Abstract
Accurate identification of cotton leaf pests and diseases is essential for sustainable cultivation but is challenged by complex backgrounds, diverse pest morphologies, and varied symptoms, where existing deep learning models often show insufficient robustness. To address these challenges, RDL-YOLO model is proposed in this study. In the proposed model, RepViT-Atrous Convolution (RepViT-A) is employed as the backbone network to enhance local–global interaction and improve the response intensity and extraction accuracy of key lesion features. In addition, the Dilated Dense Convolution (DDC) module is designed to achieve a dynamic multi-scale receptive field, enabling the network to adapt to lesion defects of different shapes and sizes. LDConv further optimizes the effect of feature fusion. Experimental results showed that the mean Average Precision (mAP) of the proposed model reached 77.1%, representing a 3.7% improvement over the baseline YOLOv11. Compared with leading detectors such as Real-Time Detection Transformer (RT-DETR), You Only Look Once version 11 (YOLOv11), DETRs as Fine-grained Distribution Refinement (D-FINE), and Spatial Transformer Network-YOLO (STN-YOLO). RDL-YOLO exhibits superior performance, enhanced reliability, and strong generalization capabilities in tests on the cotton leaf dataset and public datasets. This advancement offers a practical technical solution for improved agricultural pest and disease management.
1. Introduction
As an important economic crop, cotton has an annual global production of more than 25 million tons and generates at least 600 billion U.S. dollars per year [1]. Its economic impact is significant, as its value chain covers textiles, clothing, oil processing, and other fields. Cotton occupies a pivotal position in the global textile industry and agricultural economy [2,3]. However, cotton leaves are susceptible to various pests and diseases, including leaf spot, aphids, armyworms, bacterial blight, fusarium wilt, leaf curl disease, etc. These pests and diseases seriously affect the yield and quality of cotton and pose a threat to the economic returns of cotton farmers and the ecological environment [4]. Leaf blight, for example, can lead to the yellowing and shedding of cotton plant leaves and result in severe yield loss of more than 50%. According to Food and Agriculture Organization (FAO) statistics, the global annual loss of cotton due to pests and diseases exceeds 12 billion U.S. dollars, with 65% of this loss occurring in developing countries [5]. Although traditional chemical pesticide spraying can temporarily control pests and diseases, cotton farmers usually need to inspect the field 2–3 times a day. They rely on visual observation and experience to determine the type of pests and diseases. Additionally, whole-field testing takes up to 3–5 h, and the accuracy rate is limited by the inspector’s professionalism. Grassroots cotton farmers misjudge the disease more than 40% of the time. The problems of efficiency, speed, time costs, labor costs, and accuracy are becoming more obvious, prompting the need for smarter, more sustainable pest control strategies [6].
In recent years, the rapid development of artificial intelligence technology has made the application of deep learning in precision agriculture highly promising [7,8]. The agricultural sector has seen new methods for detecting pests and diseases [9]. Due to their high efficiency, high accuracy, and strong robustness, target detection algorithms based on deep learning have become a hotspot in pest and disease detection research [10,11]. These algorithms can automatically learn image features to rapidly localize and classify pests and diseases, providing a powerful tool for the early detection and precise prevention and control of cotton pests and diseases [12]. Rui et al. [13] proposed a multi-source data fusion (MDF) decision-making method based on ShuffleNet V2 for detecting leaf pests and diseases. The method combines RGB images, multispectral images, and thermal infrared images, improving the detection performance through multi-source data fusion. To enhance the robustness of the model, a label smoothing technique is introduced in the study to reduce the issue of model overconfidence. The method proposes an MDF model to improve the accuracy and robustness of grape leaf pests and diseases detection, especially in complex environments. Yang et al. [14] proposed a new maize pest detection method, Maize-YOLO, which is based on YOLOv7 and introduces the CSPResNeXt-50 module and the VoVGSCSP module. The CSPResNeXt-50 module improves the detection accuracy by optimizing the network structure. The VoVGSCSP module, on the other hand, further improves the detection speed. The method achieves 76.3% mAP and 77.3% recall. However, none of them were able to establish an effective local–global feature interaction chain and lacked an adaptive recalibration mechanism for lesion channels, making it difficult to detect features in complex background situations.
Li et al. [15] proposed a new deep learning network, YOLO-JD, for detecting jute pests and diseases. The network introduces an hourglass feature extraction module (SCFEM), a deep hourglass feature extraction module (DSCFEM), and a spatial pyramid pooling module (SPPM) to improve the feature extraction efficiency. Furthermore, a comprehensive loss function, including IoU loss and CIoU loss, is proposed to enhance the detection accuracy in dealing with pests and diseases in jute production. Wang et al. [16] proposed an improved YOLO model, YOLO-PWD, for detecting pine wood nematode disease (PWD). The model is based on YOLOv5s and introduces a squeeze and excitation (SE) network, a CBAM, and a bi-directional feature pyramid network (BiFPN) to strengthen the feature extraction capability. Additionally, a Dynamic Convolutional Kernel (Dynamic Conv) was introduced to improve the model’s deployment ability on edge devices (e.g., Autonomous Aerial Vehicle (AAV)), and improve the accuracy of detecting PWDs in complex environments, providing technical support for the conservation of pine forest resources and sustainable environmental development. Yuan et al. [17] proposed a new highly robust detection method for pine wood nematode disease, YOLOv8-RD, which is based on the YOLOv8 model. This approach combines the advantages of residual learning and fuzzy deep neural network (FDNN), and designs a residual fuzzy module (ResFuzzy) to efficiently filter image noise and enhance the smoothness of background features. Meanwhile, the study introduces a dynamic upsampling operator (DySample) to dynamically adjust the upsampling step size so as to effectively recover the detail information in the feature map. None of the above methods have solved the dynamics of the target scale in agricultural scenarios, resulting in the model being unable to adaptively focus on key areas and having low performance under complex background interference.
Liu et al. [18] proposed the tomato leaf disease detection model YOLO-BSMamba, which enhances global context modeling by fusing convolution with the state space model (HCMamba module) and introduces the SimAM attention mechanism to suppress background noise, achieving an 86.7% mAP@0.5 in complex backgrounds. However, its feature extraction process still relies on static convolution kernels with fixed sampling positions, resulting in insufficient geometric adaptability to lesion deformation (such as irregular edge expansion). Similarly, Fang et al. [19] proposed RRDD-Yolov11n for rice diseases, adopted the SCSABlock attention module to optimize multi-semantic fusion, and utilized CARAFE upsampling to restore detailed features, increasing the mAP to 88.3%. However, CARAFE only reorganizes the kernel weights through content prediction and does not achieve dynamic offset learning of the sampling position, which limits the perception accuracy of the model for the morphological changes of the lesion.
Detecting cotton leaf pests and diseases is difficult [20,21]. Significant differences exist in the leaf morphology of different cotton varieties [22]. Due to differences in cuticle thickness and chlorophyll levels, we observe a different set of symptoms. For example, wilt is characterized by yellowing and curling in young leaves and brown necrotic spots in mature leaves. Aphids are only 0.5~2 mm long, leaf spot disease spots are 2~15 mm in diameter, and wilt disease covers the entire leaf blade. These differences make it hard for pest and disease detection model to accurately identify pests and diseases. Meanwhile, a more complex agricultural background, combined with varying weather conditions and light intensity leads to different backgrounds [23]. This contributes to the multi-scale characteristics of pests and diseases on cotton leaves, thereby increasing the requirements for improving the detection accuracy.
It turns out that developing intelligent detection algorithms for cotton leaf pests and diseases is of great importance for the sustainability of modern agriculture [24]. This technological improvement allows scientists to manage and safeguard cotton resources intelligently, promote biodiversity, and more effectively identify the early onset of pests or plant diseases. This technology can also reduce economic losses and maintain a healthy and stable ecological environment [25,26].
To address the aforementioned challenges of complex backgrounds, diverse lesion morphologies, and information loss from fixed sampling, this study proposes a novel model, RDL-YOLO, which integrates RepViT-A for enhancing local–global feature interaction, DDC for achieving a dynamic multi-scale receptive field, and LDConv for dynamic sampling. Based on the YOLOv11 framework, RDL-YOLO effectively improves its capability for multi-scale detection of cotton leaf pests and diseases. The main contributions of this work are as follows:
(a) In order to enhance the model’s ability to extract features of cotton leaf pests and diseases, RepViT-Atrous Convolution (RepViT-A) was adopted as the backbone network. The original RepViTBlock and RepViTSEBlock were replaced with the improved and developed AADBlock and AADSEBlock modules. These modules enhance local–global interaction. The AADSEBlock extends the AADBlock through a squeezing and excitation mechanism. The AADBlock realizes the recalibration of channel features, significantly improving the response strength and extraction accuracy of key lesion features under complex background interference.
(b) To solve the problems of inflexibility of the traditional convolution receptive field and excessive sensitivity to noises such as cotton leaf fuzz and uneven illumination, a CCD convolution module is proposed. Through dilated convolution to extract and adjust multi-scale features and relative weights, a dynamic multi-scale receptive field is achieved, further enhancing the adaptability of the model to defects of different shapes and sizes. Regarding the problem of detail loss in illumination changes, through the channel-space joint filtering of CBAM, the non-lesion background interference in the cotton field images is effectively suppressed.
(c) To capture of cotton leaf features more rapidly, the issue of feature information loss or inaccuracy due to the fixed sampling position in traditional convolutions is resolved. Meanwhile, LDConv downsampling is combined with the dynamic sampling mechanism to resample the feature map according to the learned offset, further optimizing the effect of feature fusion.
2. Materials and Methods
This section introduces the materials and methods used in this study, including the dataset, data preprocessing techniques, evaluation metrics, experimental parameters, as well as the detailed architecture and components of the proposed RDL-YOLO model.
2.1. Dataset
2.1.1. Data Collection
In view of the complex background, where there is no suitable data collection for cotton pests and diseases at present, the data used in this study is composed of different datasets on cotton leaf pests and diseases from KAGGLE (https://www.kaggle.com/datasets/seroshkarim/cotton-leaf-disease-dataset (accessed on 22 October 2024), https://www.kaggle.com/datasets/dhamur/cotton-plant-disease (accessed on 22 October 2024) and https://www.kaggle.com/datasets/ataher/cotton-leaf-disease-dataset (accessed on 25 October 2024)). In addition, images of cotton leaf pests and diseases were also obtained from Google Images and Baidu Images using the search term “cotton leaf disease”. All web-crawled images were manually reviewed, and unannotated images were labeled with bounding boxes using the LabelImg tool to ensure their relevance to the research topic and image quality. As shown in Figure 1, this dataset is divided into eight types of pests and diseases states. During the training process, the image size is set to 640 × 640 pixels.
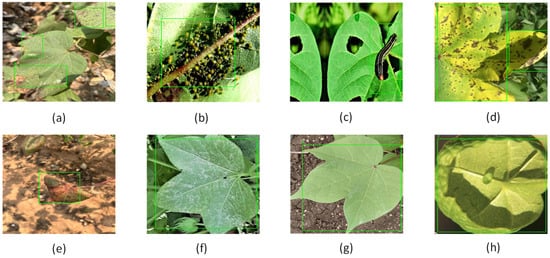
Figure 1.
Plant disease types in the dataset. Each image highlights the disease features with a green box. The disease types are as follows: (a) leaf spot; (b) aphids; (c) armyworm; (d) bacterial blight; (e) Fusarium wilt; (f) grey mildew; (g) healthy; (h) leaf curl. (Those pictures are dedicated to the public domain under CC0 1.0 Universal. No Copyright).
To particularly demonstrate the generalization capability of the proposed algorithm beyond the cotton leaf dataset, an additional experimental evaluation was conducted using the Tomato Leaf Diseases Detection Computer Vision dataset (https://www.kaggle.com/datasets/farukalam/tomato-leaf-diseases-detection-computer-vision (accessed on 15 May 2025)). This dataset is publicly available and has a resolution of 640 × 640. It consists of seven types of defects from tomato leaves: ’Bacterial Spot’, ’Early Blight’, ’Healthy’, ’Late Blight’, ’Leaf Mold’, ’Target Spot’, and ’Black Spot’. The training, validation and test datasets are divided in the ratio of 7:2:1.
2.1.2. Image Augmentation
The data augmentation techniques for the cotton leaf dataset are shown in Figure 2. During the process of data cleaning and enhancement, feature-insensitive images were deleted, and data enhancement techniques, including zoom (random scale range 0.8–1.2), increased exposure (brightness adjustment ±30%, saturation adjustment ±30%), and rotation (random angle range ±15°), were adopted to expand the dataset to 6097 images. The training set (4280 pieces), validation set (1201 pieces) and test set (616 pieces) contained category label files. Since each image contains one or more objects, the total number of disease category labels exceeds the number of images. The numbers of targets for each disease category are shown in Table 1.

Figure 2.
Data augmentation techniques for cotton leaf images: (a) original; (b) zoom; (c) increased exposure; (d) rotation. (Those pictures are dedicated to the public domain under CC0 1.0 Universal. No Copyright).

Table 1.
The number and proportion of targets for each disease category.
2.2. The Indicators of Evaluation
This study used precision (P), recall (R), mean average precision (mAP), parameters (Params), GFLOPs, and inference speed (FPS) to comprehensively measure the model’s performance in cotton leaf pest detection. These metrics provide valuable insight into the model’s ability to accurately detect positive samples.
TP (true positive) is the number of pest and disease instances correctly identified by the model. FP (false positive) is the number of misreported background or healthy leaves. FN (false negative) is the number of missed foci. C is the total number of categories. Precision (P) reflects the proportion of correct determinations among all results predicted by the model as pests or diseases and is the inverse of the false alarm rate. Recall (R) reflects the model’s ability to detect actual foci and is the complement of the missed detection rate. AP integrates the model’s performance at different confidence thresholds by calculating the area under the precision–recall curve for a single category. mAP averages the AP of all categories to assess the model’s overall robustness under multiple categories and scenarios. These metrics complement each other: a higher P indicates a lower false alarm rate, while a higher R indicates a higher leakage rate. When the model faces a trade-off between false alarms and leakage in noisy and complex backgrounds, P and R visualize the trend of false alarms and leakage. Meanwhile, mAP further reveal the model’s stability and ability to resist interference at confidence thresholds ranging from high to low. Comparing P, R, and mAP under different model architectures and disturbance intensity levels shows that, as long as mAP remains high, the model has good detection capability across multiple pest categories and diverse environments. Params represent the total number of learnable weights in the network. GFLOPs indicate the computational cost for a single forward pass. FPS measures how many images the model can process per second.
2.3. Experimental Parameter Configuration
The detailed experimental settings and hyperparameters adopted by the model are shown in Table 2. The experiment was completed in the Python 3.9 and Pytorch 2.5.1 deep learning frameworks on the Windows 11 operating system. Elaborate design and optimization were carried out in the configuration of experimental training parameters. The number of training cycles was set to 300 times to ensure that the model can learn and converge fully. The image input size was set to 640 × 640, taking into account both sufficient details for recognition and computational efficiency.

Table 2.
Detailed information on the experimental configuration and hyperparameters used.
2.4. Methods
2.4.1. RDL-YOLO
The RDL-YOLO model shows significant performance improvement in the task of pests and diseases detection under the complex background of cotton leaves. Network structure of the proposed model is shown in Figure 3. RDL-YOLO is an improved model based on the YOLOv11 architecture and consists of three main components: the backbone network, the neck network and the detection head. The backbone network is based on RepViT-A and provides robust and highly distinguishable basic features for subsequent processing through its powerful local–global interaction capabilities. In the key downsampling layer of the neck network, we introduced LDConv to replace the traditional convolution. Its dynamic sampling characteristics significantly reduced the loss of key lesion features during the spatial compression process. The neck network focuses on integrating the DDC module, which is deployed at the key connection points of the Feature Pyramid Network (FPN/PAN). By taking advantage of its dynamic multi-scale receptive field, it adaptively fuses feature information from different levels, greatly enhancing the model’s detection ability for morphologically variable and differentially sized lesions on cotton leaves.

Figure 3.
RDL-YOLO network structure.
2.4.2. Network Modeling for YOLOv11
YOLO is a real-time target detection algorithm that accomplishes end-to-end target detection tasks with a single neural network [27]. It divides the image into multiple grids, predicting bounding boxes and their corresponding confidence scores, as well as category probabilities for each grid. The core idea is to consider target detection as a regression problem. Specifically, the input image is partitioned into an N × N grid, and for each grid cell, the model predicts C bounding boxes and their corresponding confidence scores, as well as the conditional probability of category A. The model predicts the center of an object if the object falls within the center of the grid. The grid predicts information about an object if its center falls within the grid. If the center of the grid is in the grid, it predicts information about the object. In 2024, Ultralytics released YOLOv11 [28], which made significant improvements in both accuracy and detection speed compared to other models. It is regarded as a relatively advanced YOLO model currently available [29]. Compared to the YOLOv8 (the previous version), YOLOv11 switched the C2F module to C3K2 and added the C2PSA module after the SPPF module, drawing inspiration from YOLOv10 by incorporating ideas behind the HEAD. The backbone network uses the C3K2 structure optimized by YOLOv8, which can improve flexibility and richness in feature extraction. This structure can also be seen as a flexible feature extraction module and a fast feature fusion module C2PSA comes from the C2f module with the combination of the PSA (Pointwise Spatial Attention) block which brings together feature extraction and attention mechanism. The PSA block is integrated into the standard C2F module to enhance the attention mechanism, allowing the model to more effectively identify and prioritize the most important aspects of the information. YOLOv11 performs feature fusion across multiple scales using a PAN-like structure to enhance feature propagation. YOLOv11 employs distribution in the regression branch and utilizes deeply separable convolution to improve the Detect Head structure. It combines Focal loss and CIoU loss. This work selects YOLOv11 as the basic model because YOLOv11 represents one of the most advanced performances of the YOLO series in object detection tasks, especially in terms of balancing accuracy and speed. Meanwhile, the mAP of YOLOv11 is 73.4% on the cotton leaf dataset, and the accuracy is higher than other YOLO series. Additionally, the C3k2 module is more convenient to make the modifications in its architecture. The network model diagram of YOLOv11 is shown in Figure 4. YOLOv11 represents a significant advancement in the YOLO series and makes target detection algorithms a step farther.
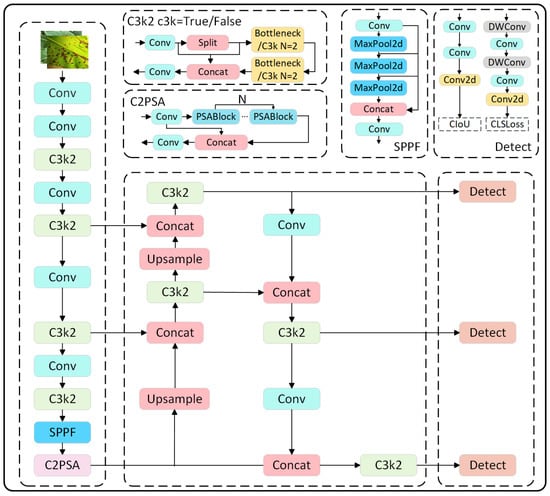
Figure 4.
Diagram of YOLOv11 network model. (Those pictures are dedicated to the public domain under CC0 1.0 Universal. No Copyright).
2.4.3. RepViT-A
The original backbone only adopts a single-path CSP/Bottleneck structure. The fixed 3 × 3 convolution makes it difficult for the model to consider the extraction of details from small targets and large-scale contextual information simultaneously. The interactions between channels are weak, and the multi-scale representation is insufficient. These issues lead to poor detection of targets such as the cotton leaf pest, which has tiny spots and large-scale lesions. Thus, the backbone was replaced by the multi-branch and multi-scale backbone RepViT-A improved by RepViT [30]. Additionally, the original RepViTBlock and RepViTSEBlock were replaced with self-developed AADBlock and AADSEBlock modules. These modules enhance local–global interactions. The AADSEBlock was extended by the AADBlock’s squeezing and excitation mechanism for channel feature recalibration. RepViT’s reparameterized convolutional kernel maintains a multi-branch structure during training, and its composite feature extraction process can be formalized as follows:
In Equation (5), k = 3 denotes three parallel convolutional branches, and is the branch weight for training and learning. In the inference stage, it is transformed into an equivalent one-way convolutional kernel by parameter fusion:
In Equation (6), denotes the linear transformation process of folding the BatchNorm parameters into the convolutional kernel and introducing the improved SE at the feature downsampling key node. The dynamic feature calibration process of the SE consists of two stages:
In Equation (8), is the GELU activation function. To address the problem of detail loss in the cotton leaf spot recognition process, a three-branch fusion structure is designed with 3 × 3 depthwise convolution by channel. The expansion rate d = 2 is used to expand the sensory field. is implemented as 2 × 2 spatial downsampling. As shown in in Equation (9), the three outputs are spliced in the channel dimension to obtain the following:
Atrous convolution retains high-frequency information at the lesion’s edge. Each channel is adaptively weighted to input recalibrated features into 1 × 1 convolution fusion. These features are then output through residual jump-linking. Local details are complemented with contextual information. Average pooling suppresses background noise. The SE module strengthens the lesion region’s response to adapt to lesion morphology scale changes. The CDG module is redesigned for the new AAD module. This module is innovative in three dimensions compared to the original design. This innovation is reflected in the following: after 1 × 1 convolution, two depth-separable convolutional layers are stacked consecutively. This design forms a feature refinement chain as shown in Equation (10), and its theoretical sensory field expands recursively with the number of layers:
k = 3 is the size of the convolution kernel, L = 2 is the number of stacked layers, and = 1 is the step size. Additionally, these values let the strength of the gradient reaction near the edge of the leaf illness better and address the issue of inaccurate identification at lesion edge. GELU captures the local details, and gating weights play with global context weight. CDG and AAD(SE)Block are given in Figure 5.
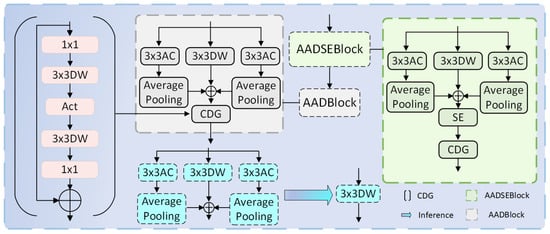
Figure 5.
The RepViT-A partial structure includes CDG, AAD, and AADSE modules.
2.4.4. Dilated Dense Convolution
From a more detailed design perspective, the DDC model will realize good coverage of local texture and global semantics in the sense of field convolution and attention residual branches that are reparameterizable with different kernels and expansion sizes. These combinations can acquire both local information and global context information, thus obtaining better lesions. The diagram of the DDC model is as follows Figure 6.
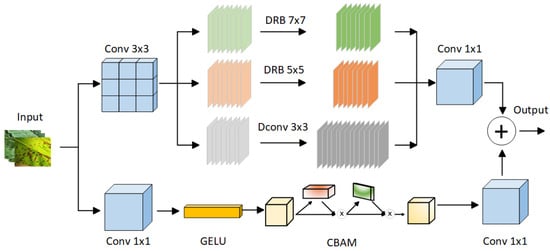
Figure 6.
DDC module structure. (Those pictures are dedicated to the public domain under CC0 1.0 Universal. No Copyright).
Specifically, the core of the module lies in the organic combination of multi-scale, reparameterizable, inflationary convolution and adaptive, attention-based, and residual branching. This combination achieves a synergistic representation of high-frequency details and global context. The first branch of the DDC reduces the number of input feature channels by half using a 3 × 3 convolution. Then, it introduces three branches in parallel: one regular 3 × 3 convolution to capture local details and two other branches that use DilatedReparamBlock with 5 × 5 and 7 × 7 dilated, reparameterized, depth-separable convolutions, respectively. The structure of the DilatedReparamBlock is shown in Figure 7.
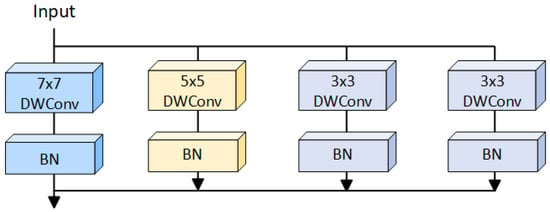
Figure 7.
Structure of DilatedReparamBlock with k = 7.
The effective sensory field for each branch is shown in Equation (11):
Thus, spot and leaf texture information are extracted at multiple scales while learning multiple expansion rates and convolutional kernel sizes are found in the sensory field.
Subsequently, three-way features are spliced in the channel dimension, and the main branch output is generated by 1 × 1 convolutional fusion. The core of this structure lies in the multi-scale response’s frequency-domain modeling capability. Let the frequency response of the feature map under convolution kernel k be , where is a two-dimensional frequency coordinate, and multi-scale convolution is equivalent in the frequency domain to constructing a set of filter banks with different bandwidths . The overall output can be written approximately as follows:
In Equation (12), is a frequency-selective weighting coefficient that is learned by the network through training. This introduces a frequency-domain attention mechanism that can enhance the response to a certain frequency band, compensating for the expression bottleneck caused by the fixed bandwidth of a single convolutional kernel. To further suppress interference from illumination variations and background noise, the module has a shallow residual attention branch. The input is sequentially processed through a series of operations: a 1 × 1 convolution, followed by GELU activation, and subsequently enhanced by the CBAM mechanism [31].
The attention module then passes the input through 1 × 1 convolution and GELU activation. Finally, the results are summed element-wise with the main branch to effectively fuse shallow details and deep semantics. Including CBAM-driven shallow residual branching provides an adaptive feature recalibration mechanism. Channel attention focuses on the sparse lesion pattern of leaf spots and spatial attention emphasizes striped or speckled lesion morphology. This allows critical signals to be delivered “without distortion” to the deeper network in the presence of complex disturbances, such as light variations and foliar self-shading. This enables key signals to be transmitted to the deep network “without distortion” in the presence of complex disturbances.
Residual links retain the high-frequency parts of shallow features, solve the vanishing gradient problem of deep networks, and add smoother constraints to the network parameter space, similar to the spectral constraints during optimization. From the perspective of gradient propagation, shallow residual paths have direct backpropagation of the loss function, that is, Equation (13):
Let y denote the output of the main branch and denote the output of the attention residual path. Compared with traditional single-path architecture, it can be seen from the equation that the dual-path makes the reachable paths of the gradient flow much larger. It avoids the usual problem of vanishing gradients in deep networks and effectively improves feature extraction. Multi-branch parallelism boosts the feature expression capability, greatly enhancing the model’s accuracy and stability in detecting small targets and large lesions on cotton pest and disease leaves in complex fields.
2.4.5. LDConv
In traditional downsampling operations, such as bilinear interpolation and transposed convolutions, the sampling positions and convolution kernel shapes are preset and fixed. This “rigid” mechanism often fails to achieve fine alignment when dealing with different lesion morphologies and scales, resulting in a lack of response to tiny or irregularly shaped lesions. In this study, we introduced LDConv [32] downsampling. The structure of LDConv is shown in Figure 8.
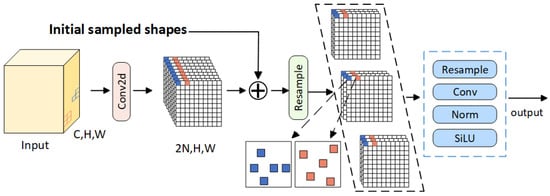
Figure 8.
Structure of the LDConv model.
The core innovation of LDConv is the introduction of a learnable offset field with dynamic resampling based on four-point bilinear interpolation, which enables the network to dynamically adjust the distribution of sampling points for each downsampling channel and each pixel position, thus realizing accurate downsampling for content awareness. Specifically, LDConv introduces a coordinate generation algorithm that can generate different initial sampling positions for convolutional kernels of arbitrary size and dynamically adjust the sampling shapes through offsets. LDConv first generates a one-dimensional learnable convolutional prediction offset field of size 2N through one-dimensional convolution (kernel_size = 3), where N is the number of sampling multiplicities, which is equivalent to the number of points that need to be sampled for each spatial position of the output. The initialization of the convolutional weights to zero ensures that the initial behavior of the network is equivalent to ordinary neat sampling, and the sampling times are controlled by stride. During the learning process, the offset field continuously adjusts so that each sampling point can “drift” to a location with more texture or key information, thereby enhancing the response of the feature to small lesions. LDConv then uses dynamic resampling based on four-point bilinear interpolation:
In Equation (14), the four neighboring integer points are denoted by lt, rb, lb, and rt. The corresponding interpolation weight, g(q, p), includes one N × 1 separable convolutional reorganization channel to accurately align and fuse feature maps of different resolutions in a content-aware manner.
The overall sensory field can be approximated by connecting the DDC in series with the LDConv as follows:
In Equation (15), denotes the size of the convolutional kernel used in the ith inflated convolutional branch, denotes the expansion rate of the branch, and N is the downsampling multiplier in LDConv. It can be seen that the cross-scale features provided by the DDC coupled with the spatial “stretch” of the LDConv enable the feature maps to be more closely aligned and fused at different resolutions. This combination significantly improves the ability of the neck to express multi-scale and multi-shape targets. The synergistic effect of the two modules not only significantly expands the effective receptive field and feature discrimination ability of the neck module, but also enables the convolution kernel to more accurately adapt to the shape of the target, which improves the feature extraction efficiency, and enhances the accuracy and robustness of detecting small spots and complex multi-scale lesions on cotton leaves.
3. Results
This section provides a detailed introduction to the application of the RDL-YOLO performance model in the task of detecting diseases and pests of cotton leaves. The various indicators of RDL-YOLO were verified through comparative experiments and ablation experiments. We also verify the validity of the proposed module and model.
3.1. Ablation Experiments
The performance of the cotton leaf pest and disease detection model was analyzed through three evaluation indices: P, R, and mAP. Table 3 shows the results of ablation experiments with different module combinations. The results indicate that adopting the RepViT-A structure greatly enhanced the model’s detection capabilities, especially in the recall, which increased from 69.2% to 71.8% and the mAP improved from 73.4% to 76.4%. This proves that RepViT-A can enhance the model’s perception of cotton leaf pest regions at multiple scales. Furthermore, introducing the LDConv module on top of RepViT-A improved spatial adaptability in feature extraction, increasing recall to 73.4% and mAP to 76.7%.

Table 3.
Ablation experiments on the cotton leaf dataset.
Additionally, the DDC module on top of RepViT-A shows strong detection ability, with mAP reaching 77.0%, and precision 85.0%. The structure is more sensitive in differentiating between diseased areas and complicated backgrounds, thus minimizing false alarms. After the fusion of the three modules, RepViT-A, DDC, and LDConv, the model finally achieved a perfect score in detecting cotton leaf pests and diseases, with a recall of 73.6% and a mAP of 77.1%. This success can be attributed to the combined advantages of the modules in feature extraction, fusion, and spatial perception. To substantiate these findings, we conducted modular ablation experiments to demonstrate how each component enhances the model’s ability to detect cotton leaf pests and diseases. Ultimately, the final integrated model demonstrates superior performance across all types of pests and diseases, particularly excelling in the detection of small and occlusion targets, occluded objects, and regions with unclear boundaries.
3.2. Comparative Experiments
Recent studies have shown that, on standard object detection datasets, an improvement of more than 2% in mAP relative to the baseline is generally considered a meaningful performance improvement [33,34]. Therefore, this work used a 2% mAP as the practical threshold to determine the performance difference between models. In this study, the performance of the proposed RDL-YOLO model in a cotton leaf pest and disease detection task was evaluated. A variety of target detection models (including YOLOv10n, YOLOv11n, YOLOv12n, Real-Time Detection Transformer (RT-DETR50), DETRs as Fine-grained Distribution Refinement (D-FINE) [35], and Spatial Transformer Network-YOLO (STN-YOLO) [36]) was compared with the proposed model on the Cotton Leaf dataset. Additionally, the generalization ability of the model was verified on the publicly available Tomato Leaf Diseases Detection Computer Vision dataset. The results of the comparison experiments are shown in Table 4. The experimental results show that on the Cotton Leaf dataset, RDL-YOLO achieves a precision(P) of 81.7%, a recall(R) of 73.6%, and a mAP of 77.1%, outperforming all comparison models in overall detection performance. Compared with YOLOv11n (80.3% P, 69.2% R, 73.4% mAP), the precision of RDL-YOLO increased by 1.4%, the recall increased by 4.4% and the mAP increased by 3.7%. Compared with RT-DETR50 (83.9% P, 69.0% R, 73.2% mAP), the precision of RDL-YOLO decreased by 2.2%, the recall increased by 4.6% and the mAP increased by 3.9%. Analysis shows that although the precision (P) has slightly decreased, the comprehensive performance of RDL-YOLO is better than that of RT-DETR50. Compared with D-FINE (74.9% P, 65.1% R, 74.9% mAP), the precision of RDL-YOLO increased by 6.8%, the recall increased by 8.5% and the mAP increased by 2.2%, further demonstrating its comprehensive advantages in target coverage, target recognition and positioning accuracy. Compared with STN-YOLO (79.1% P, 70.4% R, 73.9% mAP), the precision of RDL-YOLO increased by 2.6%, the recall of increased by 3.2%, and the mAP has increased by 3.2%, demonstrating its stronger detection ability for targets in complex backgrounds. On the Tomato Leaf Diseases Detection dataset, RDL-YOLO also demonstrated excellent generalization ability, achieving a mAP of 74.5%, outperforming all comparison models. In contrast, the mAP values for YOLOv10n, YOLOv11n, YOLOv12n, RT-DETR50, D-FINE, and STN-YOLO were 66.5%, 68.6%, 67.2%, 61.5%, 67.9%, and 67.7%, respectively. The mAP of RDL-YOLO was significantly higher than comparative models.It further proves the stability and adaptability of RDL-YOLO in cross-crop scenarios. The number of parameters (Params), GFLOPs, and inference speed (FPS) are presented in Table 4 to comprehensively evaluate the computational cost. These metrics facilitate a trade-off analysis between detection accuracy and inference efficiency. RDL-YOLO has a large number of parameters and relatively low inference speed, addressing these limitations will be an important focus of future research.

Table 4.
Comparative experiments.
Specifically, the advantages of RDL-YOLO are mainly reflected in the following two aspects:
(1) In the Cotton and Tomato Leaf datasets, the recall of RDL-YOLO was 73.6% and 77.1%, respectively. In the Cotton dataset, the recall of RDL-YOLO was exceeded all the comparison models by at least 3%. In the Tomato Leaf dataset, the recall of YOLOv11n was slightly higher (79.3%), but RDL-YOLO still maintained a significant lead among all the other models. Especially compared with YOLOv10n and RT-DETR50, the recall was increased 18.2% and 12.2%, respectively. This indicates that RDL-YOLO was more sensitive and comprehensive in capturing target features, thereby effectively reducing the rate of missed detections. (2) In the Cotton Leaf dataset, RDL-YOLO achieved a mAP of 77.1%, representing improvements of 3.7% over YOLOv11n and 3.2% over STN-YOLO. In the Tomato Leaf dataset, RDL-YOLO achieved a mAP of 74.5%, exceeding the performance of all compared models by more than 2%. It indicates that RDL-YOLO exhibits stable performance in diverse detection scenarios.
Combined with P-R curves shown in Figure 9, the results indicate that RDL-YOLO significantly enhances overall precision and recall while concurrently preserving computational efficiency. These findings suggest that RDL-YOLO achieves an optimal balance between precision and recall in the context of cotton pest and disease detection. This work will provide methodological support and practical strategies for pest and disease monitoring within precision agriculture frameworks.
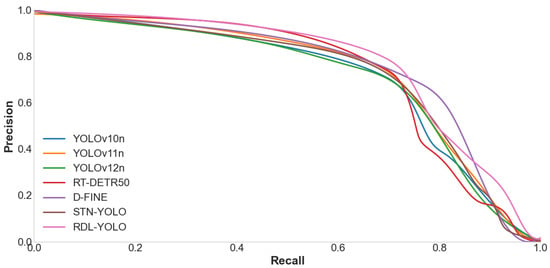
Figure 9.
P-R curves for comparison tests.
3.3. Visual Analysis
As shown in Figure 10, the normalized confusion matrix of RDL-YOLO on the cotton leaf pests and diseases detection task reflects the improvement effect and existing shortcomings of each of the three modules.
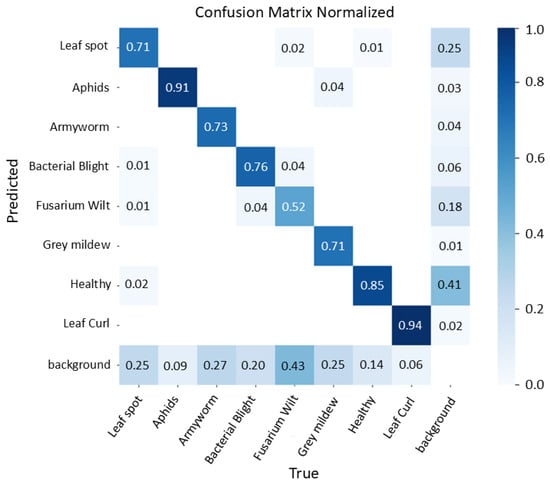
Figure 10.
Confusion matrix normalized.
First, the RepViT-A module significantly improves the response strength and extraction accuracy of high-contrast spots (e.g., leaf curl and aphids) by enhancing local–global interactions and enabling channel feature recalibration—94% accuracy for leaf curl and 91% for aphids—with only a very small amount of misclassification as background. Second, the parallel adaptive multi-scale convolutional kernel weights of the DDC convolutional module effectively extend the model’s receptive field to defects of different shapes and sizes, resulting in a steady improvement in the detection accuracy of armyworm (73%), leaf spot disease (71%), and bacterial blight disease (76%), but there are still about 20–25% of samples missed due to background interference.
Finally, LDConv’s dynamic sampling mechanism optimized feature fusion by learning offsets to resample key locations, which helped the recognition accuracy of some fine textures (e.g., gray mildew) to reach 71%, but the accuracy of Fusarium wilt was still only 52%; 43% were misidentified as background, and 18% were confused with bacterial mottle disease. Healthy leaves were correctly recognized by 85%. Overall, the three improvements have played a positive role in most of the mainstream pest and disease detection tasks, but the model still needs to further improve its robustness and fine-grained recognition ability by richer data augmentation and stronger attentional mechanisms for very low-contrast or highly background-similar spots.
Figure 11 demonstrates the superior performance of the RDL-YOLO model through a multi-dimensional evaluation curve. The F1-confidence curve shows that RDL-YOLO has a peak F1 value of 0.77, which is significantly better than the benchmark model.
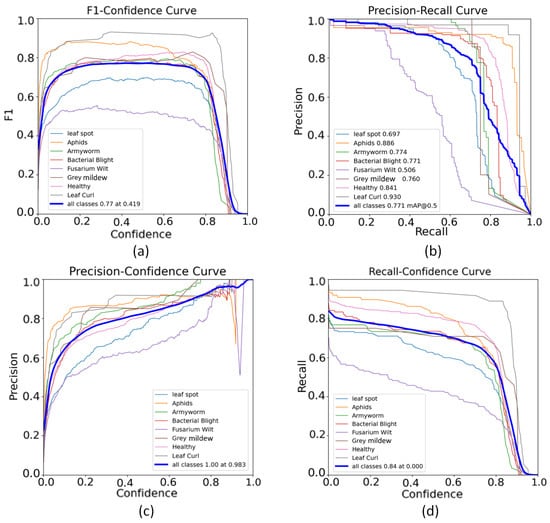
Figure 11.
The evaluation curve of the overall detection performance. (a) F1_curve; (b) PR_curve; (c) P_curve; (d) R_curve.
This robustness stems from its RepViT-A module, which significantly improves the response strength and extraction accuracy of key spot features under complex background interference by enhancing local–global interactions and recalibrating channel features. The precision–recall curve further validates RDL-YOLO’s strong category discrimination capabilities, with excellent mAP@0.5 values for key disease categories such as leaf curl (0.930) and healthy (0.841). This is attributed to its DDC convolutional module, which realizes a dynamic multi-scale sensory field by learning the weights of convolutional kernels at different scales in parallel. The dynamic multi-scale design effectively captures irregular disease patterns, and thus is able to adaptively perceive different sizes and shapes of disease spots. The accuracy–confidence curve achieves near-perfect accuracy at a very high confidence threshold (1.00 accuracy at 0.983 confidence), demonstrating a very low false detection rate even in highly confident predictions. This breakthrough is driven by LDConv’s dynamic sampling mechanism, which eliminates the problem of losing key features due to fixed sampling locations by guiding resampling with learned offsets. Meanwhile, the recall–confidence curve (recall remains 0.84 at a confidence level of 0.000) further confirms the strong generalization ability of RDL-YOLO in low confidence scenarios, and its optimized feature fusion ensures the comprehensive coverage of diseased areas. In summary, the synergistic effect of feature recalibration of RepViT-A, adaptive scale sensing of DDC, and deformable sampling mechanism of LDConv enables RDL-YOLO to strike a new optimal balance between precision (mAP@0.5: 0.771) and recall (class-wide average F1: 0.77), and establishes a robust framework for the detection of crop diseases in complex environments framework for crop disease detection in complex environments.
To further validate the model’s local–global interaction ability, Figure 12 illustrates the attention distribution of a representative sample visualized using Grad-CAM. It can be seem from (b) and (e) that the heatmap generated by YOLOv11n have problems of concern drift and inaccurate positioning, which are particularly prominent in images with blurred edges of lesions or dense distribution of multiple lesions. This indicates that it has certain deficiencies in capturing local fine-grained features and global context information.
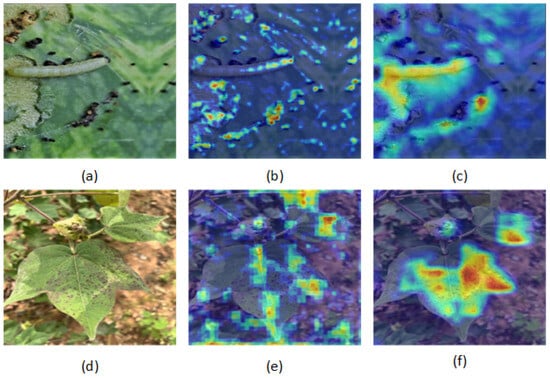
Figure 12.
Comparison of heatmap images. (a) Original image of the pest; (b) pest heatmap generated by YOLOv11n; (c) pest heatmap generated by RDL-YOLO; (d) original image of the disease; (e) disease heatmap generated by YOLOv11n; and (f) disease heatmap generated by RDL-YOLO. (Those pictures are dedicated to the public domain under CC0 1.0 Universal. No Copyright).
As shown in (c) and (f), RDL-YOLO effectively enhances the local–global interaction ability by introducing the RepViT-A backbone, DDC module, and LDConv structure, and realizes the feature adaptive calibration of the channel dimension. The synergy of these three structures enables the model to enhance its response to key lesion areas while suppressing background noise interference, significantly improving the discriminative ability of lesion detection.
It can be observed from the heatmap that the attention of RDL-YOLO in the lesion area is more concentrated, compact, and highly consistent with the shape of the lesion. It can accurately focus on the center of the lesion and reasonably extend to the edge area. This indicates that the model has a stronger global semantic understanding ability and local fine positioning ability. Especially in sample image (f), RDL-YOLO demonstrates collaborative attention toward both the edge and central regions of the lesion, while effectively recalibrating channel features. The results indicate that RDL-YOLO has a better spatial attention collaborative mechanism and the ability of fine feature regulation across channels.
Figure 13a–c shows that there are large areas disease spots and multiple small-scale disease spots in the same image. The detection capability of YOLOv11n is relatively limited, and YOLOv12n exhibits a low level of confidence in its predictions. However, RDL-YOLO can accurately detect multiple lesion areas of different scales, and the confidence level is improved, indicating that it has a better multi-scale receptive field ability. This is attributed to the dynamic multi-scale receptive field mechanism of DDC. Figure 13d–f shows a comparison of the dynamic sampling detection of Armyworm. The model performs feature map resampling guided by learned offsets. The detection frame generated by YOLOv11n does not fit the target object, while YOLOv12n performs better. The detection frame generated by RDL-YOLO model is the most accurate, precisely locating the actual area of the detection target. This indicates that the fixed sampling method has perceptual limitations for detecting target, while RDL-YOLO can learn the appropriate offset by means of the LDConv dynamic sampling mechanism, achieving more effective detection of non-central and asymmetric targets.
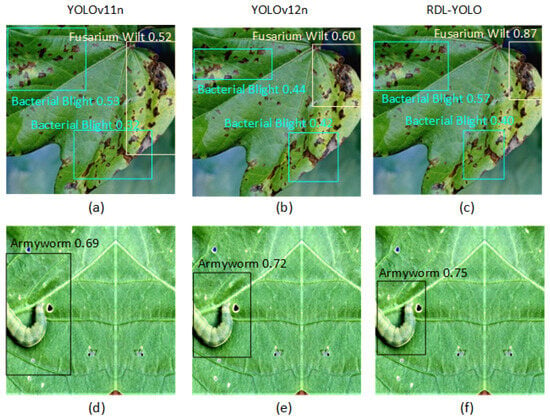
Figure 13.
Comparison of detection results for multi-scale lesions and dynamic sampling targets among YOLOv11n, YOLOv12n and RDL-YOLO. (a) YOLOv11n multi-scale feature detection; (b) YOLOv12n multi-scale feature detection; (c) RDL-YOLO multi-scale feature detection; (d) YOLOv11n dynamic sampling detection; (e) YOLOv12n dynamic sampling detection; (f) RDL-YOLO dynamic sampling detection. (Those pictures are dedicated to the public domain under CC0 1.0 Universal. No Copyright).
4. Discussion
The RDL-YOLO model achieves significant performance breakthroughs in cotton leaf pest and disease detection tasks, and its core innovations are the enhancement of local–global feature interactions through the RepViT-A backbone network, and the introduction of channel feature recalibration techniques. The macro-diffusion at the forest level requires large receptive field context modeling, DDC convolution realizes dynamic multi-scale receptive field to suppress irrelevant background and enhance the intensity of spot response, and LDConv sampling mechanism optimizes feature fusion, and the dynamic receptive field of convolutional kernel can better match the irregular morphology of the spots and accurately reconstruct the details of the morphology, which effectively solves key problems such as weak response of the spots, poor morphology, and loss of spatial information in the complex farmland background. This effectively solves the key problems of weak response of lesion features, poor morphological adaptability, and loss of spatial information in complex farmland background.
Experiments show that the RDL-YOLO model has achieved a significant performance improvement in the task of detecting diseases and pests of cotton leaves, with its mAP reaching 77.1%. It outperforms YOLOv11n (73.4%), STN-YOLO (73.9%), and RT-DETR based on the Transformer architecture (73.2%), indicating that the proposed model has a leading advantage between traditional convolutional structures and new Transformer detectors. Although the mAP of D-FINE on the cotton leaf dataset reached 74.9%, RDL-YOLO, with its multi-scale dynamic receptive field and offset-sampling, performed better in mAP, also improved recall to 73.6% (65.1% for D-FINE) and the precision reached 81.7% (74.9% for D-FINE). For the model’s generalization ability evaluated on the Tomato Leaf Diseases dataset, RDL-YOLO was also superior to YOLOv11n (68.6%), YOLOv12n (67.2%), STN-YOLO (67.7%), and D-FINE (67.9%), with a mAP of 74.5%. Among them, the recall was 77.1%. The results further verified the model’s detection ability under different crops and disease types.
Furthermore, RDL-YOLO was also compared with other methods. Zambre et al. [36] proposed the STN-YOLO model, which introduces a spatial transformer module to enhance robustness against rotation and translation. On the Plant Growth and Phenotyping (PGP) dataset, it achieved a precision of 95.3% (1.0% higher than the baseline), a recall of 89.5% (0.3% higher), and an mAP of 72.6% (0.8% higher). This model is suitable for image scenarios with significant affine transformations but exhibits limited adaptability to object structures and lacks strong multi-scale feature extraction capabilities. Li et al. [37] proposed the CFNet-VoV-GCSP-LSKNet-YOLOv8s model, which achieved a precision of 89.9% (2.0% higher than the baseline), a recall of 90.7% (1.0% higher), and an mAP of 93.7% (1.2% higher) on a private cotton pest and disease dataset. The model improves small-object detection and accelerates convergence by enhancing multi-scale feature fusion, but its ability to model local–global feature interactions remains limited. Pan et al. [38] proposed the cotton diseases real-time detection model CDDLite-YOLO for detecting cotton diseases under natural field conditions. It achieved a precision of 89.0% (1.9% higher than the baseline), a recall of 86.1% (0.9% higher), and an mAP of 90.6% (2.0% higher) on a private cotton dataset. While the model shows strong localization ability for small features, its performance declines when dealing with large variations in lesion morphology. In this work, the proposed RDL-YOLO model achieved a precision of 81.7% (1.4% higher than the baseline), a recall of 73.6% (4.4% higher), and an mAP of 77.1% (3.7% higher) on the Cotton Leaf dataset. Compared with the above studies, RDL-YOLO achieves the largest improvement in recall and mAP over the baseline model, and it demonstrates that the proposed modifications of RDL-YOLO are more effective. It is well-suited for real-world field scenarios characterized by complex lesion morphology and strong background interference, significantly enhancing the detection of cotton leaf diseases. However, this study relies on a single curated cotton leaf dataset, which may contain inherent biases such as lighting conditions, cotton varieties, and geographical locations. Future work will evaluate the model on more diverse datasets from different agricultural environments to validate its generalization capability in real-world scenarios more broadly.
Despite the excellent performance of RDL-YOLO, challenges remain, e.g., real-time constraints, combining RepViT-A, DDC, and LDConv improves the accuracy but increases the inference latency at the edge end. To address this issue in future work, we plan to optimize the model for deployment on mobile and UAV platforms using lightweight techniques such as network pruning, quantization, or knowledge distillation.
5. Conclusions
In this work, we propose an enhanced YOLO structural model, named RDL-YOLO, for the critical agricultural task of detecting pests and diseases on cotton leaves. This model integrates three significant modules (RepViT-A, DDC, and LDConv) into the YOLOv11 backbone network to efficiently capture and accurately identify a wide range of pest and disease targets at multiple scales. RepViT-A enhances the model’s ability to perceive the multi-scale cotton leaf pest and disease regions, LDConv improves the spatial adaptability of feature extraction, and the DDC module demonstrates strong detection ability. We found significantly improved recall on the Cotton and Tomato Leaf datasets compared to the recall of RDL-YOLO, which are 73.6% and 77.1%, respectively, and the mAP were 77.1% and 74.5%, respectively. Hence, the RDL-YOLO model shows substantial improvement over existing state-of-the-art models, and the proposed multi-module fusion strategy provides a strong support for the detection of cotton leaf pests and diseases in terms of accuracy and stability. Additionally, we aim to diversify the dataset and introduce online incremental learning to boost the model’s adaptability to natural environmental changes, ultimately enhancing detection speed. These enhancements will make RDL-YOLO more suitable for deployment on edge devices, facilitating real-time pest and disease detection.
Author Contributions
Conceptualization, Z.B.; methodology, X.Z.; validation, L.L.; formal analysis, L.L.; resources, J.L.; data curation, Z.B.; writing—original draft, X.Z.; writing—review and editing, Z.J.; visualization, C.D.; supervision, C.D.; funding acquisition, Z.J.; project administration, J.L. All authors have read and agreed to the published version of the manuscript.
Funding
This research was funded by the financial support of the National Key Research and Development Program of China under the Grant No. 2017YFE0135700, Zhejiang A&F University Research Startup Funds (203402004501).
Data Availability Statement
The public datasets provided in this study can all be obtained on kaggle, including the parts collected online. The website of Tomato Leaf Diseases Detection Computer Vision is: https://www.kaggle.com/datasets/farukalam/tomato-leaf-diseases-detection-computer-vision (accessed on 15 May 2025), and other required data are available to the corresponding authors.
Conflicts of Interest
The authors declare no conflicts of interest.
References
- Khan, M.A.; Wahid, A.; Ahmad, M.T.; Tahir, M.; Ahmed, S.; Ahmad, M.; Hasanuzzaman, M. World cotton production and consumption: An overview. In Cotton Production and Uses: Agronomy, Crop Protection, and Postharvest Technologies; Springer: Singapore, 2020; pp. 1–7. [Google Scholar] [CrossRef]
- Adamu, B.F.; Wagaye, B.T. Cotton contamination. In Cotton Science and Processing Technology: Gene, Ginning, Garment and Green Recycling; Springer: Singapore, 2020; pp. 121–141. [Google Scholar] [CrossRef]
- Munir, H.; Rasul, F.; Ahmad, A.; Sajid, M.; Ayub, M.; Arif, P.; Iqbal, A.; Khan, A.; Fatima, Z.; Ahmad, S. Diverse uses of cotton: From products to byproducts. In Cotton Production and Uses: Agronomy, Crop Protection, and Postharvest Technologies; Springer: Singapore, 2020; pp. 629–641. [Google Scholar]
- Chohan, S.; Perveen, R.; Abid, M.N.; Tahir, M.; Sajid, M. Cotton diseases and their management. In Cotton Production and Uses: Agronomy, Crop Protection, and Postharvest Technologies; Springer: Singapore, 2020; pp. 239–270. [Google Scholar]
- Jordanovska, S.; Jovovic, V.; Andjelkovic, Z. Potential of wild species in the scenario of climate change. In Rediscovery of Genetic and Genomic Resources for Future Food Security; Springer: Singapore, 2020; pp. 263–301. [Google Scholar] [CrossRef]
- Deguine, J.-P.; Aubertot, J.-N.; Flor, R.J.; Lescourret, F.; Wyckhuys, K.A.; Ratnadass, A. Integrated pest management: Good intentions, hard realities. A review. Agron. Sustain. Dev. 2021, 41, 38. [Google Scholar] [CrossRef]
- Xie, J.; Lu, M.; Gao, Q.; Chen, L.; Zou, Y.; Wu, J.; Cao, Y.; Xu, N.; Wang, W.; Li, J. Intelligent detection and control of crop pests and diseases: Current status and future prospects. Agronomy 2025, 15, 1416. [Google Scholar] [CrossRef]
- Shoaib, M.; Shah, B.; Ei-Sappagh, S.; Ali, A.; Ullah, F.; Alenezi, F.; Hussain, T.; Ali, A. An advanced deep learning models-based plant disease detection: A review of recent research. Front. Plant Sci. 2023, 14, 1158933. [Google Scholar] [CrossRef] [PubMed]
- Meng, F.; Li, J.; Zhang, Y.; Qi, S.; Tang, Y. Transforming unmanned pineapple picking with spatio-temporal convolutional neural networks. Comput. Electron. Agric. 2023, 214, 108298. [Google Scholar] [CrossRef]
- Liu, J.; Wang, X. Plant diseases and pests detection based on deep learning: A review. Plant Methods 2021, 17, 22. [Google Scholar] [CrossRef]
- Nyakuri, J.P.; Nkundineza, C.; Gatera, K.; Nkurikiyeyezu, J. State-of-the-art deep learning algorithms for internet of things-based detection of crop pests and diseases: A comprehensive review. IEEE Access 2024, 12, 169824–169849. [Google Scholar] [CrossRef]
- Sharma, A.; Jain, A.; Gupta, V.; Chowdary, M. Machine learning applications for precision agriculture: A comprehensive review. IEEE Access 2020, 9, 4843–4873. [Google Scholar] [CrossRef]
- Yang, R.; Lu, X.; Huang, J.; Zhou, J.; Jiao, Y.; Liu, F.; Liu, B.; Su, P.; Gu, A. A multi-source data fusion decision-making method for disease and pest detection of grape foliage based on ShuffleNet V2. Remote Sens. 2021, 13, 5102. [Google Scholar] [CrossRef]
- Yang, S.; Xing, Z.; Wang, H.; Dong, X.; Gao, Z.; Liu, X.; Zhang, S.; Li, Y.; Zhao, M. Maize-YOLO: A new high-precision and real-time method for maize pest detection. Insects 2023, 14, 278. [Google Scholar] [CrossRef]
- Li, D.; Ahmed, N.; Wu, A.I.; Sethi, Y. Yolo-JD: A deep learning network for jute diseases and pests detection from images. Plants 2022, 11, 937. [Google Scholar] [CrossRef] [PubMed]
- Wang, L.; Cai, J.; Wang, T.; Gadekallu, K.; Fang, T.R. Detection of pine wilt disease using AAV remote sensing with an improved YOLO model. IEEE J. Sel. Top. Appl. Earth Obs. Remote Sens. 2024, 17, 19230–19242. [Google Scholar] [CrossRef]
- Yuan, J.; Wang, L.; Wang, T.; Bashir, M.M.; Al Dabel, J.; Wang, H.; Feng, K.; Fang, W.; Wang, Y. YOLOv8-RD: High-Robust pine wilt disease detection method based on residual fuzzy YOLOv8. IEEE J. Sel. Top. Appl. Earth Obs. Remote Sens. 2024, 18, 385–397. [Google Scholar] [CrossRef]
- Liu, Z.; Guo, T.; Zhao, S.; Liang, Y. YOLO-BSMamba: A YOLOv8s-Based model for tomato leaf disease detection in complex backgrounds. Agronomy 2025, 15, 870. [Google Scholar] [CrossRef]
- Fang, K.; Zhou, R.; Deng, N.; Li, C.; Zhu, X. RLDD-YOLOv11n: Research on rice leaf disease detection based on YOLOv11. Agronomy 2025, 15, 1266. [Google Scholar] [CrossRef]
- Manavalan, R. Towards an intelligent approaches for cotton diseases detection: A review. Comput. Electron. Agric. 2022, 200, 107255. [Google Scholar] [CrossRef]
- Toscano-Miranda, R.; Toro, M.; Aguilar, M.; Caro, A.; Marulanda, A.; Trebilcok, M. Artificial-intelligence and sensing techniques for the management of insect pests and diseases in cotton: A systematic literature review. J. Agric. Sci. 2022, 160, 16–31. [Google Scholar] [CrossRef]
- Rizwan, M.; Abro, S.; Asif, M.U.; Hameed, W.; Mahboob, Z.A.; Deho, M.A.; Sial, S. Evaluation of cotton germplasm for morphological and biochemical host plant resistance traits against sucking insect pests complex. J. Cotton Res. 2021, 4, 18. [Google Scholar] [CrossRef]
- Ahmad, M.; Muhammad, A.; Sajjad, A. Ecological management of cotton insect pests. In Cotton Production and Uses: Agronomy, Crop Protection, and Postharvest Technologies; Springer: Singapore, 2020; pp. 213–238. [Google Scholar] [CrossRef]
- Li, C.; Wang, M. Pest and disease management in agricultural production with artificial intelligence: Innovative applications and development trends. Adv. Resour. Res. 2024, 4, 381–401. [Google Scholar] [CrossRef]
- Cheng, Y. Analysis of development strategy for ecological agriculture based on a neural network in the environmental economy. Sustainability 2023, 15, 6843. [Google Scholar] [CrossRef]
- John, M.A.; Bankole, I.; Ajayi-Moses, T.; Ijila, T.; Jeje, P.; Lalit, R. Relevance of advanced plant disease detection techniques in disease and Pest Management for Ensuring Food Security and Their Implication: A review. Am. J. Plant Sci. 2023, 14, 1260–1296. [Google Scholar] [CrossRef]
- Wang, C.-Y.; Liao, H.-Y.M. YOLOv1 to YOLOv10: The fastest and most accurate real-time object detection systems. APSIPA Trans. Signal Inf. Process. 2024, 13, e29. [Google Scholar] [CrossRef]
- Ultralytics. YOLOv11. Available online: https://github.com/ultralytics/ultralytics (accessed on 1 June 2025).
- Khanam, R.; Hussain, M. Yolov11: An overview of the key architectural enhancements. arXiv 2024, arXiv:2410.17725. [Google Scholar] [CrossRef]
- Wang, A.; Chen, H.; Lin, Z.; Han, G.; Ding, G. Repvit: Revisiting mobile cnn from vit perspective. In Proceedings of the IEEE/CVF Conference on Computer Vision and Pattern Recognition, Seattle, WA, USA, 16–22 June 2024; pp. 15909–15920. [Google Scholar]
- Woo, S.; Park, J.; Lee, J.-Y.; Kweon, I.S. Cbam: Convolutional block attention module. In Proceedings of the European Conference on Computer Vision (ECCV), Munich, Germany, 8–14 September 2018; pp. 3–19. [Google Scholar]
- Zhang, X.; Song, Y.; Song, T.; Yang, D.; Ye, Y.; Zhou, L.; Zhang, L. LDConv: Linear deformable convolution for improving convolutional neural networks. Image Vis. Comput. 2024, 149, 105190. [Google Scholar] [CrossRef]
- Zhao, Y.; Lv, W.; Xu, S.; Wei, J.; Wang, G.; Dang, Q.; Liu, Y.; Chen, J. Detrs beat yolos on real-time object detection. In Proceedings of the IEEE/CVF Conference on Computer Vision and Pattern Recognition, Seattle, WA, USA, 16–22 June 2024; pp. 16965–16974. [Google Scholar]
- Dong, J.; Lin, Y.; Li, C.; Zhou, S.; Zheng, N. AugDETR: Improving multi-scale learning for detection transformer. In Proceedings of the European Conference on Computer Vision, Milan, Italy, 29 September–4 October 2024; pp. 238–255. [Google Scholar]
- Peng, Y.; Li, H.; Wu, P.; Zhang, Y.; Sun, X.; Wu, F. D-FINE: Redefine regression task in DETRs as fine-grained distribution refinement. arXiv 2024, arXiv:2410.13842. [Google Scholar]
- Zambre, Y.V.; Rajkitkul, E.; Mohan, A.; Peeples, J. Spatial transformer network YOLO model for agricultural object detection. In Proceedings of the International Conference on Machine Learning and Applications, Vienna, Austria, 21–27 July 2024; pp. 115–121. [Google Scholar]
- Li, R.; He, Y.; Li, Y.; Qin, W.; Abbas, A.; Ji, R.; Li, S.; Wu, Y.; Sun, X.; Yang, J. Identification of cotton pest and disease based on CFNet-VoV-GCSP-LSKNet-YOLOv8s: A new era of precision agriculture. Front. Plant Sci. 2024, 15, 1348402. [Google Scholar] [CrossRef]
- Pan, P.; Shao, M.; He, P.; Hu, L.; Zhao, S.; Huang, L.; Zhou, G.; Zhang, J. Lightweight cotton diseases real-time detection model for resource-constrained devices in natural environments. Front. Plant Sci. 2024, 15, 1383863. [Google Scholar] [CrossRef] [PubMed]
Disclaimer/Publisher’s Note: The statements, opinions and data contained in all publications are solely those of the individual author(s) and contributor(s) and not of MDPI and/or the editor(s). MDPI and/or the editor(s) disclaim responsibility for any injury to people or property resulting from any ideas, methods, instructions or products referred to in the content. |
© 2025 by the authors. Licensee MDPI, Basel, Switzerland. This article is an open access article distributed under the terms and conditions of the Creative Commons Attribution (CC BY) license (https://creativecommons.org/licenses/by/4.0/).