Author Contributions
Conceptualization, W.Z. and M.L.; methodology, W.Z., S.Y., S.F. and L.W. (Lixing Wei); formal analysis, L.W. (Liuxihang Wang) and S.L.; investigation, S.Y. and X.L.; resources, M.L. and S.F.; writing—original draft preparation, W.Z., M.L. and X.L.; writing—review and editing, S.Y., P.M., A.H., S.F., S.L., L.W. (Liuxihang Wang) and L.W. (Lixing Wei); visualization, X.L. and L.W. (Liuxihang Wang); supervision, P.M. and A.H.; project administration, P.M.; funding acquisition, A.H.; validation, S.L. All authors have read and agreed to the published version of the manuscript.
Figure 1.
(a) ISEKI PZ60 Rice Transplanter Design Drawing; (b) ISEKI PZ60 Rice Transplanter Physical Photograph; (c) ISEKI PZ60 Rice Transplanter Actual Operation.
Figure 1.
(a) ISEKI PZ60 Rice Transplanter Design Drawing; (b) ISEKI PZ60 Rice Transplanter Physical Photograph; (c) ISEKI PZ60 Rice Transplanter Actual Operation.
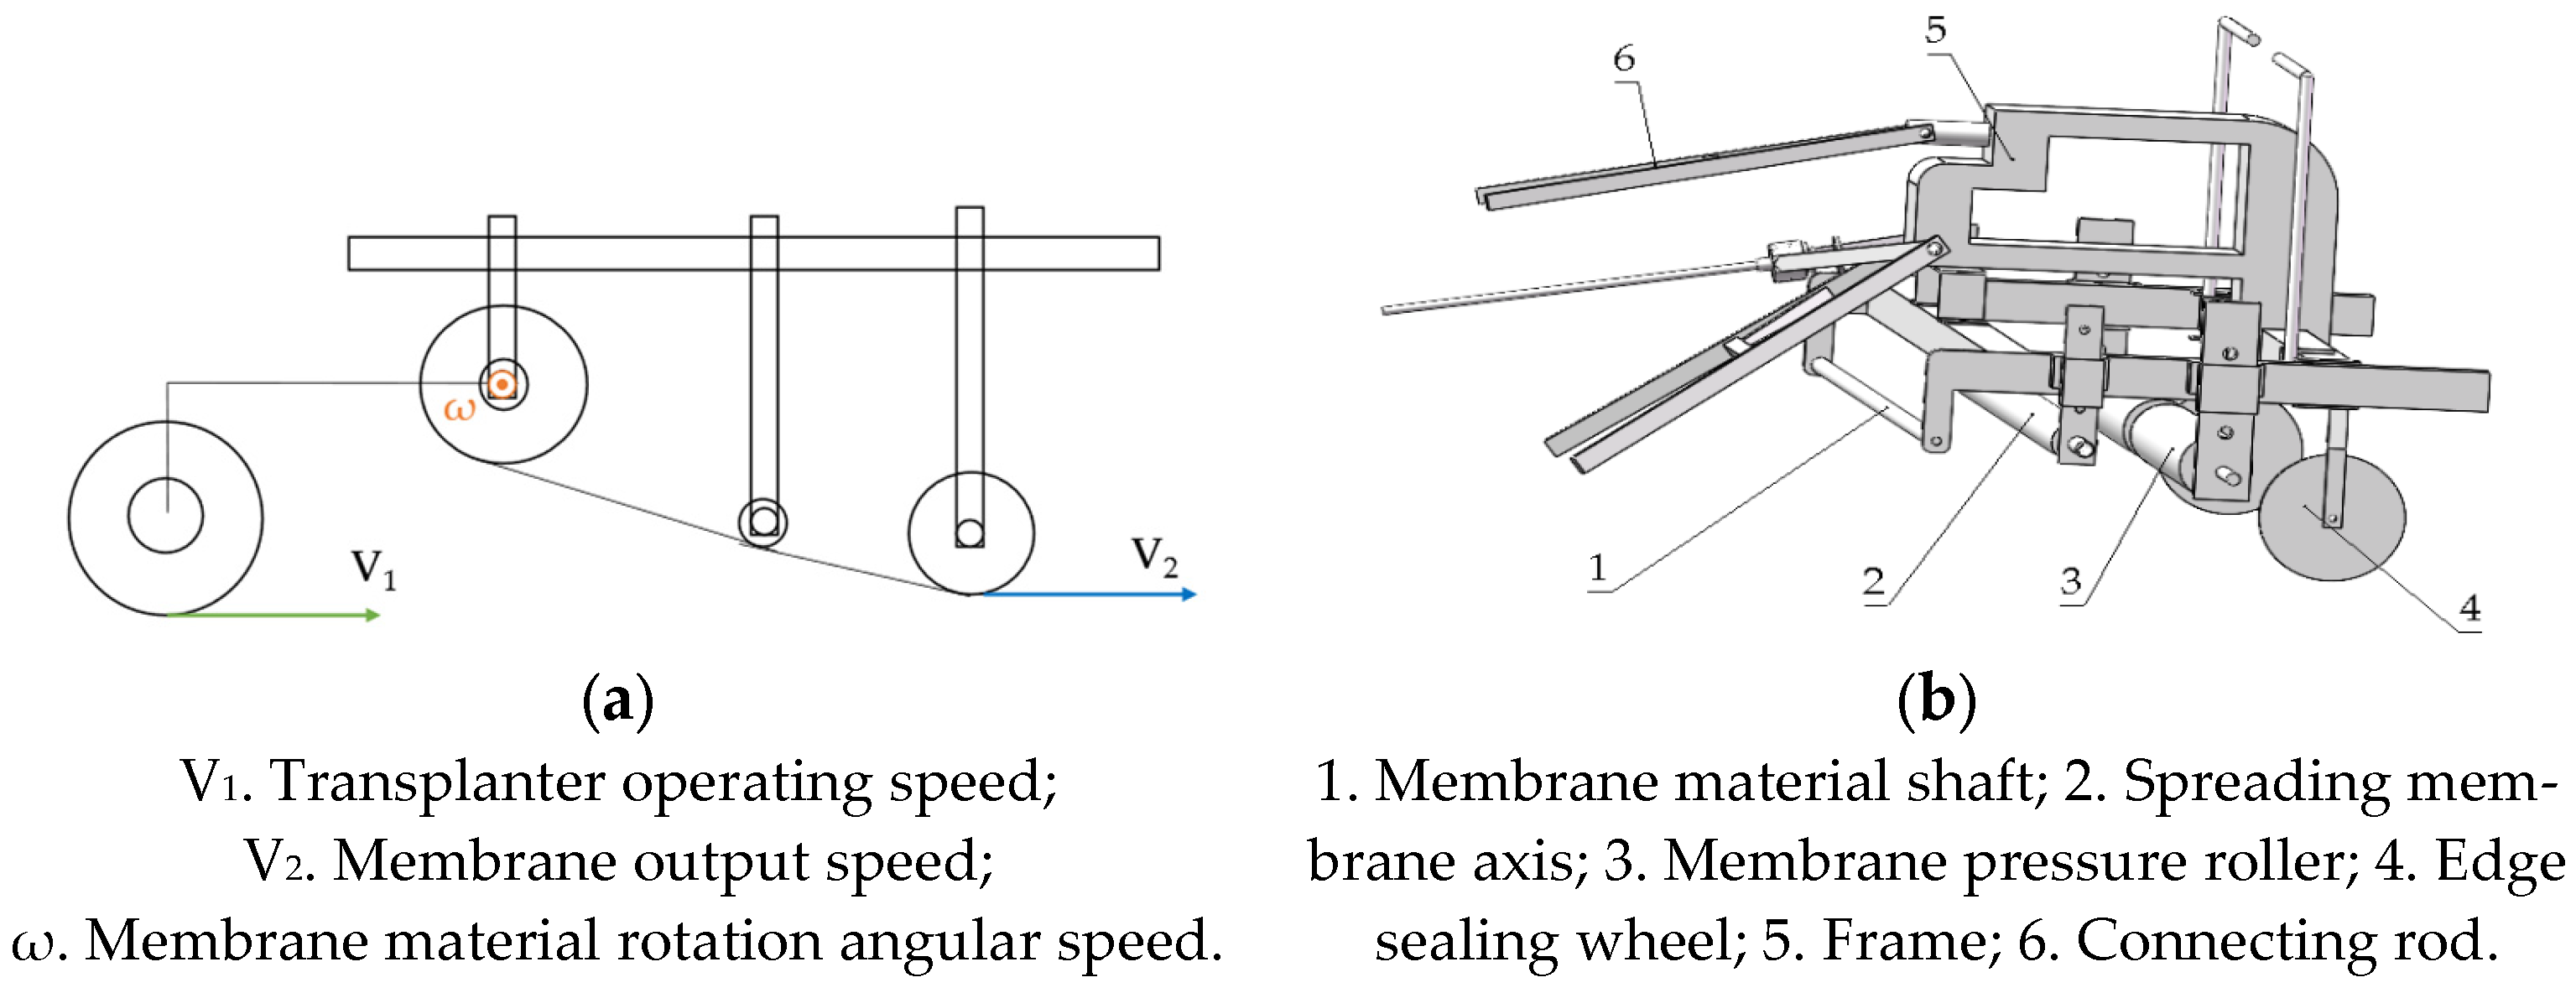
Figure 2.
(a) Synchronous membrane-laying technology; (b) Model drawing of the synchronized membrane-laying device.
Figure 2.
(a) Synchronous membrane-laying technology; (b) Model drawing of the synchronized membrane-laying device.
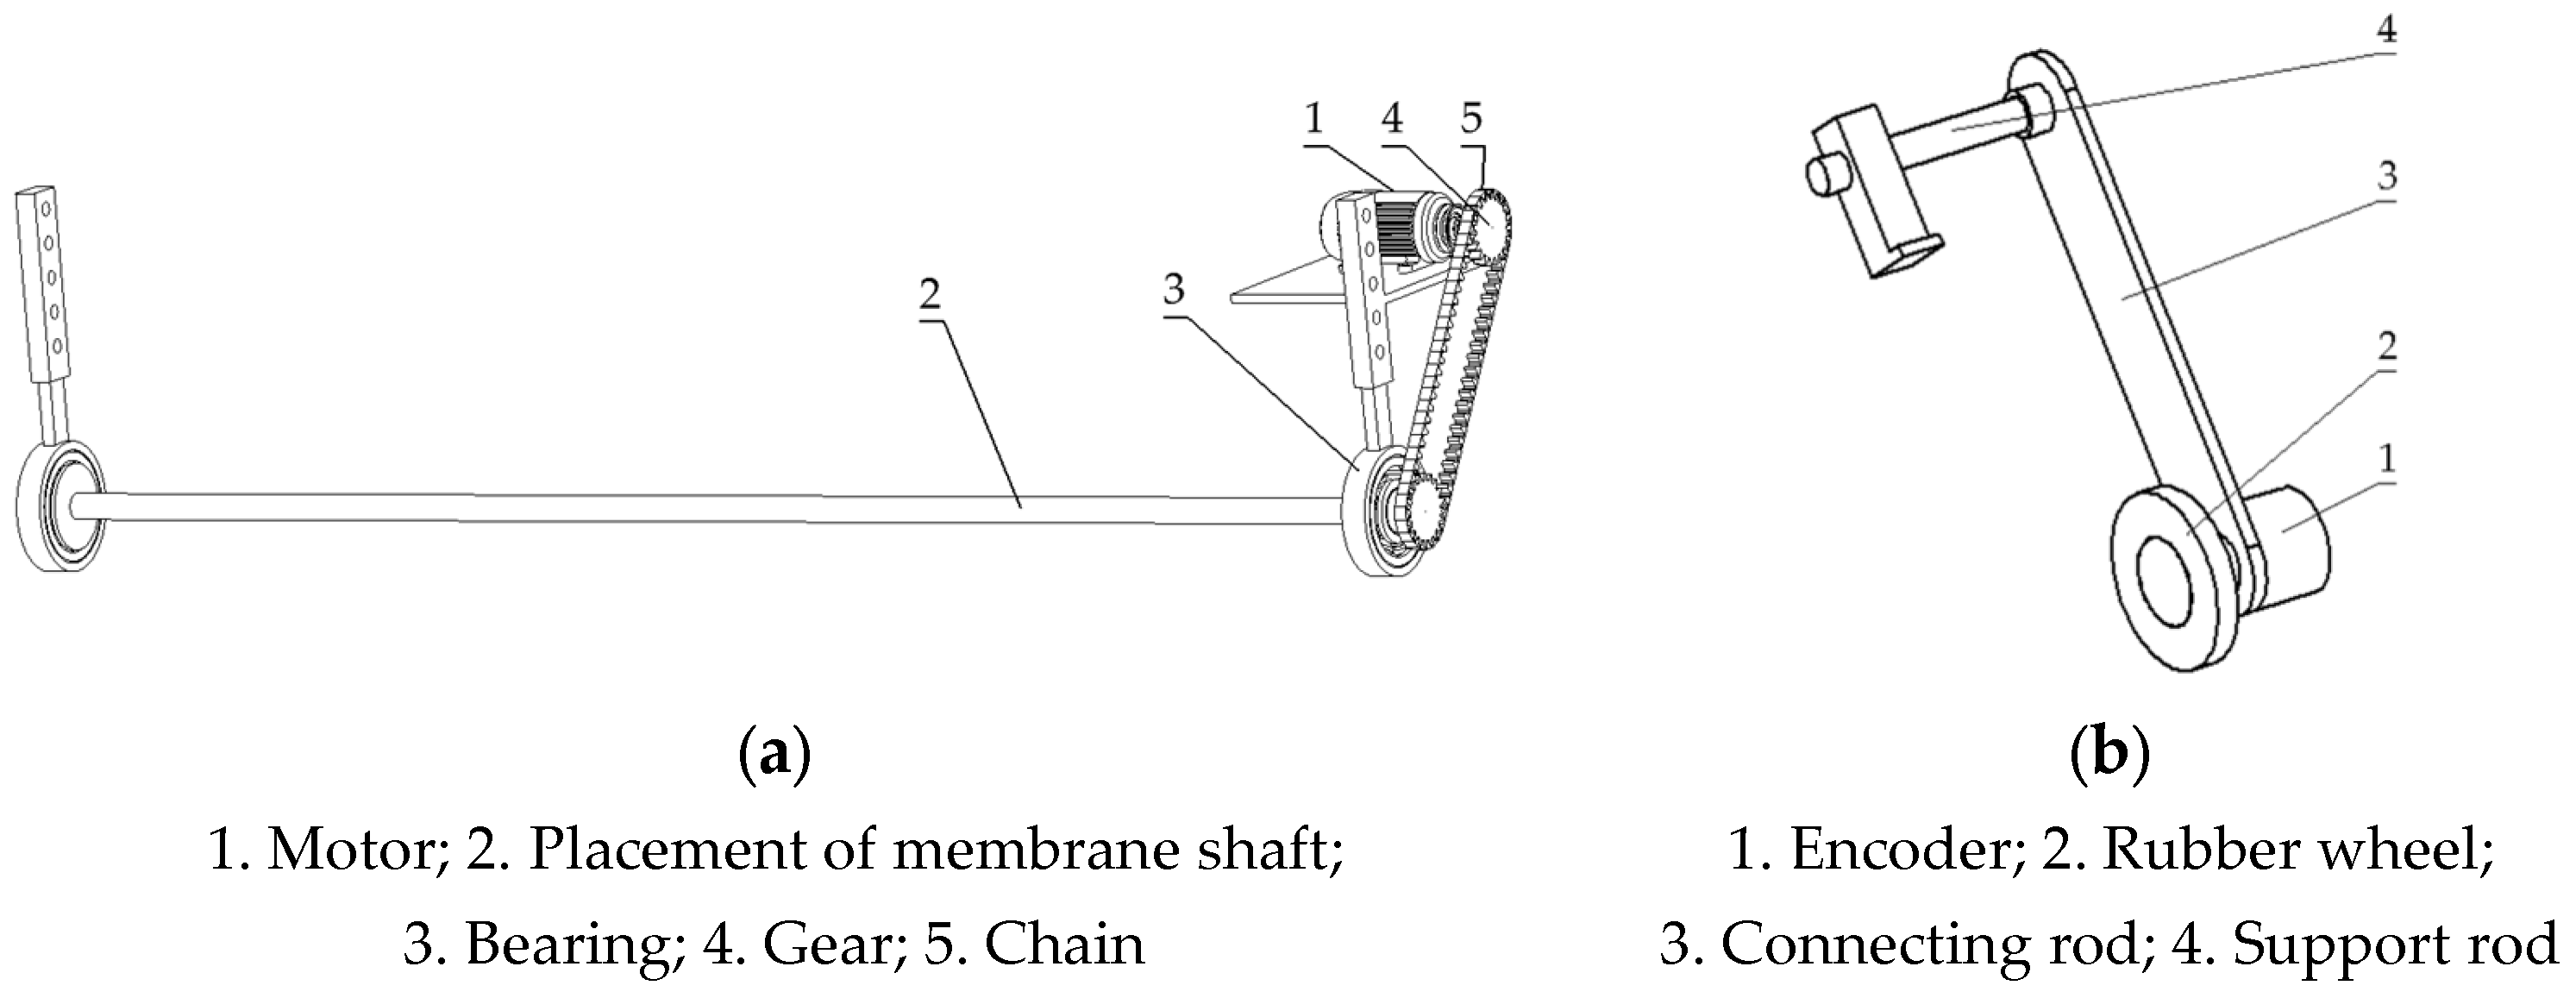
Figure 3.
(a) Structure diagram of the membrane shaft; (b) Structural diagram of the speed measuring unit.
Figure 3.
(a) Structure diagram of the membrane shaft; (b) Structural diagram of the speed measuring unit.
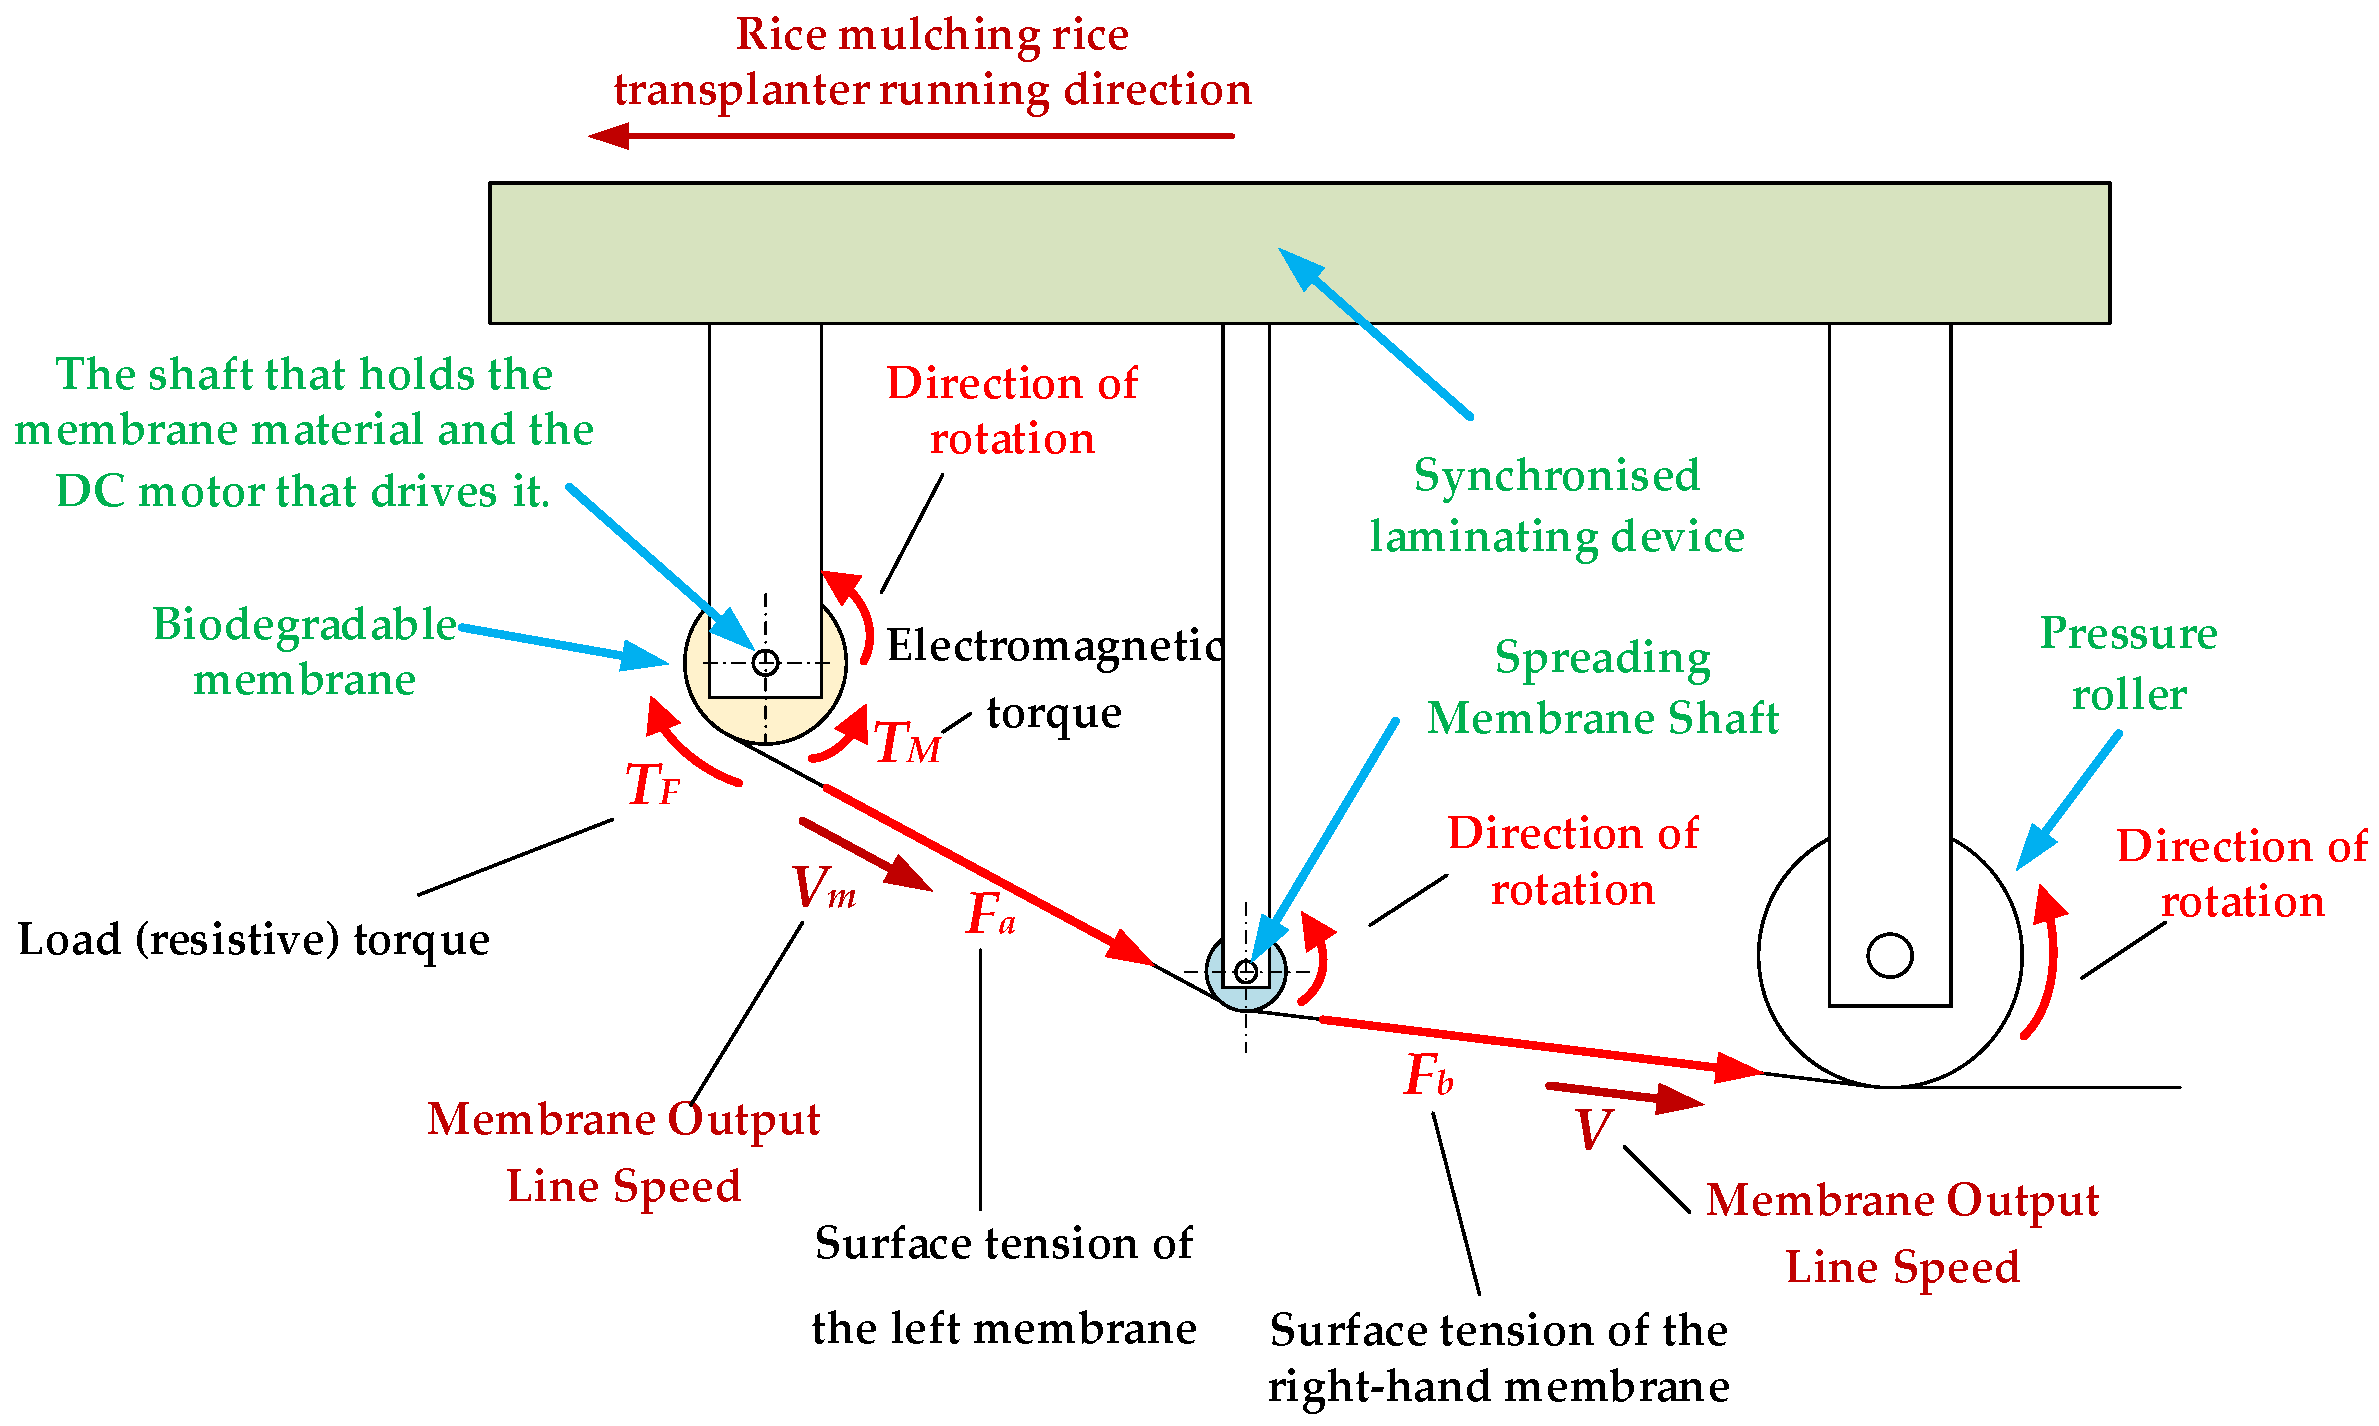
Figure 4.
The force analysis diagram of each mechanism during the operation of the membrane laminating device.
Figure 4.
The force analysis diagram of each mechanism during the operation of the membrane laminating device.
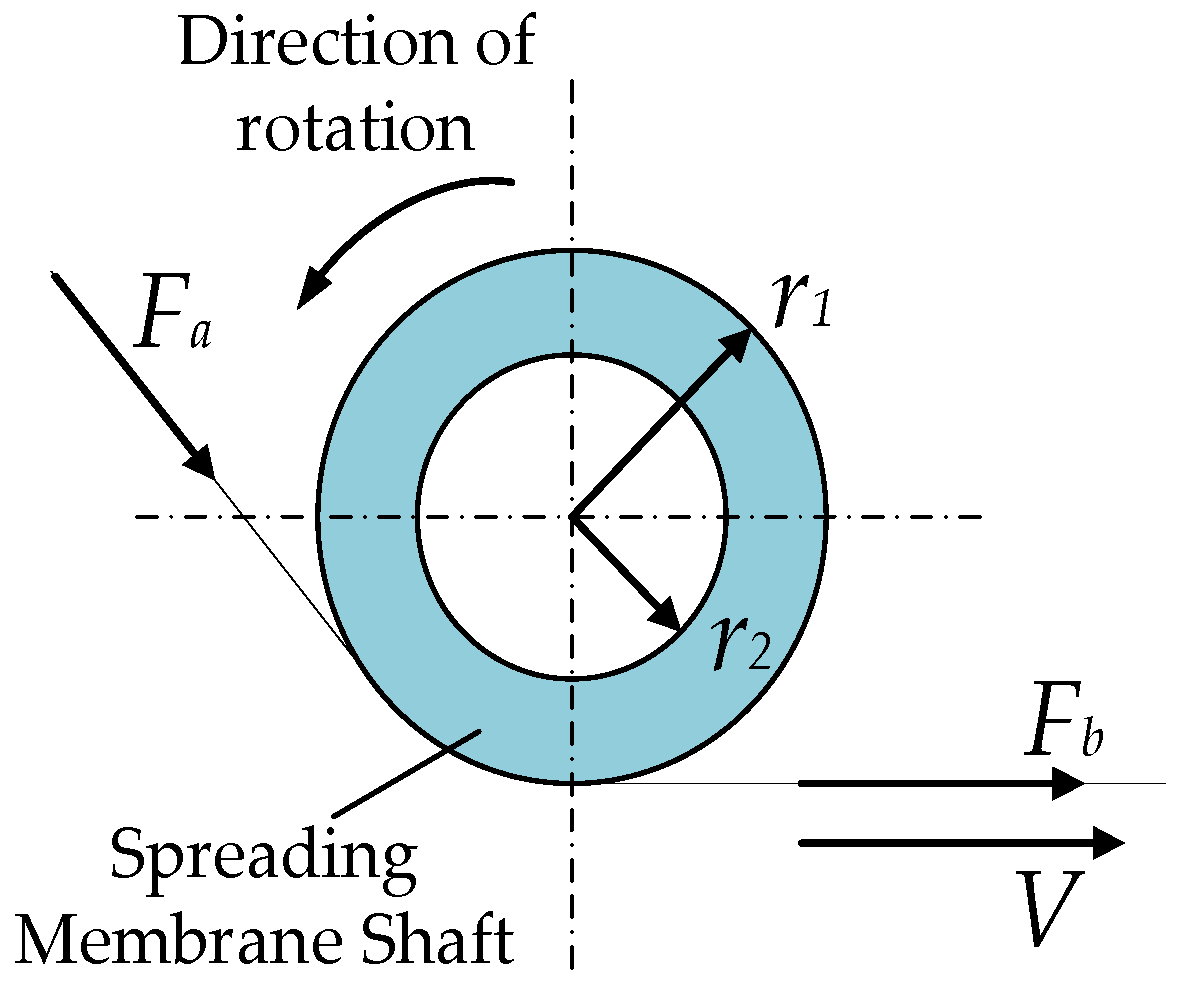
Figure 5.
Mechanical relationship between membrane tension and spreading axis rotation.
Figure 5.
Mechanical relationship between membrane tension and spreading axis rotation.
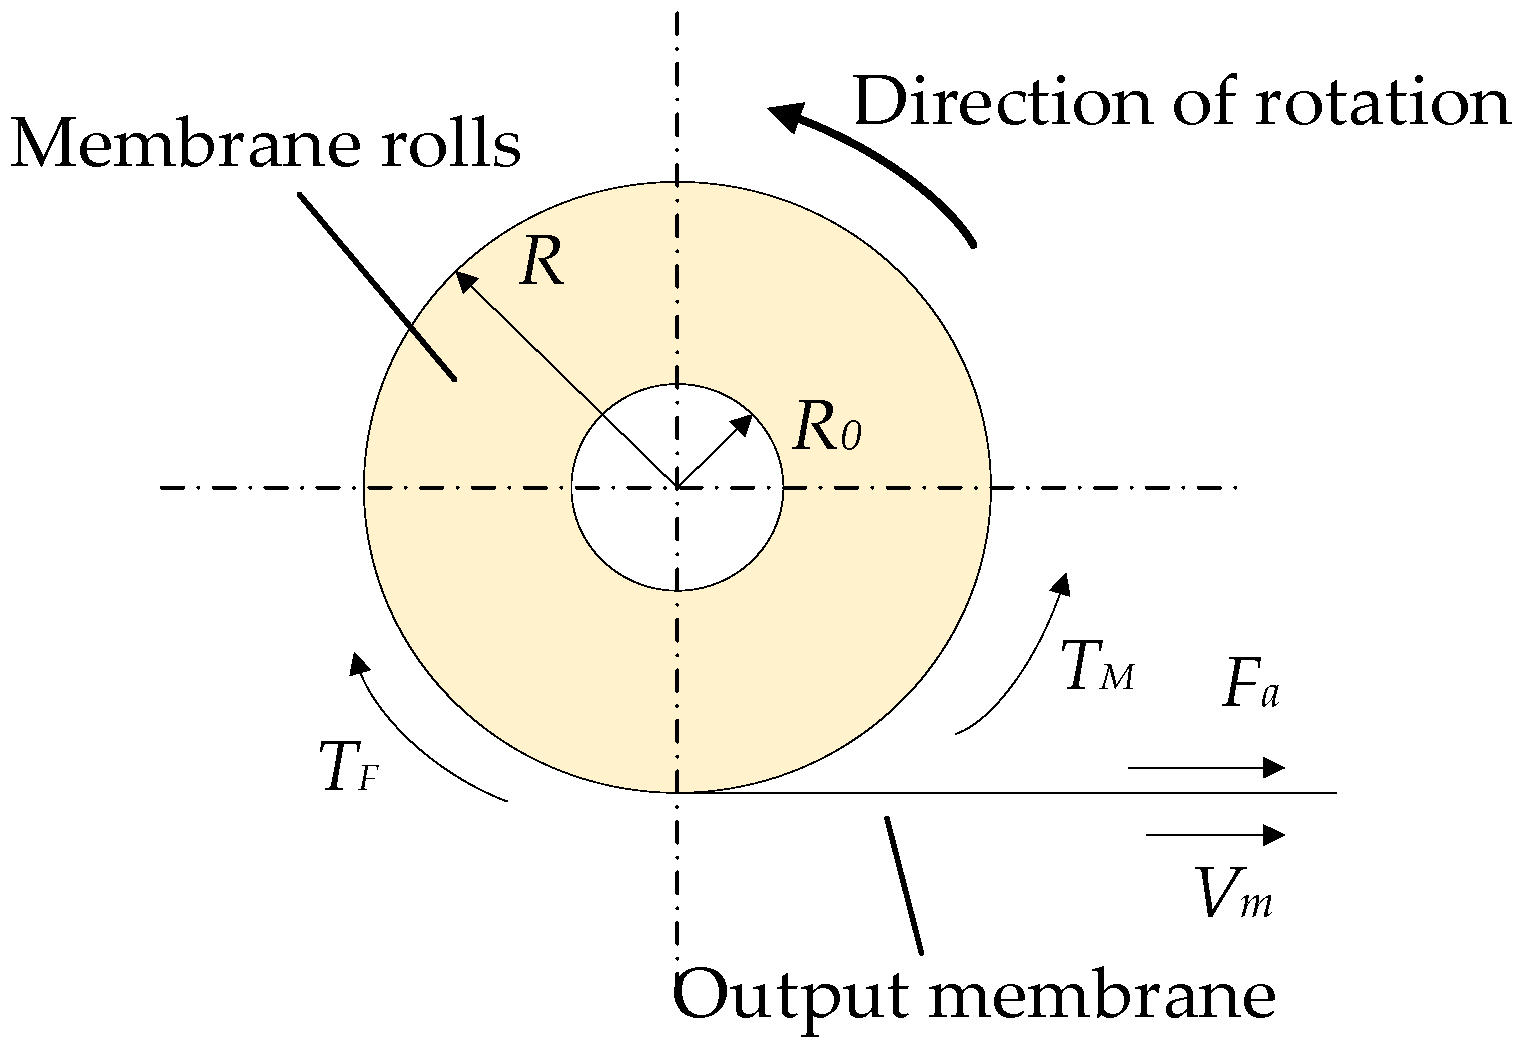
Figure 6.
Working principle diagram of membrane material consumption.
Figure 6.
Working principle diagram of membrane material consumption.
Figure 7.
(a) Specimen strip preparation; (b) Sample parameter values; (c) Test sample; (d) Random sampling method; (e) Random sampling of samples; (f) Test output plots; (g) Mass gauge; and (h) Membrane tensile tests.
Figure 7.
(a) Specimen strip preparation; (b) Sample parameter values; (c) Test sample; (d) Random sampling method; (e) Random sampling of samples; (f) Test output plots; (g) Mass gauge; and (h) Membrane tensile tests.
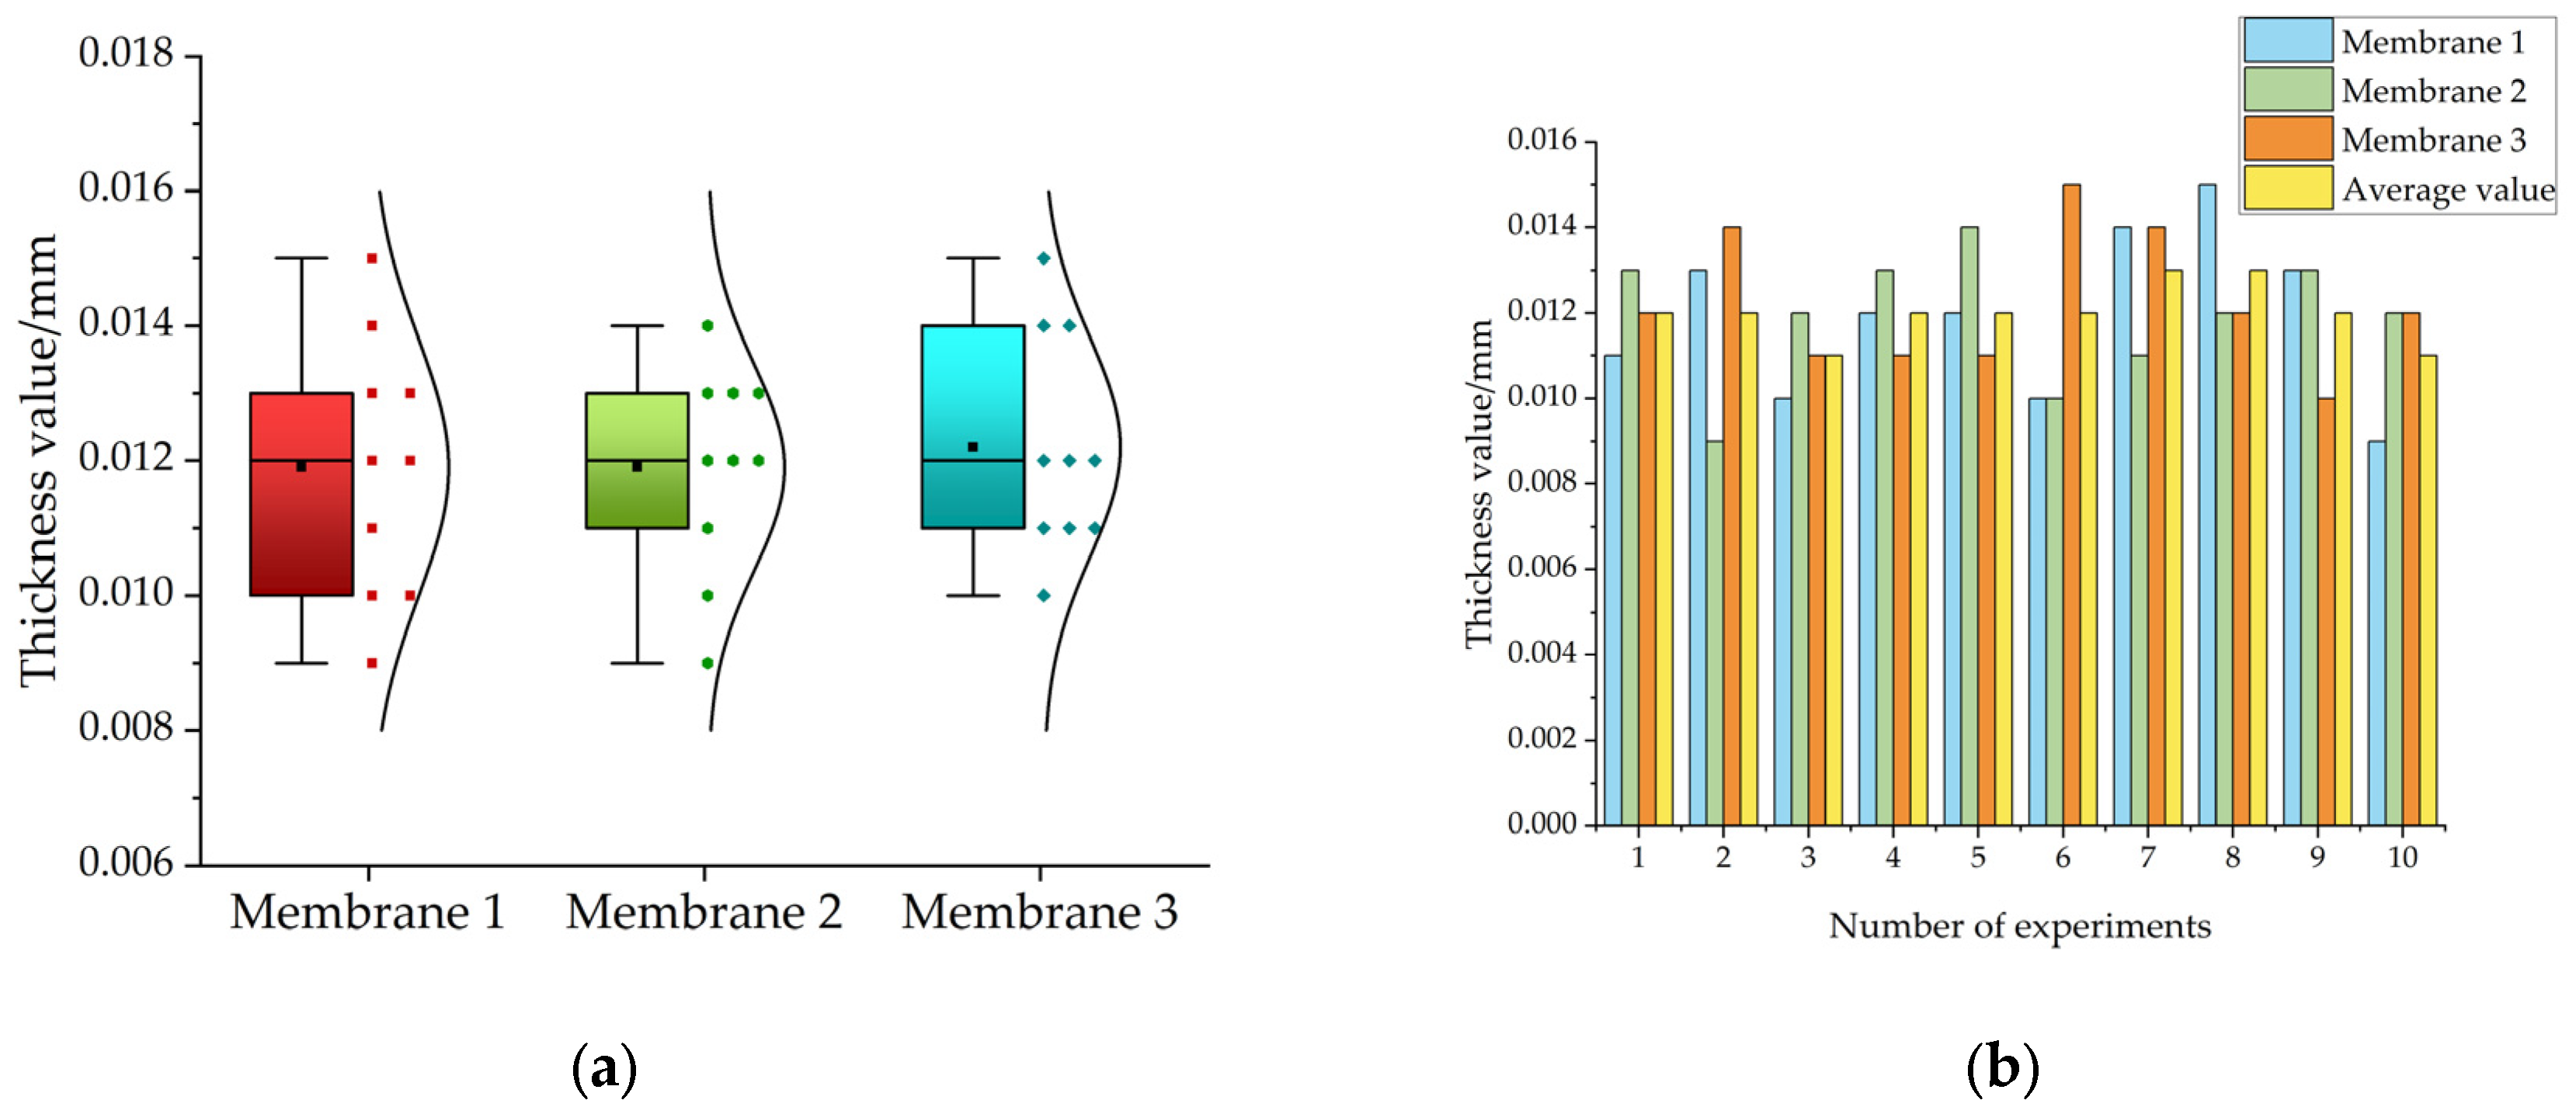
Figure 8.
(a) Boxplot and distribution of test results for three biodegradable membranes; (b) Histogram of thickness values and mean thicknesses for the three membranes.
Figure 8.
(a) Boxplot and distribution of test results for three biodegradable membranes; (b) Histogram of thickness values and mean thicknesses for the three membranes.
Figure 9.
Schematic diagram of membrane material radius variation.
Figure 9.
Schematic diagram of membrane material radius variation.
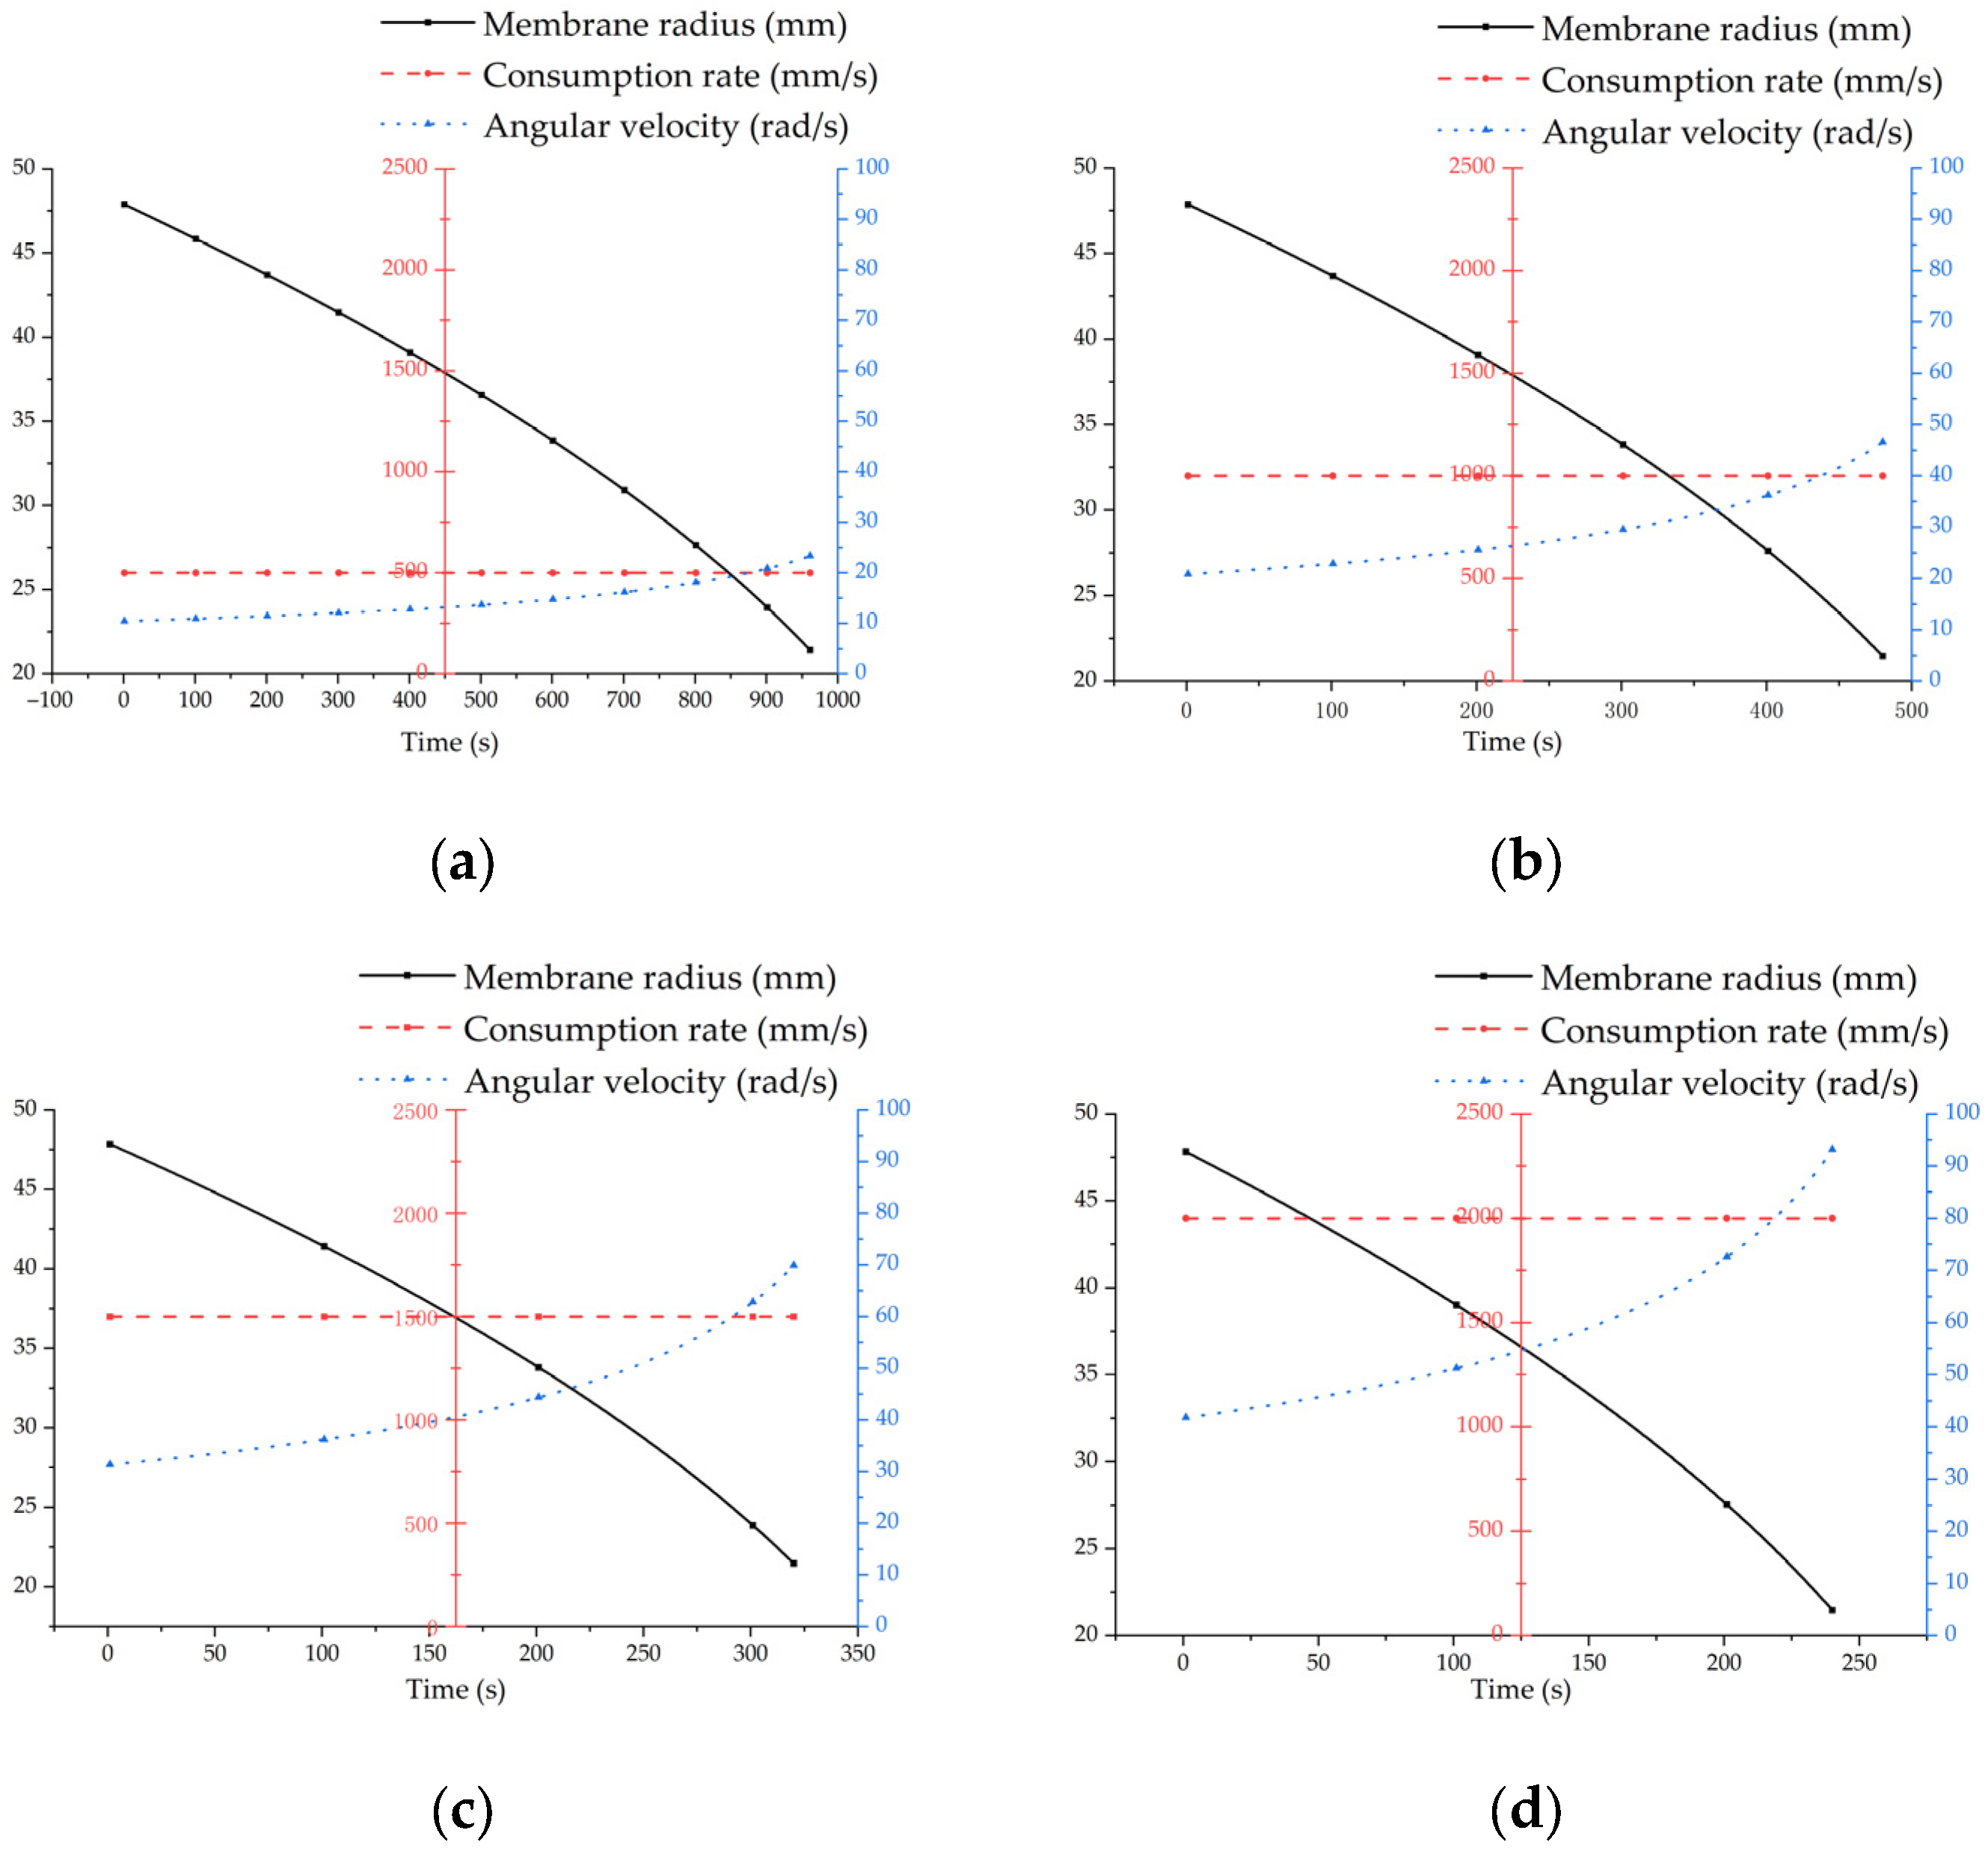
Figure 10.
Membrane radius and angular velocity variation over time at four operating speeds: (a) 0.5 m/s; (b) 1.0 m/s; (c) 1.5 m/s; and (d) 2.0 m/s.
Figure 10.
Membrane radius and angular velocity variation over time at four operating speeds: (a) 0.5 m/s; (b) 1.0 m/s; (c) 1.5 m/s; and (d) 2.0 m/s.
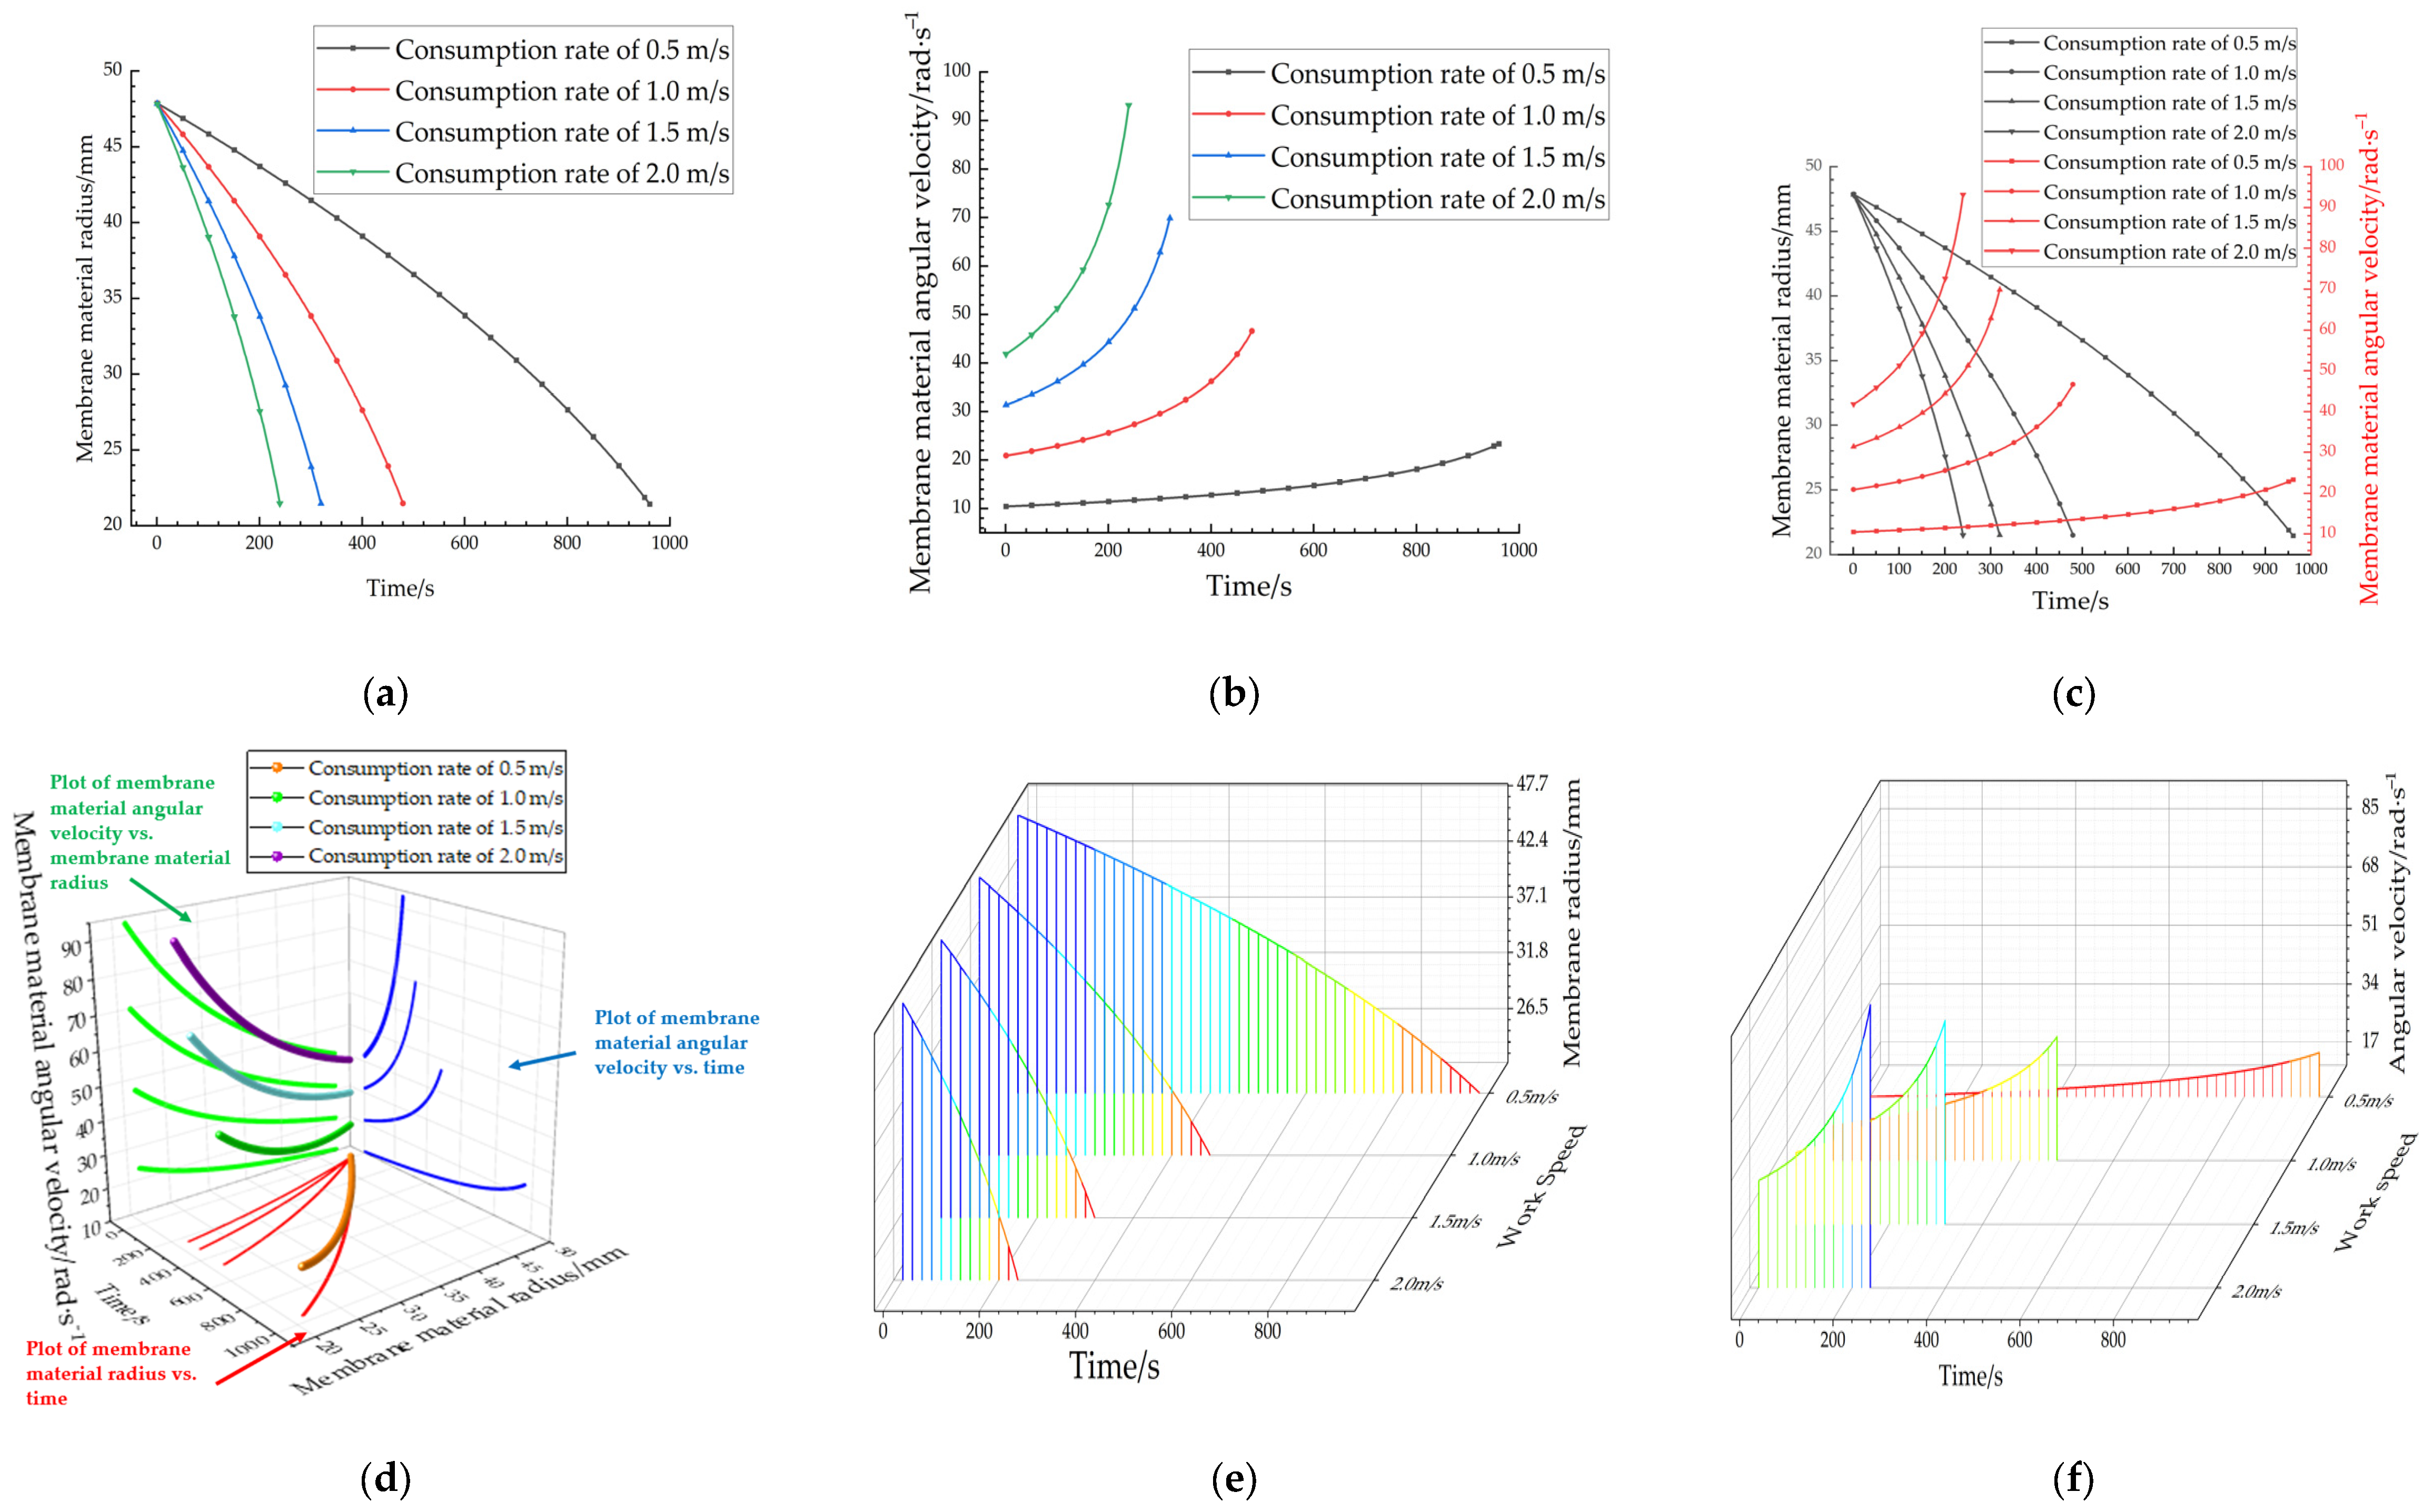
Figure 11.
Plot of membrane radius and angular velocity vs. time. (a) Membrane radius vs. time; (b) Angular velocity vs. time; (c) Radius vs. angular velocity (2D); (d) Radius vs. angular velocity vs. time (3D); (e) Radius vs. operating speed vs. time (3D); and (f) Angular velocity vs. operating speed vs. time (3D).
Figure 12.
Double-loop speed control system for membrane axis in rice transplanting operations.
Figure 12.
Double-loop speed control system for membrane axis in rice transplanting operations.
Figure 13.
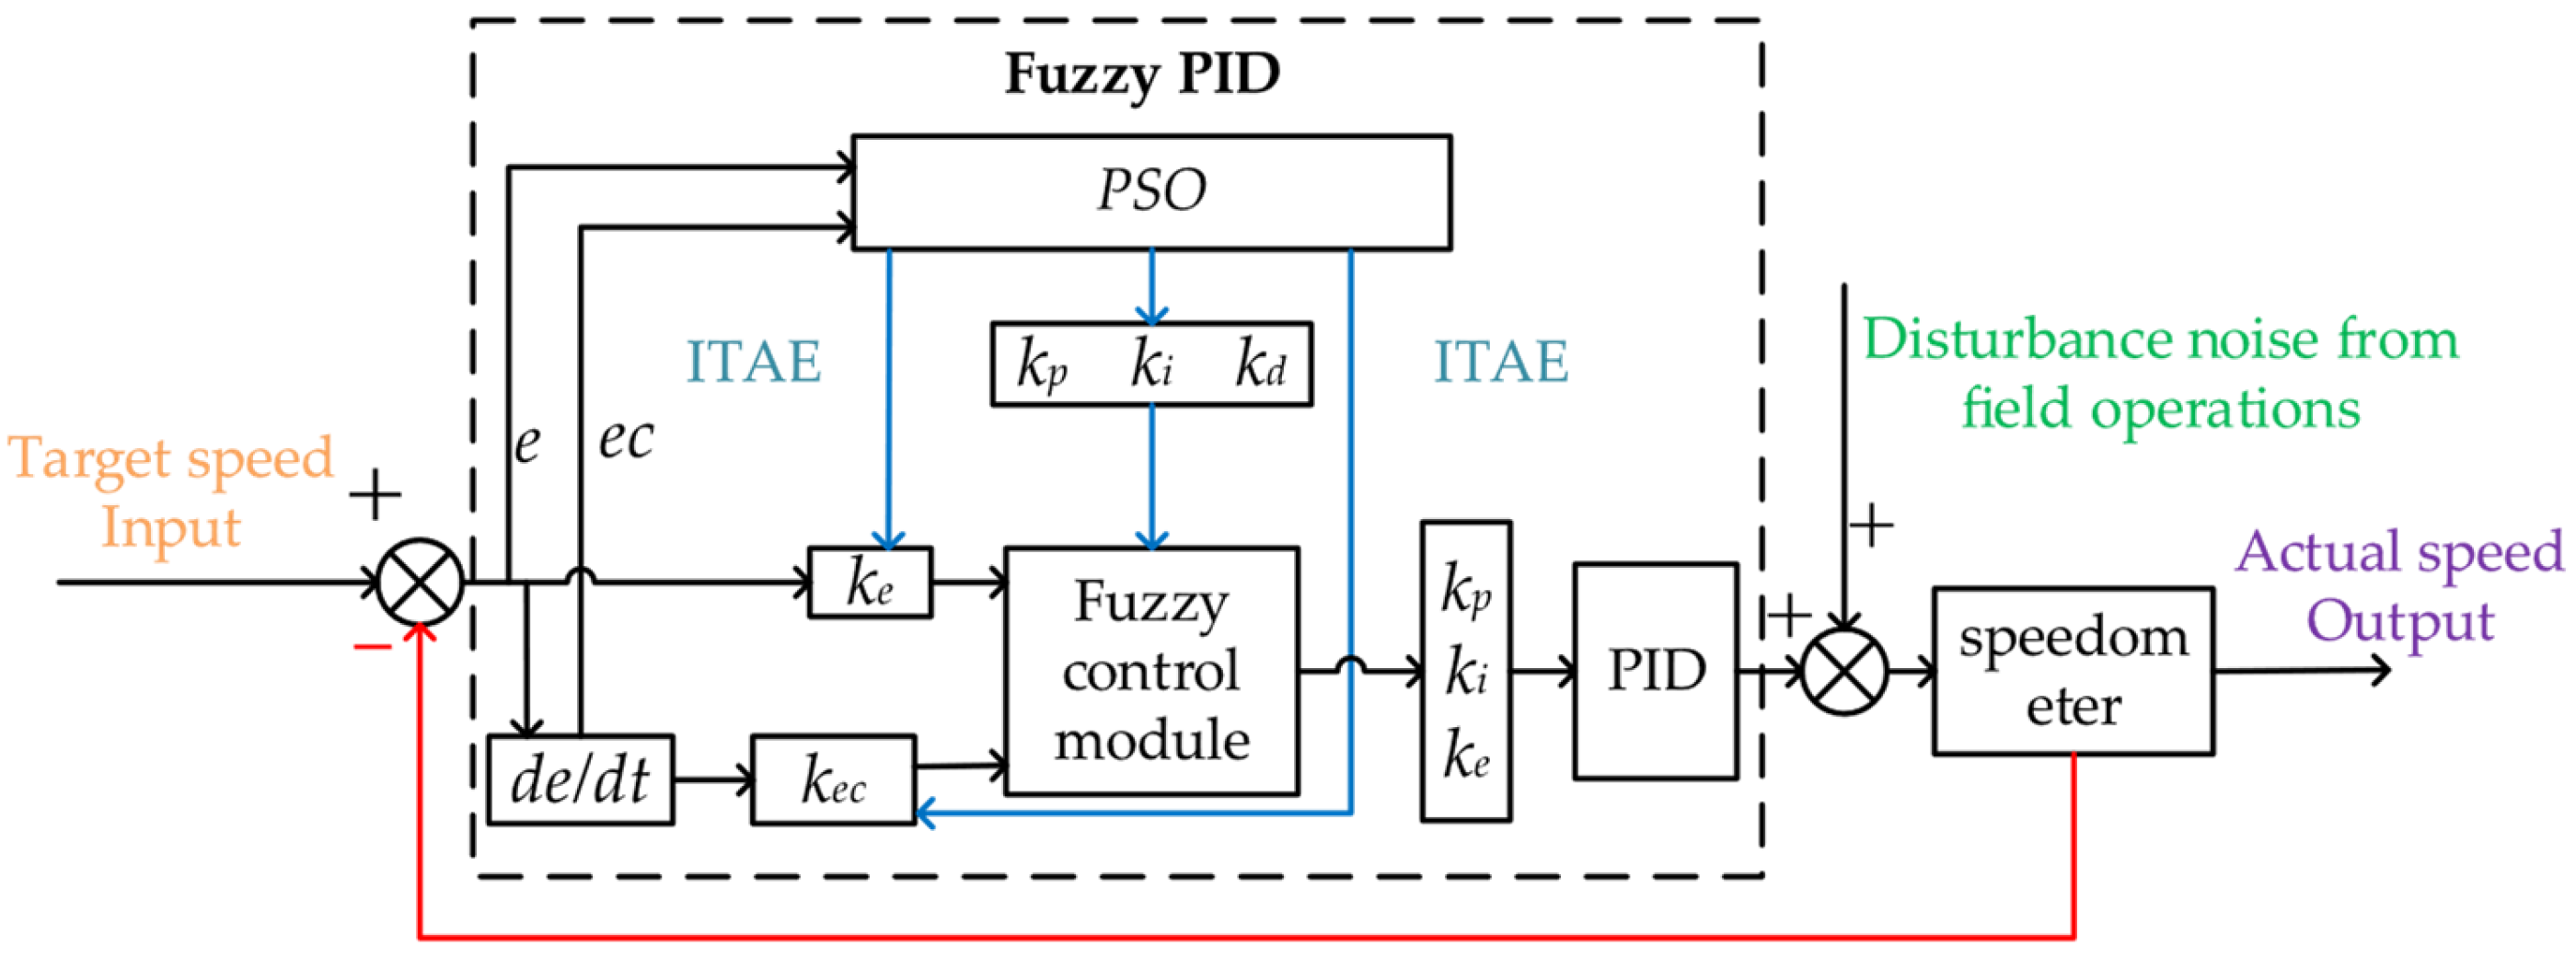
Schematic diagram of the Fuzzy-PID controller for membrane axis regulation in rice transplanting.
Figure 13.
Schematic diagram of the Fuzzy-PID controller for membrane axis regulation in rice transplanting.
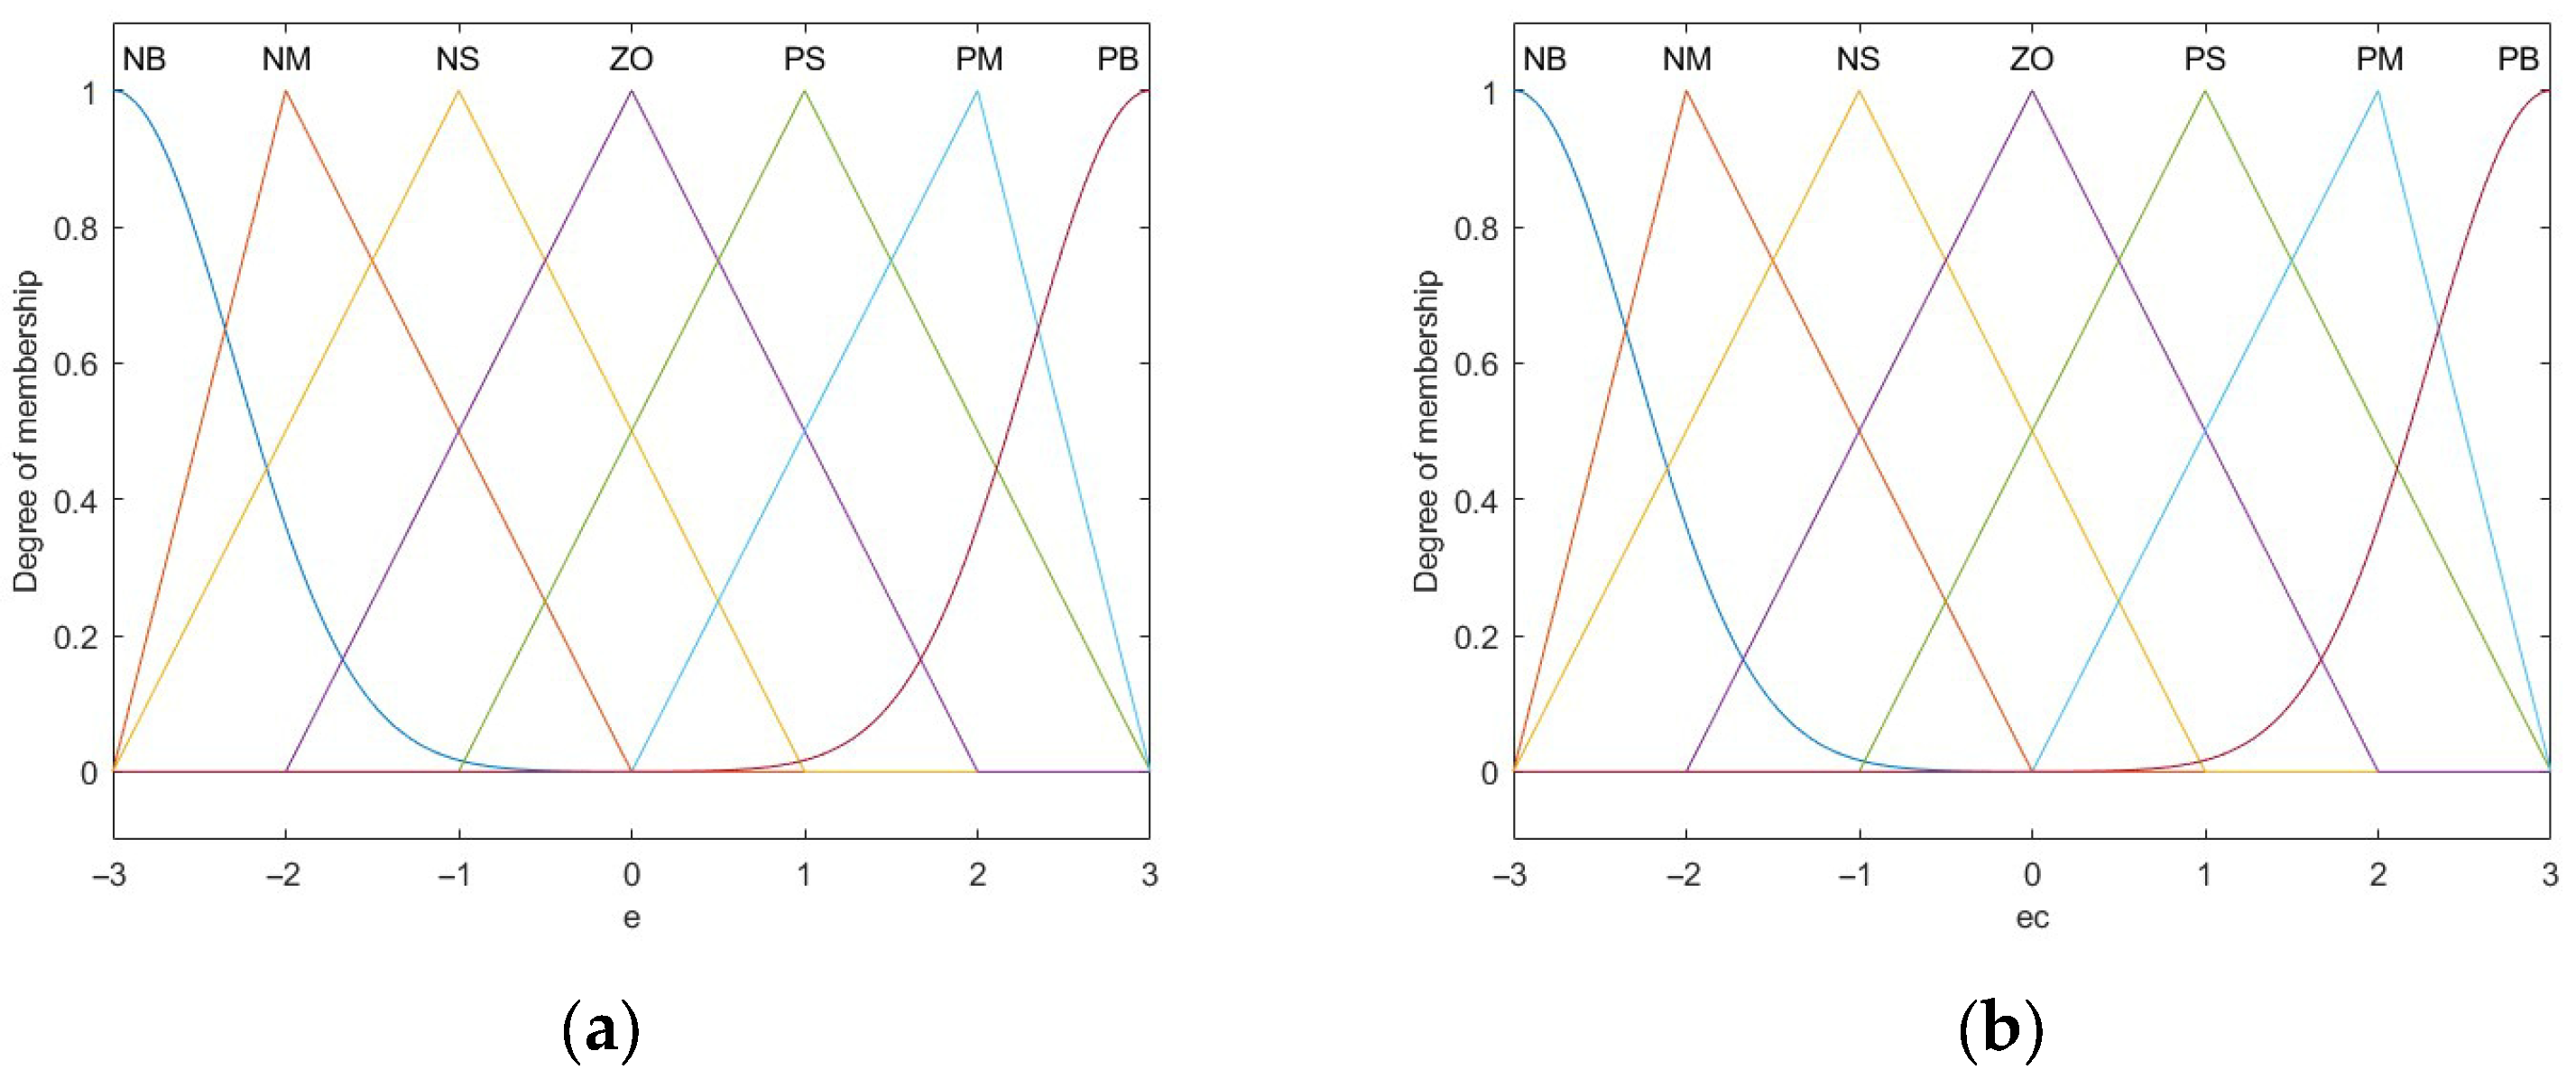
Figure 14.
(a) Membership function for error; (b) Membership function for rate of error change.
Figure 14.
(a) Membership function for error; (b) Membership function for rate of error change.
Figure 15.
(a) ΔKp output surface; (b) ΔKi output surface; and (c) ΔKd output surface.
Figure 15.
(a) ΔKp output surface; (b) ΔKi output surface; and (c) ΔKd output surface.
Figure 16.
(a) Schematic diagram of the PSO algorithm; and (b) Velocity direction update schematic.
Figure 16.
(a) Schematic diagram of the PSO algorithm; and (b) Velocity direction update schematic.
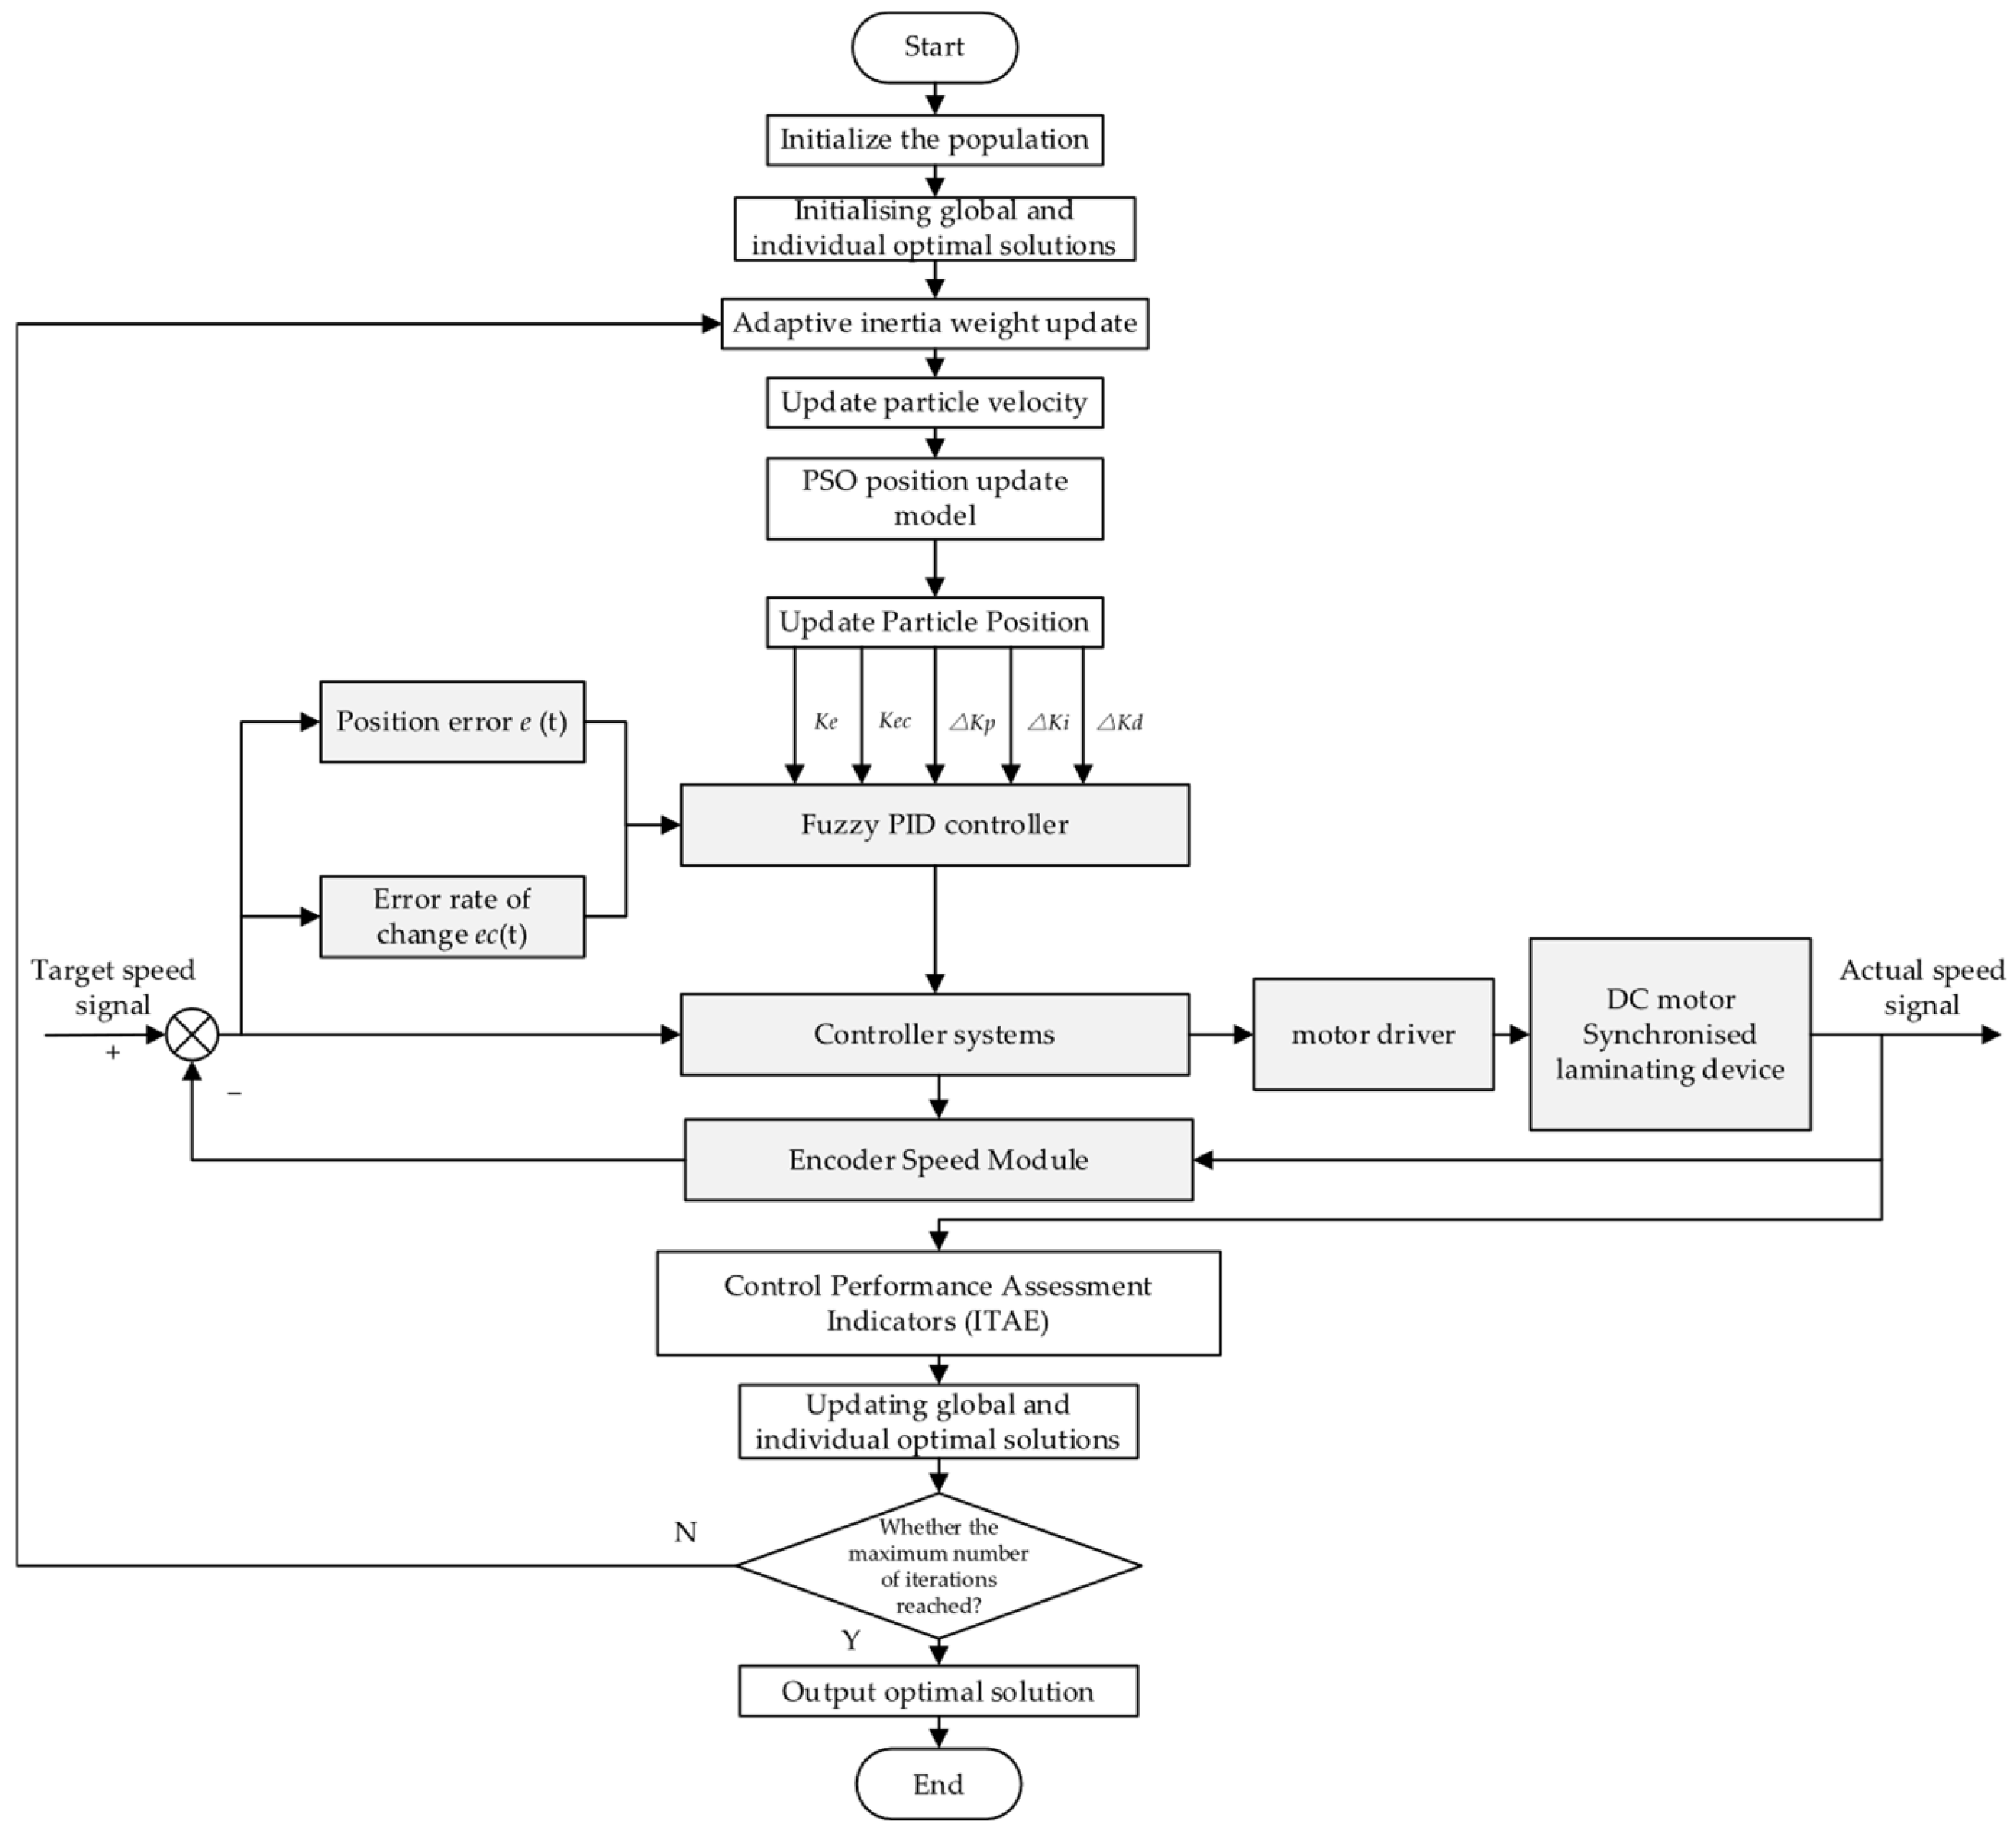
Figure 17.
Flowchart of the PSO algorithm for optimizing the fuzzy PID controller.
Figure 17.
Flowchart of the PSO algorithm for optimizing the fuzzy PID controller.
Figure 18.
Schematic diagram of PSO-Fuzzy PID applied to synchronous laminating control system.
Figure 18.
Schematic diagram of PSO-Fuzzy PID applied to synchronous laminating control system.
Figure 19.
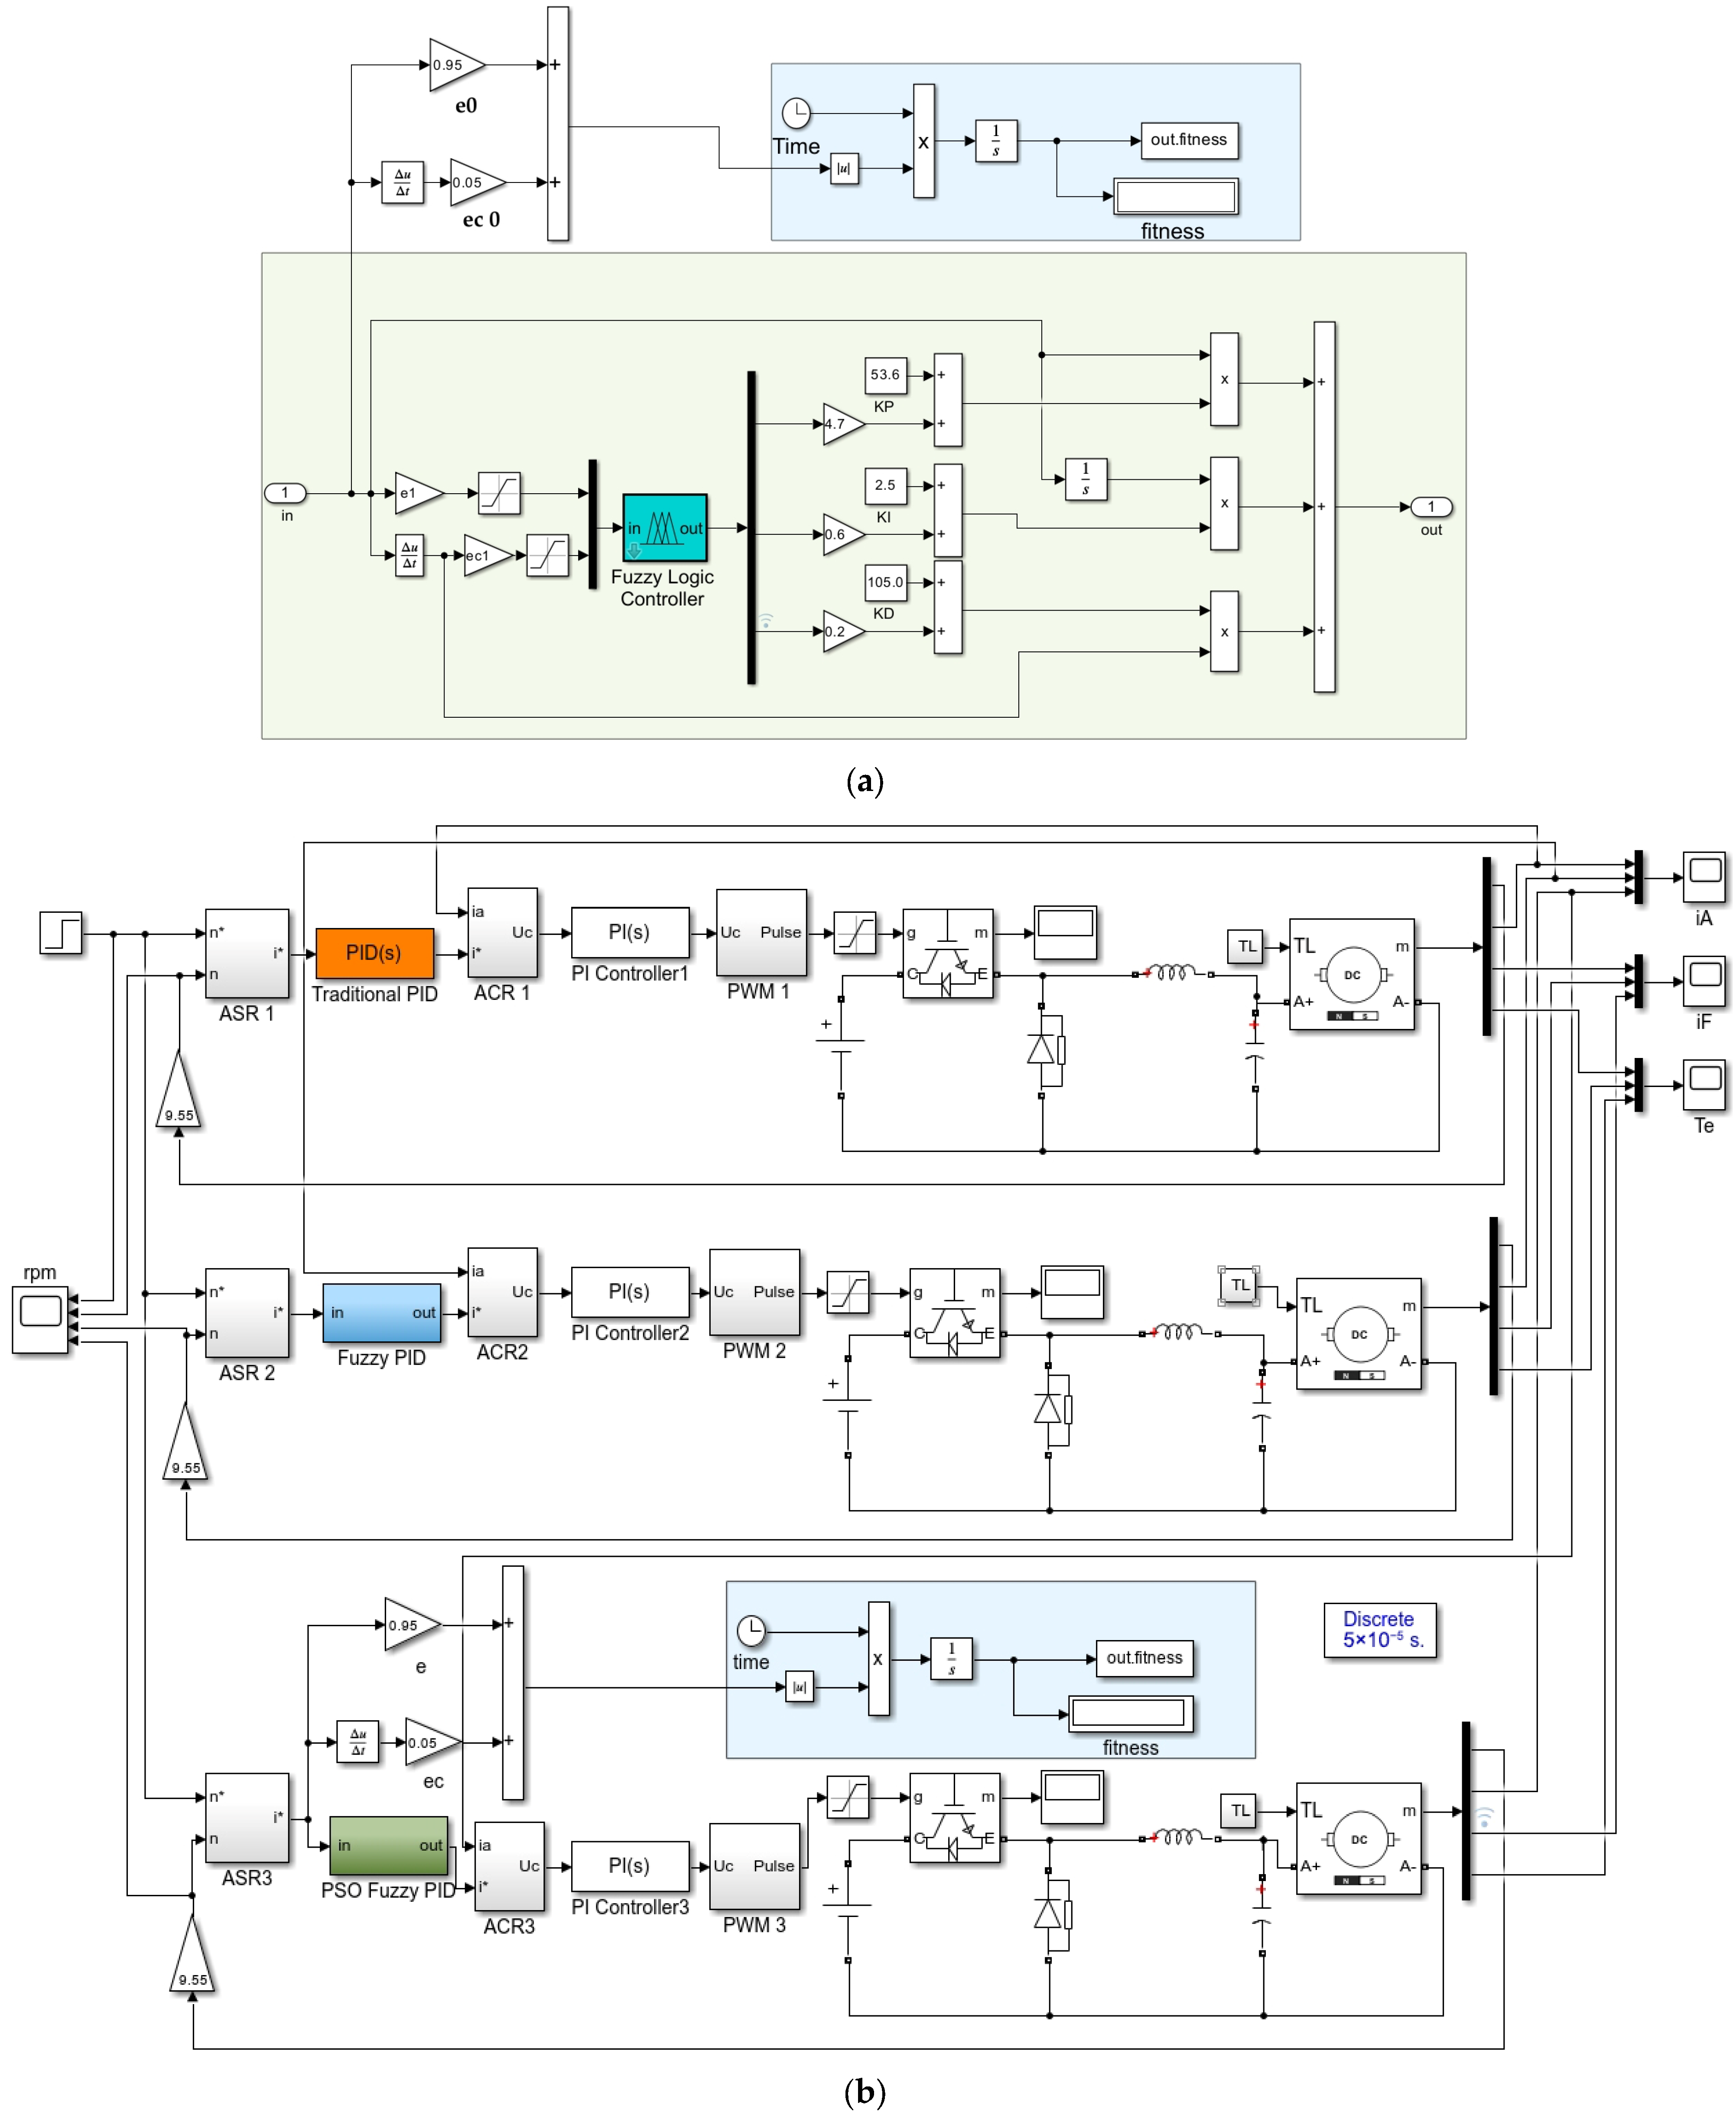
(a) PSO-Fuzzy PID control subsystems; and (b) 3 control comparison tests.
Figure 19.
(a) PSO-Fuzzy PID control subsystems; and (b) 3 control comparison tests.
Figure 20.
Iteration number graph.
Figure 20.
Iteration number graph.
Figure 21.
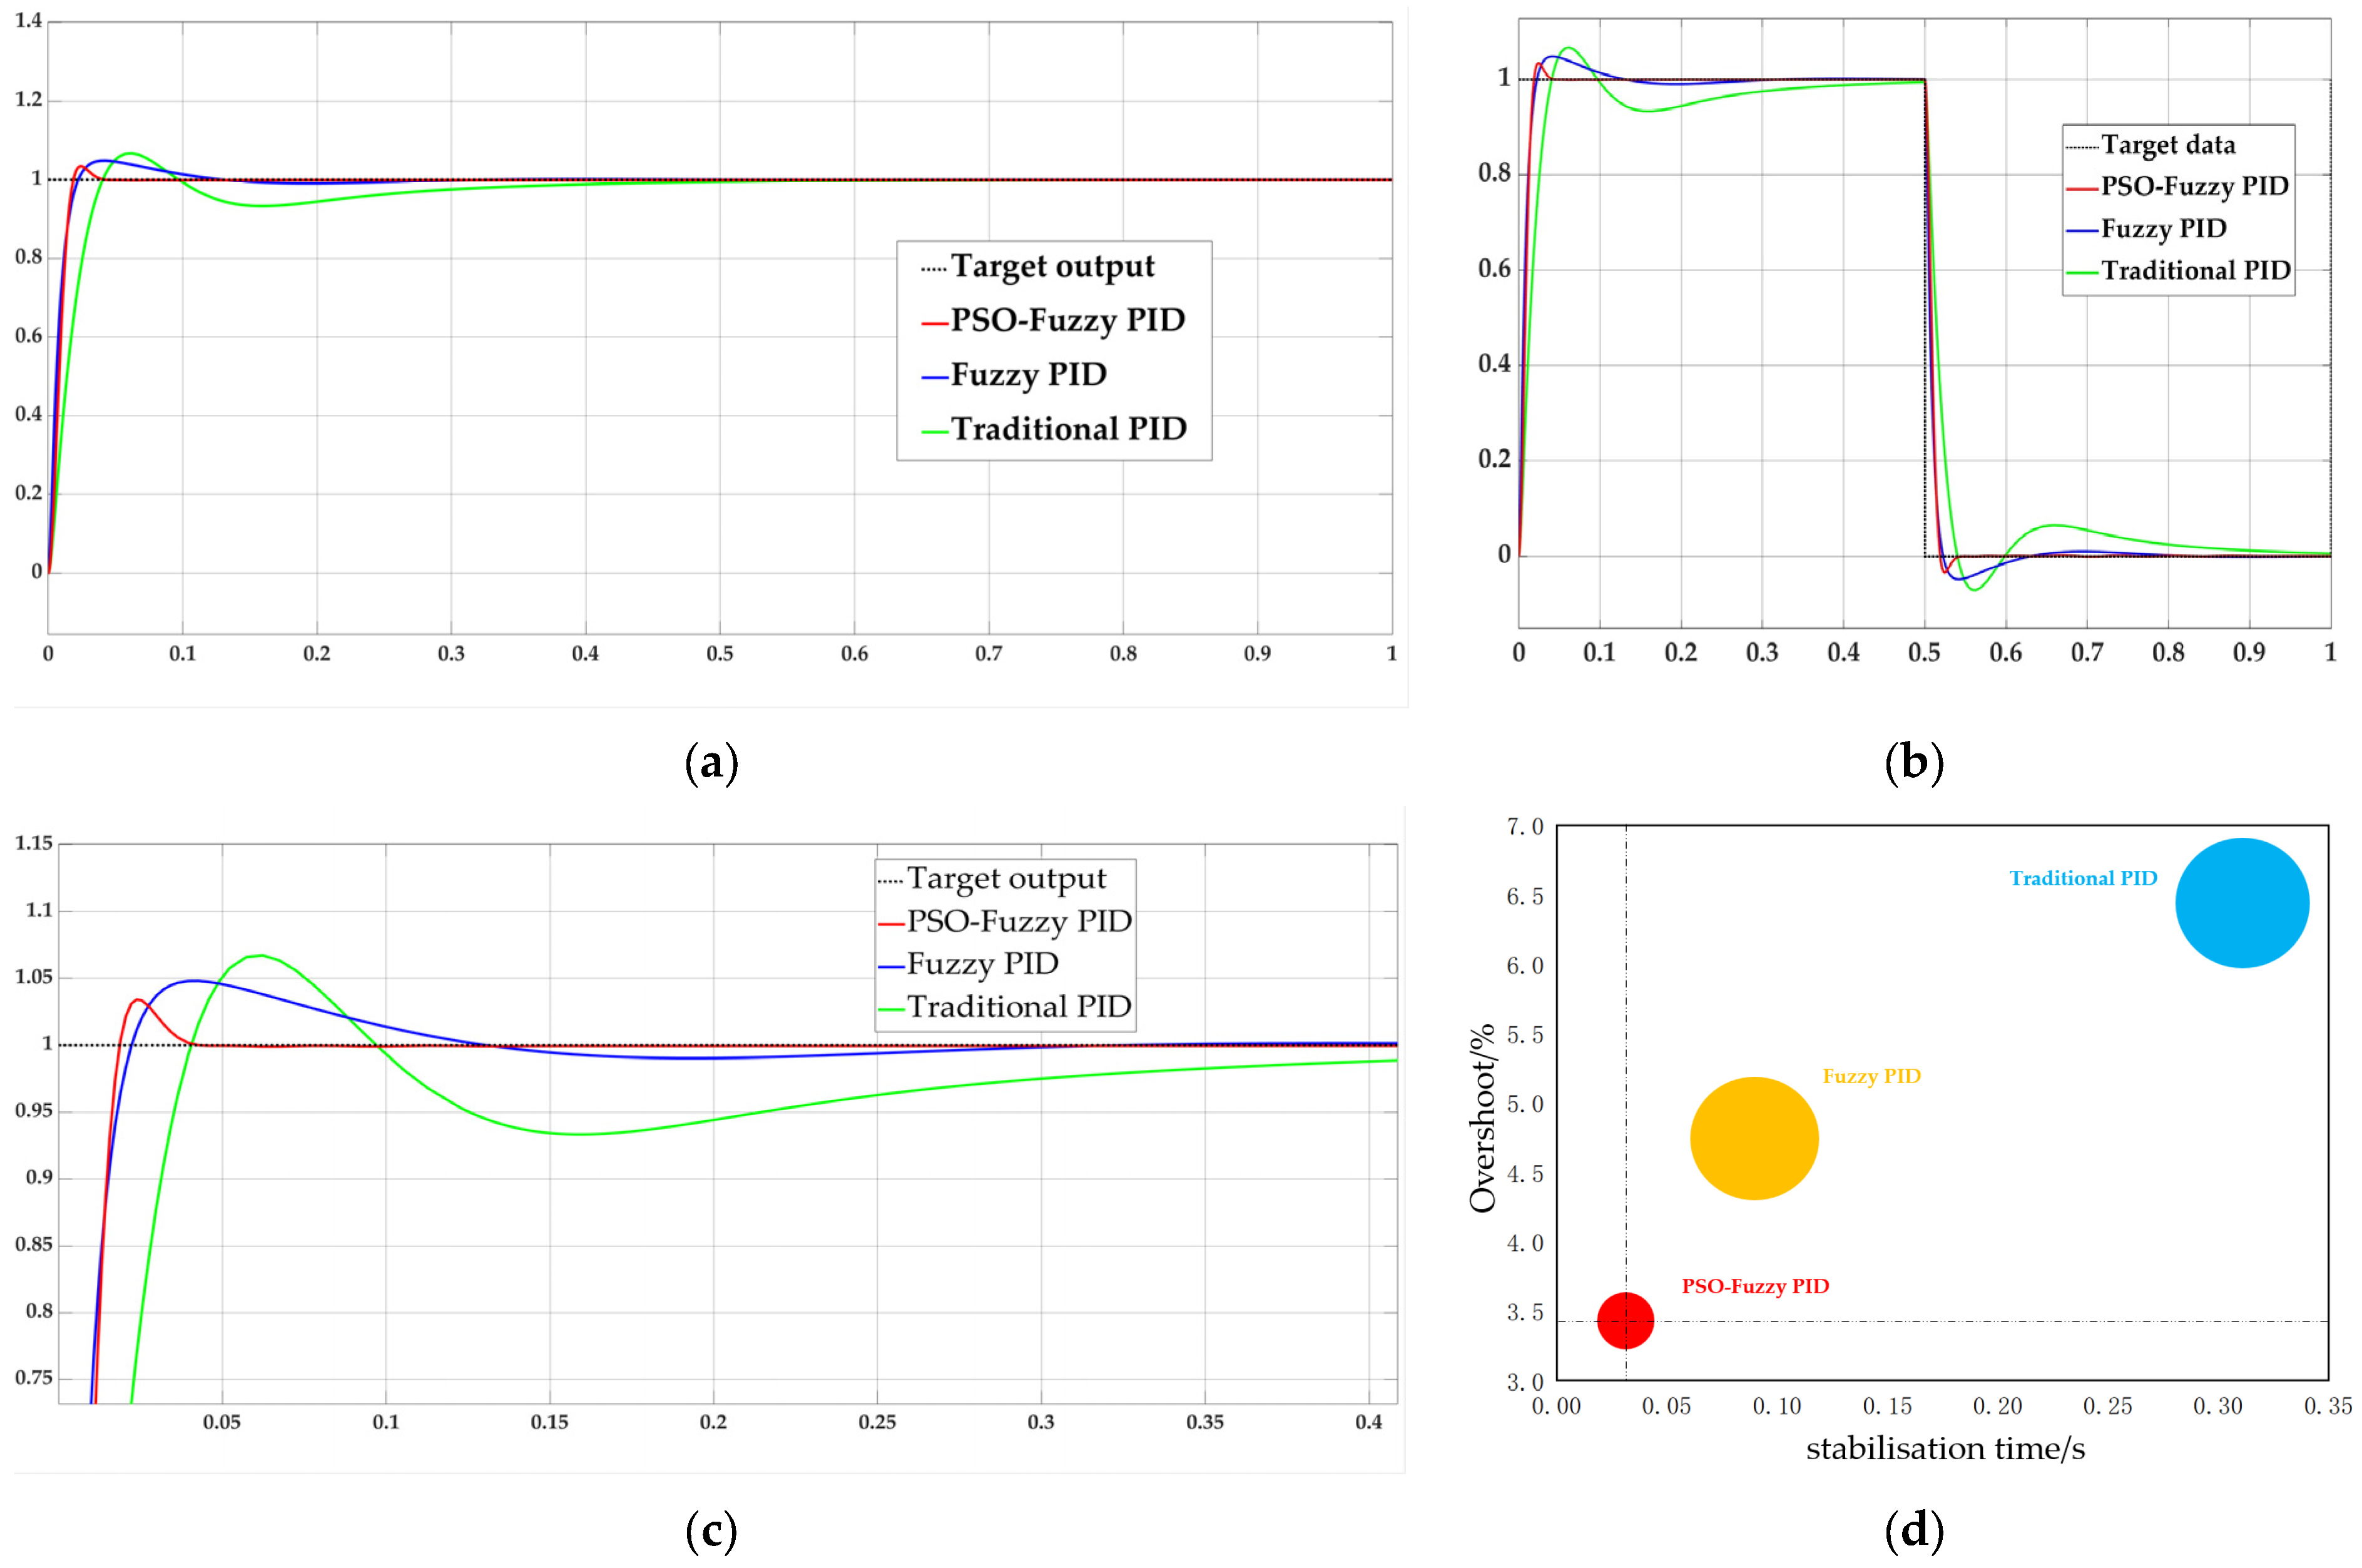
(a) Step response plots; (b) Square wave response plots; (c) Local response details; and (d) Response bubble plots.
Figure 21.
(a) Step response plots; (b) Square wave response plots; (c) Local response details; and (d) Response bubble plots.
Figure 24.
(a) Three-dimensional model; (b) Frame diagram; (c) Physical assembly; and (d) Test rigs for integration of the control system.
Figure 24.
(a) Three-dimensional model; (b) Frame diagram; (c) Physical assembly; and (d) Test rigs for integration of the control system.
Figure 25.
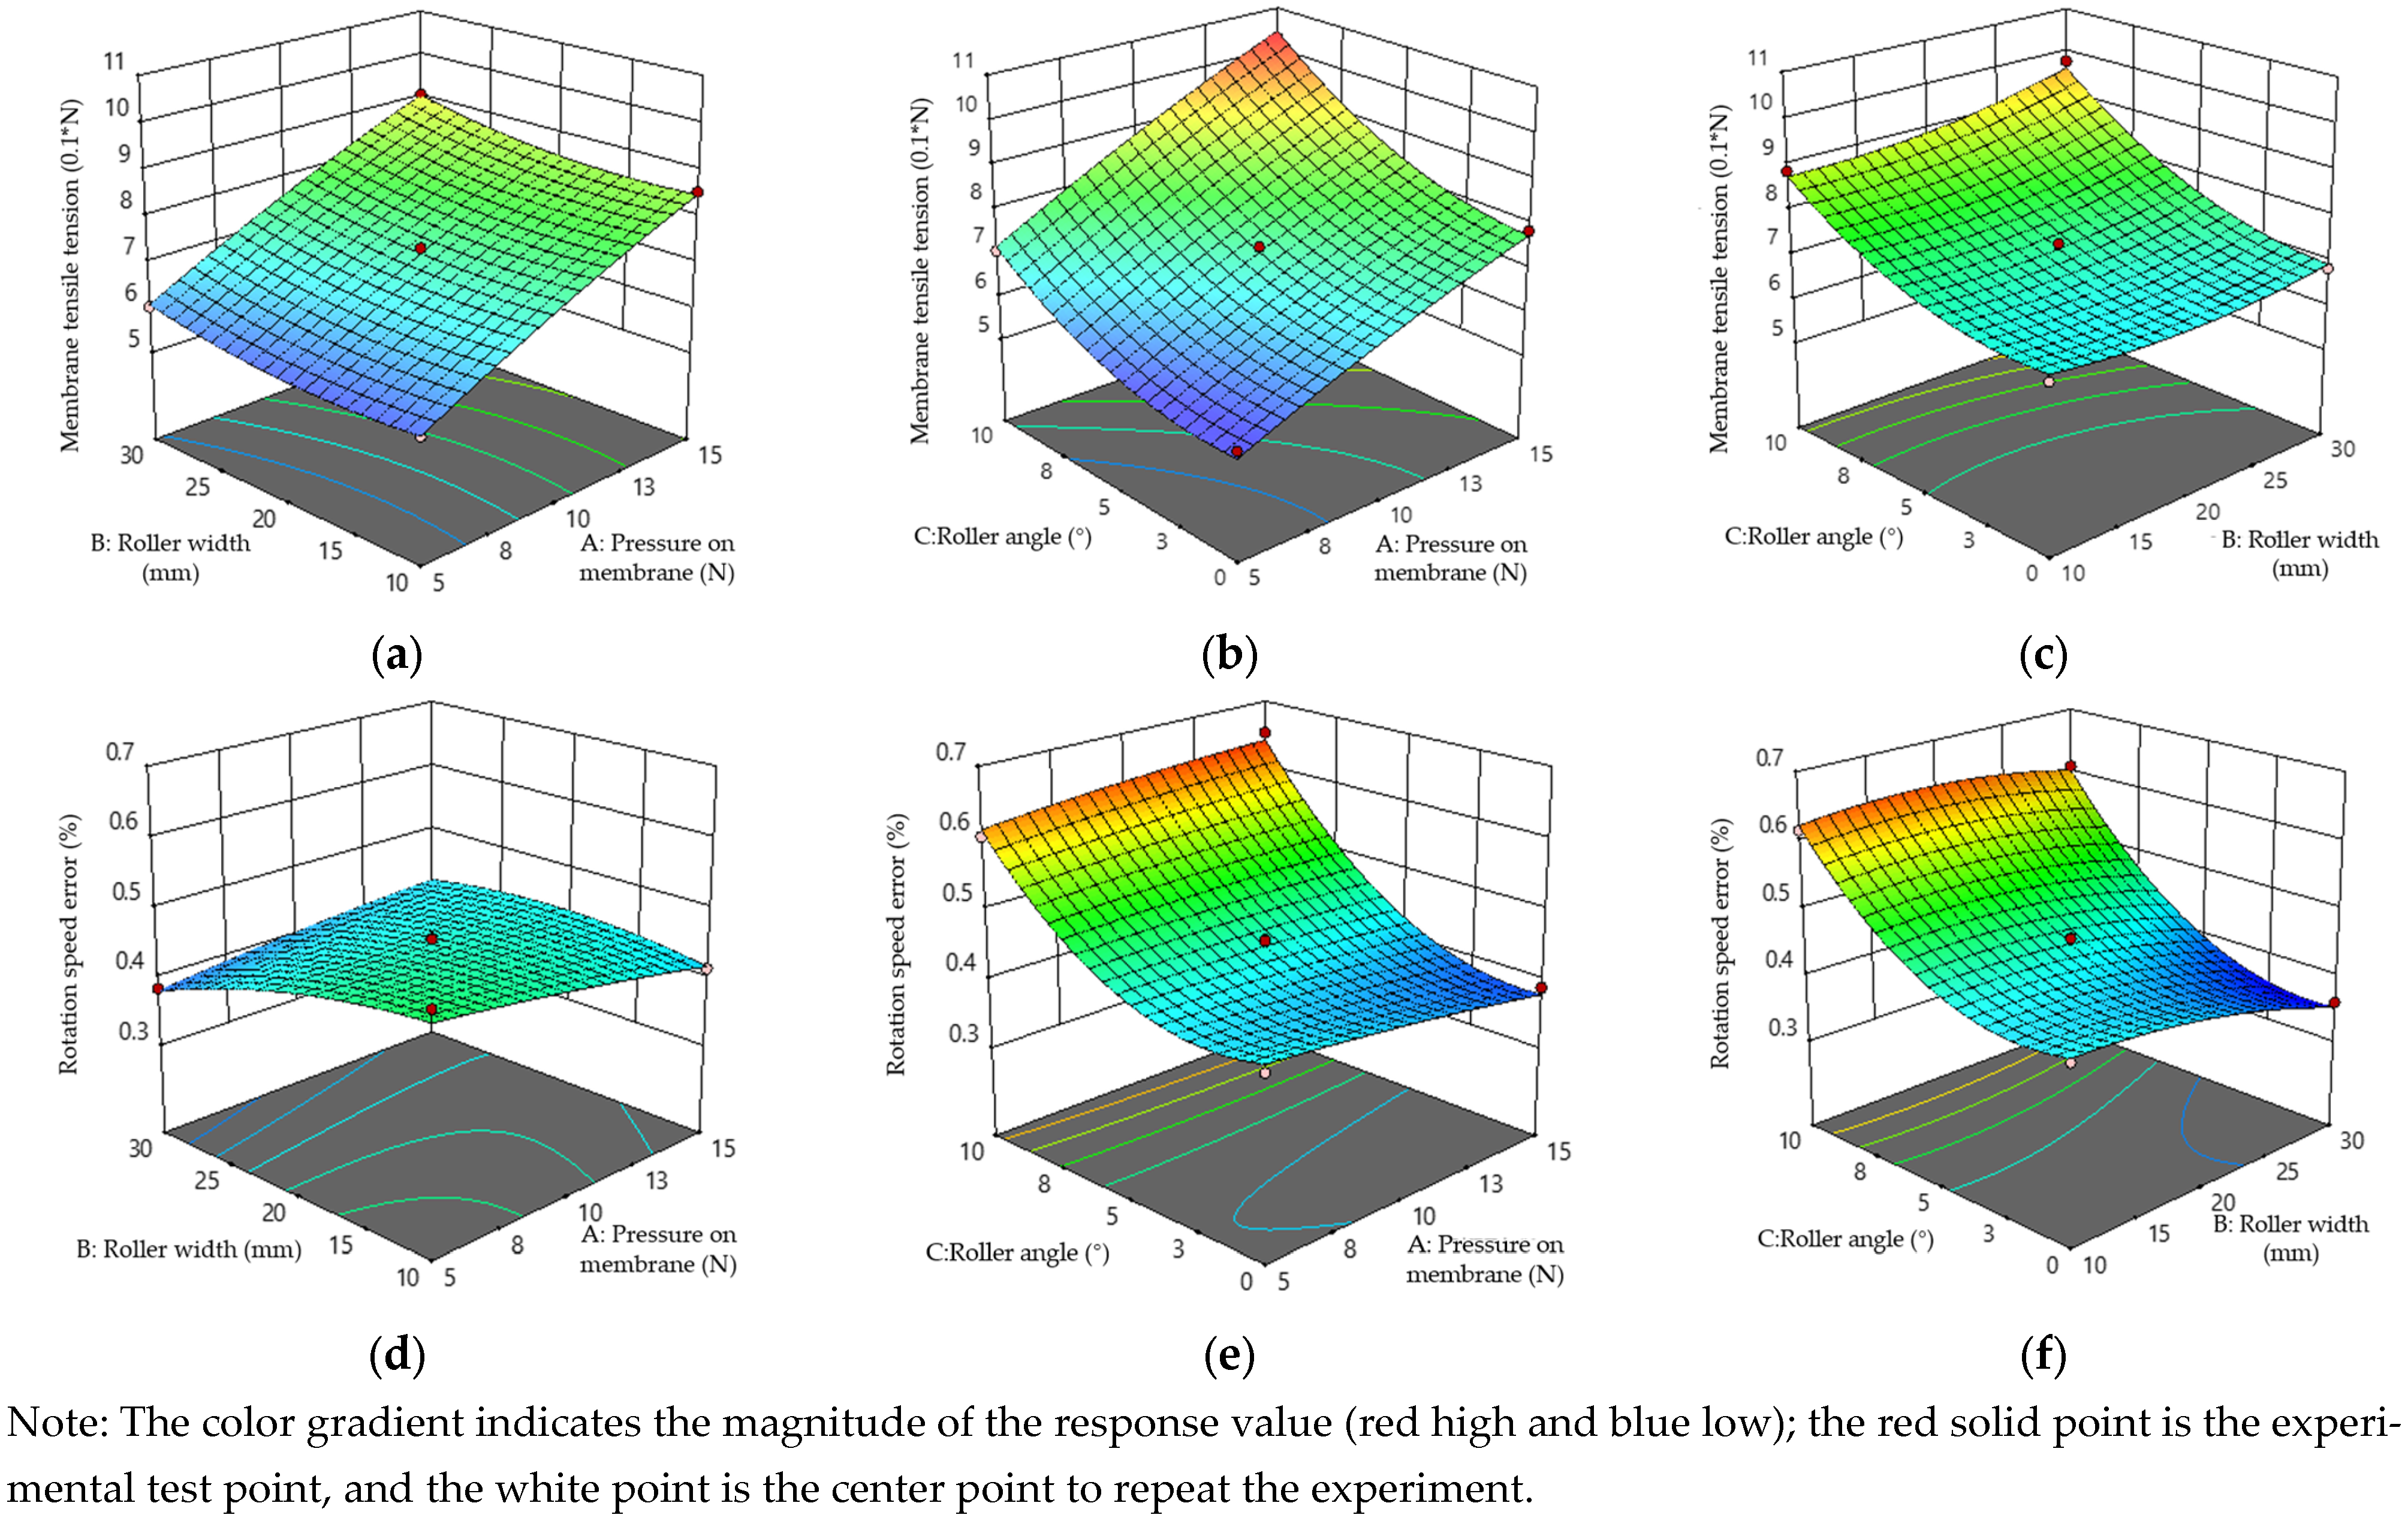
Response surfaces analysis. (a) Pressure on membrane vs. roller width vs. tensile tension; (b) Pressure on membrane vs. roller angle vs. tensile tension; (c) Roller Width vs. Roller Angle vs. Tensile Tension; (d) Pressure on Membrane vs. Roller Width vs. Rotation Error; (e) Pressure on Membrane vs. Roller Angle vs. Rotation Error; (f) Roller Width vs. Roller Angle vs. Rotation Error.
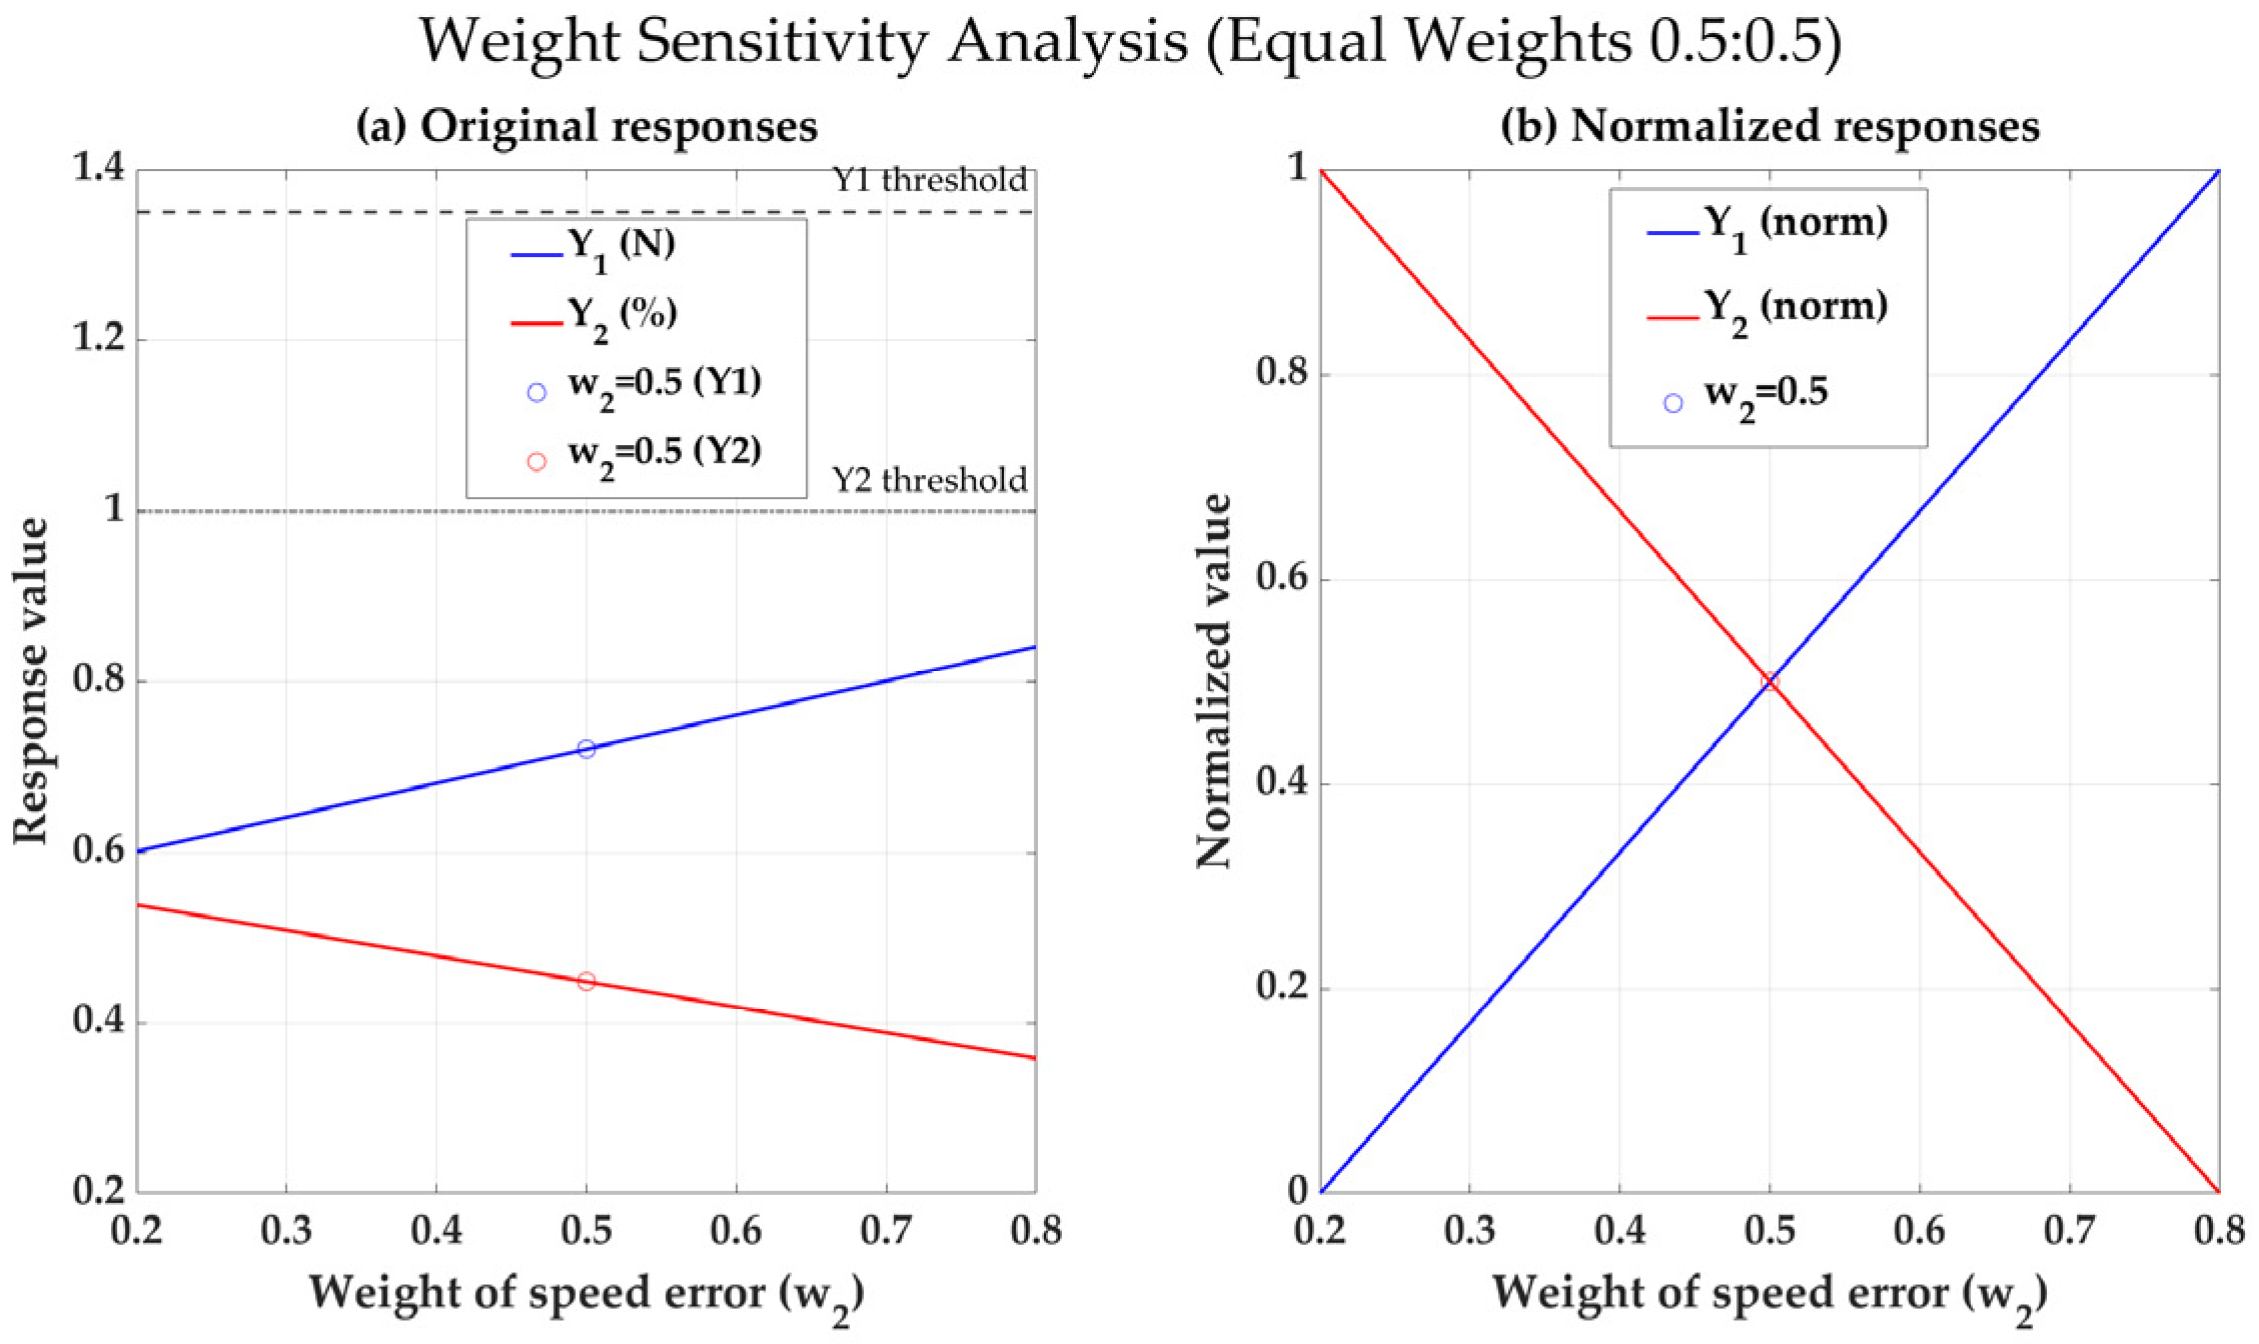
Figure 26.
Weight sensitivity analysis.
Figure 26.
Weight sensitivity analysis.
Figure 27.
Pareto frontier.
Figure 27.
Pareto frontier.
Figure 28.
(a) Biodegradable membrane; (b) Initial preparation of the test; (c) Synchronisation device control; and (d) Membrane output effect.
Figure 28.
(a) Biodegradable membrane; (b) Initial preparation of the test; (c) Synchronisation device control; and (d) Membrane output effect.
Figure 29.
(a) Laboratory simulation tests; (b) Test stand; (c) Commissioning of the control section; (d) Connection of the control module; and (e) Simulation test.
Figure 29.
(a) Laboratory simulation tests; (b) Test stand; (c) Commissioning of the control section; (d) Connection of the control module; and (e) Simulation test.
Figure 30.
(a) Speed matching test; and (b) RPM error value variation graph.
Figure 30.
(a) Speed matching test; and (b) RPM error value variation graph.
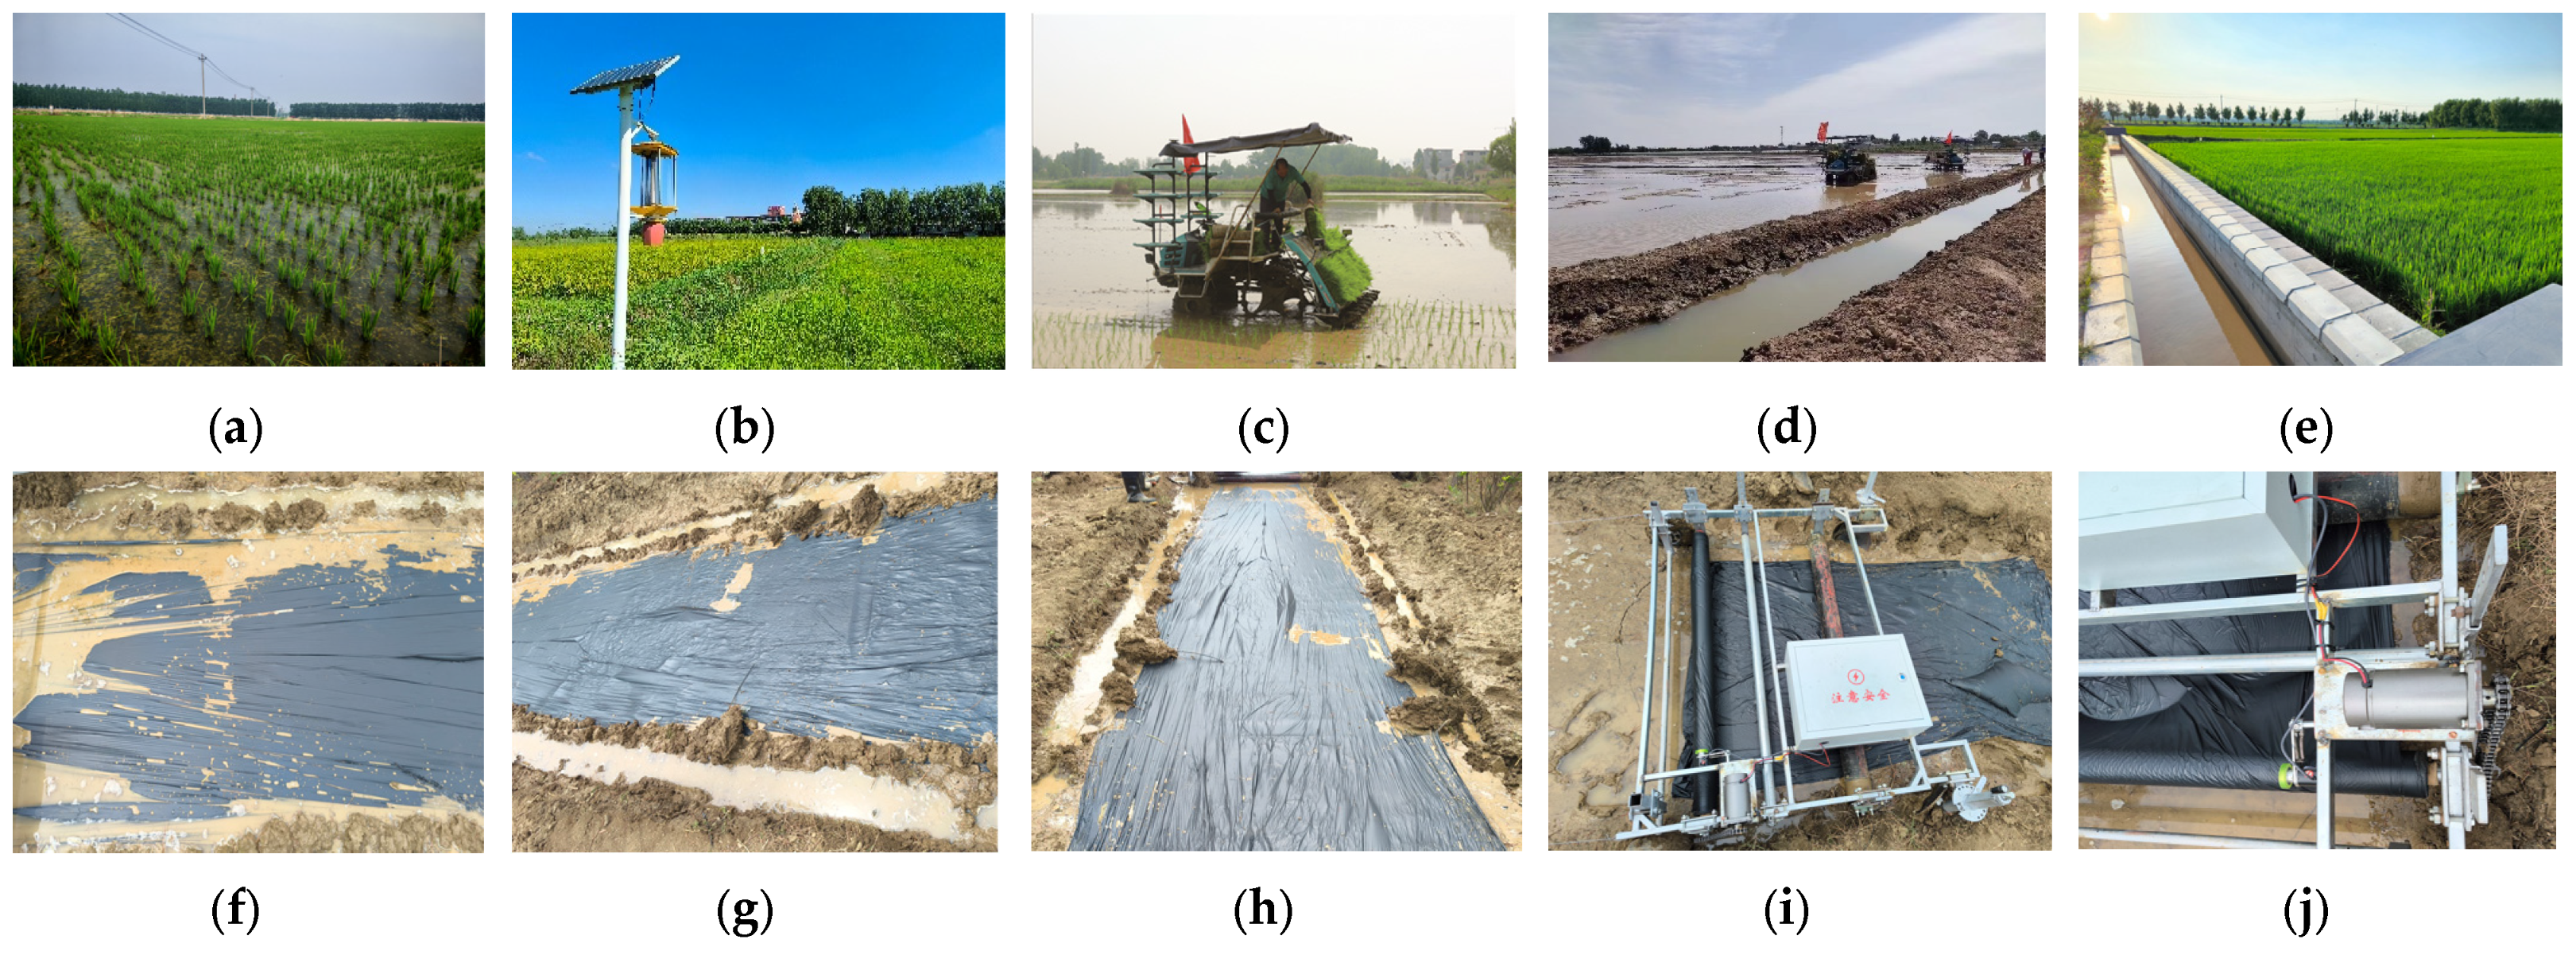
Figure 31.
Test environment and operational effects. (a) Rice field environment; (b) Test field; (c) Rice transplanter; (d) Rice transplanter operating environment; (e) Rice test field; (f) Field trial; (g) Mulching device Test; (h) Field test; (i) Mulching device; and (j) Control system.
Figure 31.
Test environment and operational effects. (a) Rice field environment; (b) Test field; (c) Rice transplanter; (d) Rice transplanter operating environment; (e) Rice test field; (f) Field trial; (g) Mulching device Test; (h) Field test; (i) Mulching device; and (j) Control system.
Figure 32.
Results of field trials. (a) Actual running time in two operating environments; (b) Completion time error in two operating environments; (c) Membrane width change in two operating environments; and (d) Membrane width change rate in two operating environments.
Figure 32.
Results of field trials. (a) Actual running time in two operating environments; (b) Completion time error in two operating environments; (c) Membrane width change in two operating environments; and (d) Membrane width change rate in two operating environments.
Table 1.
Main technical parameters.
Table 1.
Main technical parameters.
| Performance Parameters | Unit | Parametric |
|---|
| Engine power | kW | 14.6 |
| Engine speed | rpm | 3600 |
| Total displacement | L 1 | 0.653 |
| Wheelbase | mm | 1100 |
| Number of planting rows | line | 6 |
| Planting row spacing | cm | 30 |
| Planting depth | mm | 20–50 |
| Operating efficiency | ha/h | 0.4–0.7 |
Table 2.
Physical quantities in graphs and equations.
Table 2.
Physical quantities in graphs and equations.
| Name of the Physical Quantity | Notation | Unit |
|---|
| Load (resistive) torque | | N·m |
| Electromagnetic torque | | N·m |
| Membrane Output Line Speed | | m/s |
| Surface tension of the left membrane | | N |
| Surface tension of the right-hand membrane | | N |
| Membrane Output Line Speed | V | m/s |
| Real-time radius of the membrane roll | | m |
Table 3.
Physical quantities used in equations.
Table 3.
Physical quantities used in equations.
| Name of the Physical Quantity | Notation | Unit |
|---|
| Surface tension of the left membrane | | N |
| Surface tension of the right-hand membrane | | N |
| Surface tension of membrane | | N |
| Membrane Output Line Speed | V | m/s |
| Moment of inertia of the spreading shaft | | kg·m2 |
| Angular velocity of the spreading membrane axis | | rad/s |
| Angular acceleration of the spreading membrane axis | | rad/s2 |
| Outer wall radius of the membrane spreading shaft | | mm |
| Inner wall radius of the membrane spreading shaft | | mm |
| Membrane width | | mm |
| Linear acceleration | | m/s2 |
| Density of the spreading membrane axis | | kg·m3 |
Table 4.
Physical quantities used in the equations.
Table 4.
Physical quantities used in the equations.
| Name of the Physical Quantity | Notation | Unit |
|---|
| Equivalent rotational inertia of the membrane-laying shaft | | kg·m2 |
| Rotational inertia of the motor shaft | | kg·m2 |
| Rotational inertia of the membrane-laying shaft | | kg·m2 |
| Rotational inertia of the membrane roll | | kg·m2 |
| Angular velocity of the membrane-laying shaft | | rad/s |
| Membrane Output Line Speed | Vm | m/s |
| Electromagnetic torque | | N·m |
| Surface tension | | N |
| Real-time radius of the membrane roll | | m |
| Radius of membrane shaft | | m |
| Load (resistive) torque | | N·m |
| Density of the membrane material roll be | | kg·m |
| Membrane width | | m |
| Mass of the membrane | | kg |
Table 5.
Parameters of biodegradable membrane materials.
Table 5.
Parameters of biodegradable membrane materials.
| Type | Place of Origin | Degradation Time | Material | Width | Unit Price |
|---|
| Membrane 1 | Jinjiang, Fujian, China | 2 months | Bamboo fibre + PBAT + PLA | 1.5 m | 0.31 RMB/m |
| Membrane 2 | Shaoxing, Zhejiang, China | 3~6 months | PBAT | 1.5 m | 0.67 RMB/m |
| Membrane 3 | Hangzhou, Zhejiang, China | 3 months | PBAT + PLA | 1.5 m | 0.53 RMB/m |
Table 6.
Mechanical test results of biodegradable membranes.
Table 6.
Mechanical test results of biodegradable membranes.
| Type | Max Tensile Force in Elastic Phase/N | Tensile Strength/N·mm | Max Stress Elongation/% | Elongation at Break/% |
|---|
| Membrane 1 | 0.48 | 2.4 | 110 | 130 |
| Membrane 2 | 0.56 | 2.8 | 111 | 161 |
| Membrane 3 | 0.67 | 3.35 | 150 | 202 |
| Average value | 0.57 | 2.85 | 124 | 164 |
Table 7.
Speed error versus membrane tension and deformation test results.
Table 7.
Speed error versus membrane tension and deformation test results.
| Tolerance Range/% | Membrane 1
Deformation Rate/% | Membrane 2
Deformation Rate/% | Membrane 3
Deformation Rate/% | Membrane Surface Tension/N | Applicability
Evaluation |
|---|
| 0.0 ≤ Tol 1 < 0.5 | 99.2 | 99.5 | 99.8 | 0.21 | Excellent |
| 0.5 ≤ Tol < 1.0 | 98.3 | 98.6 | 98.9 | 1.35 | Excellent |
| 1.0 ≤ Tol < 5.0 | 96.1 | 96.4 | 97.2 | 4.92 | Good |
| 5.0 ≤ Tol < 10.0 | 91.7 | 93.2 | 94.3 | 10.25 | Good |
| 10.0 ≤ Tol < 20.0 | 86.2 | 88.1 | 90.1 | 18.94 | Average |
| 20.0 ≤ Tol < 30.0 | 76.6 | 79.5 | 83.7 | 26.43 | Poor |
| 30.0 ≤ Tol < 40.0 | 65.1 | 70.3 | 75.6 | 33.85 | Poor |
| 40.0 ≤ Tol < 50.0 | 0.0 | 59.1 | 64.4 | 37.62 | N/A |
| 50.0 ≤ Tol < 60.0 | 0.0 | 0.0 | 57.2 | 41.18 | N/A |
| 60.0 ≤ Tol < 70.0 | 0.0 | 0.0 | 49.8 | 45.63 | N/A |
| 70.0 ≤ Tol < 80.0 | 0.0 | 0.0 | 0.0 | 0.00 | N/A |
| 80.0 ≤ Tol < 90.0 | 0.0 | 0.0 | 0.0 | 0.00 | N/A |
| 90.0 ≤ Tol < 100.0 | 0.0 | 0.0 | 0.0 | 0.00 | N/A |
Table 8.
Fuzzy inference rules for ΔKp adjustment.
Table 8.
Fuzzy inference rules for ΔKp adjustment.
| |
|---|
| NB | NM | NS | ZO | PS | PM | PB |
|---|
| NB | PB | PB | PM | PM | PS | ZO | ZO |
| NM | PB | PB | PM | PS | PS | ZO | NS |
| NS | PM | PM | PM | PS | ZO | NS | NS |
| ZO | PM | PM | PS/ | ZO | NS | NM | NM |
| PS | PS | PS | ZO | NS | NS | NM | NM |
| PM | PS | ZO | NS | NM | NM | NM | NB |
| PB | ZO | ZO | NM | NM | NM | NB | NB |
Table 9.
Fuzzy inference rules for ΔKi adjustment.
Table 9.
Fuzzy inference rules for ΔKi adjustment.
| |
|---|
| NB | NM | NS | ZO | PS | PM | PB |
|---|
| NB | NB | NB | NM | NM | NS | ZO | ZO |
| NM | NB | NB | NM | NS | NS | ZO | ZO |
| NS | NB | NM | NS | NS | ZO | PS | PS |
| ZO | NM | NM | NS | ZO | PS | PM | PM |
| PS | NM | NS | ZO | PS | PS | PM | PB |
| PM | ZO | ZO | PS | PS | PM | PB | PB |
| PB | ZO | ZO | PS | PM | PM | PB | PB |
Table 10.
Fuzzy inference rules for ΔKd adjustment.
Table 10.
Fuzzy inference rules for ΔKd adjustment.
| |
|---|
| NB | NM | NS | ZO | PS | PM | PB |
|---|
| NB | PS | NS | NB | NB | NB | NM | PS |
| NM | PS | NS | NB | NM | NM | NS | ZO |
| NS | ZO | NS | NM | NM | NS | NS | ZO |
| ZO | ZO | NS | NS | NS | NS | NS | ZO |
| PS | ZO | ZO | ZO | ZO | ZO | ZO | ZO |
| PM | PB | NS | PS | PS | PS | PS | PB |
| PB | PB | PM | PM | PM | PS | PS | PB |
Table 11.
Hardware and software configurations in the experiment.
Table 11.
Hardware and software configurations in the experiment.
| Deployment | Parametric |
|---|
| CPU | Intel(R) Core (TM)i9-14900K |
| RAM | 128G |
| GPU | NVIDIA GeForce PTX 4090 |
| Running Frequency | 3.20 GHz |
| Operating System | Windows10 |
| Particle Swarm Size | 100 |
| Search Space Dimension | 3 |
| Inertia factor | 0.7 |
| Acceleration constant | c1 = 1.5; c2 = 2.5 |
| Particle velocity | vmax = 2; vmin = 2 |
| Maximum Iterations | km = 50~100 |
Table 12.
Coefficient-optimal solution.
Table 12.
Coefficient-optimal solution.
| Ratio | Starting Value | 50 Times | 80 Times | 100 Times |
|---|
| K | 10.4 | 9.5792 | 6.1331 | 5.3095 |
| Kp | 53.6 | 40.6760 | 3.9983 | 10.6981 |
| Ki | 2.5 | 0.8962 | 0.0635 | 0.0100 |
| Kd | 105.0 | 95.2616 | 56.1762 | 8.2892 |
Table 13.
Step response comparison results for the three algorithms.
Table 13.
Step response comparison results for the three algorithms.
| Indicator | Traditional PID Algorithm | Fuzzy PID Algorithm | PSO-Fuzzy PID Algorithm |
|---|
| Rise time tr/s | 0.032 | 0.015 | 0.015 |
| Stabilization time ts/s | 0.329 | 0.089 | 0.031 |
| Maximum overshoot | 1.067 | 1.048 | 1.034 |
| Overshoot amount δ/% | 6.7 | 4.8 | 3.4 |
Table 15.
Test factors and coding.
Table 15.
Test factors and coding.
| Encodings | Considerations |
|---|
| Roller Pressure on Membrane/N | Roller Width/mm | Roller Angle/° |
|---|
| −1 | 5 | 10 | 0 |
| 0 | 10 | 20 | 5 |
| 1 | 15 | 30 | 10 |
Table 16.
Test plan and test results.
Table 16.
Test plan and test results.
| Serial Number | Considerations | Membrane Tensile
Tension/0.1 × N | Rotation Speed Error/% |
|---|
| | |
|---|
| 1 | 0 | 0 | 0 | 7.12 | 0.456 |
| 2 | −1 | 1 | 0 | 6.02 | 0.384 |
| 3 | 0 | −1 | −1 | 6.67 | 0.426 |
| 4 | 1 | 0 | −1 | 7.85 | 0.388 |
| 5 | −1 | −1 | 0 | 5.67 | 0.502 |
| 6 | 1 | −1 | 0 | 8.54 | 0.413 |
| 7 | 0 | 1 | −1 | 6.83 | 0.359 |
| 8 | 1 | 0 | 1 | 10.29 | 0.652 |
| 9 | −1 | 0 | 1 | 7.06 | 0.603 |
| 10 | 1 | 1 | 0 | 9.05 | 0.402 |
| 11 | 0 | 0 | 0 | 7.16 | 0.448 |
| 12 | 0 | −1 | 1 | 8.86 | 0.615 |
| 13 | −1 | 0 | −1 | 5.43 | 0.423 |
| 14 | 0 | 0 | 0 | 7.32 | 0.443 |
| 15 | 0 | 0 | 0 | 7.13 | 0.438 |
| 16 | 0 | 0 | 0 | 7.32 | 0.457 |
| 17 | 0 | 1 | 1 | 9.76 | 0.609 |
Table 17.
Analysis of variance for membrane tensile tension regression.
Table 17.
Analysis of variance for membrane tensile tension regression.
| Source | | |
|---|
Sum of
Squares | Mean Square | F | p | Sum of
Squares | Mean Square | F | p |
|---|
| Model | 29.75 | 3.31 | 120.64 | <0.0001 | 0.1316 | 0.0146 | 65.32 | <0.0001 |
| 16.68 | 16.68 | 608.51 | <0.0001 | 0.0004 | 0.0004 | 1.81 | 0.22 |
| 0.4608 | 0.4608 | 16.82 | 0.0046 | 0.0051 | 0.0051 | 22.78 | 0.002 |
| 10.56 | 10.56 | 385.24 | <0.0001 | 0.0975 | 0.0975 | 435.25 | <0.0001 |
| 0.0064 | 0.0064 | 0.2335 | 0.6437 | 0.0029 | 0.0029 | 12.78 | 0.009 |
| 0.164 | 0.164 | 5.99 | 0.0443 | 0.0018 | 0.0018 | 7.88 | 0.0263 |
| 0.1369 | 0.1369 | 5 | 0.0605 | 0.0009 | 0.0009 | 4.15 | 0.0809 |
| 0.0725 | 0.0725 | 2.65 | 0.1478 | 0.0001 | 0.0001 | 0.3724 | 0.561 |
| 0.2451 | 0.2451 | 8.94 | 0.0202 | 0.0015 | 0.0015 | 6.58 | 0.0373 |
| 1.41 | 1.41 | 51.46 | 0.0002 | 0.0222 | 0.0222 | 98.97 | <0.0001 |
| Residual | 0.1918 | 0.0274 | | | 0.0016 | 0.0002 | | |
| Lack of Fit | 0.1506 | 0.0502 | 4.87 | 0.08 | 0.0013 | 0.0004 | 6.43 | 0.052 |
| Pure Error | 0.0412 | 0.0103 | | | 0.0003 | 0.0001 | | |
| Core Total | 29.95 | | | | 0.1332 | | | |
Table 18.
Analysis of Bench Test After Parameter Optimization.
Table 18.
Analysis of Bench Test After Parameter Optimization.
| Parametric | Unit | Average Value |
|---|
| operating speed | m/s | 0.5 | 1.0 | 1.5 | 2.0 |
| To membrane pressure | N | 5 | 5 | 5 | 5 |
| Roller width | mm | 28.5 | 28.5 | 28.5 | 28.5 |
| Roller angle | ° | 0.69 | 0.69 | 0.69 | 0.69 |
| Membrane Tensile Tension | N | 0.55 | 0.61 | 0.64 | 0.71 |
| RPM error | % | 0.36 | 0.38 | 0.41 | 0.44 |
| Rate of change of membrane width | % | 0.43 | 0.57 | 0.71 | 0.84 |
Table 19.
Simulation test results.
Table 19.
Simulation test results.
| Parametric | 0.5 m/s | 1 m/s | 2 m/s |
|---|
| Theoretical completion time/s | 960.00 | 960.00 | 960.00 | 480.00 | 480.00 | 480.00 | 240.00 | 240.00 | 240.00 |
| Actual completion time/s | 963.25 | 964.93 | 963.52 | 481.67 | 482.11 | 481.87 | 242.37 | 241.24 | 241.94 |
| Completion time error/per cent | 0.34 | 0.51 | 0.37 | 0.35 | 0.44 | 0.39 | 0.99 | 0.52 | 0.81 |
| Number of occurrences of rupture/times | 0 | 0 | 0 | 0 | 0 | 0 | 0 | 0 | 0 |
| Number of occurrences of stagnant membrane/times | 0 | 1 | 0 | 0 | 1 | 0 | 0 | 0 | 0 |
| Is the quality of the work satisfactory | qualified | qualified | qualified | qualified | qualified | qualified | qualified | qualified | qualified |
Table 20.
Hoist parameters.
Table 20.
Hoist parameters.
| Performance Parameters | Unit | Parametric |
|---|
| Rated voltage/V | V | 380 |
| Current frequency/HZ | HZ | 50 |
| Input power/kW | kW | 3 |
| Bare machine weight/kg | kg | 140 |
| Rope length | m | 15 |
| Rope Diameter | mm | 11 |
| Rated starting weight | T | 1 |
Table 21.
Results of Actual Field Experiment Verification.
Table 21.
Results of Actual Field Experiment Verification.
| Parametric | A | B | C |
|---|
| operating environment | standing water | slurry | standing water | slurry | standing water | slurry |
| Theoretical operating time/s | 960.00 | 960 | 960.00 | 960 | 960.00 | 960 |
| Actual operating time/s | 963.74 | 961.8 | 962.64 | 960.75 | 963.34 | 961.2 |
| Completion time error/percent | 0.39 | 0.19 | 0.27 | 0.08 | 0.33 | 0.13 |
| Theoretical membrane width/mm | 1500 | 1500 | 1500 | 1500 | 1500 | 1500 |
| Actual membrane width/mm | 1492 | 1489 | 1487 | 1484 | 1483 | 1480 |
| Membrane width change rate/% | 0.53 | 0.73 | 0.87 | 1.07 | 1.13 | 1.33 |
| Membrane breakage rate/% | 0 | 0 | 0 | 0 | 0 | 0 |
| Operational passes | Pass | Pass | Pass | Pass | Pass | Pass |
