Article

Effect of Light on the Yield and Nutrient Composition of Selected Mint Species Grown in a Controlled Environment

by
Krzysztof K. Jadwisieńczak
1,
Zdzisław Kaliniewicz
1,*,
Joanna Majkowska-Gadomska
2,
Emilia Mikulewicz
2,
Anna Francke
2,
Marek Marks
2 and
Dariusz J. Choszcz
1
1
Department of Vehicles and Machinery, University of Warmia and Mazury in Olsztyn, Oczapowskiego 11, 10-719 Olsztyn, Poland
2
Department of Agroecosystems and Horticulture, University of Warmia and Mazury in Olsztyn, Plac Łódzki 3, 10-719 Olsztyn, Poland
*
Author to whom correspondence should be addressed.
Agronomy 2025, 15(8), 1959; https://doi.org/10.3390/agronomy15081959 (registering DOI)
Submission received: 11 July 2025 / Revised: 11 August 2025 / Accepted: 13 August 2025 / Published: 14 August 2025
(This article belongs to the Special Issue New Insights in Crop Management to Respond to Climate Change)

Abstract

The experiment was conducted in a greenhouse and a growth chamber, in a randomized block design, with three replicates. The use of light-emitting diodes (LEDs) with varying wavelengths, combined with adequate nutrition, positively influence yield and the content of essential macronutrients and micronutrients in mint plants, which play a key role in the processes of growth and development. The average total yield of mint ranged from 23.1 g plant−1 to 48.1 g plant−1, while marketable yield ranged from 22.5 g plant−1 to 47.6 g plant−1. Exposure to violet LED light led to the highest increase in yield. The content of all analyzed macronutrients increased in plants of the evaluated mint species exposed to LED light. On average, the content of N, P, K in the aerial parts of mint plants increased significantly by around 25%, 56%, and 42%, respectively, under exposure to violet LED light, and by around 19%, 44%, and 37%, respectively, under exposure to yellow LED light. The values of K:Ca, K:Mg, and K:(Ca + Mg) ratios were higher in plants grown under LED light than in plants exposed to sodium light, whereas the opposite was noted for the Ca:P ratio. Exposure to violet or yellow LED light did not induce significant changes in Mn, Zn, Cu, and Fe uptake by mint plants. The micronutrient content of plants was largely determined by mint species. Mentha piperita plants had the highest Zn content, and Mentha suaveolens plants had the highest concentrations of Mn, Cu, and Fe.

1. Introduction

The genus Mentha comprises 19 species and 13 naturally occurring hybrids of flowering plants of the family Lamiaceae that are ubiquitous around the world [1]. Mint is a plant that has been cultivated for a long time for its health-promoting properties. Mint is one of the most valuable herbal plants with numerous applications. It stimulates digestion, and exerts spasmolytic, diuretic, choleretic, carminative, disinfecting, soothing, diaphoretic, anti-inflammatory, and analgesic effects. Mint leaves and herbage are used as raw materials in the production of mint preparations [2].
Light plays a regulatory role in plants, and recent review articles have summarized the most important knowledge about the modulatory effects of the light spectrum in the production of horticultural plants [3], selected leaf vegetables [4], and microgreens, as well as the applicability of light-emitting diode (LED) systems [5] and LED lighting for urban agriculture [6]. The biosynthesis of bioactive compounds and crop quality are influenced by LED light, both in the visible [7] and UV spectra [8,9]. Despite the fact that mint is one of the most important herbal sources of essential oils and minerals, little is known about the optimal supplemental lighting programs for its cultivation [10]. Light intensity and quality are equally important in plant cultivation. Appropriate light intensity provides sufficient energy for photosynthesis, whereas light quality (spectrum/color) affects various developmental processes, including growth, flowering, and fruit setting. Insufficient light intensity can stunt plant growth, and incorrect light spectra can lead to abnormal development manifesting as excessively long and weak stems or reduced resistance to environmental stressors and diseases [11,12]. To enhance the dietary value of mint herbage, the optimal light intensities and colors for different phenological stages of mint plants and various photoperiods have been proposed based on the results of experiments investigating various lighting technologies [13,14,15].
Manipulation of the LED light environment, including the determination of specific spectral modes through the integration of light quality (spectral composition) and quantity (intensity and photoperiod) and circadian cycle characteristics from microsecond to hour levels have the potential to enhance plant productivity and increase the concentrations of macronutrients and micronutrients in horticultural crops grown under controlled conditions. In the work of Soufi et al. [16], manipulation of LED light spectra and the use of nutrient solutions according to plant needs influenced various biological parameters of lettuce leaves and the transfer of essential macronutrients and micronutrients to plant organs, promoting plant growth and development. According to Pinho et al. [17], LED light spectra, particularly a combination of far-red, deep-red, and blue LEDs, more effectively promoted plant growth and nutrient uptake than high-pressure sodium (HPS) lighting. In addition, recent research into broad-spectrum LED lamps covering the entire light spectrum range (300–800 nm) that elicits a growth response in plants has suggested that considerable progress has been made in this regard because broad-spectrum lamps induce a greater increase in plant yields and the photosynthetic rate than dichroic lamps [15].
The present study was undertaken to examine the influence of LED lamps emitting yellow light with a wavelength range of 580–600 nm, LED lamps emitting violet light with a wavelength range of 400–450 nm, and sodium lamps emitting orange light with a wavelength of 589.3 nm on mint plants grown under controlled conditions. The third group consisted of control plants grown in the greenhouse under exposure to high-pressure sodium lamps with light intensity of 140 lm W−1. We hypothesized that LED light (violet and yellow) would enhance the macronutrient and micronutrient content and yield of mint, compared to sodium lamps.
The aim of this study was to evaluate the effect of light on the chemical composition of three mint species (Mentha piperita L., Mentha suaveolens L., Mentha spicata L.) grown under controlled greenhouse conditions and exposed to two types of LED light and sodium light.

2. Materials and Methods

The experiment was carried out in a greenhouse and a growth chamber at the Faculty of Agriculture and Forestry of the University of Warmia and Mazury in Olsztyn (20°29′ E, 53°45′ N; 125 m a.s.l.) between February and April of 2023 and 2024. The first experimental factor was yellow LED light (Philips GreenPower LED flowering lamp, Philips Poland, Warsaw, Poland) with a wavelength range of 580–600 nm and violet LED light (Fluence SPYDRx PLUS, Fluence EMEA, Eindhoven, Netherlands) with a wavelength range of 400–450 nm. High-pressure sodium lamps with light intensity of 140 lm W−1 were the source of control light. The second experimental factor represented three mint species: peppermint (Mentha piperita), apple mint (Mentha suaveolens), and spearmint (Mentha spicata).
Mint plants were propagated vegetatively through tip cuttings collected from mother plants grown in the greenhouse. The cuttings were rooted in mini paper pots with a diameter of 1 cm, with two cuttings per cell. The pots were placed in 126-cell propagation trays. During seedling production, humidity and temperature were maintained at 90% and 24 °C, respectively. After nine days, seedlings were transferred from propagation trays to 10 cm × 10 cm growing pots filled with peat substrate for organic herbs (pH of 5.5–6.5). Two paper pots were placed in each growing pot. Each of the three replicates per treatment had an area of 1 m2 and consisted of 64 0.7 dm3 pots. The edge plants were excluded from the analysis. The weight of each pot containing a mint plant was recorded. Then, the plant material was pooled, and an average sample was collected for chemical analysis.
Two types of LED lamps were used in the experiment: lamps emitting yellow light (Philips GreenPower LED flowering lamp) with a wavelength range of 580–600 nm and lamps emitting violet light (Fluence SPYDRx PLUS) with a wavelength range of 400–450 nm. Mint plants were divided into three groups of 100 pots each and placed in three boxes exposed to different types of light. The first group was exposed to yellow LED light, and the second group was exposed to violet LED light. Growing conditions were identical in both growth chambers. The third group consisted of control plants grown in the greenhouse under exposure to high-pressure sodium lamps with light intensity of 140 lm W−1. Both types of LED lamps were installed in a way that ensured equal photon density per unit area on growing benches. Light intensity measured at the beginning of the experiment at the level of the top leaves was 170 ± 20 µmol m−2 s−1. The plants were illuminated with LED light between 6 a.m. and 6 p.m.
The climate inside the growth chamber and the greenhouse was controlled by a computer to maintain stable temperature and humidity. Temperature varied slightly from 20 °C at night to 24 °C during the day, and relative humidity was kept at 60–70%. Organic plant protection products were not used due to the absence of natural pests, but yellow sticky traps (Biobest) were suspended to eliminate potential insects. Mint plants were monitored daily. Water mixed with a dedicated herb fertilizer was supplied directly to the pots. The fertilizer used in the experiment was PGMix 14-16-18 (Yara Poland, Szczecin, Poland), and it had the following composition (per 0.5 kg m−3): sulfur (19%), potassium (18%), phosphorus (16%), nitrogen (14%) (including 5.5% N-NO3 and 8.5% N-NH4), magnesium (0.80%), molybdenum (0.20%), manganese (0.16%), copper (0.12%), iron (0.09%), zinc (0.04%), and boron (0.03%). The fertilizer was applied twice in each treatment. The substrate in the pots was kept moist throughout the entire experiment.
Plant treatments were applied based on the growing requirements of mint species [18]. Weeds and moss buds were removed, and the organic substrate was aerated by spiking with a tine fork. Mint was harvested 35 days after taking root. The plants were cut 1 cm above the substrate, dried, and subjected to biochemical analyses. Only healthy and marketable plants were harvested for biochemical analyses. In each mint species, total and marketable yields were determined at the fully ripe stage and were expressed as fresh plant weight per pot.
The nutrient composition of aboveground plant parts was analyzed based on composite samples collected from each treatment. All replicates were biological. A total of 1728 plants were analyzed. Chemical analyses of the leaves were conducted using dried plant material harvested during the first cut, with three replicates per treatment. The concentrations of macronutrients and micronutrients were determined in both dry and wet mineralized samples, with three replicates of each. Plant material was dried at 65 °C in a Binder ED400 oven (Binder GmbH, Tuttlingen, Germany) and subsequently ground using a Grindomix GM300 knife mill (Retsch GmbH, Haan, Germany). For macronutrient analysis, samples were subjected to wet mineralization in H2SO4 with H2O2 as the oxidizing agent, using a SpeedDigester K-439 unit (Büchi Labortechnik AG, Flawil, Switzerland). Micronutrient content was determined following wet mineralization of leaf samples in a mixture of HNO3, HClO4, and HCl, performed in a CEM Mars 5 microwave digestion system (CEM Corporation, Matthews, NC, USA).
The mint herbal raw material was analyzed to determine the following: total nitrogen content by the Kjeldahl method, phosphorus content by colorimetry, concentrations of potassium and calcium by atomic emission spectrometry (AES), magnesium content by atomic absorption spectrometry (AAS), and concentrations of copper, zinc, boron, and manganese by AAS. The analyses were performed using equipment consistent with the research conducted by Majkowska-Gadomska et al. [19]. As only minor variations were observed between the years, the results are presented as mean values across both years of the study. Additionally, the following macronutrient ratios were calculated: Ca:P, Ca:Mg, K:Mg, K:(Ca + Mg), and K:Ca.

Statistical Analysis

The results were processed statistically in the Statistica PL v. 13.3 package (TIBCO, Paolo Alto, CA, USA). In the first stage of the analysis, descriptive statistics were used to determine the mean values and standard deviations of macronutrient and micronutrient concentrations, and macronutrient ratios in selected groups. Outliers were identified by Grubbs’ test and were eliminated from further calculations. The significance of differences between group means was determined by one way analysis of variance (ANOVA), the interactions between the experimental factors (light × species) were evaluated by two-way ANOVA, and homogeneous groups were identified using Tukey’s test, following the verification of normality by the Shapiro–Wilk test and homoscedasticity by Levene’s test. The correlations between macronutrient and micronutrient concentrations were evaluated by calculating Pearson’s correlation coefficients, and regression equations were determined for significant correlations with a coefficient of determination that reached a level of minimum 0.6—only significant regression equations were presented for a sample size of n = 18 (LED light) and n = 9 (control). All statistical analyses were conducted and conclusions were formulated at a significance level of α = 0.05.

3. Results and Discussion

Until recently, most artificial lighting systems relied on high-intensity discharge lamps (high-pressure sodium (HPS) lamps and metal-halide (MH) lamps) and fluorescent lamps which are characterized by relatively high fluence and low cost [3,9,20]. However, conventional lighting systems have certain drawbacks because they generate substantial amounts of heat, consume large amounts of energy, and produce broad-spectrum light (orange-red wavelengths, 550–650 nm, with a smaller proportion of blue wavelengths, 400–500 nm) without the option of spectral modulation. In recent years, energy-efficient light-emitting diodes (LEDs) have gained significant popularity, and their technical and spectral advantages over traditional light sources in plant production have been well documented [21]. Red and blue wavelengths are maximally absorbed by chlorophyll pigments [22], and most research studies on LED lamps have focused on different red:blue ratios to optimize the growth, morphology, and physiological responses of plants [10,23].

3.1. Mentha Yields

The differences in the yield of mint plants exposed to LED light and sodium light (control group) are presented in Table 1 and Table A1 and Figure 1. Mint yield was influenced by both mint species and light exposure during cultivation. The highest total yield and marketable yield were noted in M. spicata, followed by M. piperita and M. suaveolens. Exposure to violet LED light led to the highest increase in mint yield, whereas the yields of mint plants exposed to yellow LED light and sodium light (control group) were comparable. The average total yield of mint ranged from 23.1 g plant−1 (M. suaveolens, control group) to 48.1 g plant−1 (M. spicata, violet LED group), while marketable yield in these groups reached 22.5 g plant−1 and 47.6 g plant−1, respectively. Exposure to violet LED light induced an increase in yield ranging from around 16% (M. piperita) to around 24% (M. suaveolens) relative to the control group, and from around 12% (M. suaveolens) to around 28% (M. piperita) relative to mint plants exposed to yellow LED light. Violet light is used in photosynthesis, but its effect is complex. Chlorophyll, the primary pigment in photosynthesis, absorbs violet light more intensely than green light, but less intensely than red light. In the light-dependent phase of photosynthesis, chlorophyll absorbs light energy, which is used to split water molecules and generate ATP and NADPH. These compounds are required for the light-independent phase of photosynthesis where sugar synthesis occurs. The impact of violet light on photosynthetic efficiency is influenced by various factors, including plant species, its physiological status, light intensity, and duration of light exposure [24,25].
According to Mansoori [26] and Majkowska-Gadomska et al. [19], total fresh mint yield is an important indicator used by growers to estimate the economic profitability of mint cultivation. Similarly to the previous study by Majkowska-Gadomska et al. [19], the present experiment also revealed that yield is significantly influenced by genetic factors and growing conditions. Hydroponic cultivation, along with appropriate plant lighting, contributes to maximizing yields (plant growth potential) and increasing water and nutrient use efficiency due to advanced growing technologies, such as integrated plant protection, fertigation, drip irrigation, and climate control [16,19]. Both light intensity and quality are crucial for plant growth and development. Plants require light of specific intensity and spectrum for photosynthesis, the process that provides them with energy. Insufficient light negatively affects plant growth, causing issues such as faded leaves and the absence of flowering. In turn, optimal light intensity and quality enhance photosynthesis, photoreceptor signaling, and biomass allocation to shoots [27,28]. The development of controlled-environment agriculture technologies, including hydroponics, offers a viable alternative that enables growers to increase water use efficiency and productivity in an environmentally sustainable manner [29]. Both previous research [16,17] and this study indicate that the use of LEDs as an adjustable light source is a promising approach to improve plant growth, metabolism, and function. Plants are able to sense the surrounding environment by obtaining information through the perception of light signals in the visible region of the radiation spectrum (400–700 nm), which are most effective for photosynthesis, photoreceptors, and the dynamic absorption and utilization of various nutrients [30]. Nutrient uptake and utilization by horticultural plants are influenced by light parameters, including light quality, light intensity, and photoperiod, via a complex regulatory network [6,9,16]. A relationship also exists between light wavelength and nutrient uptake. In the present experiment, the use of LEDs, especially those emitting violet light, was beneficial to mint plants.

3.2. Macronutrient Concentrations

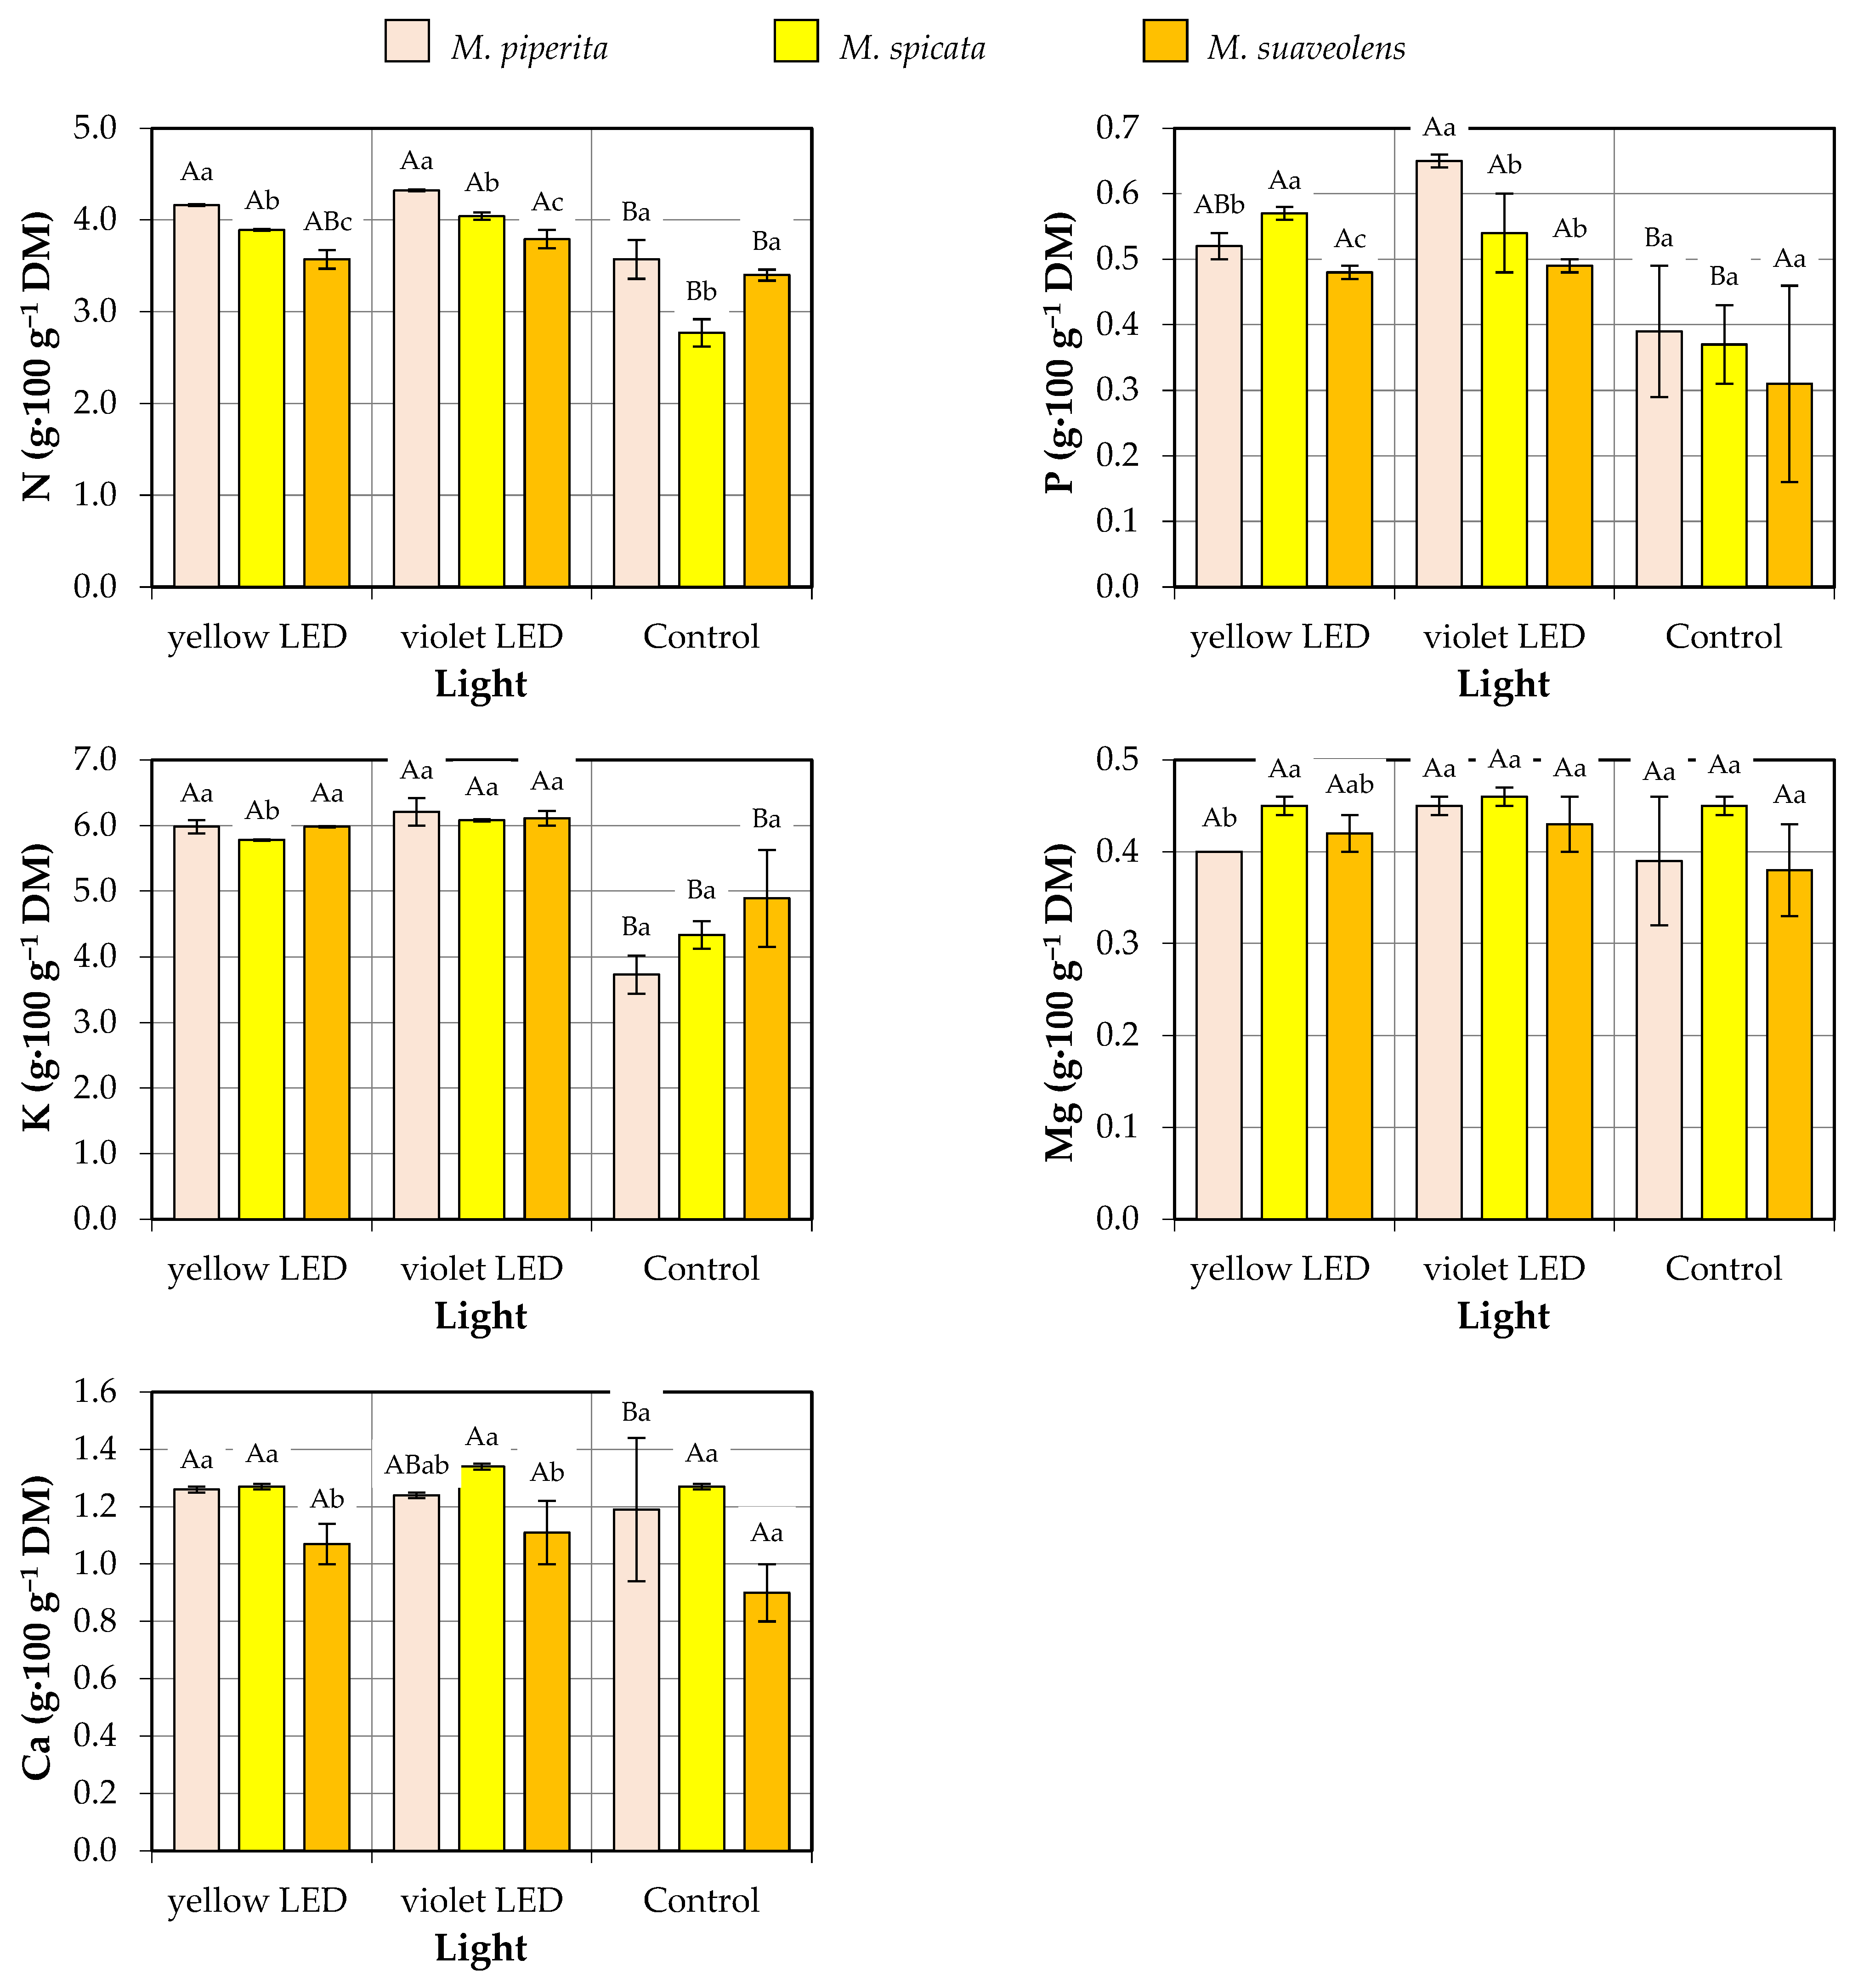
Macronutrients play an important role in the human body by regulating and maintaining the acid-base balance. Daily macronutrient requirements exceed 100 mg. The mineral content of plants affects the nutritional value of food and contributes to healthy plant growth and development [31,32,33]. Plants need 16 essential nutrients, including macronutrients such as nitrogen (N), potassium (K), phosphorus (P), magnesium (Mg), calcium (Ca), and sulfur (S). In addition to macronutrients, micronutrients such as iron (Fe), copper (Cu), zinc (Zn), manganese (Mn), boron (B), molybdenum (Mo), cobalt (Co), and nickel (Ni) are required in small quantities [34]. The differences in the content of basic macronutrients between control group plants and the experimental plants exposed to yellow or violet LED light are presented in Table 2 and Table A2 and Figure 2. The examined mint species had a similar content of N, P, and K, but differed in the concentrations of Mg and Ca. On average, in M. spicata plants, Mg content was 12% higher, and Ca content was 5% and 25% higher than in M. piperita and M. suaveolens, respectively. The content of all analyzed macronutrients increased in mint plants grown under exposure to LED light, and significant differences in N, P, and K levels were observed between the control group and the experimental groups. On average, the content of these macronutrients in aerial plant parts increased by around 25%, 56%, and 42% in plants exposed to violet LED light and by around 19%, 44%, and 37% in plants grown under yellow LED light. The LED-induced increase in N and K accumulation in plant differed across the studied mint species (significant interaction between mint species and type of light).
The average N content ranged from 2.77 g·100 g−1 DM (M. spicata, control group) to 4.32 g·100 g−1 DM (M. piperita, violet LED group), and the highest increase in this parameter (by approx. 46%) relative to the control group was observed in M. spicata plants exposed to violet LED light. In turn, the average content of P ranged from 0.31 g·100 g−1 DM (M. suaveolens, control group) to 0.65 g·100 g−1 DM (M. piperita, violet LED group). The greatest increase in P content (by approx. 67%) relative to the control group was noted in M. piperita grown under violet LED light. Similar observations were made in the average K content of mint plants, which ranged from 3.73 g·100 g−1 DM (M. piperita, control group) to around 6.21 g·100 g−1 DM (M. piperita, violet LED group). The average Mg content of mint plants ranged from 0.38 g·100 g−1 DM (M. suaveolens, control group) to 0.46 g·100 g−1 DM (M. spicata, violet LED group), and similarly to P and K concentrations, the greatest increase in Mg content (by approx. 15%) relative to the control group was noted in M. piperita plants subjected to violet LED light, but the observed difference was not significant. Significant differences in Mg content were found only in mint plants of different species exposed to yellow LED light. No significant differences in Ca concentrations were found between control and LED-treated plants within each mint species. The rate of Ca uptake was significantly higher in the groups of plants exposed to yellow or violet LED light, and the content of this macronutrient ranged from 0.90 g·100 g−1 DM (M. suaveolens, control group) to 1.34 g·100 g−1 DM (M. spicata, violet LED group).
The concentrations of macronutrients in plants of the analyzed mint species were similar to those reported by Sadowska et al. [34] for peppermint grown on soil amended with biochar and supplemental N fertilizer. The levels of macronutrients were influenced by the type of light, as in a study by Tabbert et al. [10] who found that different types of light altered the composition of essential oil. In turn, a study of two plant species, Ocimum basilicum L. and M. piperita L., revealed that basil responded better to LED light than peppermint in terms of both morphological traits and essential oil composition, similarly as in our own research described above. Nishioka et al. [35] found that in Japanese mint (Mentha arvensis L.) plants grown under three different light treatments (blue, green, and red light) provided by fluorescent lamps, the content of I-menthol (mg/plant), the main component of essential oil in plants, was 1.4 times higher in the red light treatment than in blue and green light treatments, whereas the concentration of I-menthol (mg g−1 leaf DW) did not differ significantly between the treatments. These results suggest that red light is beneficial for the production of Japanese mint plants with high essential oil content in controlled environments with artificial light. The results of numerous studies indicate that that there exists a close relationship between light absorption and nutrient uptake in plants [36,37]. Light wavelength and intensity as well as the duration of light exposure have a direct impact on nutrient uptake by plants, thus affecting nutrient use efficiency and overall productivity [37]. Soufi et al. [16] also reported that a combination of red and blue LED light increased Ca concentration in lettuce plants grown in different hydroponic systems, compared with white LED light (control treatment). The cited authors found that manipulation of LED light spectra and adequate nourishment based on the nutrient requirements of two lettuce varieties had a beneficial influence on the net photosynthesis rate, stomatal conductance, the transpiration rate, intercellular CO2 concentration in leaves, water use efficiency as well as the absorption and transfer of essential macronutrients and micronutrients that play a crucial role in the processes of plant growth and development. In the cited study, a combination of red and blue LED light had a more positive effect on macronutrients such as N, Ca, Mg, K, and P in lettuce, and similar observations were made in the present experiment involving three mint species. The increase in nutrient concentrations under exposure to various light spectra can be attributed to the fact that manipulation of the LED light spectrum, accompanied by nutrient solution optimization and stress prevention (the accumulation of nutrients in the solutions induces salinity stress), may enhance the efficiency of the photosynthetic apparatus, which is largely dependent on both macronutrients and micronutrients [30].

3.3. Macronutrient Ratios

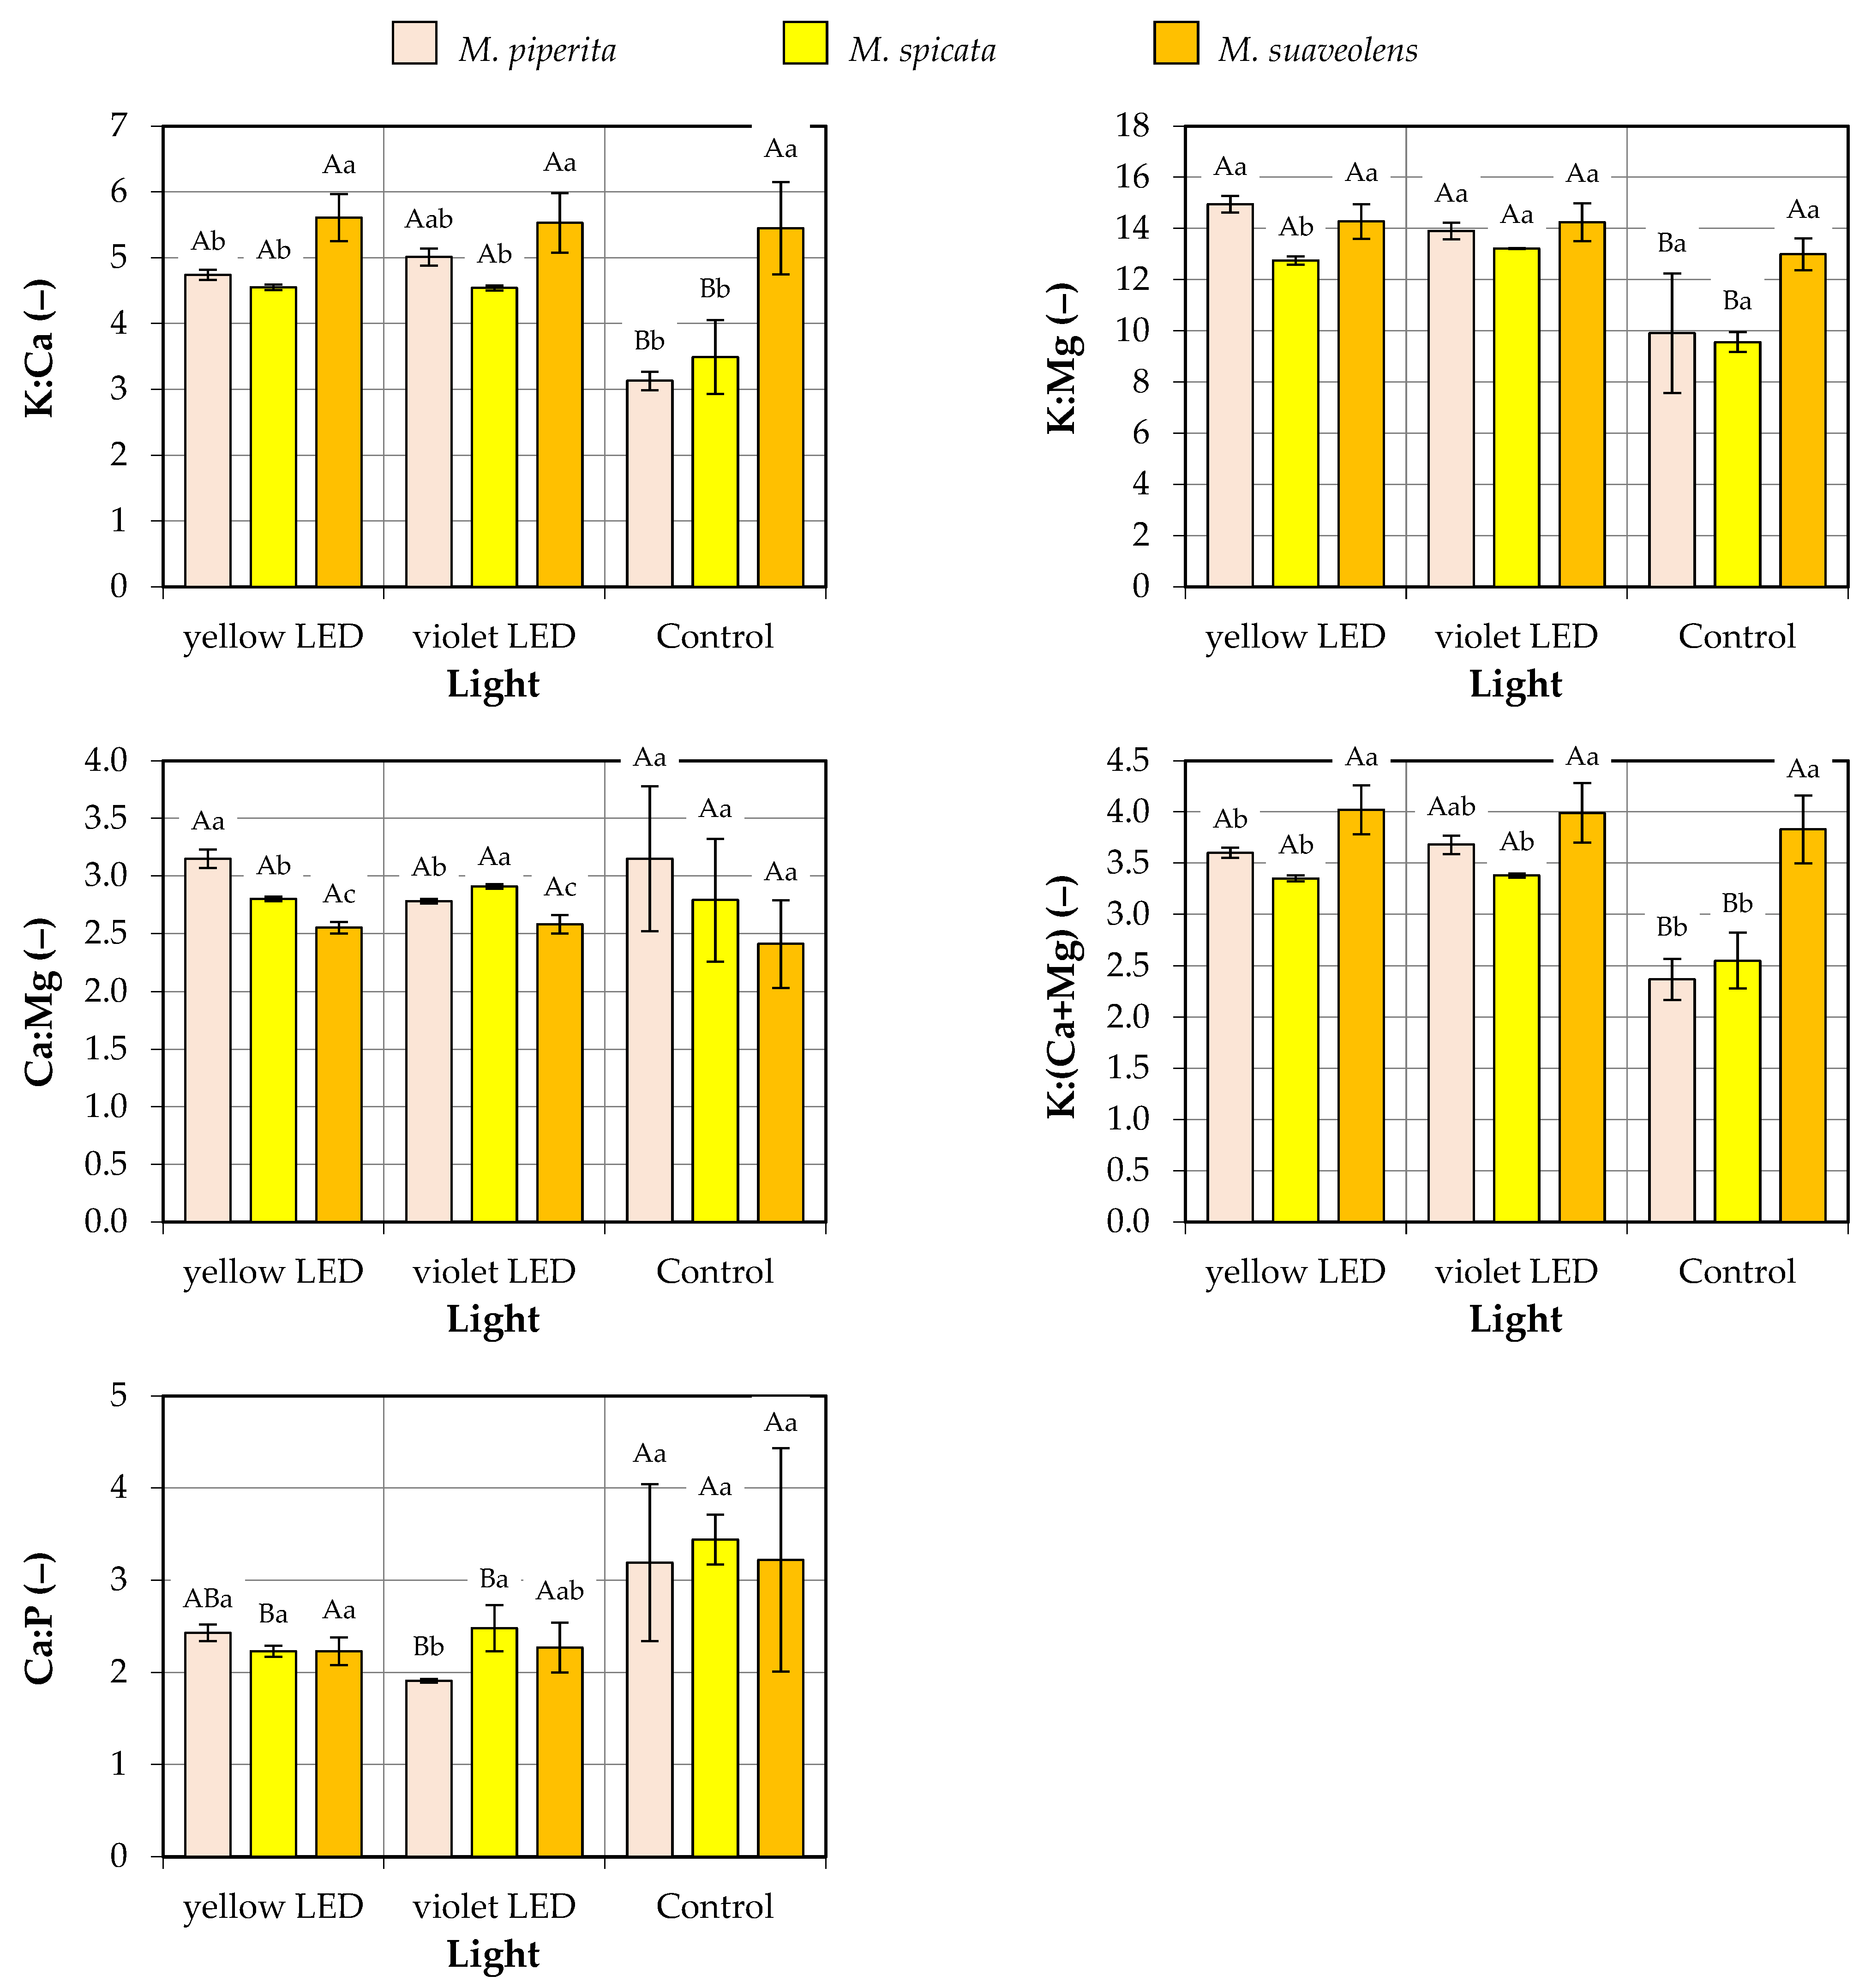
The nutritional quality of edible plant parts depends not only on the total mineral content, but also on the balance between individual minerals. The optimal macronutrient ratios in plant-based foods have been determined at: Ca:P—2:1, Ca:Mg—3:1, K: (Ca + Mg)—1.6–2.2:1, K:Mg—2–6:1, and K:Ca—2–4:1 [38]. These ratios can be significantly modified by various factors, including plant species, plant organ, maturity stage, harvest date, and fertilization. Ca:Mg and Ca:P ratios that exceed optimal values may signal potential deficiencies in magnesium and phosphorus intake. As noted by Rosanoff et al. [39], the dietary Ca:Mg ratio should remain below 2.8:1, since higher ratios (Ca:Mg > 2.8) have been associated with an increased risk of cardiovascular disease and diabetes. In the present study, the macronutrient ratios of peppermint plants were closest to the optimal values.
The differences in the macronutrient ratios of aerial plant parts between the control group and the experimental groups exposed to yellow or violet LED light are presented in Table 3 and Table A3 and Figure 3. Mentha suaveolens plants were characterized by the highest average values of K:Ca, K:Mg, and K:(Ca + Mg) ratios, M. piperita plants—by the highest average value of the Ca:Mg ratio, and M. spicata plants—by the highest average value of the Ca:P ratio. However, significant differences were found only in the values of K:Ca, Ca:Mg, and K:(Ca + Mg) ratios. The values of the Ca:Mg ratio were highly similar, whereas significant differences in the remaining macronutrient ratios were noted between control plants (not exposed to LED light) and experimental plants grown under yellow or violet LED light. Significant differences were observed mainly between groups of plants exposed to a given color of LED light and the control group. The analyzed mint species responded differently to yellow and violet LED light (significant ordinal interaction between mint species and type of light).
Exposure to LED light did not induce significant differences in any of the macronutrient ratios in M. suaveolens plants, and in the Ca:Mg ratio in M. piperita and M. spicata plants. The values of K:Ca, K:Mg, and K:(Ca + Mg) ratios were higher in groups of plants treated with yellow or violet LED light than in the control group not exposed to LED light, whereas Ca:P values were higher in the control group than in the experimental plants. The average macronutrient ratios were determined in the following range of values:
  • K:Ca—from 3.13 (M. piperita, control group) to 5.61 (M. suaveolens, yellow LED group);
  • K:Mg—from 9.56 (M. spicata, control group) to 14.95 (M. piperita, yellow LED group);
  • Ca:Mg—from 2.41 (M. suaveolens, control group) to 3.15 (M. piperita, yellow LED group and control group);
  • K:(Ca + Mg)—from 2.37 (M. piperita, control group) to 4.02 (M. suaveolens, yellow LED group);
  • Ca:P—from 1.91 (M. piperita, violet LED group) to 3.44 (M. spicata, control group).

3.4. Micronutrient Content

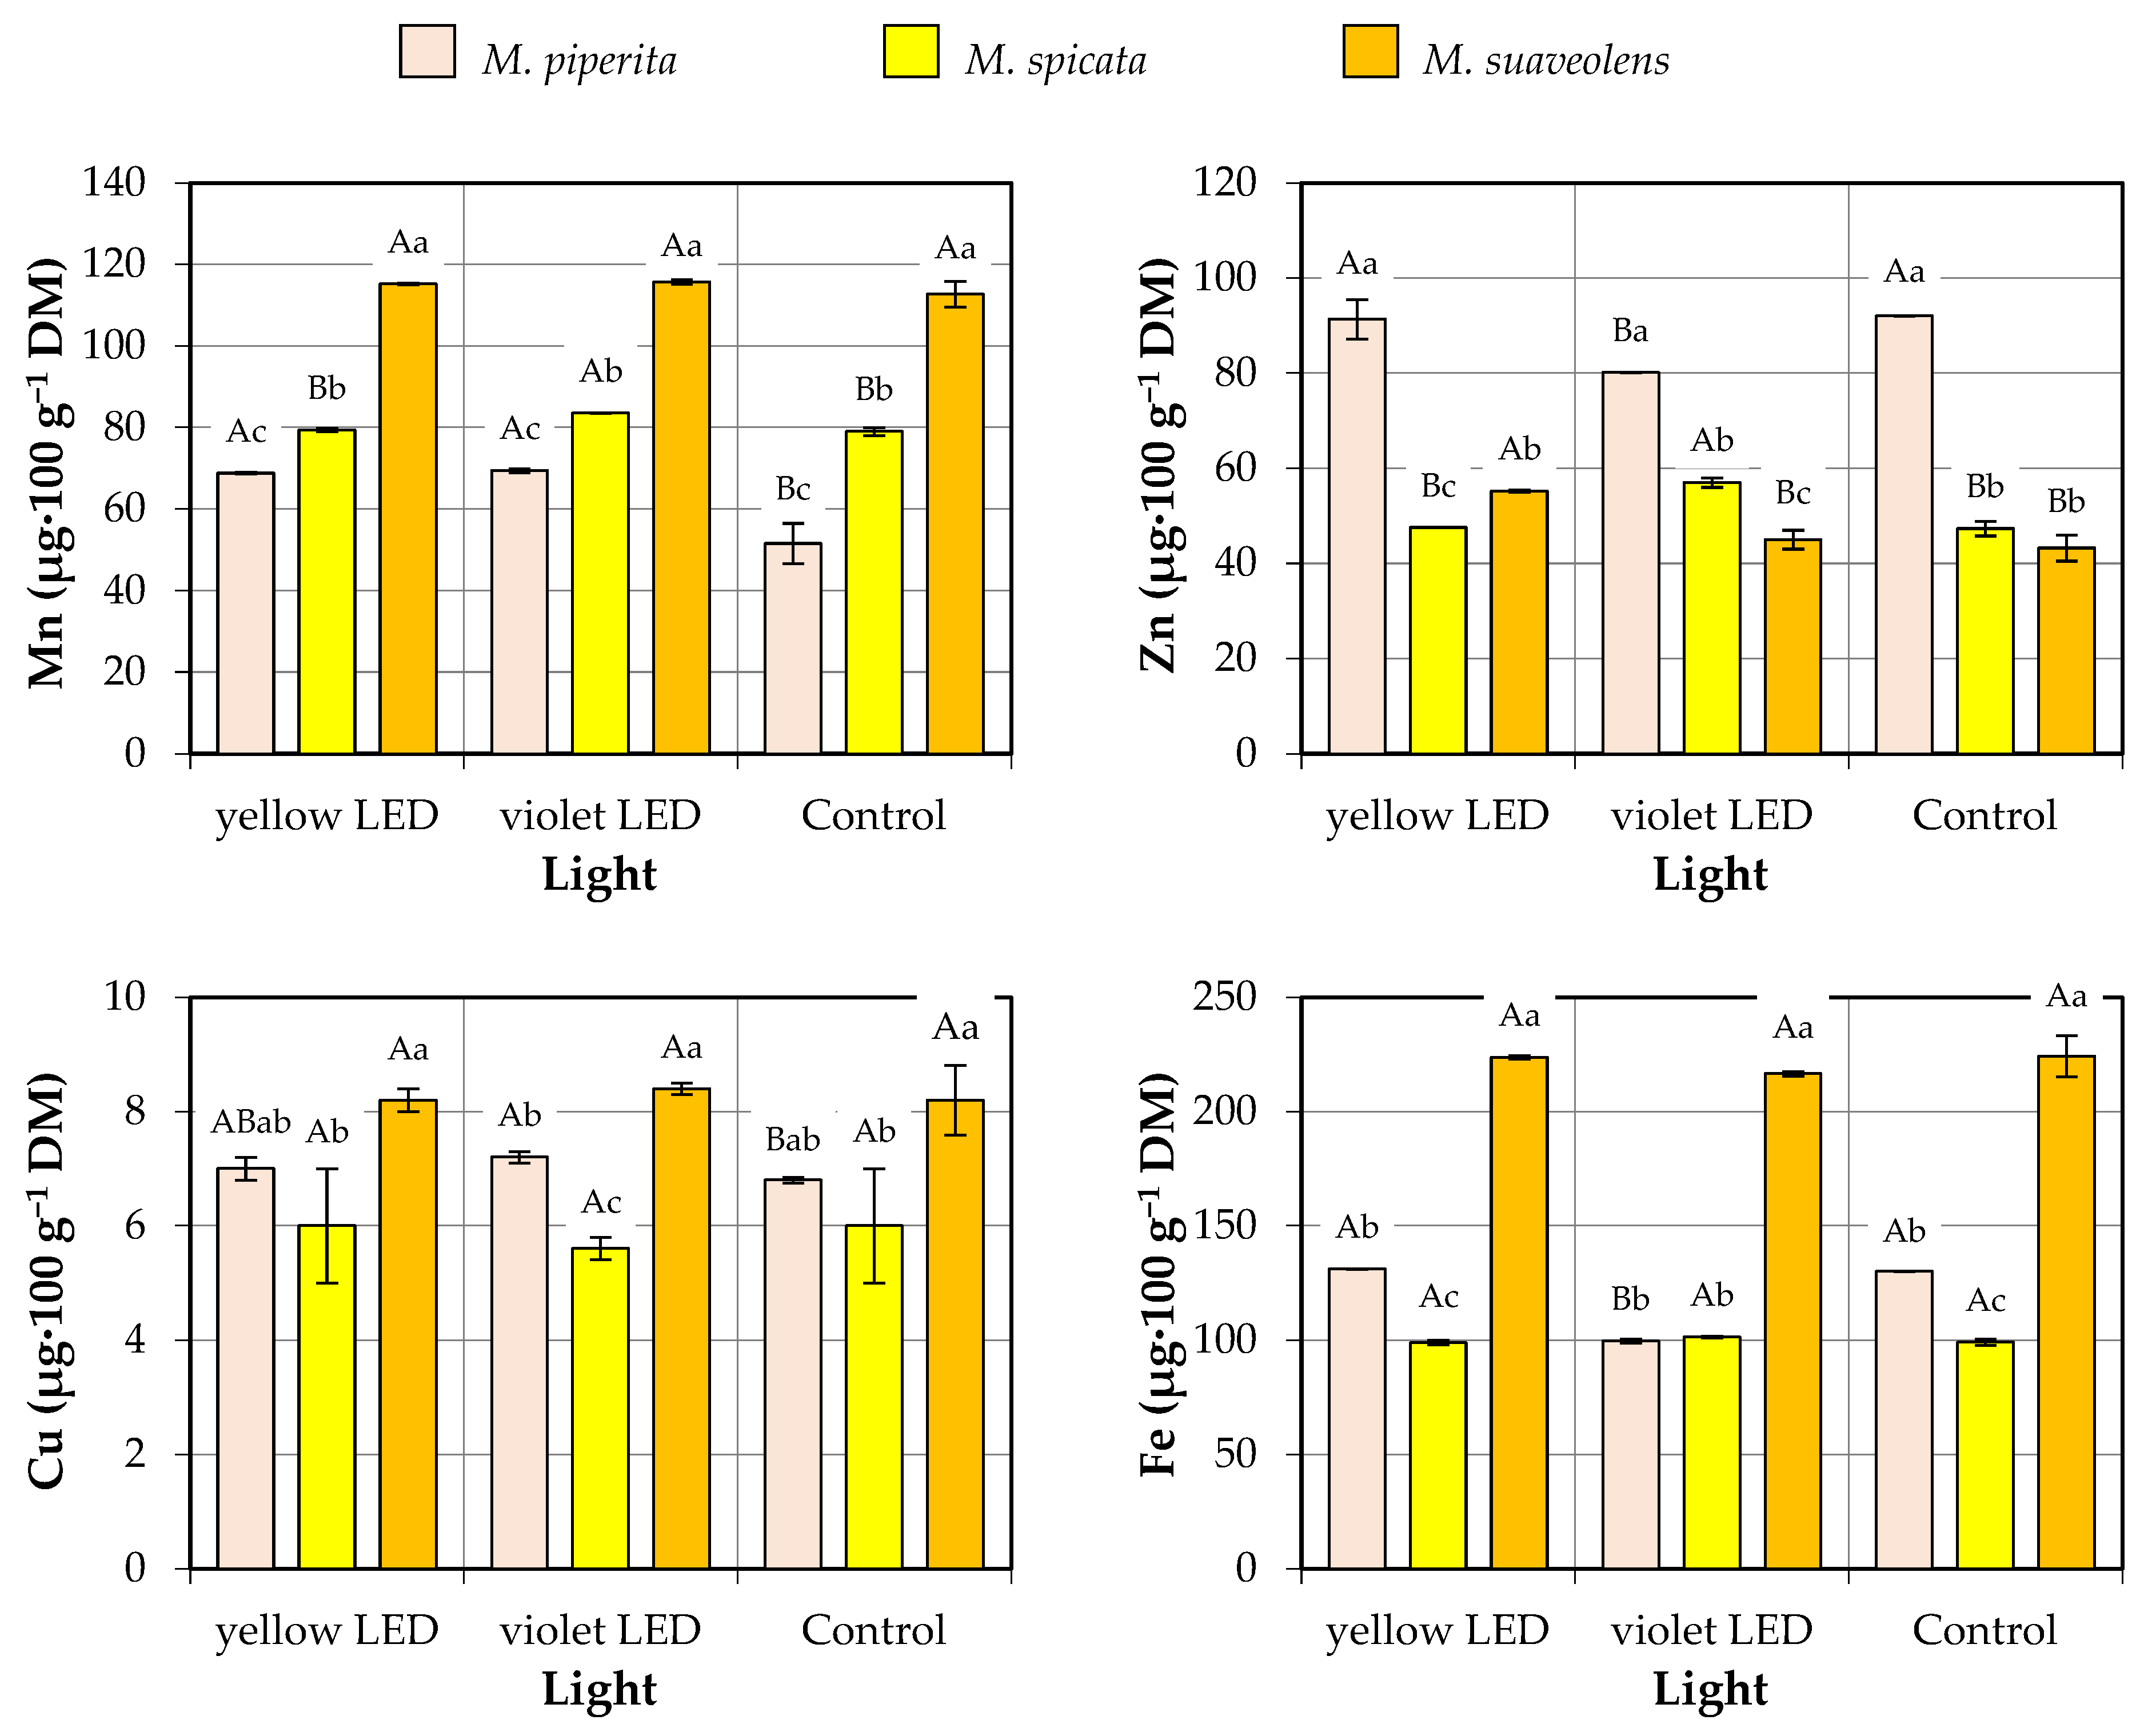
The differences in the content of selected micronutrients between plants of the examined mint species in the control group and the experimental groups exposed to yellow or violet LED light are presented in Table 4 and Table A4 and Figure 4. Yellow or violet LED treatments did not induce significant differences in micronutrient uptake. In the work of Pinho et al. [17], iron and zinc uptake by lettuce plants was significantly affected by spectral changes in red and blue light. Micronutrient concentrations were associated mainly with mint species, which corroborates the findings of Kızıl et al. [40]. However, the content of Mn, Zn, and Fe was influenced by the interaction between mint species and type of light. M. suaveolens plants were characterized by the highest average content of Mn, Cu, and Fe, whereas M. piperita plants had the highest Zn content. Manganese levels were lowest in M. piperita; the concentration of Zn was lowest in M. suaveolens, whereas the content of Cu and Fu was lowest in M. spicata. In the examined mint species, the differences between the highest and lowest average concentrations of Mn, Zn, Cu, and Fe were estimated at 84%, 84%, 41%, and 122%, respectively. These variations can be attributed to the genetic characteristics of the analyzed mint species, as well as the impact of light spectrum on various developmental processes, including growth, flowering, and fruit setting.
The average content of the analyzed micronutrients was determined in the following range of values:
  • Mn—from 51.5 µg·100 g−1 DM (M. piperita, control group) to 115.6 µg·100 g−1 DM (M. suaveolens, violet LED group);
  • Zn—from 43.2 µg·100 g−1 DM (M. suaveolens, control group) to 92.0 µg·100 g−1 DM (M. piperita, control group);
  • Cu—from 5.6 µg·100 g−1 DM (M. spicata, violet LED group) to 8.4 µg·100 g−1 DM (M. suaveolens, violet LED group);
  • Fe—from 99.0 µg·100 g−1 DM (M. spicata, yellow LED group) to 224.2 µg·100 g−1 DM (M. suaveolens, control group).
According to many studies, it can be stated that genetics plays an important role in the absorption of nutrients by plants and, consequently, their accumulation in edible parts [14,17]. Similar values to those determined in this experiment were noted in a study by Kızıl et al. [40], where peppermint was more abundant in micronutrients than other mint species. However, exposure to LED light induces modifications in plant development. These changes occur under the influence of light as a stimulus, as well as after the plant photoreceptors receive information. They trigger a signal cascade leading to changes in plant development related to gene transcription and to changes in chemical composition.
Mint tea is one of the most popular herbal teas. Dry peppermint leaves are traditionally used to make herbal teas and formulate oral liquid and solid herbal preparations. From the therapeutic point-of-view, mint is regarded as a source of micronutrients, macronutrients, and vitamins [41].
Several metals are essential for plants (B), animals (Co, Se), and both plants and animals (Cu, Fe, Mn, Mo, Ni, Zn), and required for the normal biological functions of living organisms because they are components of enzymes [39].

3.5. Correlations Between Mineral Concentrations

In the next step of the study, the concentrations of macronutrients and micronutrients determined in all mint species were assigned to two groups: plants exposed to yellow or violet LED light and plants not exposed to any LED light. Precise manipulation of the light spectrum in which plants grow using diodes (LEDs) allows for the regulation of various aspects of plant growth and development during cultivation, and thus causes changes in the chemical composition of the herbal raw material. Light plays a fundamental role in the life of plants, acting as a source of energy for photosynthesis and a stimulus in metabolic processes. The results of the analysis of the correlations between the concentrations of the analyzed macronutrients and micronutrients in two groups are presented in Table 5 and Table A5. A total of 36 comparisons were made in each group. The analysis revealed 15 significant correlations in the group of plants exposed to LED light, but only six in the control group. In addition, only four significant correlations between mineral ratios, i.e., Ca:Fe, Mn:Zn, Mn:Fe and Cu:Fe, were found in both groups. The highest value (0.91) of the correlation coefficient was noted for the relationship between Mn and Fe content in the group of plants grown under LED light. In four cases (N:Ca, N:Fe, K:Zn, and Ca:Mn), the introduction of LED light induced significant changes in the observed correlations—from directly proportional to inversely proportional relationships (change in sign). This observation aligns with the findings of Ouzounis et al. [42], who demonstrated that plant productivity is influenced not only by light quantity—such as intensity (fluence rate) and duration (photoperiod)—but also by light quality (spectral composition), which plays a key role in regulating plant growth, photomorphogenesis, and tissue composition.
In both agriculture and horticulture, nutrient ratios in plants are important for their growth and development. For instance, nitrogen is the key building block for proteins and nucleic acids. A better understanding of the interplay between nitrogen and calcium contributes to achieving high and stable yields. Excessive nitrogen uptake in the absence of calcium can lead to increased plant growth, but plants become weaker and less resistant to diseases. On the other hand, calcium deficiency can impair nitrogen uptake and decrease plant yields. A relationship between nitrogen and iron is important for normal plant growth; a very high nitrogen uptake can lead to iron deficiency in plants, which manifests as chlorosis or yellowing of leaves, particularly young leaves. In turn, insufficient nitrogen supply may inhibit plant growth and development, despite iron abundancy. Manganese is a micronutrient that affects various metabolic processes, including photosynthesis and hormonal balance in plants. Optimal nutrient ratios contribute to plant health, enhance resistance to diseases and environmental stressors, and improve the growth rate of plants by boosting nitrogen use efficiency [43,44,45,46].
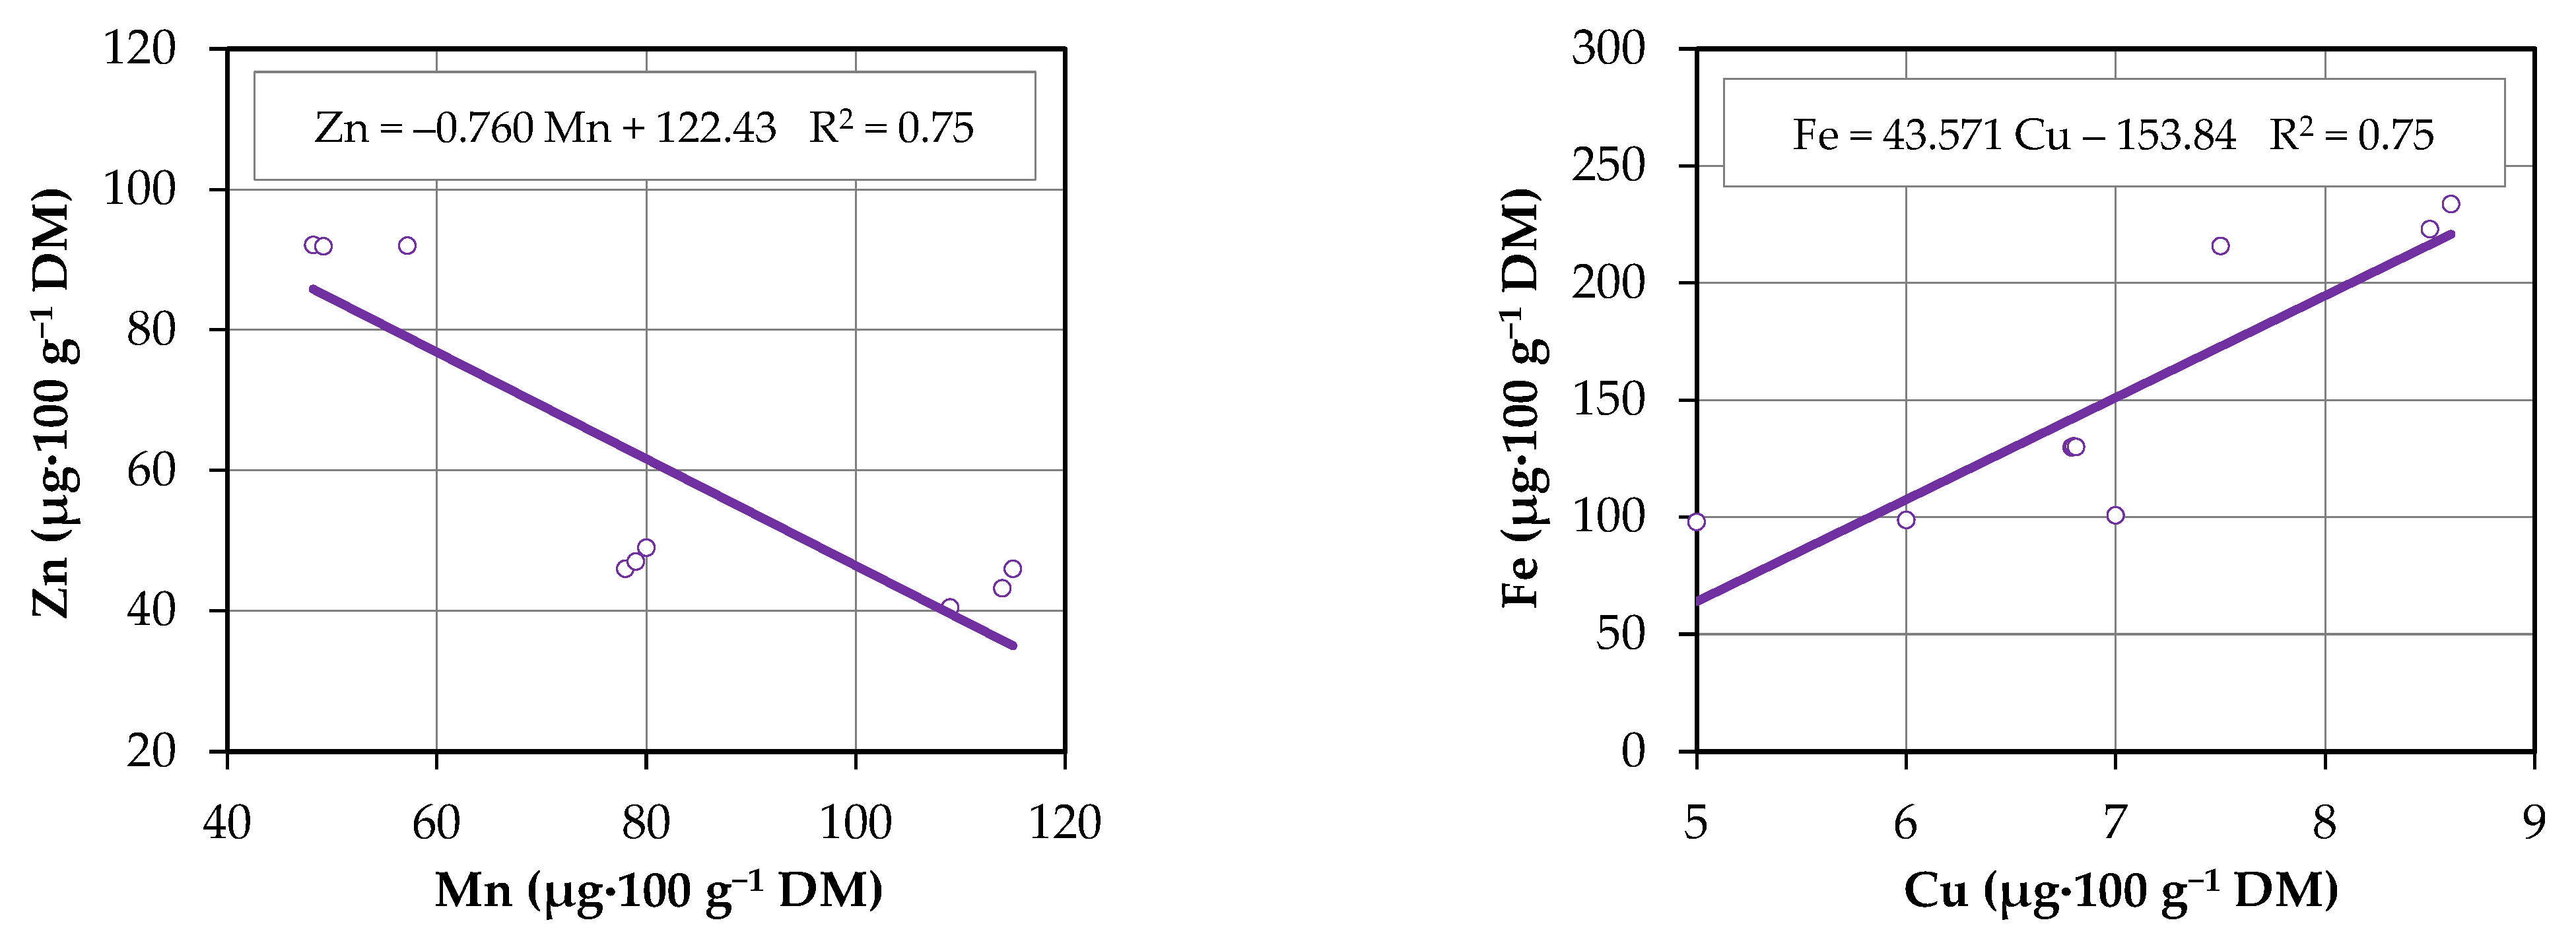
In the control group, only two mineral ratios were characterized by a coefficient of determination higher than 0.6 (Figure 5): Mn:Zn (0.75) and Cu:Fe (0.75). The content of Zn decreased from around 86 µg·100 g−1 DM to around 35 µg·100 g−1 DM (by approx. 60%) on average when the concentration of Mn in mint plants increased from around 48 µg·100 g−1 DM to around 115 µg·100 g−1 DM. An estimated 70% increase in Cu content (from 5.0 µg·100 g−1 DM to around 8.6 µg·100 g−1 DM) was accompanied by an estimated 245% increase in Fe concentration (from 64 µg·100 g−1 DM to around 221 µg·100 g−1 DM).
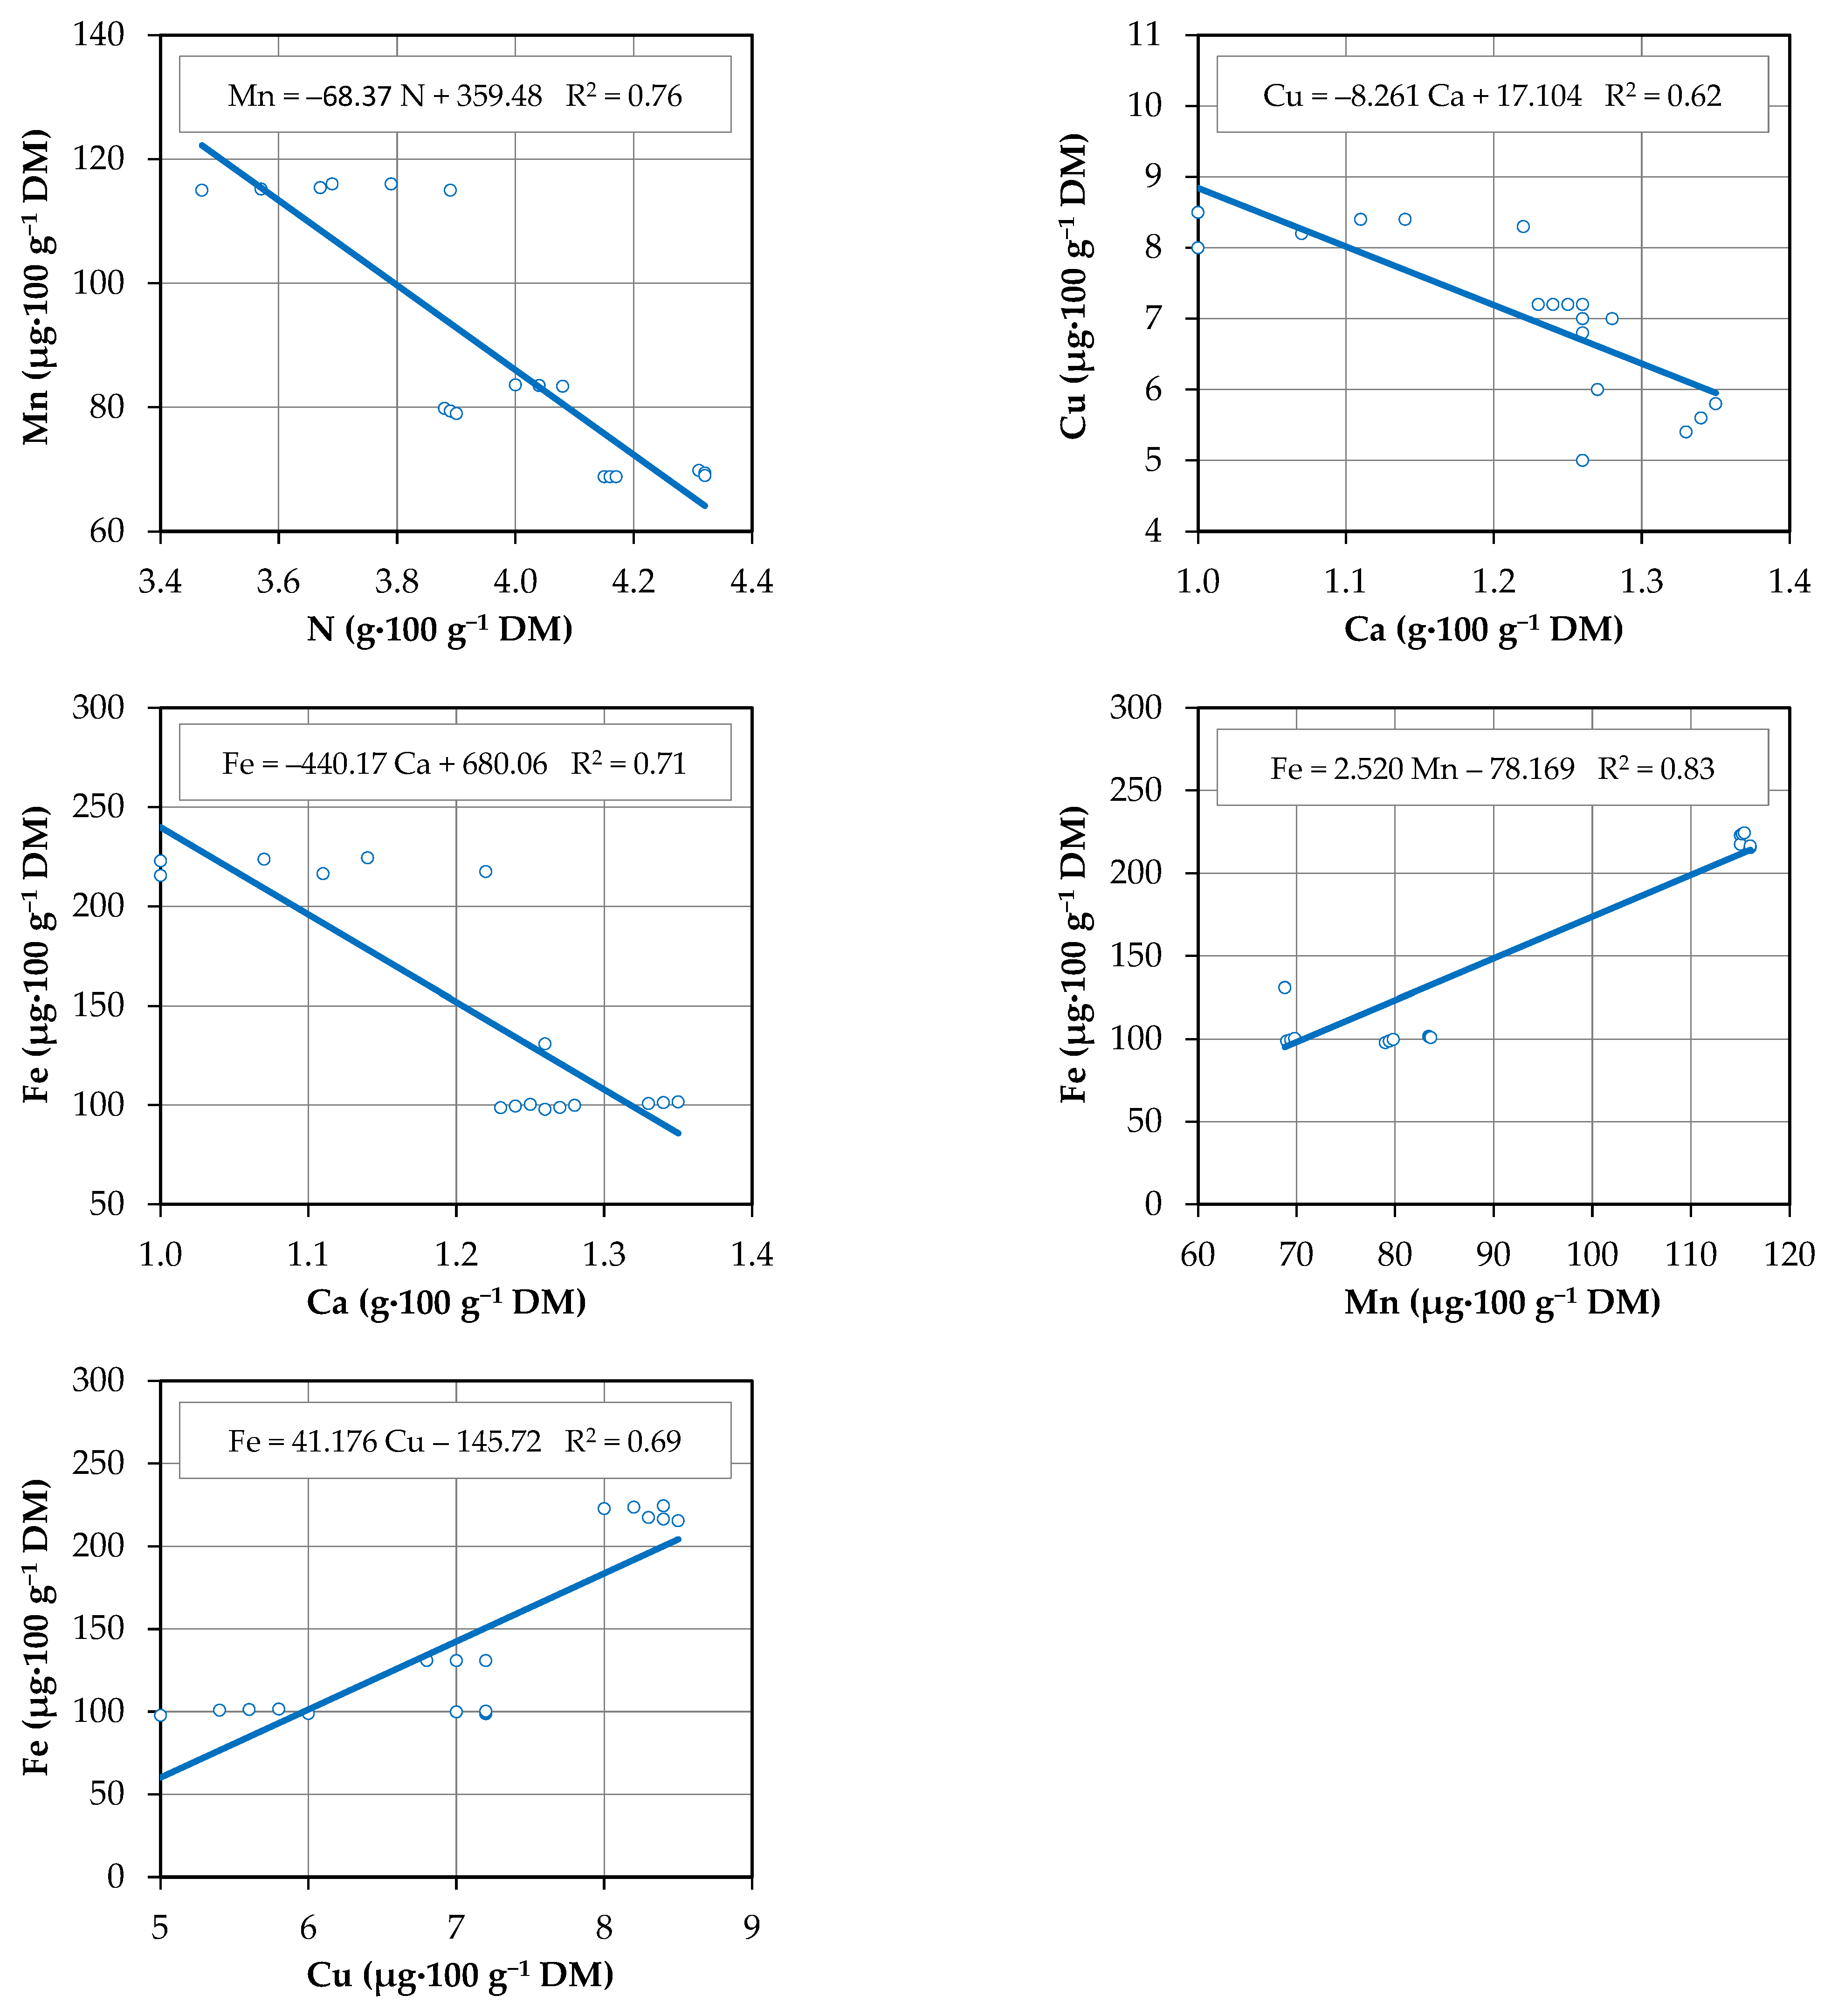
In turn, in the group of mint plants grown under exposure to LED light, five nutrient ratios were characterized by coefficients of determination of minimum 0.6 (Figure 6). In this group, the value of the coefficient of determination was highest for the Mn:Fe ratio (0.83) and lowest for the Ca:Cu ratio (0.62). A 35% increase in Ca concentration was accompanied by an estimated 33% decrease in Cu content (from around 8.8 µg·100 g−1 DM to around 6.0 µg·100 g−1 DM) and an estimated 64% decrease in Fe content (from around 240 µg·100 g−1 DM to around 86 µg·100 g−1 DM). Directly proportional relationships were also noted between Fe content vs. Mn and Cu levels. The observed changes in Fe concentrations were also associated with an estimated 70% increase in Mn and Cu content (from around 69 µg·100 g−1 DM to around 116 µg·100 g−1 DM, and from around 5.0 µg·100 g−1 DM to around 8.5 µg·100 g−1 DM, respectively). In turn, an inversely proportional relationship was observed between Mn content and N content. An increase in N content from 3.5 g·100 g−1 DM to around 4.3 g·100 g−1 DM was accompanied by an estimated 48% decrease in Mn levels.
The present results partially confirm the observations made by David et al. [47] in M. piperita plants supplied with nutrient solutions containing different levels of K and P, supplemented with different NPK rates.

4. Conclusions

The use of LEDs with varying wavelengths, combined with adequate nutrition, positively influence yield and the content of essential nutrients, including macronutrients in mint plants, which play a key role in the processes of growth and development. In addition, controlled growth conditions contribute to improving water and nutrient use efficiency, thus increasing productivity with no negative environmental impact.
Mint yield was influenced by both mint species and light exposure during cultivation. The average total yield of mint ranged from 23.1 g plant−1 to 48.1 g plant−1, while marketable yield ranged from 22.5 g plant−1 to 47.6 g plant−1. Exposure to violet LED light led contributed to the highest increase in yield.
The content of all analyzed macronutrients increased in plants of the evaluated mint species exposed to LED light during growth and development, and significant differences in the concentrations of N, P, and K were observed relative to the control group. The content of N, P, and K in the herbage of three mint species increased by around 25%, 56%, and 42%, respectively, under exposure to violet LED light, and by around 19%, 44%, and 37%, respectively, under exposure to yellow LED light, whereas exposure to violet or yellow LED light did not induce significant changes in micronutrient uptake. The micronutrient content of plants was largely determined by mint species.
The ratios of K:Ca, K:Mg, and K:(Ca + Mg) were higher in plants grown under LED light than in plants exposed to sodium light, whereas the opposite was noted for the Ca:P ratio.

Author Contributions

Conceptualization, J.M.-G. and E.M.; methodology, J.M.-G. and E.M.; software, Z.K.; validation, Z.K.; formal analysis, Z.K., E.M., M.M. and D.J.C.; investigation, Z.K.; resources, J.M.-G. and A.F.; data curation, K.K.J. and J.M.-G.; writing—original draft preparation, Z.K. and J.M.-G.; writing—review and editing, Z.K. and J.M.-G.; visualization, K.K.J., J.M.-G. and A.F.; supervision, Z.K. and J.M.-G.; project administration, Z.K. and J.M.-G.; funding acquisition, A.F., M.M. and D.J.C. All authors have read and agreed to the published version of the manuscript.

Funding

The results presented in this paper were obtained as part of a comprehensive study financed by the University of Warmia and Mazury in Olsztyn, Faculty of Agriculture and Forestry, Department of Agroecosystems and Horticulture, 30.610.016-110, funded by the Ministry of Science under “the Regional Initiative of Excellence Program”.

Data Availability Statement

The data that support the findings of this study are available from the corresponding author upon reasonable request.

Conflicts of Interest

The authors declare no conflicts of interest.

Appendix A

Table A1. The effect of LED light on the yield of mint plants (mean values ± standard deviations).
FactorSource
of Variation
Total YieldMarketable Yield
g·plant−1
SpeciesM. piperita39.6 ± 4.7 a39.3 ± 4.8 a
M. spicata43.6 ± 3.8 a43.3 ± 3.7 a
M. suaveolens25.7 ± 2.4 b25.3 ± 2.5 b
Type of lightYellow LED34.6 ± 7.8 a34.2 ± 7.8 a
Violet LED40.7 ± 9.1 a40.4 ± 9.1 a
Control33.7 ± 8.0 a33.3 ± 8.1 a
a, b—superscript letters denote significant differences between the examined yield at p < 0.05.
Table A2. The effect of LED light on the content of macronutrients in the aerial parts of mint plants (mean values ± standard deviations).
FactorSource
of Variation
NPKMgCa
(g·100 g−1 DM)
SpeciesM. piperita4.01 ± 0.36 a0.52 ± 0.12 a5.31 ± 1.20 a0.41 ± 0.04 b1.23 ± 0.04 a
M. spicata3.57 ± 0.61 a0.49 ± 0.10 a5.40 ± 0.82 a0.46 ± 0.01 a1.29 ± 0.13 a
M. suaveolens3.59 ± 0.19 a0.43 ± 0.11 a5.66 ± 0.69 a0.41 ± 0.04 b1.03 ± 0.13 b
Type of lightYellow LED3.87 ± 0.26 a0.52 ± 0.04 a5.91 ± 0.11 a0.42 ± 0.03 a1.20 ± 0.10 a
Violet LED4.05 ± 0.23 a0.56 ± 0.08 a6.13 ± 0.13 a0.45 ± 0.02 a1.23 ± 0.11 a
Control3.24 ± 0.39 b0.36 ± 0.10 b4.32 ± 0.65 b0.41 ± 0.06 a1.12 ± 0.22 a
a, b—superscript letters denote significant differences between macronutrient concentrations within each experimental factor at p < 0.05.
Table A3. The effect of LED light on nutrient ratios in the aerial parts of mint plants (mean values ± standard deviations).
FactorSource
of Variation
K:CaK:MgCa:MgK:(Ca + Mg)Ca:P
(–)
SpeciesM. piperita4.3 ± 0.9 b12.9 ± 2.6 a3.0 ± 0.4 a3.2 ± 0.6 b2.5 ± 0.7 a
M. spicata4.2 ± 0.6 b11.8 ± 1.7 a2.8 ± 0.3 ab3.1 ± 0.4 b2.7 ± 0.6 a
M. suaveolens5.5 ± 0.5 a13.8 ± 0.9 a2.5 ± 0.2 b3.9 ± 0.3 a2.6 ± 0.8 a
Type of lightYellow LED5.0 ± 1.0 a14.0 ± 1.0 a2.8 ± 0.3 a3.7 ± 0.3 a2.3 ± 0.1 b
Violet LED5.0 ± 0.5 a13.8 ± 0.6 a2.8 ± 0.2 a3.7 ± 0.3 a2.2 ± 0.3 b
Control4.0 ± 1.2 b10.8 ± 2.0 b2.8 ± 0.6 a2.9 ± 0.7 b3.3 ± 0.8 a
a, b—superscript letters denote significant differences between nutrient ratios within each experimental factor at p < 0.05.
Table A4. The effect of LED light on the content of micronutrients in the aerial parts of mint plants (mean values ± standard deviations).
FactorSource
of Variation
MnZnCuFe
(μg·100 g−1 DM)
SpeciesM. piperita63.2 ± 9.1 c87.8 ± 6.2 a7.0 ± 0.2 b120.3 ± 15.4 b
M. spicata80.6 ± 2.2 b50.6 ± 4.9 b5.9 ± 0.7 c99.9 ± 1.5 c
M. suaveolens114.5 ± 2.2 a47.8 ± 5.8 b8.3 ± 0.3 a221.5 ± 5.9 a
Type of lightYellow LED87.8 ± 21.1 a64.7 ± 20.4 a7.1 ± 1.1 a151.3 ± 56.1 a
Violet LED89.5 ± 20.5 a60.7 ± 15.5 a7.1 ± 1.2 a139.2 ± 58.0 a
Control81.1 ± 26.7 a60.9 ± 23.5 a7.0 ± 1.1 a151.2 ± 56.6 a
a, b, c—superscript letters denote significant differences between micronutrient concentrations within each experimental factor at p < 0.05.
Table A5. Coefficients of linear correlation between the content of macronutrients and micronutrients in the aerial parts of mint plants.
Type of LightNutrientPearson’s Correlation Coefficient
NPKMgCaMnZnCu
LEDP0.711
K0.360.221
Mg0.210.410.181
Ca0.710.450.030.581
Mn−0.87−0.690.03–0.130.751
Zn0.730.360.27–0.390.31−0.701
Cu–0.41–0.400.27–0.45−0.790.64–0.061
Fe−0.76−0.740.08–0.44−0.850.91–0.380.83
ControlP0.141
K–0.090.201
Mg–0.480.660.161
Ca–0.380.53–0.240.431
Mn–0.15–0.310.76–0.09–0.591
Zn0.570.31−0.68–0.200.33−0.861
Cu0.47–0.040.50–0.46–0.340.60–0.171
Fe0.50–0.240.58–0.48−0.750.76–0.350.87
Values in bold denote significant correlations at 0.05. Critical values of the correlation coefficient—0.47 (LED) and 0.67 (Control).

References

  1. Chrysargyris, A.; Nikolaidou, E.; Stamatakis, A.; Tzortzakis, N. Vegetative, physiological, nutritional and antioxidant behavior of spearmint (Mentha spicata L.) in response to different nitrogen supply in hydroponics. J. Appl. Res. Med. Aromat. Plants 2017, 6, 52–61. [Google Scholar] [CrossRef]
  2. Chrapek, A.; Dzida, K. Chemical composition, growing conditions and healing effects of peppermint (Mentha × piperita L.). In Wybrane Zagadnienia z Zakresu Przemysłu Spożywczego oraz Zarządzania i Inżynierii Produkcji, Tom 1; Babicz, N., Kropiwiec-Domańska, K., Eds.; Wydawnictwo Uniwersytetu Przyrodniczego: Lublin, Poland, 2020; pp. 16–23. [Google Scholar] [CrossRef]
  3. Zheng, L.; He, H.; Song, W. Application of light-emitting diodes and the effect of light quality on horticultural crops: A review. HortScience 2019, 54, 1656–1661. [Google Scholar] [CrossRef]
  4. Thoma, F.; Somborn-Schulz, A.; Schlehuber, D.; Keuter, V.; Deerberg, G. Effects of light on secondary metabolites in selected leafy greens: A review. Front. Plant Sci. 2020, 11, 497. [Google Scholar] [CrossRef] [PubMed]
  5. Bantis, F.; Smirnakou, S.; Ouzounis, T.; Koukounaras, A.; Ntagkas, N.; Radoglou, K. Current status and recent achievements in the field of horticulture with the use of light-emitting diodes (LEDs). Sci. Hortic. 2018, 235, 437–451. [Google Scholar] [CrossRef]
  6. Kozai, T. Why LED lighting for urban agriculture? In LED Lighting for Urban Agriculture; Kozai, T., Fujiwara, K., Runkle, E., Eds.; Springer: Singapore, 2016; pp. 3–18. [Google Scholar] [CrossRef]
  7. Hasan, M.; Bashir, T.; Ghosh, R.; Lee, S.K.; Bae, H. An overview of LEDs’ effects on the production of bioactive compounds and crop quality. Molecules 2017, 22, 1420. [Google Scholar] [CrossRef] [PubMed]
  8. Rai, K.; Agrawal, S.B. Effects of UV-B radiation on morphological, physiological and biochemical aspects of plants: An overview. J. Sci. Res. 2017, 61, 87–113. [Google Scholar]
  9. Paradiso, R.; Proietti, S. Light-quality manipulation to control plant growth and photomorphogenesis in greenhouse horticulture: The state of the art and the opportunities of modern LED systems. J. Plant Growth Regul. 2022, 41, 742–780. [Google Scholar] [CrossRef]
  10. Tabbert, J.M.; Schulz, H.; Krähmer, A. Investigation of LED light qualities for peppermint (Mentha x Piperita L.) cultivation focusing on plant quality and consumer safety aspects. Front. Food Sci. Technol. 2022, 2, 852155. [Google Scholar] [CrossRef]
  11. Hogewoning, S.W.; Trouwborst, G.; Maljaars, H.; Poorter, H.; van Ieperen, W.; Harbinson, J. Blue light dose-responses of leaf photosynthesis, morphology, and chemical composition of Cucumis sativus grown under different combinations of red and blue light. J. Exp. Bot. 2010, 61, 3107–3117. [Google Scholar] [CrossRef]
  12. Brito, C.; Ferreira, H.; Dinis, L.-T.; Trindade, H.; Marques, D.; Correia, C.M.; Moutinho-Pereira, J. Different LED light intensity and quality change perennial ryegrass (Lolium perenne L.) physiological and growth responses and water and energy consumption. Front. Plant Sci. 2023, 14, 1160100. [Google Scholar] [CrossRef]
  13. Behn, H.; Albert, A.; Marx, F.; Noga, G.; Ulbrich, A. Ultraviolet-B and photosynthetically active radiation interactively affect yield and pattern of monoterpenes in leaves of peppermint (Mentha × Piperita L.). J. Agric. Food Chem. 2010, 58, 7361–7367. [Google Scholar] [CrossRef]
  14. Alvarenga, J.P.; Pacheco, F.V.; Bertolucci, S.K.V.; Silva, S.T.; de Oliveira, T.; Pinto, J.E.B.P. In vitro culture of Mentha viridis: Quality and intensity of light on growth and production of volatiles. Acta Hortic. 2018, 1224, 175–182. [Google Scholar] [CrossRef]
  15. Kozai, T. Towards sustainable plant factories with artificial lighting (PFALs) for achieving SDGs. Int. Agric. Biol. Eng. 2019, 12, 28–37. [Google Scholar] [CrossRef]
  16. Soufi, H.R.; Roosta, H.R.; Fatehi, F.; Ghorbanpour, M. Spectral composition of LED light differentially affects biomass, photosynthesis, nutrient profile, and foliar nitrate accumulation of lettuce grown under various replacement methods of nutrient solution. Food Sci. Nutr. 2023, 11, 8143–8162. [Google Scholar] [CrossRef]
  17. Pinho, P.; Jokinen, K.; Halonen, L. The influence of the LED light spectrum on the growth and nutrient uptake of hydroponically grown lettuce. Light. Res. Technol. 2017, 49, 866–881. [Google Scholar] [CrossRef]
  18. Kołodziej, B. Uprawa Ziół: Poradnik dla Plantatorów [Growing Herbs. A Grower’s Guide]; PWRiL: Poznań, Poland, 2010. (In Polish) [Google Scholar]
  19. Majkowska-Gadomska, J.; Kaliniewicz, Z.; Francke, A.; Sałata, A.; Jadwisieńczak, K.K. An evaluation of the biometric parameters and chemical composition of the florets, leaves, and stalks of broccoli plants grown in different soil types. Appl. Sci. 2024, 14, 4411. [Google Scholar] [CrossRef]
  20. Trivellini, A.; Toscano, S.; Romano, D.; Ferrante, A. LED lighting to produce high-quality ornamental plants. Plants 2023, 12, 1667. [Google Scholar] [CrossRef]
  21. Eichhorn Bilodeau, S.; Wu, B.-S.; Rufyikiri, A.-S.; MacPherson, S.; Lefsrud, M. An update on plant photobiology and implications for cannabis production. Front. Plant Sci. 2019, 10, 296. [Google Scholar] [CrossRef]
  22. McCree, K.J. The action spectrum absorptance and quantum yield of photosynthesis in crop plants. Agric. Meteorol. 1972, 9, 191–216. [Google Scholar] [CrossRef]
  23. Pennisi, G.; Blasioli, S.; Cellini, A.; Maia, L.; Crepaldi, A.; Braschi, I.; Spinelli, F.; Nicola, S.; Fernandez, J.A.; Stanghellini, C.; et al. Unraveling the role of red:blue LED lights on resource use efficiency and nutritional properties of indoor grown sweet basil. Front. Plant Sci. 2019, 10, 305. [Google Scholar] [CrossRef] [PubMed]
  24. Alrifai, O.; Hao, X.; Marcone, M.F.; Tsao, R. Current review of the modulatory effects of LED lights on photosynthesis of secondary metabolites and future perspectives of microgreen vegetables. J. Agric. Food Chem. 2019, 67, 6075–6090. [Google Scholar] [CrossRef]
  25. Zhang, Y.; Xie, J. The effect of red and violet light emitting diode (LED) treatments on the postharvest quality and biodiversity of fresh-cut pakchoi (Brassica rapa L. Chinensis). Food Sci. Technol. Int. 2022, 28, 297–308. [Google Scholar] [CrossRef]
  26. Mansoori, I. The effect of plant density and harvesting time on growth and essential oil of peppermint (Mentha piperita L.). J. Med. Bioeng. 2014, 3, 113–116. [Google Scholar] [CrossRef]
  27. Martínez-Moreno, A.; Frutos-Tortosa, A.; Diaz-Mula, H.; Mestre, T.C.; Martínez, V. Effect of the intensity and spectral quality of LED light on growth and quality of spinach indoors. Horticulturae 2024, 10, 411. [Google Scholar] [CrossRef]
  28. Ruamrungsri, S.; Utrapen, Y.; Tateing, S.; Panjama, K.; Inkham, C. Impact of LED combinations and light intensity on growth and yields of wasabi. Horticulturae 2025, 11, 3. [Google Scholar] [CrossRef]
  29. Surendran, U.; Chandran, C.; Joseph, E.J. Hydroponic cultivation of Mentha spicata and comparison of biochemical and antioxidant activities with soil-grown plants. Acta Physiol. Plant. 2017, 39, 26. [Google Scholar] [CrossRef]
  30. Xu, J.; Guo, Z.; Jiang, X.; Ahammed, G.J.; Zhou, Y. Light regulation of horticultural crop nutrient uptake and utilization. Hortic. Plant J. 2021, 7, 367–379. [Google Scholar] [CrossRef]
  31. Francke, A.; Majkowska-Gadomska, J.; Kaliniewicz, Z.; Jadwisieńczak, K. No effect of biostimulants on the growth, yield and nutritional value of shallots grown for bunch harvest. Agronomy 2022, 12, 1156. [Google Scholar] [CrossRef]
  32. Skubij, N.; Dzida, K.; Jarosz, Z.; Pitura, K.; Jaroszuk-Sierocińska, M. Nutritional value of savory herb (Satureja hortensis L.) and plant response to variable mineral nutrition conditions in various phases of development. Plants 2020, 9, 706. [Google Scholar] [CrossRef] [PubMed]
  33. Trivellini, A.; Toscano, S.; Romano, D.; Ferrante, A. The role of blue and red light in the orchestration of secondary metabolites, nutrient transport and plant quality. Plants 2023, 12, 2026. [Google Scholar] [CrossRef]
  34. Sadowska, U.; Domagała-Świątkiewicz, I.; Żabiński, A. Biochar and its effects on plant-soil macronutrient cycling during a three-year field trial on sandy soil with peppermint (Mentha piperita L.). Part I: Yield and macro element content in soil and plant biomass. Agronomy 2020, 10, 1950. [Google Scholar] [CrossRef]
  35. Nishioka, N.; Nishimura, T.; Ohyama, K.; Sumino, M.; Malayeri, S.H.; Goto, E.; Inagaki, N.; Morota, T. Light quality affected growth and contents of essential oil components of Japanese mint plants. Acta Hortic. 2008, 797, 431–436. [Google Scholar] [CrossRef]
  36. Zhai, J.; Gao, Y.; Zhang, X.W.; Han, L.J.; Bi, H.G.; Li, Q.M.; Ai, X.Z. Effects of silicon and calcium on photosynthesis yield and quality of cucumber in solar-greenhouse. Acta Hortic. Sin. 2019, 46, 701–713. [Google Scholar] [CrossRef]
  37. Oivukkamäki, J.; Atherton, J.; Xu, S.; Riikonen, A.; Zhang, C.; Hakala, T.; Honkavaara, E.; Porcar-Castell, A. Investigating foliar macro- and micronutrient variation with chlorophyll fluorescence and reflectance measurements at the leaf and canopy scales in potato. Remote Sens. 2023, 15, 2498. [Google Scholar] [CrossRef]
  38. Jarnuszewski, G.; Meller, E. Mineral element ratios in plants grown on post-bog soils fertilised with zinc and copper. Folia Pomer. Univ. Technol. Stetin. Agric. Aliment. Piscaria Zootech. 2013, 304, 25–32. (In Polish) [Google Scholar]
  39. Rosanoff, A.; Capron, E.; Barak, P.; Mathews, B.; Nielsen, F. Edible plant tissue and soil calcium:magnesium ratios: Data too sparse to assess implications for human health. Crop Pasture Sci. 2015, 66, 1265–1277. [Google Scholar] [CrossRef]
  40. Kızıl, S.; Hasımı, N.; Tolan, V.; Kılınc, E.; Yuksel, U. Mineral content, essential oil components and biological activity of two mentha species (M. piperita L., M. spicata L.). Turk. J. Field Crops 2010, 15, 148–153. [Google Scholar]
  41. Hudz, N.; Kobylinska, L.; Pokajewicz, K.; Horčinová Sedláčková, V.; Fedin, R.; Voloshyn, M.; Myskiv, I.; Brindza, J.; Wieczorek, P.P.; Lipok, J. Mentha piperita: Essential oil and extracts, their biological activities, and perspectives on the development of new medicinal and cosmetic products. Molecules 2023, 28, 7444. [Google Scholar] [CrossRef]
  42. Ouzounis, T.; Rosenqvist, E.; Ottosen, C.O. Spectral effects of artificial light on plant physiology and secondary metabolism: A review. HortScience 2015, 50, 1128–1135. [Google Scholar] [CrossRef]
  43. Weng, X.; Li, H.; Zhou, Y.; Ren, C.; Zhang, S.; Liu, L. Relative availability of nitrogen and calcium regulates the growth of poplar seedlings due to transcriptome changes. Forests 2023, 14, 1899. [Google Scholar] [CrossRef]
  44. Bhat, M.A.; Mishra, A.K.; Shah, S.N.; Bhat, M.A.; Jan, S.; Rahman, S.; Baek, K.-H.; Jan, A.T. Soil and mineral nutrients in plant health: A prospective study of iron and phosphorus in the growth and development of plants. Curr. Issues Mol. Biol. 2024, 46, 5194–5222. [Google Scholar] [CrossRef] [PubMed]
  45. Singh, K.; Gupta, S.; Singh, A.P. Review: Nutrient-nutrient interactions governing underground plant adaptation strategies in a heterogeneous environment. Plant Sci. 2024, 342, 112024. [Google Scholar] [CrossRef]
  46. Xing, Y.; Feng, Z.-Q.; Zhang, X.; Cao, H.-X.; Liu, C.-L.; Qin, H.-H.; Jiang, H.; Zhu, Z.-L.; Ge, S.-F.; Jiang, Y.-M. Nitrogen reduces calcium availability by promoting oxalate biosynthesis in apple leaves. Hortic. Res. 2024, 11, uhae208. [Google Scholar] [CrossRef] [PubMed]
  47. David, E.F.S.; Mischan, M.M.; Marques, M.O.M.; Boaro, C.S.F. Physiological indexese macro- and micronutrients in plant tissue and essential oil of Mentha piperita L. grown in nutrient solution with variation in N, P, K and Mg levels. Rev. Bras. Plantas Med. 2014, 16, 97–106. [Google Scholar] [CrossRef]
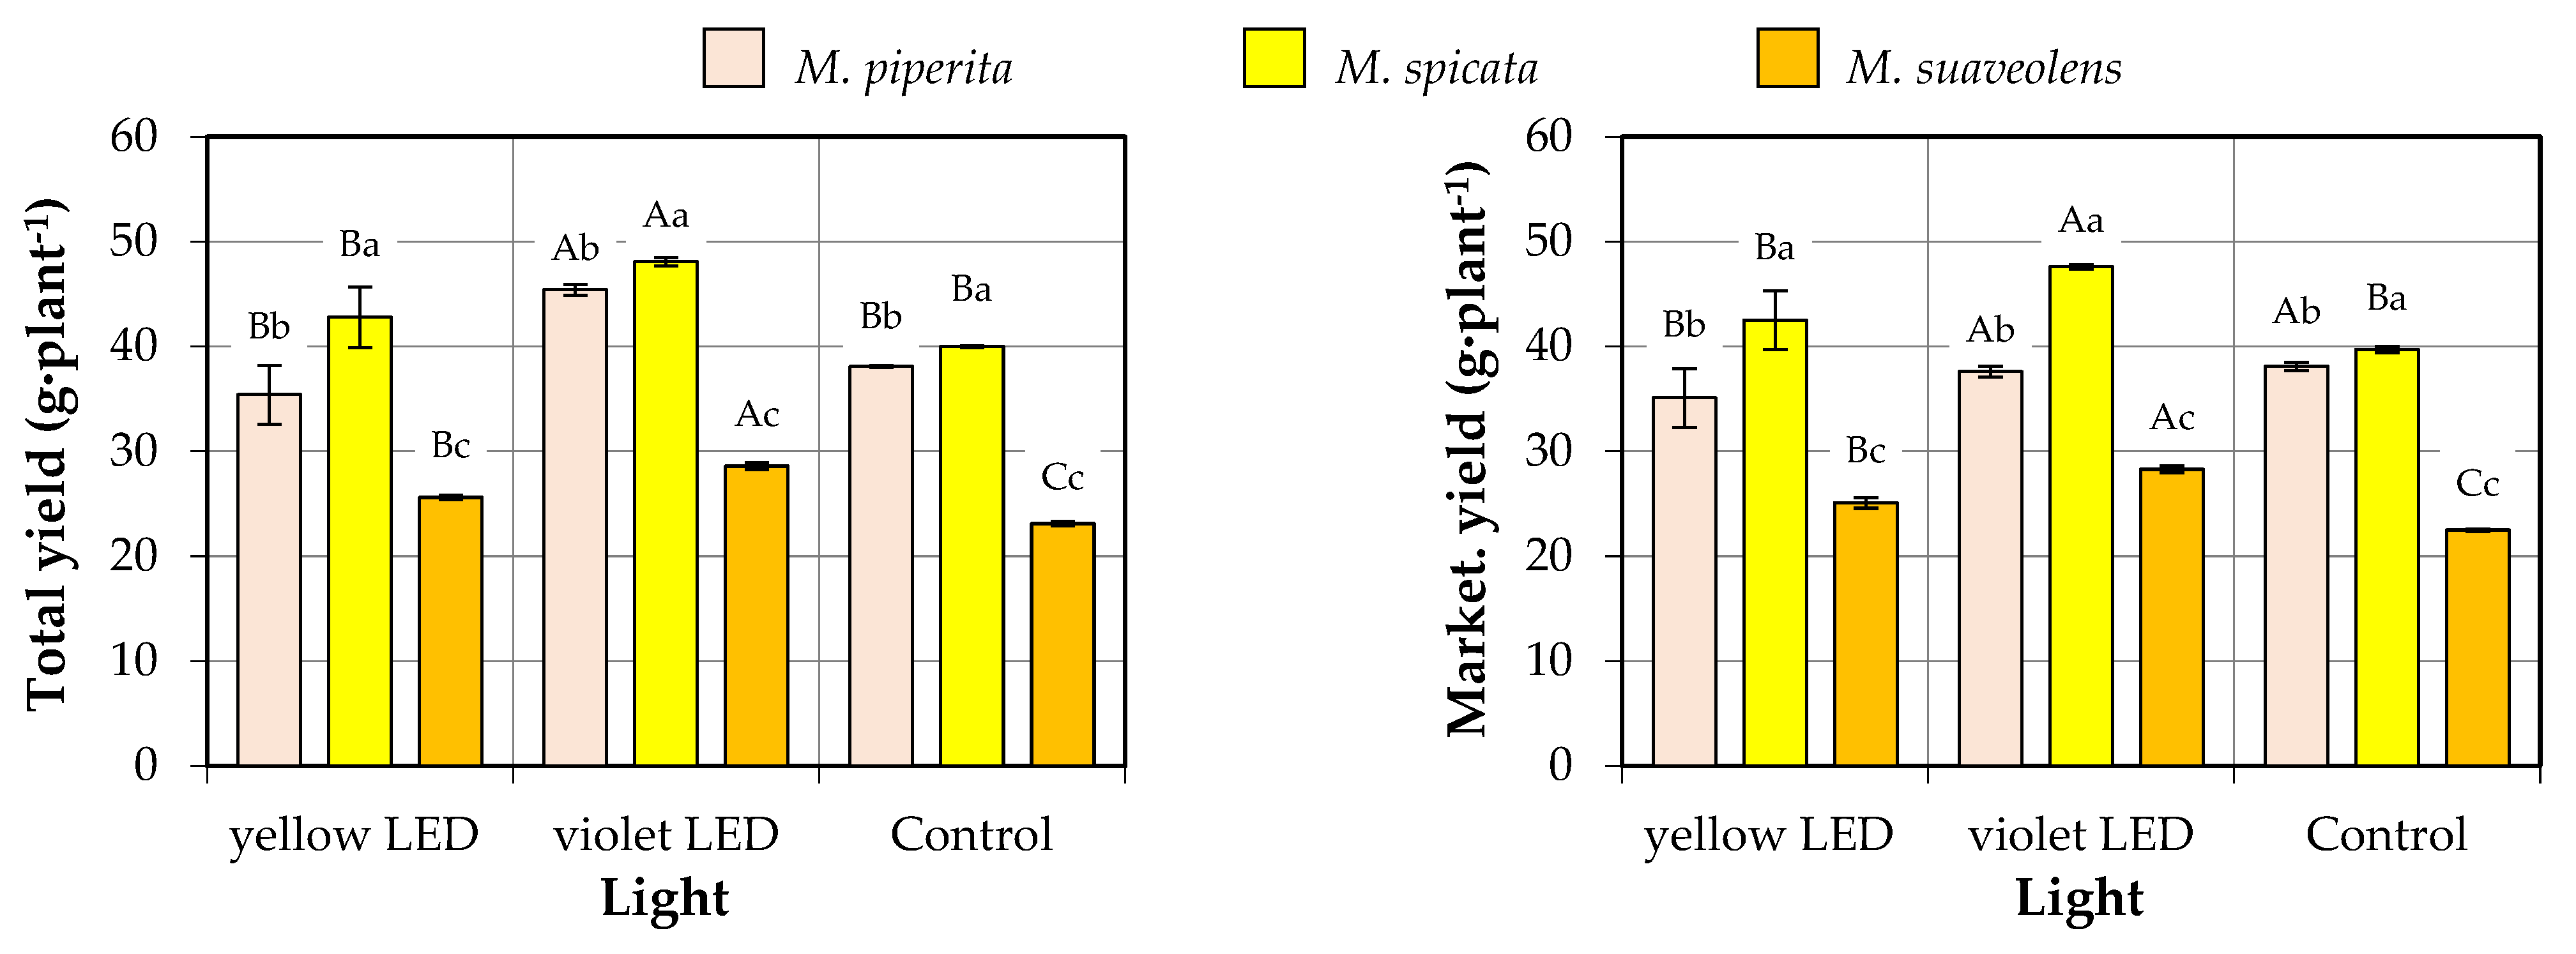
Figure 1. Impact of LED light on the yield of mint plants: A, B, C—letters indicate significant differences (p < 0.05, Tukey’s test, n = 9) among light treatments within the same mint species; a, b, c—letters indicate significant differences (p < 0.05, Tukey’s test, n = 9) among mint species under the same light treatment.
Agronomy 15 01959 g001
Figure 2. Impact of LED light on macronutrient levels in mint plants: A, B—letters indicate significant differences (p < 0.05, Tukey’s test, n = 9) among light treatments within the same mint species; a, b, c—letters indicate significant differences (p < 0.05, Tukey’s test, n = 9) among mint species under the same light treatments.
Agronomy 15 01959 g002
Figure 3. Impact of LED light on macronutrient ratios in mint plants: A, B—letters indicate significant differences (p < 0.05, Tukey’s test, n = 9) among light treatments within the same mint species; a, b, c—letters indicate significant differences (p < 0.05, Tukey’s test, n = 9) among mint species under the same light treatments.
Agronomy 15 01959 g003
Figure 4. Impact of LED light on micronutrient levels in mint plants: A, B—letters indicate significant differences (p < 0.05, Tukey’s test, n = 9) among light treatments within the same mint species; a, b, c—indicate significant differences (p < 0.05, Tukey’s test, n = 9) among mint species under the same light treatments.
Agronomy 15 01959 g004
Figure 5. Correlations between the content of minerals in the group of mint plants not exposed to LED light.
Agronomy 15 01959 g005
Figure 6. Correlations between the content of minerals in the group of mint plants exposed to LED light.
Agronomy 15 01959 g006
Table 1. The p-value in ANOVA of the yield of mint plants.
FactorTotal YieldMarketable Yield
Species (A)<0.001<0.001
Type of light (B)0.1760.170
Interaction (A × B)0.0020.003
Table 2. The p-value in ANOVA of the macronutrient content in the aerial parts of mint plants.
FactorNFKMgCa
Species (A)0.0560.2310.7030.013<0.001
Type of light (B)<0.001<0.001<0.0010.0980.301
Interaction (A × B)<0.0010.3460.0100.4640.537
Table 3. The p-value in ANOVA of the nutrient ratios in the aerial parts of mint plants.
FactorK:CaK:MgCa:MgK:(Ca + Mg)Ca:P
Species (A)<0.0010.0980.0040.0020.808
Type of light (B)0.022<0.0010.9020.004<0.001
Interaction (A × B)0.0060.0180.4950.0010.768
Table 4. The p-value in ANOVA of the micronutrient content in the aerial parts of mint plants.
FactorMnZnCuFe
Species (A)<0.001<0.001<0.001<0.001
Type of light (B)0.7140.8920.9900.876
Interaction (A × B)<0.001<0.0010.700<0.001
Table 5. Istotność coefficients of linear correlation between the content of macronutrients and micronutrients in the aerial parts of mint plants.
Type of LightNutrientNPKMgCaMnZnCu
LEDP+1
Knsns1
Mgnsnsns1
Ca+nsns+1
Mn+++nsns+1
Zn+nsnsnsns+1
Cunsnsnsns++ns1
Fe++nsns++++ns++
ControlPns1
Knsns1
Mgnsnsns1
Cansnsnsns1
Mnnsns+nsns1
Znnsns+nsns++1
Cunsnsnsnsnsnsns1
Fensnsnsns++ns++
+—significant coefficient of correlation with an absolute value of ≤0.8; ++—significant coefficient of correlation with an absolute value of >0.8; ns—not significant at 0.05.
Disclaimer/Publisher’s Note: The statements, opinions and data contained in all publications are solely those of the individual author(s) and contributor(s) and not of MDPI and/or the editor(s). MDPI and/or the editor(s) disclaim responsibility for any injury to people or property resulting from any ideas, methods, instructions or products referred to in the content.