Review

Raman Spectroscopy as a Tool for Early Identification of Tan Spot Disease and Assessment of Fungicide Response in Wheat

Laboratory of Plant Pathology, Department of Agriculture Crop Production and Rural Environment, School of Agricultural Sciences, University of Thessaly, 38446 Volos, Greece
Agronomy 2025, 15(8), 1952; https://doi.org/10.3390/agronomy15081952
Submission received: 18 July 2025 / Revised: 11 August 2025 / Accepted: 11 August 2025 / Published: 13 August 2025

Abstract

Tan spot disease, caused by Pyrenophora tritici-repentis, poses a significant threat to wheat production worldwide. Early detection and precise fungicide application are essential for effective disease management. This study explores the potential of Raman spectroscopy—specifically surface-enhanced Raman spectroscopy (SERS) and coherent anti-Stokes Raman scattering (CARS)—as non-invasive tools for identifying fungal infection and assessing wheat’s biochemical response to propiconazole treatment. The methodology is entirely theoretical; no laboratory experiments were conducted. Instead, all spectral graphs and figures were generated through a collaborative process between the author and Microsoft Copilot, which served as a rendering tool. These AI-assisted visualizations simulate Raman responses based on known molecular interactions and literature data. The results demonstrate the conceptual feasibility of Raman-based diagnostics for precision agriculture, offering a sustainable approach to disease monitoring and fungicide management.

1. Introduction

Climate change has a significant impact on plant diseases, influencing their occurrence, prevalence, and severity. This relationship is complex and involves both direct and indirect effects on how plants interact with pathogens. For instance, changes in temperature and humidity can enhance the virulence and spread of plant pathogens [1,2]. Additionally, climate change can influence the physiological responses of plants, making them more susceptible to infections. Increased temperatures can weaken plant defenses and enhance the aggressiveness of pathogens [2,3]. Additionally, climate change can affect the development, survival, and geographical distribution of pathogens, leading to the emergence of new diseases in regions that were previously unaffected [4].

1.1. Role of Pyrenophora tritici-repentis and Propiconazole

Research indicates that climate change is driving the northward and upward expansion of Pyrenophora tritici-repentis into regions that were previously unaffected by this pathogen [5,6]. This expansion is largely due to the pathogen’s adaptation to warmer climates, as increased temperatures and altered precipitation patterns can contribute to higher incidence and severity of the disease [7]. Furthermore, elevated temperatures may enhance the aggressiveness of P. tritici-repentis by shortening the latent period and enhancing the pathogen’s ability to infect host plants [8].
Given that the risk of plant diseases can easily shift due to climate change, and that predicting these changes is complicated by various biological interactions related to diseases, we believe developing new diagnostic techniques is essential, and that is a key issue of this research.
To facilitate early detection of pathogens such as P. tritici-repentis, a real-time quantitative polymerase chain reaction (qPCR) assay has been developed [9]. This assay focuses on a multicopy locus (PtrMulti) within the P. tritici-repentis genome. This assay is highly specific and sensitive, capable of detecting DNA levels as low as 0.1 picograms [9]. Specific primer pairs have been designed to ensure reliable PCR detection of P. tritici-repentis in wheat leaf and seed samples. PCR using specific primers for the ToxA gene has been used to amplify a product for the detection of P. tritici-repentis strains, particularly those classified as races 4 and 5 [10,11,12].
In addition to the qPCR assay, remote sensing and imaging techniques, such as multispectral imaging, hyperspectral imaging, and thermal imaging, have been utilized to detect early-stage stress factors associated with tan spot disease caused by P. tritici-repentis [11]. Furthermore, advanced detection algorithms, such as the YOLOv5 model, have been implemented for real-time disease identification with high accuracy [13].
Molecular methods offer high accuracy and specificity, particularly for genetic analysis in the early detection of P. tritici-repentis. However, these methods cannot identify pesticide residues present in wheat products or examine the interactions between pesticides and the reproducibility of pathogens. Furthermore, while common fungicides, such as triazoles, used in wheat crops show good sensitivity and stability, these methods do not clarify changes in selectivity or the behavior of these pesticides.
Traditional molecular methods, such as gas chromatography–mass spectrometry (GC-MS) and high-performance liquid chromatography (HPLC), are commonly used to detect pesticide residues. While these methods are highly accurate, they require complex and time-consuming sample preparation.
To achieve early pathogen detection, we rely on laboratory methods with high accuracy, such as polymerase chain reaction (PCR). Although GC-MS and HPLC also provide high accuracy for detecting pesticide residues, none of these methods offers unique advantages for the early detection of P. tritici-repentis or for identifying pesticide residues.

1.2. Raman Spectroscopy in Agricultural Diagnostics and Objectives of the Study

In this context, we discuss Raman spectroscopy—a non-destructive and highly sensitive detection method and provide theoretical results to support its application. Here, we explore the application of Raman spectroscopy—specifically surface-enhanced Raman spectroscopy (SERS) and coherent anti-Stokes Raman scattering (CARS)—as innovative tools for early detection of this pathogen and for monitoring the localized application of the fungicide propiconazole. These techniques offer high sensitivity and molecular specificity, enabling non-destructive analysis of infected plant tissues. The objective of this work is to evaluate the feasibility of Raman-based methods for in situ diagnosis and targeted fungicide deployment. The paper is structured as follows: Section 2 (Materials and Methods) details the theoretical and experimental methodology, Section 3 (Theoretical Results and Simulated Insights) presents the results and their interpretation, and Section 4 (Discussion) discusses the implications and potential applications of the findings. Finally, Section 5 concludes with a summary and future directions.

2. Materials and Methods

2.1. Study Objectives

The primary objective of this study is to explore the theoretical feasibility of using Raman spectroscopy—specifically surface-enhanced Raman spectroscopy (SERS) and coherent anti-Stokes Raman scattering (CARS)—for early detection of P. tritici-repentis in wheat and for assessing the biochemical response to propiconazole treatment. The aim is to conceptualize a non-invasive diagnostic framework that supports precision agriculture and sustainable disease management.

2.2. Scope of the Study

This work is entirely theoretical. No laboratory experiments, field trials, or physical sample analyses were conducted. Instead, the study relies on the existing literature, known molecular interactions, and simulated spectral data to illustrate the potential of Raman-based diagnostics.

2.3. Nature of the Study

The methodology is conceptual and simulation-based. It does not involve experimental procedures or real biological samples.

2.4. Tan Spot Disease in Wheat: Understanding the Epidemic and Pesticide Application

Tan spot is a significant fungal disease affecting wheat crops worldwide, reducing yields and compromising grain quality. This epidemic spreads through P. tritici-repentis, a pathogen that thrives in humid conditions, leading to characteristic necrotic leaf lesions. Understanding the epidemiology of tan spot is crucial for effective management, as environmental factors, crop resistance, and pathogen virulence all play key roles in its spread.
Pesticide application remains a fundamental strategy in controlling tan spot, particularly with demethylation inhibitor (DMI) fungicides like propiconazole or prothioconazole, which disrupt fungal sterol biosynthesis. However, concerns about resistance development and environmental impact necessitate integrated disease management approaches, combining fungicide use with genetic resistance, crop rotation, and agronomic practices. We believe that advancing SERS-based (surface-enhanced Raman spectroscopy) detection methods can enhance precision monitoring, enabling early intervention for better disease control.
In the following sections, we will address critical issues related to this disease scenario and explore Raman spectroscopy as a potential solution for improved detection and management of P. tritici-repentis.

2.5. Critical Issue 1: Pyrenophora tritici-repentis, Inoculum Sources, Toxins, and Wheat Stages of Infection

Pyrenophora tritici-repentis produces both ascospores and conidia, which play crucial roles in its life cycle and infection process. Ascospores are a primary source of inoculum, especially during the initial stages of the growing season. They are ejected from pseudothecia and can infect wheat plants, contributing to the spread of tan spot disease. Conidia are produced on infected wheat tissues and can cause secondary infections. Airborne conidia play a significant role in the disease cycle by spreading the pathogen during the growing season. They are produced on infected tissues and can infect new plants, leading to the development of tan spot symptoms, with their numbers increasing significantly as temperatures rise [14,15,16].
In addition to fungal spores (ascospores and conidia) infection, P. tritici-repentis produces several host-selective toxins (HSTs) that are critical for its pathogenicity. The key toxins include, Ptr ToxA, Ptr ToxB, and Ptr ToxC.
Ptr ToxA is a necrotizing protein that causes damage and necrosis in sensitive wheat cultivars by entering mesophyll cells and localizing to chloroplasts [17]. The expression of ToxA increases significantly during infection [18]. Ptr ToxB and Ptr ToxC induce chlorosis by causing chlorophyll degradation in sensitive wheat genotypes [19,20]. Unlike Ptr ToxA and Ptr ToxB, the gene encoding Ptr ToxC has not been fully identified, although recent studies have made significant progress in understanding its genetic basis [21,22].
These proteinaceous effectors, e.g., Ptr ToxA, has been shown to be essential for causing necrosis in sensitive wheat genotypes [23], and this toxin interacts with specific host genes, leading to disease susceptibility [24]. But ToxA has also been found in other fungal wheat pathogens such as Parastagonospora nodorum and Bipolaris sorokiniana, indicating its horizontal transfer among species [25,26].

2.6. Critical Issue 2: The Role of Fungicide Application in Managing Pyrenophora tritici-repentis

According to Laribi et al., [22], P. tritici-repentis has been reported in all major wheat-growing regions, including North and South America, North and South Asia, Europe, and North Africa, and tan spot is increasingly gaining importance in the Mediterranean region, which is known as a major secondary center of durum wheat.
Research has shown that conservation agriculture and non-inversion tillage can significantly influence disease severity. Effective management of crop residues is crucial for reducing inoculum levels [27,28]. Additionally, implementing crop rotation and various tillage systems can help lower the inoculum load in the soil, thereby decreasing disease severity [29,30]. Moreover, warmer and more humid conditions may expand the geographic range of P. tritici-repentis, which increases the risk of tan spot disease in new areas. This disease manifests as tan necrosis and chlorosis on wheat leaves and requires early and effective fungicide application for control.
Apart from the foliar fungicides, seed treatment with pyraclostrobin and combinations of thiamethoxam, difenoconazole, mefenoxam, fludioxonil, and sedaxane have demonstrated reductions in tan spot severity by 15–20% and improvements in plant vigor and yield, but those have moderately reduced tan spot severity during early growth stages (15–20%) [31]. The use of seed treatment fungicides, such as Systiva®, has been shown to significantly reduce the infection rates of P. tritici-repentis. However, the effectiveness of these treatments can vary based on environmental conditions and the presence of natural sources of inoculum [28].
Furthermore, developing and planting resistant wheat cultivars is crucial for managing tan spot disease. Resistance can be influenced by genetic factors and environmental conditions, with some cultivars showing better performance under specific climate scenarios [22,32].
Pyrenophora tritici-repentis infection can occur at various wheat growth stages, from seedling to flag leaf. When tan spot and Septoria nodorum blotch (caused by Phaeosphaeria nodorum) occur together and cause infections on the flag or penultimate leaf, they can cause significant yield reductions, ranging from 18% to 31% [33].
Our observations regarding wheat stages of infection and fungicide application indicate that symptoms of tan spot can appear early, with initial signs of infection visible during the seedling stage. As mentioned earlier, seed treatment with fluxapyroxad fungicide may offer a solution. However, we need an effective technique to examine plant tissue for fungal mycelia and to verify the presence of fluxapyroxad fungicide.
As mentioned above, P. tritici-repentis produces necrotrophic effectors (NEs) that induce symptoms such as tan necrosis and chlorosis in susceptible wheat cultivars. These symptoms are critical for the pathogen’s virulence and can be observed early in the infection process [10,28]. Infection during the seedling stage can have a significant impact on plant growth and grain yield. Therefore, it is crucial to develop effective field techniques for identifying the pathogen’s ability to produce toxins that lead to necrosis and chlorosis, as this is a key factor in the progression of the disease.
The disease progresses as the wheat plants grow, with increased severity observed during the tillering stage [15]. The severity of infection on the flag leaf is also crucial and can lead to yield loss. During grain development, wheat heads can develop brown spots and mycelia, leading to shriveled seeds [16]. The pathogen can also infect kernels, causing red smudge and black point symptoms [34].
During the maturity stages of wheat growth, infected kernels may show signs of red smudge and black point. These symptoms are linked to the presence of detectable levels of catenarin and emodin, which are important mycotoxins produced by the fungus P. tritici-repentis. At this stage, the mycotoxins can negatively impact the quality and safety of the harvested grain [34].
The presence of P. tritici-repentis hyphae at various growth stages of wheat—specifically during the seedling stage, tillering stage, flag leaf stage, and maturity (kernels)—is crucial for production. This is due to two main factors: (i) the necrotrophic effectors that influence disease severity and (ii) the presence of mycotoxins such as emodin, catenarin, and islandicin, which contribute to the pathogen’s virulence and the symptoms observed in infected wheat [35]. There are various techniques to detect P. tritici-repentis hyphae and to study the roles of necrotrophic effectors and mycotoxins in the pathogenesis of tan spot disease in wheat; however, no single method is adequate on its own.
Effective fungicide applications are crucial for managing tan spot and mitigating yield losses. Various fungicides have been tested for their efficacy against P. tritici-repentis, with triazoles and strobilurins showing significant disease control. Fungicide treatments can reduce disease severity, improve plant vigor, and increase grain yield.
Effective management of tan spot in wheat requires a clear understanding of the roles played by necrotrophic effectors and mycotoxins produced by P. tritici-repentis, as well as the strategic application of effective fungicides. Various techniques have been implemented to improve fungicide management, ensuring sustainable crop protection while minimizing the risk of resistance development. However, no single method has proven sufficient for controlling the pathogen and managing fungicide effectively.

2.7. Critical Issue 3: Pyrenophora tritici-repentis, the Dilemma of Fungicide Use, and the Role of the Primary and Secondary Source of Inoculum

The use of fungicides to control tan spot in wheat, caused by P. tritici-repentis, is a common practice, but it presents several challenges. Fungicides such as azoxystrobin, propiconazole, and tebuconazole have been shown to significantly reduce yield losses attributed to tan spot [36,37,38]. However, the frequent application of these fungicides has led to the development of resistance in populations of P. tritici-repentis. For example, resistance to strobilurin fungicides has been reported in Argentina and Europe, with mutations such as G143A in the cytb gene being a common mechanism of resistance [38,39,40].
As mentioned above, the primary source of inoculum in P. tritici-repentis is typically the ascospores present in wheat debris, which can survive in the soil and infect new crops [28,41,42]. Continuous wheat cropping and reduced tillage practices can exacerbate this issue by increasing the amount of infected stubble left in the field, thereby raising inoculum levels [41,43].
To effectively manage both primary and secondary sources of the inoculum of P. tritici-repentis, it is essential to consider the timing and application of fungicides. Field experiments conducted in Australia have shown that single applications of fungicides made at 90% flag leaf emergence [36] or another field study research conducted in Greece showed that an application of propiconazole during the GS37/39 growth stage of wheat significantly reduces the impact of tan spot on wheat yield [37]. Field experiments conducted in Australia have demonstrated that a single application of fungicides made at 90% flag leaf emergence can be effective [36]. Additionally, a separate study in Greece found that applying propiconazole during the GS37/39 growth stage of wheat significantly reduces the impact of tan spot on wheat yield [37].
Additionally, our study conducted in Greece assessed the effectiveness of Systiva® (fluxapyroxad), indicating that treatments with Systiva® at doses of 125 cc and 150 cc per 100 kg of wheat seed significantly decreased the percentage of infected wheat plants by P. tritici repentis during the growth stages GS23-25 and GS30-31 [28].
While other fungicides, such as pyraclostrobin and combinations of thiamethoxam, difenoconazole, mefenoxam, fludioxonil, and sedaxane, have been effective in reducing the severity of tan spot [31], Systiva® has shown particularly promising results in field trials [28]. This success may be attributed to Systiva®’s ability to move upwards during the growth of wheat plants. This indicates that using fungicides is essential for controlling tan spot early, emphasizing the importance of evaluating their effectiveness. We believe that researchers, particularly agronomists, require an effective tool to estimate fungal development and detect the presence of fungicides in plant tissue.

2.8. Methodology Statement for Figure Creation

In this manuscript, we utilized figures designed by human knowledge with the assistance of AI. All figures were created through a collaborative process between the author (I. Vagelas) and Microsoft Copilot (Free) available on Edge, Windows, and Microsoft 365 web apps, as the rendering tool. All the figures presented are based on hypothetical data and do not represent real data. For all figures, Microsoft Copilot served exclusively as a technical rendering assistant. The intellectual framework, graphical narrative, and design coherence reflect the author’s personal scientific expertise and creative input. For example, the methodology followed for Figure 1 consisted of the following steps:
Scientific Content Definition: The author (Dr. Ioannis Vagelas) provided a structured and detailed textual description outlining the scientific components to be visualized. This included the laser–sample interaction, types of scattering (Stokes, anti-Stokes, Rayleigh), associated energy transitions, and the construction of a Raman intensity spectrum.
Sequential Panel Structuring: Based on the author’s instructions, the figure was organized into three panels:
  • Panel 1: Laser interaction with sample and scattered signal depiction;
  • Panel 2: Energy level transitions with Raman shift representations;
  • Panel 3: Raman spectrum with labeled peaks corresponding to the scattering types.
Creative Rendering via AI: Microsoft Copilot, functioning solely as a technical assistant, processed the instructions and generated the image according to the specified layout, color coding, directional arrows, and annotations provided by the author.
Intellectual Authorship and Control: The conceptual design, physical labeling, and educational structure of the diagram were entirely determined by the author. The AI acted only as a rendering tool without independent scientific input.
Overall, the AI system (Microsoft Copilot) served solely as a rendering assistant; all conceptual, structural, and scientific elements remain the intellectual property of the author. The scientific framework, figure composition, and educational strategy were exclusively developed by the author, who retains full authorship and control over the content.

2.9. No Laboratory Setup

Parameters such as laser exposure, power settings, and control samples are not applicable, as no physical instrumentation or sample testing was performed.

2.10. Comparative Analysis

While classical methods are acknowledged, this study does not include direct comparisons due to its theoretical nature. Future work may involve benchmarking Raman spectroscopy against conventional diagnostic techniques.

3. Theoretical Results and Simulated Insights

3.1. Principles of Raman Spectroscopy—Raman Parameters

3.1.1. Addressing the Study Objectives (Critical Issues 1–3) Through Raman Spectroscopy

Based on our experience and a thorough review of the existing literature, we propose Raman spectroscopy as a promising solution to the challenges posed in this manuscript. In the following sections, we will evaluate the effectiveness of this technique, focusing on its applications in both biological and chemical data analyses.

3.1.2. Fundamental Principles of Raman Spectroscopy

Raman scattering is a process where light interacts with a molecule and changes its energy due to vibrations in the material.
As Figure 1 shows, within the Raman scattering process, the interaction of the laser light (beam) with the medium (sample) implies the conservation of both energy and wave vector. The energy change corresponds to the creation of one phonon (Stokes process) or the destruction of one phonon (anti-Stokes process). Since Stokes scattering is stronger and more commonly observed, it is usually recorded in standard Raman spectroscopy. In each case, one vibrational quantum of energy (phonon) is gained or lost, so that the Stokes and anti-Stokes lines are equally shifted from the Rayleigh line [44]. Therefore, as the Stokes line is more intense than the anti-Stokes line, only the Stokes spectrum is generally recorded and analyzed in conventional Raman spectroscopy [44].
Raman spectroscopy is a powerful tool for analyzing plant tissues and fungal pathogens by examining energy exchange in Stokes and anti-Stokes scattering. The ratio of Stokes to anti-Stokes intensity can reflect temperature variations in plant tissues, which may indicate physiological changes, including possible fungal infections. Therefore, it is important to carefully interpret temperature based on Stokes/anti-Stokes ratios [45,46]. Moreover, Raman spectroscopy can identify biochemical alterations in plant tissues before visible symptoms appear, facilitating early pathogen detection or toxin(s) production. This technology is being explored for next-generation agriculture to monitor plant diseases more efficiently [47].
In addition to traditional Raman spectroscopy, surface-enhanced Raman spectroscopy (SERS) can significantly amplify signals, allowing for the detection of trace amounts of fungal pathogens. Recent studies have highlighted the use of machine learning alongside Raman spectroscopy to enhance the accuracy of pathogen detection [48].

3.2. Detection of Fungal Biomarkers Such as Ergosterol and Chitin via SERS

3.2.1. Raman Spectroscopy for Identifying Plant Pathogens and Diagnosing Diseases

Raman spectroscopy is increasingly being recognized as a valuable tool for identifying plant pathogens and diagnosing plant diseases. This technique has several advantages compared to traditional methods like PCR and ELISA, which can be time-consuming and destructive and require complicated sample preparation. In contrast, Raman spectroscopy enables the analysis of plant samples without causing any damage, making it ideal for in-field diagnostics [49,50].
Raman spectroscopy has proven to be an effective method for detecting living biological samples, achieving an accuracy of up to 97.5%. It is particularly adept at distinguishing closely related strains of bacteria, such as Xanthomonas oryzae pv. oryzae and X. oryzae pv. oryzicola [51]. This technique exhibits higher sensitivity in detecting diseases compared to traditional methods like quantitative PCR (qPCR), especially in the early stages of infection [51,52,53]. Additionally, Raman spectroscopy can be used to identify a wide range of pathogens, including bacteria, fungi, and viruses, across various plant species [49,50,51,54].
Raman spectroscopy has also been successfully used to differentiate between healthy wheat and wheat infected by viruses like the wheat streak mosaic virus (WSMV) and the barley yellow dwarf virus (BYDV) [49]. Additionally, Raman spectroscopy can identify fungal infections in crops such as wheat and sorghum, enabling early diagnosis and assisting in disease management [52]. Raman spectroscopy is a valuable tool for distinguishing between healthy and diseased plants, as well as for identifying specific pathogens. For instance, it has been effectively used to detect Huanglongbing (HLB) in citrus trees and various viral infections in wheat [49,53]. This technique is capable of identifying subtle biochemical changes in plants caused by pathogens, often before any visible symptoms appear. The high sensitivity of Raman spectroscopy allows for the early detection of diseases, which is essential for effective disease management [51,53,54].
Based on the information provided, we believe that Raman spectroscopy, along with its enhanced variants—surface-enhanced Raman spectroscopy (SERS) and coherent anti-Stokes Raman scattering (CARS) microscopy—are powerful tools for label-free imaging of biological samples, including plant tissues and plant pathogens. Further details on SERS and CARS microscopy are provided below.

3.2.2. Challenges of SERS vs. Raman Spectroscopy in Detecting Plant Fungal Pathogens

While both SERS and traditional Raman spectroscopy have their unique advantages and challenges, SERS stands out for its high sensitivity and rapid detection capabilities, making it particularly useful for detecting plant fungi. Studies indicate that SERS can detect extremely low concentrations of pathogens due to its signal enhancement mechanism, making it ideal for early-stage detection [55,56].
Many biological samples, including plant tissues, naturally exhibit fluorescence that can obscure Raman signals. Surface-enhanced Raman spectroscopy (SERS) addresses this issue by quenching the fluorescence [57]. SERS enables rapid detection without damaging the sample, which is essential for real-time monitoring in agriculture. Additionally, SERS provides highly specific spectral signatures, allowing for precise identification of pathogens [58].
Studies indicate that SERS is particularly valuable for applications where fluorescence interference is a problem or when detecting trace amounts of substances, such as in disease detection caused by fungi, bacteria, and viruses [59,60,61,62,63].
For pathogen detection in plants, SERS (surface-enhanced Raman spectroscopy) is generally the better choice over standard Raman spectroscopy.
  • Higher Sensitivity: SERS can detect extremely low concentrations of pathogens due to its signal enhancement mechanism, making it ideal for early-stage detection.
  • Overcomes Fluorescence Interference: Many biological samples, including plant tissues, exhibit fluorescence that can overwhelm Raman signals. SERS mitigates this issue by quenching fluorescence.
  • Rapid and Non-Destructive: SERS allows for fast detection without damaging the sample, which is crucial for real-time monitoring in agriculture.
  • Specific Molecular Fingerprinting: SERS provides highly specific spectral signatures, enabling precise identification of pathogens.
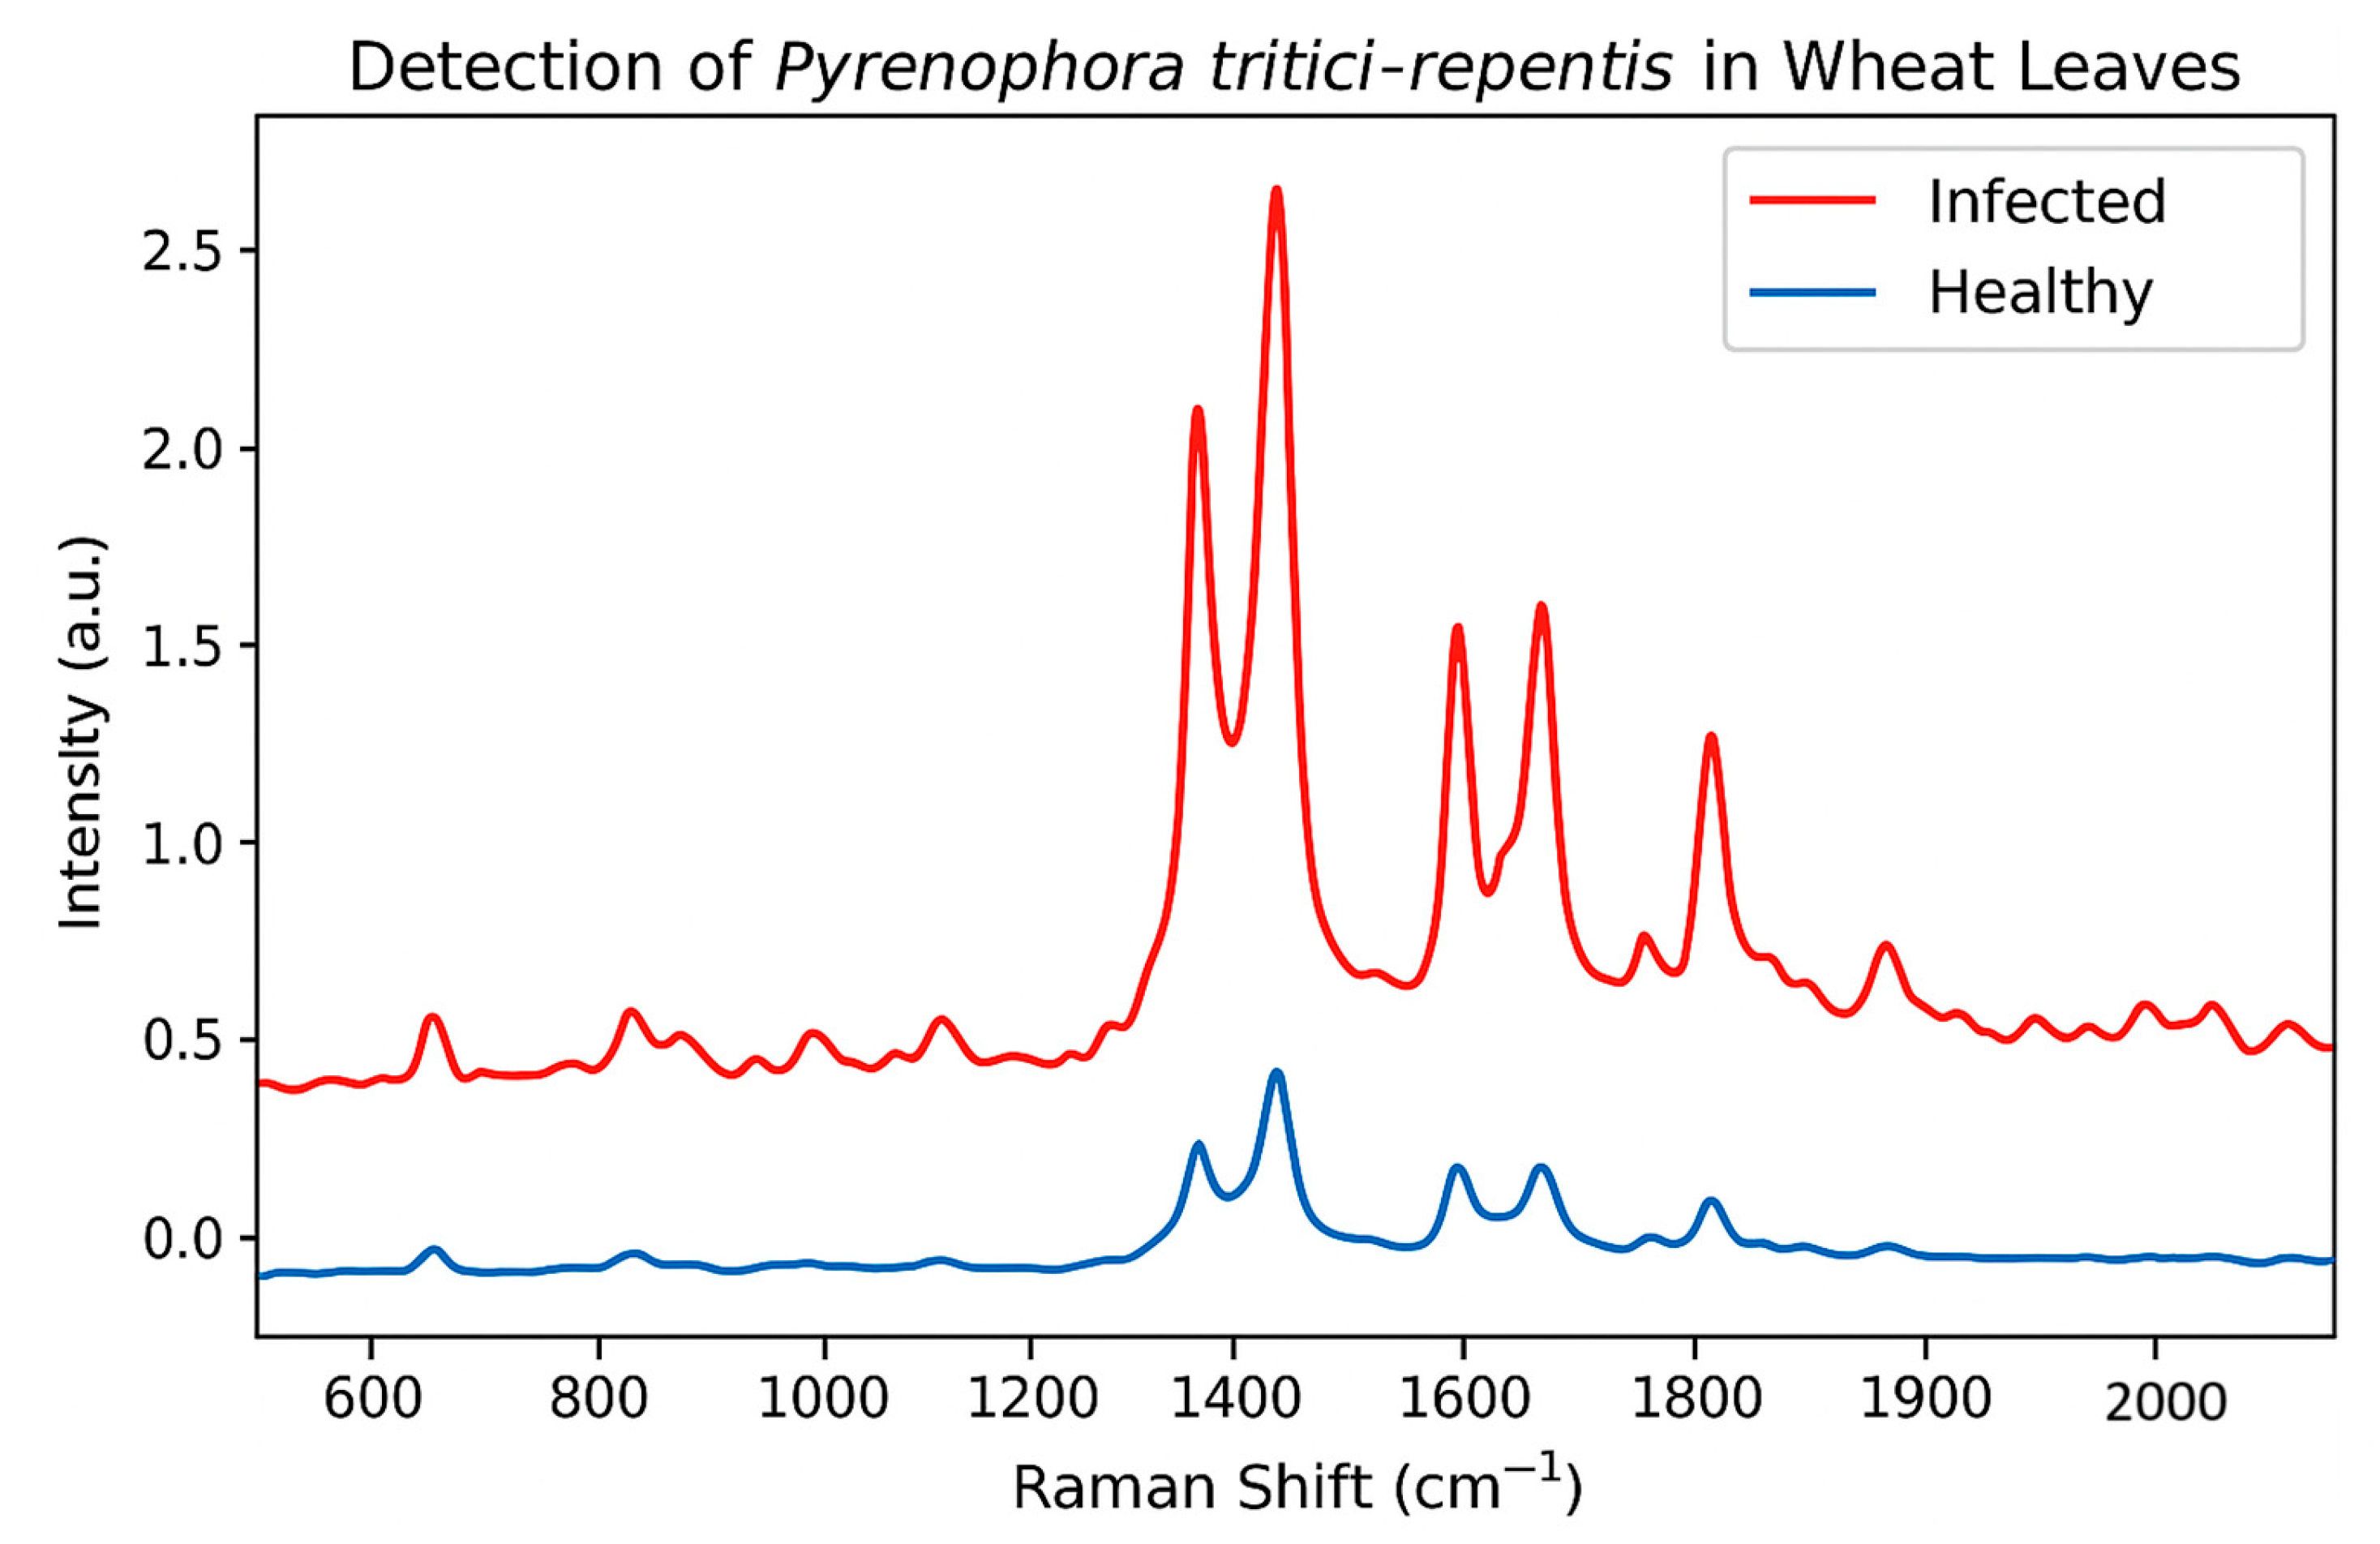
Below is a conceptual detection graph created using surface-enhanced Raman spectroscopy (SERS) data to differentiate between healthy and infected wheat leaves affected by P. tritici-repentis. The graph, designed in Copilot AI, plots Raman shifts (in cm−1) on the x-axis against intensity on the y-axis. Figure 2 illustrates that a spectral range of 400–1800 cm−1 was utilized, with infected leaves showing a distinct peak near 1370 cm−1 and 1450 cm−1, indicating the presence of a fungal biomarker. Two curves are presented: (i) healthy wheat leaves (blue curve) display a relatively smooth and featureless spectrum, with only minor peaks that reflect the normal chemical composition of the leaf tissues; and (ii) infected wheat leaves (red curve) show a pronounced peak around 1370 cm−1, which is identified as a significant fungal biomarker, along with several additional subtle peaks. These distinct features suggest the presence of a fungal pathogen, showing that SERS can be effectively used for early disease detection.

3.3. Coherent Anti-Stokes Raman Scattering (CARS)

3.3.1. Temperature Variations in Plant Tissues and Their Impact on Virulence Expression During Pathogen Infection

Accurate temperature measurements are crucial for understanding plant physiology and responses to environmental stress. The temperature of plant tissues can differ significantly from ambient air temperature, affecting growth and development processes [64]. Temperature variations in plant tissues are critical for understanding plant physiology, stress responses, and overall health. Our research indicates that pathogen attacks can lead to notable changes in the temperatures of plant tissues. For example, vine leaves infected with Phomopsis viticola and rose leaves infected with Podosphaera pannosa experienced temperature decreases of up to 1.6 °C and 1.1 °C, respectively, even before any visible symptoms emerged [65]. Similarly, elevated temperatures can significantly influence the severity of plant diseases. For instance, rice seedlings exposed to higher temperatures (35 °C) before pathogen inoculation exhibited accelerated tissue necrosis and increased fungal biomass compared to those exposed to lower temperatures (28 °C) [66]. Our previous research demonstrated that Raman spectroscopy can non-invasively detect plant pathogens by analyzing molecular changes and the physiological stress response in infected tissues [67].
Infrared thermography is capable of detecting temperature changes induced by disease at early stages, which allows for pre-symptomatic diagnosis and timely intervention. Similarly, coherent anti-Stokes Raman scattering (CARS) is a powerful technique used for various applications, including temperature measurements and chemical imaging in biological tissues. CARS is renowned for its non-intrusive nature, making it suitable for in situ measurements in harsh environments [68]. This characteristic is beneficial for studying temperature variations in delicate plant tissues without causing damage. CARS microscopy provides label-free vibrational imaging, delivering chemical maps of cells and tissues. This technique can identify the main chemical compounds in plant tissues, such as epicuticular waxes, which are crucial for understanding plant physiology and responses to environmental stress [69].
CARS microscopy is a valuable tool for tracking the movement and interactions of pathogens within plant tissues. It offers insights into how these pathogens invade and spread [70,71]. By visualizing the biochemical changes that occur in plant tissues during a pathogen attack, researchers can identify important defense molecules and pathways [70,72]. We believe that this information can assist in developing disease management strategies and improving the effectiveness of pesticides.

3.3.2. Coherent Anti-Stokes Raman Scattering (CARS) Spectroscopy: Principles and Applications

Coherent anti-Stokes Raman scattering (CARS) microscopy is a valuable tool for label-free imaging of biological samples, including plant tissues. It provides contrast via vibrational resonances of specific chemical bonds, which can be influenced by temperature changes [73,74]. CARS microscopy is extensively used for high-resolution, label-free imaging of biological samples, including living cells and tissues [71,75].
CARS (coherent anti-Stokes Raman scattering) enables real-time analysis using molecular vibrational spectroscopy without the necessity for external labels [76]. This technique is applied to investigate the chemical composition of complex samples in various fields, including biophysics, materials science, and medicine [76,77]. CARS microscopy offers label-free, non-invasive imaging of biological samples, making it valuable for real-time pathogen detection [70,78,79].
Coherent anti-Stokes Raman scattering (CARS) and quantitative polymerase chain reaction (qPCR) are both effective techniques for pathogen detection; however, they operate on fundamentally different principles and offer unique advantages. CARS microscopy is particularly strong in providing label-free, real-time imaging of biochemical changes in infected tissues. This makes it valuable for studying interactions between pathogens and their hosts [80,81], as well as for analyzing early-stage infections [70,79]. For example, this technology has been utilized to quickly detect waterborne pathogens, such as Cryptosporidium, at the single oocyst level [82]. This research demonstrates that bacteria can be identified at a single-cell level using spectral focusing on the C–H stretching region, with a total recording time of just 1 to 2 min. It suggests that hyperspectral coherent anti-Stokes Raman scattering (CARS) imaging could provide a mobile and cost-effective solution for in situ detection of bacteria and for studying bacterial activity. Early studies have shown that CARS has been successfully employed to detect bacterial spores, such as those of Bacillus anthracis, by targeting calcium dipicolinate, a major component of these spores [83]. Additionally, CARS has been applied to individual spores of fungi, like Aspergillus nidulans, enabling chemical mapping and differentiation between the cell wall and the cytoplasm [84].
Raman spectroscopy can identify pathogens at the single-cell level without the need for pre-enrichment, making it a valuable tool for early detection and quarantine inspections [85,86,87].
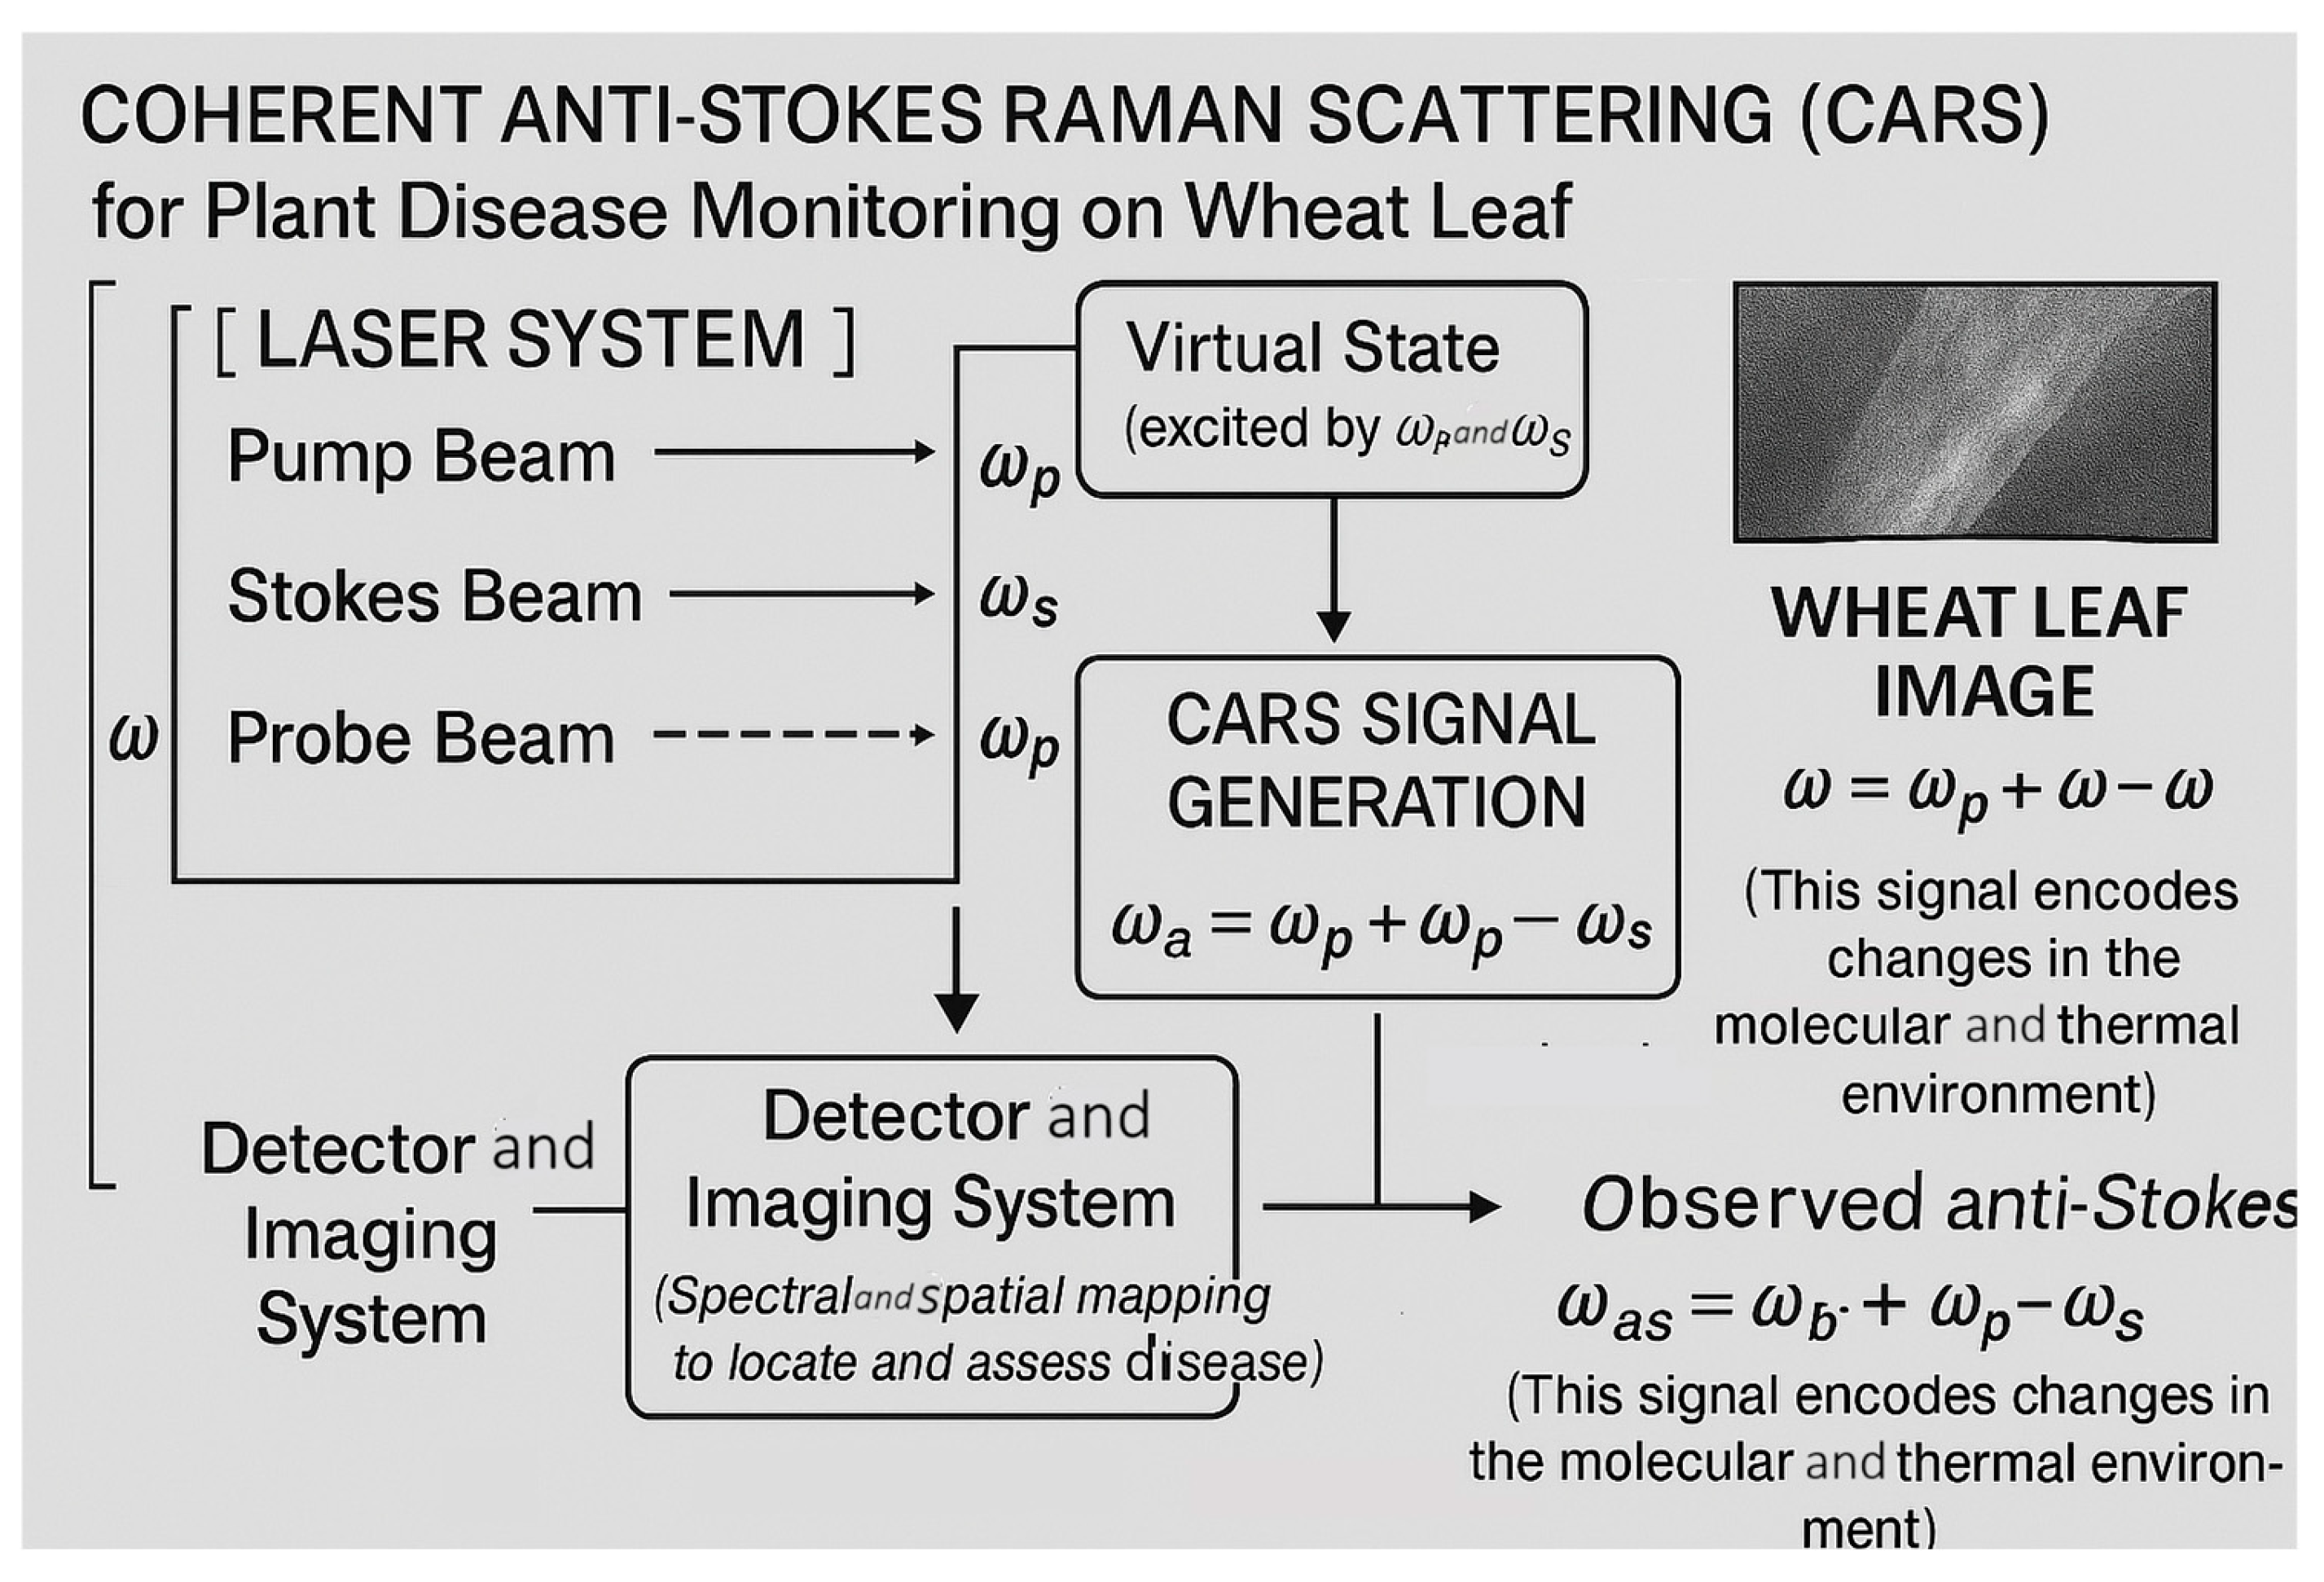
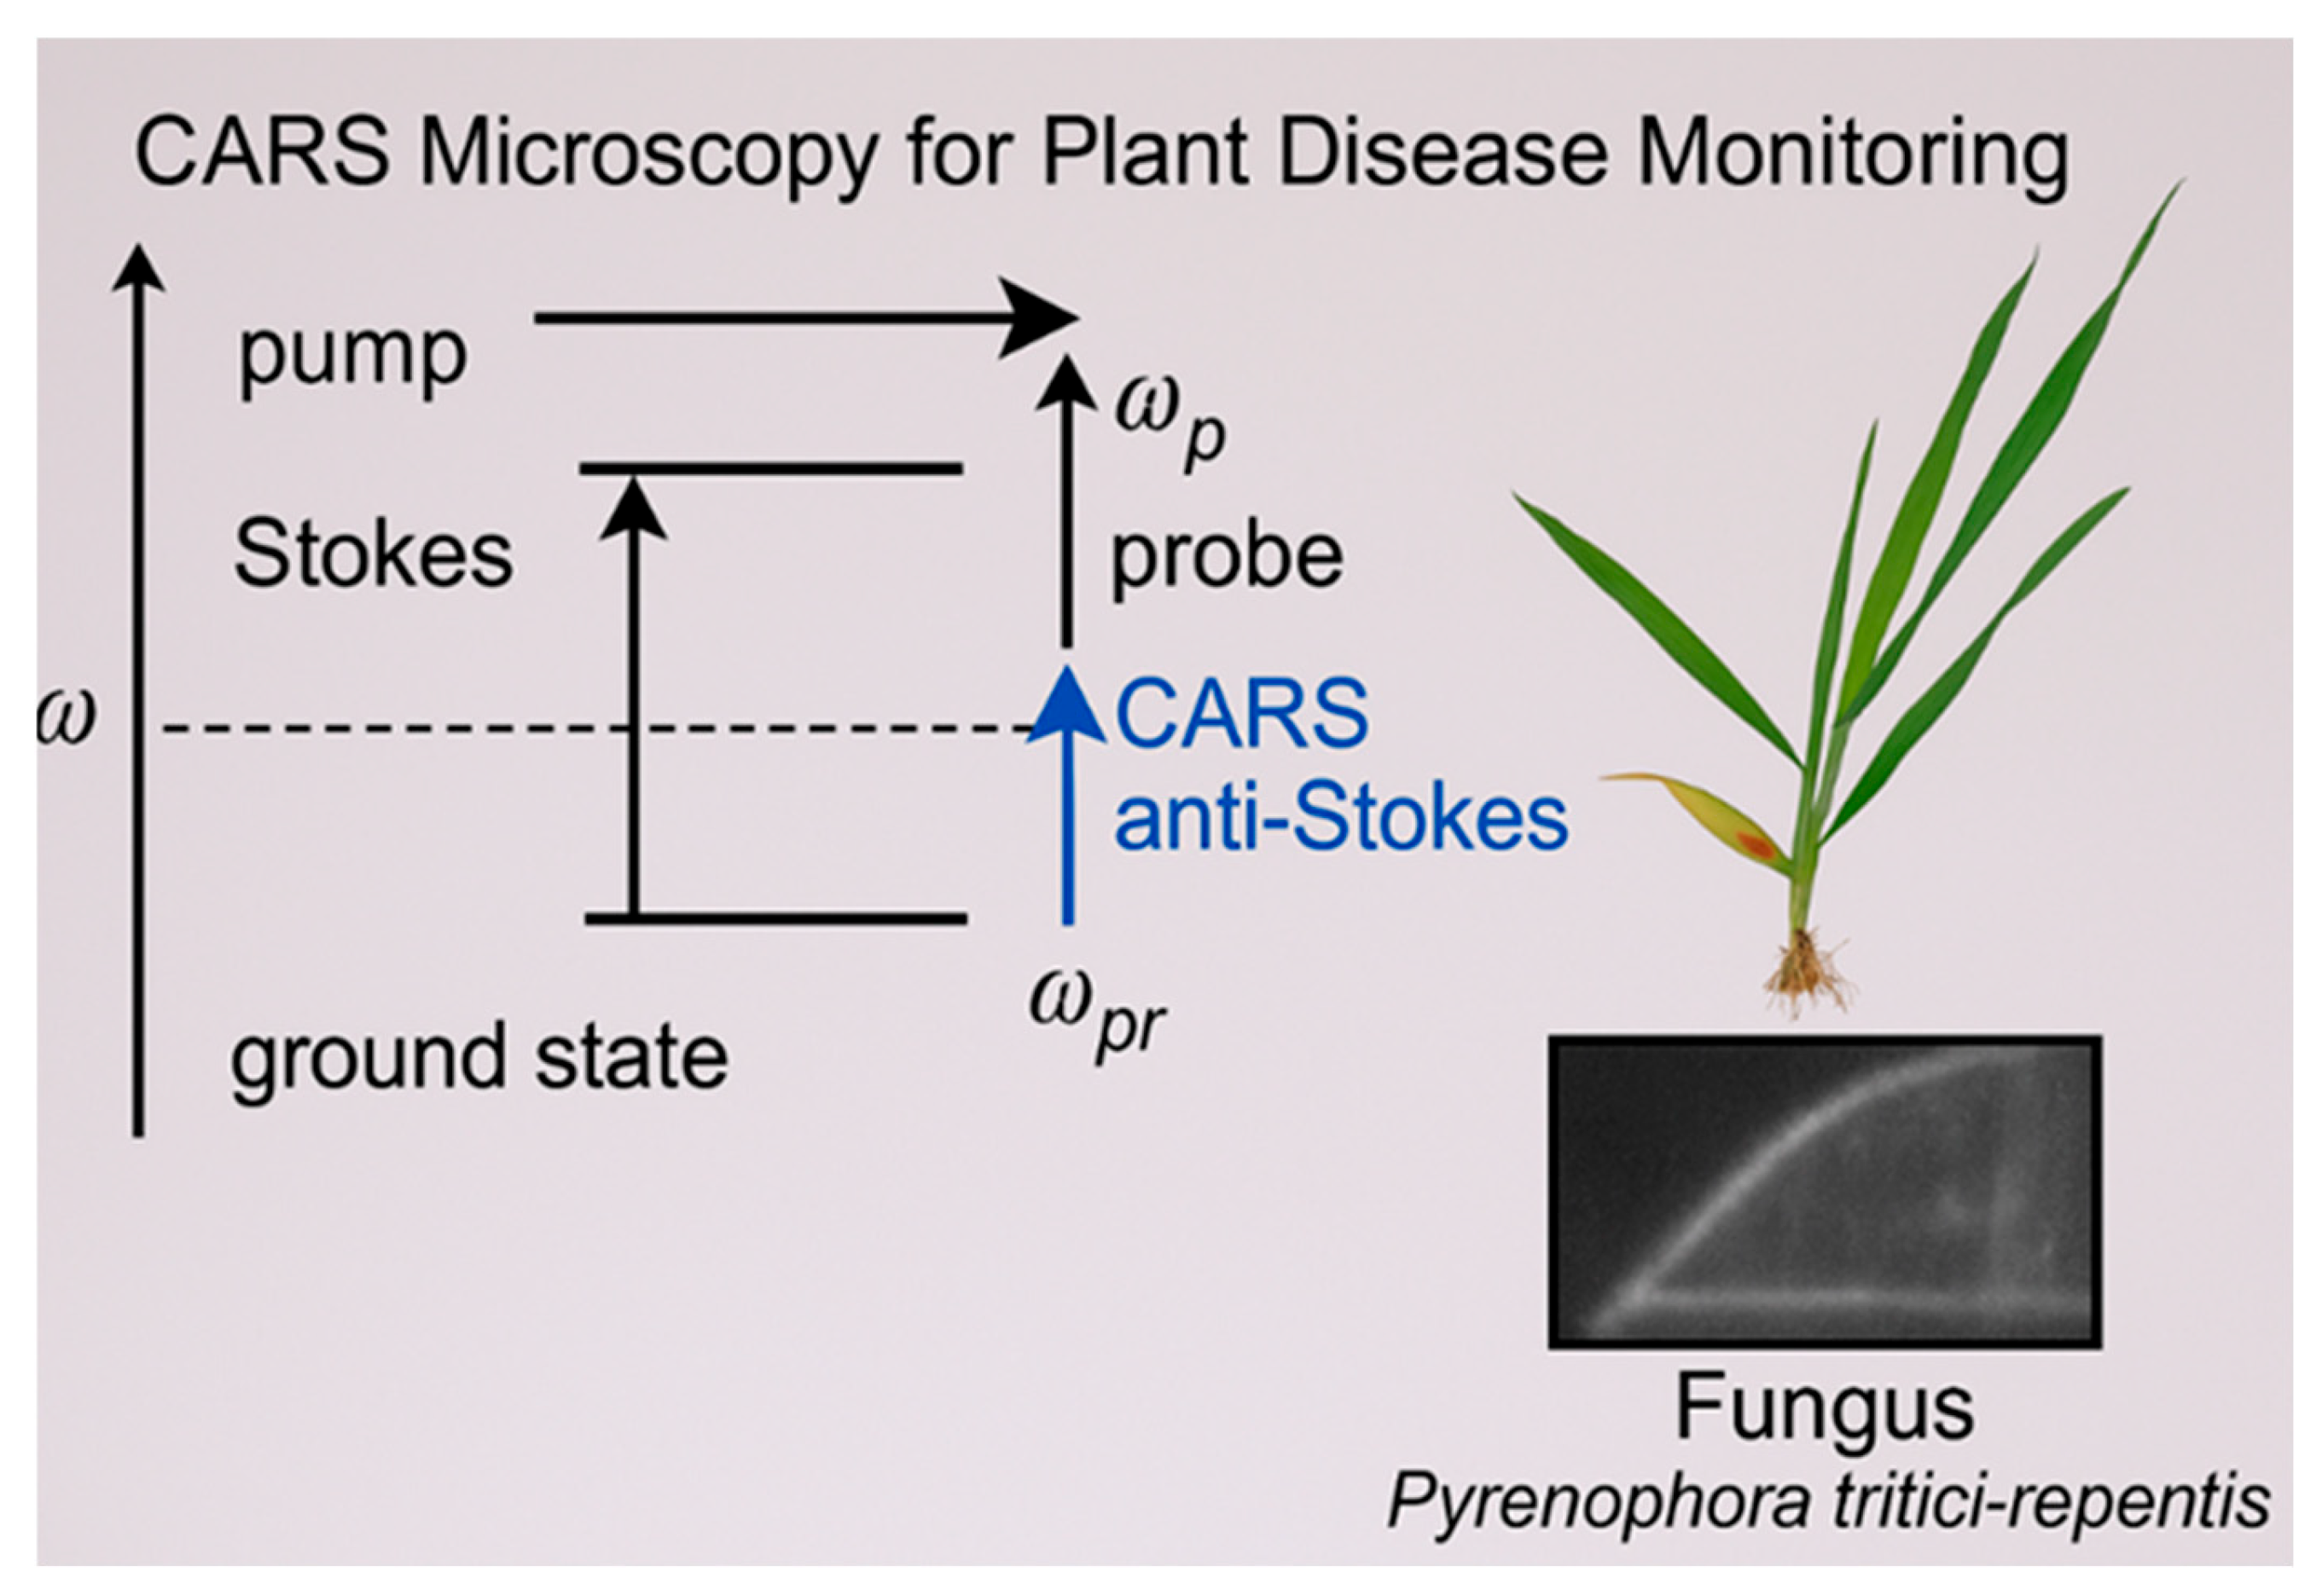
CARS relies on two laser beams—a pump beam (ωp, Figure 3) and a Stokes beam (ωs, Figure 3)—which are tuned to excite a specific molecular vibration in the sample (Raman spectroscopy uses a single laser beam). When these laser beams interact with the sample, they stimulate molecular vibrations that create a third, higher-energy signal called the anti-Stokes signal (blue-shifted in Figure 4). This anti-Stokes signal is significantly stronger than spontaneous Raman scattering, making CARS highly sensitive for detecting biochemical and structural changes in biological samples.
In Figure 4, we present a diagram of CARS Raman microscopy that clearly displays the ω labels and the complete anti-Stokes emission expression, ωpr + ωp − ωs. This provides a comprehensive overview of the CARS process for monitoring plant diseases. Figure 4 illustrates the principle of coherent anti-Stokes Raman scattering (CARS) microscopy used for plant disease monitoring, specifically detecting fungal infections like P. tritici-repentis.

3.4. Identification of Fungal Toxins and Effectors

Raman Spectroscopy for Detecting Fungal Toxins (Mycotoxins) and Effector Molecules

Raman spectroscopy, especially surface-enhanced Raman spectroscopy (SERS), has demonstrated great potential for detecting fungal toxins, known as mycotoxins, and their effectors. SERS is highly sensitive and specific, making it suitable for detecting mycotoxins at very low concentrations. For instance, SERS-based methods have been developed to detect deoxynivalenol (DON) and nivalenol (NIV) with high sensitivity [88].
The method enables rapid detection with minimal sample preparation, making it ideal for on-site analysis [89]. The development of portable SERS devices and inexpensive substrates has made it feasible to conduct on-site testing, which is crucial for real-time monitoring in agricultural settings [90].
The application of SERS in real-world scenarios, such as detecting mycotoxins in food samples and monitoring fungal contamination in agricultural products, demonstrates its practical utility and potential for widespread adoption [91].
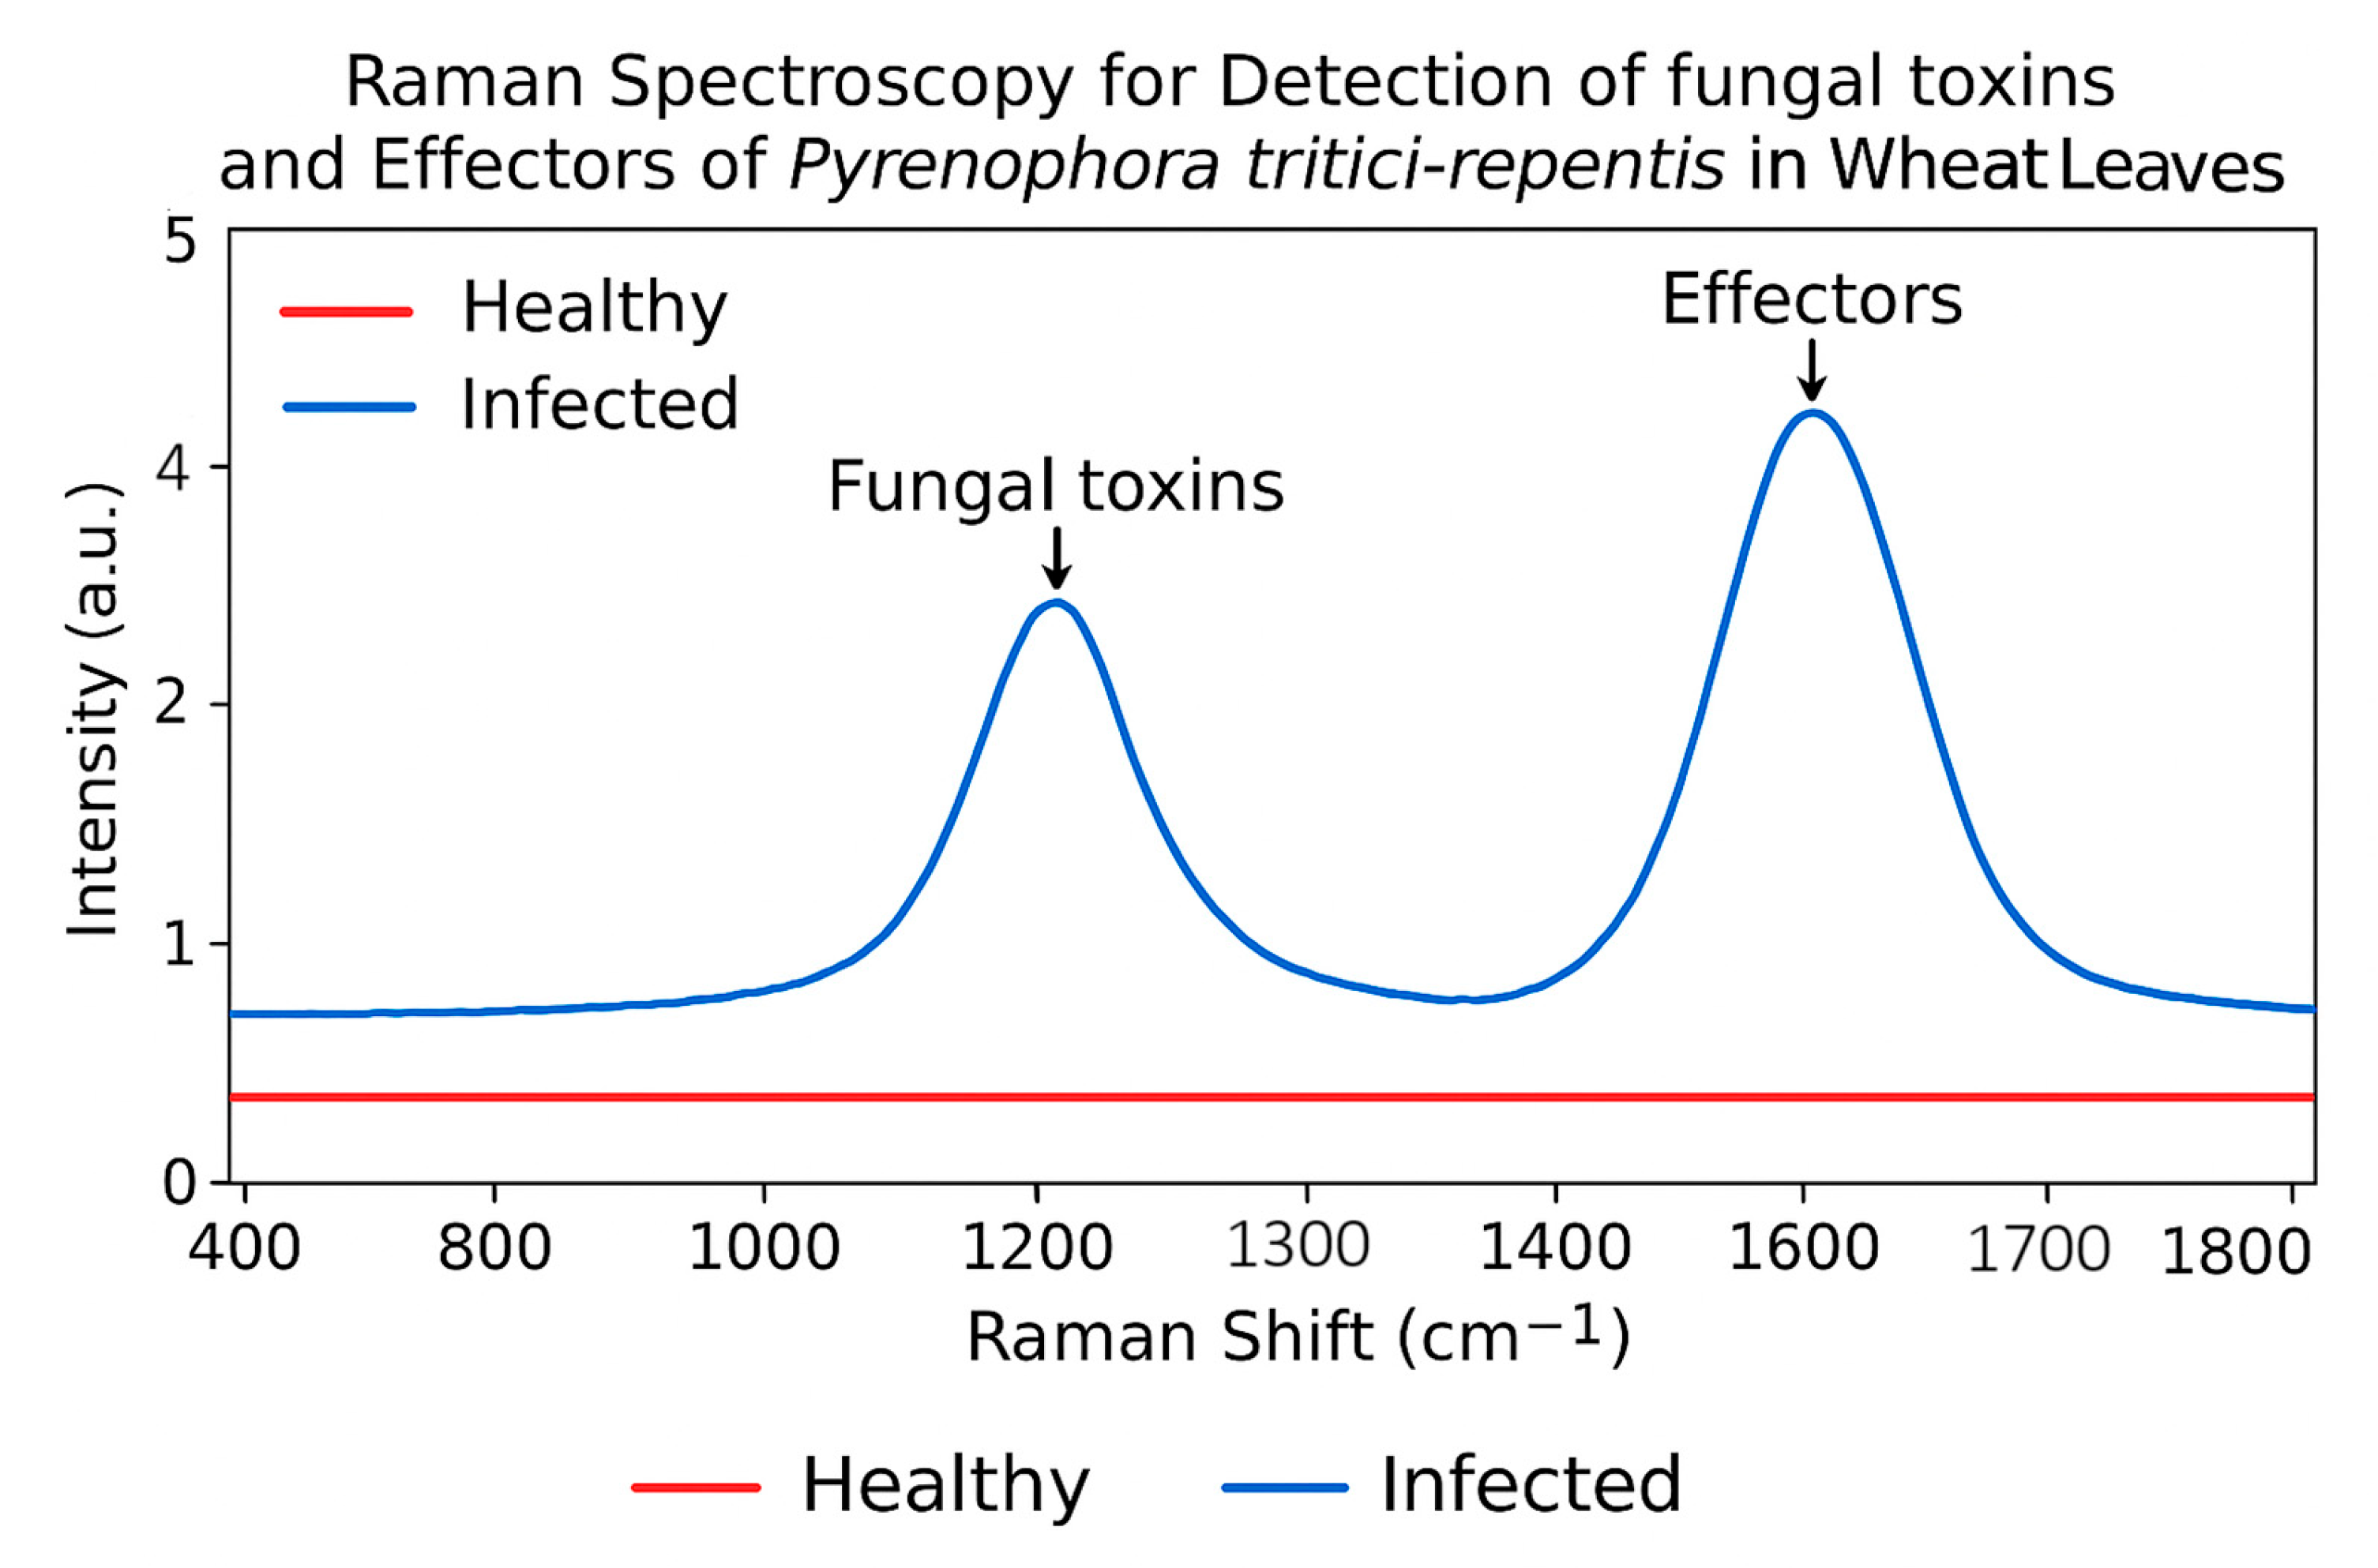
Below is a graph (Figure 5) made by Copilot AI, intended to illustrate how Raman spectroscopy can differentiate between healthy wheat leaves and those infected by P. tritici-repentis through the detection of fungal toxins and effectors. Figure 5 shows simulated Raman spectra comparing healthy (red) and infected (blue) wheat leaves. The infected spectrum shows distinct peaks near 1250 cm−1 and 1650 cm−1, corresponding to fungal toxins and effector molecules produced by Pyrenophora tritici-repentis. These spectral features are absent in healthy tissue, highlighting the diagnostic potential of Raman spectroscopy for early pathogen detection. These peaks are associated with fungal toxins and effectors. The x-axis (Raman shift in cm−1) ranges from 400 to 1800 cm−1, which corresponds to the vibrational modes of key biomolecules. The y-axis (Intensity in Arbitrary Units), clearly labeled on the left, indicates the intensity of the Raman signal.

3.5. Detection of Propiconazole via SERSRaman Spectroscopy and SERS for Fungicide Detection: Advances and Applications

Raman spectroscopy and its enhanced variant, surface-enhanced Raman spectroscopy (SERS), are powerful tools for detecting and analyzing fungicides in agricultural products. This technique (SERS) offers high sensitivity and specificity. SERS offers exceptional sensitivity and specificity for detecting fungicides such as imidacloprid, thiram, thiabendazole, and carbendazim [92,93,94,95,96,97].
SERS offers high sensitivity and specificity for detecting fungicides, even at very low concentrations, often in the parts per billion (ppb) range [96,98,99]. Research indicates that SERS can effectively identify characteristic peaks of triazole pesticides, such as myclobutanil and tebuconazole, with remarkable sensitivity and specificity [100]. This technique (SERS) can detect ultra-trace levels of analytes, making it suitable for monitoring pesticide residues in agricultural products [100,101,102], and is crucial for real-time monitoring and ensuring food safety [103,104]. Concerning the wheat crop, SERS has been applied to detect quinomethionate (6-methyl-1,3-dithiolo [4,5-b]quinoxalin-2-one) in wheat, with strong vibrational signals observed when adsorbed on a colloidal silver surface, even at very low concentrations [105].
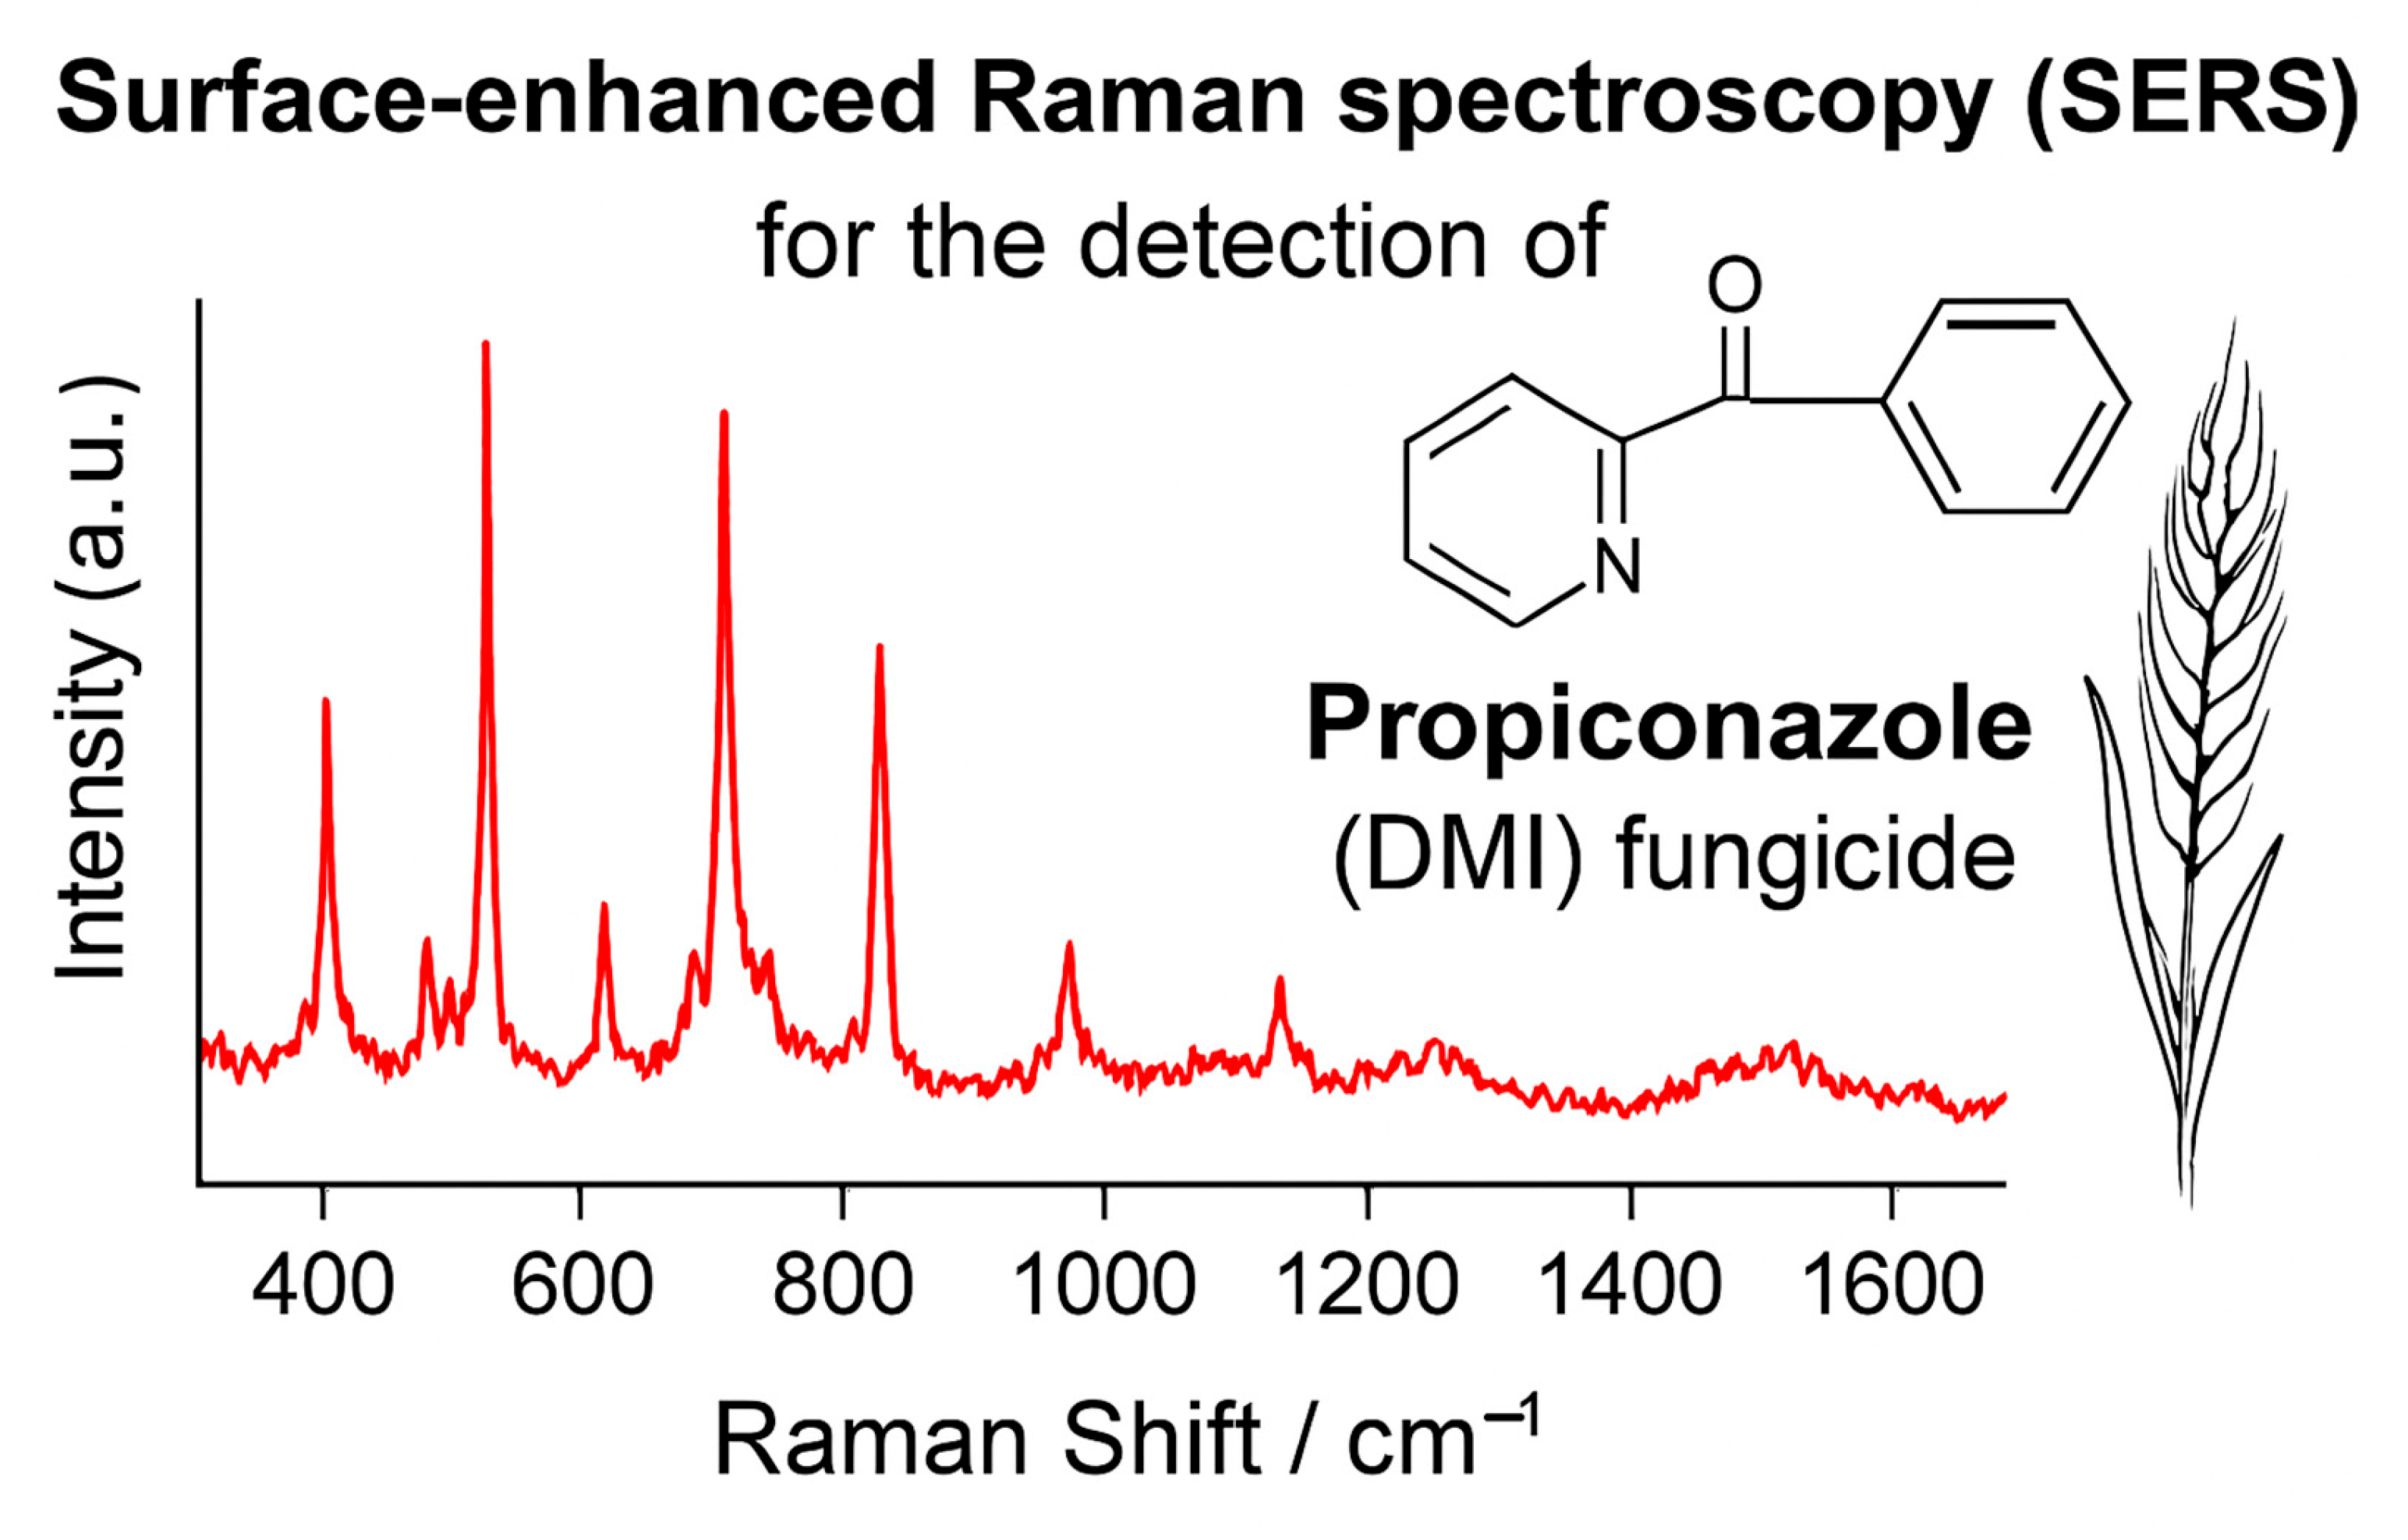
Below is a conceptual detection graph (Figure 6) illustrating the detection of the triazole fungicide propiconazole in wheat leaves using surface-enhanced Raman spectroscopy (SERS). Figure 6 shows a simulated Raman spectrum featuring the characteristic vibrational peaks of propiconazole, a demethylation inhibitor (DMI) fungicide. The graph compares untreated wheat leaves (control) with those treated with propiconazole. The spectrum covers the range of 400–1600 cm−1 and exhibits prominent peaks that reflect molecular features such as aromatic ring vibrations and C–N stretching.

3.5.1. Raman Spectroscopy for Detecting Fungicides, Fungal Growth, and Mycotoxins in Cereals

Raman spectroscopy offers a quick and non-destructive method for analyzing fungi, mycotoxins, and fungicides in cereals. This capability is essential for ensuring food safety and maintaining quality control [106]. Different fungi display unique Raman phenotypes, allowing for rapid and precise identification [86].
Concerning fungi, SERS has been used to detect various fungi in grain crops, including Aspergillus niger and Fusarium moniliforme, using colloidal Au nanoparticles. So, SERS enhances the Raman signal by using a roughened metallic substrate (typically silver or gold). The enhancement occurs due to localized surface plasmons, which amplify both the laser excitation and scattered radiation. This can increase sensitivity by factors as large as 1011, making it useful for detecting extremely low concentrations [107].
SERS, when combined with deep learning, has been utilized to detect mixed pesticides and fungicides on fruits, demonstrating high accuracy even with varying mixture ratios [101,102,108]. Furthermore, SERS has been applied to identify pesticide residues in crops [87,109] and has shown high sensitivity and accuracy in detecting pirimiphos-methyl residues and flumetsulam (a selective, systemic herbicide) in wheat [110,111].

3.5.2. Challenges of SERS and qPCR for Fungicides, Fungi and Mycotoxins Detection

Advanced analytical techniques, such as surface-enhanced Raman spectroscopy (SERS) and quantitative polymerase chain reaction (qPCR), have demonstrated significant potential for detecting various analytes, including fungicides, fungal pathogens, and mycotoxins. SERS provides rapid and label-free detection by utilizing the unique vibrational fingerprints of chemical compounds.
In contrast, quantitative PCR (qPCR) is known for its high specificity, as it can amplify very small amounts of nucleic acids to detect the presence of fungi and, indirectly, their associated toxins or virulence factors. However, qPCR faces several challenges, particularly in sample preparation and the presence of inhibitors commonly found in agricultural samples. If fungal cells are not completely lysed or if the extraction of target nucleic acids is inefficient, it can result in low template yields. This may lead to false negatives or an underestimation of pathogen load. Additionally, the design of primers must be carefully optimized to prevent cross-reactivity, especially in situations involving multiple targets. While qPCR is excellent for detecting the genetic material of pathogens, it has limitations in its use for quantifying fungicides.

4. Discussion

This article challenges the need for early detection in plant pathology. Rapid and accurate monitoring enables interventions at the very early stages of infection, which can significantly reduce the need for heavy pesticide use. For instance, advanced techniques like Raman spectroscopy, remote sensing using UAVs, and hyperspectral imaging are being developed to identify subtle biochemical and spectral changes in wheat leaves before visible symptoms emerge. These methods can indicate the presence of pathogens as well as environmental stress factors that interact with disease dynamics [30,112].
The simulated Raman spectra presented in this study demonstrates the conceptual feasibility of using vibrational spectroscopy—specifically SERS and CARS—for early detection of P. tritici-repentis and monitoring of propiconazole application in wheat crops.
While early detection helps identify incipient disease outbreaks, the simultaneous assessment of pesticide use is vital for sustainable management. Excessive or untimely application of fungicides can lead to environmental contamination, pesticide resistance, and disruption of beneficial organisms. Ongoing evaluation of fungicide efficacy—such as monitoring the performance of SDHI treatments—and correlating it with field detection results allows for an integrated strategy that minimizes chemical inputs while maximizing disease control. This balanced approach ensures that management strategies are both effective under stress conditions induced by climate change and aligned with eco-friendly practices [28].
The ability to differentiate infected from healthy tissues and detect fungicide presence through spectral signatures suggests that Raman-based diagnostics could offer a rapid, non-destructive alternative to conventional methods such as qPCR, ELISA, and GC-MS. These classical techniques, while accurate, often require extensive sample preparation, laboratory infrastructure, and longer turnaround times. In contrast, Raman spectroscopy—if validated through empirical studies—could enable real-time, in-field decision-making, reducing unnecessary pesticide use and improving disease management.
However, the current study is limited by its theoretical nature. No laboratory experiments were conducted, and the spectral data were generated through simulation and literature-based modeling. The figures are illustrative and were created collaboratively with Microsoft Copilot to visualize the proposed concept. As such, the results should be interpreted as a proof-of-concept rather than empirical evidence.
Climate change is reshaping the conditions in which crops grow. Warmer temperatures have altered rainfall patterns, and increased humidity can create more favorable conditions for fungal pathogens. In wheat, diseases like tan spot—caused by P. tritici-repentis—are expected to become more aggressive and widespread under these evolving climatic conditions. This increased disease pressure not only threatens yield and quality but also forces farmers into reactive and often extensive fungicide applications, intensifying environmental and human health concerns [30]. In this study, we adopted the scenario of P. tritici-repentis to evaluate and illustrate our hypothesis on early detection techniques.
Necrotrophic effectors play a crucial role in the pathogenesis of plant diseases caused by necrotrophic fungal pathogens. These pathogens kill host cells and derive nutrients from the dead or dying tissues, leading to significant economic losses in crop production [113,114]. Necrotrophic pathogens produce effectors that induce programmed cell death in host plants. This cell death is beneficial for necrotrophs, as it provides the necessary nutrients for their growth and proliferation [115]. These effectors can suppress plant immune responses, making the host more susceptible to infection. They often act redundantly on several plant targets, enhancing the pathogen’s ability to infect [115]. For P. tritici-repentis, these effectors, also known as host-selective toxins (HSTs), are crucial for the development of disease symptoms such as necrosis and chlorosis in wheat [116,117]. These effectors interact with specific host genes to induce disease symptoms, and their production and diversification are facilitated by genomic elements that provide the pathogen with a flexible and adaptive genetic landscape. Understanding these interactions and the underlying genetic mechanisms is crucial for developing effective disease management strategies in wheat [23,116,117,118].
Unlike biotrophic pathogens, necrotrophic pathogens utilize an “inverse gene-for-gene” interaction. In this process, effectors are recognized by specific dominant genes in the host, which leads to programmed cell death, thereby facilitating pathogen colonization [119]. Necrotrophic effectors are typically small, secreted proteins that can be internalized by host cells. They interact with host susceptibility factors, triggering cell death [120]. In addition to proteinaceous effectors, necrotrophic pathogens produce toxins and cell wall-degrading enzymes that enhance their virulence by breaking down plant tissues [121]. For P. tritici-repentis, the primary identified effectors are (i) Ptr ToxA, a proteinaceous toxin encoded by the ToxA gene; (ii) Ptr ToxB, a proteinaceous toxin encoded by the ToxB gene; and (iii) Ptr ToxC, a low-molecular-weight compound whose genetic basis is less understood. To study these necrotrophic effectors, several methods have been developed, including molecular techniques, genetic mapping, molecular cloning, and bioassays based on pathogen inoculation and culture filtrate. In this study, we introduce surface-enhanced Raman spectroscopy (SERS) as a high-sensitivity and essential method for studying necrotrophic effectors, which may exist in very low concentrations. SERS significantly enhances the Raman signal, enabling the detection of minute quantities of analytes, even down to the single-molecule level, such as DNA, proteins, or drugs [94]. This technique allows for rapid and straightforward analysis, making it suitable for real-time monitoring and high-throughput screening of molecules, including pathogens [122,123].
SERS enhances Raman scattering signals when molecules are adsorbed onto nanostructured metal surfaces, making it particularly effective for identifying low concentrations of fungicides [124]. This method is exceptionally adept at detecting fungicides in agricultural products. Its remarkable sensitivity and specificity enable the reliable identification of trace amounts of various fungicides, such as mancozeb and thiram [125,126]. Furthermore, it has been successfully used to quantify carbendazim residues in tobacco leaves [127].
Although both SERS and traditional Raman spectroscopy offer distinct advantages and challenges, SERS distinguishes itself with its exceptionally high sensitivity and rapid detection capabilities, which are particularly valuable for identifying plant fungi. Its signal enhancement mechanism allows for the detection of extremely low concentrations of pathogens, making it ideal for early-stage detection [55,56].
Many biological samples, particularly plant tissues, often show strong fluorescence that can mask Raman signals. Surface-enhanced Raman scattering (SERS) effectively addresses this issue by quenching fluorescence, allowing for rapid detection without harming the sample. This capability not only facilitates real-time monitoring in agricultural environments but also provides highly specific spectral signatures [128] for accurate pathogen identification [58,63,129].
Combining early detection techniques with real-time pesticide assessments enables farmers to respond before a disease outbreak escalates. In a world where climate change is increasing both the frequency and severity of plant diseases, these proactive strategies are crucial. They effectively address the need for disease control while minimizing chemical inputs, thus safeguarding both crop health and the environment. Here, we provide evidence that Raman spectroscopy detects vibrational modes of molecules within plant tissues. This method can identify biochemical changes at the molecular level, such as the presence of fungal toxins or stress-induced compounds. When combined with advanced data processing and machine learning, it allows for the swift identification of pathogens, such as P. tritici-repentis, even prior to any symptoms appearing.
Future research should focus on experimental validation using infected wheat samples, calibration of Raman instrumentation (e.g., laser wavelength, power, exposure time), and comparative analysis with established diagnostic methods. Field trials will also be essential to assess the robustness of Raman-based detection under variable environmental conditions.
This study highlights the advantages of an integrated approach that employs P. tritici-repentis infection to enhance the early detection of plant diseases through advanced technologies. It also promotes sustainable agriculture by optimizing the use of resources, such as DMI fungicides, while minimizing the negative effects of chemical applications.

5. Conclusions

Early detection technologies enable farmers and agronomists to take a proactive approach to agriculture. By utilizing spectroscopic techniques and real-time data analytics through Raman spectroscopy, these systems protect crop health while promoting sustainable and economically viable practices. This study presents a theoretical framework for using Raman spectroscopy—specifically SERS and CARS—as a non-invasive tool for early detection of Pyrenophora tritici-repentis in wheat and for monitoring fungicide application. Simulated spectral data suggests that Raman-based techniques can distinguish infected from healthy tissues and detect the presence of propiconazole with high sensitivity. These findings support the potential of Raman spectroscopy for precision agriculture and sustainable disease management.
The study is conceptual and does not include laboratory experiments, real sample analysis, or field validation. To validate the proposed framework, future research should include laboratory experiments using real wheat samples infected with P. tritici-repentis. Calibration of Raman instrumentation is essential, including laser wavelength, power, and integration time. A comparative analysis with classical diagnostic methods, such as qPCR, ELISA, and GC-MS, is necessary. Additionally, field trials should assess the practicality of Raman-based detection under varying environmental conditions. By focusing on these aspects, the conceptual model proposed here can develop into a strong and practical diagnostic tool for crop protection. We believe that the integration of these technologies is leading us toward a future where precision agriculture reduces environmental impacts, improves food security, and enhances ecosystem resilience through early pathogen detection and the efficient use of pesticides.

Funding

This work received no external funding.

Data Availability Statement

Not applicable.

Acknowledgments

Figures featured in this work were generated with the support of Microsoft Copilot (Free) available on Edge, Windows, guided by the author’s input, ideas and supervision. We appreciate the tool’s contribution to the visualization and refinement of graphical elements.

Conflicts of Interest

The author declares no conflicts of interest.

References

  1. Meena, A.K.; Varma, S.; Kumar, V.; Sharma, R. Impact of climate change on plant diseases and management strategies: A review. Int. J. Chem. Stud. 2020, 8, 2968–2973. [Google Scholar] [CrossRef]
  2. Lahlali, R.; Taoussi, M.; Laasli, S.-E.; Gachara, G.; Ezzouggari, R.; Belabess, Z.; Aberkani, K.; Assouguem, A.; Meddich, A.; El Jarroudi, M.; et al. Effects of climate change on plant pathogens and host-pathogen interactions. Crop Environ. 2024, 3, 159–170. [Google Scholar] [CrossRef]
  3. Ávila-Quezada, G.D.; Esquivel, J.F.; Silva-Rojas, H.V.; Leyva-Mir, S.G.; García-Ávila, C.D.; Noriega-Orozco, L.; Rivas-Valencia, P.; Ojeda-Barrios, D.L.; Castillo, A.M. Emerging plant diseases under a changing climate scenario: Threats to our global food supply. Emir. J. Food Agric. 2018, 30, 443–450. [Google Scholar] [CrossRef]
  4. Singh, B.K.; Delgado-Baquerizo, M.; Egidi, E.; Guirado, E.; Leach, J.E.; Liu, H.; Trivedi, P. Climate change impacts on plant pathogens, food security and paths forward. Nat. Rev. Microbiol. 2023, 21, 640–656. [Google Scholar] [CrossRef] [PubMed]
  5. Mironenko, N.V.; Baranova, O.A.; Kovalenko, N.M.; Mikhailova, L.A.; Rosseva, L.P. Genetic structure of the Russian populations of Pyrenophora tritici-repentis, determined by using microsatellite markers. Russ. J. Genet. 2016, 52, 771–779. [Google Scholar] [CrossRef]
  6. Kremneva, O.Y.; Mironenko, N.V.; Volkova, G.V.; Baranova, O.A.; Kim, Y.S.; Kovalenko, N.M. Resistance of winter wheat varieties to tan spot in the North Caucasus region of Russia. Saudi J. Biol. Sci. 2020, 28, 1787–1794. [Google Scholar] [CrossRef]
  7. Hýsek, J.; Vavera, R.; Růžek, P. Influence of temperature, precipitation, and cultivar characteristics on changes in the spectrum of pathogenic fungi in winter wheat. Int. J. Biometeorol. 2017, 61, 967–975. [Google Scholar] [CrossRef]
  8. Porras, R.; Miguel-Rojas, C.; Lorite, I.J.; Pérez-De-Luque, A.; Sillero, J.C. Characterization of Durum Wheat Resistance against Septoria Tritici Blotch under Climate Change Conditions of Increasing Temperature and CO2 Concentration. Agronomy 2023, 13, 2638. [Google Scholar] [CrossRef]
  9. See, P.T.; Moffat, C.S.; Morina, J.; Oliver, R.P. Evaluation of a Multilocus Indel DNA Region for the Detection of the Wheat Tan Spot Pathogen Pyrenophora tritici-repentis. Plant Dis. 2016, 100, 2215–2225. [Google Scholar] [CrossRef]
  10. Guo, J.; Shi, G.; Kalil, A.; Friskop, A.; Elias, E.M.; Xu, S.S.; Faris, J.D.; Liu, Z. Pyrenophora tritici-repentis race 4 isolates cause disease on tetraploid wheat. Phytopathology 2020, 110, 1781–1790. [Google Scholar] [CrossRef]
  11. Kumarbayeva, M.; Kokhmetova, A.; Kovalenko, N.; Atishova, M.; Keishilov, Z.; Aitymbetova, K. Characterization of Pyrenophora tritici-repentis (tan spot of wheat) races in Kazakhstan. Phytopathol. Mediterr. 2022, 16, 243–257. [Google Scholar] [CrossRef]
  12. Mangel, D.; Bruce, M.; Noller, J.R. Race Structure of Pyrenophora tritici-repentis in the Kansas wheat pathogen population. Plant Dis. 2024, 109, 1287–1293. [Google Scholar] [CrossRef] [PubMed]
  13. Vagelas, I. Effective Strategies for Managing Wheat Diseases: Mapping Academic Literature Utilizing VOSviewer and Insights from Our 15 Years of Research. Agrochemicals 2025, 4, 4. [Google Scholar] [CrossRef]
  14. Friesen, T.L.; Ali, S.; Stack, R.W.; Francl, L.J.; Rasmussen, J.B. Rapid and efficient production of the Pyrenophora tritici-repentis teleomorph. Can. J. Bot. 2003, 81, 890–895. [Google Scholar] [CrossRef]
  15. Duveiller, E.; Kandel, Y.R.; Sharma, R.C.; Shrestha, S.M. Epidemiology of foliar blights (spot blotch and tan spot) of wheat in the plains bordering the himalayas. Phytopathology 2005, 95, 248–256. [Google Scholar] [CrossRef]
  16. See, P.T.; Schultz, N.; Moffat, C.S. Evaluation of Pyrenophora tritici-repentis Infection of Wheat Heads. Agriculture 2020, 10, 417. [Google Scholar] [CrossRef]
  17. Manning, V.A.; Hardison, L.K.; Ciuffetti, L.M. Ptr ToxA interacts with a chloroplast-localized protein. Mol. Plant-Microbe Interact. 2007, 20, 168–177. [Google Scholar] [CrossRef]
  18. Mironenko, N.V.; Baranova, O.A.; Kovalenko, N.M. The role of the sexual process in preserving the alien translocation of the ToxA gene in the genome of Pyrenophora tritici-repentis. Mikol. Fitopatol. 2019, 53, 115–123. [Google Scholar] [CrossRef]
  19. Aboukhaddour, R.; Kim, Y.M.; Strelkov, S.E. RNA-mediated gene silencing of ToxB in Pyrenophora tritici-repentis. Mol. Plant Pathol. 2012, 13, 318–326. [Google Scholar] [CrossRef]
  20. Kaņeps, J.; Bankina, B.; Moročko-Bičevska, I. Virulence of Pyrenophora tritici-repentis: A minireview. Res. Rural Dev. 2021, 21–28. [Google Scholar] [CrossRef]
  21. Shi, G.; Kariyawasam, G.; Liu, S.; Leng, Y.; Zhong, S.; Ali, S.; Moolhuijzen, P.; Moffat, C.S.; Rasmussen, J.B.; Friesen, T.L.; et al. A conserved hypothetical gene is required but not sufficient for Ptr ToxC production in Pyrenophora tritici-repentis. Mol. Plant-Microbe Interact. 2022, 35, 336–348. [Google Scholar] [CrossRef]
  22. Laribi, M.; Yahyaoui, A.H.; Abdedayem, W.; Kouki, H.; Sassi, K.; Ben M’barek, S. Characterization of Mediterranean Durum Wheat for Resistance to Pyrenophora tritici-repentis. Genes 2022, 13, 336. [Google Scholar] [CrossRef]
  23. See, P.T.; Marathamuthu, K.A.; Iagallo, E.M.; Oliver, R.P.; Moffat, C.S. Evaluating the importance of the tan spot ToxA–Tsn1 interaction in Australian wheat varieties. Plant Pathol. 2018, 67, 1066–1075. [Google Scholar] [CrossRef]
  24. Ciuffetti, L.M.; Manning, V.A.; Pandelova, I.; Betts, M.F.; Martinez, J.P. Host-selective toxins, Ptr ToxA and Ptr ToxB, as necrotrophic effectors in the Pyrenophora tritici-repentis–wheat interaction. New Phytol. 2010, 187, 911–919. [Google Scholar] [CrossRef]
  25. Moolhuijzen, P.M.; See, P.T.; Oliver, R.P.; Moffat, C.S.; Wilson, R.A. Genomic distribution of a novel Pyrenophora tritici-repentis ToxA insertion element. PLoS ONE 2018, 13, e0206586. [Google Scholar] [CrossRef]
  26. See, P.T.; Iagallo, E.M.; Marathamuthu, K.A.; Wood, B.; Aboukhaddour, R.; Moffat, C.S. A New ToxA haplotype in the wheat fungal pathogen Bipolaris sorokiniana. Phytopathology 2024, 114, 1525–1532. [Google Scholar] [CrossRef] [PubMed]
  27. Jørgensen, L.; Olsen, L. Control of tan spot (Drechslera tritici-repentis) using cultivar resistance, tillage methods and fungicides. Crop. Prot. 2007, 26, 1606–1616. [Google Scholar] [CrossRef]
  28. Vagelas, I.; Cavalaris, C.; Karapetsi, L.; Koukidis, C.; Servis, D.; Madesis, P. Protective Effects of Systiva® Seed Treatment Fungicide for the Control of Winter Wheat Foliar Diseases Caused at Early Stages Due to Climate Change. Agronomy 2022, 12, 2000. [Google Scholar] [CrossRef]
  29. Carignano, M.; Staggenborg, S.A.; Shroyer, J.P. Management Practices to Minimize Tan Spot in a Continuous Wheat Rotation. Agron. J. 2008, 100, 145–153. [Google Scholar] [CrossRef]
  30. Reynoso, A.; Sautua, F.; Carmona, M.; Chulze, S.; Palazzini, J. Tan spot of wheat: Can biological control interact with actual management practices to counteract this global disease? Eur. J. Plant Pathol. 2023, 166, 27–38. [Google Scholar] [CrossRef]
  31. Bugingo, C.; Ali, S.; Yabwalo, D.; Byamukama, E. Optimizing Fungicide Seed Treatments for Early Foliar Disease Management in Wheat Under Northern Great Plains Conditions. Agronomy 2025, 15, 291. [Google Scholar] [CrossRef]
  32. Singh, P.K.; Singh, R.P.; Duveiller, E.; Mergoum, M.; Adhikari, T.B.; Elias, E.M. Genetics of wheat–Pyrenophora tritici-repentis interactions. Euphytica 2009, 171, 1–13. [Google Scholar] [CrossRef]
  33. Bhathal, J.; Loughman, R.; Speijers, J. Yield Reduction in Wheat in Relation to Leaf Disease From Yellow (tan) Spot and Septoria Nodorum Blotch. Eur. J. Plant Pathol. 2003, 109, 435–443. [Google Scholar] [CrossRef]
  34. Bouras, N.; Strelkov, S.E. The anthraquinone catenarin is phytotoxic and produced in leaves and kernels of wheat infected by Pyrenophora tritici-repentis. Physiol. Mol. Plant Pathol. 2008, 72, 87–95. [Google Scholar] [CrossRef]
  35. Bouras, N.; Holtz, M.D.; Aboukhaddour, R.; Strelkov, S.E. Influence of nitrogen sources on growth and mycotoxin production by isolates of Pyrenophora tritici-repentis from wheat. Crop J. 2016, 4, 119–128. [Google Scholar] [CrossRef]
  36. Colson, E.S.; Platz, G.J.; Usher, T.R. Fungicidal control of Pyrenophora tritici-repentis in wheat. Australas. Plant Pathol. 2003, 32, 241–246. [Google Scholar] [CrossRef]
  37. Vagelas, I. Important Foliar Wheat Diseases and their Management: Field Studies in Greece. Mod. Concepts Dev. Agron. 2021, 8, 783–786. [Google Scholar] [CrossRef]
  38. Kaņeps, J.; Bankina, B.; Moročko-Bičevska, I.; Apsīte, K.; Roga, A.; Fridmanis, D. Sensitivity Analysis of Pyrenophora tritici-repentis to Quinone-Outside Inhibitor and 14α-Demethylase Inhibitor Fungicides in Latvia. Pathogens 2024, 13, 1060. [Google Scholar] [CrossRef]
  39. Sautua, F.J.; Carmona, M.A. Detection and characterization of QoI resistance in Pyrenophora tritici-repentis populations causing tan spot of wheat in Argentina. Plant Pathol. 2021, 70, 2125–2136. [Google Scholar] [CrossRef]
  40. Sautua, F.J.; Carmona, M.A. Baseline sensitivity of QoI-resistant isolates of Pyrenophora tritici-repentis from Argentina to fenpicoxamid. Eur. J. Plant Pathol. 2022, 164, 583–591. [Google Scholar] [CrossRef]
  41. Bankina, B.; Bimšteine, G.; Arhipova, I.; Kaņeps, J.; Stanka, T. Importance of Agronomic Practice on the Control of Wheat Leaf Diseases. Agriculture 2018, 8, 56. [Google Scholar] [CrossRef]
  42. Bankina, B.; Bimšteine, G.; Arhipova, I.; Kaņeps, J.; Darguža, M. Impact of Crop Rotation and Soil Tillage on the Severity of Winter Wheat Leaf Blotches. Rural Sustain. Res. 2021, 45, 21–27. [Google Scholar] [CrossRef]
  43. Mazzilli, S.R.; Ernst, O.R.; de Mello, V.P.; Pérez, C.A. Yield losses on wheat crops associated to the previous winter crop: Impact of agronomic practices based on on-farm analysis. Eur. J. Agron. 2016, 75, 99–104. [Google Scholar] [CrossRef]
  44. Kauffmann, T.H.; Kokanyan, N.; Fontana, M.D. Use of Stokes and anti-Stokes Raman scattering for new applications. J. Raman Spectrosc. 2018, 50, 418–424. [Google Scholar] [CrossRef]
  45. Maher, R.C.; Cohen, L.F.; Le Ru, E.C.; Etchegoin, P.G. A study of local heating of molecules under surface enhanced raman scattering (SERS) conditions using the anti-Stokes/Stokes ratio. Faraday Discuss. 2006, 132, 77–83, discussion 85–94. [Google Scholar] [CrossRef] [PubMed]
  46. Herman, I.P. Peak temperatures from Raman Stokes/anti-Stokes ratios during laser heating by a Gaussian beam. J. Appl. Phys. 2011, 109, 016103. [Google Scholar] [CrossRef]
  47. Saletnik, A.; Saletnik, B.; Zaguła, G.; Puchalski, C. Raman Spectroscopy for Plant Disease Detection in Next-Generation Agriculture. Sustainability 2024, 16, 5474. [Google Scholar] [CrossRef]
  48. Farber, C.; Kurouski, D. Raman Spectroscopy and Machine Learning for Agricultural Applications: Chemometric Assessment of Spectroscopic Signatures of Plants as the Essential Step Toward Digital Farming. Front. Plant Sci. 2022, 13, 887511. [Google Scholar] [CrossRef]
  49. Farber, C.; Bryan, R.; Paetzold, L.; Rush, C.; Kurouski, D. Non-Invasive Characterization of Single-, Double- and Triple-Viral Diseases of Wheat With a Hand-Held Raman Spectrometer. Front. Plant Sci. 2020, 11, 01300. [Google Scholar] [CrossRef]
  50. Salbreiter, M.; Frempong, S.B.; Even, S.; Wagenhaus, A.; Girnus, S.; Rösch, P.; Popp, J. Lighting the Path: Raman Spectroscopy’s Journey Through the Microbial Maze. Molecules 2024, 29, 5956. [Google Scholar] [CrossRef]
  51. Ji, X.; Xue, J.; Shi, J.; Wang, W.; Zhang, X.; Wang, Z.; Lu, W.; Liu, J.; Fu, Y.V.; Xu, N. Noninvasive Raman spectroscopy for the detection of rice bacterial leaf blight and bacterial leaf streak. Talanta 2024, 282, 126962. [Google Scholar] [CrossRef]
  52. Egging, V.; Nguyen, J.; Kurouski, D. Detection and Identification of Fungal Infections in Intact Wheat and Sorghum Grain Using a Hand-Held Raman Spectrometer. Anal. Chem. 2018, 90, 8616–8621. [Google Scholar] [CrossRef] [PubMed]
  53. Sanchez, L.; Pant, S.; Mandadi, K.; Kurouski, D. Raman Spectroscopy vs Quantitative Polymerase Chain Reaction in Early Stage Huanglongbing Diagnostics. Sci. Rep. 2020, 10, 10101. [Google Scholar] [CrossRef] [PubMed]
  54. Weng, S.; Hu, X.; Wang, J.; Tang, L.; Li, P.; Zheng, S.; Zheng, L.; Huang, L.; Xin, Z. Advanced Application of Raman Spectroscopy and Surface-Enhanced Raman Spectroscopy in Plant Disease Diagnostics: A Review. J. Agric. Food Chem. 2021, 69, 2950–2964. [Google Scholar] [CrossRef] [PubMed]
  55. Ding, J.; Lin, Q.; Zhang, J.; Young, G.M.; Jiang, C.; Zhong, Y.; Zhang, J. Rapid identification of pathogens by using surface-enhanced Raman spectroscopy and multi-scale convolutional neural network. Anal. Bioanal. Chem. 2021, 413, 3801–3811. [Google Scholar] [CrossRef]
  56. Tahir, M.A.; Dina, N.E.; Cheng, H.; Valev, V.K.; Zhang, L. Surface-enhanced Raman spectroscopy for bioanalysis and diagnosis. Nanoscale 2021, 13, 11593–11634. [Google Scholar] [CrossRef]
  57. Wang, Y.; Zhang, Z.; Sun, Y.; Wu, H.; Luo, L.; Song, Y. Recent Advances in Surface-Enhanced Raman Scattering for Pathogenic Bacteria Detection: A Review. Sensors 2025, 25, 1370. [Google Scholar] [CrossRef]
  58. Kissell, L.N.; Liu, H.; Sheokand, M.; Vang, D.; Kachroo, P.; Strobbia, P. Direct Detection of Tobacco Mosaic Virus in Infected Plants with SERS-Sensing Hydrogels. ACS Sens. 2024, 9, 514–523. [Google Scholar] [CrossRef]
  59. Xia, J.; Li, W.; Sun, M.; Wang, H. Application of SERS in the Detection of Fungi, Bacteria and Viruses. Nanomaterials 2022, 12, 3572. [Google Scholar] [CrossRef]
  60. Liu, L.; Ma, W.; Wang, X.; Li, S. Recent Progress of Surface-Enhanced Raman Spectroscopy for Bacteria Detection. Biosensors 2023, 13, 350. [Google Scholar] [CrossRef]
  61. Liu, Y.; Su, G.; Wang, W.; Wei, H.; Dang, L. A novel multifunctional SERS microfluidic sensor based on ZnO/Ag nanoflower arrays for label-free ultrasensitive detection of bacteria. Anal. Methods 2024, 16, 2085–2092. [Google Scholar] [CrossRef]
  62. Yu, X.; Park, S.; Lee, S.; Joo, S.-W.; Choo, J. Microfluidics for disease diagnostics based on surface-enhanced raman scattering detection. Nano Converg. 2024, 11, 17. [Google Scholar] [CrossRef]
  63. Wang, X.; Liang, S.; Gan, Q.; Cai, B.; Liu, C. Current status and future perspectives of the diagnostic of plant bacterial pathogens. Front. Plant Sci. 2025, 16, 1547974. [Google Scholar] [CrossRef] [PubMed]
  64. Peña Quiñones, A.J.; Keller, M.; Salazar Gutierrez, M.R.; Khot, L.; Hoogenboom, G. Comparison between grapevine tissue temperature and air temperature. Sci. Hortic. 2019, 247, 407–420. [Google Scholar] [CrossRef]
  65. Vagelas, I.; Papadimos, A.; Lykas, C. Pre-Symptomatic Disease Detection in the Vine, Chrysanthemum, and Rose Leaves with a Low-Cost Infrared Sensor. Agronomy 2021, 11, 1682. [Google Scholar] [CrossRef]
  66. Onaga, G.; Wydra, K.D.; Koopmann, B.; Séré, Y.; von Tiedemann, A. Elevated temperature increases in planta expression levels of virulence related genes in Magnaporthe oryzae and compromises resistance in Oryza sativa cv. Nipponbare. Funct. Plant Biol. 2017, 44, 358–371. [Google Scholar] [CrossRef]
  67. Vagelas, I.; Manthos, I.; Sotiropoulos, T. Applications of Raman Microscopy/Spectroscopy-Based Techniques to Plant Disease Diagnosis. Appl. Sci. 2024, 14, 5926. [Google Scholar] [CrossRef]
  68. Eckbreth, A.C. Coherent Anti-Stokes Raman Spectroscopy (CARS). In Laser Diagnostics for Combustion Temperature and Species; Routledge: London, UK, 2022. [Google Scholar] [CrossRef]
  69. Weissflog, I.; Vogler, N.; Akimov, D.; Dellith, A.; Schachtschabel, D.; Svatos, A.; Boland, W.; Dietzek, B.; Popp, J. Toward in Vivo Chemical Imaging of Epicuticular Waxes. Plant Physiol. 2010, 154, 604–610. [Google Scholar] [CrossRef]
  70. Pezacki, J.P.; Blake, J.A.; Danielson, D.C.; Kennedy, D.C.; Lyn, R.K.; Singaravelu, R. Chemical contrast for imaging living systems: Molecular vibrations drive CARS microscopy. Nat. Chem. Biol. 2011, 7, 137–145. [Google Scholar] [CrossRef]
  71. Khmaladze, A.; Jasensky, J.; Zhang, C.; Han, X.; Ding, J.; Seeley, E.; Liu, X.; Smith, G.; Chen, Z. Hyperspectral microscopic imaging by multiplex coherent anti-Stokes Raman scattering (CARS). In Proceedings of the Optical Engineering + Applications, San Diego, CA, USA, 6 September 2011. [Google Scholar] [CrossRef]
  72. Li, S.; Li, Y.; Yi, R.; Liu, L.; Qu, J. Coherent Anti-Stokes Raman Scattering Microscopy and Its Applications. Front. Phys. 2020, 8, 598420. [Google Scholar] [CrossRef]
  73. Fu, Y.; Wang, H.; Huff, T.B.; Shi, R.; Cheng, J. Coherent anti-stokes Raman scattering imaging of myelin degradation reveals a calcium-dependent pathway in lyso-PtdCho-induced demyelination. J. Neurosci. Res. 2007, 85, 2870–2881. [Google Scholar] [CrossRef] [PubMed]
  74. Pelegati, V.B.; Kyotoku, B.B.C.; Padilha, L.A.; Cesar, C.L. Six-wave mixing coherent anti-Stokes Raman scattering microscopy. Biomed. Opt. Express 2018, 9, 2407–2417. [Google Scholar] [CrossRef] [PubMed]
  75. Patel, I.I.; Steuwe, C.; Reichelt, S.; Mahajan, S. Coherent anti-Stokes Raman scattering for label-free biomedical imaging. J. Opt. 2013, 15, 094006. [Google Scholar] [CrossRef]
  76. Evans, C.L.; Xie, X.S. Coherent anti-stokes raman scattering microscopy: Chemical imaging for biology and medicine. Annu. Rev. Anal. Chem. 2008, 1, 883–909. [Google Scholar] [CrossRef]
  77. Khmaladze, A.; Jasensky, J.; Price, E.; Zhang, C.; Boughton, A.; Han, X.; Seeley, E.; Liu, X.; Holl, M.M.B.; Chen, Z. Hyperspectral Imaging and Characterization of Live Cells by Broadband Coherent Anti-Stokes Raman Scattering (CARS) Microscopy with Singular Value Decomposition (SVD) Analysis. Appl. Spectrosc. 2014, 68, 1116–1122. [Google Scholar] [CrossRef]
  78. Murugkar, S.; Evans, C.; Xie, X.; Anis, H. Chemically specific imaging of cryptosporidium oocysts using coherent anti-Stokes Raman scattering (CARS) microscopy. J. Microsc. 2009, 233, 244–250. [Google Scholar] [CrossRef]
  79. Wu, F.; Li, S.; Chen, X.; Yue, S.; Hong, W.; Wang, P. High-Sensitive and Background-Free Coherent Anti-Stokes Raman Scattering Microscopy Using Delay Modulation. Laser Photonics Rev. 2024, 18, 2300827. [Google Scholar] [CrossRef]
  80. Underwood, W.; Koh, S.; Somerville, S.C. Visualizing cellular dynamics in plant-microbe interactions using fluorescent-tagged proteins. Methods Mol. Biol. 2011, 712, 283–291. [Google Scholar] [CrossRef]
  81. Naemat, A.; Sinjab, F.; McDonald, A.; Downes, A.; Elfick, A.; Elsheikha, H.M.; Notingher, I. Visualizing the interaction of Acanthamoeba castellanii with human retinal epithelial cells by spontaneous Raman and CARS imaging. J. Raman Spectrosc. 2018, 49, 412–423. [Google Scholar] [CrossRef]
  82. Hong, W.; Liao, C.; Zhao, H.; Younis, W.; Zhang, Y.; Seleem, M.N.; Cheng, J. In situ Detection of a Single Bacterium in Complex Environment by Hyperspectral CARS Imaging. ChemistrySelect 2016, 1, 513–517. [Google Scholar] [CrossRef]
  83. Petrov, G.I.; Yakovlev, V.V.; Sokolov, A.V.; Scully, M.O. Detection of Bacillus subtilis spores in water by means of broadband coherent anti-Stokes Raman spectroscopy. Opt. Express 2005, 13, 9537–9542. [Google Scholar] [CrossRef] [PubMed]
  84. Strycker, B.D.; Han, Z.; Commer, B.; Shaw, B.D.; Sokolov, A.V.; Scully, M.O. CARS spectroscopy of Aspergillus nidulans spores. Sci. Rep. 2019, 9, 1789. [Google Scholar] [CrossRef] [PubMed]
  85. Gan, Q.; Wang, X.; Wang, Y.; Xie, Z.; Tian, Y.; Lu, Y. Culture-Free Detection of Crop Pathogens at the Single-Cell Level by Micro-Raman Spectroscopy. Adv. Sci. 2017, 4, 1700127. [Google Scholar] [CrossRef] [PubMed]
  86. Wang, H.; Liu, M.; Zhao, H.; Ren, X.; Lin, T.; Zhang, P.; Zheng, D. Rapid detection and identification of fungi in grain crops using colloidal Au nanoparticles based on surface-enhanced Raman scattering and multivariate statistical analysis. World J. Microbiol. Biotechnol. 2022, 39, 26. [Google Scholar] [CrossRef]
  87. Wang, X.; Ai, S.; Xiong, A.; Zhou, W.; He, L.; Teng, J.; Geng, X.; Wu, R. SERS combined with QuEChERS using NBC and Fe3O4 MNPs as cleanup agents to rapidly and reliably detect chlorpyrifos pesticide in citrus. Anal. Methods 2023, 15, 6266–6274. [Google Scholar] [CrossRef]
  88. Lian, S.; Li, X.; Lv, X. A Novel SERS Label-Free Sensing Strategy for DON and NIV: A DFT Study on the Interaction between DON/NIV and Ag/Au. Langmuir 2024, 40, 20954–20965. [Google Scholar] [CrossRef]
  89. Rodriguez, R.S.; Szlag, V.M.; Reineke, T.M.; Haynes, C.L. Multiplex surface-enhanced Raman scattering detection of deoxynivalenol and ochratoxin A with a linear polymer affinity agent. Mater. Adv. 2020, 1, 3256–3266. [Google Scholar] [CrossRef]
  90. Alieva, R.; Sokolova, S.; Zhemchuzhina, N.; Pankin, D.; Povolotckaia, A.; Novikov, V.; Kuznetsov, S.; Gulyaev, A.; Moskovskiy, M.; Zavyalova, E. A Surface-Enhanced Raman Spectroscopy-Based Aptasensor for the Detection of Deoxynivalenol and T-2 Mycotoxins. Int. J. Mol. Sci. 2024, 25, 9534. [Google Scholar] [CrossRef]
  91. Lin, X.; Yu, W.; Tong, X.; Li, C.; Duan, N.; Wang, Z.; Wu, S. Application of Nanomaterials for Coping with Mycotoxin Contamination in Food Safety: From Detection to Control. Crit. Rev. Anal. Chem. 2022, 54, 355–388. [Google Scholar] [CrossRef]
  92. Ma, C.-H.; Zhang, J.; Hong, Y.-C.; Wang, Y.-R.; Chen, X. Determination of carbendazim in tea using surface enhanced Raman spectroscopy. Chin. Chem. Lett. 2015, 26, 1455–1459. [Google Scholar] [CrossRef]
  93. Chen, C.; Liu, W.; Tian, S.; Hong, T. Novel Surface-Enhanced Raman Spectroscopy Techniques for DNA, Protein and Drug Detection. Sensors 2019, 19, 1712. [Google Scholar] [CrossRef]
  94. Chen, X.; Lin, M.; Sun, L.; Xu, T.; Lai, K.; Huang, M.; Lin, H. Detection and quantification of carbendazim in Oolong tea by surface-enhanced Raman spectroscopy and gold nanoparticle substrates. Food Chem. 2019, 293, 271–277. [Google Scholar] [CrossRef]
  95. Kulakovich, O.S.; Matsukovich, A.S.; Trotsiuk, L.L. Challenges in surface-enhanced Raman scattering detection of pesticide carbendazim and ways to overcome. J. Nanophotonics 2022, 16, 046002. [Google Scholar] [CrossRef]
  96. Yan, D.; Ma, C.; Jing, X.; Zhang, J.; Qian, R.; Chen, L. Effects of aggregating agents on the surface-enhanced Raman spectroscopic detection of carbendazim. In Proceedings of the Fifteenth International Conference on Information Optics and Photonics (CIOP 2024), Xi’an, China, 11–15 August 2024. [Google Scholar] [CrossRef]
  97. Oliveira, M.J.d.S.; Ruiz, G.C.M.; Rubira, R.J.G.; Sanchez-Cortes, S.; Constantino, C.J.L.; Furini, L.N. Consequences of Surface Composition and Aggregation Conditions of Ag Nanoparticles on Surface-Enhanced Raman Scattering (SERS) of Pesticides. Chemosensors 2025, 13, 13. [Google Scholar] [CrossRef]
  98. Song, J.; Chen, Z.-P.; Jin, J.-W.; Chen, Y.; Yu, R.-Q. Quantitative surface-enhanced Raman spectroscopy based on the combination of magnetic nanoparticles with an advanced chemometric model. Chemom. Intell. Lab. Syst. 2014, 135, 31–36. [Google Scholar] [CrossRef]
  99. Sivaraj, S.; Ramasamy, P.; Sathe, V.; Mahalingam, U. Synergistic Effects of plasmonic and semiconductor nanoparticles on graphene oxide for thiodicarb pesticide detection and Detoxification. Appl. Surf. Sci. 2025, 689, 162469. [Google Scholar] [CrossRef]
  100. Li, J.; Cheng, J.; Du, J.; Xiao, M.; Wang, M.; Wang, J.; She, Y.; El-Aty, A.A.; Cao, X. Detection of myclobutanil and tebuconazole in apple using magnetic molecularly imprinted polymer surface-enhanced Raman spectroscopy. J. Food Compos. Anal. 2024, 133, 106380. [Google Scholar] [CrossRef]
  101. Chen, Z.; Dong, X.; Liu, C.; Wang, S.; Dong, S.; Huang, Q. Rapid detection of residual chlorpyrifos and pyrimethanil on fruit surface by surface-enhanced Raman spectroscopy integrated with deep learning approach. Sci. Rep. 2023, 13, 19855. [Google Scholar] [CrossRef]
  102. Chen, Z.; Tan, R.; Zeng, M.; Yuan, X.; Zhuang, K.; Feng, C.; He, Y.; Luo, X. SERS detection of triazole pesticide residues on vegetables and fruits using Au decahedral nanoparticles. Food Chem. 2023, 439, 138110. [Google Scholar] [CrossRef]
  103. Ouyang, L.; Ren, W.; Zhu, L.; Irudayaraj, J. Prosperity to challenges: Recent approaches in SERS substrate fabrication. Rev. Anal. Chem. 2017, 36, 20160027. [Google Scholar] [CrossRef]
  104. Lin, T.; Song, Y.-L.; Liao, J.; Liu, F.; Zeng, T.-T. Applications of surface-enhanced Raman spectroscopy in detection fields. Nanomedicine 2020, 15, 2971–2989. [Google Scholar] [CrossRef]
  105. Kim, M.; Kang, J.; Park, S.; Lee, M. Surface-enhanced Raman spectroscopy of quinomethionate adsorbed on silver colloids. Bull. Korean Chem. Soc. 2003, 24, 633–637. [Google Scholar] [CrossRef]
  106. Sun, Y.; Zheng, X.; Wang, H.; Yan, M.; Chen, Z.; Yang, Q.; Shao, Y. Research advances of SERS analysis method based on silent region molecules for food safety detection. Microchim. Acta 2023, 190, 387. [Google Scholar] [CrossRef] [PubMed]
  107. Camden, J.P.; Dieringer, J.A.; Wang, Y.; Masiello, D.J.; Marks, L.D.; Schatz, G.C.; Van Duyne, R.P. Probing the structure of Single-molecule surface-enhanced Raman scattering hot spots. J. Am. Chem. Soc. 2008, 130, 12616–12617. [Google Scholar] [CrossRef]
  108. Weng, S.; Yuan, H.; Zhang, X.; Li, P.; Zheng, L.; Zhao, J.; Huang, L. Deep learning networks for the recognition and quantitation of surface-enhanced Raman spectroscopy. Analyst 2020, 145, 4827–4835. [Google Scholar] [CrossRef]
  109. Zhang, D.; Liang, P.; Chen, W.; Tang, Z.; Li, C.; Xiao, K.; Jin, S.; Ni, D.; Yu, Z. Rapid field trace detection of pesticide residue in food based on surface-enhanced Raman spectroscopy. Microchim. Acta 2021, 188, 370. [Google Scholar] [CrossRef]
  110. Weng, S.; Yu, S.; Dong, R.; Zhao, J.; Liang, D. Detection of Pirimiphos-Methyl in Wheat Using Surface-Enhanced Raman Spectroscopy and Chemometric Methods. Molecules 2019, 24, 1691. [Google Scholar] [CrossRef]
  111. Han, M.; Lu, H.; Zhang, Z. Fast and Low-Cost Surface-Enhanced Raman Scattering (SERS) Method for On-Site Detection of Flumetsulam in Wheat. Molecules 2020, 25, 4662. [Google Scholar] [CrossRef]
  112. Lukošiūtė-Stasiukonienė, A.; Almogdad, M.; Semaškienė, R.; Mačiulytė, V. Crop Density and Sowing Timing Effect on Tan Spot Occurrence in Spring Wheat. Agriculture 2024, 14, 1284. [Google Scholar] [CrossRef]
  113. Wang, X.; Jiang, N.; Liu, J.; Liu, W.; Wang, G.-L. The role of effectors and host immunity in plant–necrotrophic fungal interactions. Virulence 2014, 5, 722–732. [Google Scholar] [CrossRef]
  114. Shao, D.; Smith, D.L.; Kabbage, M.; Roth, M.G. Effectors of Plant Necrotrophic Fungi. Front. Plant Sci. 2021, 12, 687713. [Google Scholar] [CrossRef]
  115. Derbyshire, M.C.; Raffaele, S. Till death do us pair: Co-evolution of plant–necrotroph interactions. Curr. Opin. Plant Biol. 2023, 76, 102457. [Google Scholar] [CrossRef] [PubMed]
  116. Mironenko, N.V.; Baсильeвнa, M.H.; Orina, A.S.; Cтaнислaвoвнa, O.A.; Kovalenko, N.M.; Mихaйлoвнa, K.H. Expression of the ToxA and PtrPf2 genes of the phytopathogenic fungus Pyrenophora tritici-repentis at the beginning of the infection process. Ecol. Genet. 2019, 18, 149–155. [Google Scholar] [CrossRef]
  117. Mironenko, N.V.; Orina, A.S.; Kovalenko, N.M. Novel ToxA Insertion Element in Pyrenophora tritici-repentis. Russ. J. Genet. 2024, 60, 1161–1167. [Google Scholar] [CrossRef]
  118. Tran, V.A.; Aboukhaddour, R.; Strelkov, I.S.; Bouras, N.; Spaner, D.; Strelkov, S.E. The sensitivity of Canadian wheat genotypes to the necrotrophic effectors produced by Pyrenophora tritici-repentis. Can. J. Plant Pathol. 2017, 39, 149–162. [Google Scholar] [CrossRef]
  119. Faris, J.D.; Friesen, T.L. Plant genes hijacked by necrotrophic fungal pathogens. Curr. Opin. Plant Biol. 2020, 56, 74–80. [Google Scholar] [CrossRef]
  120. Tan, K.-C.; Oliver, R.P.; Solomon, P.S.; Moffat, C.S. Proteinaceous necrotrophic effectors in fungal virulence. Funct. Plant Biol. 2010, 37, 907–912. [Google Scholar] [CrossRef]
  121. Liao, C.-J.; Hailemariam, S.; Sharon, A.; Mengiste, T. Pathogenic strategies and immune mechanisms to necrotrophs: Differences and similarities to biotrophs and hemibiotrophs. Curr. Opin. Plant Biol. 2022, 69, 102291. [Google Scholar] [CrossRef]
  122. Sun, J.; Gong, L.; Wang, W.; Gong, Z.; Wang, D.; Fan, M. Surface-enhanced Raman spectroscopy for on-site analysis: A review of recent developments. Luminescence 2020, 35, 808–820. [Google Scholar] [CrossRef]
  123. Zhu, A.; Ali, S.; Jiao, T.; Wang, Z.; Ouyang, Q.; Chen, Q. Advances in surface-enhanced Raman spectroscopy technology for detection of foodborne pathogens. Compr. Rev. Food Sci. Food Saf. 2023, 22, 1466–1494. [Google Scholar] [CrossRef]
  124. Afroozeh, A. A Review of Developed Surface-Enhanced Raman Spectroscopy (SERS)-Based Sensors for the Detection of Common Hazardous Substances in the Agricultural Industry. Plasmonics 2024, 20, 63–81. [Google Scholar] [CrossRef]
  125. Atanasov, P.A.; Nedyalkov, N.N.; Fukata, N.; Jevasuwan, W.; Subramani, T.; Terakawa, M.; Nakajima, Y. Surface-Enhanced Raman Spectroscopy (SERS) of Mancozeb and Thiamethoxam Assisted by Gold and Silver Nanostructures Produced by Laser Techniques on Paper. Appl. Spectrosc. 2018, 73, 313–319. [Google Scholar] [CrossRef] [PubMed]
  126. Saini, R.K.; Sharma, A.K.; Agarwal, A.; Prajesh, R. Label-free detection of Thiram pesticide on flexible SERS-active substrate. Mater. Chem. Phys. 2022, 295, 127088. [Google Scholar] [CrossRef]
  127. Feng, Z.; Yang, X.; Guo, X.; Yu, J.; Li, F.; Shao, J.; Liang, H.; Jiang, H. Sensitive Determination of Carbendazim in Tobacco Leaves by Surface Enhanced Raman Spectroscopy (SERS) Using a Silica–Silver Nanoparticle Substrate and QuEChERs Pretreatment. Anal. Lett. 2024, 57, 2644–2653. [Google Scholar] [CrossRef]
  128. Cialla-May, D.; Bonifacio, A.; Bocklitz, T.; Markin, A.; Markina, N.; Fornasaro, S.; Dwivedi, A.; Dib, T.; Farnesi, E.; Liu, C.; et al. Biomedical SERS—The current state and future trends. Chem. Soc. Rev. 2024, 53, 8957–8979. [Google Scholar] [CrossRef]
  129. Lau, H.Y.; Wang, Y.; Wee, E.J.H.; Botella, J.R.; Trau, M. Field Demonstration of a Multiplexed Point-of-Care Diagnostic Platform for Plant Pathogens. Anal. Chem. 2016, 88, 8074–8081. [Google Scholar] [CrossRef]
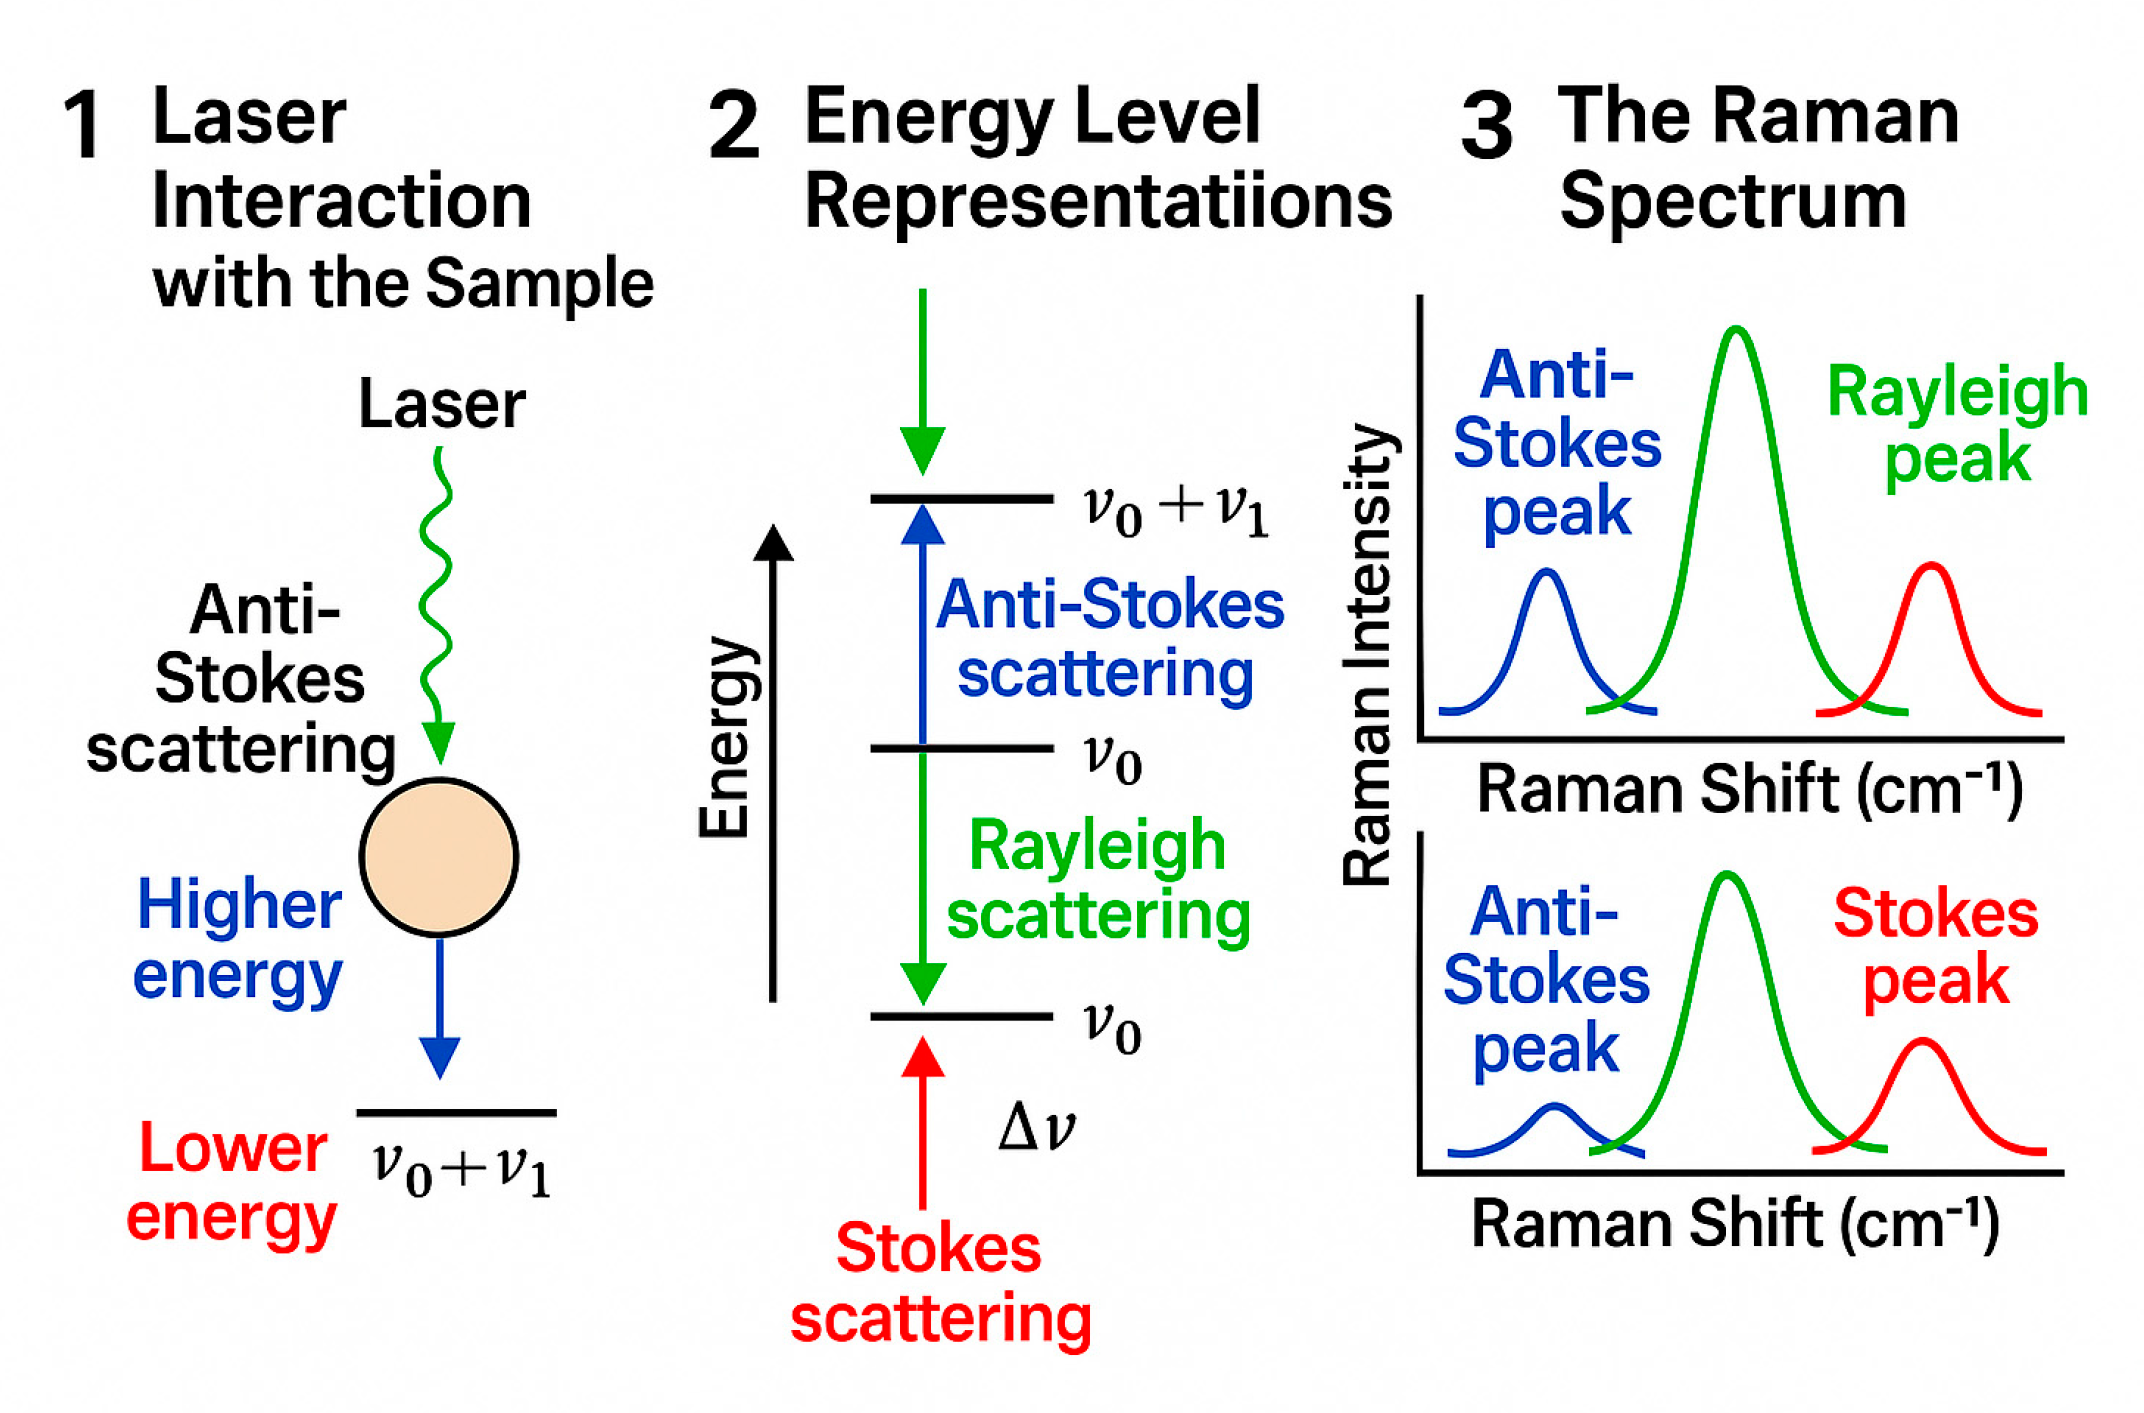
Figure 1. Principles of Raman scattering. 1. Laser interaction with the aample. A laser beam (green) is directed at a sample, exciting molecular vibrations. The sample scatters the light, producing three types of scattered signals: (a) Raman anti-Stokes scattering (higher energy shift, shown in blue); (b) Rayleigh scattering (no energy shift, shown in green); and (c) Raman Stokes scattering (lower energy shift, shown in red). 2. Energy level representations. The energy levels involved in the scattering process are displayed, showing transitions between molecular states: (a) Rayleigh scattering occurs when the scattered light has the same energy as the incident laser, and (b) Raman Stokes and anti-Stokes scattering result in energy shifts due to molecular interactions, denoted as Δν (Raman shift). 3. The Raman spectrum displays a graph of Raman intensity versus Raman shift (cm−1). The spectrum is composed of three main components: (a) anti-Stokes peaks (shown in blue) on the left side, indicating higher energy shifts; (b) the Rayleigh peak (shown in green) in the center, which represents no energy shifts; and (c) Stokes peaks (shown in red) on the right side, corresponding to lower energy shifts. All creative and scientific rights are retained by the author. The image does not contain embedded metadata or AI-generated attribution layers.
Agronomy 15 01952 g001
Figure 2. Simulated SERS spectrum of wheat leaf infected with Pyrenophora tritici-repentis. Theoretical Raman peaks corresponding to fungal biomarkers such as ergosterol and chitin are highlighted. Spectral intensities are modeled based on literature data and simulated molecular interactions. Notably, peaks around 1370 cm−1 and 1450 cm−1 suggest the presence of ergosterol and chitin, which are key indicators of fungal infection. This graph is based on simulated data and serves as a conceptual illustration. All creative and scientific rights are retained by the author. The image does not contain embedded metadata or AI-generated attribution layers.
Agronomy 15 01952 g002
Figure 3. Coherent anti-Stokes Raman scattering (CARS) microscopy for monitoring plant diseases on wheat leaves. The diagram illustrates the CARS microscopy process and highlights its key elements. Three beams are generated, each with a clearly labeled angular frequency: pump beam (ωp), Stokes beam (ωs), and probe beam (ωpr). These labels ensure that the source frequencies are clearly identified. The beams are overlapped in space and time within the wheat leaf tissue, causing the molecules to enter a coherently excited state. This step is critical for the nonlinear optical process that follows: (i) CARS Signal Generation, (ii) Wheat Leaf Image, and (iii) the Detector and Imaging System. For CARS Signal Generation, the nonlinear interaction leads to the generation of an anti-Stokes signal. The observed anti-Stokes emission is given by the expression ω_AS = ωpr + ωp − ωs. This formula is clearly displayed to emphasize that the anti-Stokes output is a combination of the probe, pump, and Stokes inputs. The sample is an image of a wheat leaf displaying characteristic tan spot lesions caused by infection from P. tritici-repentis. This offers context and visual confirmation of the disease state. For Detector and Imaging System, the anti-Stokes signal is captured by a detector that performs both spectral and spatial mapping, thereby enabling effective diagnosis of disease severity. The graph represents a generation of conceptual data that was simulated using the Copilot AI program. This graph is based on simulated data and serves as a conceptual illustration. All creative and scientific rights are retained by the author. The image does not contain embedded metadata or AI-generated attribution layers.
Agronomy 15 01952 g003
Figure 4. Coherent anti-Stokes Raman scattering (CARS) microscopy for plant disease monitoring. The diagram walkthrough illustrates the CARS microscopy process used for detecting P. tritici-repentis. The graph represents a generation of conceptual data that was simulated using the Copilot AI program. This graph is based on simulated data and serves as a conceptual illustration. All creative and scientific rights are retained by the author. The image does not contain embedded metadata or AI-generated attribution layers.
Agronomy 15 01952 g004
Figure 5. Raman spectroscopy for the detection of fungal toxins and effectors of Pyrenophora tritici-repentis in wheat leaves. The x-axis represents the Raman shift (cm−1) (spanning 400 to 1800 cm−1), and the y-axis indicates Raman intensity (a.u.). This graph is based on simulated data and serves as a conceptual illustration. All creative and scientific rights are retained by the author. The image does not contain embedded metadata or AI-generated attribution layers.
Agronomy 15 01952 g005
Figure 6. Simulated CARS spectrum of wheat treated with propiconazole. Surface-enhanced Raman spectroscopy for the detection of propiconazole (DMI) fungicide in wheat leaves. The x-axis represents the Raman shift (cm−1) (spanning 400 to 1600 cm−1), and the y-axis indicates Raman intensity (a.u.). This graph is based on simulated data and serves as a conceptual illustration. All creative and scientific rights are retained by the author. The image does not contain embedded metadata or AI-generated attribution layers.
Agronomy 15 01952 g006
Disclaimer/Publisher’s Note: The statements, opinions and data contained in all publications are solely those of the individual author(s) and contributor(s) and not of MDPI and/or the editor(s). MDPI and/or the editor(s) disclaim responsibility for any injury to people or property resulting from any ideas, methods, instructions or products referred to in the content.