Article

Modeling the Effects of Different Water and Fertilizer Irrigation Systems on Greenhouse Gas Emissions Using the DNDC Model

School of Water Conservancy, North China University of Water Resources and Electric Power, Zhengzhou 450046, China
*
Author to whom correspondence should be addressed.
Agronomy 2025, 15(8), 1951; https://doi.org/10.3390/agronomy15081951
Submission received: 15 July 2025 / Revised: 9 August 2025 / Accepted: 10 August 2025 / Published: 13 August 2025
(This article belongs to the Section Water Use and Irrigation)

Abstract

Exploring the effects of different water and fertilizer irrigation systems on N2O and CO2 emissions is of great significance for promoting sustainable agricultural development. In this study, summer maize in Henan Province was selected as the research object, and field experiments were carried out from 2023 to 2024. A total of 12 water and fertilizer treatments were set up. In situ field measurements of N2O and CO2 in farmland were carried out using static chamber gas chromatography to study the effects of different water and fertilizer irrigation systems on N2O and CO2 emissions from farmland and the simulation performance of the DNDC model. The results were as follows: (1) Irrigation and fertilization significantly interacted to affect N2O and CO2 emissions. (2) The summer maize yield under the B2 treatment was the highest, and the total N2O and CO2 emissions under the C3 treatment were the highest. (3) Under the DNDC simulation scenario, the summer maize yields under the real-time irrigation system in 2023 and 2024 increased by 4.43% and 4.38% compared with those under full irrigation. The total N2O emissions from farmland were reduced by 6.56% and 6.22%, while CO2 emissions decreased by 14.49% and 14.79%, respectively. The results show that real-time water and fertilizer irrigation systems can promote the yield of summer maize and reduce greenhouse gas emissions. The research results provide a theoretical basis for reducing greenhouse gas emissions from farmland and are significant for promoting sustainable agricultural development.

1. Introduction

Agricultural activities are an important source of greenhouse gas emissions. Global agricultural carbon emissions have increased by 14% since the 1990s [1]. In an analysis of carbon emissions from agricultural activities in China, the study found that food production contributed 27% of emissions. The crop production process contributes 21% of carbon emissions, while the animal feed production process contributes 6%. Applying chemical fertilizers is regarded as one of the key measures to ensure high and stable grain yields. However, this approach has significantly increased greenhouse gas emissions [2] and the global warming potential [3]. Reasonable land use and management measures can improve soil quality and fertility and help slow the upward trend of N2O and CO2 concentrations in the atmosphere [4]. Therefore, agriculture can play a significant role in maintaining the balance of the global carbon cycle, and reducing agricultural emissions will also become an important driving force for the country to achieve the strategic goal of carbon neutrality.
Currently, research on agricultural carbon and nitrogen emissions is mainly aimed at paddy fields [5,6], vegetable fields [7,8], etc., focusing on fertilization [9,10], tillage methods [11,12], and straw returning [13,14], while there is little research on real-time irrigation systems. Chen et al. [15] pointed out that nitrogen application significantly increased N2O and CO2 emissions from farmland in dryland ecosystems. Ni et al. [16] found that with an increase in fertilization, N2O emissions increased exponentially. Wang et al. [17] showed that concentrations of CH4, CO2, and N2O varied significantly with soil depth. The concentration of CO2 in soil increased with increasing soil depth. This reflected seasonal variation, with higher CO2 concentrations in the warm and humid maize growing season and lower CO2 concentrations in the winter wheat growing season. Xu et al. [18] showed that direct N2O emissions can have a nonlinear response to increasing N rates, which means that EFs are not a constant value but depend on the amount of N fertilizer applied. Ardenti et al. [19] showed that intensive irrigation and N fertilization are often linked to low N-fertilizer efficiency and high emissions of N2O. Drip irrigation combined with N fertigation can promote N-use efficiency, thereby curbing N2O emissions without reducing crop yields.
With climate warming, the demand for corn water in northern China will increase significantly, resulting in severe water shortages [20]. At the same time, corn production is one of the primary sources of greenhouse gas emissions [21]. These potential environmental impacts will require changes in the management of maize production, aiming to reduce water consumption and greenhouse gas emissions while maintaining maize yields [22]. In order to reduce water consumption in corn irrigation and improve water-use efficiency, a real-time irrigation system has been developed as a water-saving irrigation method. The real-time drip irrigation system [23] delivers water and liquid fertilizer directly into the root zone for crop growth, effectively reducing deep seepage around the crop, soil evaporation, and weed growth, and further improving crop water productivity. However, the effects of real-time drip irrigation regimes on crop yields and soil N2O vary depending on factors such as field management, climatic conditions, and soil properties. There is still a lack of tools for the quantitative analysis of crop yields and N2O emissions, which will limit the sustainable production of maize in the future.
Traditional field experiments require time, labor, material, and financial resources to explore the patterns of N2O and CO2 emissions in farmland. Many models have emerged, such as DSSAT [24], APSIM [25], and WOFOST [26]. These models are used to simulate crop growth and other greenhouse gases. The development and application of models make it possible to estimate the loss of gaseous nitrogen from farmland under different environmental conditions and agricultural management modes in a short time and at a low cost. The DNDC model [27] is one of the most successful biogeochemical models. Scholars at home and abroad have used this model to simulate many farmland N2O [28,29] and CO2 [30] emissions. In simulating N2O and CO2 emissions from farmland, the model can reasonably reproduce N2O and CO2 emissions under conventional planting conditions. However, its sensitivity to N2O and CO2 emissions from farmland during non-agricultural activity periods is insufficient. The model’s simulation accuracy is reduced under special agricultural treatments such as high/low nitrogen fertilizer application rates and plastic film mulching. Therefore, the DNDC model still needs to be further tested and improved. Most previous studies investigated the whole irrigation system [31] or a single agricultural practice (irrigation or fertilization). In contrast, the mechanism of the combined practice of water and fertilizer under a real-time drip irrigation system is still unclear. Optimizing management practices is usually based on the direct impact on a single crop, and there is a lack of research assessing the annual impact on the cropping system. In addition, it is still unknown how well the DNDC model can simulate the effects of dual water and fertilizer management on maize yields and N2O emissions, or what the optimal management measures for maize cropping systems are. In order to further explore the feasibility of applying the DNDC model in northern drylands, this study analyzed the effects of water and fertilizer on N2O and CO2 emissions, as well as summer maize yields, under real-time irrigation systems using data on tillage management processes, soil and climate conditions, crop growth processes, and N2O and CO2 emissions from summer maize farmland in Zhengzhou City, Henan Province, from 2023 to 2024 and verified the DNDC model. The calibrated model simulated and analyzed the total N2O and CO2 emissions and summer maize yields under real-time and full irrigation systems. This provides a valuable reference for the application and improvement of the DNDC model in northern arid areas. It also provides theoretical support and a scientific basis for realizing agricultural water savings and reducing greenhouse gas emissions.

2. Materials and Methods

2.1. Study Area

The experimental area is located in the agricultural high-efficiency water-irrigation test site (32°21′24.88″ N, 114°47′65″ E) of the Longzi Lake Campus of North China University of Water Resources and Electric Power in Zhengzhou City, Henan Province (Figure 1). The main crops are winter wheat and summer maize. It is located in the north-central part of Henan Province, at the boundary of the middle and lower reaches of the Yellow River. It has a temperate continental monsoon climate with intense seasonal drought and uneven rainfall. Rainfall is mainly concentrated in June–August. The average annual precipitation is 632.4 mm, the extreme annual maximum rainfall is 1339 mm, the minimum annual rainfall is 380.6 mm, the average temperature is 14.7 °C, the extreme minimum temperature is −16.3 °C, the extreme maximum temperature is 41.5 °C, and the altitude of the study area is about 56 m. The soil texture of the tillage layer in the experimental field is loam, the soil field capacity is 31.65%, the soil total nitrogen content is 460 mg/kg, and the available phosphorus content is 17.22 mg/kg.

2.2. Experimental Design

In this experiment, the maize variety was Zhenghuangnuo 2, which was sown on 9 June 2023 and harvested on 29 September 2023, and sown again on 11 June 2024 and harvested on 30 September 2024, with a row spacing of 70 cm and a plant spacing of 30 cm. Three irrigation levels were designed in the experiment. The upper limit of irrigation in each group was 90% θf, and the lower limits of irrigation were 60% θf, 70% θf, and 80% θf, respectively, with rain-fed as the control. Field capacity (θf) refers to the maximum amount of water that the soil can retain after sufficient drainage under natural conditions. In the experiment, compound fertilizer was applied as the base fertilizer before sowing, and the fertilizer used was Xinlianxinmeixin soluble compound fertilizer. In both 2023 and 2024, topdressing was carried out on July 17. The fertilizer was a urea–formaldehyde slow-release compound fertilizer with a total nutrient content of not less than 40% and an N–P–K ratio of 22:8:10. Three fertilization levels were set at sowing: high fertilizer (540 kg/ha), medium fertilizer (450 kg/ha), and low fertilizer (360 kg/ha). One irrigation level corresponded to three fertilization levels, giving a total of 12 treatments, using drip irrigation and water and fertilizer integration equipment. The area of each treatment in the experimental area was 16 m2, with a length and width of 4 m and 4 m, respectively, and 6 × 13 = 78 plants were planted. Details of each treatment are shown in Table 1. The upper and lower irrigation limits at different growth stages of different summer maize simulated by the DNDC model are shown in Table 2. These correspond to the group E treatments, whereas full irrigation corresponds to the group F treatments. The amount of fertilizer, fertilization time, and other management measures were the same as in the field test; 6 groups of tests were simulated. The irrigation group refers to the experimental area or management unit divided according to different irrigation systems, methods, or frequencies in irrigation experiments or actual irrigation management. By setting different irrigation groups, the effects of different irrigation methods or irrigation systems on crop growth, yield, and water-use efficiency can be compared to optimize irrigation management and improve irrigation efficiency.
The irrigation method used in this study is intelligent real-time drip irrigation. According to the upper and lower limits of irrigation shown in Table 1, the system automatically issues an irrigation control signal when the soil moisture reaches the set lower limit of irrigation. The signal controls the solenoid valve to open the irrigation switch and start automatic irrigation. When the soil moisture reaches the set irrigation limit, the system automatically signals to stop and end irrigation. This intelligent real-time drip irrigation system does not stipulate fixed irrigation times or irrigation frequencies, and only operates according to the set upper and lower limits. The water meter bound to the solenoid valve determines the irrigation amount. The real-time irrigation scheduling of summer maize is shown in Table S1.

2.3. Method

2.3.1. Determination of Total N2O and CO2 Emissions from Farmland

The N2O and CO2 emission fluxes from farmland in the summer maize growing season were measured continuously using the static box method. One sampling box was placed in each experimental plot, and the boxes were positioned so they did not interfere with each other. Sampling was performed between 8:00 a.m. and 11:00 a.m. Gas samples were collected from June to September. Samples were collected once every 7 days during the early growth stage and once every 15 days during the later stage. Samples were collected once every other day after irrigation and fertilization, and collection was delayed in case of heavy rain. The sampling time interval was 30 min. At 0 min and 30 min, a syringe was used to extract 30 mL of mixed uniform gas from the box and transfer it to an air bag. After sampling, the samples were analyzed using an Agilent Technology Company (Santa Clara, CA, USA) 5890 meteorological chromatograph (temperature setting resolution: 1 °C; temperature stability: when the ambient temperature changes by 1 °C, it is better than 0.01 °C; hydrogen flame ionization detector: minimum detection limit, 5 Pg/s (carbon, tridecane); dynamic linear range: 107 (±10%)). The calculation formula for N2O and CO2 emissions from summer maize farmland is as follows:
f = ρ h 273 ( 273 + T ) · d c d t
f is soil gas emission flux, mg/(m2·h); ρ is the gas density in the standard state, g/cm3; h is the height of the sampling box, m; T is the temperature in the box when sampling, °C; and d c d t is the change rate of gas concentration in the box, μL/(m3·h).
The formula for the cumulative emission flux of N2O and CO2 during the whole growth period of summer maize is as follows:
M = ( f i + 1 + f i ) × ( t i + 1 + t i ) × 24 2 × 100
M is the total amount of N2O emissions from farmland; the subscript i is the number of sampling times; and t is the sampling time, d.

2.3.2. Determination of Summer Maize Yield

At the maturity stage of maize, two rows of maize ears were randomly harvested in each treatment. After the maize ears were dried to a safe moisture content (14%), the number of ears, the number of grains per ear, and the weight of 100 grains were measured, and the yield per unit area (kg/ha) was calculated.
The ECH20 system (Decagon Devices Inc., Pullman, WA, USA) was used to measure soil moisture. Due to the deep-root development of summer maize, a probe was buried at 30 cm in the experimental field to measure soil moisture content. The observation frequency was daily.
In this experiment, the irrigation amount was calculated according to the three lower irrigation limits, namely 60% θf, 70% θf, and 80% θf. When the measured soil moisture was lower than the lower limit of the soil moisture content set for the plot, irrigation was determined according to the real-time meteorological data. If there was rainfall before and after irrigation, the precipitation was first considered, and the irrigation time was adjusted according to the adequate rainfall and the water demand of the maize until the set soil moisture content was reached. This value represented the upper limit. The calculation formula is as follows:
M i = 1000 · n · H i ( θ c 1 θ i ) · θ m a x
M i is the amount of water for the ith irrigation, m3; 1000 is a constant used for unit conversion; n is the porosity of the soil in the planned wetting layer, %; H i is the wet layer depth for the crop on day i, m; θ c 1 is the soil moisture content to be achieved after irrigation, %; θ i is the initial soil moisture content on the first day, %; and θ m a x is the field capacity, %.

2.4. DNDC Model

The DNDC model is composed of two parts. One part simulates the soil environment and includes three sub-models: soil climate, soil organic matter decomposition, and crop growth. The other part simulates the effect of the soil environment on microbial activity and includes three sub-models: fermentation, nitrification, and denitrification. Since the model was established by Li Changsheng et al. in 1992 [32], it has been widely used by scholars at home and abroad to simulate soil temperature, soil relative humidity, greenhouse gas (CO2, CH4, N2O) emissions, NH3 volatilization, crop yield, farmland runoff leaching loss, and soil organic carbon changes in different types of farmland. Although the model can simulate soil N2O emissions in a variety of agricultural/natural ecosystems, the complexity of soil nitrogen transformation and the diversity of agricultural management, soil conditions, and climatic and environmental combinations mean the model still needs substantial verification. Therefore, before simulating N2O and CO2 emissions and summer maize yields, it is necessary to correct and verify the DNDC model and adjust the model’s internal default values to improve its accuracy.

2.4.1. Model Parameter Input

The data required for the model simulation were collected and measured in this experiment. The model’s default parameters were corrected using the measured data from the A1, A2, and A3 treated maize fields from 2023 to 2024. The corrected DNDC model simulation results were verified using the measured data from the B1, B2, B3, C1, C2, C3, D1, D2, and D3 treated maize fields from 2023 to 2024. Field weather stations measured the meteorological data. Some soil and crop data were obtained after field sampling. Tillage and fertilization management were carried out according to the actual field records. The specific input parameters are shown in Table 3.

2.4.2. Model Evaluation

In this study, the determination coefficient (R2), consistency index (d), and Nash efficiency coefficient (EF) were used to evaluate the fitting degree (R2) of the DNDC model. R2 measures the degree to which the regression model fits the observed data. When R2 = 1, it means that the fitting degree of the model is very high. The dimension of RMSE is the same as the measured and simulated values, which reflects the error size more intuitively. EF reflects the trend simulation effect of the simulated values on field-measured values. When EF is 0~1, the closer the value is to 1, the greater the correlation between the simulated and measured values. When EF < 0, there is no correlation between the simulated and measured values. The calculation formula is as follows:
R 2 = i = 1 N ( Q i Q ¯ ) ( P i P ¯ ) ( Q i Q ) ¯ 2 ( P i P ¯ ) 2
R M S E = i = 1 N ( Q i P i ) 2 N 0.5
E F = 1 i = 1 N ( P i Q i ) 2 i = 1 N ( P i P ¯ ) 2
P i represents the measured value, Q i is the model simulation value, P ¯ is the average of the measured values, Q ¯ is the average of the model simulation values, and N represents the number of data points.
In this study, the Honest Significant Difference (HSD) test was used for mean separation. The HSD test is used for multiple comparisons, especially after analysis of variance (ANOVA). The statistic q for the Tukey HSD test is calculated as follows:
q = X i X j S E
where X i and X j are the means of the two groups and SE is the standard error of the mean difference.

3. Results

3.1. Effects of Different Water and Fertilizer Irrigation Systems on Yields

The analysis of variance of summer maize yields from 2023 to 2024 showed that the single-factor effect of irrigation and fertilization on yield reached a very significant level (p < 0.01), and there was a significant interaction between the two (p < 0.01). It can be seen in Figure 2a that in the experiment in 2023, the yield of summer maize obtained from the combination of water and fertilizer (B2, medium water fertilizer) was the highest. The yield of summer maize obtained by the D1 treatment (rain-fed low fertilizer) was the lowest, the same as the experiment’s results in 2024. In the 2023 experiment, the yields of the B1 treatment (medium water and low fertilizer) and B3 treatment (medium water and high fertilizer) decreased by 10.11% and 5.30%, respectively, compared with the B2 treatment under the same irrigation amount. In 2024, under the same irrigation amount, the yields of the B1 treatment (medium water and low fertilizer) and B3 treatment (medium water and high fertilizer) decreased by 17.16% and 8.41%, respectively, compared with the B2 treatment. It can be seen that increasing the amount of fertilizer appropriately significantly increased the yield of summer maize. At the same time, too high or too low an amount of fertilizer caused a reduction in crop yield. In contrast, the degree of yield reduction from high fertilizer was greater than that of low fertilizer. At the same fertilizer levels (A2 treatment (low water fertilizer), B2 treatment (medium water fertilizer), and C2 treatment (high water fertilizer)), the yields of summer maize in 2023 were 20.52%, 41.33%, and 21.44% higher than those of the D2 treatment (rain-fed medium fertilizer). In 2024, the summer maize yields were 17.02%, 44.45%, and 23.72% higher than those of the D2 treatment. This shows that under the same amount of fertilizer, the yield of summer maize increased with the increase in irrigation amount, and its growth rate followed a convex parabolic trend. In summary, irrigation and fertilization significantly impact yield, and reasonable water and fertilizer application are important factors for crops to achieve high yield.

3.2. Effects of Different Water and Fertilizer Irrigation Systems on Total N2O Emissions from Farmland

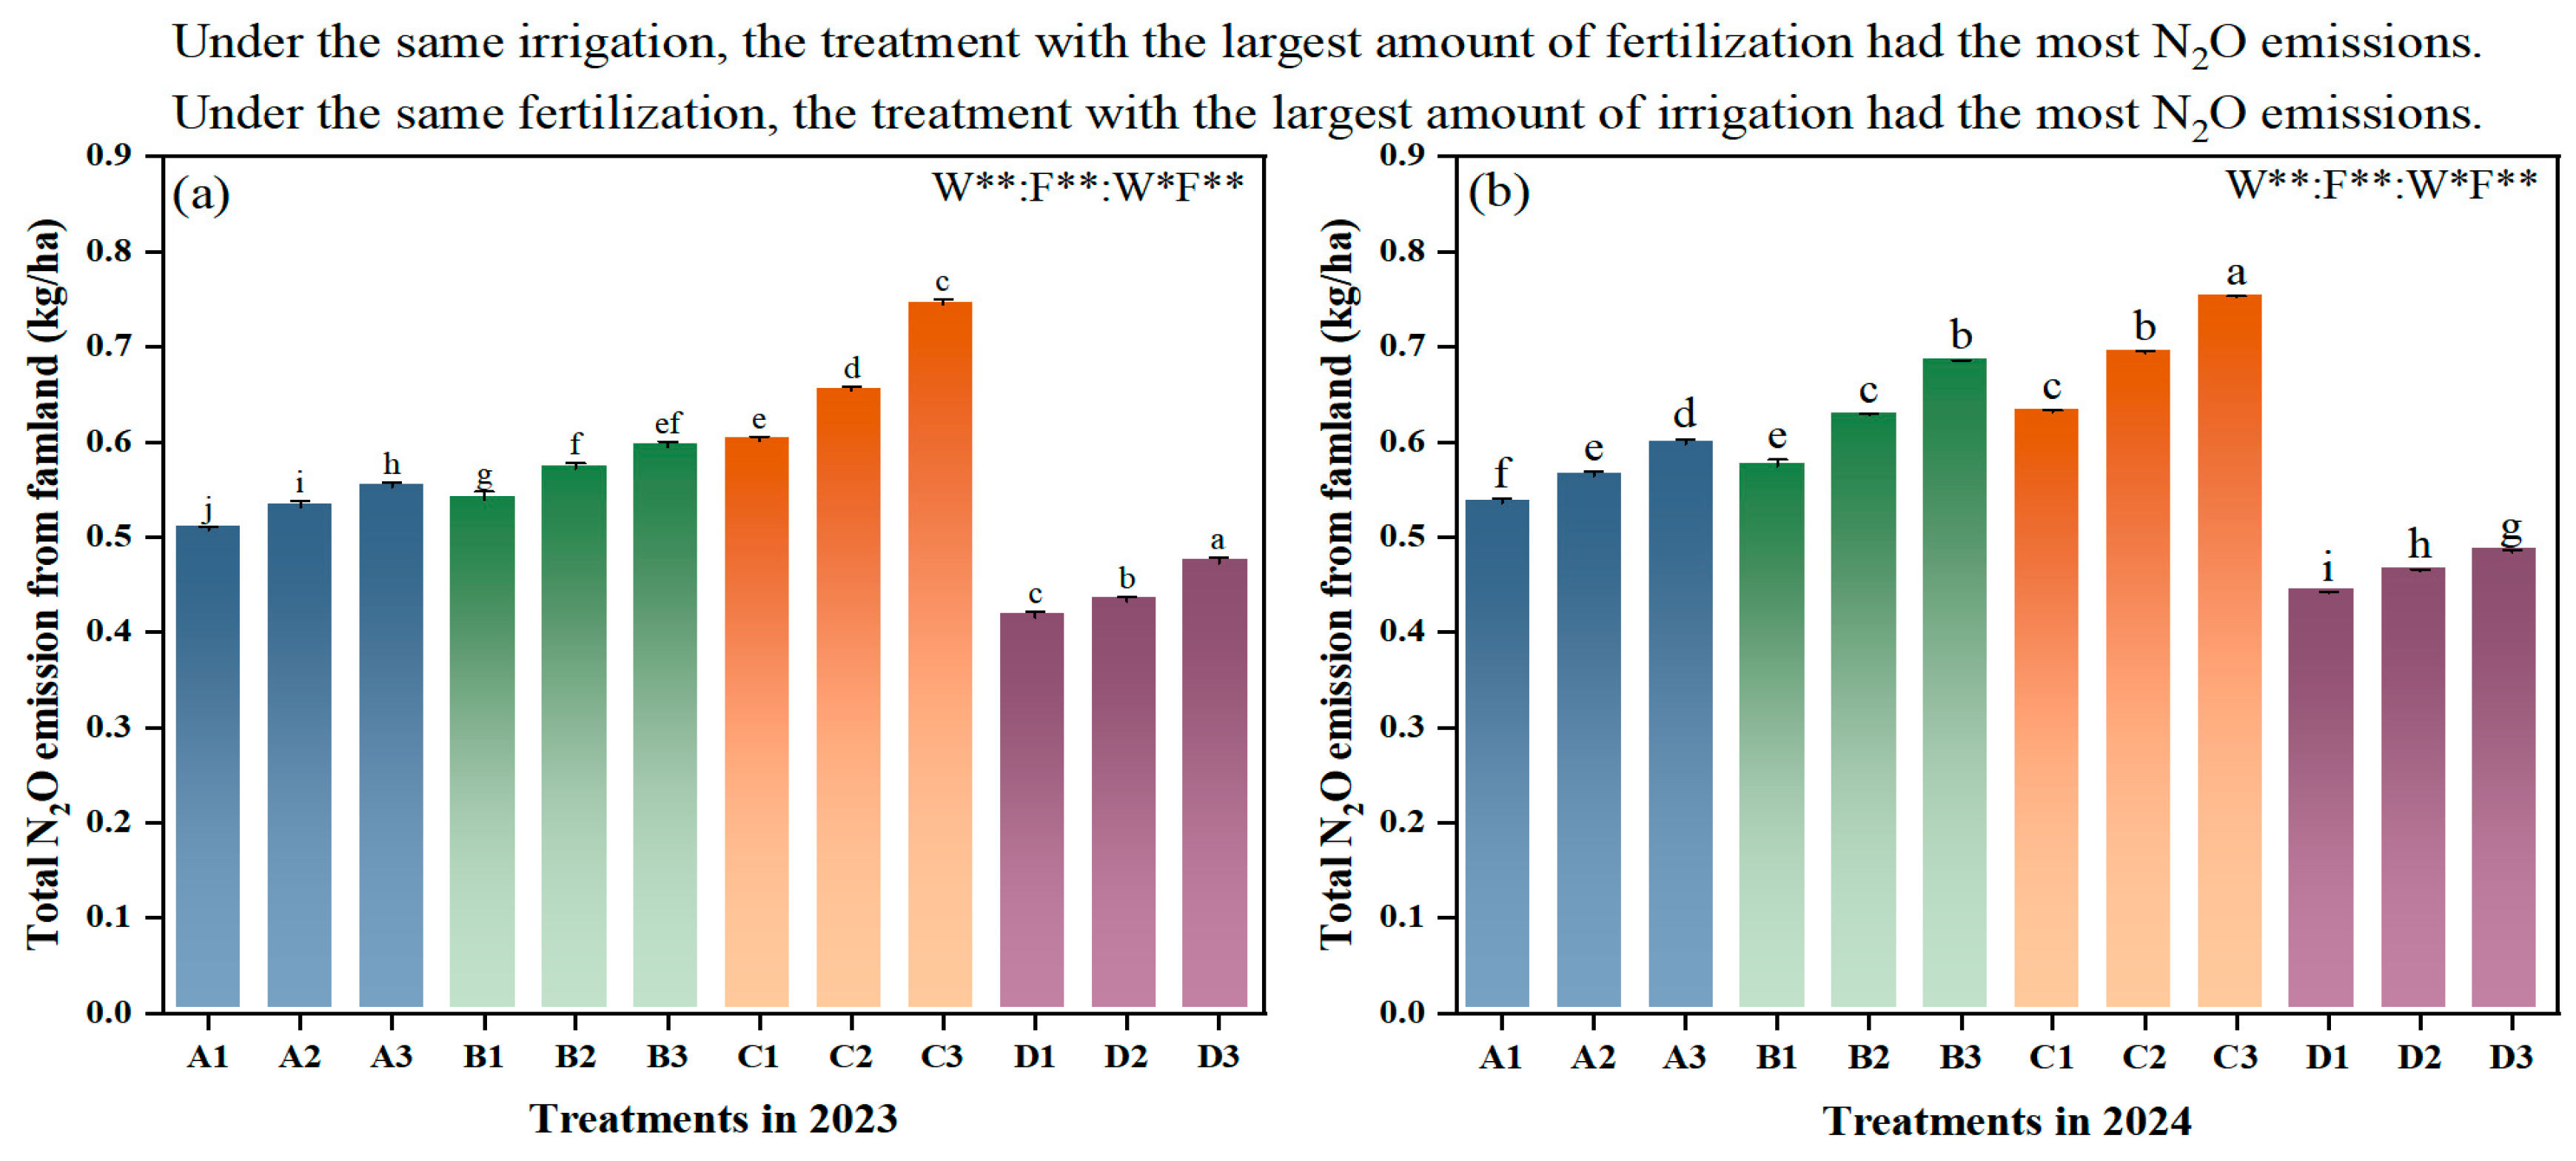
From 2023 to 2024, the total N2O emissions from summer maize farmland were analyzed by variance analysis. Figure 3 shows that the single-factor effect of irrigation and fertilization amounts on the total N2O emissions from farmland reached a very significant level (p < 0.01). There was also a significant interaction between the two (p < 0.01). It can be seen in Figure 3a that in the experiment in 2023, the total amount of N2O emissions from farmland from the combination of water and fertilizer (C3, high water and high fertilizer) was the highest. The total N2O emissions from the D1 treatment (rain-fed low fertilizer) were the lowest, the same as the experimental results in 2024. In the 2023 experiment, under the same irrigation amount, the total N2O emissions from the C1 treatment (high water and low fertilizer) and C2 treatment (high water and fertilizer) were reduced by 19.26% and 12.23%, respectively, compared with the C3 treatment (high water and high fertilizer). In 2024, the total N2O emissions from the C1 treatment (high water and low fertilizer) and C2 treatment (high water and fertilizer) decreased by 19.30% and 11.36%, respectively, compared with the C3 treatment (high water and high fertilizer) under the same irrigation amount. The results show that under a certain amount of irrigation, increasing the amount of fertilizer leads to an increase in the total amount of N2O emissions from farmland. Under the same amount of fertilizer, compared with the D1 treatment (rain-fed low fertilizer), A1 treatment (low water and low fertilizer), B1 treatment (medium water and low fertilizer), and C1 treatment (high water and low fertilizer), the total N2O emissions from summer maize farmland in 2023 increased by 22.21%, 29.91%, and 44.80% respectively. In 2024, the total N2O emissions from summer maize farmland increased by 21.92%, 30.21%, and 43.11%, respectively. This shows that under the same amount of fertilizer, the total N2O emissions from summer maize farmland increased with increasing irrigation. In summary, the amounts of irrigation and fertilization significantly affect the total amount of N2O emissions from farmland, and reasonable water and fertilizer application are important factors in reducing the total amount of N2O emissions from farmland.

3.3. Effects of Different Water and Fertilizer Irrigation Systems on Total CO2 Emissions from Farmland

The total CO2 emissions from summer maize farmland from 2023 to 2024 were analyzed by variance analysis. Figure 4 shows that the single-factor effect of irrigation and fertilization amounts on the total CO2 emissions from farmland reached a very significant level (p < 0.01). There was also a significant interaction between the two (p < 0.01). It can be seen in Figure 4a that in the experiment in 2023, the total CO2 emissions from farmland obtained through the combination of water and fertilizer (C3, high water and high fertilizer) were the highest. The total CO2 emissions from the D1 treatment (rain-fed low fertilizer) were the lowest, the same as the experimental results in 2024. In the 2023 experiment, under the same irrigation amount, the total amount of farmland CO2 emissions from the C1 treatment (high water and low fertilizer) and C2 treatment (high water and fertilizer) decreased by 3.71% and 2.96%, respectively, compared with the C3 treatment (high water and high fertilizer). In 2024, compared with the C3 treatment (high water and high fertilizer), the total amount of farmland CO2 emissions from the C1 treatment (high water and low fertilizer) and C2 treatment (high water and fertilizer) decreased by 3.71% and 1.73%, respectively, under the same irrigation amount. The results show that under a certain amount of irrigation, increasing the amount of fertilizer increases the total CO2 emissions from farmland. Under the same amount of fertilizer, compared with the D1 treatment (rain-fed low fertilizer), A1 treatment (low water and low fertilizer), B1 treatment (medium water and low fertilizer), and C1 treatment (high water and low fertilizer), the total CO2 emissions from summer maize farmland in 2023 increased by 24.13%, 52.26%, and 75.19%, respectively. In 2024, the total CO2 emissions from summer maize farmland increased by 19.44%, 34.32%, and 42.92%, respectively. This shows that under the same amount of fertilizer, the total CO2 emissions from summer maize farmland increased with increasing irrigation. In summary, the amounts of irrigation and fertilization significantly impact the total amount of CO2 emissions from farmland, and reasonable water and fertilizer application are important factors in reducing the total amount of CO2 emissions from farmland. The results of this experiment show that under real-time irrigation systems, a reasonable combination of water and fertilizer can effectively reduce carbon emissions from agricultural soil while ensuring that the grain yield is not reduced. These results provide a scientific and reasonable irrigation strategy for addressing climate change and mitigating the increase in greenhouse gas concentrations in the atmosphere.

3.4. Model Verification

3.4.1. Validation of DNDC Model on Summer Maize Yield

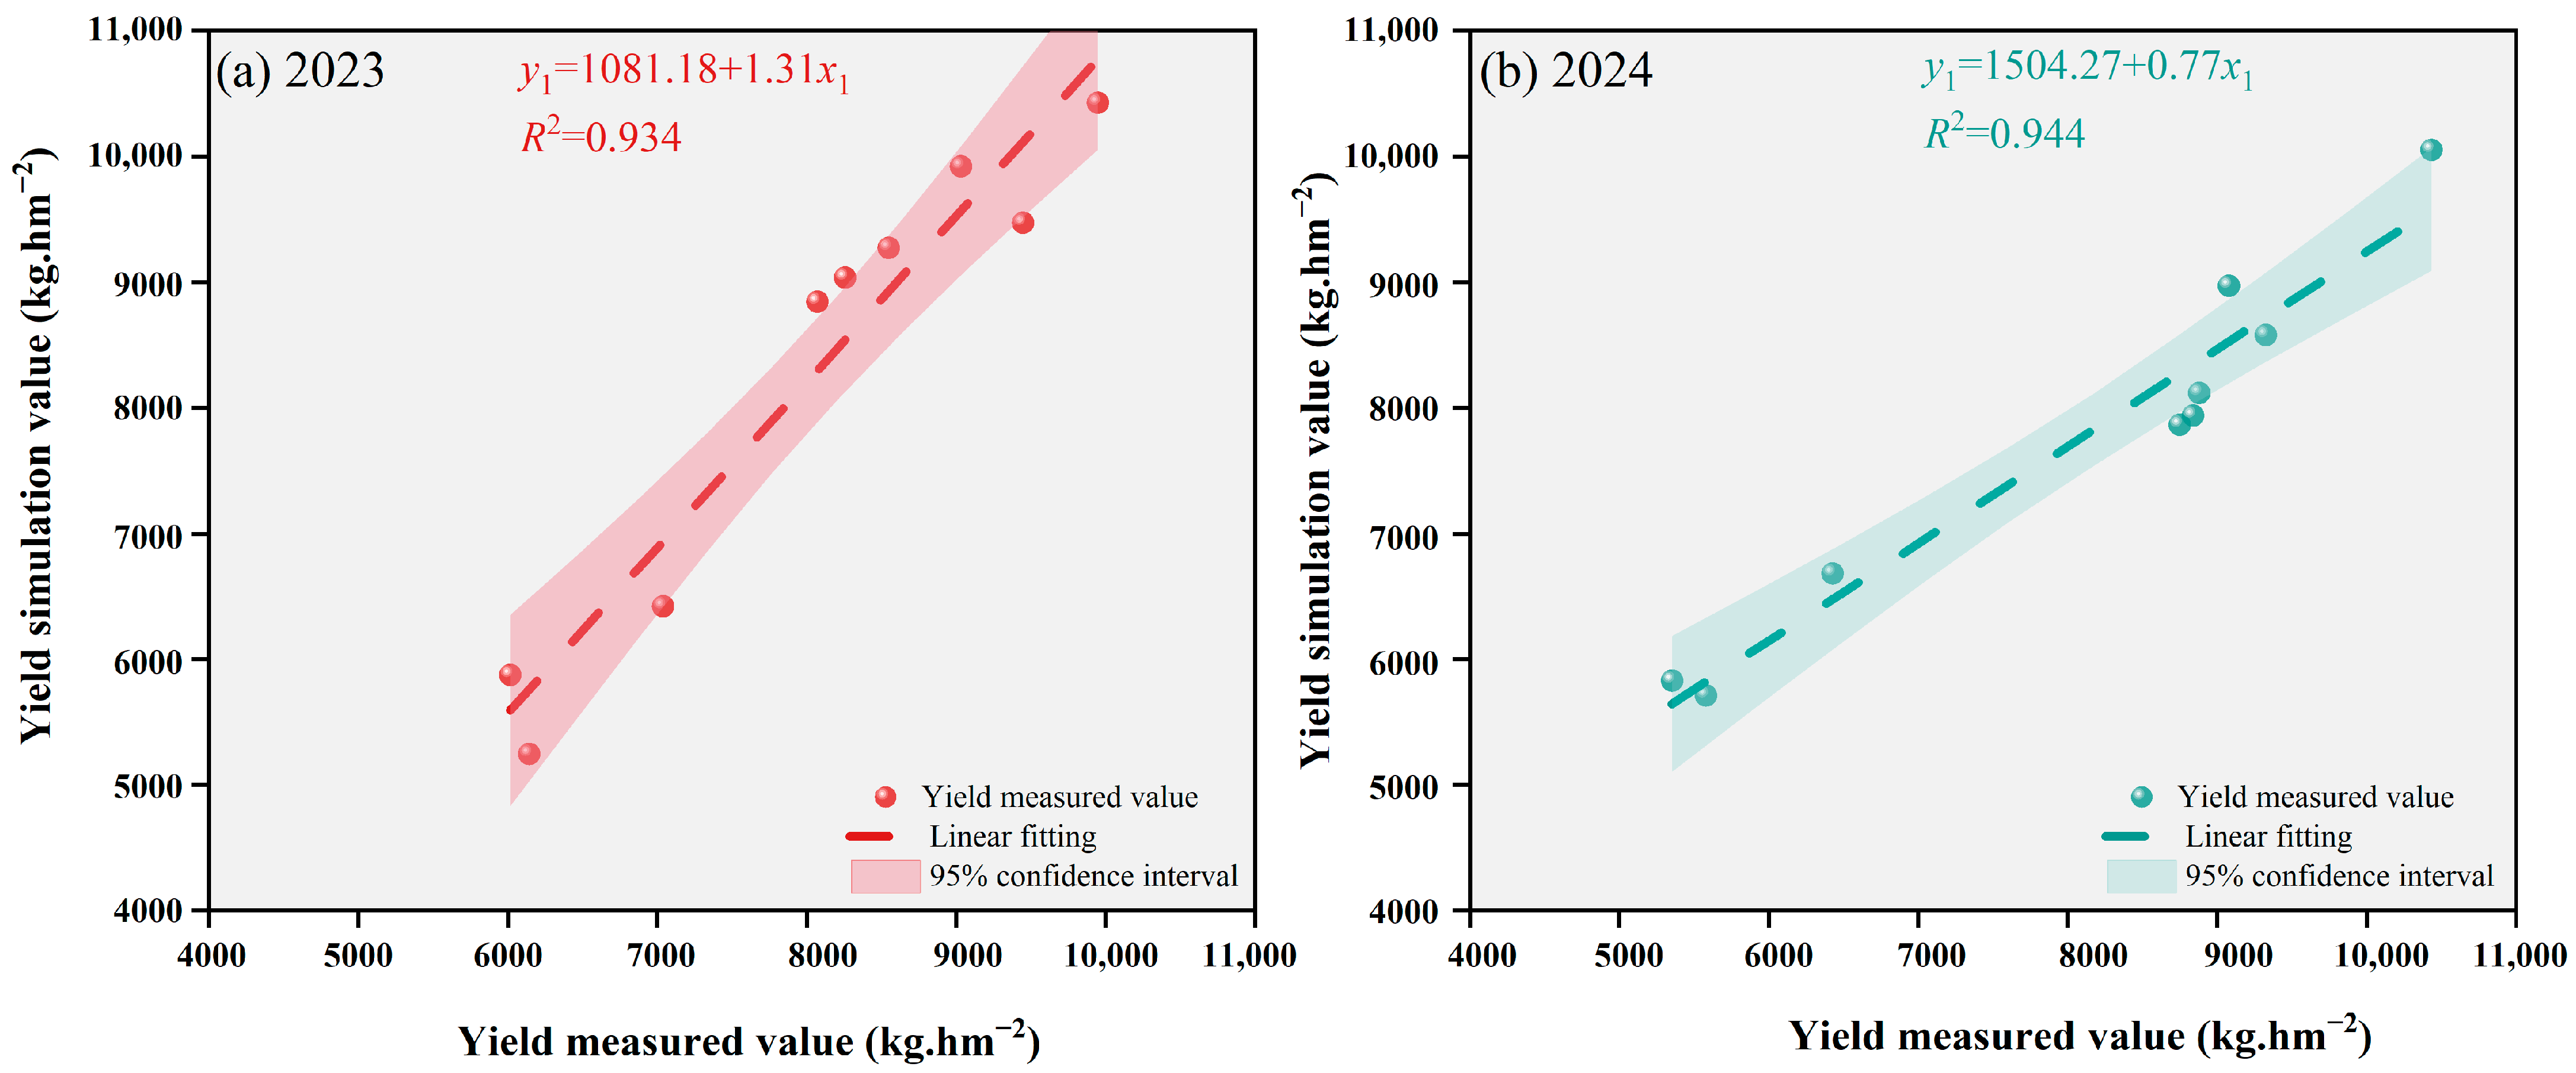
It can be seen in Figure 5 and Table 4 that the fitting equation between the measured and simulated values of the summer maize yield in 2023 was y1 = 1081.18 + 1.31x1. R2 was 0.934, RMSE was 664.027 kg/ha, and EF was 0.746. The fitting equation between the measured and simulated values of summer maize yield in 2024 was y1 = 1504.27 + 0.77x1. R2 was 0.944, RMSE was 593.873 kg/ha, and EF was 0.809. The results show that the DNDC model can reasonably simulate the yield of summer maize under different water and fertilizer treatments in real-time irrigation systems.

3.4.2. Validation of DNDC Model on N2O Emissions

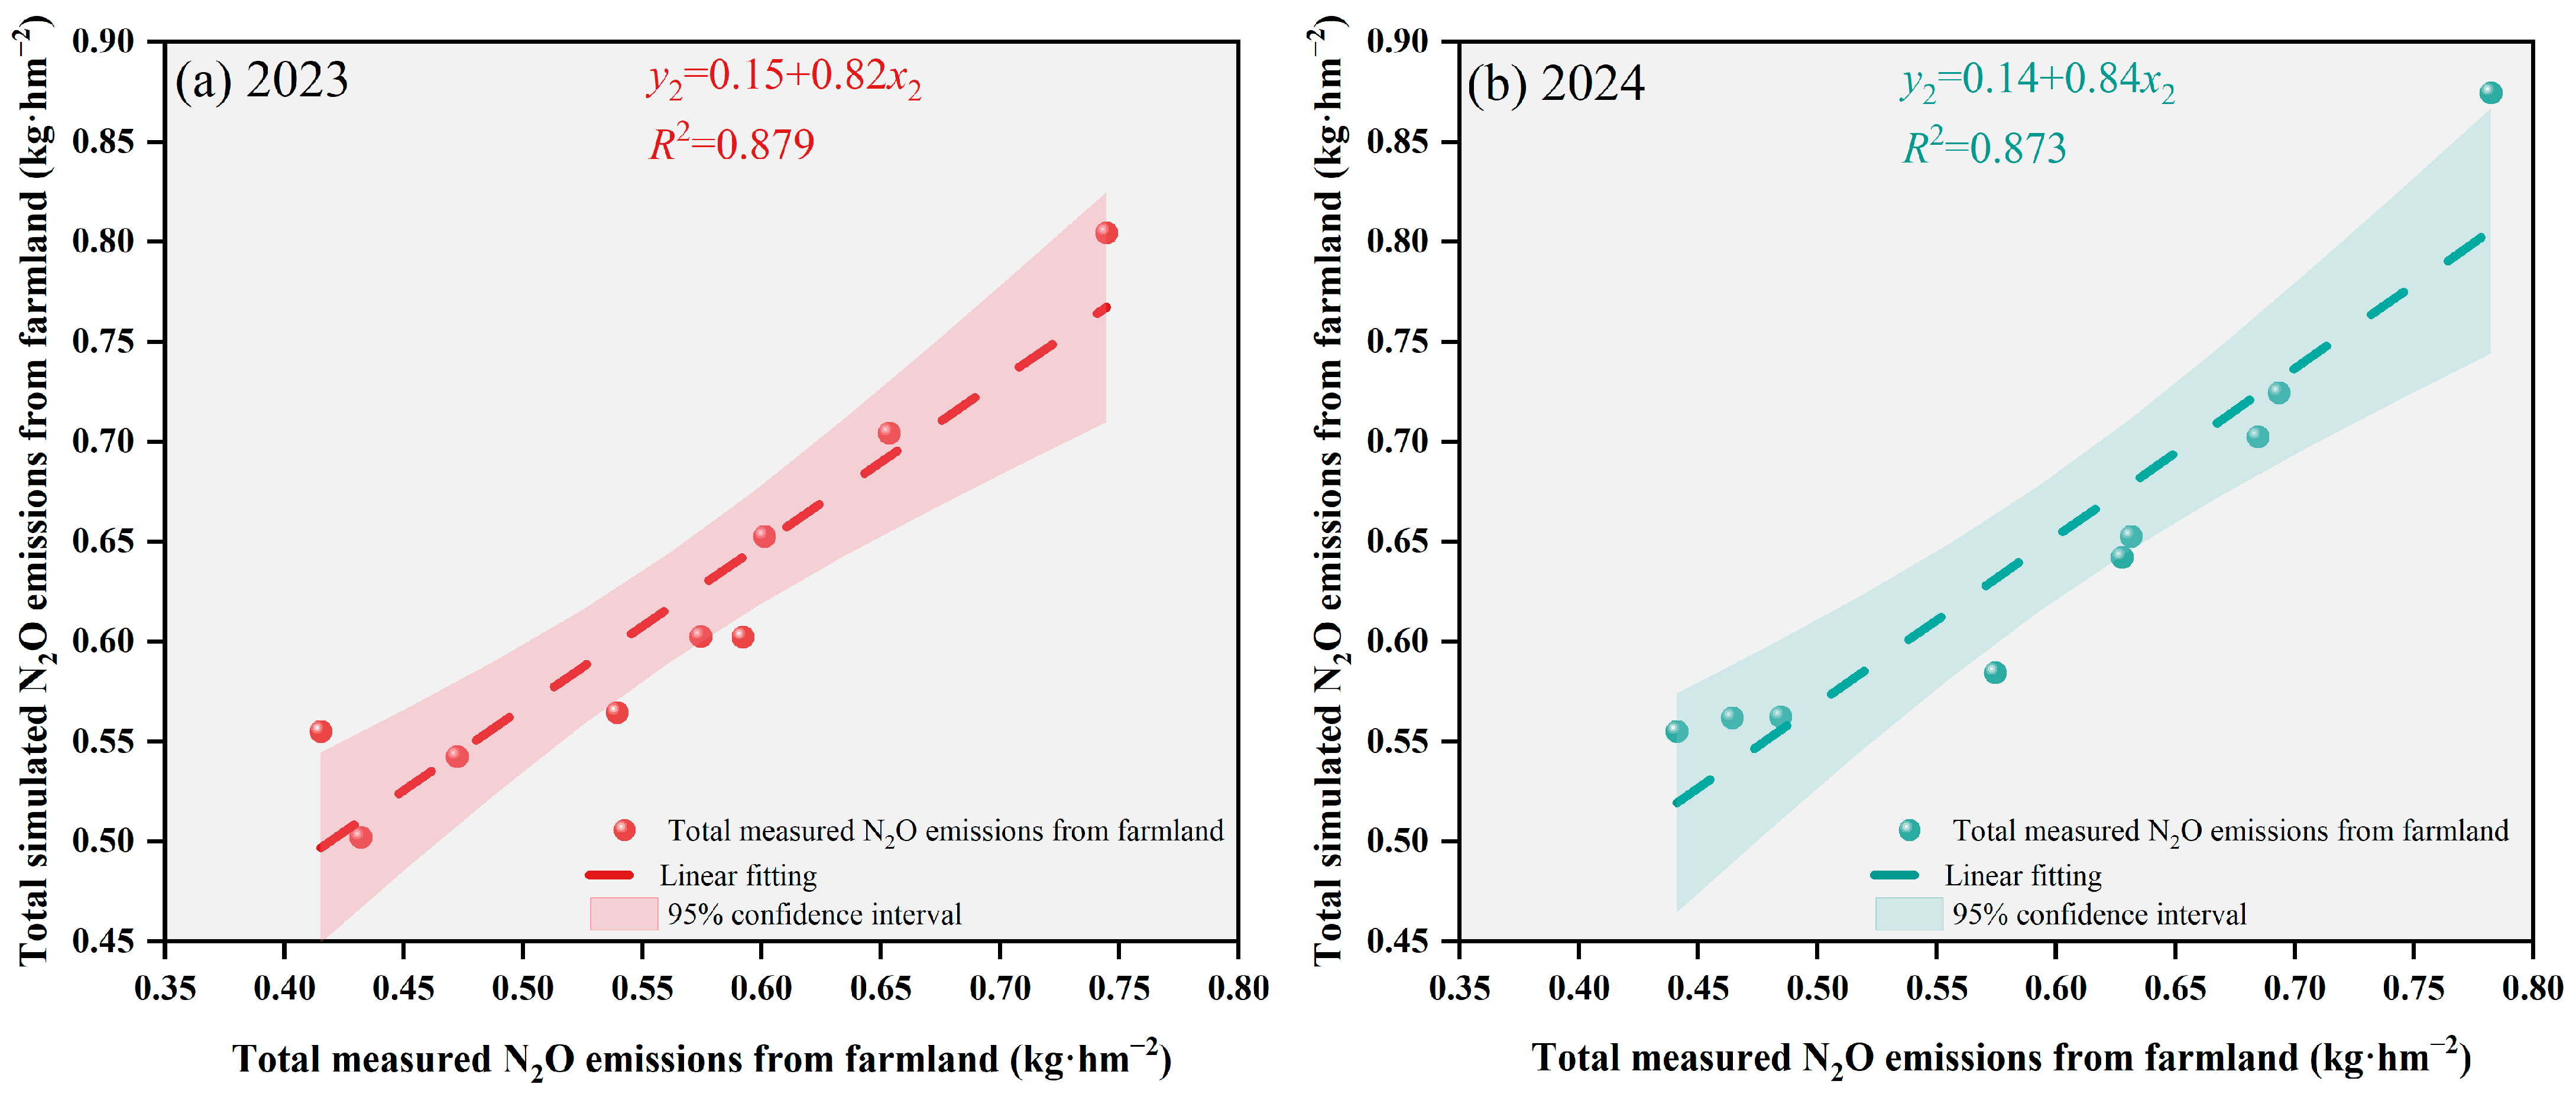
It can be seen in Figure 6 and Table 5 that the fitting equation between the measured and simulated values of N2O emissions from summer maize farmland in 2023 was y2 = 0.14 + 0.84x2. R2 was 0.873, RMSE was 0.066 kg/ha, and EF was 0.564. The fitting equation between the measured and simulated values of N2O emissions from summer maize farmland in 2024 was y1 = 0.15 + 0.82x2. R2 was 0.873, RMSE was 0.067 kg/ha, and EF was 0.639. The results show that the DNDC model can reasonably simulate total N2O emissions from summer maize farmland under different water and fertilizer treatments in real-time irrigation systems.

3.4.3. Validation of DNDC Model on CO2 Emissions

From Figure 7 and Table 6, it can be seen that the fitting equation between the measured and simulated values of total CO2 emissions from summer maize farmland in 2023 was y3 = 1712.57 + 0.73x3. R2 was 0.828, RMSE was 561.232 kg/ha, and EF was 0.818. The fitting equation between the measured and simulated values of total CO2 emissions from summer maize farmland in 2024 was y3 = 1901.94 + 0.70x3. R2 was 0.834, RMSE was 586.502 kg/ha, and EF was 0.811, indicating that the model can better simulate total CO2 emissions from summer maize farmland under different water and fertilizer treatments. In summary, the DNDC model shows good simulation performance for summer maize yields, total N2O emissions, and total CO2 emissions under different water and fertilizer treatments in real-time irrigation systems.

3.5. DNDC Model Simulation

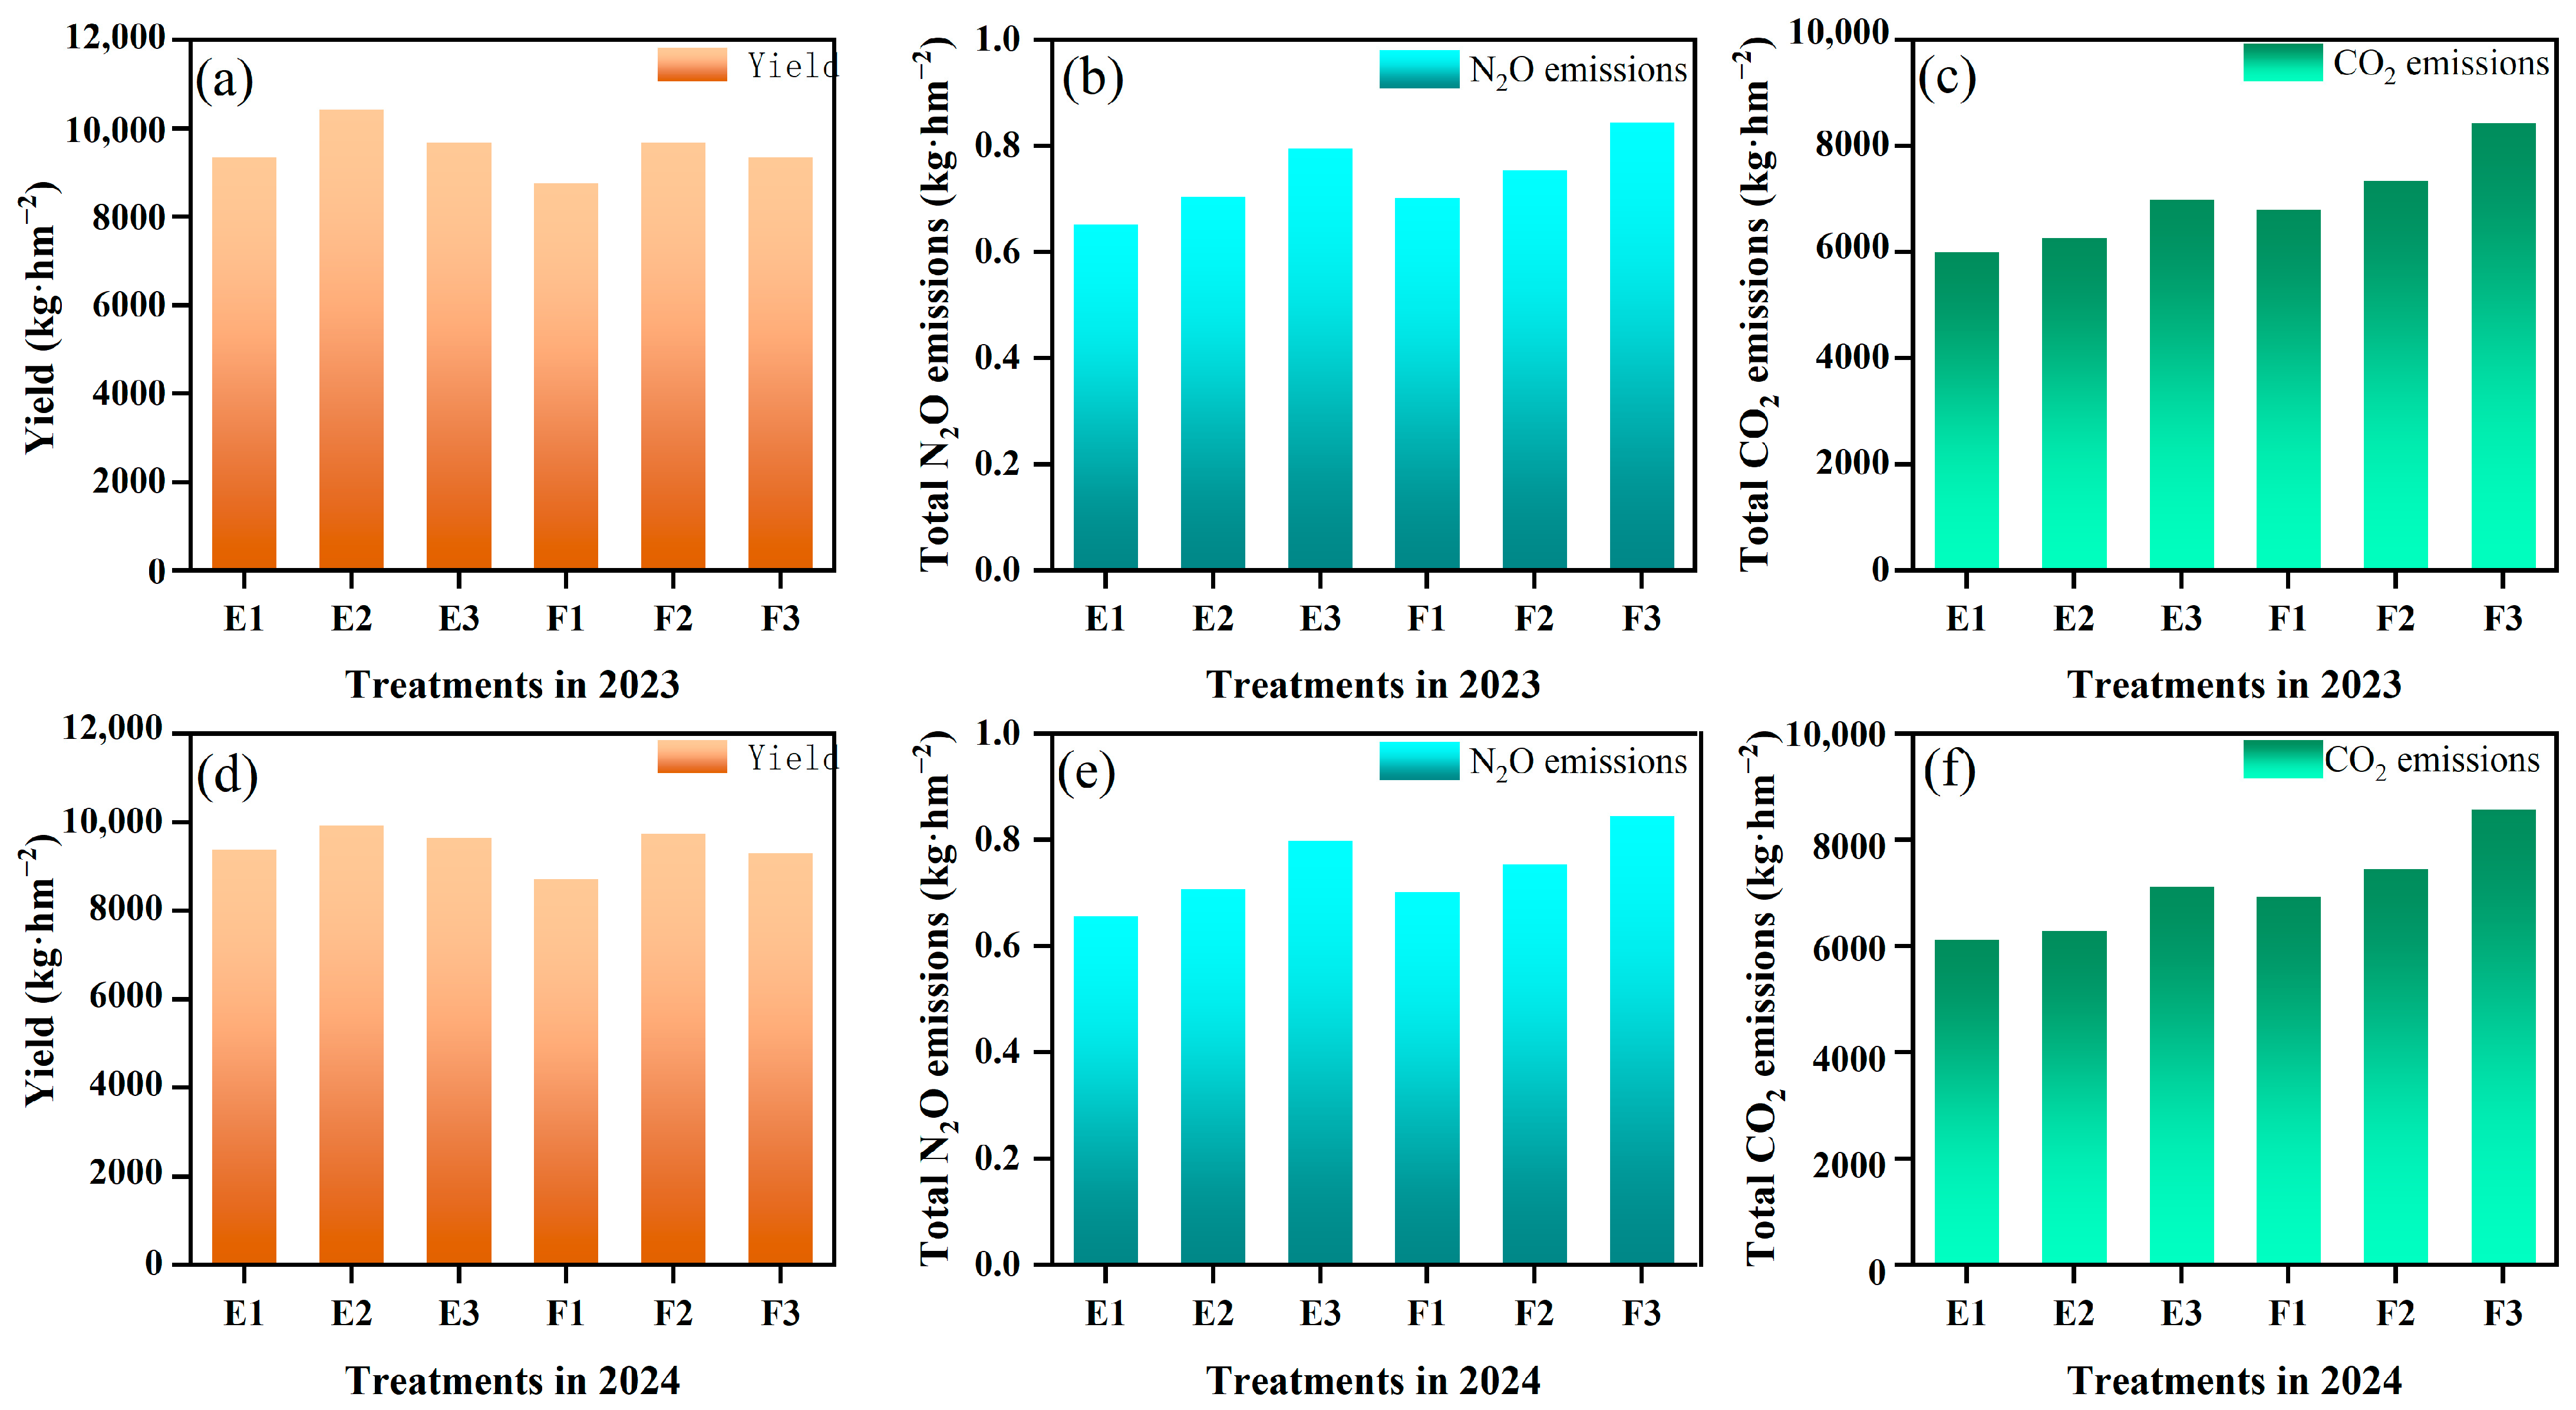
The calibrated DNDC model was used to simulate summer maize yields, total N2O emissions, and total CO2 emissions from farmland under specific scenarios (Figure 8). In 2023, the yields of the E1, E2, and E3 treatments under the real-time irrigation system increased by 6.86%, 7.80%, and 3.54%, respectively, compared with the F1, F2, and F3 treatments under sufficient irrigation. In 2024, the yields of the E1, E2, and E3 treatments under the real-time irrigation system increased by 7.71%, 1.85%, and 3.58%, respectively, compared with the F1, F2, and F3 treatments under full irrigation. This indicates that the real-time irrigation system is more conducive to increases in summer maize than full irrigation; that is, an appropriate water deficit can increase summer maize yields. In 2023, the total N2O emissions from the E1, E2, and E3 treatments under the real-time irrigation system were 7.13%, 6.63%, and 5.91% lower than those of the F1, F2, and F3 treatments, respectively. In 2024, the total N2O emissions from the E1, E2, and E3 treatments under the real-time irrigation system decreased by 6.76%, 6.30%, and 5.62%, respectively, compared with the F1, F2, and F3 treatments under full irrigation. In 2023, the total CO2 emissions from the E1, E2, and E3 treatments under the real-time irrigation system were 11.60%, 14.69%, and 17.15% lower than those of the F1, F2, and F3 treatments under full irrigation. In 2023, the total CO2 emissions from the E1, E2, and E3 treatments under the real-time irrigation system were 11.71%, 15.69%, and 16.97% lower than those of the F1, F2, and F3 treatments under full irrigation. In summary, the results show that the real-time irrigation system is more conducive to reducing greenhouse gas emissions than sufficient irrigation.

4. Discussion

In agricultural management, water and fertilizer are important factors affecting summer maize yields, total N2O emissions, and total CO2 emissions from farmland. Therefore, reasonable application of water and fertilizer can achieve the goal of low resource consumption and high efficiency. We found that the amounts of irrigation and fertilization had a significant effect on the yield of summer maize, and there was an interaction between the two, which was consistent with the results of Wang Rui. Both irrigation and fertilization significantly increased the total amount of N2O emissions from farmland, and there was a significant interaction between them. This is consistent with the research of Pareja-Sánchez et al. [33]. Because the effect of organic fertilizer application on soil N2O emissions is mainly due to exogenous C and N, fertilizer input affects soil N2O emissions by changing the C/N ratio [34]. The application of nitrogen fertilizer provides rich substrate for nitrification and denitrification, significantly increasing soil bacterial biomass and total phospholipid fatty acids, thereby promoting N2O production and emissions [35]. This is consistent with the results of this study. The medium fertilization level in this study can increase maize yield and significantly reduce greenhouse gas emissions. This may be because under the medium fertilization level, the microbial biomass in the soil is moderate [36], which not only ensures the decomposition of organic matter and the mineralization of nitrogen but also avoids nitrogen loss caused by excessive microbial activity [37]. An appropriate amount of nitrogen fertilizer can improve the activity of microorganisms and promote the transformation and circulation of nitrogen. This activity’s improvement helps plants use nitrogen in the soil more effectively, thereby increasing yield. In contrast, excessive nitrogen fertilizer application will damage plants and pollute the soil [38]. In addition, an appropriate ratio of water to fertilizer helps maintain appropriate soil moisture, promotes plant growth and nitrogen absorption, and reduces nitrogen loss through runoff and leaching, thereby reducing N2O emissions [39]. Under this irrigation condition, the application of a medium fertilization level significantly improved fertilizer-use efficiency and reduced nitrogen waste, which was cost-effective. The effect of irrigation and fertilization on total CO2 emissions was significant, consistent with the results of Ma et al. [40]. The main reason is that soil temperature, porosity, pH value, microbial activity, plant density, and the rate of greenhouse gas diffusion from soil to the atmosphere are affected by the combined effects of fertilizer application rate and soil moisture. Irrigation can significantly increase the sensitivity of soil respiration [41]. The DNDC model was used to simulate summer maize yields and total N2O and CO2 emissions from farmland under real-time irrigation and full irrigation systems. The results showed that the yield was the highest under the E2 treatment (7.80% higher than F2), while total N2O and CO2 emissions from farmland decreased by 6.63% and 14.69%, respectively. This shows that real-time irrigation is more conducive to increasing summer maize yields and reducing greenhouse gas emissions from farmland than full irrigation. However, this experiment only explored the effects of two factors (water and fertilizer) on total N2O and CO2 emissions from farmland. Other factors affecting total greenhouse gas emissions from farmland include tillage methods, greenhouses, soil moisture, etc. Further exploration is needed.
In summary, this study explored the effects of different water and fertilizer treatments on farmland N2O emissions, CO2 emissions, and summer maize yields under a real-time irrigation system and the applicability of the DNDC model. The simulation showed that the DNDC model had strong overall performance in estimating crop yields, NO2 emissions, and CO2 emissions. This demonstrates the potential of applying the DNDC model to quantify crop productivity and greenhouse gas emissions in maize systems. However, the calibration parameters may not be universally applicable due to varying soil and climatic conditions. Due to complex conditions between different locations, model parameters for specific locations should be calibrated to match local observations. In this study, model calibration and validation were based on field measurements. The calibrated model parameters can be used as a guide for extrapolating maize systems to other research sites or regions. Under the DNDC model, it was found that the summer maize yield in the real-time irrigation system was higher than in the full irrigation system, while total NO2 and CO2 emissions were significantly lower. Therefore, the real-time irrigation system in this study can be used as a cost-effective tool for reducing greenhouse gas emissions.

4.1. Research Limitations and Future Work

4.1.1. Planting Date

Wang et al.’s study [42] found that delaying sowing date would reduce the yield of winter wheat and wheat-maize systems and increase N2O accumulation and emissions. The results showed that sowing in early October benefited yield increase and N2O emission reduction. Delaying the sowing date reduces the number of tillers before wintering and jointing, resulting in dry-matter loss [43]. It also shortens the length of the total growing season, thereby reducing heat build-up and further limiting dry-matter accumulation [44]. Early sowing may also help maize better adapt to the shortening of the growing season caused by rising temperatures under climate change, avoiding adverse effects of cold stress [45]. In contrast, a study [46] has shown that maize planted on May 1 (early sowing) had yields 7.3%, 8.4%, 6.3%, 7.2%, and 6.4% higher than maize treated with nitrogen-fertilizer optimization. It is understood that farmers’ maize sowing dates are often between 20 April and 5 May. Therefore, the positive effect of an early sowing date on maize yield can be attributed to increased solar-radiation interception during the vegetative period and increased thermal time during the reproductive period [47]. These results indicate that under future climate change, slightly advancing and moderately delaying the sowing date may be better adaptation measures for farmers’ maize planting and environmentally sustainable production, respectively. In short, advancing or delaying the maize sowing date may impact DNDC model simulations of greenhouse gas emissions. However, this study did not examine the effects of the maize sowing date, which is a limitation.

4.1.2. Tillage Measures

Scholars have different views on the effects of tillage measures on crop yield and N2O emissions. Fan et al.’s study [46] found that no-tillage is more suitable for maize planting than spring chisel ploughing prior to planting, and that no-tillage can increase maize yield by 2.1–3.7%. This is consistent with previous reports that no-tillage [48] can increase maize yield by improving soil water storage and dry-matter accumulation [49]. However, other studies have shown that no-tillage may lead to reduced maize yield, partly due to the decreases in root length, root length density, and root surface area density as soil density increases and soil aeration decreases under no-tillage [50]. These inconsistent conclusions may be due to differences in climatic and soil conditions among regions; the effects of no-tillage on N2O emissions also vary. N2O emissions under no-tillage mainly depend on the soil’s porosity, texture, and aeration characteristics [51]. When soil aeration is high, denitrification is inhibited [43], reducing soil N2O. In contrast, low soil aeration promotes the denitrification of microorganisms and produces N2O. Due to the different soil properties in different regions, the effects of tillage measures on maize yield and N2O emissions differ. Therefore, the results of this study cannot yet be generalized for large-scale applications, which is another limitation of this study. If the scope of application of the DNDC model is to be expanded, it is necessary to study soil properties and tillage measures across different regions.

4.1.3. Cover Crops

Planting cover crops is one of the management methods related to climate-smart agriculture (CSA) and has been assessed as a tool to reduce the environmental impact of crop agriculture [52]. Although the potential benefits of CSA practices have been independently studied and simulated in different cropping systems, the adoption of CSA is still relatively limited [53]. In the United States, it is estimated that 31% of maize (Zea mays) and 46% of soybean (Glycine max) are managed by no-tillage or strip tillage, and only 2% of farmland is covered with crops [54]. Studies have shown that mulching crops significantly impacts the nitrogen cycle in agricultural ecosystems. Mulching crops can effectively chelate mineral nitrogen in the soil, preventing nitrate loss. Mulching crops may affect soil N2O emissions by reducing the available mineral nitrogen in the soil during the active growth period and by providing substrates for post-mortem denitrifying bacteria [55].

4.1.4. Future Work

Irrigation and fertilization are important factors affecting crop yields, soil N2O, and CO2. Simulated irrigation and fertilization can reduce greenhouse gas emissions from agriculture. However, crop yield and greenhouse gas mitigation efficiency depend on the sowing date, tillage practices, soil characteristics, mulching crops, organic amendments, and weather conditions. These factors may significantly affect the simulation accuracy of the DNDC model. This study mainly studied the irrigation and fertilization amounts with the most significant influence, and did not compare and simulate other influencing factors, which is another limitation of this paper. In addition, the DNDC model mentioned in this study also requires further model validation at sites with different soil, weather, and management practices to improve the accuracy of its estimations. This study provides a low-cost, data-driven approach to quantify climate-smart agricultural practices and strategically position them in areas that may offer the most significant potential for GHG mitigation. In the future, it is urgent to improve the dynamic simulation of soil nitrogen under long-term nitrogen stress, continuously improve the accuracy of the DNDC model, and include more influencing factors to study their interaction effects in order to broaden the application of the DNDC model and guide environmentally sustainable maize production.

5. Conclusions

In this paper, summer maize in Henan Province under a real-time irrigation system, with little prior research, was selected as the research object. From the perspectives of reducing agricultural greenhouse gas emissions and improving water-use efficiency, a field experiment of summer maize with water and fertilizer treatments under the real-time irrigation system was carried out over 2 years. The variation characteristics of total N2O and CO2 emissions from farmland under different water and fertilizer combinations were revealed. At the same time, the DNDC model was used to simulate the summer maize yields, total N2O emissions, and total CO2 emissions in Henan Province. The main conclusions are as follows:
(1)
Irrigation and fertilization significantly affected the summer maize yields, total N2O emissions, and total CO2 emissions under the real-time irrigation system, and there was a significant interaction between them.
(2)
The field-measured data of the summer maize yields verified the DNDC model. The results showed that the simulated values of the summer maize yields and total N2O and CO2 emissions from farmland with different water and fertilizer treatments under the real-time irrigation system were highly consistent with the measured values, indicating that the DNDC model can simulate summer maize yields and total greenhouse gas emissions from dryland farmland. The application of the model to evaluate greenhouse gas emissions from dryland farmland has certain reliability.
(3)
Under the simulated scenario, the summer maize yields under the real-time irrigation system in 2023 and 2024 increased by 4.43% and 4.38% compared with those under full irrigation. In addition, the total N2O emissions from farmland were reduced by 6.56% and 6.22%, respectively, compared with full irrigation, while the total CO2 emissions from farmland were 14.49% and 14.79% lower than those of full irrigation, indicating that the real-time irrigation system saved water, increased yields, and reduced greenhouse gas emissions from farmland.

Supplementary Materials

The following supporting information can be downloaded at: https://www.mdpi.com/article/10.3390/agronomy15081951/s1, Table S1: Real-time irrigation system of summer maize.

Author Contributions

Conceptualization, B.C. and J.M.; methodology, B.C.; software, B.C.; validation, B.C., L.L., Y.Z., X.H., Y.D., Y.C. and J.H.; formal analysis, L.L.; investigation, B.C.; resources, X.H.; data curation, B.C.; writing—original draft preparation, B.C.; writing—review and editing, J.M.; visualization, B.C.; supervision, B.C.; project administration, L.L., X.H. and Y.C.; funding acquisition, J.M. All authors have read and agreed to the published version of the manuscript.

Funding

This research was funded by the Projects in Henan Province, grant numbers 241111112600 (Funder: Jianqin Ma), Technical Assistance Project, grant numbers TA-6883 (Funder: Jianqin Ma), North China University of Water Resources and Electric Power ‘double first-class’ innovation team project, grant numbers CXTDPY-8, National Natural Youth Science Foundation, grant numbers 52309018 (Funder: Jianqin Ma).

Conflicts of Interest

The authors declare no conflict of interest.

References

  1. Bennetzen, E.H.; Smith, P.; Porter, J.R. Agricultural Production and Greenhouse Gas Emissions from World Regions—The Major Trends over 40 Years. Glob. Environ. Chang. 2016, 37, 43–55. [Google Scholar] [CrossRef]
  2. Zhang, J.; Guo, Y.; Han, J.; Ji, Y.; Zhang, L. Greenhouse Gas Emissions and Net Global Warming Potential of Vineyards under Different Fertilizer and Water Managements in North China. Agric. Water Manag. 2021, 243, 106521. [Google Scholar] [CrossRef]
  3. Wang, J.; Hussain, S.; Sun, X.; Chen, X.; Ma, Z.; Zhang, Q.; Yu, X.; Zhang, P.; Ren, X.; Saqib, M.; et al. Nitrogen Application at a Lower Rate Reduce Net Field Global Warming Potential and Greenhouse Gas Intensity in Winter Wheat Grown in Semi-Arid Region of the Loess Plateau. Field Crops Res. 2022, 280, 108475. [Google Scholar] [CrossRef]
  4. Hamad, A.A.; Wei, Q.; Xu, J.; Hamoud, Y.A.; He, M.; Shaghaleh, H.; Wei, Q.; Li, X.; Qi, Z. Managing Fertigation Frequency and Level to Mitigate N2O and CO2 Emissions and NH3 Volatilization from Subsurface Drip-Fertigated Field in a Greenhouse. Agronomy 2022, 12, 1414. [Google Scholar] [CrossRef]
  5. Liu, T.Q.; Li, S.H.; Guo, L.G.; Cao, C.G.; Li, C.F.; Zhai, Z.B.; Zhou, J.Y.; Mei, Y.M.; Ke, H.J. Advantages of Nitrogen Fertilizer Deep Placement in Greenhouse Gas Emissions and Net Ecosystem Economic Benefits from No-Tillage Paddy Fields. J. Clean. Prod. 2020, 263, 121322. [Google Scholar] [CrossRef]
  6. Zhang, G.; Huang, Q.; Song, K.; Yu, H.; Ma, J.; Xu, H. Responses of Greenhouse Gas Emissions and Soil Carbon and Nitrogen Sequestration to Field Management in the Winter Season: A 6-Year Measurement in a Chinese Double-Rice Field. Agric. Ecosyst. Environ. 2021, 318, 107506. [Google Scholar] [CrossRef]
  7. Zhang, F.; Liu, F.; Ma, X.; Guo, G.; Liu, B.; Cheng, T.; Liang, T.; Tao, W.; Chen, X.; Wang, X. Greenhouse Gas Emissions from Vegetables Production in China. J. Clean. Prod. 2021, 317, 128449. [Google Scholar] [CrossRef]
  8. Liang, T.; Liao, D.; Wang, S.; Yang, B.; Zhao, J.; Zhu, C.; Tao, Z.; Shi, X.; Chen, X.; Wang, X. The Nitrogen and Carbon Footprints of Vegetable Production in the Subtropical High Elevation Mountain Region. Ecol. Indic. 2021, 122, 107298. [Google Scholar] [CrossRef]
  9. Huang, Q.; Zhang, G.; Ma, J.; Song, K.; Zhu, X.; Shen, W.; Xu, H. Dynamic Interactions of Nitrogen Fertilizer and Straw Application on Greenhouse Gas Emissions and Sequestration of Soil Carbon and Nitrogen: A 13-Year Field Study. Agric. Ecosyst. Environ. 2022, 325, 107753. [Google Scholar] [CrossRef]
  10. Guo, L.; Zhao, S.; Song, Y.; Tang, M.; Li, H. Green Finance, Chemical Fertilizer Use and Carbon Emissions from Agricultural Production. Agriculture 2022, 12, 313. [Google Scholar] [CrossRef]
  11. Cui, H.; Wang, Y.; Luo, Y.; Jin, M.; Chen, J.; Pang, D.; Li, Y.; Wang, Z. Tillage Strategies Optimize SOC Distribution to Reduce Carbon Footprint. Soil Tillage Res. 2022, 223, 105499. [Google Scholar] [CrossRef]
  12. Wang, H.; Wang, S.; Yu, Q.; Zhang, Y.; Wang, R.; Li, J.; Wang, X. No Tillage Increases Soil Organic Carbon Storage and Decreases Carbon Dioxide Emission in the Crop Residue-Returned Farming System. J. Environ. Manag. 2020, 261, 110261. [Google Scholar] [CrossRef] [PubMed]
  13. Guo, Z.; Liu, Y.; Meng, X.; Yang, X.; Ma, C.; Chai, H.; Li, H.; Ding, R.; Nazarov, K.; Zhang, X.; et al. The Long-Term Nitrogen Fertilizer Management Strategy Based on Straw Return Can Improve the Productivity of Wheat-Maize Rotation System and Reduce Carbon Emissions by Increasing Soil Carbon and Nitrogen Sequestration. Field Crops Res. 2024, 317, 109561. [Google Scholar] [CrossRef]
  14. Li, J.; Li, Y.; Lin, N.; Fang, Y.; Dong, Q.; Zhang, T.; Siddique, K.H.M.; Wang, N.; Feng, H. Ammoniated Straw Returning: A Win-Win Strategy for Increasing Crop Production and Soil Carbon Sequestration. Agric. Ecosyst. Environ. 2024, 363, 108879. [Google Scholar] [CrossRef]
  15. Chen, X.; Xie, Y.; Wang, J.; Shi, Z.; Zhang, J.; Wei, H.; Ma, Y. Presence of Different Microplastics Promotes Greenhouse Gas Emissions and Alters the Microbial Community Composition of Farmland Soil. Sci. Total Environ. 2023, 879, 162967. [Google Scholar] [CrossRef]
  16. Ni, B.; Zhang, W.; Xu, X.; Wang, L.; Bol, R.; Wang, K.; Hu, Z.; Zhang, H.; Meng, F. Exponential Relationship between N2O Emission and Fertilizer Nitrogen Input and Mechanisms for Improving Fertilizer Nitrogen Efficiency under Intensive Plastic-Shed Vegetable Production in China: A Systematic Analysis. Agric. Ecosyst. Environ. 2021, 312, 107353. [Google Scholar] [CrossRef]
  17. Wang, Y.Y.; Hu, C.S.; Ming, H.; Zhang, Y.M.; Li, X.X.; Dong, W.X.; Oenema, O. Concentration Profiles of CH4, CO2 and N2O in Soils of a Wheat-Maize Rotation Ecosystem in North China Plain, Measured Weekly over a Whole Year. Agric. Ecosyst. Environ. 2013, 164, 260–272. [Google Scholar] [CrossRef]
  18. Xu, P.; Li, Z.; Wang, J.; Zou, J. Fertilizer-Induced Nitrous Oxide Emissions from Global Orchards and Its Estimate of China. Agric. Ecosyst. Environ. 2022, 328, 107854. [Google Scholar] [CrossRef]
  19. Ardenti, F.; Abalos, D.; Capra, F.; Lommi, M.; Maris, S.C.; Perego, A.; Bertora, C.; Tabaglio, V.; Fiorini, A. Matching Crop Row and Dripline Distance in Subsurface Drip Irrigation Increases Yield and Mitigates N2O Emissions. Field Crops Res. 2022, 289, 108732. [Google Scholar] [CrossRef]
  20. Wang, H.; Wang, N.; Quan, H.; Zhang, F.; Fan, J.; Feng, H.; Cheng, M.; Liao, Z.; Wang, X.; Xiang, Y. Yield and Water Productivity of Crops, Vegetables and Fruits under Subsurface Drip Irrigation: A Global Meta-Analysis. Agric. Water Manag. 2022, 269, 107645. [Google Scholar] [CrossRef]
  21. Abdalla, M.; Song, X.; Ju, X.; Topp, C.F.E.; Smith, P. Calibration and Validation of the DNDC Model to Estimate Nitrous Oxide Emissions and Crop Productivity for a Summer Maize-Winter Wheat Double Cropping System in Hebei, China. Environ. Pollut. 2020, 262, 114199. [Google Scholar] [CrossRef]
  22. Tian, Z.; Fan, Y.; Wang, K.; Zhong, H.; Sun, L.; Fan, D.; Tubiello, F.N.; Liu, J. Searching for “Win-Win” Solutions for Food-Water-GHG Emissions Tradeoffs across Irrigation Regimes of Paddy Rice in China. Resour. Conserv. Recycl. 2021, 166, 105360. [Google Scholar] [CrossRef]
  23. Grant, F.; Sheline, C.; Sokol, J.; Amrose, S.; Brownell, E.; Nangia, V.; Winter, A.G. Creating a Solar-Powered Drip Irrigation Optimal Performance Model (SDrOP) to Lower the Cost of Drip Irrigation Systems for Smallholder Farmers. Appl. Energy 2022, 323, 119563. [Google Scholar] [CrossRef]
  24. Alderman, P.D. A Comprehensive R Interface for the DSSAT Cropping Systems Model. Comput. Electron. Agric. 2020, 172, 105325. [Google Scholar] [CrossRef]
  25. Chapagain, R.; Huth, N.; Remenyi, T.A.; Mohammed, C.L.; Ojeda, J.J. Assessing the Effect of Using Different APSIM Model Configurations on Model Outputs. Ecol. Model. 2023, 483, 110451. [Google Scholar] [CrossRef]
  26. Ntakos, G.; Prikaziuk, E.; ten Den, T.; Reidsma, P.; Vilfan, N.; van der Wal, T.; van der Tol, C. Coupled WOFOST and SCOPE Model for Remote Sensing-Based Crop Growth Simulations. Comput. Electron. Agric. 2024, 225, 109238. [Google Scholar] [CrossRef]
  27. Chang, N.; Chen, D.; Cai, Y.; Li, J.; Zhang, M.; Li, H.; Wang, L. Enhancing Crop Yield and Carbon Sequestration and Greenhouse Gas Emission Mitigation through Different Organic Matter Input in the Bohai Rim Region: An Estimation Based on the DNDC-RF Framework. Field Crops Res. 2024, 319, 109624. [Google Scholar] [CrossRef]
  28. Zhang, Y.; Yu, Q. Does Agroecosystem Model Improvement Increase Simulation Accuracy for Agricultural N2O Emissions? Agric. For. Meteorol. 2021, 297, 108281. [Google Scholar] [CrossRef]
  29. Zhao, Z.; Cao, L.; Deng, J.; Sha, Z.; Chu, C.; Zhou, D.; Wu, S.; Lv, W. Modeling CH4 and N2O Emission Patterns and Mitigation Potential from Paddy Fields in Shanghai, China with the DNDC Model. Agric. Syst. 2020, 178, 102743. [Google Scholar] [CrossRef]
  30. Yao, Y.; Li, G.; Lu, Y.; Liu, S. Modelling the Impact of Climate Change and Tillage Practices on Soil CO2 Emissions from Dry Farmland in the Loess Plateau of China. Ecol. Model. 2023, 478, 110276. [Google Scholar] [CrossRef]
  31. Cao, S.; Liu, X.; Er, H. Dujiangyan Irrigation System—A World Cultural Heritage Corresponding to Concepts of Modern Hydraulic Science. J. Hydro-Environ. Res. 2010, 4, 3–13. [Google Scholar] [CrossRef]
  32. Li, C.; Frolking, S.; Frolking, T.A. A model of nitrous oxide evolution from soil driven by rainfall events: 2. Model applications. J. Geophys. Res. 1992, 97, 9777–9783. [Google Scholar] [CrossRef]
  33. Pareja-Sánchez, E.; Cantero-Martínez, C.; Álvaro-Fuentes, J.; Plaza-Bonilla, D. Impact of Tillage and N Fertilization Rate on Soil N2O Emissions in Irrigated Maize in a Mediterranean Agroecosystem. Agric. Ecosyst. Environ. 2020, 287, 106687. [Google Scholar] [CrossRef]
  34. Yao, X.; Zhang, Z.; Li, K.; Yuan, F.; Xu, X.; Long, X.; Song, C. Optimizing Water and Nitrogen Management to Balance Greenhouse Gas Emissions and Yield in Chinese Rice Paddies. Field Crops Res. 2024, 319, 109621. [Google Scholar] [CrossRef]
  35. Xiao, C.; Zhang, F.; Li, Y.; Fan, J.; Ji, Q.; Jiang, F.; He, Z. Optimizing Drip Irrigation and Nitrogen Fertilization Regimes to Reduce Greenhouse Gas Emissions, Increase Net Ecosystem Carbon Budget and Reduce Carbon Footprint in Saline Cotton Fields. Agric. Ecosyst. Environ. 2024, 366, 108912. [Google Scholar] [CrossRef]
  36. Li, W.; Xie, L.; Zhao, C.; Hu, X.; Yin, C. Nitrogen Fertilization Increases Soil Microbial Biomass and Alters Microbial Composition Especially Under Low Soil Water Availability. Microb. Ecol. 2023, 86, 536–548. [Google Scholar] [CrossRef]
  37. Bahrulolum, H.; Nooraei, S.; Javanshir, N.; Tarrahimofrad, H.; Mirbagheri, V.S.; Easton, A.J.; Ahmadian, G. Green Synthesis of Metal Nanoparticles Using Microorganisms and Their Application in the Agrifood Sector. J. Nanobiotechnol. 2021, 19, 86. [Google Scholar] [CrossRef]
  38. Tyagi, J.; Ahmad, S.; Malik, M. Nitrogenous Fertilizers: Impact on Environment Sustainability, Mitigation Strategies, and Challenges. Int. J. Environ. Sci. Technol. 2022, 19, 11649–11672. [Google Scholar] [CrossRef]
  39. Jiang, M.; Dong, C.; Bian, W.; Zhang, W.; Wang, Y. Effects of Different Fertilization Practices on Maize Yield, Soil Nutrients, Soil Moisture, and Water Use Efficiency in Northern China Based on a Meta-Analysis. Sci. Rep. 2024, 14, 6480. [Google Scholar] [CrossRef]
  40. Ma, Z.; Zhu, Y.; Liu, J.; Li, Y.; Zhang, J.; Wen, Y.; Song, L.; Liang, Y.; Wang, Z. Multi-Objective Optimization of Saline Water Irrigation in Arid Oasis Regions: Integrating Water-Saving, Salinity Control, Yield Enhancement, and CO2 Emission Reduction for Sustainable Cotton Production. Sci. Total Environ. 2024, 912, 169672. [Google Scholar] [CrossRef]
  41. Ao, Y.; Hou, R.; Fu, Q.; Li, T.; Li, M.; Cui, S.; Liu, D. Mechanisms of Soil Respiration and Its Temperature Sensitivity in Black Soil Farmland. J. Clean. Prod. 2023, 427, 139066. [Google Scholar] [CrossRef]
  42. Wang, C.; Zhao, J.; Gao, Z.; Feng, Y.; Laraib, I.; Chen, F.; Chu, Q. Exploring Wheat-Based Management Strategies to Balance Agricultural Production and Environmental Sustainability in a Wheat−maize Cropping System Using the DNDC Model. J. Environ. Manag. 2022, 307, 114445. [Google Scholar] [CrossRef] [PubMed]
  43. Yin, L.; Ji, Y.; Zhang, Y.; Chong, L.; Chen, L. Rotifer Community Structure and Its Response to Environmental Factors in the Backshore Wetland of Expo Garden, Shanghai. Aquac. Fish. 2018, 3, 90–97. [Google Scholar] [CrossRef]
  44. Myrbeck, Å.; Stenberg, M.; Rydberg, T. Establishment of Winter Wheat—Strategies for Reducing the Risk of Nitrogen Leaching in a Cool-Temperate Region. Soil Tillage Res. 2012, 120, 25–31. [Google Scholar] [CrossRef]
  45. Braunack, M.V.; Bange, M.P.; Johnston, D.B. Can Planting Date and Cultivar Selection Improve Resource Use Efficiency of Cotton Systems? Field Crops Res. 2012, 137, 1–11. [Google Scholar] [CrossRef]
  46. Fan, D.; Song, D.; Jiang, R.; He, P.; Shi, Y.; Pan, Z.; Zou, G.; He, W. Modelling Adaptation Measures to Improve Maize Production and Reduce Soil N2O Emissions under Climate Change in Northeast China. Atmos. Environ. 2024, 319, 120241. [Google Scholar] [CrossRef]
  47. Zhu, G.; Liu, Z.; Qiao, S.; Zhang, Z.; Huang, Q.; Su, Z.; Yang, X. How Could Observed Sowing Dates Contribute to Maize Potential Yield under Climate Change in Northeast China Based on APSIM Model. Eur. J. Agron. 2022, 136, 126511. [Google Scholar] [CrossRef]
  48. Behnke, G.D.; Zuber, S.M.; Pittelkow, C.M.; Nafziger, E.D.; Villamil, M.B. Long-Term Crop Rotation and Tillage Effects on Soil Greenhouse Gas Emissions and Crop Production in Illinois, USA. Agric. Ecosyst. Environ. 2018, 261, 62–70. [Google Scholar] [CrossRef]
  49. Wang, Y.; Zhang, Y.; Zhou, S.; Wang, Z. Meta-Analysis of No-Tillage Effect on Wheat and Maize Water Use Efficiency in China. Sci. Total Environ. 2018, 635, 1372–1382. [Google Scholar] [CrossRef]
  50. Dai, Z.; Hu, J.; Fan, J.; Fu, W.; Wang, H.; Hao, M. No-Tillage with Mulching Improves Maize Yield in Dryland Farming through Regulating Soil Temperature, Water and Nitrate-N. Agric. Ecosyst. Environ. 2021, 309, 107288. [Google Scholar] [CrossRef]
  51. Mutegi, J.K.; Munkholm, L.J.; Petersen, B.M.; Hansen, E.M.; Petersen, S.O. Nitrous Oxide Emissions and Controls as Influenced by Tillage and Crop Residue Management Strategy. Soil Biol. Biochem. 2010, 42, 1701–1711. [Google Scholar] [CrossRef]
  52. Hung, C.-Y.; Whalen, J.K. Plausible Impacts of Fall Manuring on Cover Crop Production and Spring Nitrous Oxide Emissions under Climate Change in Southern Quebec, Canada. Agric. Ecosyst. Environ. 2021, 321, 107620. [Google Scholar] [CrossRef]
  53. McNunn, G.; Karlen, D.L.; Salas, W.; Rice, C.W.; Mueller, S.; Muth, D.; Seale, J.W. Climate Smart Agriculture Opportunities for Mitigating Soil Greenhouse Gas Emissions across the U.S. Corn-Belt. J. Clean. Prod. 2020, 268, 122240. [Google Scholar] [CrossRef]
  54. Parkin, T.B.; Kaspar, T.C.; Jaynes, D.B.; Moorman, T.B. Rye Cover Crop Effects on Direct and Indirect Nitrous Oxide Emissions. Soil Sci. Soc. Am. J. 2016, 80, 1551–1559. [Google Scholar] [CrossRef]
  55. Singh, J.; Ale, S.; DeLaune, P.B.; Barnes, E.M. Simulated Effects of Cover Crops with No-Tillage on Soil and Crop Productivity in Rainfed Semi-Arid Cotton Production Systems. Soil Tillage Res. 2023, 230, 105709. [Google Scholar] [CrossRef]
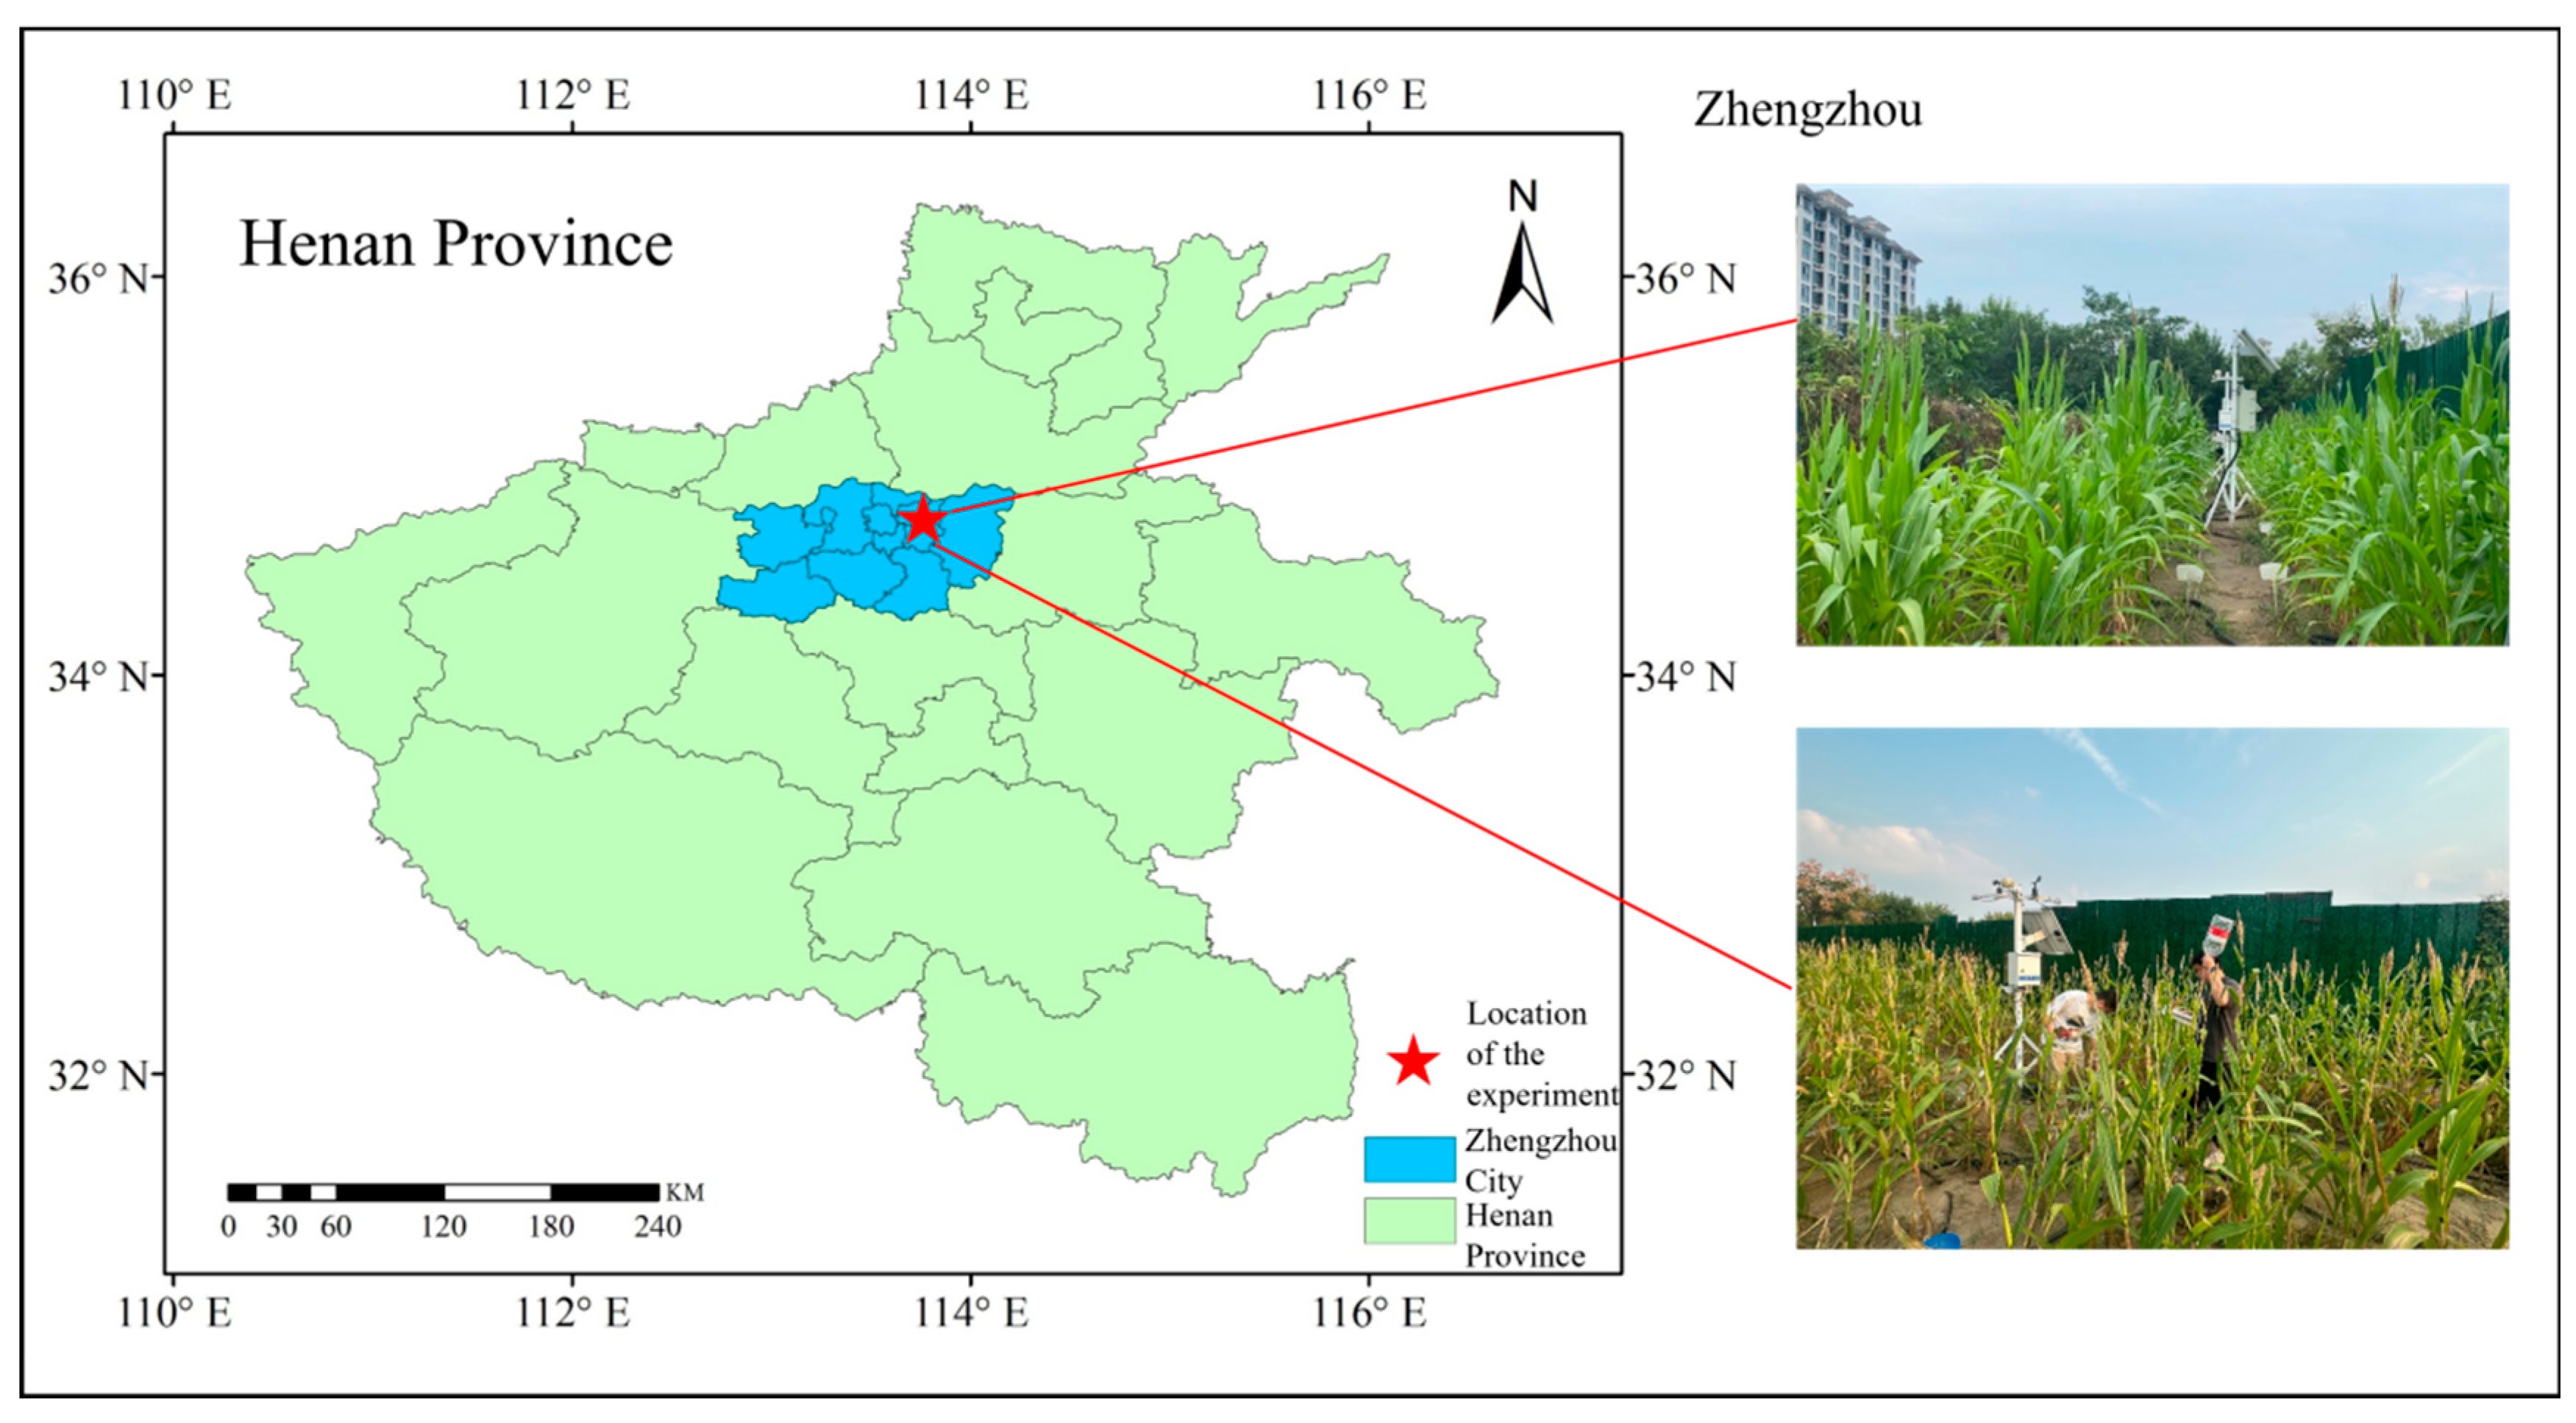
Figure 1. Location of the test site.
Agronomy 15 01951 g001
Figure 2. Summer maize yields under different water and fertilizer irrigation systems; (a) 2023; (b) 2024; * represents p < 0.05; ** represents p < 0.01, as shown below. Means followed by the same lowercase letter in the column do not differ from each other (p < 0.05).
Agronomy 15 01951 g002
Figure 3. Total N2O emissions under different water and fertilizer irrigation systems. (a) 2023; (b) 2024. * represents p < 0.05; ** represents p < 0.01. Means followed by the same lowercase letter in the column do not differ from each other (p < 0.05).
Agronomy 15 01951 g003
Figure 4. Total CO2 emissions under different water and fertilizer irrigation systems. (a) 2023; (b) 2024. Means followed by the same lowercase letter in the column do not differ from each other (p < 0.05).
Agronomy 15 01951 g004
Figure 5. Comparison between the measured and simulated values of summer maize yield using the DNDC model.
Agronomy 15 01951 g005
Figure 6. Comparison between the measured and simulated values of total N2O emissions from farmland using the DNDC model.
Agronomy 15 01951 g006
Figure 7. Comparison between the measured and simulated values of total CO2 emissions from farmland using the DNDC model.
Agronomy 15 01951 g007
Figure 8. Summer maize yields, total N2O emissions, and total CO2 emissions under the DNDC simulation scenarios. (a) Production yield for 2023; (b) Production yield for 2024; (c) Production N2O for 2023; (d) Production N2O for 2024; (e) Production CO2 for 2023; (f) Production CO2 for 2024.
Agronomy 15 01951 g008
Table 1. Summer maize field experiment: water and fertilizer ratio scheme.
TreatmentIrrigation Upper LimitIrrigation
Lower Limit
Fertilization (kg/ha)Irrigation
(m3/ha)
A190%θf60%θf540800
A2450
A3360
B170%θf5401050
B2450
B3360
C180%θf5401400
C2450
C3360
D1RainfallRainfall5400
D2450
D3360
Table 2. DNDC simulation of different growth stages of summer maize irrigation.
Growing StageSeedling—JointingJointing—HeadingHeading—FillingGrouting—Maturity
Irrigation
lower limit
60%θf65%θf70%θf60%θf
Irrigation upper limit90%θf90%θf90%θf90%θf
Table 3. Crop parameters simulated by the DNDC model.
Crop ParametersUnitSummer Maize
Optimum outputkg C/ha4900
Biomass allocation ratiosGrain/stem leaf/root0.53/0.36/0.07
Total nitrogen requirementkg N/ha116.905
Accumulated temperature°C1800
Nitrogen fixation coefficient 0.9
Optimum temperature°C31
Table 4. Evaluation indices for the measured and simulated values of summer maize yield.
IndicatorR2RMSE (kg/ha)EF
20230.934664.0270.746
20240.944593.8730.809
Table 5. Fitting evaluation indices for the measured and simulated values of total N2O emissions from farmland.
IndicatorR2RMSE (kg/ha)EF
20230.8790.0660.564
20240.8730.0670.639
Table 6. Fitting evaluation indices for the measured and simulated values of total CO2 emissions from farmland.
IndicatorR2RMSE (kg/ha)EF
20230.828561.2320.818
20240.834586.5020.811
Disclaimer/Publisher’s Note: The statements, opinions and data contained in all publications are solely those of the individual author(s) and contributor(s) and not of MDPI and/or the editor(s). MDPI and/or the editor(s) disclaim responsibility for any injury to people or property resulting from any ideas, methods, instructions or products referred to in the content.