Article

Effects of Continuous Saline Water Irrigation on Soil Salinization Characteristics and Dryland Jujube Tree

College of Hydraulic and Civil Engineering, Xinjiang Agricultural University, Urumqi 830052, China
*
Author to whom correspondence should be addressed.
Agronomy 2025, 15(8), 1898; https://doi.org/10.3390/agronomy15081898
Submission received: 4 July 2025 / Revised: 3 August 2025 / Accepted: 5 August 2025 / Published: 7 August 2025
(This article belongs to the Section Water Use and Irrigation)

Abstract

The sustainable utilization of saline water resources represents an effective strategy for alleviating water scarcity in arid regions. However, the mechanisms by which prolonged saline water irrigation influences soil salinization and dryland crop growth are not yet fully understood. This study examined the effects of six irrigation water salinity levels (CK: 0.87 g·L−1, S1: 2 g·L−1, S2: 4 g·L−1, S3: 6 g·L−1, S4: 8 g·L−1, S5: 10 g·L−1) on soil salinization dynamics and jujube growth during a three-year field experiment (2020–2022). The results showed that soil salinity within the 0–1 m profile significantly increased with rising irrigation water salinity and prolonged irrigation duration, with the 0–0.4 m layer accounting for 50.27–74.95% of the total salt accumulation. A distinct unimodal salt distribution was observed in the 0.3–0.6 m soil zone, with the salinity peak shifting downward from 0.4 to 0.5 m over time. Meanwhile, soil pH and sodium adsorption ratio (SAR) increased steadily over the study period. The dominant hydrochemical type shifted from SO42−-Ca2+·Mg2+ to Cl-Na+·Mg2+. Crop performance exhibited a nonlinear response to irrigation salinity levels. Low salinity (2 g·L−1) significantly enhanced plant height, stem diameter, leaf area index (LAI), vitamin C content, and yield, with improvements of up to 12.11%, 3.96%, 16.67%, 16.24%, and 16.52% in the early years. However, prolonged exposure to saline irrigation led to significant declines in both plant growth and water productivity (WP) by 2022. Under high-salinity conditions (S5), yield decreased by 16.75%, while WP declined by more than 30%. To comprehensively evaluate the trade-off between economic effects and soil environment, the entropy weight TOPSIS method was employed to identify S1 as the optimal irrigation treatment for the 2020–2021 period and control (CK) as the optimal treatment for 2022. Through fitting analysis, the optimal irrigation water salinity levels over 3 years were determined to be 2.75 g·L−1, 2.49 g·L−1, and 0.87 g·L−1, respectively. These findings suggest that short-term irrigation of jujube trees with saline water at concentrations ≤ 3 g·L−1 is agronomically feasible.

1. Introduction

Rapid population growth, combined with the expansion of industrial and agricultural activities, have significantly increased the demand for agricultural water, exacerbating water scarcity particularly acute in arid and semi-arid regions [1]. Furthermore, limited precipitation, high evaporation rates, and the spatiotemporal unevenness of water resource distribution have further intensified the imbalance between water supply and demand [2,3]. To alleviate pressure on agricultural irrigation water resources and ensure stable and high yields of grain, fruit, and vegetables, developing and utilizing unconventional water sources for alternative irrigation strategies is essential [4]. This approach is crucial to ensuring the sustainable management of agricultural water resources.
Xinjiang, situated in the northwestern border region of China, is characterized by an arid climate and severe water scarcity [5]. The development and utilization of groundwater resources have become a widely adopted strategy to address the imbalance between agricultural water supply and demand [6]. The southern region of Xinjiang is characterized by a unique combination of topographical, climatic, hydrological, and soil conditions [7]. This region is notable for its substantial underground saline water resources, with salinity levels often exceeding 2 g of salts per L [8]. Statistical analysis indicates that the subterranean saline water reserves in the region amount to 1.116 billion m3, covering an area of 91,400 km2, and accounting for 30.6% of the total area of the southern Xinjiang plain [9]. In conditions of freshwater scarcity, the rational extraction and utilization of saline water resources, which are both widely distributed and abundant, offer considerable potential for regional application [10,11,12].
The jujube production industry has become a pivotal industry in southern Xinjiang, characterized by its extensive coverage, wide-reaching benefits, and significant development potential [13]. Orchard cultivation covers more than 1.033 million hectares, with jujube plantations exceeding 318,000 hectares and red jujube production reaching 3.45 million tons [14]. This is attributed to the region’s abundant water, soil, sunlight, and thermal resources [15]. However, the long-term use of irrigation can lead to an increase in harmful salt ions in the soil, resulting in a degradation of the soil environment and an escalation in the risk of secondary salinization [16]. This, in turn, may exert substantial negative effects on jujube tree growth and fruit quality. This problem is attributed primarily to the substandard quality of the irrigation water. For instance, in the Pimo Reclamation Area of southern Xinjiang, 16,675 hectares of jujube orchards have experienced severe soil salinization due to inadequate irrigation management practices, resulting in varying degrees of salt-alkali damage to the jujube trees. The threshold electrical conductivity of the soil saturation extract (ECe) at which jujube yield begins to decline is typically around 4.9 dS·m−1 [17]. Values exceeding this range may result in yield reduction and physiological disorders. To alleviate salt stress and maintain crop yield, practices such as freshwater leaching, application of organic amendments, and deficit irrigation are commonly employed. However, systematic studies on soil salinization dynamics and the effects of different irrigation water salinity levels on jujube growth remain limited.
Saline irrigation has been shown to deposit significant quantities of sodium chloride (NaCl) in soil [18], resulting in salt accumulation. This process induces the swelling and dispersion of soil aggregates, prompting smaller particles to migrate and accumulate in larger soil pores [19]. Consequently, the hydraulic conductivity and infiltration rates of the soil are reduced [20], thereby influencing the spatial and temporal distribution of soil moisture and salt [21,22] and altering the physicochemical properties of the soil. The ionic compositions of different saline waters vary significantly. Under the influence of water, salt ions migrate through diffusion, convection, and exchange processes, significantly altering the physicochemical properties of the rhizosphere environment and thereby affecting crop growth and physiological activities [23].
Research indicates that under high-salinity conditions, excessive Na+ disrupts ionic homeostasis in crops by interfering with protein synthesis and inhibiting enzymatic activity, thereby impairing key physiological processes essential for plant growth [24,25]. This disruption reduces photosynthesis and ultimately hinders normal crop growth and development [26]. Moreover, the decline in Ca2+ levels has been shown to cause the destabilization of the cell wall and compromise membrane integrity [27], thereby triggering physiological disorders such as blossom-end rot, reduced fruit set rates, and ultimately, a decline in crop yield [28]. Research also indicates that moderate saline water irrigation can optimize the rhizosphere environment [29]. This type of irrigation not only replenishes water but also supplies essential mineral nutrients that are required for crop growth [26]. This has been demonstrated to enhance the osmotic regulation capacity of crops, facilitate root absorption of water and nutrients, and ultimately boost crop yield [28].
In summary, numerous studies have examined the effects of saline water irrigation on soil physicochemical properties and the growth of annual crops, with jujube showing a marked response to salt accumulation. Its salt tolerance threshold and physiological response mechanisms differ significantly from those of annual crops, such as cotton and wheat. Compared with existing studies that primarily focus on saline water irrigation in grain crops, this study emphasizes the salt tolerance traits of jujube, underscoring its species-specific responses and practical significance. Moreover, previous studies, such as Liu et al. [17], have explored the effects of winter irrigation on soil salinity and jujube growth. However, their research was limited in temporal scope, focusing only on one season. It also failed to examine the cumulative effects of continuous saline water irrigation across multiple growing seasons, including the associated changes in soil ion composition, crop quality, and long-term sustainability. In contrast, the present study systematically investigates the long-term effects of saline irrigation over multiple years, encompassing a broad range of salinity levels and employing quantitative decision analysis to identify optimal irrigation strategies.
This study aimed to evaluate the effects of saline water drip irrigation on jujube trees, with a specific focus on soil salinity accumulation, its spatial and temporal distribution, and its impact on jujube growth, yield, and fruit quality. A 3-year (2020–2022) field experiment was conducted in Xinjiang, China, to systematically characterize the changes in soil pH, sodium adsorption ratio (SAR), and soil hydrochemical composition under varying irrigation salinity levels. Additionally, the study developed a coupled model that integrates soil ecological conditions and crop economic performance to determine the optimal salinity range for sustainable jujube cultivation in arid oasis regions.

2. Materials and Methods

2.1. Site Description

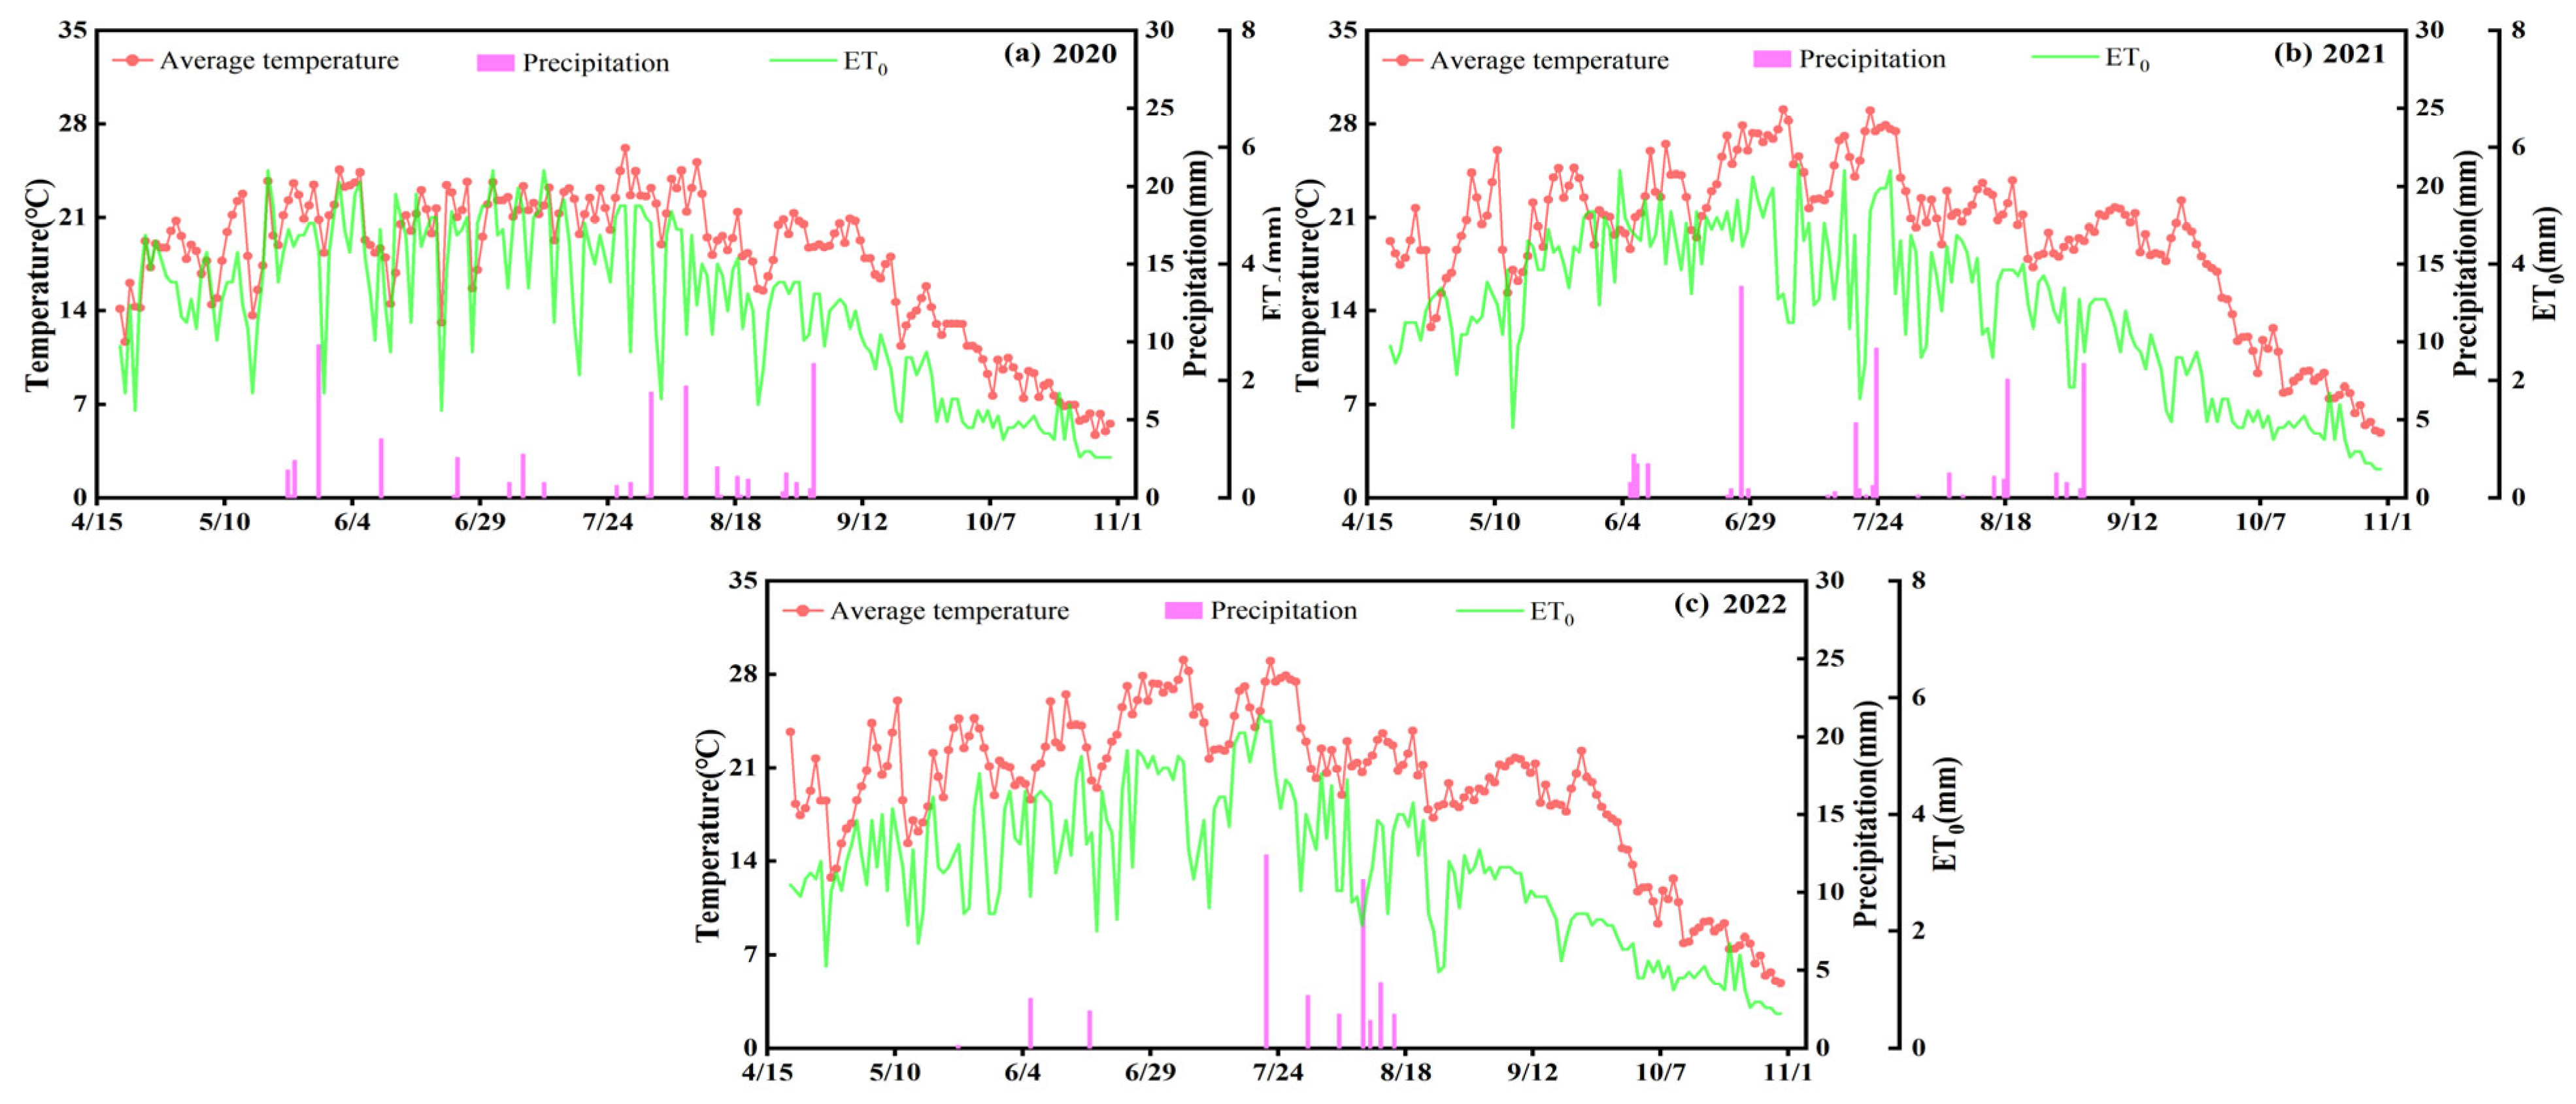
From April 2020 to November 2022, a field non-weighing lysimeter was used at the Linfruit Experimental Base of Xinjiang Agricultural University, which is located in Aksu City, Hongqipo Farm, Xinjiang (80°21′20″ E, 41°17′54″ N, 1150 m above sea level). The design of the experimental lysimeter was based on the standards proposed by Allen et al. [30], with dimensions of 0.8 m × 0.8 m × 1.2 m (Figure 1). Water-blocking materials were installed along the sidewalls to prevent lateral water movement, while the bottom of the pits remained open. A gravel layer was deposited at a depth of 1.0–1.2 m, and the upper 0–1.0 m layer was backfilled with a homogeneous mixture of sandy soil and undisturbed soil, mixed at a 2:1 mass ratio. The region exhibits a typical temperate arid desert climate (Köppen: Bwk, Figure 1), an annual temperature of 10.29 °C, and receives an average of 51.86 mm of precipitation annually, predominantly concentrated between June and August. The reference crop evapotranspiration (ETo) exhibited a range from 579.2 to 641.2 mm (Figure 2). An automatic meteorological station (RX3001, Onset, Bourne, MA, USA) was installed 10 m from the experimental plot.
The soil properties of the 0–1 m layer in the test pit are presented in Table 1. Soil density was determined using the core sampling method following the USDA Soil Survey Manual. Textural characteristic was analyzed using the hydrometer method. The procedures for measuring pH, salt content, and SAR were the same as those outlined in Section 2.3.1. All measurement items were collected in triplicate at each soil depth layer. The average bulk density of the 0–1 m soil layer in the test pit was found to be 1.54 g·cm−3, with clay content measuring 6.33%, silt content 38.44%, and sand content 55.23%. The ion concentrations in the soil profile of the test pit are presented in Table 2. According to the United States Department of Agriculture (USDA) soil classification system, the soil texture is identified as loamy sand, with an initial salinity of 0.93 g·kg−1, pH is 8.06, and sodium adsorption ratio (SAR) is 2.14 (mmol·L−1)0.5.

2.2. Experimental Design

The present study focuses on three-year-old grafted gray jujube trees, which represent a major economic crop in southern Xinjiang, China. The transplantation of the trees occurred on 11 April 2019, with adequate freshwater irrigation provided throughout 2019. Each test pit was planted with one jujube tree. The irrigation water used in the experiment was formulated based on the local groundwater hydrochemical type. This classification, derived from long-term monitoring data and laboratory analysis of well water at the experimental site, reflects the prevailing water quality in the region [31,32]. Analytical-grade NaCl, MgSO4, and CaCl2 (purity ≥ 99.5%) were weighed in a mass ratio of 2:1:1 and individually dissolved in 3.5 L of heated tap water while continuously stirring with an electric mixer until fully dissolved. The three solutions were then sequentially poured into a storage tank and stirred further until uniformity was achieved. Saline irrigation water for each treatment was subsequently prepared according to the designated salinity levels. The hydrochemical types of each treatment are shown in Table 3. The present study established six salinity treatments. The salinity of the control (CK) was 0.87 g·L−1, while S1 was 2 g·L−1. Salinity levels for S1 to S5 were uniformly set at 2 g·L−1. The experiment was replicated thrice, resulting in a total of 18 experimental pits.
This experiment employed a fixed-interval (10 d) variable-quota irrigation system from 2020 to 2022. Irrigation began on April 10 each year and was applied every 10 days thereafter until the end of the growth period. The specific irrigation schedule and amounts are provided in Table 4. The irrigation amount for each application was determined based on crop evapotranspiration (ETc), calculated by multiplying reference evapotranspiration (ETo) by the crop coefficient (Kc) specific to jujube trees. ETo was calculated with the FAO-recommended ETo Calculator, which applies the FAO Penman–Monteith equation as described in FAO Irrigation and Drainage Paper No. 56. The calculation was based on meteorological data from the 10 days prior to each irrigation event, including daily average temperature, wind speed, sunshine duration, relative humidity, and other relevant variables. The Kc value was selected based on previous research findings [33], and adjusted based on measured soil moisture to account for the physiological characteristics of local jujube trees at different growth stages.
ETc = Kc × ETo
where ETc denotes crop evapotranspiration (mm), Kc refers to the crop coefficient, and ETo indicates reference evapotranspiration (mm).
The irrigation method employed a simple self-pressure drip irrigation system, consisting of a bucket, adjustable-flow micro-drip irrigation device, a pressure-compensated dripper, and a 0.5 m high plastic stool (Figure 1). The device allowed for precise, plant-level irrigation control, ensured uniform infiltration, and, when combined with soil-specific irrigation scheduling, reduced the risk of surface runoff and deep percolation. During the experiment, field management practices for jujube trees were strictly followed in accordance with local agronomic standards.

2.3. Measurement Parameters and Methods

2.3.1. Soil Salinity and Chemical Properties

Soil samples were collected at each growth stage from jujube trees using a 0.03 m diameter auger, at 0.1 m intervals down to a depth of 1 m, 0.15 m away from the trunk in a counterclockwise pattern. After sampling, the holes were backfilled with sandy loam. Then transport the soil sample to the laboratory and employ the oven-drying method to determine the soil moisture content. The soil samples were then ground, passed through a 2 mm sieve, and extracted using a 1:5 soil-to-water ratio with thorough stirring. The suspension was centrifuged at 4000 rpm for 7 min (TD5A, Hefei, China), and the supernatant was used for further analysis. Electrical conductivity (ECse) was measured using a conductivity meter (DDSJ-308F, Shanghai, China), and the soil soluble salt content was subsequently calculated. Duplicate measurements were taken for all key parameters, including soil moisture, pH, and electrical conductivity, to ensure data accuracy and consistency. Any inconsistencies were resolved by repeating the measurements. Moreover, the methodology was rigorously applied during each sampling period to ensure reproducibility.
Y = 0.0002 × n × ECse1.1007 (R2 = 0.9963, p < 0.01, N = 20)
where Y represents the soil soluble salt content (g·kg−1). n denotes the water-to-soil ratio, and N represents the number of calibration samples used to construct the salinity standard curve. Equation (2) was established through laboratory-based calibration.
The soil pH was measured using a Mettler pH meter (FE28, Columbus, OH, USA). The concentrations of Na+ and K+ were determined using a flame photometer (FP6410, Shanghai, China). The levels of Ca2+ and Mg2+ were measured via the EDTA complexometric titration method, while Cl was assessed using the silver nitrate titration method. The contents of HCO3 and CO32− were determined through the double indicator neutralization titration method [15]. Soil sodium adsorption ratio (SAR) was subsequently calculated according to the following Equation (3):
SAR = ((Na+/(Ca2+ + Mg2+))/2)0.5
where SAR denotes soil sodium adsorption ratio (mmol·L−1)0.5.

2.3.2. Jujube Tree Growth Index

At the beginning (20 April) and end (30 October) of each growing season, the stem diameter of jujube trees was measured using a vernier caliper at 0.05 m above the ground, while tree height was measured with a measuring tape. Concurrently, the length of fruit stalks was measured at 10 d intervals throughout the growing season, utilizing a tape measure. Hemispherical images of each treatment were captured at 15 d intervals using a fisheye wide-angle lens on a DSLR camera from a down-top perspective [34]. The resulting images were processed in Adobe Photoshop CC 2019 (San Jose, CA, USA) and analyzed with the Hemiview canopy analysis system to calculate the leaf area index (LAI) [35]. Additionally, quality control was applied throughout the image analysis process to prevent errors in LAI estimation. The stem diameter and plant height of the jujube tree were calculated using Equations (4) and (5):
Jc = (JcNS + JcEW)/2
H = H2 − H1
where Jc denotes the stem diameter growth of the jujube tree; JcNS refers to the growth in the north-south direction, and JcEW indicates the growth in the east-west direction, mm; H represents the plant height growth, where H2 is the tree height at the end of the growth period, and H1 is the height at the beginning of the growth period, m.

2.3.3. Jujube Yield and Quality

After the growing season, on 30 October, jujube fruits from each treatment were harvested and weighed. The average fruit weight from the three replicate pits was utilized to determine the fruit yield per plant. The fruit yield per hectare was calculated based on a planting density of 1 m × 2 m. The jujube fruits from each treatment were thoroughly mixed, and a subsample was obtained using the quartering method. Five jujube fruits were then selected at random, thoroughly cleaned, and any extraneous matter removed. The vertical and horizontal diameters were measured with a vernier caliper, and the horizontal diameter was averaged across three measured points. The jujube fruits were subjected to a process of de-fleshing and grinding. Vitamin C was determined utilizing the dichlorobenzene indophenol titration method, total acid was measured with the acid-base titration method, and total sugar was determined using the anthrone colorimetric method [36].
Water productivity (WP) was calculated using Equations (6)–(8):
ET = P0 + I − ΔW − R − L − D
ΔW = 10 × r × H (W1 − W0)
WP = Y/ET
where ET represents the crop water consumption over the full growth period (mm), P0 denotes the total effective precipitation (≥2.5 mm), and I is the total irrigation amount (mm). Since the study employed a field test pit experiment and the groundwater level was deeper than 10 m, R (surface runoff), L (lateral soil water infiltration), and D (groundwater recharge) were all considered 0 mm. W indicates the change in soil water content (mm), r is the soil bulk density (g·cm−3), H is the soil layer thickness (mm), W1 is the initial soil water content at the start of the interval (cm·cm−3), and W0 is the final soil water content at the end of the interval (cm3·cm−3). WP represents the water productivity (kg·m−3), and Y is the yield (kg·ha1).
The following Equation (9) was employed to determine the volume of a single fruit [37]:
V g   =   4 3   ×   π   ×   0.5 J z   ×   ( 0.5 J h ) 2
where Vg represents the volume of the jujube fruit (cm3), π is the circumference ratio, Jz is the vertical diameter of the fruit (cm), and Jh is the horizontal diameter of the fruit (cm).

2.4. Statistical Analysis of Data

Prior to statistical analysis, the Shapiro–Wilk test was applied to assess the normality of all datasets. The test results indicated no significant deviation from normality (p > 0.05), supporting the use of parametric methods, including one-way ANOVA and Duncan’s multiple range test (DMRT). Single-factor analysis of variance (ANOVA) was conducted using the DPS Data Processing System 18.10 Advanced Edition. Duncan’s new multiple range test (DMRT) at the 0.05 significance level was applied for multiple comparisons among treatments. The Piper trilinear diagram was utilized for the analysis of soil hydrochemical properties [38]. The entropy-weighted TOPSIS model was implemented using SPSS version 22.0 (IBM Corp., Armonk, NY, USA). All figures presented in this study were prepared using Origin 2021.

3. Results

3.1. Dynamic Variations in Soil Salinity

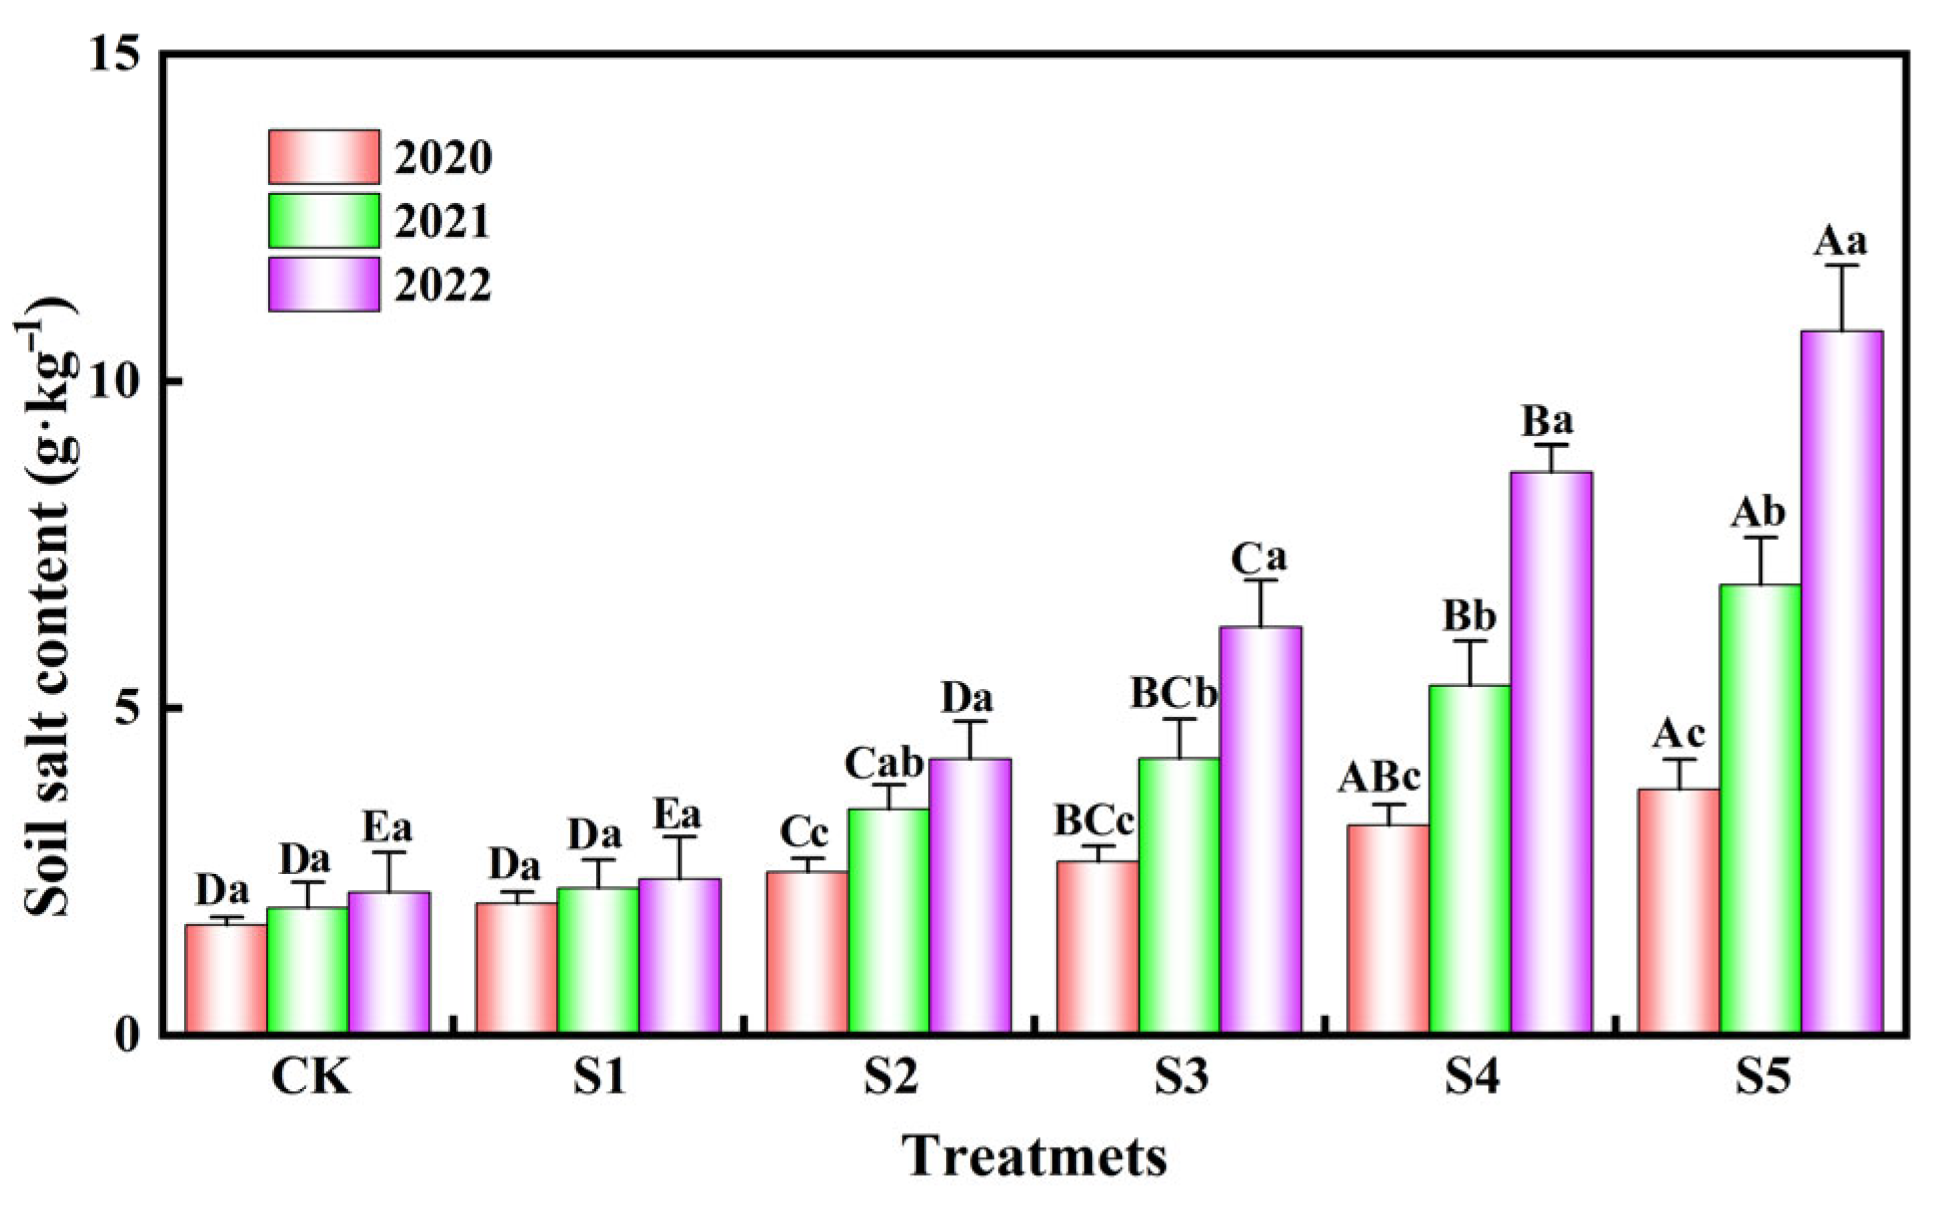
Figure 3 illustrates the variations in average soluble salt content within the 0–1 m soil layer from 2020 to 2022. The changes in soil salinity under the CK and S1 treatments were relatively insignificant, with a three-year cumulative increase of 0.37 g·kg−1 and 0.50 g·kg−1, respectively. When the irrigation water salinity was ≥4 g·L−1 (S2–S5), the soil salinity differences were significant (p ≤ 0.05). The three-year cumulative increases were 1.73, 3.58, 5.40, and 7.00 g·kg−1, respectively. Soil salt content exhibited an increasing trend with rising irrigation water salinity. In addition, significant differences in soil salt content were observed among treatments in each year (p ≤ 0.05). Notably, salt accumulation under the S3–S5 treatments was consistently and significantly higher than that under CK and S1 across all 3 years. In 2022, the soil salt content under S5 reached 12.5 g·kg−1, which was 3.3 times as high as that of CK and 2.4 times that of S1, indicating a substantial increase with increasing salinity levels. In contrast, the differences between S2 and S3 varied across years and did not show a consistent trend. These findings further confirm that increasing irrigation water salinity significantly exacerbates soil salinization.
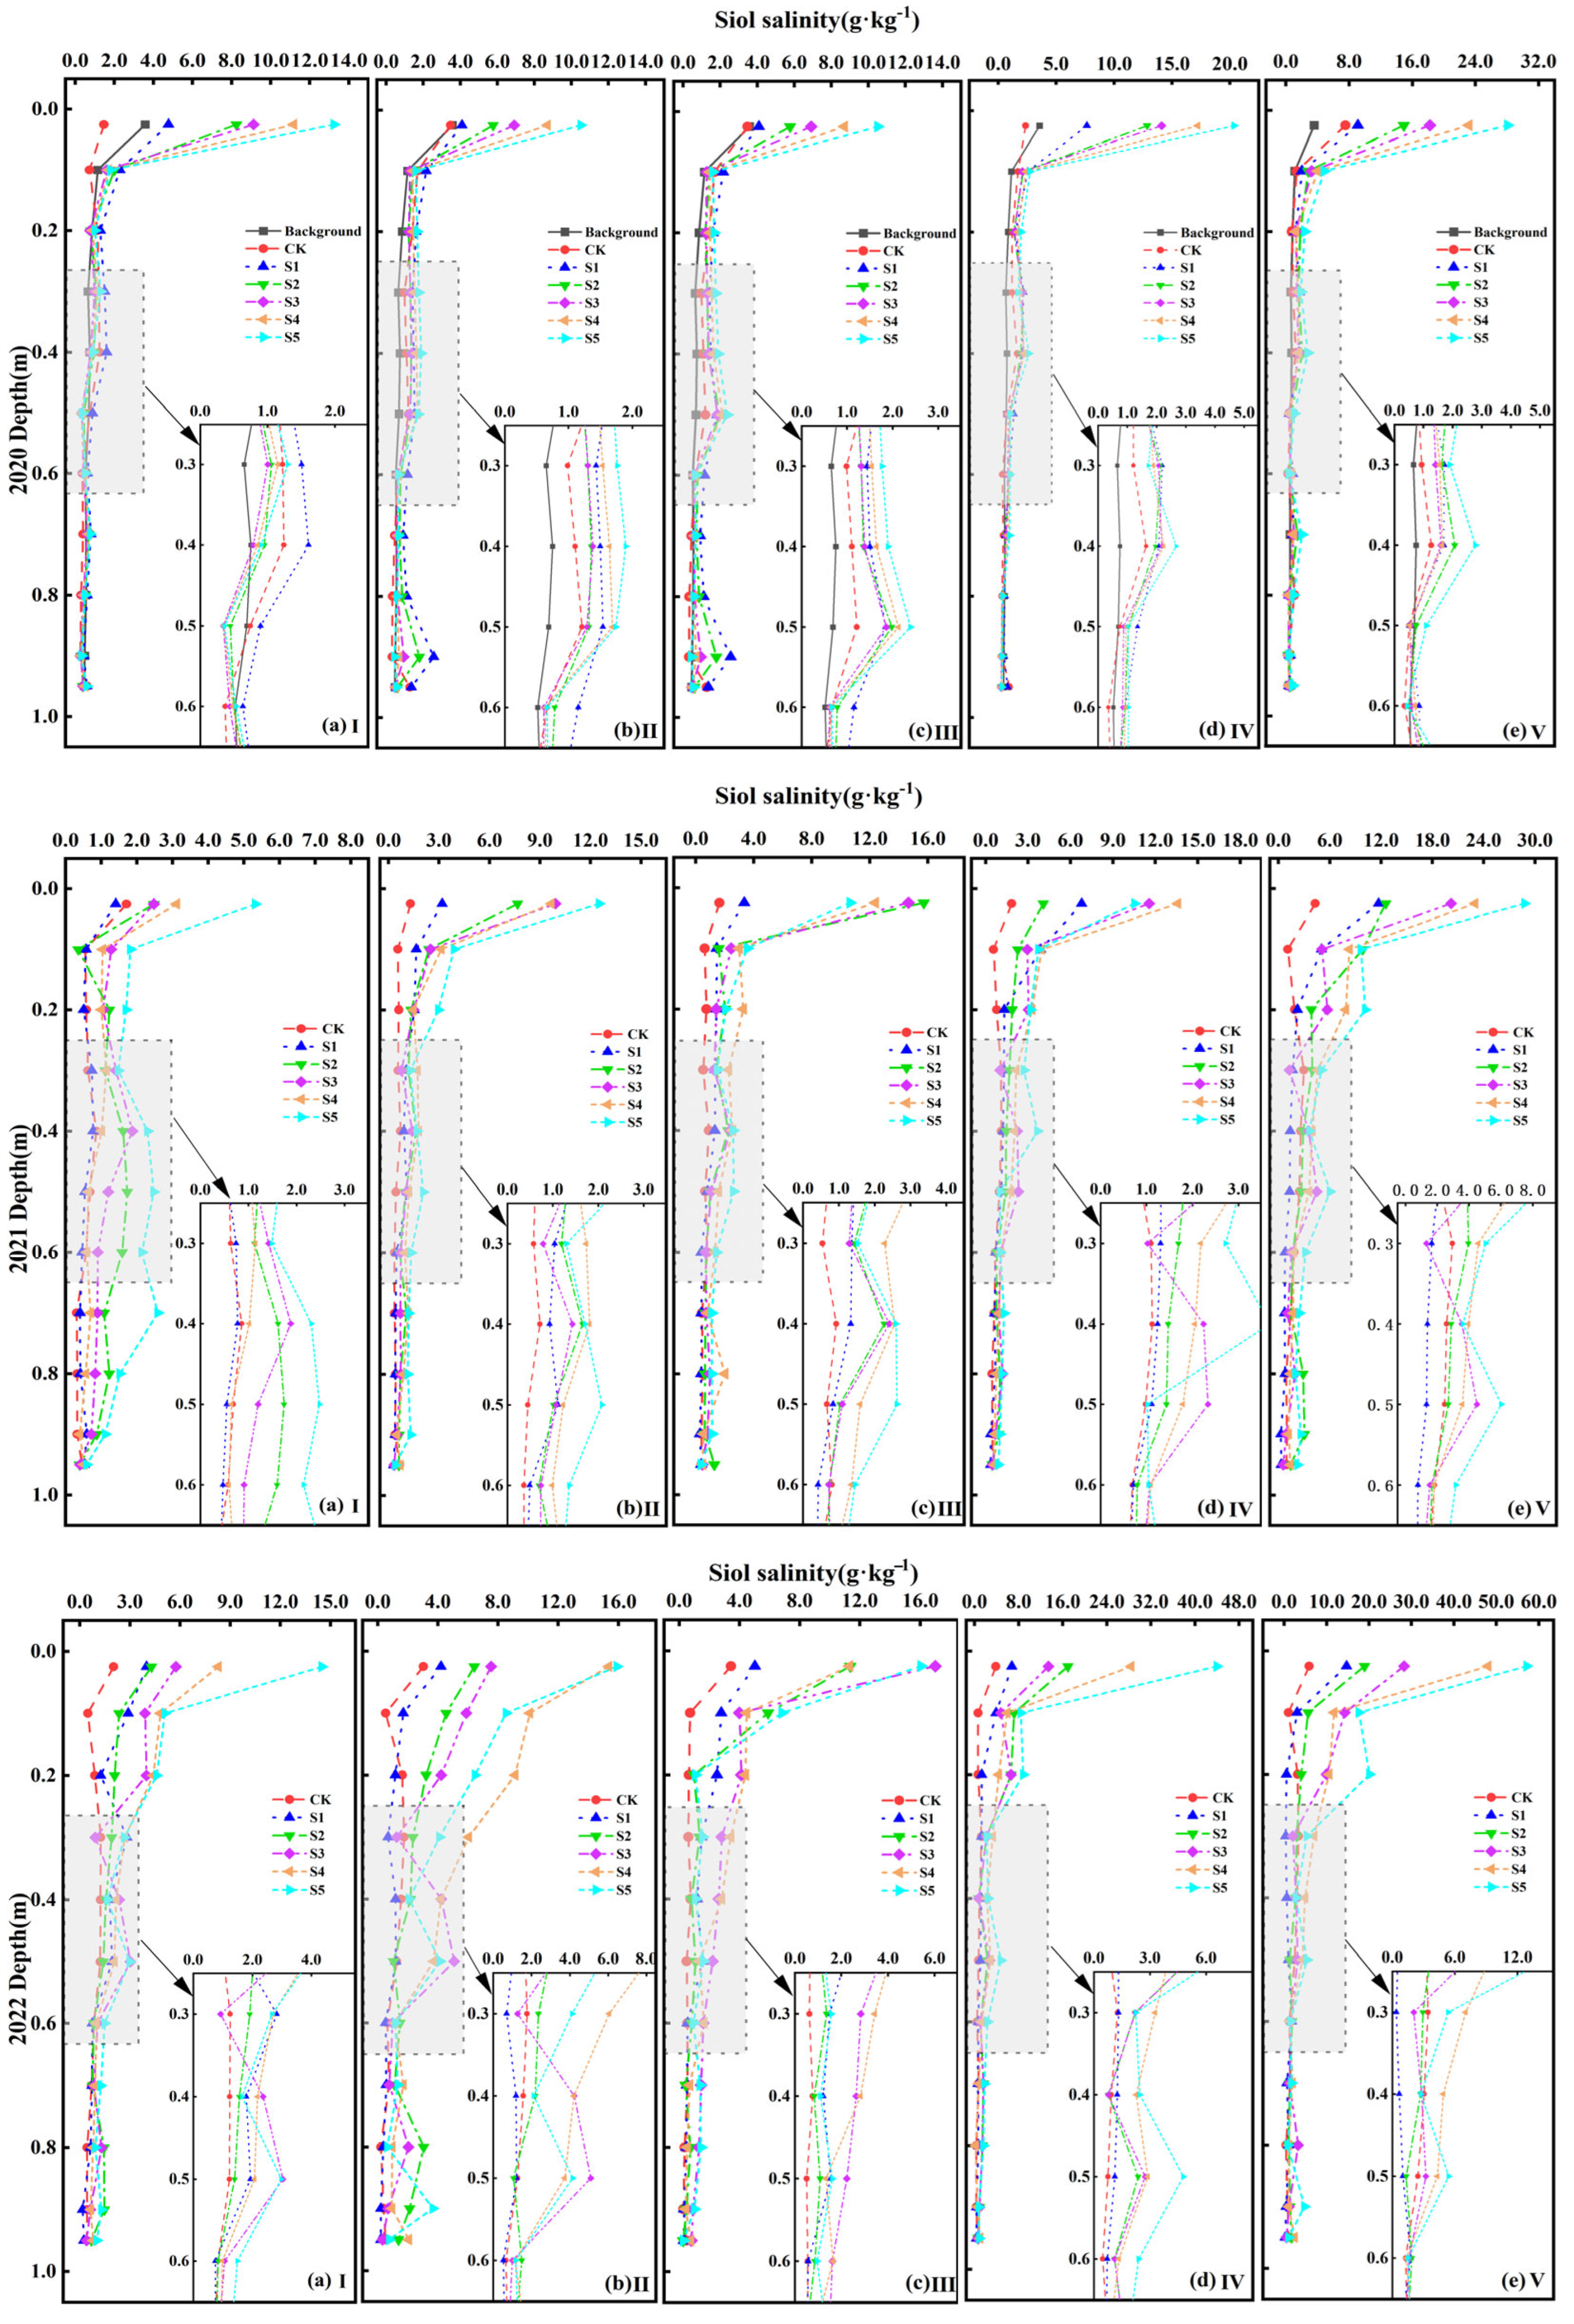
Figure 4 illustrates the spatiotemporal variation in soil salinity across depths and jujube growth stages from 2020 to 2022. Significant differences in soil salt accumulation were observed among treatments, especially in the upper 0–0.4 m layer, which consistently exhibited the highest salt content across all years. The proportion of salt stored in this layer relative to the 0–1 m soil profile increased with irrigation water salinity, ranging from 50.27% under CK in 2020 to 74.95% under S5 in 2022. Under high-salinity treatments (S4 and S5), salt content in the 0–0.4 m layer was 2.8–3.5 times greater than under CK and S1, indicating that surface salt accumulation is strongly influenced by irrigation salinity.
A distinct unimodal distribution was observed in the 0.3–0.6 m soil layer across all growth stages. The depth of the salinity peak varied with treatment and year: under CK and S1, the peak remained at approximately 30–40 cm, while under S5, it gradually shifted downward to 0.5–0.6 m by 2022. During the young fruit stage, the salinity peak under the S5 treatment reached 4.78 g·kg−1, which was significantly higher than that under CK (1.25 g·kg−1), representing a 282% increase (p ≤ 0.05). This suggests more pronounced downward salt migration under prolonged saline irrigation. Furthermore, salinity in the 0–1 m profile exhibited a cumulative trend over the growing season. From the budding stage to maturity, soil salt content increased by a factor of 2.5–3.7 times, with greater accumulation under higher salinity treatments. By the end of the 2022 season, total salt content under S5 reached 12.5 g·kg−1, compared to 3.8 g·kg−1 under CK. These findings confirm that both irrigation salinity level and duration are key drivers of soil salinization in arid agricultural systems.

3.2. Soil Chemical Properties

3.2.1. pH and SAR

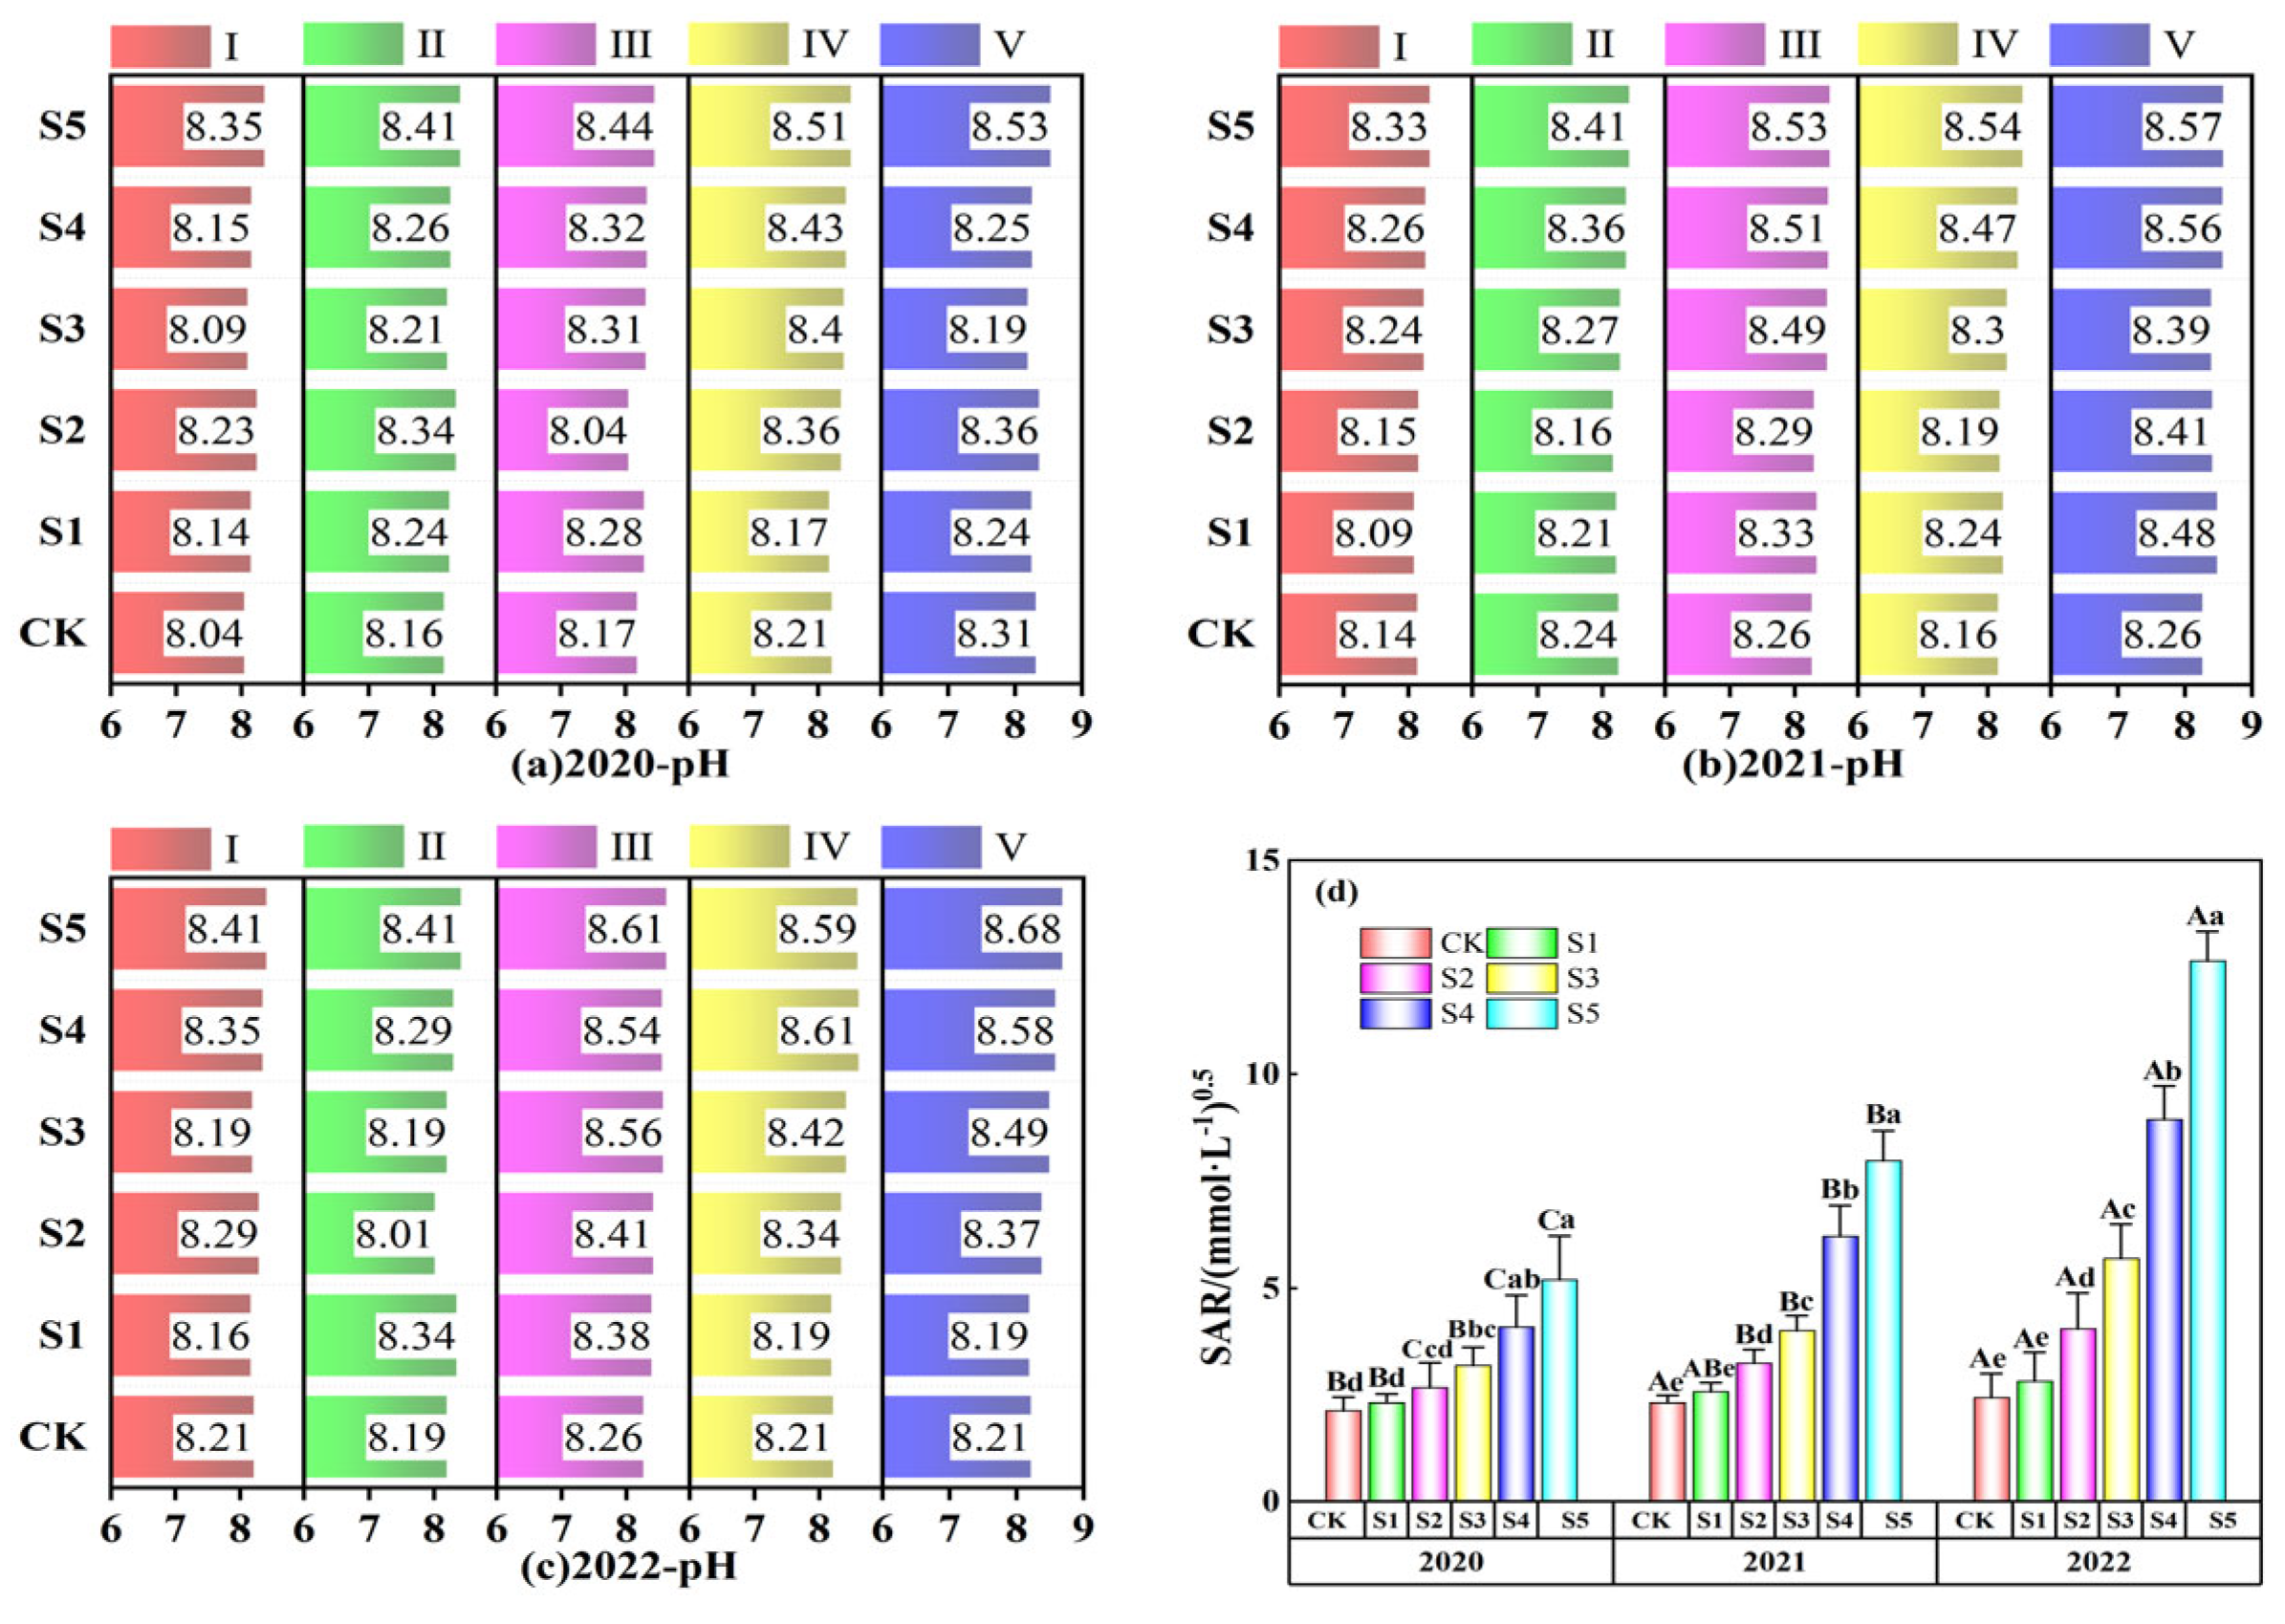
Analyzing soil pH and SAR is crucial for understanding soil salinity and alkalinity characteristics. Figure 5a–c illustrates the variation in soil pH values during the growth stages of jujube trees irrigated with waters of different mineralization levels from 2020 to 2022. As observed, the maximum pH values for each treatment were 8.3, 8.28, 8.36, 8.43, and 8.53 in 2020; 8.26, 8.48, 8.41, 8.49, 8.56, and 8.57 in 2021; and 8.26, 8.38, 8.41, 8.56, 8.58, and 8.68 in 2022. In 2020, the pH values for treatments S1 to S5 increased by 0.44%, 1.08%, 0.76%, 1.27%, and 3.30%, respectively, compared to CK. In 2021, the increases were 0.71%, 0.34%, 1.53%, 2.68%, and 3.21% and in 2022, they were 0.44%, 0.83%, 1.87%, 3.14%, and 3.94%. These results suggest that the pH of the soil during the growing season of jujube trees gradually increases with higher salinity of the irrigation water, with the maximum values generally occurring at the end of the growing season.
Figure 5d illustrates the SAR values of the soil for each treatment from 2020 to 2022. The SAR values for S2–S5 treatments showed significant differences compared to CK in different years (p ≤ 0.05), except in 2020. In 2020, the SAR values for S2–S5 increased by 8.41%, 25.23%, 49.53% and 91.59% respectively, and by 1.43 times. In 2021, the increases were 11.21%, 40.09% and 72.84%, and 1.68 and 2.44 times, respectively. In 2022, the increases are 15.57% and 65.34%, 1.32, 2.65, and 4.16 times, respectively. This indicates that the SAR value increases progressively as the salinity of the irrigation water increases. Moreover, the SAR increased consistently over time across all treatments. Under the S5 treatment, the SAR increased from 6.9 in 2020 to 9.4 in 2021 and further to 13.2 (mmol·L−1)0.5 in 2022, representing a cumulative rise of 91.3%. Similarly, SAR under the S3 treatment increased from 5.1 to 6.8 and then to 9.3 (mmol·L−1)0.5 over the same period, marking an 82.4% increase. In contrast, SAR values under CK and S1 remained consistently below 5.5 (mmol·L−1)0.5, indicating minimal sodium accumulation under low-salinity irrigation. The results indicate that long-term irrigation with high-salinity water (≥6 g·L−1) significantly increases the SAR and accelerates sodification. This trend reflects an annual accumulation of SAR, progressively approaching the critical threshold for sodium hazard 13 (mmol·L−1)0.5 [39]. Without timely intervention, the risk of soil structural degradation, salinization, and long-term limitations on crop growth is substantially increased.

3.2.2. Soil Hydrochemical Types

The Piper diagram for the soil of each treatment from 2020 to 2022 is shown in Figure 6. The soil solutions under different treatments are concentrated in the upper right part of the diamond shape (Figure 6a–c), located in zone 4, indicating that strong acidity exceeds weak acidity. Ion concentrations in soil solutions for the CK (0.87 g L1) treatment show little variation between years, with the water chemistry type being SO42−-Ca2+·Mg2+. However, as the salinity of the irrigation water increases, the concentration of ions in the soil solution changes, leading to a shift in the type of water chemistry. When the irrigation water salinity is ≤4 g·L1, the anions Cl and SO42− are dominant, making up 60–80% of milliequivalents, while the cations are primarily Na+, K+, and Ca2+, also comprising 60–80%. The soil water chemistry type is Cl·SO42−-Na+·Ca2+. When the irrigation water salinity exceeds 4 g·L1, the anion Cl content increases, raising its milliequivalent proportion to 70–90%. The cations shift from Na+, K+, and Ca2+ to Na+, K+, and Mg2+, with the milliequivalent proportion increasing to 75–95%. The soil water chemistry type shifts to Cl-Na+·Mg2+. The changes across treatments are consistent, with the overall trend showing that as irrigation water salinity increases, the proportion of the anion Cl gradually increases, while the proportions of HCO3 and SO42− gradually decrease. The cations Na+ + K+, and Mg2+ gradually increase, while Ca2+ decreases. The water chemistry type transitions from SO42−-Ca2+·Mg2+ to Cl·SO42−-Na+·Ca2+ and then to Cl-Na+·Mg2+.

3.3. The Effects on Jujube Tree

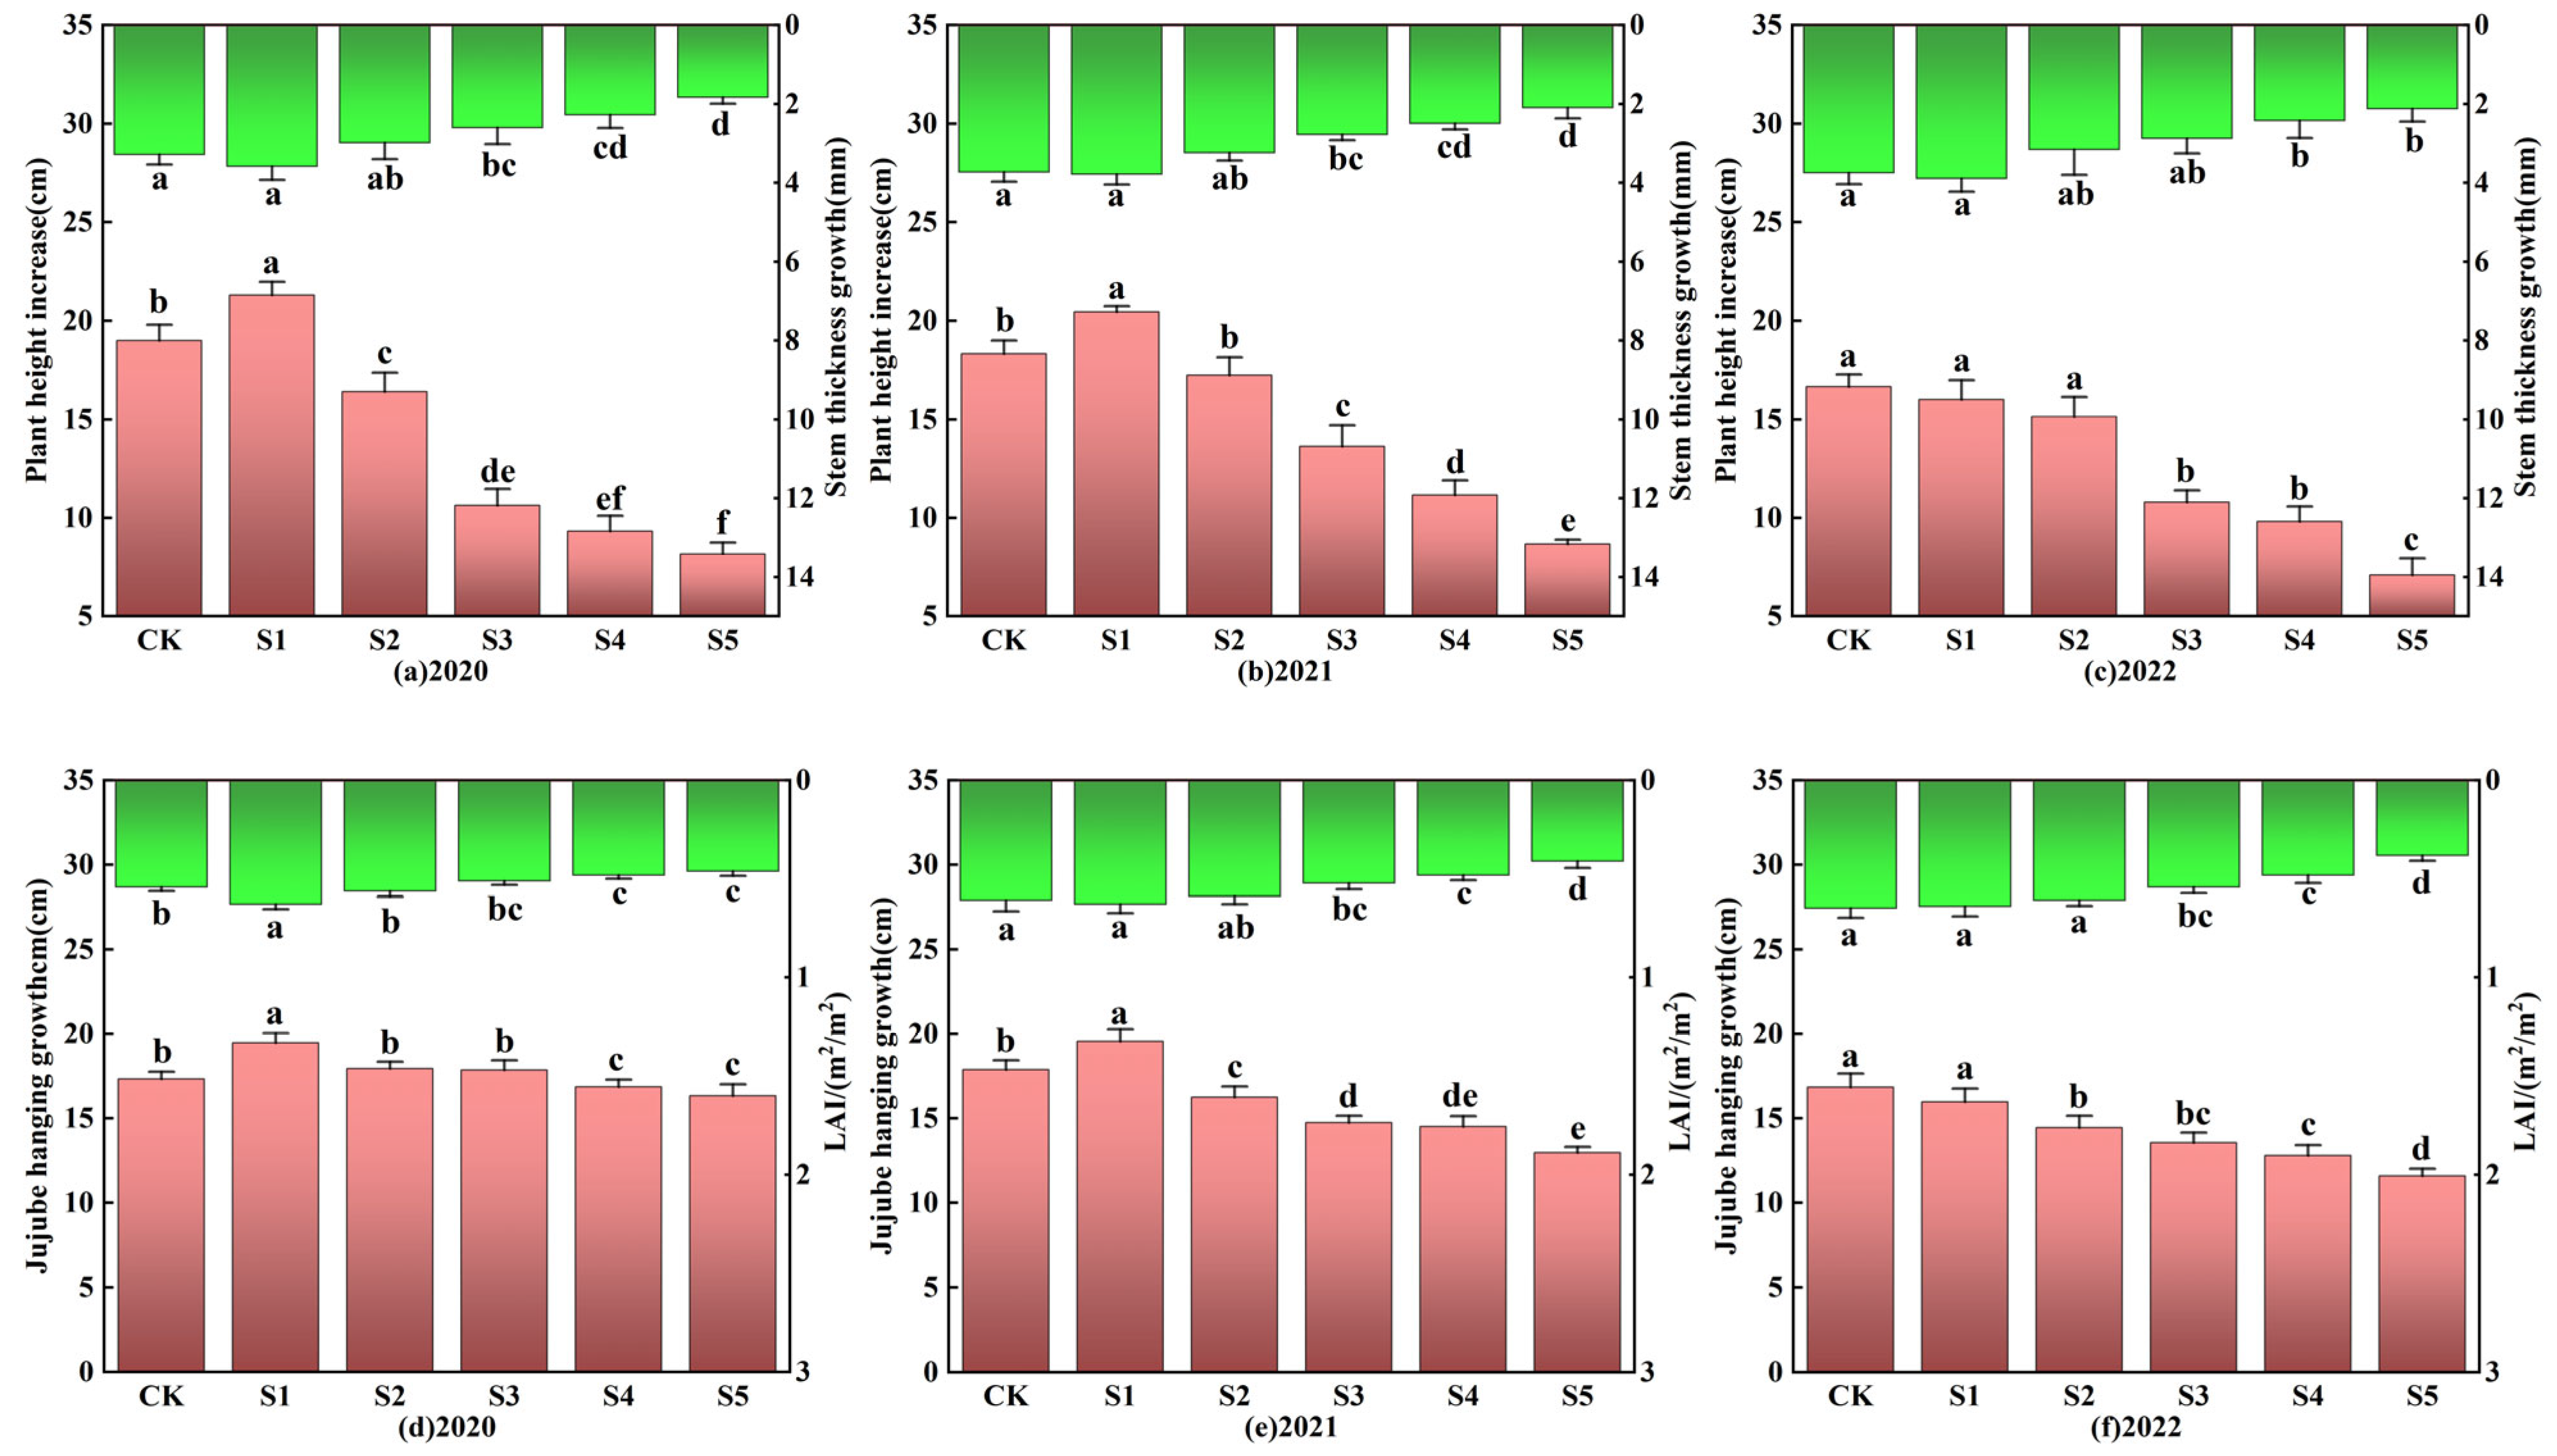
Figure 7 illustrates the changes in plant height, stem diameter growth, fruit-hanging growth, and LAI of jujube trees under different irrigation treatments from 2020 to 2022. From 2020 to 2021, the growth indicators of jujube trees showed an initial increase, followed by a decline with increasing irrigation water salinity. By 2022, all indicators exhibited a continuous downward trend as salinity levels further increased. Taking stem diameter increment as an example, the S1 treatment led to increases of 3.96% and 1.44% over the control (CK) in 2020 and 2021, respectively, although these differences were not statistically significant (p > 0.05). In contrast, treatments S2 through S5 exhibited reductions of 15.76%, 23.22%, 35.25%, and 43.38%, as well as 13.13%, 25.48%, 33.00%, and 43.88%, all demonstrating significant differences (p ≤ 0.05). In 2022, significant differences between treatments S1 to S5 and CK were noted (p ≤ 0.05), with respective reductions of 3.90%, 9.16%, 35.19%, 40.98%, and 57.31%.
Table 5 summarizes the variations in jujube fruit yield and quality indicators from 2020 to 2022 under different irrigation salinity levels. A distinct nonlinear response was observed across all indicators. Low salinity (2 g·L−1) generally improved fruit volume, yield, water productivity (WP), and quality parameters, while higher salinity treatments (≥6 g·L−1) led to significant reductions (p ≤ 0.05). In 2020 and 2021, fruit volume and yield under S1 increased by approximately 20.94% and 16.06%, respectively, compared to CK, whereas S5 showed corresponding decreases of 3.83% and 16.75%. This suggests that yield performance peaked under mild salinity but declined sharply with excessive salt stress. The trends in WP and yield are similar. Compared to CK, WP in S1 increased by 16.52% in 2020 and remained elevated in 2021. However, by 2022, all treatments showed a decline in WP, with S4 and S5 decreasing by 24.63% and 32.09%, respectively, indicating the cumulative effects of salinity stress over time. In terms of fruit quality, moderate salinity consistently enhanced total sugar content and vitamin C levels during the first 2 years. For instance, S1 yielded the highest vitamin C concentrations in 2020 and 2021 (204.20 and 198.82 mg·100 g−1), reflecting increases of 16.24% and 13.78% over CK. However, these advantages were not maintained in 2022, when most treatments, except S1, exhibited significant declines.

3.4. Multi-Objective Evaluation Based on Entropy-Weighted TOPSIS

This method assumes that the optimal alternative is the one closest to the positive ideal solution and farthest from the negative ideal solution. By normalizing the evaluation indicators, it computes the Euclidean distance of each alternative from both the positive and negative ideal points. The relative closeness of each alternative is then determined, allowing for a comprehensive ranking and identification of the optimal option.
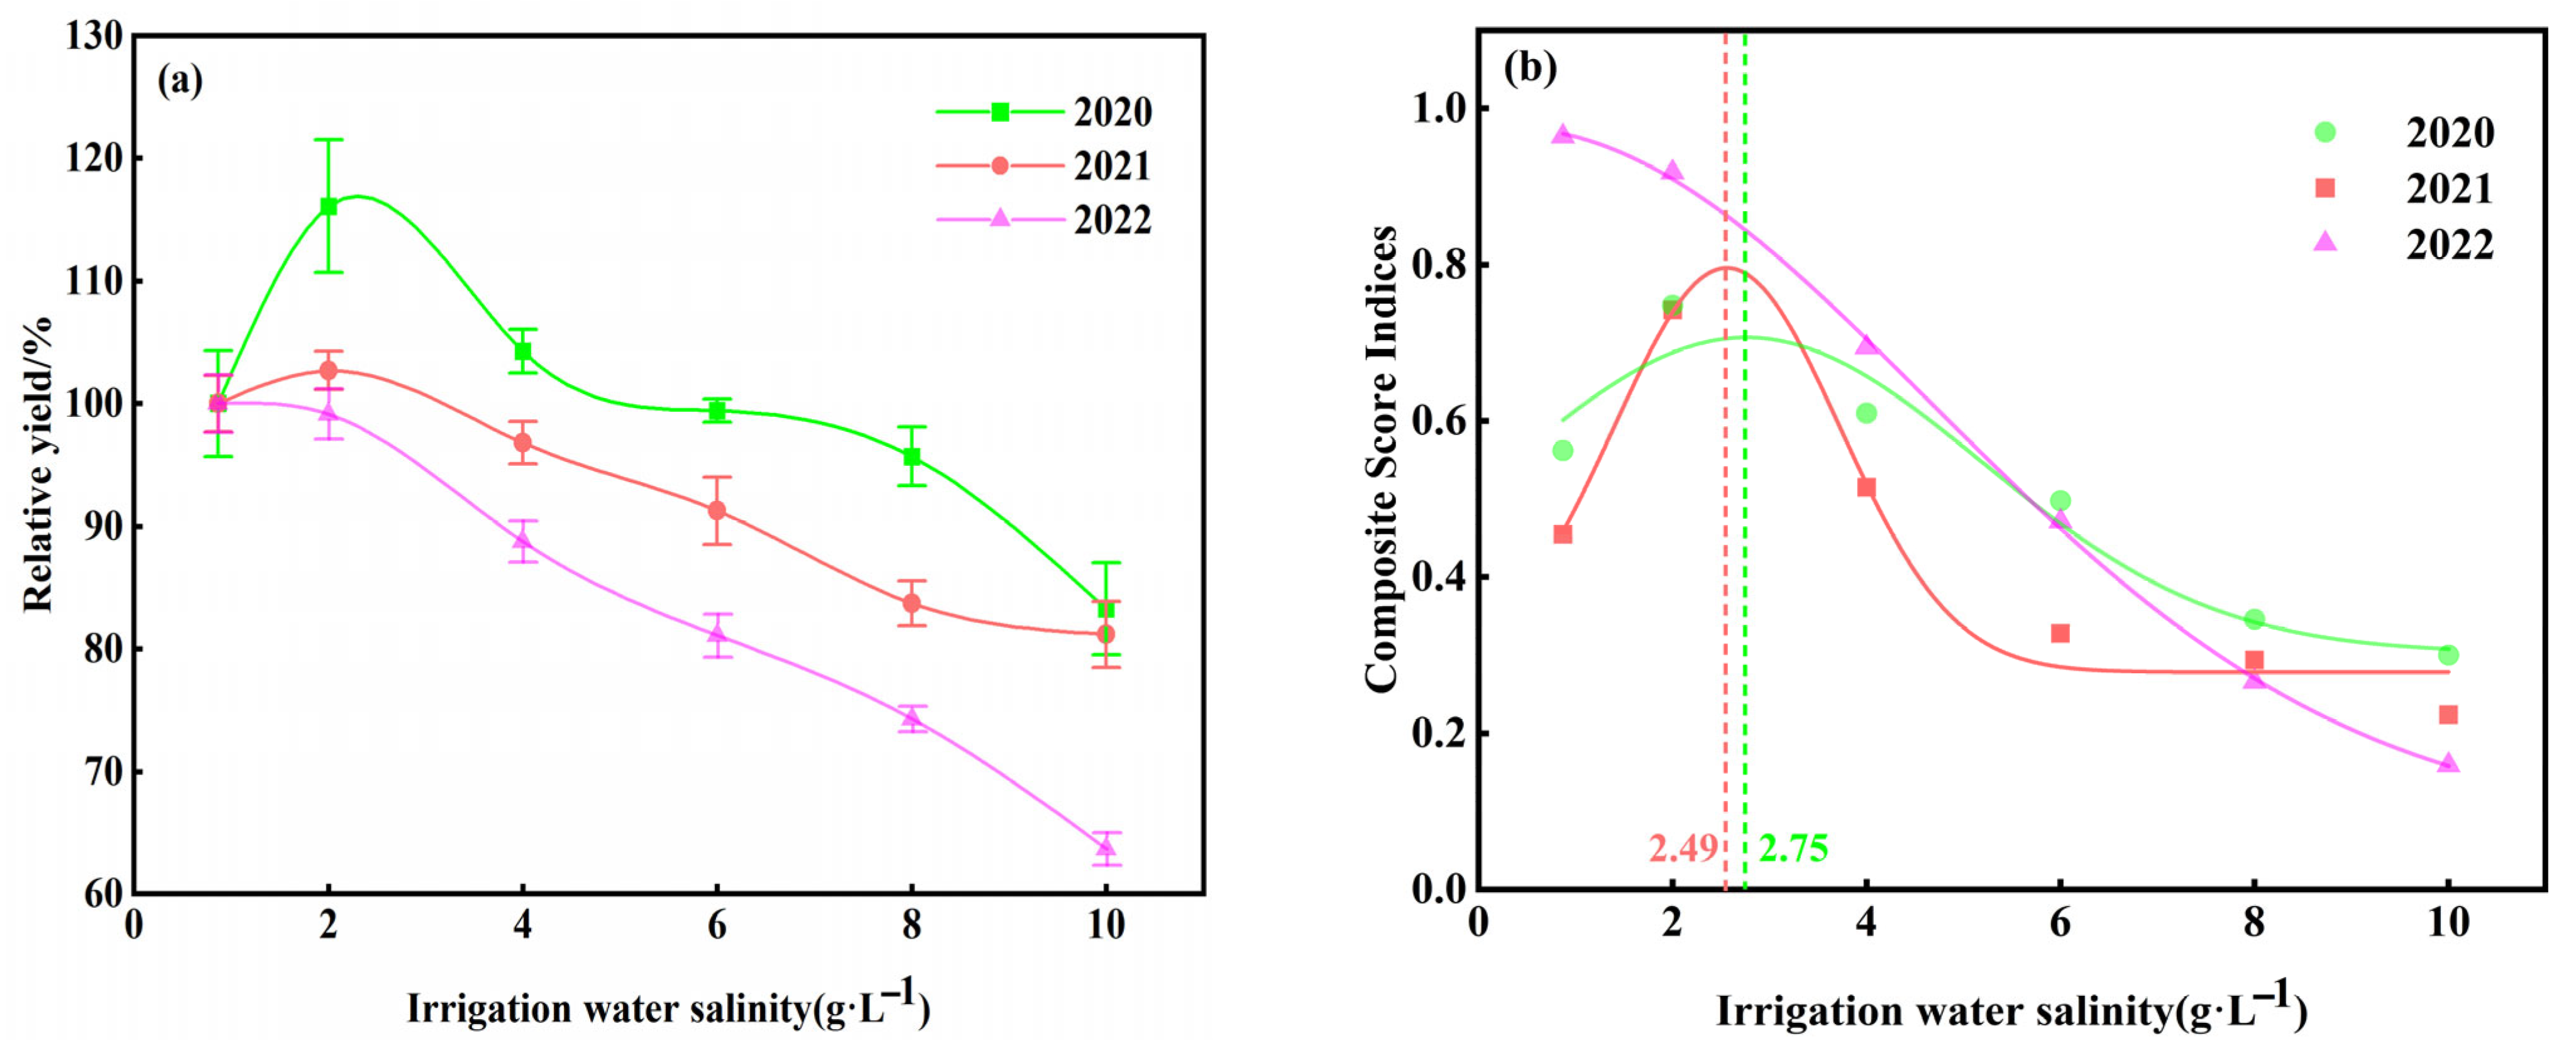
Figure 8a illustrates the relative yield of jujube trees under different irrigation water salinity levels. Relative yield generally declined with increasing salinity across all treatments, except for S1 in 2020 and 2021, where yields remained comparable to the control (CK). To further evaluate the contribution of each indicator, an entropy weight analysis was conducted (Table 6). The results show minimal interannual variation in indicator weights. Among them, yield and quality indicators consistently held the highest weights, ranging from 0.0770 to 0.0805. Agronomic traits ranked second, with weights between 0.0744 and 0.0795. In contrast, indicators related to soil salinity and alkalinity exhibited the lowest weights, ranging from 0.0717 to 0.0769.
The comprehensive scores and rankings of different irrigation water salinity treatments based on the TOPSIS method are presented in Table 7. From 2020 to 2021, the S1 and S2 exhibited significantly higher scores compared to the CK. Specifically, S1 recorded the highest scores of 0.748 and 0.742, while S2 followed with scores of 0.610 and 0.515. In contrast, the scores for the other treatments were lower than those of the CK. In 2022, the scores for all treatments were lower than those for CK. Furthermore, the results presented in Figure 8b demonstrate the relationship between irrigation water salinity and comprehensive scores. Specifically, the optimal salinity levels for irrigation water were found to be 2.75 g·L−1 in 2020 and 2.49 g·L−1 in 2021, while the freshwater treatment was determined to be optimal in 2022.

4. Discussion

4.1. Effects on Soil Salinity

The use of saline water resources plays a crucial role in mitigating water scarcity in arid regions; however, their long-term impacts on soil salinity dynamics and crop performance remain insufficiently studied. This study revealed that increasing irrigation water salinity led to continuous accumulation of soluble salts in the soil profile, predominantly within the 0–0.4 m layer, with the highest accumulation occurring in the 0–0.2 m layer. This is consistent with earlier research [16,40], which suggests that intense evaporation can intensify the upward migration of soil salinity from deeper layers to more superficial ones, ultimately leading to an increase in surface soil salinity. In addition, this study found that under the S5 treatment, the soluble salt content in the 0–0.4 m soil layer reached 25.07 g·kg−1 by the end of the third year, consistent with the findings of Li et al. [41], who reported that irrigation with medium salinity would introduce salt into the soil, particularly when evaporation exceeded leaching, resulting in a gradual increase in soil conductivity each year. Meanwhile, the Cl concentration in saline irrigation water increases proportionally with salinity levels. Due to its high solubility and mobility, Cl readily accumulates in the surface soil during evaporation, where it combines with Na+ to form Na+-Cl complexes, thereby intensifying salt accumulation in the topsoil. Notably, in this study, soil salinity in the 0.3–0.6 m layer exhibited a unimodal distribution, with the peak gradually shifting downward over time (Figure 4). This pattern contrasts with the findings of Li and Wang et al. in the high-precipitation region of the Huang–Huai–Hai Plain, where soil salinity was observed to be more evenly distributed across the entire soil profile [12,26]. This discrepancy highlights the variability of water–salt transport mechanisms across different climatic zones. Under arid conditions, characterized by low precipitation and high evaporation, salt migration tends to be episodic and heterogeneous, leading to gradual accumulation and downward displacement of salts within the middle layer of the root zone.

4.2. Effects on Soil Hydrochemical Characteristics

Different salinity levels of saline water treatments altered soil pH, SAR, and major ion contents, thereby changing the soil’s hydrochemical properties. With increasing irrigation water salinity, both soil pH and SAR exhibited a progressively rising trend over the years, consistent with previous research findings [42,43]. Saline water irrigation accelerates the accumulation of Na+ in the soil, which competes for cation exchange sites and displaces Ca2+ and Mg2+ from soil colloid surfaces. This cation exchange process weakens the electrostatic cohesion between soil colloids, leading to soil structure degradation and reduced permeability, thereby increasing the risks of soil salinization and alkalization [27].
The excess Na+ also reacts with alkaline anions, such as HCO3, to form alkaline salts like NaHCO3, which further increases soil pH [44]. Furthermore, an increase in irrigation water salinity has been shown to modify the composition and ratio of anions and cations in the soil solution through the effects of evaporation concentration and ion exchange [44]. The present study found that under freshwater treatment, there were no significant interannual differences in the anion and cation contents of the soil solution, and the soil hydrochemical type remained unchanged. However, as the experiment progressed and the irrigation water salinity increased, the contents of Cl, SO42−, Na+ + K+, and Mg2+ increased. When the salinity was ≥4 g·L−1, Mg2+ gradually replaced Ca2+, and the water chemistry type shifted from Cl·SO42−·Na+·Ca2+ to Cl-Na+·Mg2+ [45,46]. The analysis indicates that under low-salinity treatments, Cl, SO42−, and Na++K+ dominate the soil solution because of their high solubility and weaker ion exchange activity. As irrigation water salinity increases, Ca2+ tends to precipitate with CO32− or SO42− ions, causing a gradual decline in Ca2+ and SO42− levels. Conversely, Mg2+ exhibits higher solubility, reduced propensity for precipitation, and diminished sensitivity to cation exchange, consequently assuming a predominant role and resulting in a shift in the soil water chemistry type [16,47]. During the experimental period, the combination of low rainfall and high temperatures significantly enhanced surface evaporation, resulting in considerable moisture loss and salt accumulation in the upper soil layers. This phenomenon served to further intensify the increase in ion concentrations and the migration of dominant ions. Concurrently, elevated temperatures accelerated water depletion, reduced the leaching window for salts, and inhibited the downward movement and replenishment of Ca2+ [47]. Consequently, the soil hydrochemical type underwent a marked transformation.

4.3. Effects on the Growth of Jujube Trees

Prolonged saline water irrigation has been shown to intensify salt stress in young jujube trees, resulting in the hindrance of normal development of growth parameters and a significant decline in yield and fruit quality (Table 5). Research indicates that during the first two years of the experiment, irrigation water salinity ≤ 4 g·L−1 did not significantly hinder the growth and development of jujube trees and moderately enhanced yield and fruit quality. However, by the third year, all treatments exhibited a certain degree of growth inhibition in comparison to the freshwater treatment [48]. Low-salinity irrigation water, by providing moderate levels of mineral nutrients, can improve soil ionic balance [49], enhance osmotic regulation and antioxidant metabolism in jujube trees, and promote the synthesis of sugars and vitamin C, which serve both nutritional and defensive roles [50]. However, when irrigation water salinity exceeds the salt tolerance threshold of jujube trees (4.9 dS·m−1), soil salt accumulation intensifies, resulting in environmental degradation [51], structural collapse, and reductions in soil aeration and permeability [12]. These adverse conditions inhibit root water uptake, exacerbate ion toxicity, and impair carbon assimilation, ultimately suppressing the biosynthesis of sugars and vitamin C [17]. Furthermore, the present study demonstrated that with increasing irrigation water salinity, the height, stem diameter, jujube fruit stalk length, and leaf area index of jujube trees exhibited a similar trend [52,53]. The combined impact of salt stress on water productivity, nutrient uptake, and photosynthetic capacity is the primary factor influencing these growth indicators [26]. Under moderate salinity, plants enhance photosynthetic capacity and structural support by increasing leaf area and stem thickness, thus promoting the growth of height and fruit stalks. Conversely, under conditions of high salt stress, salt progressively suppresses root absorption, thereby reducing water and nutrient availability and significantly decreasing growth indicators [54].

4.4. Multi-Objective Evaluation

The TOPSIS method is a multi-criteria decision-making approach grounded in the concept of the ideal solution [55]. The comprehensive evaluation method allows for the integration of multiple indicators, thus offering more thorough and precise decision support. The entropy-weighted TOPSIS method effectively resolves weight determination and optimal scheme selection in multi-criteria decision-making, while enabling a straightforward assessment of the relative merits of different schemes [56]. The findings indicate that the weight proportions for fruit yield and quality indicators are the highest, followed by those for jujube tree agronomic traits, while the proportions for soil salinity and alkalinity characteristics are the lowest [49,57]. This is attributed to the direct and significant impact of yield and quality indicators on jujube tree production, which have high economic value, giving them the highest weight. Jujube agronomic traits exhibit relative stability and are less influenced by irrigation water salinity, ranking below yield and quality indicators. While soil salinity and alkalinity characteristics do influence jujube growth, their effects are slower and more indirect, resulting in the lowest weight proportion. Meanwhile, the TOPSIS ranking results demonstrate that during the initial 2 years of the experiment, the treatment rankings remained consistent: S1 > S2 > CK > S3 > S4 > S5. However, as irrigation water salinity increased, the rankings of all treatments progressively declined in the third year, indicating that saline water irrigation is feasible in the short term from the perspective of water resource conservation. However, as irrigation frequency increases, soil salts gradually accumulate, and once a certain threshold is exceeded, excessively high salt concentrations have a detrimental effect on jujube tree growth, thereby influencing the optimal irrigation water salinity. The fitting results in Figure 8b further demonstrate that the optimal irrigation water salinity levels for 2020, 2021, and 2022 were 2.75 g·L−1 (4.29 ds·m−1), 2.49 g·L−1 (3.88 ds·m−1), and 0.87 g·L−1 (1.36 ds·m−1), respectively. This indicates that as irrigation water salinity increases, the adverse effects on soil and crops gradually intensify. In order to ensure the rational utilization of saline water resources, irrigation practices should be adjusted in a prompt manner in response to the dynamic changes in soil salinity. In addition, there is a necessity to reinforce water–salt regulation strategies in order to prevent salt accumulation and the consequent irreversible degradation of agricultural systems.

4.5. Strengths and Limitations of the Study

This study presents a comprehensive, multi-year field evaluation of the impacts of continuous saline water irrigation on both soil salinization processes and the physiological performance of jujube (Ziziphus jujuba), a salt-sensitive perennial crop. Unlike many previous studies that focus primarily on annual crops or short-term effects, this experiment systematically tracked spatiotemporal salt dynamics, soil hydrochemical evolution, and crop responses over 3 consecutive years. The integration of the entropy weight TOPSIS model to evaluate trade-offs between yield and environmental constraints introduces methodological innovation and enhances decision-making relevance. However, several limitations should be acknowledged. The crop coefficient (Kc) is calculated based on the plant water demand model, with factors such as crop physiological differences, microclimate variations, and water transport characteristics under different soil conditions causing variations in the Kc [58]. Under long-term saline irrigation, the growth cycle, irrigation demand, and root growth patterns of jujube may not align fully with the FAO’s standard Kc curve, introducing uncertainty. This uncertainty is particularly pronounced in arid and saline–alkali regions. Future research should validate the applicability of the modified Kc values under these specific environmental conditions. This study used the gravimetric (oven-drying) method to determine soil moisture content. While this method is highly accurate, its low measurement frequency limits the ability to track soil moisture dynamics in real-time, restricting the flexible adjustment of irrigation volumes. Given this limitation, the study adopted the ‘full irrigation’ principle to control irrigation volume. While over-irrigation may reduce salt accumulation in the root zone through salt leaching, this phenomenon was not specifically addressed in the study. Salt leaching, caused by over-irrigation, should be considered a potential strategy for saline water irrigation management, and future research could explore its effectiveness in practical applications.

5. Conclusions

Saline water irrigation markedly influenced the vertical distribution and temporal dynamics of soil salinity in arid regions of Xinjiang. Over the 3-year experimental period, salt accumulation in the 0–1 m soil profile increased with rising irrigation water salinity, with the surface 0–0.4 m layer accounting for 50.27–74.95% of the total salt content, identifying this as the primary zone of salt accumulation. A distinct unimodal distribution was observed in the 0.3–0.6 layer, and the salinity peak gradually migrated downward, indicating salt migration to deeper layers. Meanwhile, both soil pH and sodium adsorption ratio (SAR) exhibited consistent annual increases, especially under irrigation salinity levels ≥ 4 g·L−1. The hydrochemical composition of the soil solution shifted from Cl·SO42−–Na+·Ca2+ to Cl-Na+·Mg2+ with increasing salinity, indicating a Cl dominated ion migration mechanism and the progressive deterioration of soil colloidal structure. Jujube trees demonstrated a nonlinear response to irrigation salinity in terms of overall crop performance. In the first 2 years, moderate saline irrigation (≤3 g·L−1) significantly improved plant height, stem diameter, fruit quality, and WP. Model fitting identified optimal irrigation salinity levels of 2.75 g·L−1 in 2020 and 2.49 g·L−1 in 2021. However, by 2022, continued salt accumulation led to significant declines in growth parameters, yield, and WP, suggesting potential physiological stress due to salt accumulation. In summary, short-term application of saline irrigation water (≤3 g·L−1) can enhance jujube tree growth and fruit quality in arid regions of Xinjiang. However, prolonged use beyond this duration may result in increased risks of soil degradation and yield reduction. Building on the observations made in this study, future research should focus on investigating timely salinity management strategies, such as freshwater leaching or rotational irrigation, which could be implemented by the end of the second year or the beginning of the third year. These strategies would facilitate the safe utilization of saline water resources and promote the sustainable development of fruit production in arid environments.

Author Contributions

Conceptualization, Q.Z. and Y.M.; methodology, Q.Z. and M.X.; software, Q.Z.; validation, Q.Z. and P.A.; formal analysis, Q.Z.; investigation, Y.M. and Q.Z.; resources, Y.M.; data curation, Q.Z.; writing—original draft preparation, M.X. and Q.Z.; writing—review and editing, M.X. and Y.M.; visualization, P.A.; supervision, Y.M.; project administration, Y.M.; funding acquisition, Y.M. All authors have read and agreed to the published version of the manuscript.

Funding

This research was funded by the National Natural Science Foundation of China (52069027); Xinjiang Uygur Autonomous Region Talent Development Fund “Tianshan Leading Talent” Program (2024TSYCLJ0013); National Key Research and Development Program (2021YFD1900804-04); and Xinjiang Uygur Autonomous Region Youth Science Foundation (2023D01B28).

Data Availability Statement

All data will be made available on request to the corresponding author’s email with appropriate justification.

Conflicts of Interest

The authors declare no conflicts of interest.

References

  1. Ma, T.; Sun, S.; Fu, G.; Hall, J.W.; Ni, Y.; He, L.; Yi, J.; Zhao, N.; Du, Y.; Pei, T.; et al. Pollution Exacerbates China’s Water Scarcity and Its Regional Inequality. Nat. Commun. 2020, 11, 650. [Google Scholar] [CrossRef] [PubMed]
  2. Mohamed, M.M.; El-Shorbagy, W.; Kizhisseri, M.I.; Chowdhury, R.; McDonald, A. Evaluation of Policy Scenarios for Water Resources Planning and Management in an Arid Region. J. Hydrol. Reg. Stud. 2020, 32, 100758. [Google Scholar] [CrossRef]
  3. Gupta, R.; Kumar, G. Scenario Planning for Water Resource Management in Semi Arid Zone. Phys. Chem. Earth Parts A/B/C 2018, 105, 290–299. [Google Scholar] [CrossRef]
  4. Xue, J.; Ren, L. Conjunctive Use of Saline and Non-Saline Water in an Irrigation District of the Yellow River Basin. Irrig. Drain. 2017, 66, 147–162. [Google Scholar] [CrossRef]
  5. Min, W.; Guo, H.; Zhou, G.; Zhang, W.; Ma, L.; Ye, J.; Hou, Z. Root Distribution and Growth of Cotton as Affected by Drip Irrigation with Saline Water. Field Crops Res. 2014, 169, 1–10. [Google Scholar] [CrossRef]
  6. Huang, C.H.; Zong, L.; Buonanno, M.; Xue, X.; Wang, T.; Tedeschi, A. Impact of Saline Water Irrigation on Yield and Quality of Melon (Cucumis melo cv. Huanghemi) in Northwest China. Eur. J. Agron. 2012, 43, 68–76. [Google Scholar] [CrossRef]
  7. Cheng, M.; Wang, H.; Fan, J.; Wang, X.; Sun, X.; Yang, L.; Zhang, S.; Xiang, Y.; Zhang, F. Crop Yield and Water Productivity under Salty Water Irrigation: A Global Meta-Analysis. Agric. Water Manag. 2021, 256, 107105. [Google Scholar] [CrossRef]
  8. Zhang, H.; Zeng, F.; An, H. Formation, Distribution and Transport of Shallow Groundwater in Arid Areas, China. Arid. Zone Res. 2011, 28, 67–73. [Google Scholar] [CrossRef]
  9. Zhou, J.; Wu, B.; Wang, Y. Distribution and quality evaluation of medium-salinity groundwater in the plain area of Tarim Basin, Xinjiang. CRWHP 2009, 9, 32–36. [Google Scholar]
  10. Selim, T.; Bouksila, F.; Berndtsson, R.; Persson, M. Soil Water and Salinity Distribution under Different Treatments of Drip Irrigation. Soil Sci. Soc. Am. J. 2013, 77, 1144–1156. [Google Scholar] [CrossRef]
  11. Ma, J.; Li, Z.; Jiang, W.; Liu, J. Effects of Different Salinity Levels in Drip Irrigation with Brackish Water on Soil Water-Salt Transport and Yield of Protected Tomato (Solanum lycopersicum). Agronomy 2023, 13, 2442. [Google Scholar] [CrossRef]
  12. Wang, H.; Zheng, C.; Ning, S.; Cao, C.; Li, K.; Dang, H.; Wu, Y.; Zhang, J. Impacts of Long-Term Saline Water Irrigation on Soil Properties and Crop Yields under Maize-Wheat Crop Rotation. Agric. Water Manag. 2023, 286, 108383. [Google Scholar] [CrossRef]
  13. SBX. Xinjiang Statistical Yearbook in 2022; China Statistical Publishing House: Ürümqi, China, 2023. [Google Scholar]
  14. Rouzi, A.; Halik, Ü.; Thevs, N.; Welp, M.; Aishan, T. Water Efficient Alternative Crops for Sustainable Agriculture along the Tarim Basin: A Comparison of the Economic Potentials of Apocynum pictum, Chinese Red Date and Cotton in Xinjiang, China. Sustainability 2017, 10, 35. [Google Scholar] [CrossRef]
  15. Xin, M.; Zhao, Q.; Qiao, Y.; Ma, Y. Magnetized Saline Water Drip Irrigation Alters Soil Water-Salt Infiltration and Redistribution Characteristics. Water 2024, 16, 2693. [Google Scholar] [CrossRef]
  16. Yang, G.; Li, F.; Tian, L.; He, X.; Gao, Y.; Wang, Z.; Ren, F. Soil Physicochemical Properties and Cotton (Gossypium hirsutum L.) Yield under Brackish Water Mulched Drip Irrigation. Soil Tillage Res. 2020, 199, 104592. [Google Scholar] [CrossRef]
  17. Liu, Z.; Jiao, X.; Lu, S.; Zhu, C.; Zhai, Y.; Guo, W. Effects of Winter Irrigation on Soil Salinity and Jujube Growth in Arid Regions. PLoS ONE 2019, 14, e0218622. [Google Scholar] [CrossRef]
  18. Leilei, G.; Zaimin, W. Interaction between Brackish Water Intermittent Infiltration and Cultivated Soil Environment: A Case Study from Arid Piedmont Plain of Northwest China. Front. Earth Sci. 2022, 10, 894033. [Google Scholar] [CrossRef]
  19. Lekakis, E.H.; Antonopoulos, V.Z. Modeling the Effects of Different Irrigation Water Salinity on Soil Water Movement, Uptake and Multicomponent Solute Transport. J. Hydrol. 2015, 530, 431–446. [Google Scholar] [CrossRef]
  20. Rengasamy, P. Soil Chemistry Factors Confounding Crop Salinity Tolerance—A Review. Agronomy 2016, 6, 53. [Google Scholar] [CrossRef]
  21. Zhang, A.; Zheng, C.; Li, K.; Dang, H.; Cao, C.; Rahma, A.E.; Zhang, J.; Feng, D. Responses of Soil Water-salt Variation and Cotton Growth to Drip Irrigation with Saline Water in the Low Plain near the Bohai Sea. Irrig. Drain. 2020, 69, 448–459. [Google Scholar] [CrossRef]
  22. Harter, F.S.; Harter, L.D.S.H.; Meneghello, G.E. Rice Seed Production under Conditions of Salinity Stres. Ciênc. Rural 2018, 48, e20170057. [Google Scholar] [CrossRef]
  23. Yuan, C.; Feng, S.; Huo, Z.; Ji, Q. Effects of Deficit Irrigation with Saline Water on Soil Water-Salt Distribution and Water Use Efficiency of Maize for Seed Production in Arid Northwest China. Agric. Water Manag. 2019, 212, 424–432. [Google Scholar] [CrossRef]
  24. Rahman, M.; Mostofa, M.G.; Keya, S.S.; Siddiqui, N.; Ansary, M.U.; Das, A.K.; Rahman, A.; Tran, L.S.-P. Adaptive Mechanisms of Halophytes and Their Potential in Improving Salinity Tolerance in Plants. Int. J. Mol. Sci. 2021, 22, 10733. [Google Scholar] [CrossRef]
  25. Zhai, Y.; Yang, Q.; Hou, M. The Effects of Saline Water Drip Irrigation on Tomato Yield, Quality, and Blossom-End Rot Incidence—A 3a Case Study in the South of China. PLoS ONE 2015, 10, e0142204. [Google Scholar] [CrossRef]
  26. Li, D.; Wan, S.; Li, X.; Kang, Y.; Han, X. Effect of Water-Salt Regulation Drip Irrigation with Saline Water on Tomato Quality in an Arid Region. Agric. Water Manag. 2022, 261, 107347. [Google Scholar] [CrossRef]
  27. Souto, A.G.D.L.; Pessoa, A.M.D.S.; Sá, S.A.D.; Sousa, N.R.D.; Barros, E.S.; Morais, F.M.D.S.; Ferreira, F.N.; Silva, W.A.O.D.; Batista, R.O.; Silva, D.V.; et al. Potential of Ca-Complexed in Amino Acid in Attenuating Salt Stress in Sour Passion Fruit Seedlings. Plants 2024, 13, 2912. [Google Scholar] [CrossRef]
  28. Sarita; Bhupnesh; Goyal, V. Promoting Sustainable Agriculture: Approaches for Mitigating Soil Salinity Challenges: A Review Promoting Sustainable Agriculture: Approaches for Mitigating Soil Salinity Challenges: A Review. Agric. Rev. 2024, 46, 444–450. [Google Scholar] [CrossRef]
  29. Chen, Y.; Lou, S.; Chen, X.; Yang, S. Effects of Brackish Water Irrigation with Different Exogenous Salt Concentrations on the Growth and Rhizosphere Salinity of Lycium barbarum. Sci. Rep. 2024, 14, 21554. [Google Scholar] [CrossRef] [PubMed]
  30. Allen, R.G.; Pereira, L.S.; Howell, T.A.; Jensen, M.E. Evapotranspiration Information Reporting: I. Factors Governing Measurement Accuracy. Agric. Water Manag. 2011, 98, 899–920. [Google Scholar] [CrossRef]
  31. Wang, Y. Analysis of Chemical Characteristics of High-Fluoride Groundwater in Aksu Prefecture, Xinjiang. J. Arid. Land Resour. Environ. 2013, 27, 87–92. [Google Scholar]
  32. Li, Q.; Jia, R.L.; Zhou, J.L.; Yang, G.Y. Preliminary Analysis of High-Fluoride Groundwater in Aksu Prefecture, Xinjiang, China. Adv. Mater. Res. 2012, 610–613, 1041–1046. [Google Scholar] [CrossRef]
  33. Ai, P.; Ma, Y.; Hai, Y. Comparing Simulated Jujube Evapotranspiration from P–T, Dual Kc, and S–W Models against Measurements Using a Large Weighing Lysimeter under Drip Irrigation in an Arid Area. Agriculture 2023, 13, 437. [Google Scholar] [CrossRef]
  34. Macfarlane, C.; Hoffman, M.; Eamus, D.; Kerp, N.; Higginson, S.; McMurtrie, R.; Adams, M. Estimation of Leaf Area Index in Eucalypt Forest Using Digital Photography. Agric. For. Meteorol. 2007, 143, 176–188. [Google Scholar] [CrossRef]
  35. Ai, P.; Ma, Y.; Hai, Y. Influence of Jujube/Cotton Intercropping on Soil Temperature and Crop Evapotranspiration in an Arid Area. Agric. Water Manag. 2021, 256, 107118. [Google Scholar] [CrossRef]
  36. Patel, M.; Kumar, R.; Singh, K.A. Comprehensive Guide to Quality Analysis of Fruit Juices and Soft Drinks: Analytical Procedures, 1st ed.; Skyfox Publishing Group: New Delhi, India, 2020; ISBN 978-81-939536-1-7. [Google Scholar]
  37. You, L.; Ma, Y.; Hong, M. Study on a Simple Estimation Method of Single Fruit Weight of Southern Xinjiang Gray Jujube Based on Jujube Fruit Volume. J. Water Conserv. Constr. Eng. 2014, 12, 119–122. [Google Scholar]
  38. Zhang, N.; Jiang, H.; Li, S.; Zhang, P.; Su, X. Research of Hydrochemical Properties of Hyporheic Zone along the WeiHe River in Shanxi Segment. Geosci. Environ. Prot. 2017, 5, 226–232. [Google Scholar] [CrossRef]
  39. Stavi, I.; Thevs, N.; Priori, S. Soil Salinity and Sodicity in Drylands: A Review of Causes, Effects, Monitoring, and Restoration Measures. Front. Environ. Sci. 2021, 9, 712831. [Google Scholar] [CrossRef]
  40. Ding, B.; Bai, Y.; Guo, S.; He, Z.; Wang, B.; Liu, H.; Zhai, J.; Cao, H. Effect of Irrigation Water Salinity on Soil Characteristics and Microbial Communities in Cotton Fields in Southern Xinjiang, China. Agronomy 2023, 13, 1679. [Google Scholar] [CrossRef]
  41. Li, J.; Qu, Z.; Chen, J.; Wang, F.; Jin, Q. Effect of Different Thresholds of Drip Irrigation Using Saline Water on Soil Salt Transportation and Maize Yield. Water 2018, 10, 1855. [Google Scholar] [CrossRef]
  42. Hu, Y.; Li, X.; Jin, M.; Wang, R.; Chen, J.; Guo, S. Reduced Co-Occurrence and Ion-Specific Preferences of Soil Microbial Hub Species after Ten Years of Irrigation with Brackish Water. Soil Tillage Res. 2020, 199, 104599. [Google Scholar] [CrossRef]
  43. Liu, X.; Yan, F.; Wu, L.; Zhang, F.; Yin, F.; Abdelghany, A.E.; Fan, J.; Xiao, C.; Li, J.; Li, Z. Leaching Amount and Timing Modified the Ionic Composition of Saline-Alkaline Soil and Increased Seed Cotton Yield under Mulched Drip Irrigation. Field Crops Res. 2023, 299, 108988. [Google Scholar] [CrossRef]
  44. Bajwa, M.S.; Hira, G.S.; Singh, N.T. Effect of Sodium and Bicarbonate Irrigation Waters on Sodium Accumulation and on Maize and Wheat Yields in Northern India. Irrig. Sci. 1983, 4, 191–199. [Google Scholar] [CrossRef]
  45. Liu, Z.; Gao, M.; Sun, Q.; Hou, G.; Zhao, Y. Formation and Evolution of Soil Salinization Based on Multivariate Statistical Methods in Ningxia Plain, China. Front. Earth Sci. 2023, 11, 1186779. [Google Scholar] [CrossRef]
  46. Dong, R.; Liu, W.; Qu, J.; Cao, W. Accumulation of Na+ in Cotton Field under Mulched Drip Irrigation of Brackish Water in Arid Areas. Separations 2023, 10, 180. [Google Scholar] [CrossRef]
  47. Rahimi, L.; Amanipoor, H.; Battaleb-Looie, S. Effect of Salinity of Irrigation Water on Soil Properties (Abadan Plain, SW Iran). Geocarto Int. 2021, 36, 1884–1903. [Google Scholar] [CrossRef]
  48. Wu, Z.X.; Qi, S.T. The Effect of Soil Salinity on the Growth and Development of Jinsi Jujube. J. Fruit Sci. 1985, 2, 11–15. [Google Scholar]
  49. Ma, Z.; Zhu, Y.; Liu, J.; Li, Y.; Zhang, J.; Wen, Y.; Song, L.; Liang, Y.; Wang, Z. Multi-Objective Optimization of Saline Water Irrigation in Arid Oasis Regions: Integrating Water-Saving, Salinity Control, Yield Enhancement, and CO2 Emission Reduction for Sustainable Cotton Production. Sci. Total Environ. 2024, 912, 169672. [Google Scholar] [CrossRef] [PubMed]
  50. Wang, Y.; Feng, Y.; Yan, M.; Pu, X.; Lu, D.; Yuan, H.; Wu, C. Transcriptome Analyses Reveal the Mechanism of Changes in the Sugar Constituents of Jujube Fruits under Saline–Alkali Stress. Agronomy 2023, 13, 2243. [Google Scholar] [CrossRef]
  51. Kuban State Agrarian University named after I.T.; Trubilin; Prikhodko, I.A.; Romanova, A.S.; Sergeev, A.E. The Problem of Soil Salinization. Sci. Life 2022, 17, 676–685. [Google Scholar] [CrossRef]
  52. Lora, J.; Oteyza, M.A.P.D.; Fuentetaja, P.; Hormaza, J.I. Low Temperature Storage and in Vitro Germination of Cherimoya (Annona cherimola Mill.) Pollen. Sci. Hortic. 2006, 108, 91–94. [Google Scholar] [CrossRef]
  53. Brauc, S.; De Vooght, E.; Claeys, M.; Höfte, M.; Angenon, G. Influence of Over-Expression of Cytosolic Aspartate Aminotransferase on Amino Acid Metabolism and Defence Responses against Botrytis cinerea Infection in Arabidopsis thaliana. J. Plant Physiol. 2011, 168, 1813–1819. [Google Scholar] [CrossRef] [PubMed]
  54. Verma, S.S.; Verma, R.P.; Verma, S.K.; Yadav, A.L.; Verma, A.K. Responses of Ber (Zizyphus mauritiana Lamk.) Varieties to Different Level of Salinity. Int. J. Curr. Microbiol. Appl. Sci. 2018, 7, 580–591. [Google Scholar] [CrossRef]
  55. Chatterjee, P.; Chakraborty, S. Development of a Meta-Model for the Determination of Technological Value of Cotton Fiber Using Design of Experiments and the TOPSIS Method. J. Nat. Fibers 2018, 15, 882–895. [Google Scholar] [CrossRef]
  56. Liu, C.; Wang, J.; Huang, P.; Hu, C.; Gao, F.; Liu, Y.; Li, Z.; Cui, B. Response of Soil Microenvironment and Crop Growth to Cyclic Irrigation Using Reclaimed Water and Brackish Water. Plants 2023, 12, 2285. [Google Scholar] [CrossRef] [PubMed]
  57. Li, J.; He, P.; Chen, J.; Hamad, A.A.A.; Dai, X.; Jin, Q.; Ding, S. Tomato Performance and Changes in Soil Chemistry in Response to Salinity and Na/Ca Ratio of Irrigation Water. Agric. Water Manag. 2023, 285, 108363. [Google Scholar] [CrossRef]
  58. Paredes, P.; Petry, M.T.; Oliveira, C.M.; Montoya, F.; López-Urrea, R.; Pereira, L.S. Single and Basal Crop Coefficients for Estimation of Water Requirements of Subtropical and Tropical Orchards and Plantations with Consideration of Fraction of Ground Cover, Height, and Training System. Irrig. Sci. 2024, 42, 1059–1097. [Google Scholar] [CrossRef]
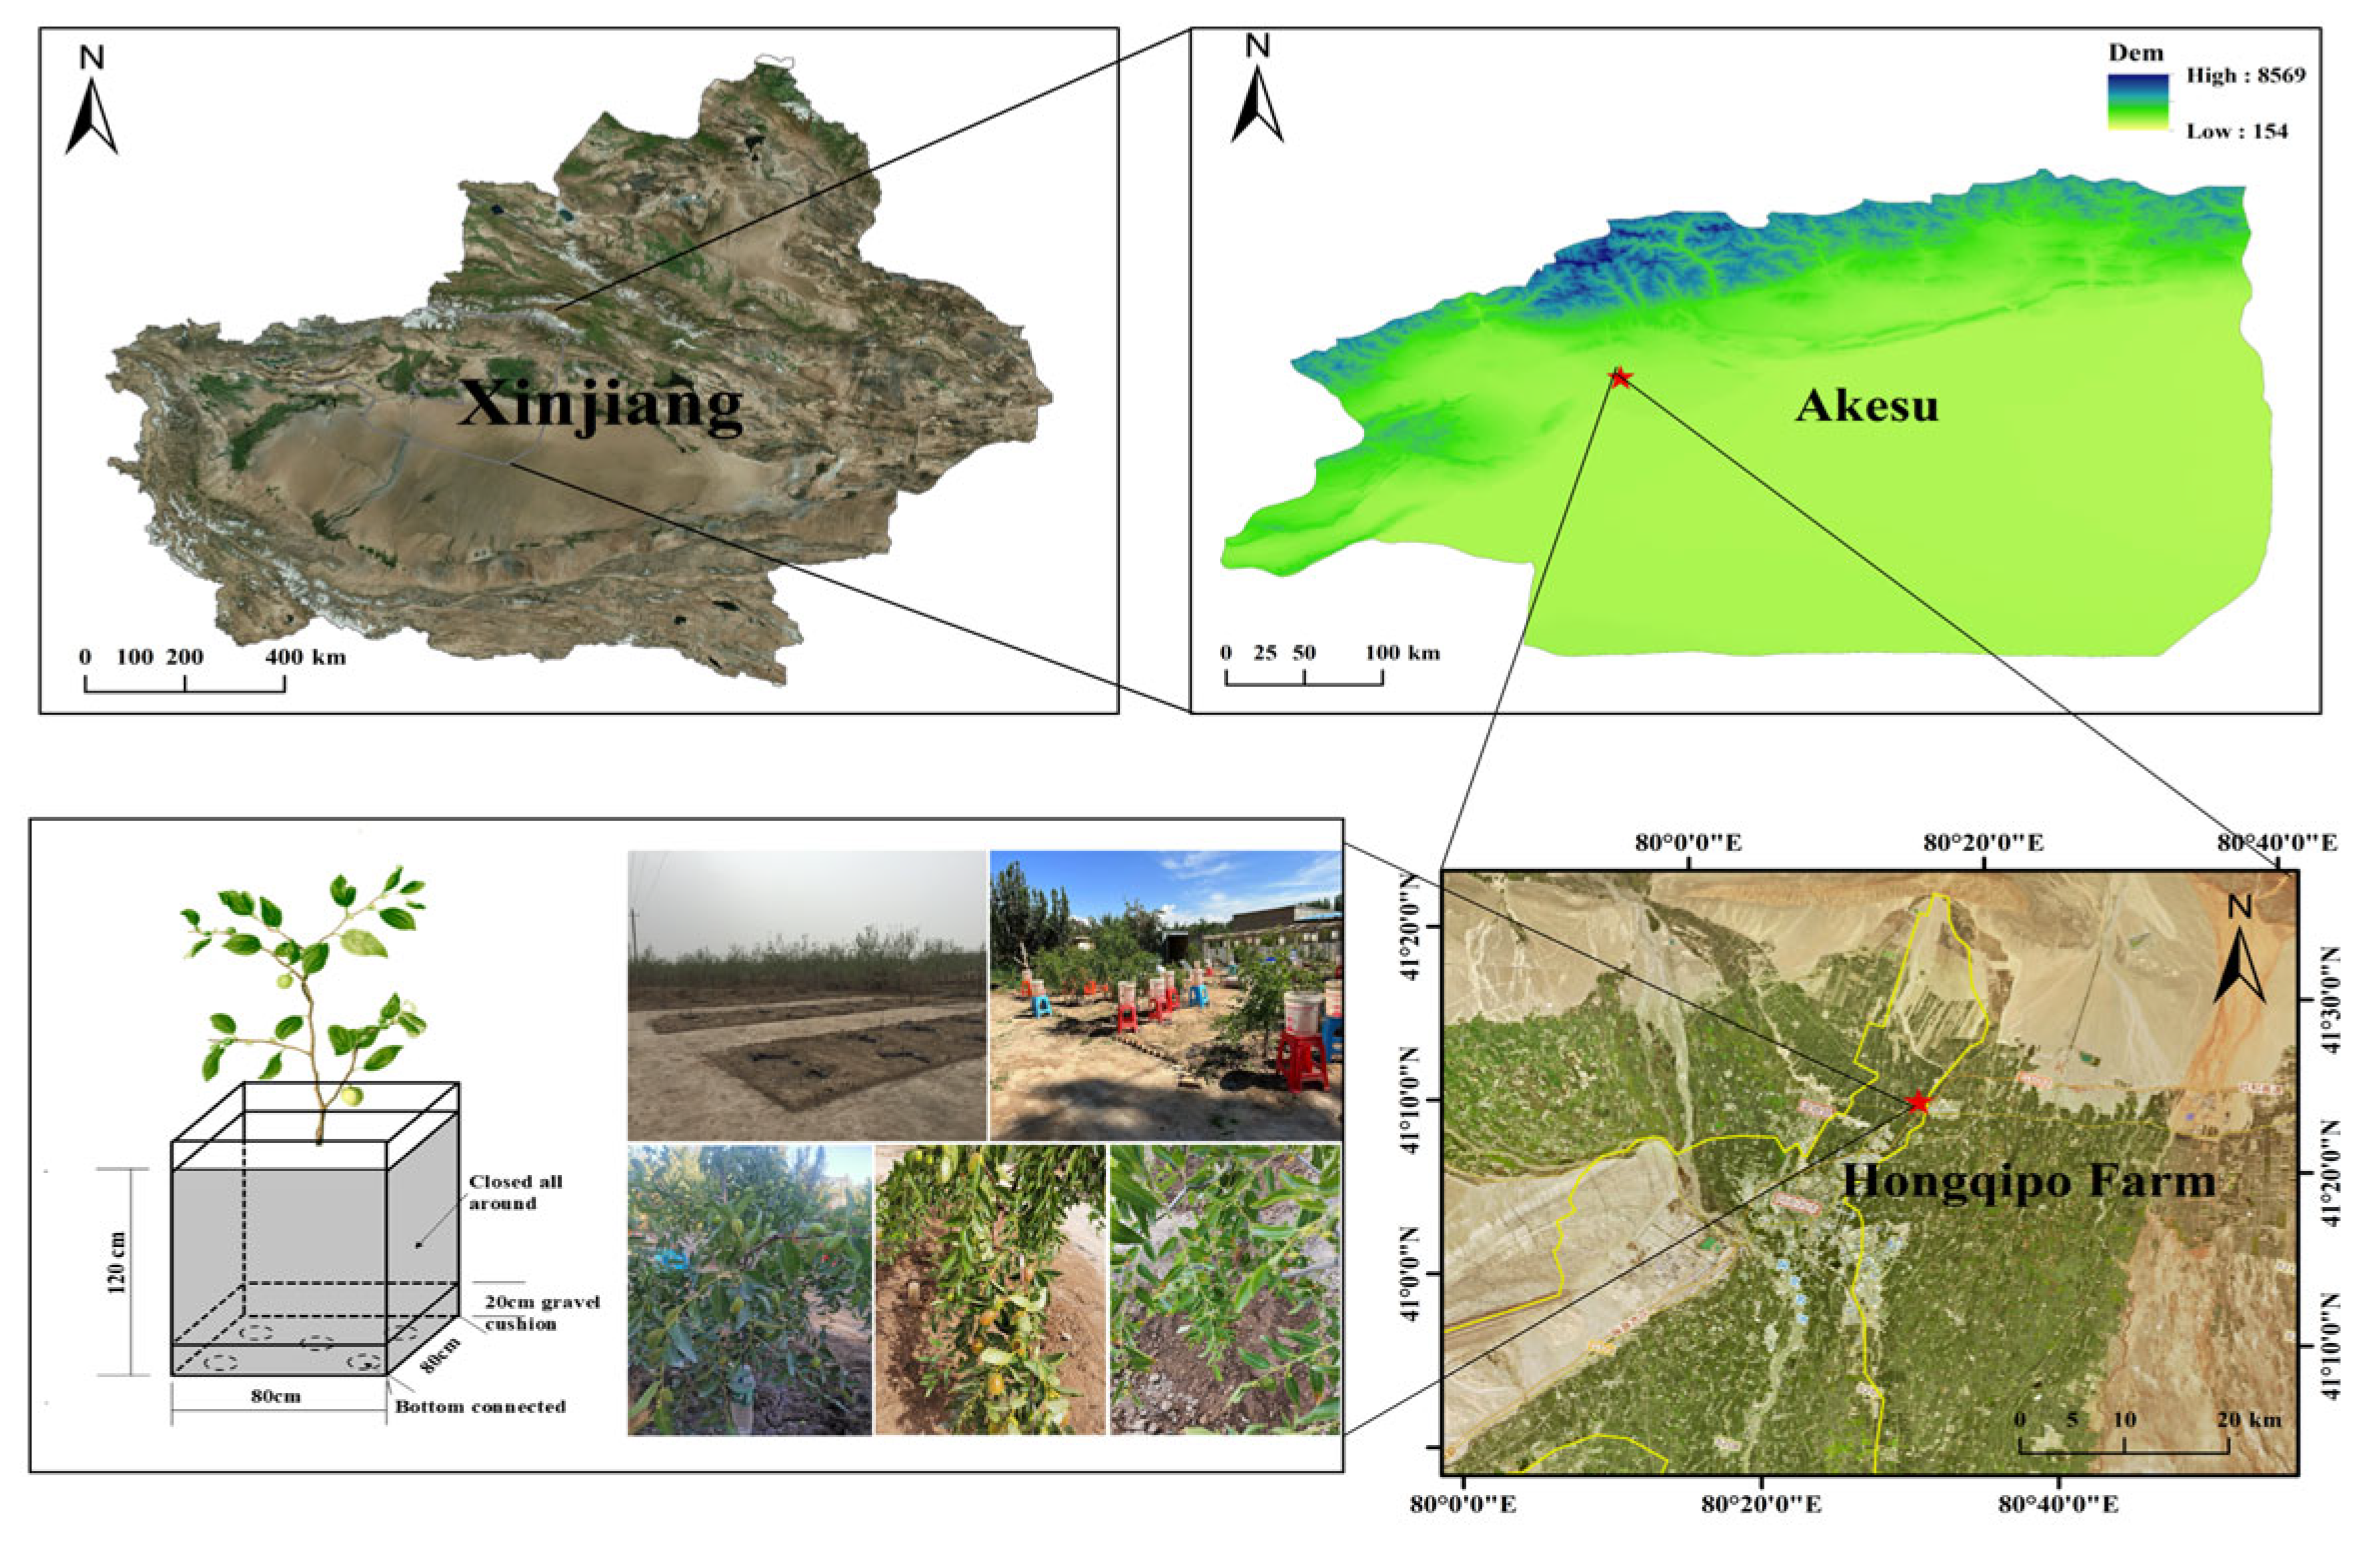
Figure 1. Experiment site location map and test pit layout.
Agronomy 15 01898 g001
Figure 2. (ac) illustrate the distribution of daily average temperature, precipitation, and ETo for the years 2020–2022, respectively.
Agronomy 15 01898 g002
Figure 3. Annual variation in the average salinity of the 0–1 m soil layer in the test pit. Note: The same uppercase letter indicates no significant difference (p > 0.05), whereas different letters indicate a significant difference (p ≤ 0.05). To enhance visual clarity, error bars were omitted due to clear differences among treatments within the same year. Lowercase and uppercase letters indicate significant differences determined using the same statistical method.
Agronomy 15 01898 g003
Figure 4. Dynamic changes of soil salinity during different growth stages of jujube trees from 2020 to 2022. Note: (ae) represent the bud stage, flowering stage, young fruit stage, fruit development stage, and maturity stage of jujube trees, respectively.
Agronomy 15 01898 g004
Figure 5. Soil pH and SAR profiles (0−1 m) at different growth stages of jujube trees. Note: (ac) represent the soil pH values from 2020 to 2022, respectively. I–V represents the bud stage, flowering stage, young fruit stage, fruit development stage, and maturity stage of jujube trees, respectively. (d) shows the soil SAR values from 2020 to 2022. The significant differences indicated by letter labels are consistent with the annotations in the Figure 3 note.
Agronomy 15 01898 g005
Figure 6. (ac) illustrate Soil Piper diagram under salt water drip irrigation with water salinity from 2020 to 2022. Note: The two lower triangles represent cation and anion distributions, which are projected into the central diamond to indicate hydrochemical types.
Agronomy 15 01898 g006
Figure 7. (ac) illustrate jujube plant height and stem diameter from 2020–2022, (de) illustrate jujube growth and LAI from 2020–2022. Note: Different letters indicate significant differences between means at (p ≤ 0.05). The difference in the same letter is not significant (p > 0.05). The error bars represent the standard deviation of three replicates.
Agronomy 15 01898 g007
Figure 8. (a) shows a relationship between irrigation water salinity and the relative yield of jujube trees. (b) shows a fitted relationship between irrigation water salinity and comprehensive evaluation score based on multiple indicators. The error bars represent the standard deviation of three replicates.
Agronomy 15 01898 g008
Table 1. Physical and chemical properties of the 0–1 m soil layer in the test pit.
DepthBulk DensityTextural Characteristics (%)pHSalt ContentSAR
(m)(g·cm−3)ClaySiltSand(g·kg−1)(mmol·L−1)0.5
Surface layer1.516.76627.38.183.582.85
0–0.51.547.6445.147.267.80.822.062
0.5–11.544.9426.2668.88.310.522.086
Note: the particle size limits for clay, silt, and sand are 0–0.002 mm, 0.002–0.02 mm, and 0.02–2 mm, respectively; the upper limit of particle size for clay is 0.002 mm.
Table 2. Soil initial ion content in the 0–1 m soil layer of the test pit.
DepthCO32−HCO3ClCa2+Mg2+SO42−K+Na+
(m)(mg·kg−1)(mg·kg−1)(mg·kg−1)(mg·kg−1)(mg·kg−1)(mg·kg−1)(mg·kg−1)(mg·kg−1)
Surface layer0269.36954.5254.07194.191232.98111.77563.64
0–0.50130.18215.3882.7146.56579.7636.78190.30
0.5–1073.6351.7332.3611.37275.7427.02102.80
Table 3. Ionic composition and chemical properties of irrigation water.
TreatmentsIonic Content (mmol·L−1)pHSalt ContentSAR
HCO3ClCa2+Mg2+SO42−K+Na+(g·kg−1)(mmol·L−1)0.5
CK1.411.082.293.483.460.620.768.140.871.87
S11.774.684.146.0613.682.692.868.182.035.26
S22.555.736.279.2924.766.737.358.274.0910.94
S33.627.738.0212.1130.037.779.828.136.1812.86
S44.749.7510.1814.9836.4512.8514.448.328.2116.90
S55.5212.4112.2217.7743.7617.9519.208.3810.2820.57
Table 4. Jujube evapotranspiration parameters and irrigation schedule across growth stages, 2020 to 2022.
YearsProjectBudding
4/19~5/16
Flowering
5/17~7/16
Young Fruit Stage
7/17~8/7
Fruit Developing
8/8~9/6
Maturity
9/7~10/27
-KC0.420.780.881.000.81-
2020ETo (mm)94.30265.9090.10101.6089.30641.20
Irrigation amount (mm)35.62172.8178.4489.5126.09402.47
Irrigation unit2525216
2021ETo (mm)82.60268.6087.30102.8088.40629.70
Irrigation amount (mm)28.94225.9452.19120.4143.21470.69
Irrigation unit2724217
2022ETo (mm)79.20234.3096.6090.4090.1590.60
Irrigation amount (mm)25.43175.4193.3075.5039.67409.31
Irrigation unit2633216
Note: The budding lasts 28 days, flowering 61 days, young fruit stage 22 days, fruit development 24 days, and maturity 51 days, with a total growth period of 192 days.
Table 5. The effects of different treatments on jujube fruit yield and quality indicators.
YearsTreatmentsFruit Volume
(cm3)
Calculated Yield
(kg·ha−1)
WP (kg·m−3)Total Sugar
(%)
Total Acid
(%)
Vitamin C
(mg·100 g−1)
2020CK6.78 bc673.5 bc1.15 bc55.1 a0.57 ab175.67 cd
S18.20 a781.67 a1.34 a57.17 a0.57 ab204.20 a
S27.18 bc702.17 b1.20 b54.03 ab0.61 a187.03 b
S36.73 bc669.67 bc1.15 bc50.77 bc0.56 ab167.67 cd
S46.55 c644.5 c1.11 c50.3 c0.56 ab158.03 d
S56.52 c560.67 d0.96 d47.33 c0.52 b155.23 d
2021CK7.20 c843.67 ab1.37 ab55.05 ab0.61 a174.76 c
S18.27 ab866.50 a1.41 a56.12 ab0.57 a198.82 a
S28.65 a816.83 b1.33 b53.44 bc0.55 a186.48 b
S37.89 b770.00 c1.25 c57.66 a0.54 a170.17 cd
S47.12 c706.02 d1.15 d53.85 bc0.56 a163.46 de
S56.74 c684.67 d1.11 d50.75 c0.55 a159.59 e
2022CK8.23 a856.21 a1.34 a55.44 a0.58 ab182.42 a
S18.08 a832.83 a1.29 a55.70 a0.62 a184.42 a
S27.67 b796.33 b1.23 b53.30 b0.56 ab171.11 b
S36.87 bc710.00 c1.17 c50.78 c0.52 b165.45 bc
S46.51 c633.83 d1.01 d49.10 cd0.55 ab159.53 c
S55.83 d514.33 e0.91 e47.50 c0.53 b145.70 d
Note: The same letter on the right side of the list indicates no significant difference (p > 0.05), whereas different letters indicate a significant difference (p ≤ 0.05).
Table 6. Calculated weight of each indicator based on the entropy weight method.
Indicators202020212022
WeightAverage WeightWeightAverage WeightWeightAverage Weight
Soil saline–alkali propertiesSoil salinity0.06110.07170.06470.07690.07660.0734
pH0.09950.10390.0785
SAR0.05440.06220.0652
Agronomic traits of jujube treesPlant height increase0.06590.07550.07490.07440.07920.0795
Stem thickness growth0.07400.07540.0889
Jujube hanging growing0.07690.08230.0835
LAI0.08500.06510.0663
Yield and qualityJujube fruit volume0.15450.08050.08760.07860.07080.0770
Theoretical yield0.05520.08480.0749
WP0.05480.08380.0755
Total sugar0.06390.06150.0875
Total acid0.05390.05090.0839
Vitamin C0.10090.10300.0691
Table 7. Comprehensive scoring ranking of indicators under saltwater drip irrigation with different salinities based on the TOPSIS method.
YearsTreatmentsDistance to the Ideal SolutionDistance to the Antideal SolutionComposite Score IndicesRank
2020CK0.3940.5050.5623
S10.2190.6490.7481
S20.3200.5000.6102
S30.3960.3930.4984
S40.5340.2820.3465
S50.6690.2860.3006
2021CK0.1940.1560.4453
S10.0940.2700.7421
S20.1510.1610.5152
S30.2090.1020.3284
S40.2720.1130.2945
S50.2450.0710.2246
2022CK0.0100.2730.9641
S10.0240.2640.9182
S20.0870.1980.6943
S30.1490.1330.4714
S40.2070.0750.2665
S50.2790.0640.1596
Disclaimer/Publisher’s Note: The statements, opinions and data contained in all publications are solely those of the individual author(s) and contributor(s) and not of MDPI and/or the editor(s). MDPI and/or the editor(s) disclaim responsibility for any injury to people or property resulting from any ideas, methods, instructions or products referred to in the content.