Article

YOLOv8n-FDE: An Efficient and Lightweight Model for Tomato Maturity Detection

by
Xin Gao
,
Jieyuan Ding
*,†,
Mengxuan Bie
,
Hao Yu
,
Yang Shen
,
Ruihong Zhang
and
Xiaobo Xi
*
School of Mechanical Engineering, Yangzhou University, Yangzhou 225127, China
*
Authors to whom correspondence should be addressed.
These authors contributed equally to this work.
Agronomy 2025, 15(8), 1899; https://doi.org/10.3390/agronomy15081899
Submission received: 14 July 2025 / Revised: 1 August 2025 / Accepted: 6 August 2025 / Published: 7 August 2025
(This article belongs to the Section Precision and Digital Agriculture)

Abstract

To address the challenges of tomato maturity detection in natural environments—such as interference from complex backgrounds and the difficulty in distinguishing adjacent fruits with similar maturity levels—this study proposes a lightweight tomato maturity detection model, YOLOv8n-FDE. Four maturity stages are defined: mature, turning-mature, color-changing, and immature. The model incorporates a newly designed C3-FNet feature extraction and fusion module to enhance target feature representation, and integrates the DySample operator to improve adaptability under complex conditions. Furthermore, the detection head is optimized as the parameter-sharing lightweight detection head (PSLD), which boosts the accuracy of multi-scale tomato fruit feature prediction and precisely focuses on tomato color characteristics. A novel PIoUv2 loss function is also introduced to further improve localization performance and accelerate convergence. Experimental results demonstrate that the improved YOLOv8n-FDE model achieves a parameter count of 1.56 × 10⁶, computational complexity of 4.5 GFLOPs, and a model size of 3.20 MB. The model attains an mAP@0.5 of 97.6%, representing reductions of 46%, 21%, and 60% in parameter count, computation, and size, respectively, compared to YOLOv8n, with a 1.8 percentage point increase in mAP@0.5. This study significantly reduces model complexity and improves the accuracy of tomato maturity detection, providing a more robust data foundation for subsequent orchard yield prediction.

1. Introduction

Tomato (Solanum lycopersicum), as one of the world’s most important economic crops, requires precise maturity assessment to determine optimal harvest timing, facilitate quality grading and market circulation, and directly impact the economic efficiency and resource allocation across the entire industrial chain [1,2]. With the rapid advancement of protected agriculture and intelligent agricultural machinery, automatic detection and maturity identification of tomato fruits have become crucial technologies for intelligent harvesting, yield estimation, and precision management. These technologies are essential for reducing labor costs, improving harvest efficiency, and ensuring fruit quality [3]. Traditional tomato recognition methods mostly rely on hand-crafted features—such as color, shape, and texture—combined with classical machine learning algorithms. However, their performance is significantly affected by variations in illumination, fruit occlusion, and complex backgrounds, making it difficult to achieve high accuracy and real-time performance in practical, complex scenarios [4,5]. In recent years, driven by the rapid development of deep learning and computer vision, convolutional neural networks (CNNs) and mainstream object detection algorithms such as YOLO and Mask R-CNN have been widely applied in automatic tomato detection and maturity grading, resulting in remarkable progress.
Recent studies have focused on improving the accuracy, speed, and adaptability of tomato detection and grading. Malik M.H. et al. [3] employed an improved HSV color space and watershed algorithm to achieve automatic recognition and segmentation of ripe tomatoes, effectively coping with uneven lighting and complex backgrounds, with high detection accuracy suitable for robotic harvesting guidance. Gu Z. et al. [4] designed MDC, FFD, and AFU modules based on an improved RTDETR model for rapid detection and automated phenotypic trait measurement of tomato fruits under complex canopies, enabling high-precision, non-destructive fruit measurement and grading. Chen W. et al. [6] proposed the MTD-YOLOv7 multitask learning model, which synchronously detects tomato fruits, fruit clusters, and their maturity levels by adding decoders and custom loss functions, achieving extremely high detection speed and robustness for automated inspection tasks. Wu Q. et al. [7] introduced the YOLO-PGC algorithm, which integrates dynamic weighting, global context, and multimodal feature fusion modules to achieve high-precision maturity detection of tomatoes in complex scenarios, with both real-time performance and robustness. Qin J. et al. [8] proposed the YOLO-CT method that combines SA attention with a high-resolution prediction head, significantly improving the detection and localization of small tomatoes and picking points in challenging environments. Ayyad S.M. et al. [9] combined particle swarm optimization (PSO) with YOLOv8 to achieve multi-class recognition of tomato maturity, rot, and diseases, enhancing hyperparameter optimization and robustness across environments, with an mAP of 0.89, making it suitable for automatic grading and picking scenarios. Lawal M.O. et al. [10] presented the improved YOLOv3 (YOLO-Tomato) model, incorporating spatial pyramid pooling and the Mish activation function, resulting in substantial accuracy improvements in complex environments, with a best AP of 99.5%, outperforming several mainstream methods. Gao X. et al. [11] proposed the YOLOv8n-CA model with a newly designed C2f-FN structure, incorporating coordinate attention and CARAFE upsampling to significantly improve detection accuracy for four-stage tomato maturity in natural environments, achieving an mAP of 97.3%. Appe S.N. et al. [12] developed CAM-YOLO, which integrates the CBAM attention mechanism and DIoU loss into YOLOv5, markedly improving the detection of overlapping and small tomatoes, with a mean average precision of 88.1%, suitable for complex field environments. Vo H. T. et al. [13] integrated artificial intelligence and image analysis techniques in YOLOv9 to achieve tomato maturity classification and implement related technological functions for tomatoes. Gao G.H. et al. [14] improved YOLOv5s by integrating CBAM attention and Soft-NMS, enhancing the accuracy and robustness of tomato recognition for picking robots in continuous working environments, with mAP increased to 92.75%. Cardellicchio A. et al. [15] designed a YOLOv5-based model to detect the phenotypic characteristics of tomatoes. This model achieved high detection accuracy on complex datasets characterized by small object sizes, high similarity, and similar colors. Tenorio G. L. et al. [16] proposed a neural network model employing MobileNetV1 as the feature extractor and selecting appropriate anchor points, enabling accurate detection and assessment of tomato maturity. Zu L. et al. [17] achieved detection and segmentation of mature green tomatoes in greenhouses using a Mask R-CNN-based method combined with an autonomous image acquisition mobile robot, achieving an F1 score of 92% in challenging scenes with occlusion and overlap, suitable for robotic harvesting. Afonso M. et al. [18] applied Mask R-CNN for greenhouse tomato detection and counting, enabling pixel-level segmentation of overlapping and occluded fruits and improving robustness and accuracy in complex environments.
Moreover, numerous studies have been optimized for lightweight models and deployment on mobile devices. For example, Wang A. et al. [1] developed the lightweight YOLO11n network combined with region tracking for efficient detection and yield estimation, meeting the real-time requirements of edge devices. Wang Q. et al. [19] proposed SWMD-YOLO, integrating SAConv, WTConv, and MSCA modules to enhance multi-scale detection. Hao F.Q. et al. [20] introduced the GSBF-YOLO lightweight model with GSim and C3Ghost modules and a BiFPN structure, achieving significant reductions in parameters and computational load while increasing mAP by 1.9%, enabling real-time maturity detection in natural environments. Koirala A. et al. [21] developed the efficient Mango YOLO model, which outperformed mainstream detectors such as Faster R-CNN, YOLOv2, and SSD in both detection accuracy and speed. This model meets the real-time and deployment requirements of practical orchard applications, providing a powerful tool for fruit yield estimation and intelligent harvesting. Parico A. I. B. et al. [22] proposed a real-time pear detection and counting system based on YOLOv4 and Deep SORT, thoroughly investigating the balance between detection accuracy, inference speed, and computational cost. Experimental results demonstrated excellent performance in terms of both accuracy and real-time capability, and the integration of object tracking enabled efficient fruit counting on mobile devices.
Current challenges mainly include a difficulty in detecting target tomatoes and multiple maturity stages under complex conditions (such as lighting changes, occlusion, and dense fruit distribution); performance bottlenecks for lightweight models and edge deployment, as traditional high-accuracy models are often too large for real-time inference; and higher requirements for model speed and stability in practical picking, automatic grading, and mobile device applications [23]. Therefore, increasing attention is being paid to structural innovations, incorporation of attention mechanisms, loss function optimization, multi-source fusion, and transfer learning, continually advancing the practical and intelligent development of tomato recognition, segmentation, and maturity grading.
In this study, YOLOv8 is selected as the baseline model to perform tomato maturity grading, dividing tomatoes into four categories: mature, turning-mature, color-changing, and immature. Based on YOLOv8n, a novel C3-FNet module is designed for feature extraction and fusion in the backbone and neck networks, achieving network lightweighting. The Dysample upsampling operator is adopted to enhance feature fusion and improve small-object detection capabilities. A new PSLD module is designed to share parameters through structural sharing, maintaining the lightweight property of the model. Finally, the PIoUv2 loss function is introduced, and the influence of its hyperparameters on model performance is experimentally analyzed, leading to further improvements in detection performance.
The specific contributions of this study are as follows:
(1)
A novel feature extraction module C3-FNet and a PSLD head were designed to achieve model lightweighting while improving detection accuracy;
(2)
The PIoUv2 loss function was introduced, and the optimal hyperparameter values were determined experimentally according to different research datasets;
(3)
The detection performance of the model was verified by analyzing its effectiveness in specific scenarios such as similar maturity, small distant objects, fruit stacking, and high-brightness conditions;
(4)
Compared to the baseline, the improved model reduced the number of parameters, computational complexity, and model size by 46%, 21%, and 60%, respectively, while improving detection performance by 1.8 percentage points, achieving a balance between lightweight design and detection accuracy.

2. Materials and Methods

2.1. Image Acquisition

The tomato image data for this study were collected from the Jiangwang Town Fruit and Vegetable Planting Demonstration Park in Yangzhou City, Jiangsu Province, using a Xiaomi 13 smartphone (Xiaomi Corporation, Beijing, China). The images have a size of 8192 × 6144 pixels and a resolution of 72 dpi. The maturity of tomatoes in this study was primarily determined based on fruit color, as shown in Figure 1. In the immature stage, the fruit skin appears whitish green, with green gradually dominating as the white color fades; tomatoes in this stage are unsuitable for harvest. When the fruit begins to show an orange hue—characterized by the lower half of the skin turning orange and the upper half remaining green, indicating a transition from green to orange—this is defined as the color-changing stage, during which the fruit can be harvested for postharvest ripening. As the skin turns predominantly light red, with some residual green, the tomato is considered in the turning-mature stage, suitable for short-distance transport and sales after harvest. In the mature stage, the fruit skin turns completely red, with no other colors present, and is suitable for immediate transport to local markets after harvest. Therefore, tomato maturity levels in this study are classified into four categories: mature, turning-mature, color-changing, and immature.

2.2. Dataset Construction

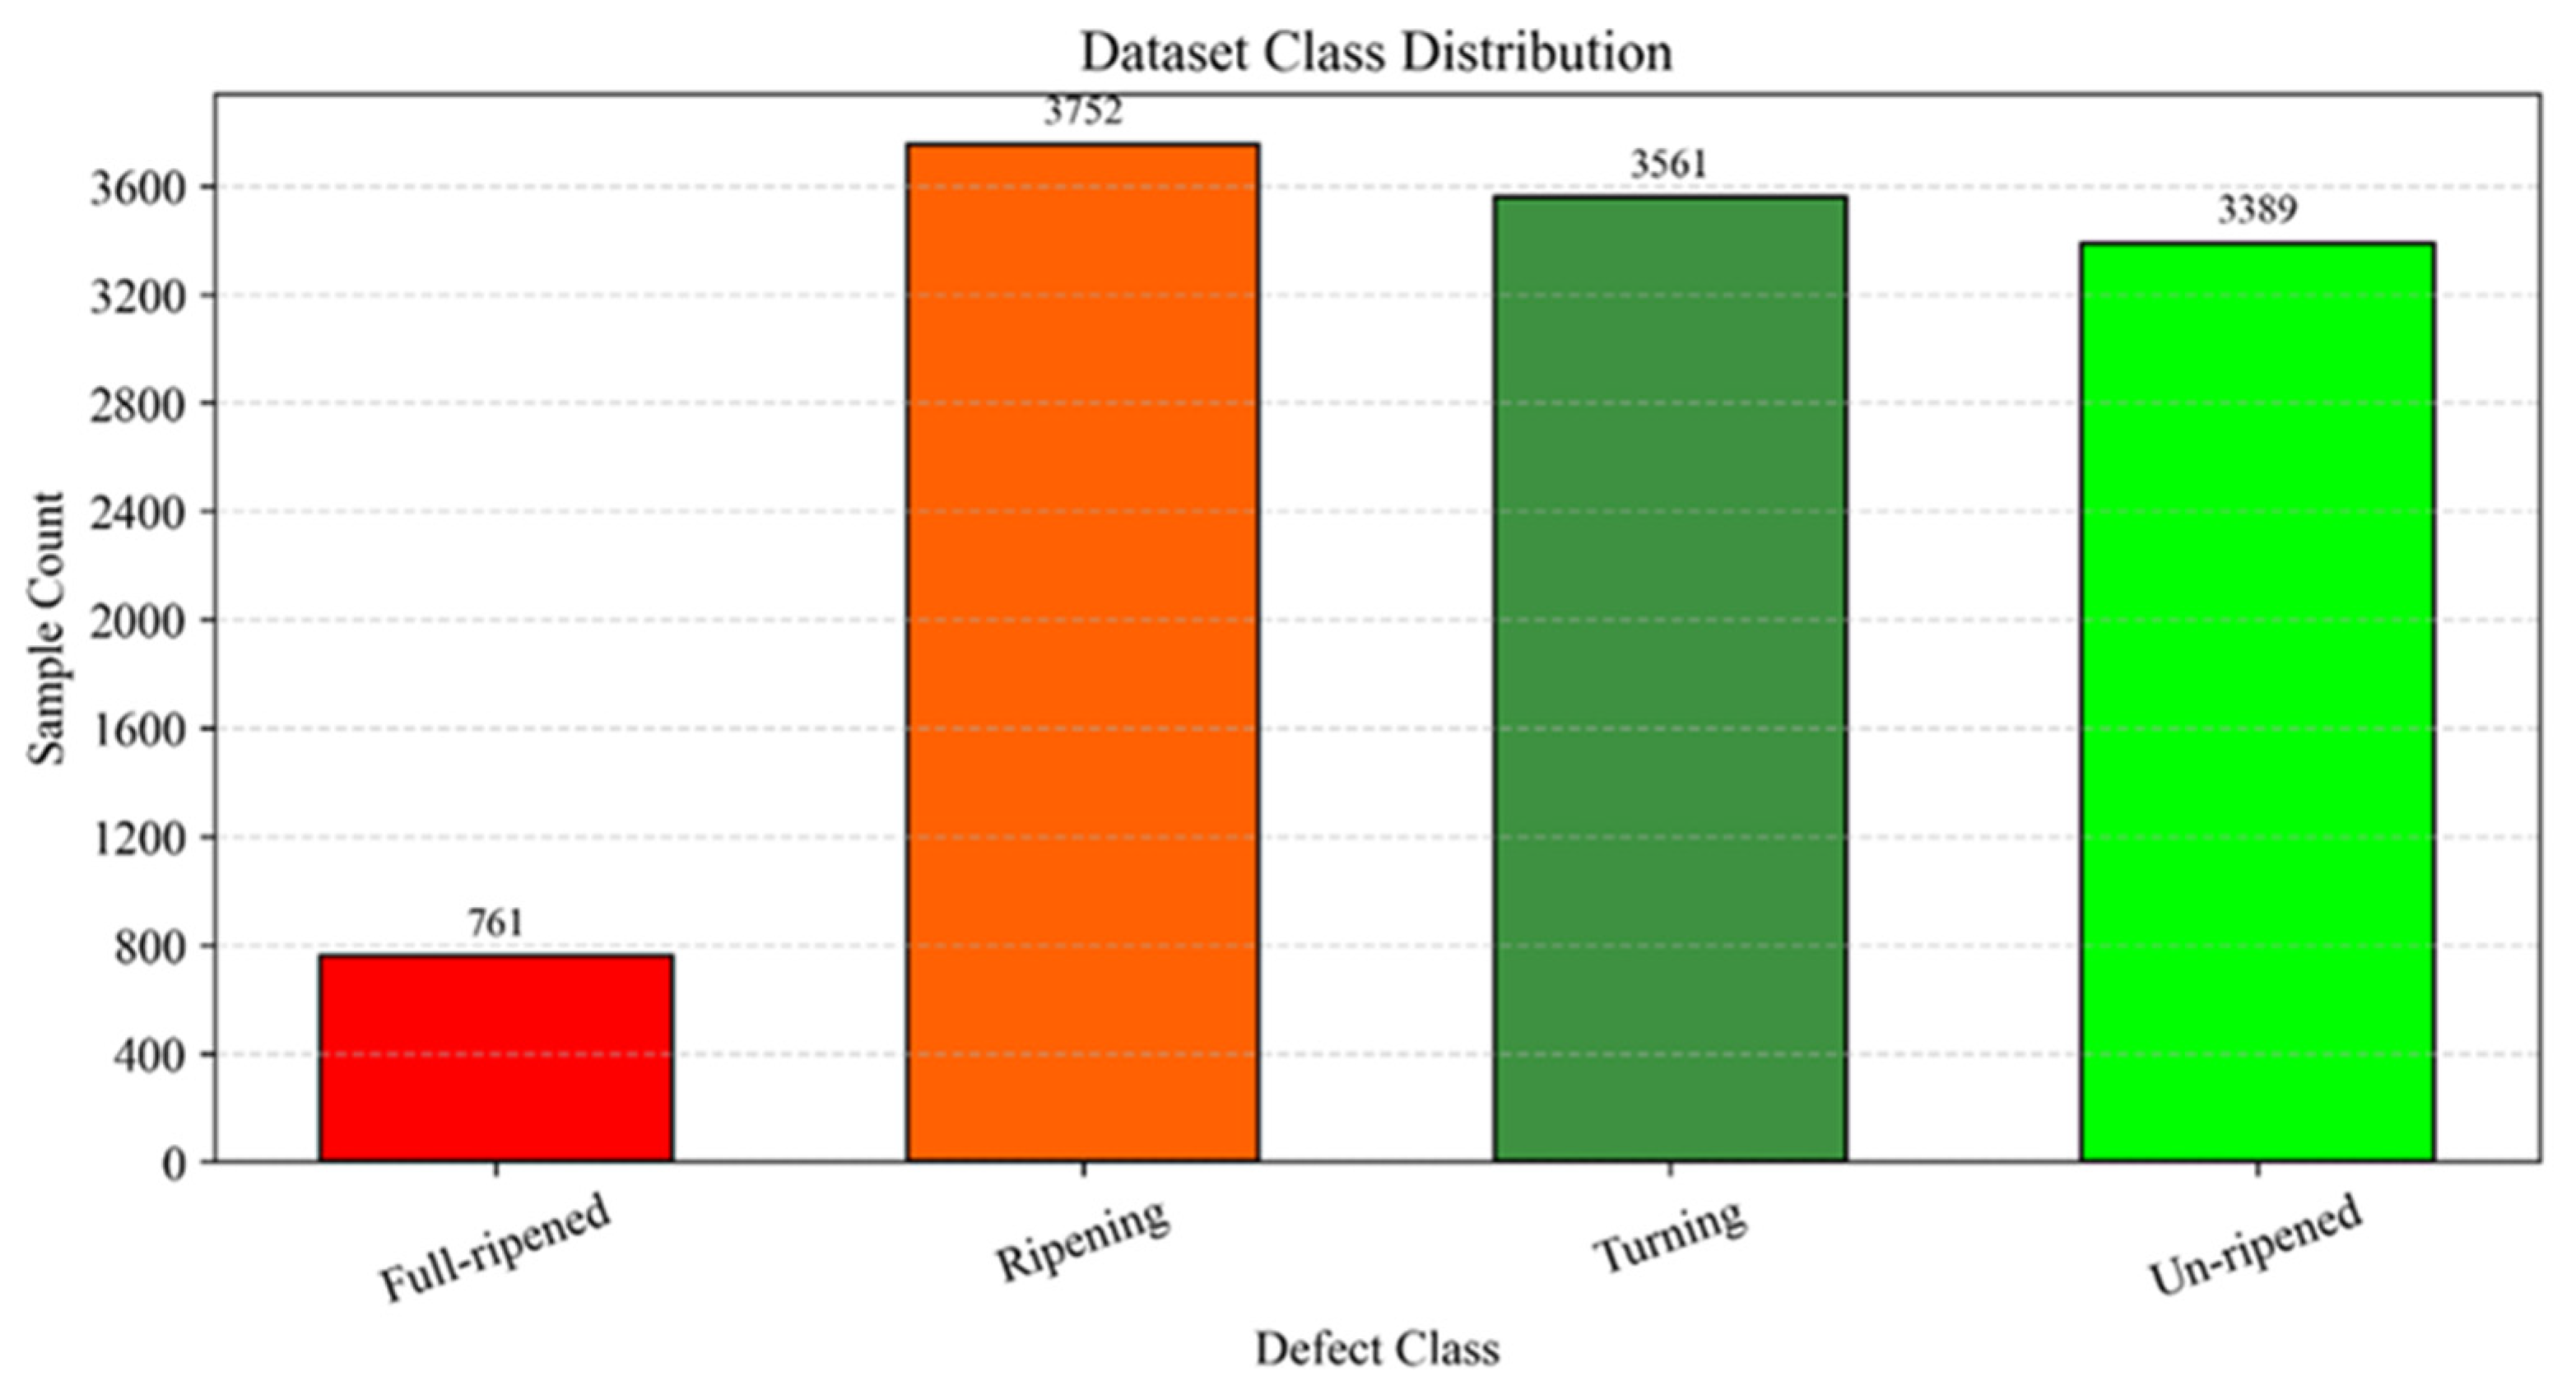
The environmental conditions of the tomatoes in the collected images included natural lighting, fruit stacking, occlusion by branches and leaves, and the coexistence of multiple maturity stages. A total of 1432 tomato images were collected. To increase the diversity of training samples, random image scaling and rotation, mirroring, contrast and brightness adjustment, and the addition of noise with various ranges and sizes were applied, as illustrated in Figure 2. Specific augmentation parameters included random rotation (with rotation angles ranging from ±15°), scaling transformation (scaling factors between 0.8 and 1.2), brightness and contrast adjustment (brightness factors from 0.7 to 1.3 and contrast factors from 0.8 to 1.2), and the addition of Gaussian noise (with noise variance set to 0.01). Each training image underwent four rounds of augmentation, with augmentation methods applied randomly to ensure the diversity of augmented samples. In addition, all augmentation operations were performed while synchronously adjusting the original image label information to maintain data consistency and validity. After augmentation, the final dataset contained 5728 images, with a total of 11,463 annotated tomatoes, including 761 mature, 3752 turning-mature, 3561 color-changing, and 3389 immature tomatoes, as illustrated in Figure 3. The dataset was divided into training, validation, and test sets at a ratio of 8:1:1. Manual annotation of tomato images was performed using the “Make Sense” (https://www.makesense.ai/) image labeling tool. Make Sense is an online annotation platform that requires no deployment or environmental configuration, and the completed label information can be directly exported in the txt format required by YOLO models, making the process highly efficient and convenient. To ensure the accuracy and validity of annotations, tomatoes with more than two-thirds of their area occluded were not annotated.
In the dataset used in this study, there is an imbalance in the number of tomato labels in different maturity stages, with the fewest labels corresponding to mature tomatoes. This distribution reflects real-world photographic scenarios, where images contain tomatoes in various maturity stages, representing natural growth conditions. In consideration of data authenticity, we retained this imbalanced distribution and avoided artificially altering class proportions by separately augmenting specific categories. In addition, immature tomatoes are more numerous in the dataset, and their features are easily confused with the background, making the model more prone to false detections or missed detections of immature tomatoes. As such, immature tomatoes can be regarded as the predominant class in this task.

2.3. Baseline Model Selection

In this study, the YOLO series was selected as the baseline object detection model. First, the YOLO family of models, with its end-to-end architecture, achieves high-efficiency and real-time performance in object detection tasks, significantly improving inference speed while maintaining detection accuracy. Secondly, the YOLO series has been continuously optimized through multiple iterations, demonstrating strong robustness and generalization in handling small object detection, complex background interference, and multi-scale objects. In addition, YOLO models are regularly updated, with new versions released each year, and their high flexibility facilitates deployment across diverse hardware platforms. As a result, YOLO has been widely applied in various fields such as industry, agriculture, and transportation, offering promising prospects and valuable reference for practical applications.
YOLOv5s, YOLOv7, YOLOv8n, YOLOv10n, and YOLO11n from the YOLO series were selected for training and comparative analysis. The experimental parameters were set as follows: input image size of 640 × 640, 300 training epochs, batch size of 8, learning rate of 0.001, cyclic learning rate of 0.001, and an IoU threshold of 0.5 for detection. Mosaic data augmentation provided by the model was disabled. To ensure fair comparison, the same dataset was used for all models, and training was conducted with identical epochs and batch size, with Mosaic augmentation uniformly disabled. All other parameters were set to their default values. As shown in Figure 4, all models exhibited convergence after approximately 200 epochs, with their mAP trends stabilizing after 300 epochs, although minor declines in performance were observed in the later stages. Among these models, YOLOv8n achieved slightly higher detection accuracy than the others, while also maintaining moderate model weights, parameter counts, and training times. This demonstrates its clear advantages in terms of lightweight design and detection efficiency. Therefore, YOLOv8n was chosen as the baseline model for further design and improvement in this study.

2.4. YOLOv8n-FDE Model

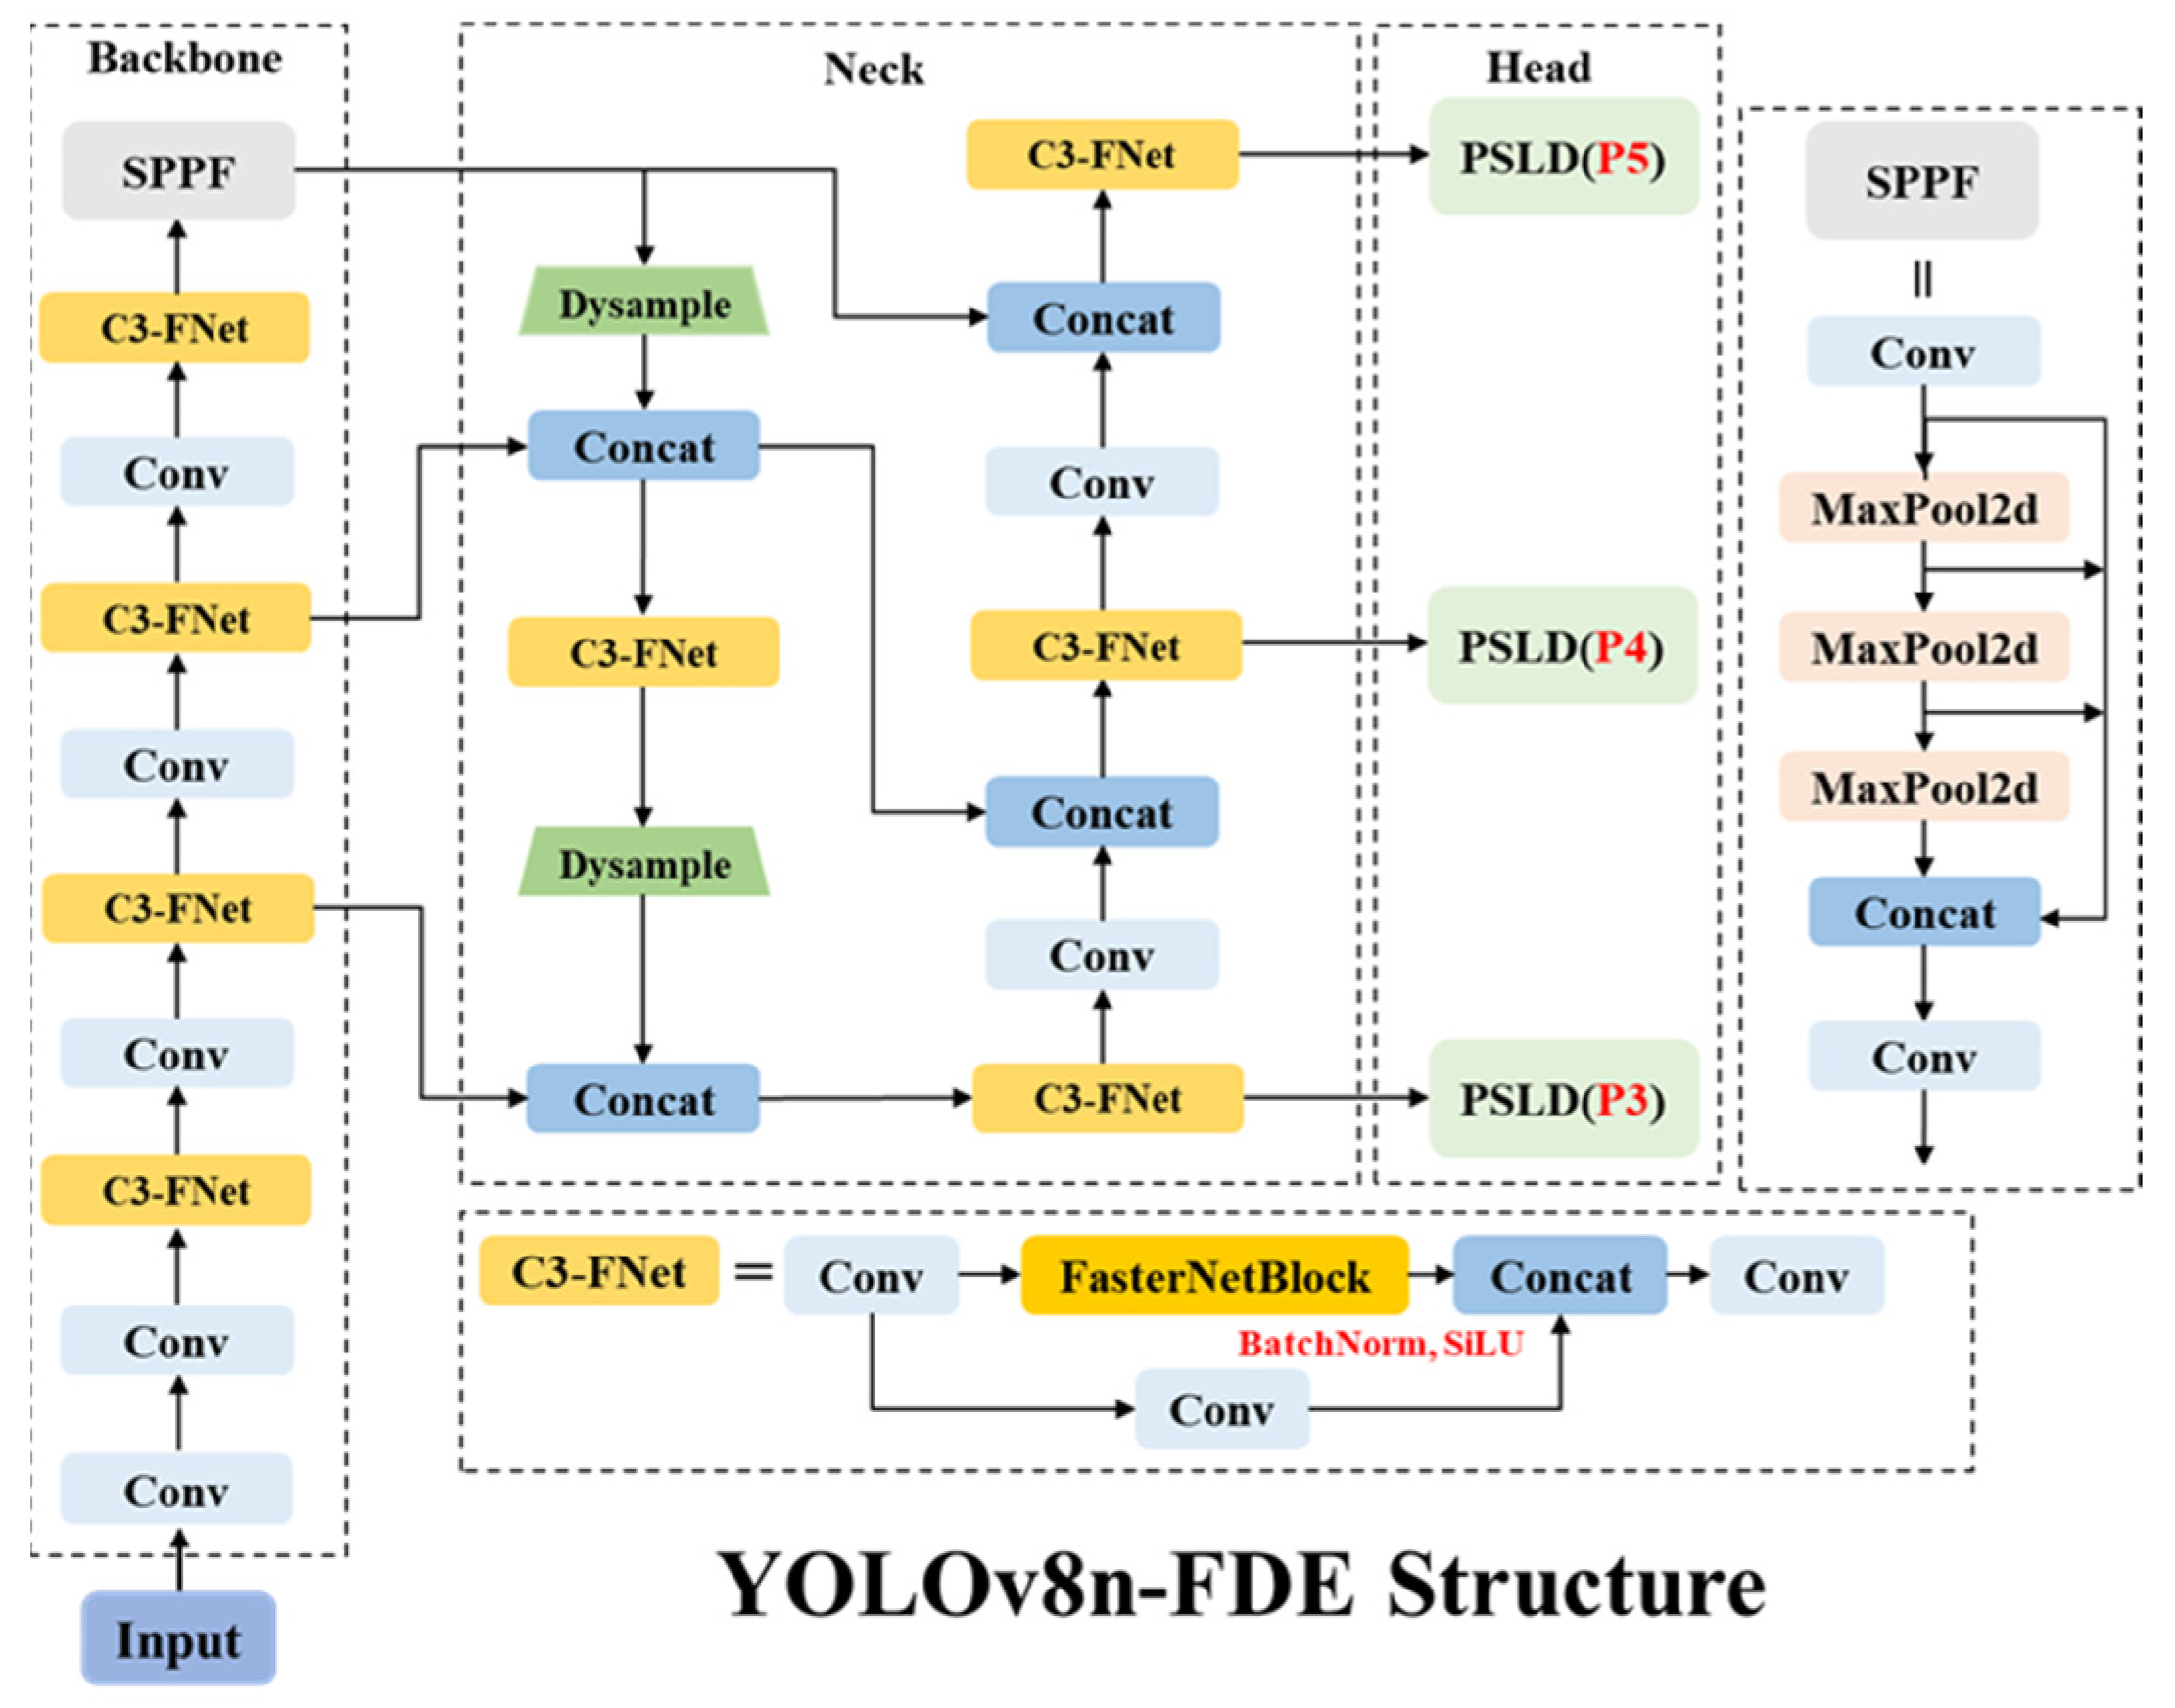
In this study, YOLOv8n was adopted as the baseline model, and improvements were made to its network architecture, resulting in the development of a lightweight tomato maturity detection model, YOLOv8n-FDE. A novel feature extraction and fusion module, C3-FNet, was designed and incorporated into both the backbone and neck feature fusion networks, enhancing the model’s capability to recognize tomato fruit features and thereby improving detection sensitivity and accuracy. Furthermore, the Dysample upsampling method was introduced, which generates sampling points through adaptive offsets, significantly improving feature reconstruction and spatial detail modeling. A new PSLD head was designed, integrating a feature-sharing convolutional structure that reduces the overall number of parameters while also enhancing spatial consistency and representational capacity across feature layers. Finally, the PIoUv2 loss function was employed to optimize the calculation of regression loss, and the impact of different values of the hyperparameter λ on model performance was analyzed to determine the optimal λ. The architecture of the improved tomato maturity detection model is illustrated in Figure 5.

2.4.1. C3-FNet Feature Extraction and Fusion Module

The tomatoes in this dataset were grown on non-standard farmland, characterized by cluttered environments, complex branches, and densely packed fruits. In addition, weather variations resulted in fluctuating lighting conditions, including low-light and overexposed scenarios, while certain images captured by the camera exhibited a degree of blurriness. The presence of these challenging conditions introduces both redundant features and noise, which can interfere with the model’s detection performance. Therefore, it is necessary to mitigate such disturbances to improve detection accuracy.
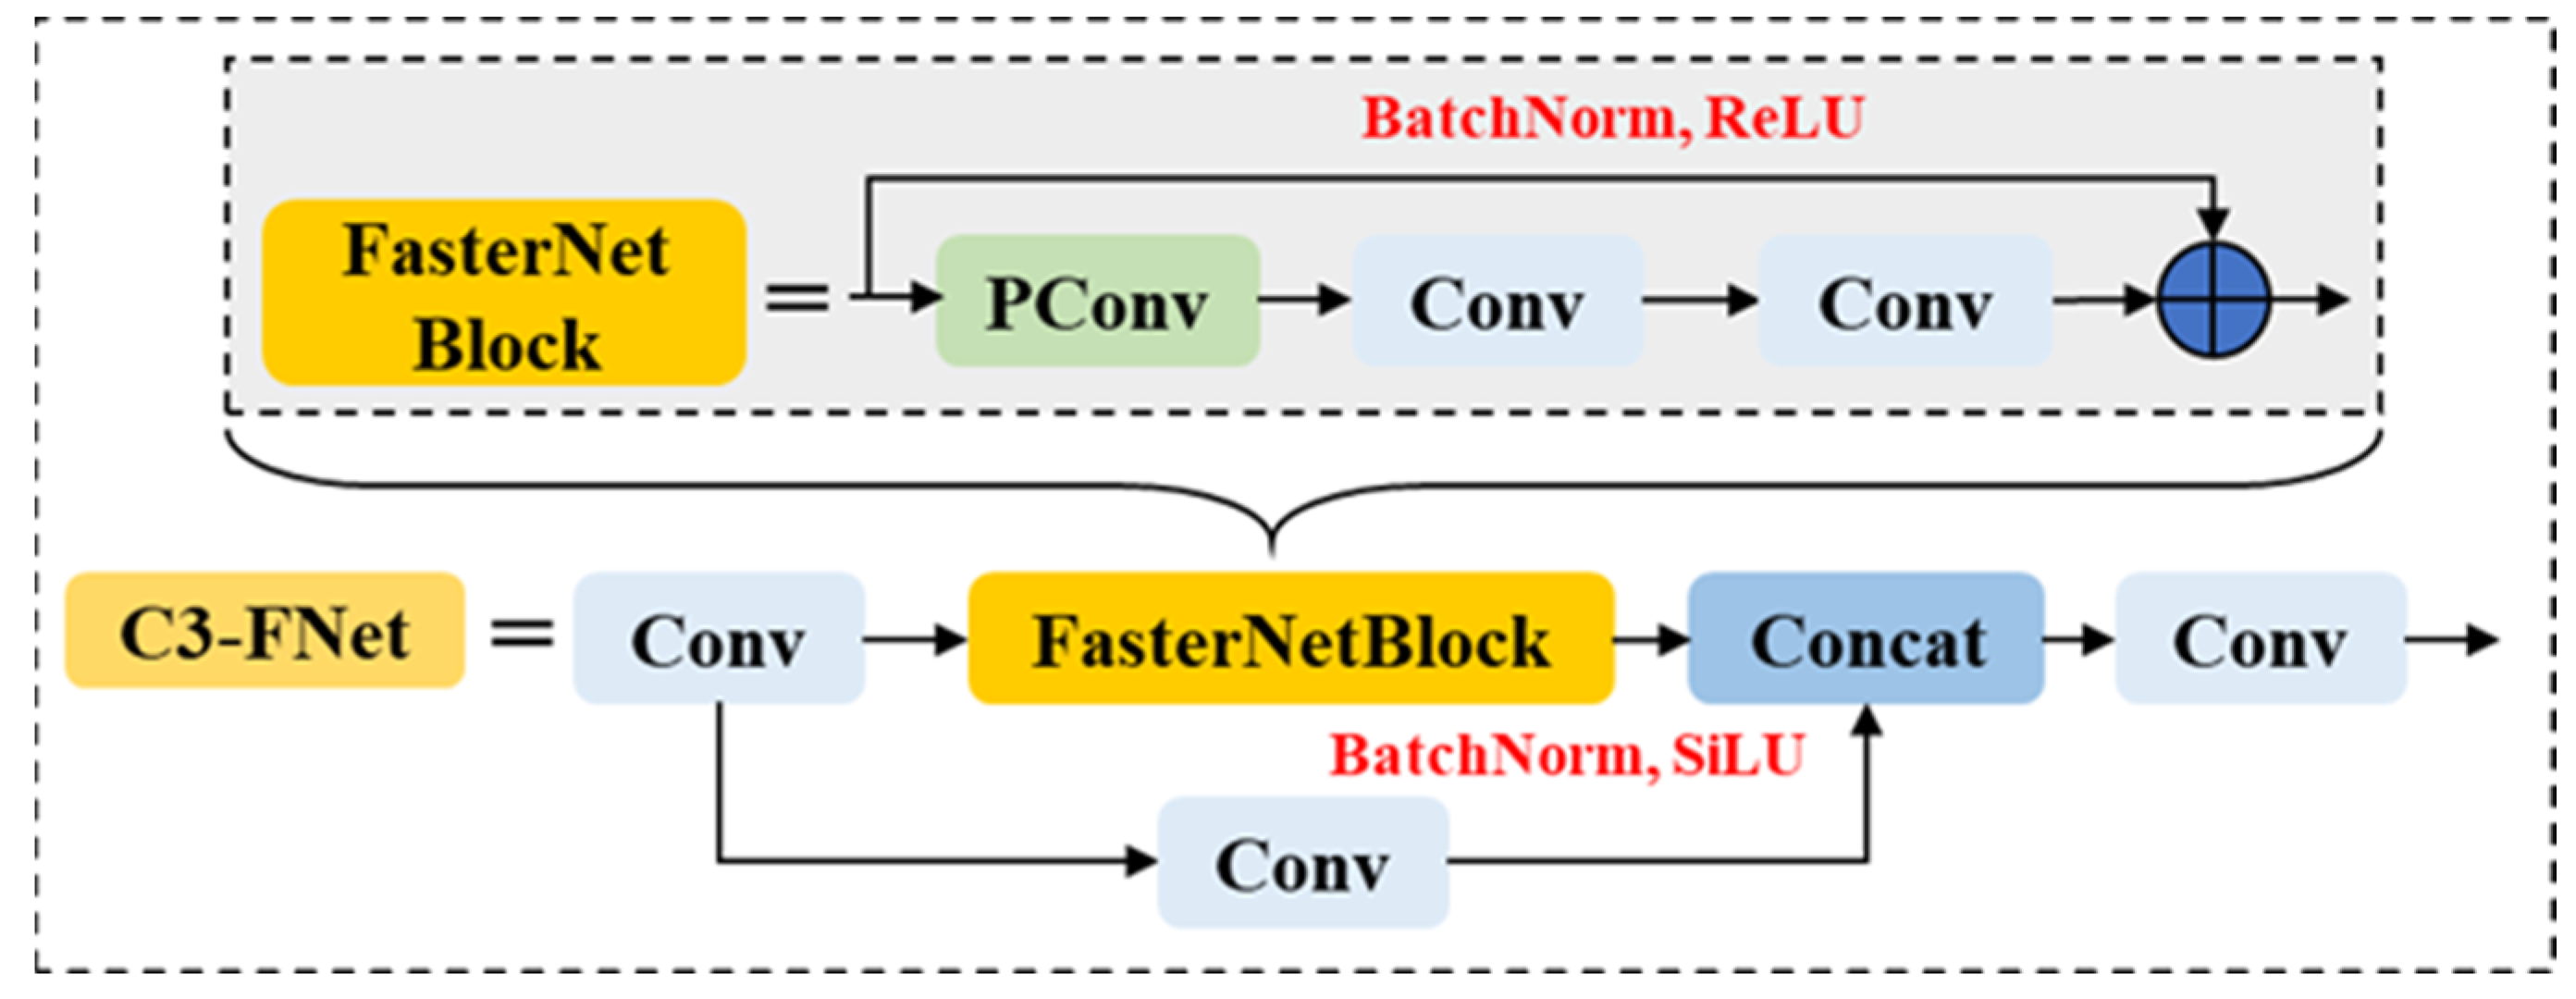
To address redundant information and meet the requirement for model lightweighting, a new feature extraction and fusion module, C3-FNet, was designed to reduce model complexity and enhance feature extraction precision. Structurally, the C3-FNet module integrates the advantages of the FasterNet Block [24] and the C3 module, balancing efficient feature extraction with lightweight model design. First, the input features are preliminarily processed using a standard convolution. The main branch introduces the FasterNet Block, which employs partial convolution (PConv): only a subset of channels undergoes 3 × 3 convolution, while the remaining channels remain unchanged. This approach significantly reduces computation and parameter count, while expanding the receptive field and enhancing the suppression of redundant information and noise. The main branch also includes standard convolution and residual connections, with each convolutional layer followed by BatchNorm and ReLU activation to improve feature representation and training stability. Meanwhile, the input is also passed through a 1 × 1 convolution to form a residual branch, preserving the original information. The outputs from the two branches are finally concatenated along the channel dimension, followed by an additional convolution, BatchNorm, and SiLU activation to complete information mixing and dimensionality reduction. The structure is illustrated in Figure 6.
Compared with the C2f module, C3-FNet is not only more efficient in structural design, but also significantly reduces redundant computations through the use of PConv. Furthermore, it enhances multi-branch fusion and gradient flow, effectively alleviating the gradient vanishing problem and accelerating convergence while improving detection accuracy. Overall, C3-FNet can extract key features more effectively in complex scenarios, achieving superior detection performance while maintaining low computational complexity.

2.4.2. Dysample Upsampling

In the task of tomato maturity detection, the upsampling module plays a crucial role in restoring boundary details and object shapes from low-resolution feature maps. In YOLOv8, the feature fusion network utilizes nearest-neighbor interpolation for upsampling, which relies solely on pixel positions and ignores the semantic information of the feature maps. This limitation restricts the model’s ability to capture object details in complex scenes, making it particularly challenging to distinguish immature tomatoes from branches and leaves. Common upsampling methods such as CARAFE [25] enhance feature modeling capability through dynamic kernel generation, but their reliance on dynamic convolution and additional subnetworks leads to increased computational cost and a large number of parameters, which negatively impacts detection speed. In this study, a lightweight dynamic point sampling-based upsampling module, Dysample [26], was introduced to replace the nearest-neighbor interpolation algorithm. The structure of this module is illustrated in Figure 7.
Dysample generates spatial offsets adaptively through its network, utilizing a pixel rearrangement and grouped sampling mechanism to fully accommodate multi-scale and diverse input features. This enables non-uniform, differentiable resampling of the input features. Without increasing the number of parameters or computational complexity, this method enhances the retention of detail information and improves the model’s ability to distinguish between similar objects such as branches and immature tomato fruits.
Specifically, Dysample takes the input low-resolution feature map X ∈ RH×W×C as the starting point. First, a linear transformation layer (Linear1) is used to generate a dynamic range adjustment factor δ, whose value is constrained within [0, 0.5] to control the sampling range. Subsequently, another linear transformation layer (Linear2) is employed to generate the initial offset Oinit ∈ RH×W×2S2. By combining the dynamic adjustment factor δ with the initial offset Oinit, the dynamic offset Odyn is generated as shown in Equation (1):
O d y n   =   O i n t · δ
The dynamic offset Odyn is then added to the fixed grid position G to generate the dynamic sampler RH×W×2S2, which defines the new two-dimensional coordinates for all sampling points:
S     =     G + O d y n
The dynamic sampler enables adaptive adjustment of the sampling point distribution, allowing it to more accurately cover the semantic features of target regions. Based on the sampler S, the grid sampling operation is applied to the input feature map X to reorganize features and generate the high-resolution feature map X’ ∈ RSH×SW×C:
X   =   g r i d s a m p l e ( X , S )
This dynamic sampling mechanism adjusts the positions of sampling points dynamically, making the feature map reorganization process more efficient. Compared with nearest-neighbor interpolation, it avoids applying fixed rules to all pixels, resulting in improved feature reconstruction and detail preservation.

2.4.3. Parameter-Sharing Lightweight Detection (PSLD) Head

To further enhance the lightweight and multi-scale adaptability of the detection head, this study designs a Parameter-Sharing Lightweight Detection (PSLD) head. As illustrated in Figure 8, PSLD adopts a shared convolutional structure, differing from the fully independent branch design of the YOLOv8 detection head. In YOLOv8, the decoupled detection head introduces two 3 × 3 convolutions and one 1 × 1 convolution in both the classification and regression branches, which effectively boosts detection performance but also significantly increases the number of parameters and computational complexity. This is less suitable for edge devices and small-batch training scenarios.
Structurally, the PSLD module uses a single backbone convolutional layer whose parameters are shared between the classification and regression branches, greatly reducing redundant weights. To further improve stability, PSLD replaces the conventional BatchNorm (BN) normalization layers with GroupNorm (GN) layers. GN [27,28] normalizes by grouping feature channels, thus avoiding the performance degradation caused by unstable statistics in BN during small-batch training and ensuring robustness across different batch sizes. In addition, to accommodate the scale differences targeted by different branches, a scale layer is introduced in the regression branch to adaptively rescale output features, thereby enhancing the model’s ability to localize targets of varying sizes and better adapt to tomatoes of different scales. The outputs of the classification and regression branches are then passed through fully connected layers or convolutional layers to generate the final predictions.
The use of shared weight parameters effectively reduces the number of parameters and computational complexity of the model, thereby improving detection efficiency. At the same time, this design enables the handling of multi-scale features and facilitates the capture of information at various scales within the image, helping the model to more accurately understand spatial relationships among objects and enhancing recognition accuracy. Applying the PSLD head in tomato maturity image detection not only accelerates inference speed but also enhances the adaptability of the model.

2.4.4. PIoUv2 Loss Function

The YOLOv8 model by default employs the CIoU regression loss function. This conventional object detection loss function relies on aggregated regression metrics for bounding boxes and does not consider the directional mismatch between the predicted and ground truth boxes, resulting in slower convergence and lower efficiency. The complex growth environment of tomatoes—where fruits are frequently occluded by branches, leaves, or other fruits—further complicates maturity recognition. To address sample imbalance, enhance model generalization, improve accuracy, and optimize adaptability to specific tasks, this study introduces a novel bounding box loss function, PIoUv2, into the improved model. The PIoU (Powerful-IoU) [29] loss function integrates a target size-adaptive penalty factor and a gradient adjustment function based on the quality of the detection box, guiding the predicted boxes to regress along more effective paths. As a result, PIoU achieves faster convergence than existing IoU-based loss functions. The formulation of the PIoU loss is as follows:
P = ( d w 1 w g t + d w 2 w g t + d h 1 h g t + d h 2 h g t ) / 4
f x   =   1         e x 2
P I o U   =   I o U     f P ,     1     P I o U     1
L P I o U   =     1         P I o U   =   L I o U + f P ,   0     L P I o U     2
where P is a penalty factor adaptive to the target size, exhibiting adaptability to different object scales. Using P as a penalty factor in the loss function prevents the predicted bounding box from being excessively enlarged. Here, dw1, dw2, dh1, and dh2 represent the absolute distances between the corresponding edges of the predicted and ground truth boxes, while wgt and hgt denote the width and height of the ground truth box, respectively. The function f(x) is designed to adaptively adjust the gradient magnitude according to the quality of the predicted box. The structure of the PIoU loss is illustrated in Figure 9.
By incorporating a focusing mechanism and introducing a non-monotonic attention function in conjunction with PIoU, a new loss function, PIoUv2, is obtained. PIoUv2 enhances the model’s ability to focus on medium-quality bounding boxes. The specific formulation of PIoUv2 is as follows:
q     =     e     P , q ( 0,1 ]
u x   =   3 x · e     x 2
L P I o U v 2   =     u λ q · L P I o U   =     3 · λ q · e λ q 2 · L P I o U
where u(λq) represents the attention function, where q replaces the penalty factor P and measures the quality of the detection box, with a range of (0, 1]. The parameter λ is a hyperparameter controlling the behavior of the attention function, typically ranging from 1.1 to 1.7. The original PIoUv2 paper recommends setting λ to 1.3 or 1.5 for optimal performance; however, its value should be re-evaluated for different datasets. The non-monotonic attention function u(λq) enhances the ability of PIoU to focus on medium-quality bounding boxes. Notably, PIoUv2 requires only a single hyperparameter λ, simplifying the model tuning process.

3. Experimental Setup

3.1. Experimental Parameters and Evaluation Metrics

The specifications of the experimental platform are shown in Table 1.
The training parameters were set as follows: input image size of 640 × 640, 300 training epochs, batch size of 8, learning rate of 0.001, cyclic learning rate of 0.001, and an IoU threshold for detection set to 0.5. The built-in Mosaic data augmentation was disabled. For experimental fairness, all baseline models were trained under the same number of epochs and batch size, with Mosaic augmentation uniformly disabled and other parameters set to their default values.
The models were evaluated in terms of both detection accuracy and detection efficiency. The main evaluation metrics included the number of parameters, computational complexity, mean average precision (mAP), and model size.

3.2. Experimental Results and Analysis

3.2.1. Comparison of Upsampling Module Performance

To validate the effectiveness of Dysample upsampling on the dataset, a comparative experiment was conducted using CARAFE upsampling on the YOLOv8n baseline model. The experimental results are shown in Table 2. The results indicate that the model with DySample upsampling achieves a lower parameter count and computational complexity, with no significant increase in model size, and yields an improvement in mean average precision. In contrast, the model using CARAFE upsampling exhibits more redundant parameters and computations, a noticeable increase in model size, and a decline in mean average precision. Overall, the DySample upsampling method demonstrates superior lightweight characteristics and higher detection performance, making it more suitable for the tomato dataset used in this study.

3.2.2. Comparison of Detection Heads

To evaluate the effectiveness of the PSLD head on the dataset, a comparative experiment was conducted using the DyHead [30] detection head on the YOLOv8n baseline model. The experimental results are presented in Table 3. The results show that the model with the PSLD head achieves a lower parameter count, computational complexity, and model size, demonstrating significant lightweight characteristics, while also achieving a slight improvement in mean average precision. In contrast, the model incorporating the DyHead detection head enhances network detection capability through multiple attention mechanisms, resulting in a significant increase in model complexity without an improvement in detection accuracy. On this dataset, it does not exhibit good adaptability. Therefore, the PSLD head, with its lightweight design and strong detection performance, is more suitable for the tomato dataset used in this study.

3.2.3. Analysis of PIoUv2 Hyperparameter Settings

In this study, PIoUv2 was used as the loss function, which employs a hyperparameter λ to control the behavior of the attention function. The recommended range for λ is 1.1 to 1.7, and the original PIoUv2 paper suggests that default values of 1.3 or 1.5 yield notable results; however, the optimal value of λ should be re-evaluated for different datasets. Keeping all other improvements unchanged, comparative experiments were conducted with different values of λ. As shown in Table 4, setting λ = 1.7 produced the most significant improvement on the tomato dataset used in this study.

3.2.4. Ablation Experiments

To evaluate the effects of the PSLD head, Dysample upsampling module, C3-FNet feature extraction and fusion module, and PIoUv2 loss function on model performance, an ablation study was conducted by incrementally applying these improvements to the original YOLOv8n model. This study focuses on model lightweighting, and the ablation experiments were designed using a cumulative strategy. Feasibility analysis was first conducted on individual modules, followed by the incremental addition of modules for further experimentation. With each addition, the number of model parameters and computational complexity decreased progressively, while the mean average precision increased step by step, indicating the effectiveness of the ablation experiments. All experiments were performed using the custom tomato dataset, and the ablation results are presented in Table 5. The results indicate that the introduction of the PSLD head and C3-FNet module significantly reduces model complexity, with notable decreases in parameter count and computational cost, while also improving mean average precision; both modules are lightweight and contribute to the overall compactness of the model. Incorporating the Dysample upsampling module results in almost no increase in model complexity, yet substantially enhances mAP, primarily serving to ensure high detection performance. Subsequently, as two or three of the above modules are added, model complexity further decreases, with steady reductions in parameters and computation, and continuous improvements in mAP, leading to progressively enhanced detection performance. Finally, integrating all three modules together with the PIoUv2 loss function achieves further gains in detection performance while maintaining lightweight model characteristics. Overall, compared to the original YOLOv8n, the YOLOv8n-FDE model reduces the number of parameters by 49%, lowers computation by 46%, and increases mean average precision by 1.6 percentage points, demonstrating outstanding performance and a lightweight design for tomato maturity detection tasks.

3.2.5. Experimental Comparison of Different Models

The YOLOv8n-FDE model was compared on the test set with Faster R-CNN, EfficientDet, and other YOLO-based object detection models, including YOLOv5s, YOLOv7, YOLOv10n, and YOLO11n. The results are shown in Table 6. It can be observed that, for the tomato maturity detection and classification task, the YOLOv8n-FDE model achieves higher mean average precision and demonstrates superior lightweight characteristics compared to other single-stage algorithms. Specifically, compared to YOLOv8n, the mean average precision increased by 1.6 percentage points, the number of parameters was reduced by 49%, the computational cost was lowered by 46%, and the model size was reduced by 47%.
In this study, the detection performance of EfficientDet, Faster R-CNN, and other YOLO models was compared on the test set. The analysis revealed that in complex scenarios involving fruit overlap, branch occlusion, and small objects, the YOLOv8n-FDE model demonstrated clear advantages in detection accuracy. As illustrated in Figure 9, the comparison primarily highlights the performance of YOLOv8n-FDE against YOLOv8n, YOLOv10n, and YOLO11n. According to both the visual results and the data in Figure 10, EfficientDet—as a single-stage object detection algorithm—has a more complex structure than YOLO-based models in terms of parameter count and computational complexity. Its backbone feature extraction and BiFPN fusion are limited in expressing high-frequency information, making it difficult to distinguish subtle differences between immature tomatoes and leaves, resulting in poor detection of immature tomato fruits, and the detection efficiency of recent YOLO models does not show a clear advantage compared to other approaches in recent years.
The Faster R-CNN model employs a deep backbone for feature extraction, but repeated downsampling leads to lower spatial resolution, causing indistinct representations in deep feature maps. As a result, the backbone network may merge closely positioned fruits into a single target, leading to loss of boundary details, and adversely affecting classification and localization, which results in missed detections and duplicate bounding boxes. Its detection efficiency is also the lowest among all the compared models. The YOLOv5s model provides average detection results and is prone to false detections; it struggles to accurately locate tomato fruits when immature fruits overlap with branches and leaves. This is mainly because, in cases of severe overlap, the distinction between positive and negative samples during training becomes ambiguous, reducing the model’s discrimination capability. The YOLOv7 model, when detecting close or adjacent fruits, exhibits limited capability in expressing highly similar features in the fusion layers, which makes it difficult to capture subtle differences between fruits, leading to decreased discrimination of adjacent fruits and bounding boxes deviating from their targets. The detection efficiency of YOLOv5s and YOLOv7 is similar, and neither stands out. The YOLOv8n model’s feature extraction and representation capabilities are relatively weak for complex scenes involving occlusion, overlapping objects, and tomatoes in different maturity stages. As a result, it often fails to capture sufficiently discriminative features, resulting in missed detections, false positives, and inaccurate bounding box localization. The YOLOv10n model introduces a dynamic attention mechanism that can enhance the representation of specific target regions; however, in highly similar and densely populated backgrounds, the attention mechanism may focus on “misleading regions,” such as boundaries between fruits and branches or glare spots, without highlighting effective discriminative features, resulting in missed detections. The YOLO11n model utilizes denser anchor boxes or multi-scale detection heads, which often leads to multiple detections of the same object and inaccurate localization, particularly when adjacent tomatoes share similar maturity levels, causing duplicate and imprecise bounding boxes.
Starting from YOLOv8 and later versions, detection efficiency has improved significantly, demonstrating a notable advantage over both other detection models and previous generations of YOLO models. The YOLOv8n-FDE model further enhances detection efficiency compared to these models. And the YOLOv8n-FDE model achieves more precise detection of a greater number of tomato fruits, with bounding boxes accurately locating tomatoes of corresponding maturity. It can also identify small distant objects and distinguish the maturity of adjacent fruits, demonstrating strong performance in complex scenarios such as branch occlusion and fruit stacking. Moreover, compared with the baseline YOLOv8n model, YOLOv8n-FDE incorporates lightweight improvements, resulting in lower complexity and superior performance relative to other comparison models.

3.2.6. Comparison of Model Performance Before and After Improvement

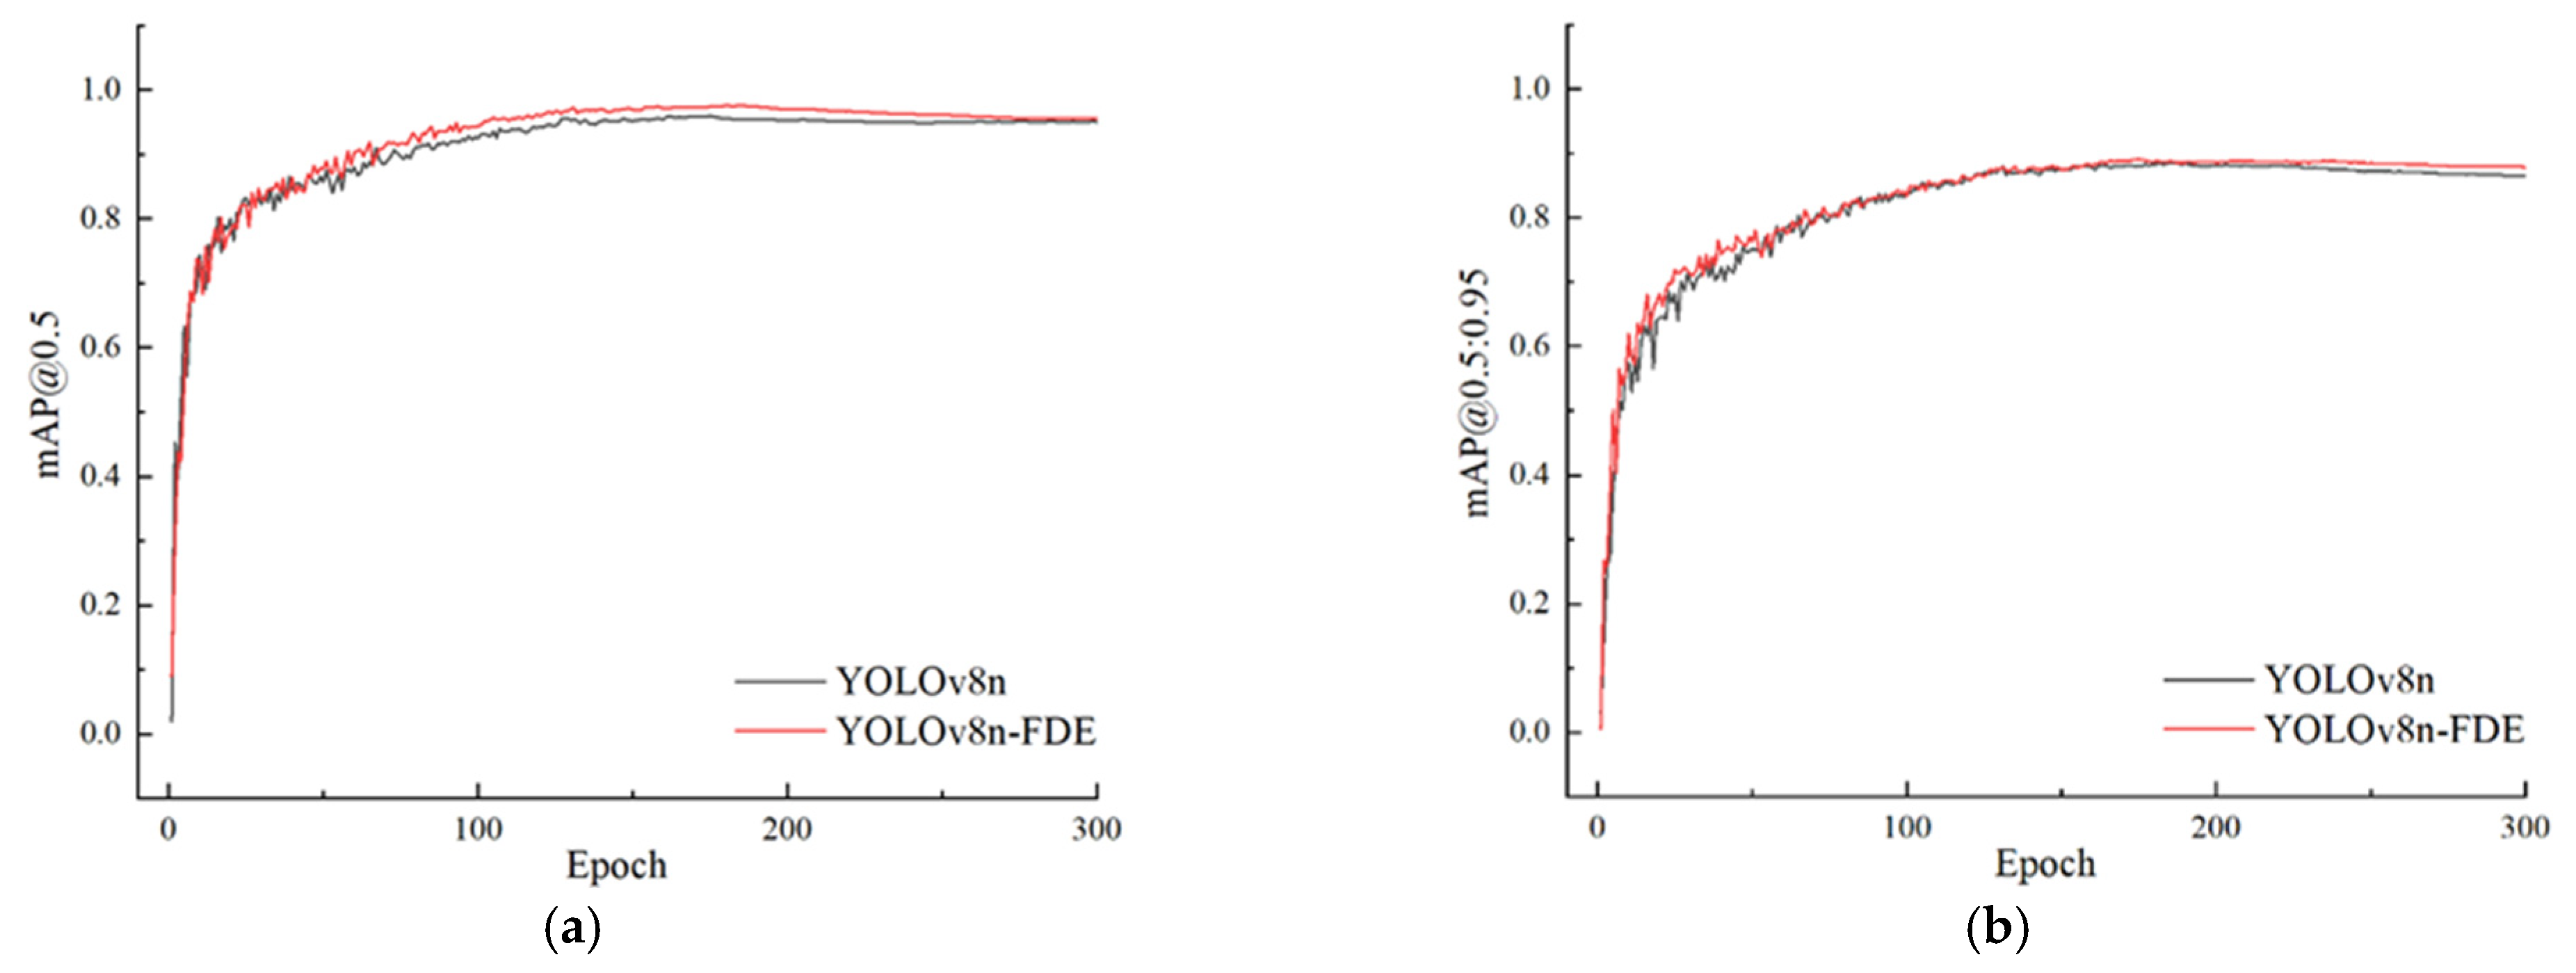
In this study, two levels of mean average precision were used to evaluate both the original and the improved models, as shown in Figure 11. Owing to its lightweight design, the proposed YOLOv8n-FDE model significantly reduces model complexity while consistently outperforming the original YOLOv8n model in terms of training performance. The mean average precision curves of the YOLOv8n-FDE model remain above those of the YOLOv8n model throughout the training process. These results demonstrate that the improvements made to the model yield superior detection performance on the custom dataset.
In this experiment, the training loss and validation loss curves exhibit highly consistent trends, both continuously decreasing and gradually stabilizing, as shown in Figure 12. This indicates that the model not only effectively fits the training data during the training process but also maintains good generalization performance on unseen validation data, with no signs of rebound or increase in the validation loss. This suggests that there is no significant overfitting in the current stage of training. The smooth convergence of the loss curves further demonstrates the stability of the training process and the appropriate adjustment of model parameters, which helps ensure the robustness and reliability of the model in practical applications.
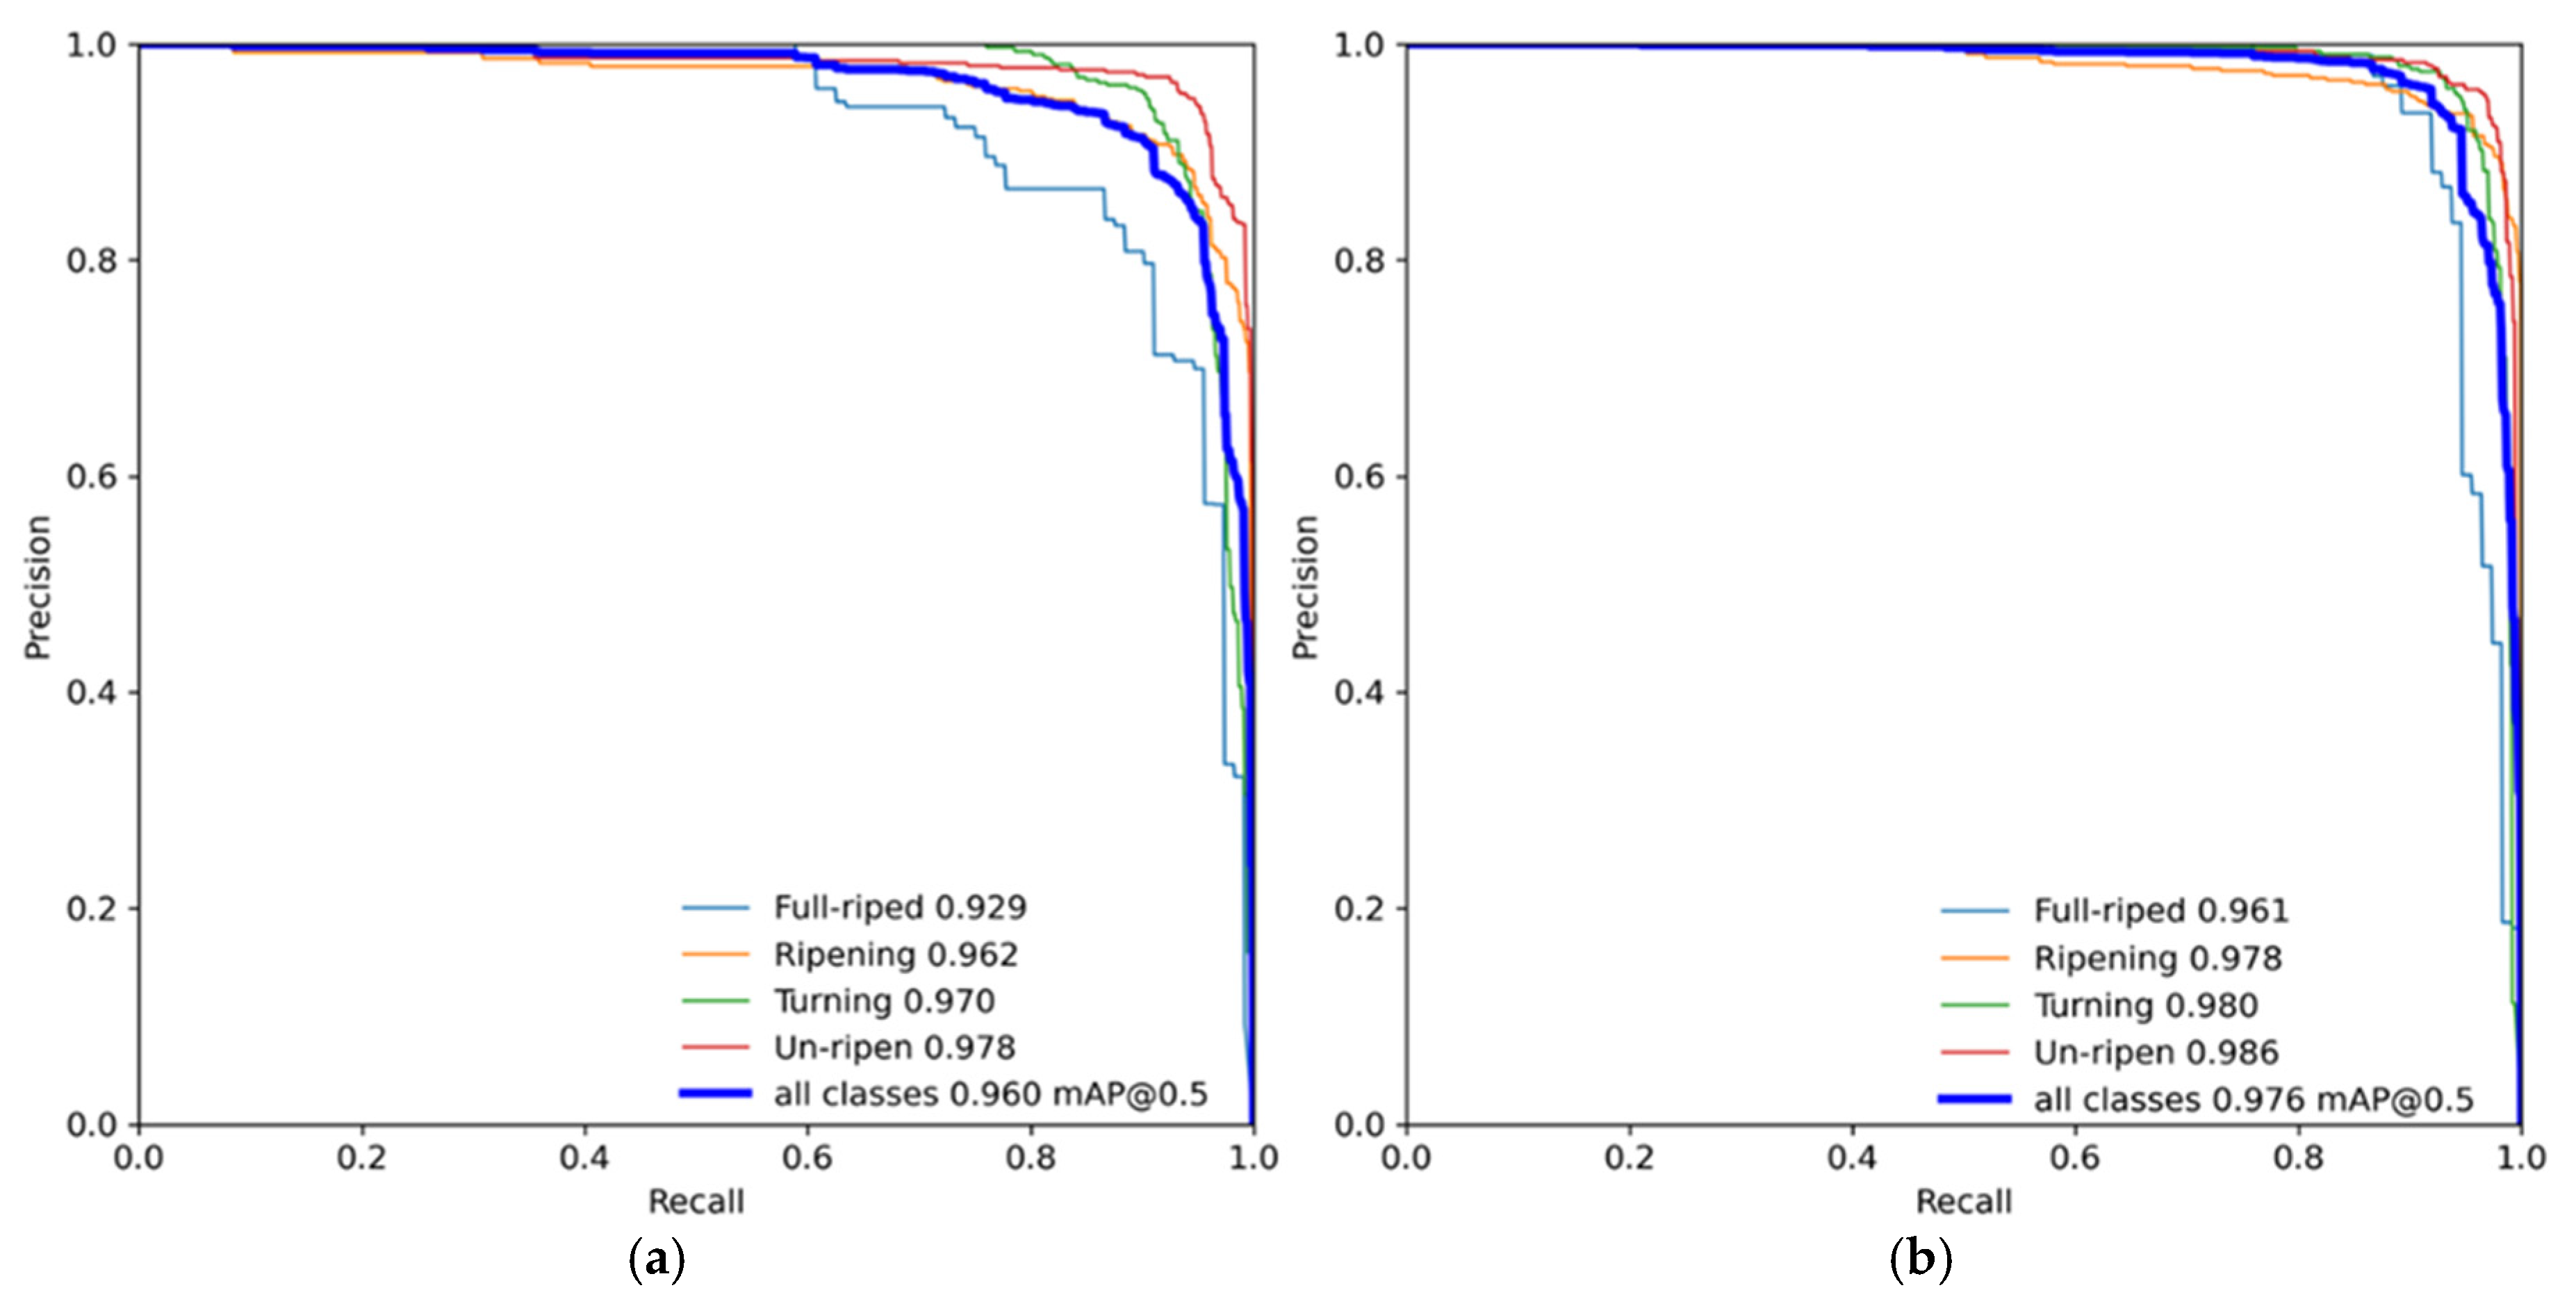
As shown by the precision–recall (PR) curves in Figure 13, the improved model outperforms the baseline model across all categories. Firstly, the PR curves for each class in the right panel are generally closer to the upper-right corner of the coordinate system, indicating that the model achieves higher precision while maintaining a high recall rate, thus demonstrating superior detection performance. Secondly, the mAP@0.5 of the improved model reaches 0.976, a significant increase compared to 0.960 for the baseline model, reflecting an overall performance improvement. In addition, the “Full-riped” class mAP in the right panel rises from 0.929 in the left panel to 0.961, and precision remains high across all categories even at high recall rates, suggesting a lower false positive rate and stronger robustness under challenging detection conditions. Finally, the PR curves in the right panel are noticeably smoother, reflecting greater stability and continuity in the model’s predictions, whereas some class curves in the left panel show considerable fluctuation, indicating less stable performance across different thresholds. In summary, the improved model demonstrates superior overall performance and generalization ability in detection tasks, offering higher practical application value.
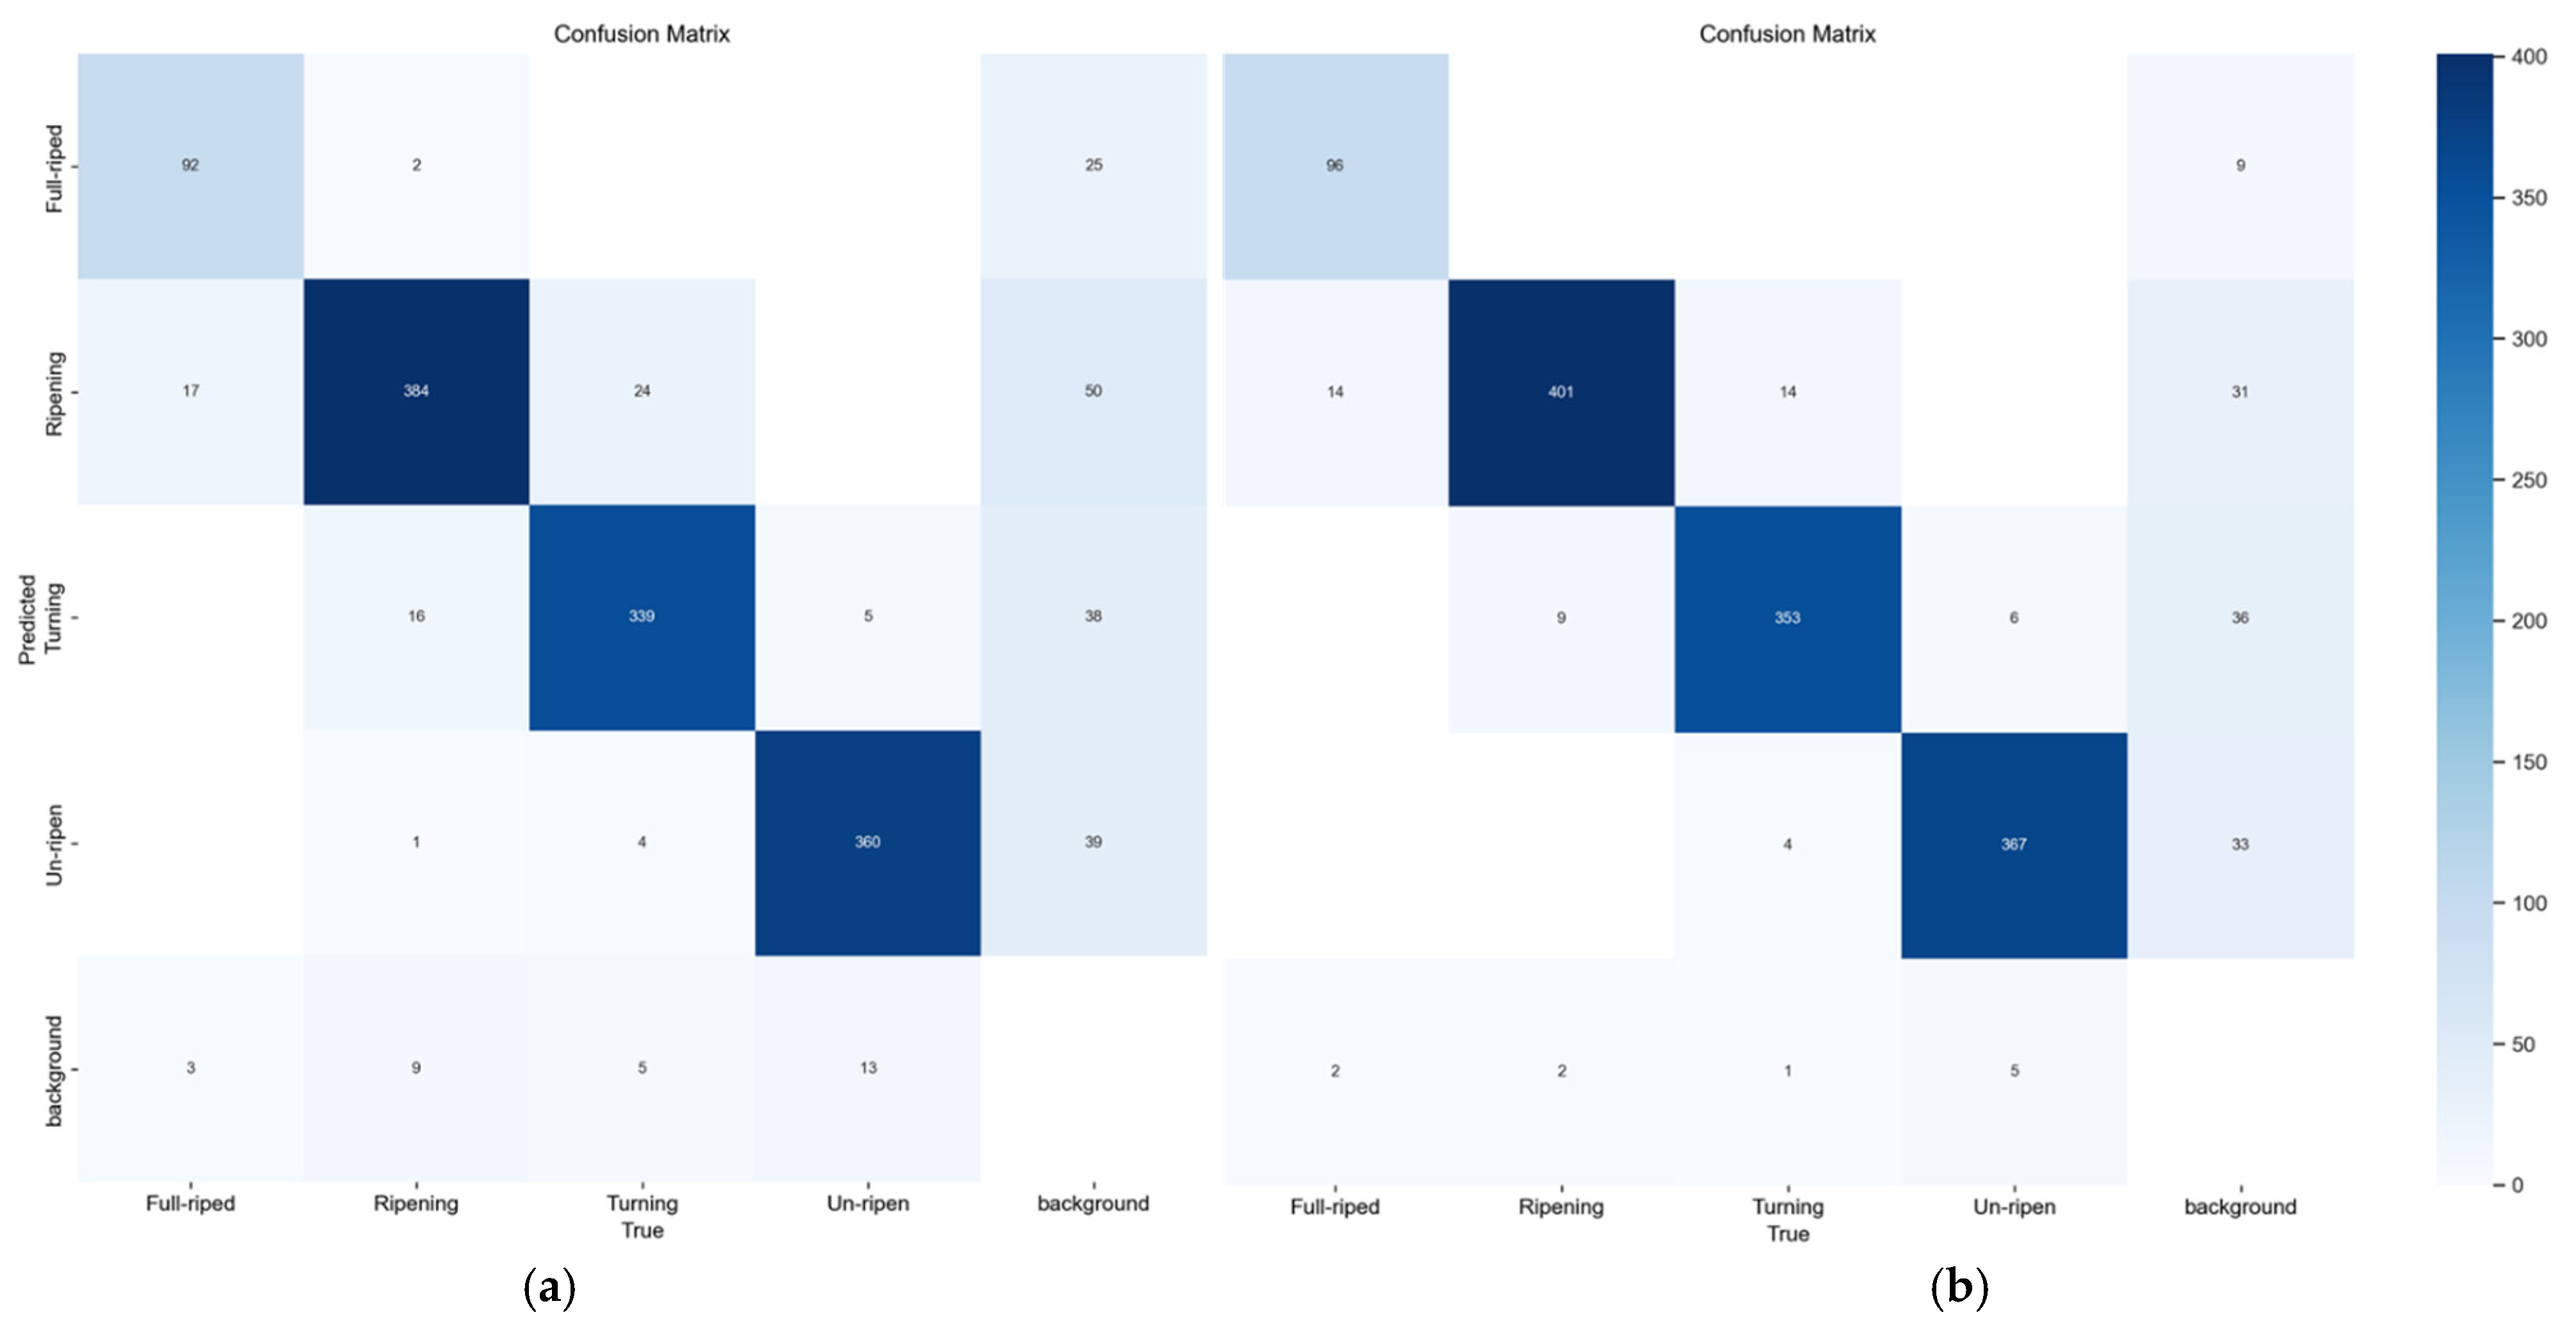
As shown in the confusion matrix in Figure 14, the baseline model exhibits significant confusion between adjacent stages such as “Ripening” and “Turning.” In addition, categories like “Ripening” and “Un-ripen” experience frequent missed detections in complex backgrounds, often being misclassified as background. The primary reasons include similarities in sample features, class imbalance, and high environmental complexity. The improved model demonstrates a much stronger overall ability to distinguish between different maturity stages of tomatoes, with substantially reduced confusion with the background, indicating greatly enhanced discrimination between fruits and the background in complex scenarios. However, some confusion still exists between the adjacent classes “Ripening” and “Turning,” as well as “Ripening” and “Full-riped,” with 14 samples misclassified in each case. This is mainly attributed to the continuity in color and morphological changes between these categories, resulting in similar visual features that make accurate distinction challenging for the model.
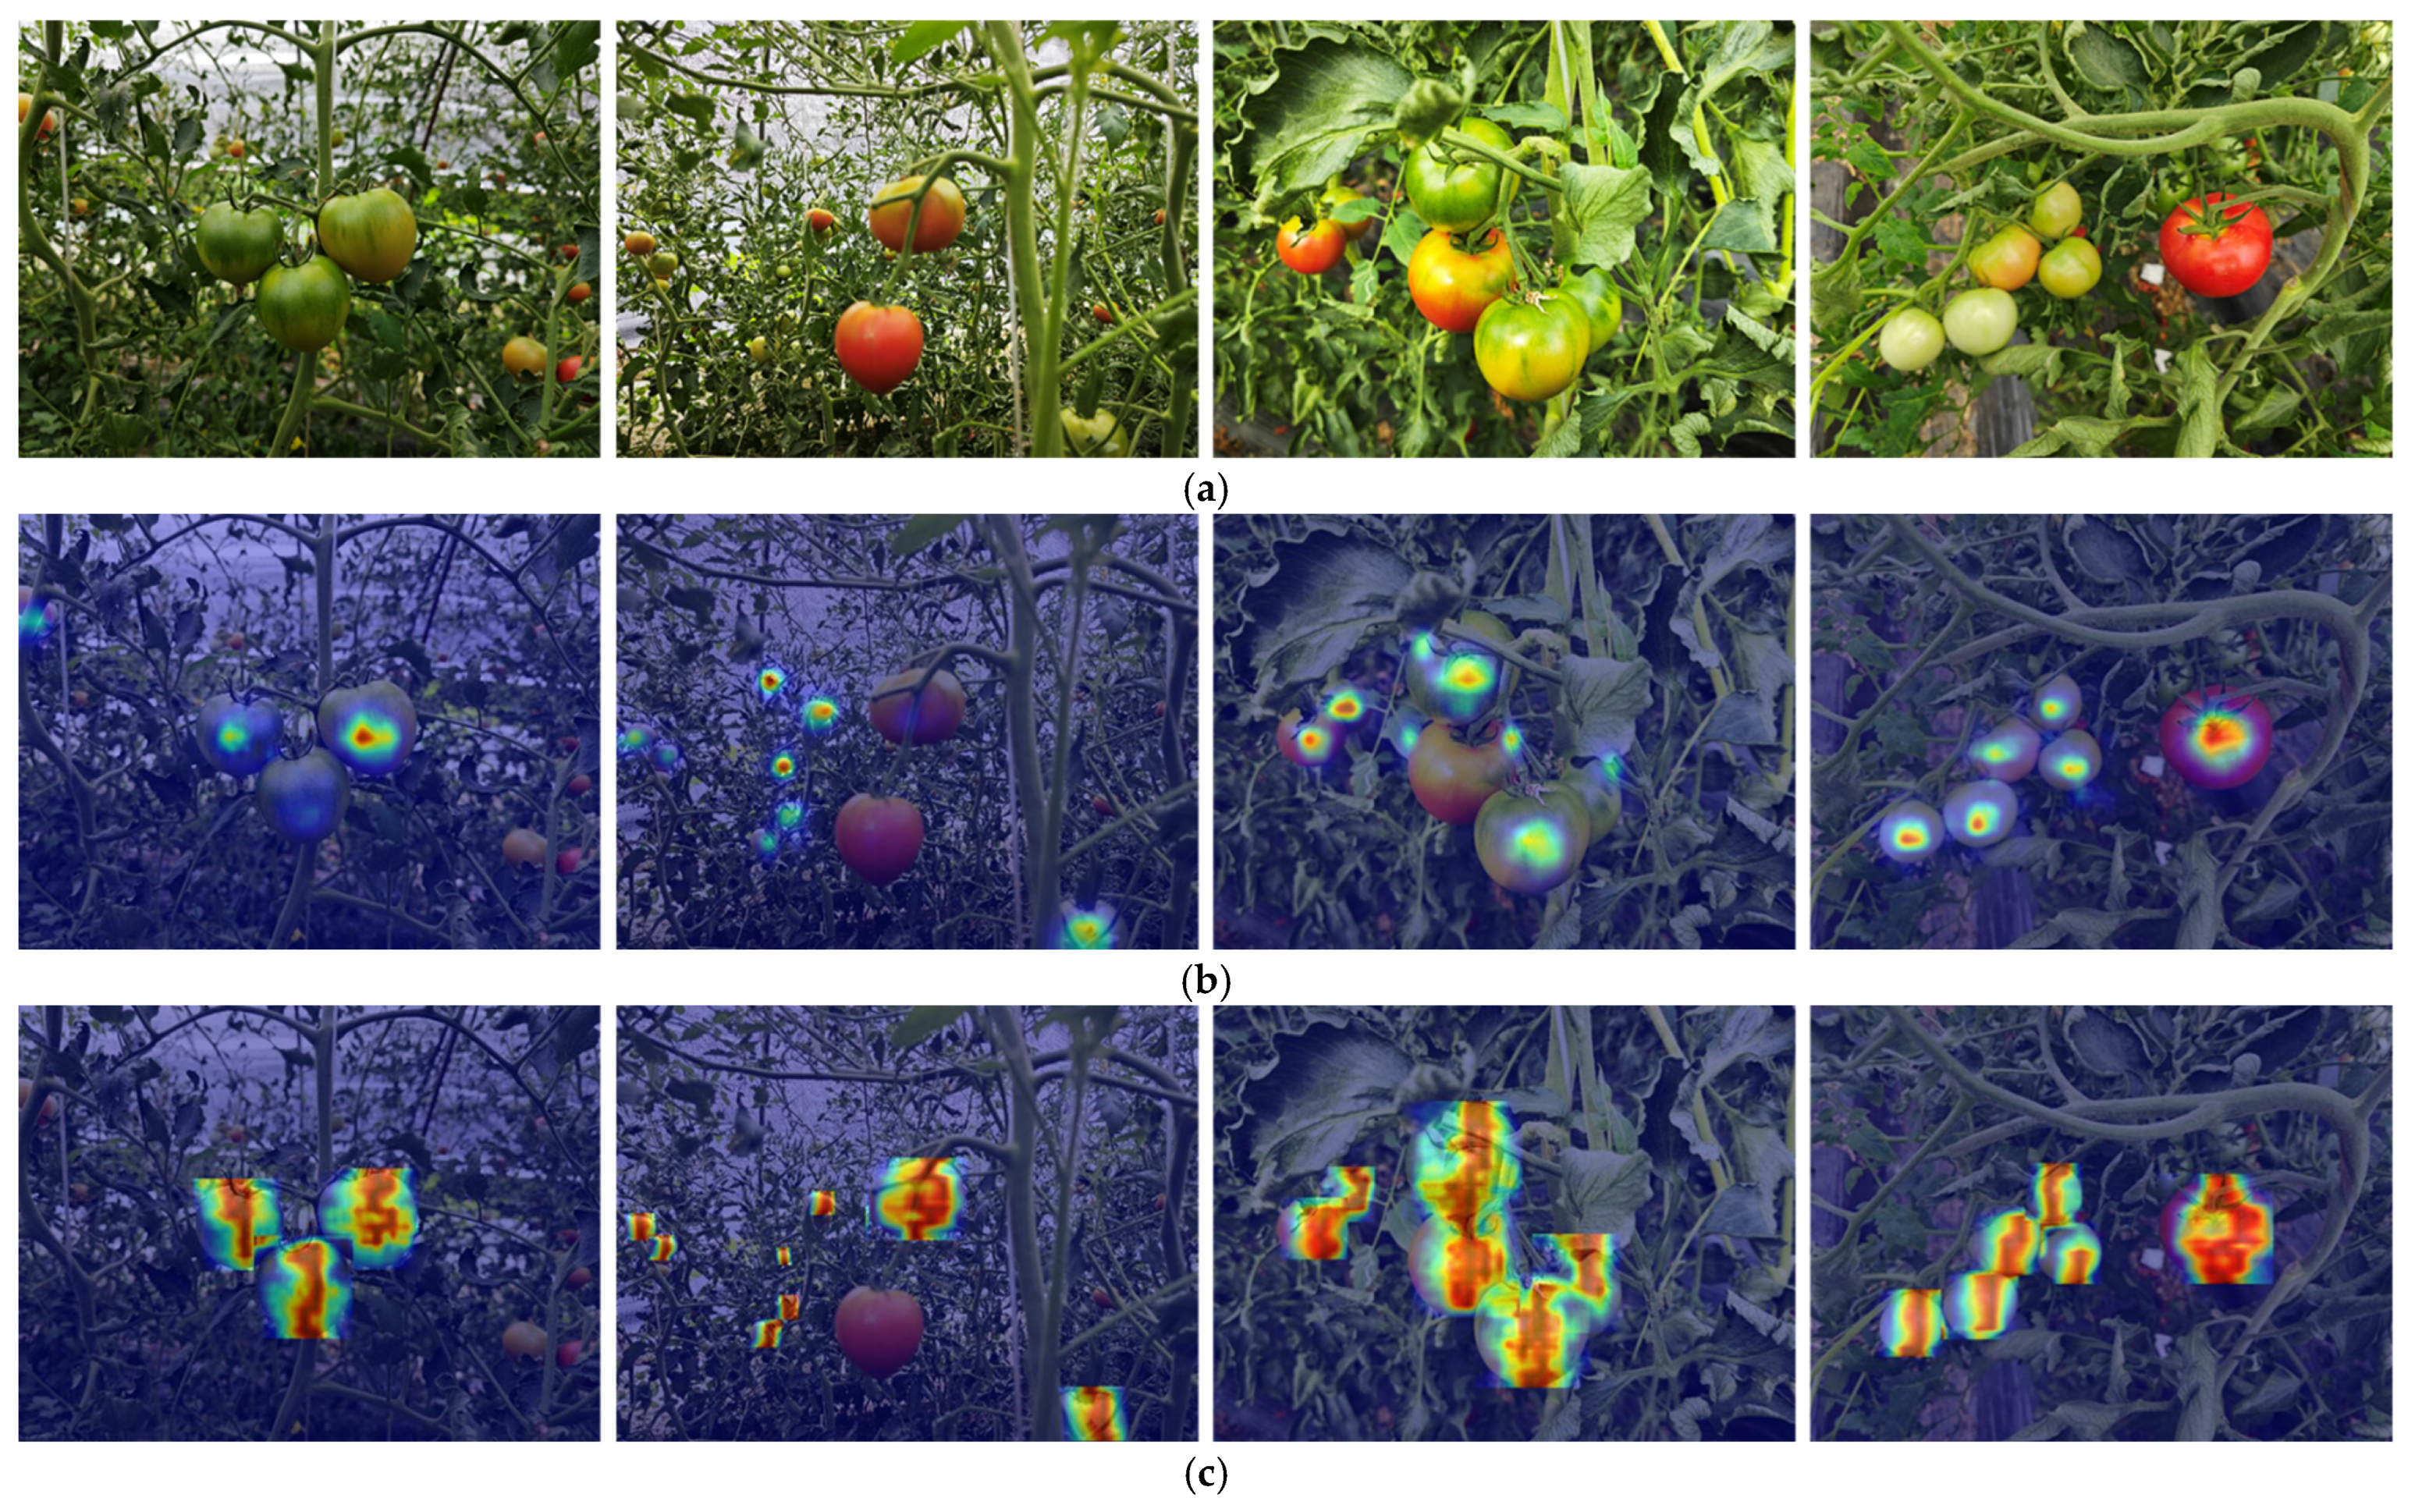
To intuitively evaluate the differences in performance between YOLOv8n-FDE and YOLOv8n, the detection results from the penultimate layer of each network were visualized as heatmaps for comparative analysis, as shown in Figure 15. As illustrated, if the heatmap is considered a proxy for attention, the baseline YOLOv8n model exhibits weak feature perception and a limited receptive field for tomato fruits, with only a small portion of attention focused on the fruits. This leads to fewer detections, lower recognition accuracy, and imprecise bounding box localization. In contrast, the YOLOv8n-FDE model demonstrates significant improvements, with most of the attention concentrated on the tomato fruits. The C3-FNet module helps YOLOv8n-FDE expand the spatial receptive field, eliminate redundant information, and strengthen feature extraction and fusion. The Dysample upsampling module fully accommodates the diverse input features of tomato images, enabling non-uniform resampling, which enhances detail preservation and improves discrimination between similar targets such as branches, leaves, and immature tomato fruits. The PSLD head, with its parameter-sharing design, efficiently handles multi-scale features and captures information at various scales, allowing the model to better understand spatial relationships between objects and improving detection of small and distant targets. Finally, the use of the PIoUv2 loss function, with a properly tuned hyperparameter λ, further optimizes detection performance.
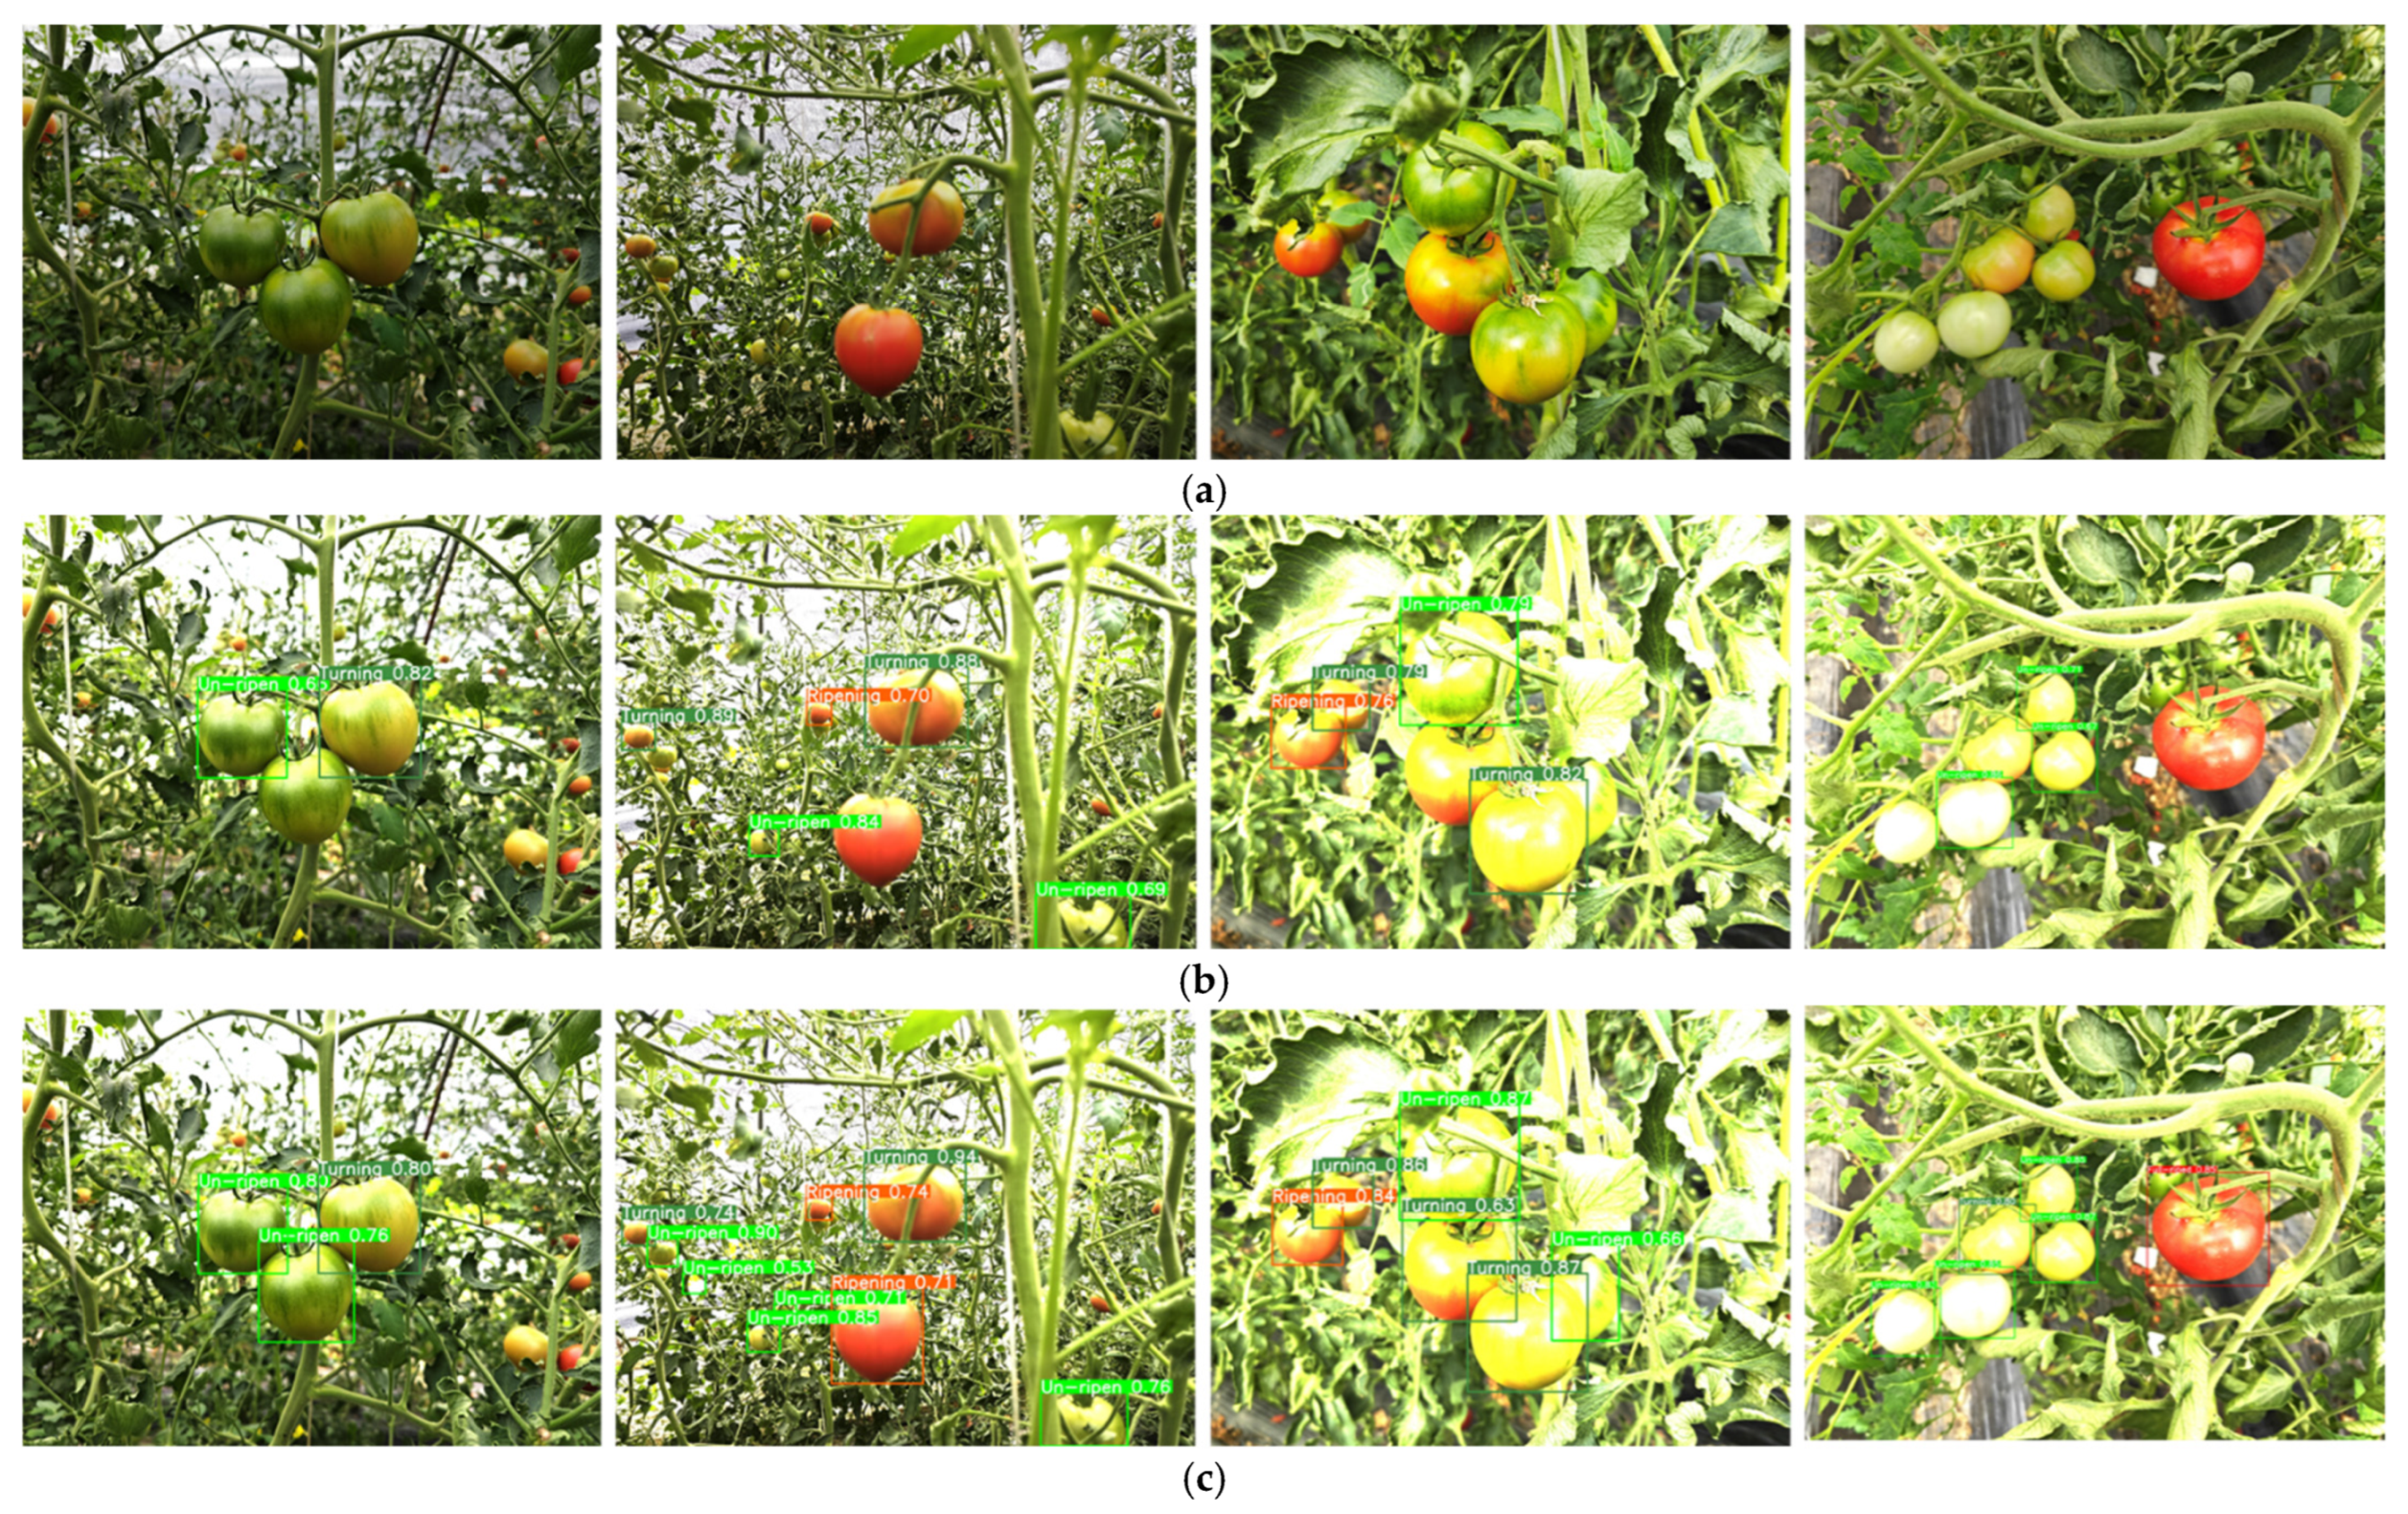
To further verify the model’s generalization ability, a maturity detection comparison was conducted for tomatoes under high-brightness conditions, as shown in Figure 16. The results indicate that both the baseline model and the YOLOv8n-FDE model show improved detection performance, with the enhanced model achieving even more notable results. Targets that were previously heavily occluded or distant small objects can now be detected, and the confidence levels for previously recognizable targets have also increased. This improvement may be attributed to the enhanced image quality following brightness augmentation, which strengthens the model’s ability to identify weak-featured targets and enables effective detection of previously missed objects. This finding also provides a reference for other researchers, suggesting that applying brightness enhancement prior to object detection can further improve detection performance.

4. Conclusions

The YOLOv8n-FDE model proposed in this study demonstrates significant performance improvements in tomato fruit detection tasks and exhibits clear advantages over various existing lightweight object detection methods. By introducing the C2f-FNet feature extraction and fusion module, the model effectively expands the receptive field and enhances the ability to recognize tomato fruits in complex backgrounds, outperforming traditional C3 or C2f module designs. The use of the Dysample upsampling operator better preserves detail information, aiding in the differentiation of similar targets such as branches and immature fruits, and demonstrates outstanding performance compared to both the original YOLOv8n model and other improved models. The innovative PSLD module reduces redundancy through parameter sharing and improves multi-scale feature fusion, embodying a design philosophy that balances lightweight structure and high performance. Compared to models with conventional detection heads, the proposed model achieves superior detection accuracy with significantly reduced parameter count and computational complexity. Regarding the application of the PIoUv2 loss function, experimental results show that changes in the hyperparameter λ do not exhibit a clear pattern in their impact on detection accuracy, suggesting that this hyperparameter should be fine-tuned based on specific datasets. This finding aligns with the limited applicability of the default λ values (1.3 or 1.5) recommended in the original literature, underscoring the importance of tailoring loss function parameters to different tasks and data conditions.

5. Discussion

Most existing lightweight approaches focus on incorporating lightweight networks to reduce model complexity and introducing attention mechanisms to improve detection performance. However, these methods often result in incomplete lightweighting and only marginal improvements in detection accuracy. Additionally, some studies seek to artificially balance the distribution of label categories in the dataset, thereby neglecting the actual distribution found in real-world scenarios. In this work, we progressively improved model performance by refining each module, aiming to identify the trade-off between lightweight design and detection performance, ultimately achieving a balanced state between model efficiency and accuracy. The construction of our dataset reflects real-world distributions, and training the model on imbalanced data enables a more realistic representation of practical application environments, thereby enhancing the model’s future performance in real-world scenarios.
Nevertheless, this study has certain limitations. The current model’s ability to recognize tomato maturity in multimodal environments needs further improvement, and the dataset scale should be expanded. Future research may incorporate techniques such as pruning and knowledge distillation to further enhance model lightweighting. Moreover, with the continuous improvement in edge computing device capabilities, lightweight models have broad prospects for practical application and are expected to play an important role in a wider range of intelligent agricultural detection scenarios.

Author Contributions

Conceptualization, X.G. and J.D.; Data Curation, Y.S.; Formal Analysis, X.G. and H.Y.; Funding Acquisition, X.X.; Investigation, J.D.; Methodology, J.D.; Project Administration, R.Z. and X.X.; Resources, X.X.; Software, Y.S.; Supervision, X.X.; Validation, X.G., J.D., M.B. and H.Y.; Visualization, J.D.; Writing—Original Draft Preparation, J.D.; Writing—Review and Editing, J.D. and M.B. All authors have read and agreed to the published version of the manuscript.

Funding

This research was funded by the High-end Talent Support Program of Yangzhou University.

Data Availability Statement

The original contributions presented in the study are included in the article: further inquiries can be directed at the corresponding authors.

Acknowledgments

The authors would like to thank the technical support of their teacher and supervisor. Additionally, we sincerely appreciate the work of the editor and the reviewers of the present paper.

Conflicts of Interest

The authors declare no conflicts of interest.

References

  1. Wang, A.; Xu, Y.; Hu, D.; Zhang, L.; Li, A.; Zhu, Q.; Liu, J. Tomato Yield Estimation Using an Improved Lightweight YOLO11n Network and an Optimized Region Tracking-Counting Method. Agriculture 2025, 15, 1353. [Google Scholar] [CrossRef]
  2. Malik, M.H.; Zhang, T.; Li, H.; Zhang, M.; Shabbir, S.; Saeed, A. Mature Tomato Fruit Detection Algorithm Based on improved HSV and Watershed Algorithm. IFAC-PapersOnLine 2018, 51, 431–436. [Google Scholar] [CrossRef]
  3. Badgujar, C.M.; Poulose, A.; Gan, H. Agricultural object detection with You Only Look Once (YOLO) Algorithm: A bibliometric and systematic literature review. Comput. Electron. Agric. 2024, 223, 109090. [Google Scholar] [CrossRef]
  4. Gu, Z.; Ma, X.; Guan, H.; Jiang, Q.; Deng, H.; Wen, B.; Zhu, T.; Wu, X. Tomato fruit detection and phenotype calculation method based on the improved RTDETR model. Comput. Electron. Agric. 2024, 227, 109524. [Google Scholar] [CrossRef]
  5. Ninja, B.; Manuj, K.H. Maturity detection of tomatoes using transfer learning. Meas. Food 2022, 7, 100038. [Google Scholar] [CrossRef]
  6. Chen, W.; Liu, M.; Zhao, C.; Li, X.; Wang, Y. MTD-YOLO: Multi-task deep convolutional neural network for cherry tomato fruit bunch maturity detection. Comput. Electron. Agric. 2024, 216, 108533. [Google Scholar] [CrossRef]
  7. Wu, Q.; Huang, H.; Song, D.; Zhou, J. YOLO-PGC: A Tomato Maturity Detection Algorithm Based on Improved YOLOv11. Appl. Sci. 2025, 15, 5000. [Google Scholar] [CrossRef]
  8. Qin, J.; Chen, Z.; Zhang, Y.; Nie, J.; Yan, T.; Wan, B. YOLO-CT: A method based on improved YOLOv8n-Pose for detecting multi-species mature cherry tomatoes and locating picking points in complex environments. Measurement 2025, 254, 117954. [Google Scholar] [CrossRef]
  9. Ayyad, S.M.; Sallam, N.M.; Gamel, S.A.; Ali, Z.H. Particle swarm optimization with YOLOv8 for improved detection performance of tomato plants. J. Big Data 2025, 12, 152. [Google Scholar] [CrossRef]
  10. Lawal, M.O. Tomato detection based on modified YOLOv3 framework. Sci. Rep. 2021, 11, 1447. [Google Scholar] [CrossRef] [PubMed]
  11. Gao, X.; Ding, J.; Zhang, R.; Xi, X. YOLOv8n-CA: Improved YOLOv8n Model for Tomato Fruit Recognition at Different Stages of Ripeness. Agronomy 2025, 15, 188. [Google Scholar] [CrossRef]
  12. Appe, S.N.; Arulselvi, G.; Balaji, G.N. CAM-YOLO: Tomato detection and classification based on improved YOLOv5 using combining attention mechanism. PeerJ Comput. Sci. 2023, 9, e1463. [Google Scholar] [CrossRef]
  13. Vo, H.T.; Mui, K.C.; Thien, N.N.; Tien, P.P. Automating Tomato Ripeness Classification and Counting with YOLOv9. Int. J. Adv. Comput. Sci. Appl. 2024, 15, 1120–1128. [Google Scholar] [CrossRef]
  14. Gao, G.H.; Shuai, C.Y.; Wang, S.Y.; Ding, T. Using improved YOLO V5s to recognize tomatoes in a continuous working environment. Signal Image Video Process. 2024, 18, 4019–4028. [Google Scholar] [CrossRef]
  15. Cardellicchio, A.; Solimani, F.; Dimauro, G.; Petrozza, A.; Summerer, S.; Cellini, F.; Renò, V. Detection of tomato plant phenotyping traits using YOLOv5-based single stage detectors. Comput. Electron. Agric. 2023, 207, 107757. [Google Scholar] [CrossRef]
  16. Wang, W.; Gong, L.; Wang, T.; Yang, Z.; Zhang, W.; Liu, C. Tomato fruit recognition based on multi-source fusion image segmentation algorithm in open environment. Trans. Chin. Soc. Agric. Mac. (Trans. CSAM) 2021, 52, 156–164. [Google Scholar]
  17. Zu, L.; Zhao, Y.; Liu, J.; Su, F.; Zhang, Y.; Liu, P. Detection and Segmentation of Mature Green Tomatoes Based on Mask R-CNN with Automatic Image Acquisition Approach. Sensors 2021, 21, 7842. [Google Scholar] [CrossRef] [PubMed]
  18. Afonso, M.; Fonteijn, H.; Fiorentin, F.S.; Lensink, D.; Mooij, M.; Faber, N.; Polder, G.; Wehrens, R. Tomato Fruit Detection and Counting in Greenhouses Using Deep Learning. Front. Plant Sci. 2020, 11, 571299. [Google Scholar] [CrossRef] [PubMed]
  19. Wang, Q.; Hua, Y.; Lou, Q.; Kan, X. SWMD-YOLO: A Lightweight Model for Tomato Detection in Greenhouse Environments. Agronomy 2025, 15, 1593. [Google Scholar] [CrossRef]
  20. Hao, F.; Zhang, Z.; Ma, D.; Kong, H. GSBF-YOLO: A lightweight model for tomato ripeness detection in natural environments. J. Real-Time Image Process. 2025, 22, 47. [Google Scholar] [CrossRef]
  21. Koirala, A.; Walsh, K.B.; Wang, Z.; McCarthy, C. Deep learning for real-time fruit detection and orchard fruit load estimation: Benchmarking of ‘MangoYOLO’. Precis. Agric. 2019, 20, 1107–1135. [Google Scholar] [CrossRef]
  22. Parico, A.I.B.; Ahamed, T. Real Time Pear Fruit Detection and Counting Using YOLOv4 Models and Deep SORT. Sensors 2021, 21, 4803. [Google Scholar] [CrossRef]
  23. Glukhikh, I.; Glukhikh, D.; Gubina, A.; Chernysheva, T. Deep Learning Method with Domain-Task Adaptation and Client-Specific Fine-Tuning YOLO11 Model for Counting Greenhouse Tomatoes. Appl. Syst. Innov. 2025, 8, 71. [Google Scholar] [CrossRef]
  24. Chen, J.; Kao, S.; He, H.; Zhuo, W.; Wen, S.; Lee, C.; Gary, C.S.H. Run, don’t walk: Chasing higher FLOPS for faster neural networks. In Proceedings of the IEEE/CVF Conference on Computer Vision and Pattern Recognition, Vancouver, BC, Canada, 17–24 June 2023; pp. 12021–12031. [Google Scholar]
  25. Zhao, J.; Xi, X.; Shi, Y.; Zhang, B.; Qu, J.; Zhang, J.; Zhu, Z.; Zhang, R. An Online Method for Detecting Seeding Performance Based on Improved YOLOv5s Model. Agronomy 2023, 13, 2391. [Google Scholar] [CrossRef]
  26. Ha, C.K.; Nguyen, H.; Van, V.D. YOLO-SR: An optimized convolutional architecture for robust ship detection in SAR Imagery. Intell. Syst. Appl. 2025, 26, 200538. [Google Scholar] [CrossRef]
  27. Kim, B.J.; Choi, H.; Jang, H.; Kim, S.W. On the ideal number of groups for isometric gradient propagation. Neurocomputing 2024, 573, 127217. [Google Scholar] [CrossRef]
  28. Tian, Z.; Shen, C.; Chen, H.; He, T. FCOS: A simple and strong anchor-free object detector. IEEE Trans. Pattern Anal. Mach. Intell. 2020, 44, 1922–1933. [Google Scholar] [CrossRef]
  29. Liu, C.; Wang, K.; Li, Q.; Li, Q.; Zhao, F.; Zhao, K.; Ma, H. Powerful-IoU: More straightforward and faster bounding box regression loss with a nonmonotonic focusing mechanism. Neural Netw. 2024, 170, 276–284. [Google Scholar] [CrossRef] [PubMed]
  30. Di, X.; Cui, K.; Wang, R.-F. Toward Efficient UAV-Based Small Object Detection: A Lightweight Network with Enhanced Feature Fusion. Remote Sens. 2025, 17, 2235. [Google Scholar] [CrossRef]
Figure 1. Tomato maturity diagram: (a) mature stage; (b) turning mature stage; (c) color-changing stage; (d) immature stage.
Agronomy 15 01899 g001
Figure 2. Examples of tomato images under multi-factor augmentation: (a) original image; (b) local rotation; (c) high lighting; (d) dimming and color patch occlusion.
Agronomy 15 01899 g002
Figure 3. Distribution of dataset labels.
Agronomy 15 01899 g003
Figure 4. mAP@0.5 trends of different models during training.
Agronomy 15 01899 g004
Figure 5. Architecture of the YOLOv8n-FDE network.
Agronomy 15 01899 g005
Figure 6. The architecture of the C3-FNet module.
Agronomy 15 01899 g006
Figure 7. Dysample network architecture.
Agronomy 15 01899 g007
Figure 8. The architecture of the PSLD head.
Agronomy 15 01899 g008
Figure 9. PIoUv2 conceptual structure.
Agronomy 15 01899 g009
Figure 10. Comparison of detection performance among different models: (a,d) similar maturity; (b) small distant objects; (c) fruit stacking.
Agronomy 15 01899 g010
Figure 11. Comparison of mean average precision: (a) mAP@0.5; (b) mAP@0.5:0.95.
Agronomy 15 01899 g011
Figure 12. Comparison of mean average precision: (a) box loss; (b) cls loss; (c) dfl loss.
Agronomy 15 01899 g012
Figure 13. Comparison of precision–recall curves: (a) YOLOv8n; (b) YOLOv8n-FDE.
Agronomy 15 01899 g013
Figure 14. Comparison of confusion matrix: (a) YOLOv8n; (b) YOLOv8n-FDE.
Agronomy 15 01899 g014
Figure 15. Comparison of heatmaps between YOLOv8n-FDE and YOLOv8n: (a) original image; (b) YOLOv8n; (c) YOLOv8n-FDE.
Agronomy 15 01899 g015
Figure 16. Detection results at high brightness levels between YOLOv8n-FDE and YOLOv8n: (a) original image; (b) YOLOv8n; (c) YOLOv8n-FDE.
Agronomy 15 01899 g016
Table 1. Experimental platform specifications.
NameDetailed Specifications
CPUi5-13600KF
GPUNVIDIA RTX A2000
RAM32 GB
VRAM6 GB
Operating systemWindows 10
Programming languagePython 3.9
Deep learning frameworkPytorch
Table 2. Comparison of upsampling performance.
ModelsParameter/MCalculation/GFLOPsModel Size/MBmAP@.5/%
YOLOv8n3.058.25.9996.0
YOLOv8n-CARAFE3.208.86.2395.9
YOLOv8n-DySample3.018.15.9896.9
Table 3. Comparison of detection head performance.
ModelsParameter/MCalculation/GFLOPsModel Size/MBmAP@.5/%
YOLOv8n3.058.25.9996.0
YOLOv8n-Dyhead3.6310.56.9096.0
YOLOv8n-PSLD2.366.54.7296.3
Table 4. The comparative analysis under different λ values.
No.ModelsmAP@.5/%
1λ = 1.196.4
2λ = 1.397.4
3λ = 1.597.0
4λ = 1.797.6
Table 5. Ablation test results of YOLOv8n-FDE model.
ModelsParameter/MCalculation/GFLOPsModel Size/MBmAP@.5/%
YOLOv8n3.058.25.9996.0
YOLOv8n-DySample3.018.15.9896.9
YOLOv8n-PSLD2.366.54.7296.3
YOLOv8n-C3_FNet2.196.14.4496.5
YOLOv8n-DySample-PSLD2.376.54.7496.8
YOLOv8n-C3_FNet-DySample-PSLD1.564.53.2097.4
YOLOv8n-C3_FNet-DySample-PSLD-PIoUv21.564.53.2097.6
Table 6. Experimental results of different model detection.
ModelsParameter/MCalculation/GFLOPsModel Size/MBmAP@.5/%mAP@.5:0.95/%Detect Times/ms
EfficientDet27.358.215.087.272.330.5
Faster R-CNN137.75403.8107.862.353.871.1
YOLOv5s2.366.54.7294.278.338.8
YOLOv736.51103.471.593.179.145.3
YOLOv8n3.018.15.9896.088.723.6
YOLOv10n2.376.55.5095.186.320.8
YOLO11n1.564.55.2393.287.418.3
YOLOv8n-FDE1.564.53.2097.689.216.1
Disclaimer/Publisher’s Note: The statements, opinions and data contained in all publications are solely those of the individual author(s) and contributor(s) and not of MDPI and/or the editor(s). MDPI and/or the editor(s) disclaim responsibility for any injury to people or property resulting from any ideas, methods, instructions or products referred to in the content.