Article

Exploring Agronomic Management Strategies to Improve Millet, Sorghum, Peanuts and Rice in Senegal Using the DSSAT Models

1
International Research Institute for Climate and Society (IRI), Climate School, Columbia University, New York, NY 10025, USA
2
Institut Sénégalais de Recherches Agricoles (ISRA), Dakar 3120, Senegal
*
Author to whom correspondence should be addressed.
Agronomy 2025, 15(8), 1882; https://doi.org/10.3390/agronomy15081882
Submission received: 3 July 2025 / Revised: 24 July 2025 / Accepted: 31 July 2025 / Published: 4 August 2025
(This article belongs to the Section Farming Sustainability)

Abstract

Achieving food security for a growing population under a changing climate is a key concern in Senegal, where agriculture employs 77% of the workforce with a majority of small farmers who rely on the production of crops for their subsistence and for income generation. Moreover, due to the underproductive soils and variable rainfall, Senegal depends on imports to fulfil 70% of its food requirements. In this research, we considered four crops that are crucial for Senegalese agriculture: millet, sorghum, peanuts and rice. We used crop simulation models to explore existing yield gaps and optimal agronomic practices. Improving the N fertilizer management in sorghum and millet resulted in 40–100% increases in grain yields. Improved N symbiotic fixation in peanuts resulted in yield increases of 20–100% with highest impact in wetter locations. Optimizing irrigation management and N fertilizer use resulted in 20–40% gains. The best N fertilizer strategy for sorghum and millet included applying low rates at sowing and in early development stages and adjusting a third application, considering the expected rainfall. Peanut yields of the variety 73-33 were higher than Fleur-11 in all locations, and irrigation showed no clear economic advantage. The best N fertilizer management for rainfed rice included applying 30 kg N/ha at sowing, 25 days after sowing (DAS) and 45 DAS. The best combination of sowing dates for a possible double rice crop depended on irrigation costs, with a first crop planted in January or March and a second crop planted in July. Our work confirmed results obtained in field research experiments and identified management practices for increasing productivity and reducing yield variability. Those crop management practices can be implemented in pilot experiments to further validate the results and to disseminate best management practices for farmers in Senegal.

1. Introduction

In the face of a rapidly expanding global population and the escalating challenges posed by climate change, achieving food security has become one of the foremost concerns of the 21st century. Senegal, located in the semi-arid region of West Africa, faces unique agricultural challenges that are intensified by climate variability and limited resources [1]. In 2020, agriculture contributed 15% to Senegal’s GDP and employed 77% of the workforce, with the majority of workers being smallholder farmers dependent on crop production for both subsistence and income generation [2]. However, the country’s agriculture is predominantly rainfed and highly vulnerable to climate fluctuations, including droughts, floods, rising temperatures, waterlogging and shorter growing seasons [3,4]. Despite the high proportion of the population engaged in farming, Senegal relies on imports to meet 70% of its food needs, largely due to the country’s underproductive soils and unpredictable rainfall patterns [5]. Numerous studies highlight the significant gap between current crop yields and the potential or attainable yields in Senegal [6,7]. The primary factors contributing to this yield gap include the inefficient or insufficient use of agricultural inputs, such as fertilizers, improved seed varieties and pesticides, as well as soil degradation caused by poor management practices and erosion, which are widespread in many agricultural regions.
Millet and sorghum are among the key staple crops in Senegal, playing a crucial role in both food security and the livelihoods of the population. These crops have long been an integral part of the country’s agricultural heritage [2]. In 2019, millet and sorghum were cultivated on a combined area of 1 million hectares, with yields of 600 kg/ha for millet and 800 kg/ha for sorghum [8], making them the most widely grown crops in Senegal. Known for their resilience to semi-arid conditions [9], as well as their nutritional benefits—rich in iron and zinc and free from gluten [10,11,12]—millet and sorghum are essential to both food security and sustainable agricultural development. Their consumption plays a pivotal role in combating malnutrition, particularly in regions where access to diverse and nutritious diets is limited.
Peanuts are a vital cash crop in Senegal, playing a significant role in the nation’s economy, food security and rural livelihoods. It provides a stable source of income for farmers, contributing to poverty reduction and broader socio-economic development [13,14,15]. The export of peanuts and their derivatives generates substantial revenue, bolstering foreign exchange earnings and supporting overall economic stability. Peanut cultivation is especially important for smallholder farmers, offering a means of income diversification and serving as a key driver of rural development [16]. In addition to its economic impact, peanuts enhance food security by offering a nutrient-rich food source that complements other dietary staples. Containing over 25% protein, along with essential nutrients such as calcium, folate and immune-boosting phytosterols [17], peanuts are a valuable component of the Senegalese diet [18]. Furthermore, peanut byproducts such as oil and meal play an important role in producing cooking oil and animal feed, thereby contributing to both food security initiatives and the sustainability of the livestock sector.
Finally, rice is a dietary staple in Senegal, providing 22–40% of the population’s caloric intake and 23–39% of its protein needs [19]. Rich in carbohydrates, vitamins and minerals, rice contributes to a balanced and diverse diet [19,20]. Its cultivation is also a cornerstone of Senegal’s economy, supporting the livelihoods of many smallholder farmers and serving as an important source of income diversification [21,22]. Despite its importance, domestic rice production—ranging between 1.3 and 1.4 million tons from 2020 to 2022—meets only about 28% of national demand [23]. In response, the government has implemented policies aimed at achieving rice self-sufficiency. Early efforts concentrated on harnessing the 240,000 hectares of potential farmland in the Senegal River Valley through irrigation development. While this strategy remains relevant, the release of improved rainfed rice varieties—such as NERICA by Africa Rice and the Sahel and ISRIZ varieties by the Institut Sénégalais de Recherches Agricoles (ISRA)—has shifted the focus. Currently, around 50% of national rice production originates from lowland and plateau areas in Casamance and the Groundnut Basin [24,25]. Significant efforts continue to promote the adoption of modern agricultural practices, improved seed varieties, and sustainable farming techniques to boost productivity and resilience [26,27].
Agriculture in Senegal is increasingly challenged by climate variability, limited resources, and a growing population. In this context, crop simulation models have become valuable tools for informed agricultural decision-making. These models offer farmers and policymakers insights into crop growth, yield projections, and resource management under diverse environmental and economic scenarios [4,28,29,30,31]. By simulating multiple scenarios, farmers can anticipate potential yield fluctuations and implement adaptive crop management strategies to reduce losses or capitalize on favorable conditions. This proactive approach strengthens the resilience of agricultural systems, supporting both food security and economic stability. Moreover, agricultural policies significantly shape the sector, and crop simulation models can aid policymakers by providing comprehensive assessments of the potential impacts of their decisions on crop production, resource use and environmental sustainability.
Crop simulation models can play a vital role in supporting both farmer decision-making and policy development by offering valuable insights into crop production strategies. However, a commonly cited concern among farmers and policy advisers is that while they recognize the potential of these models as decision-support tools, they often find them difficult to use due to complex interfaces. To address this challenge, Han et al. [31] developed SIMAGRI, a user-friendly interface designed with two key goals: to make crop models more accessible to farmers and policy advisers and to ensure simulations are based on appropriate inputs—such as soil characteristics, cultivar types, weather data and economic parameters. SIMAGRI enables users to run DSSAT simulations for a variety of “what-if” scenarios, incorporating different climate conditions (historical or forecasted) and crop management practices. The interface supports simulations using various combinations of cultivars, soil types, sowing dates, fertilizer applications, irrigation regimes and more. A graphical user interface (GUI) allows users to set up scenarios, execute simulations and view results in intuitive probabilistic formats, such as box plots or cumulative probability curves, facilitating direct comparisons between management strategies. Additionally, SIMAGRI integrates crop modeling with economic data—including prices and production costs—and presents outcomes in straightforward financial terms, such as gross margin, making the results more actionable for decision-makers.
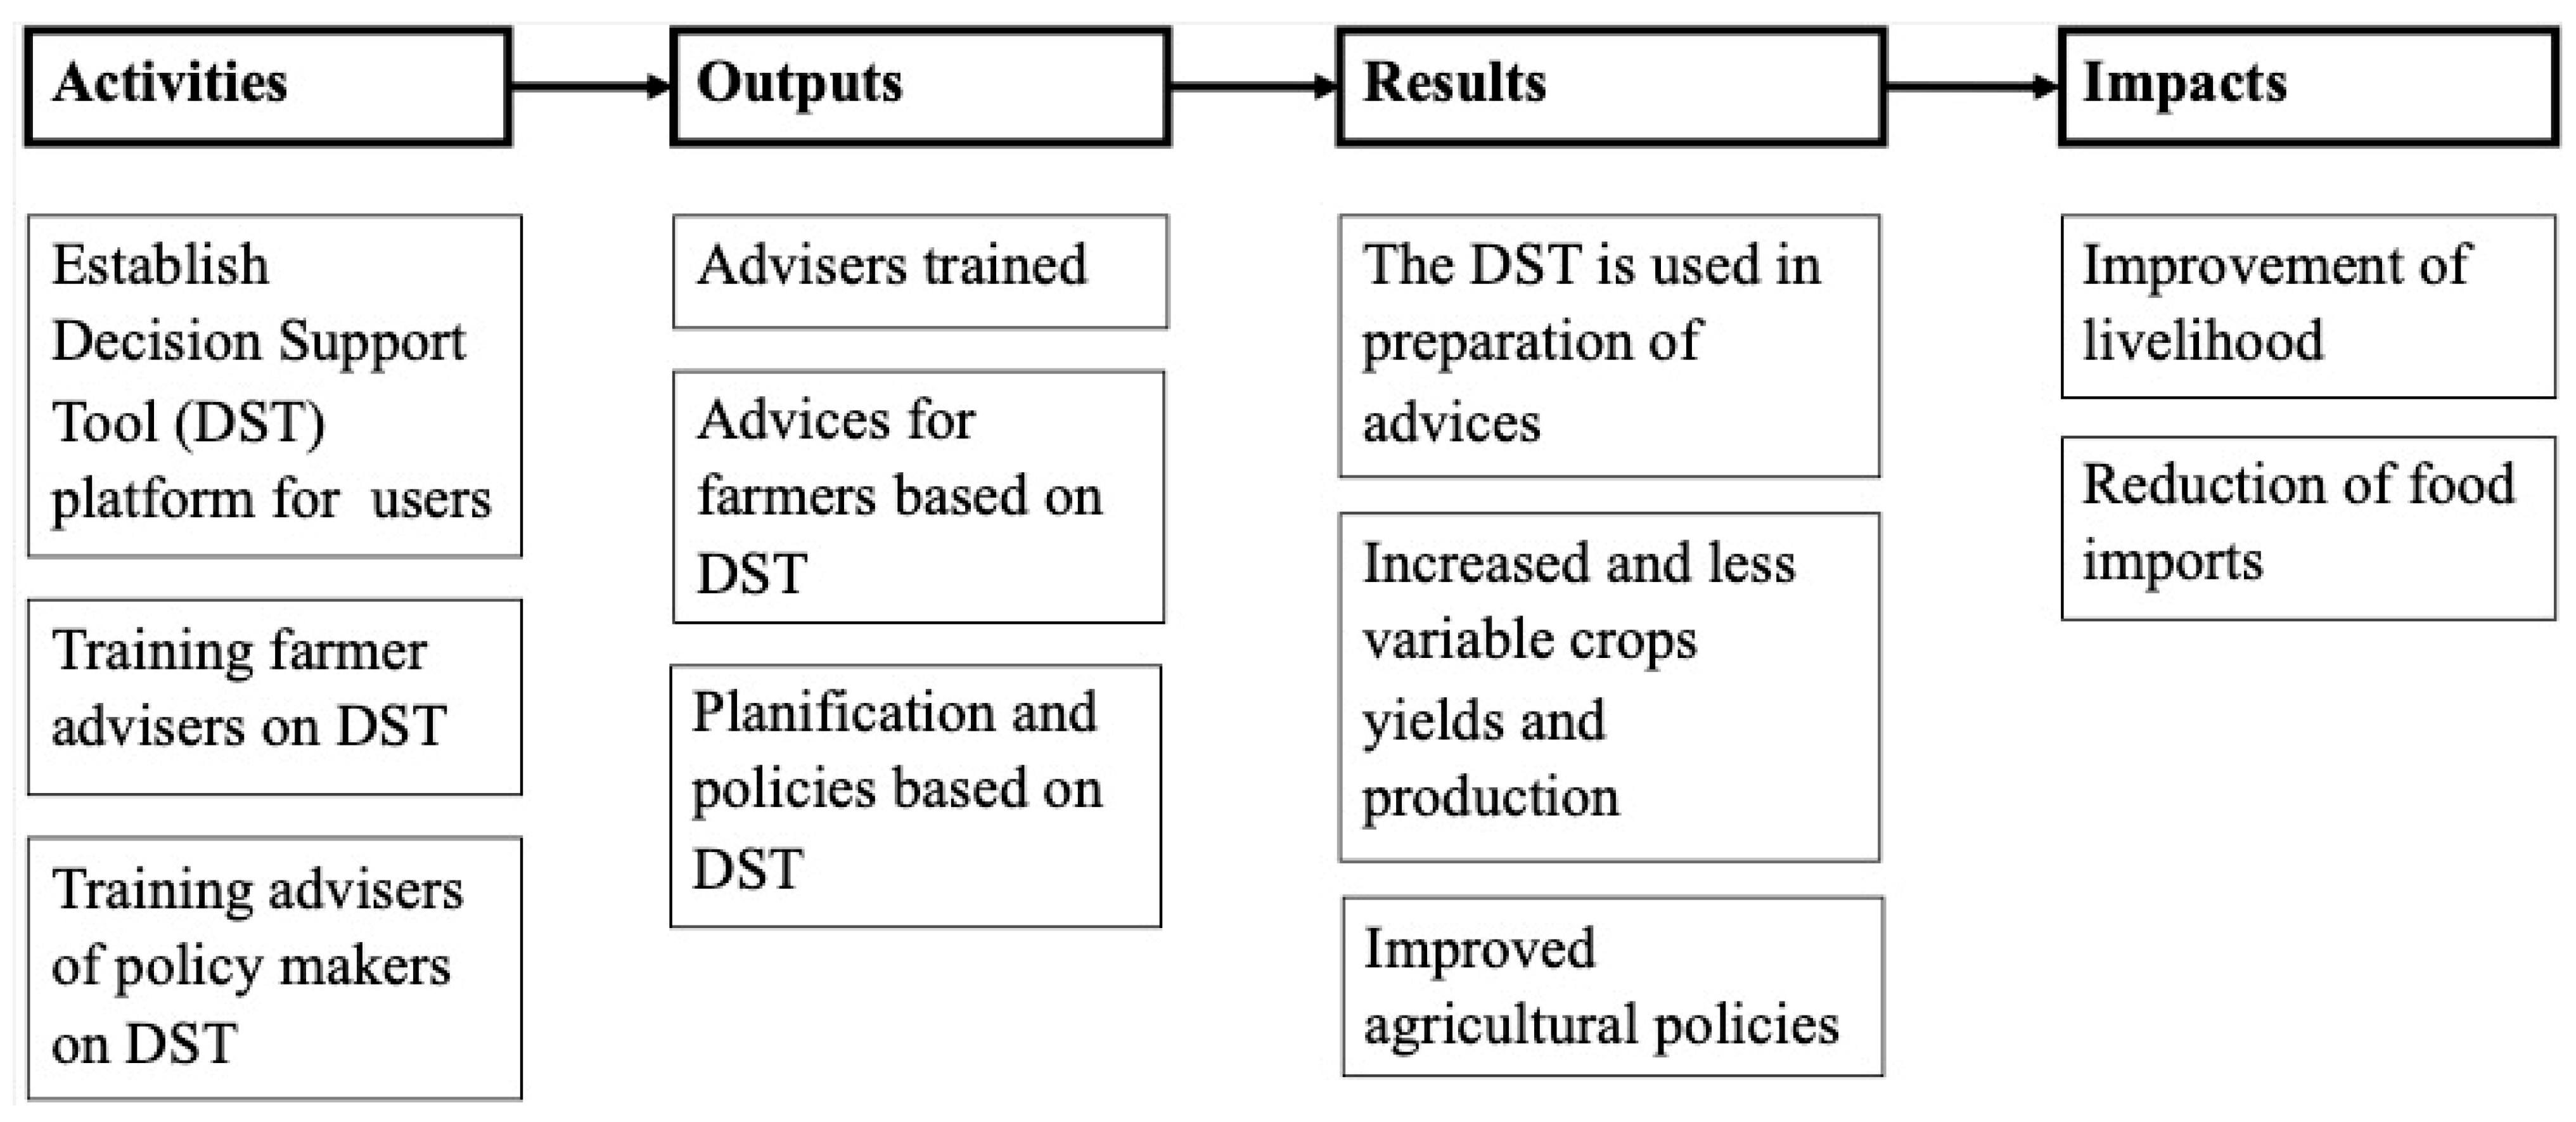
In this study, we conduct a series of crop simulation runs for millet, sorghum, peanut and rice to explore combinations of management options across different regions of Senegal. The aim is to identify strategies that can inform on-farm decision-making and support the development of policies aimed at increasing productivity and reducing yield variability. This work is grounded in the Theory of Change framework outlined in Appendix A Figure A1, which guides our approach to linking simulation-based insights with actionable outcomes for both farmers and policymakers.
Specifically, we use the DSSAT crop models [32] to answer the following research questions:

1.1. General Questions for the Four Crops

  • What are the gaps between current crop yield and attainable yields with crop management practices that maximize yields (planting dates, fertilizer, irrigation)?
  • How does the yield interannual variability change with improved practices?
  • What is the role of seasonal climate forecasts in adjusting crop management practices?
  • What is the profitability of investing in improved varieties, fertilizers and irrigation?

1.2. Millet and Sorghum

  • What is the impact of adjusting planting dates based on definitions of the onset of rainy season?
  • What is the optimal strategy for N fertilizer management?

1.3. Peanuts

  • What is the expected yield with varieties of different season lengths (long vs. short)?
  • What is the feasibility of peanut production in different regions?
  • What is the feasibility of irrigation for peanut production?

1.4. Rice

  • What is the suitability of rainfed rice in selected regions of Senegal?
  • What is the strategy for optimal N fertilizer management for rainfed rice?
  • What are the crop irrigation needs in different regions, using different production strategies (to inform investments in irrigation infrastructure)?
  • What is the feasibility of irrigated rice in single and double cropping systems in the Senegal River Valley?

2. Materials and Methods

2.1. Crop Simulation Models

We used the DSSAT version 4.7 crop models [32,33,34] that have been tested throughout the world and found to be robust tools for quantifying the impact of crop management practices on crop production [9,35]. Model calibration and performance evaluation were carried out using crop phenology, management and grain yields data obtained from research work in Senegal on millet, sorghum, peanut and rice. (The articles describing the calibration and testing of the DSSAT models that were used in this paper are presented in Appendix A Table A1, and the genetic coefficients used for each DSSAT crop model are shown in Appendix A Table A2.) In all simulations, we started the model runs several months before the rainy season normally starts, and we used soil water content at a permanent wilting point as the initial condition for the runs. Unless specified, the sowing date was determined following Han et al.’s [36] criteria (sow when the soil total plant available water content—TAW—reaches 30% of its maximum value, TAW = 30). For each crop, we used cultivars that had been previously calibrated and tested in Senegal (Appendix A Table A1 and Table A2).

2.2. Sites

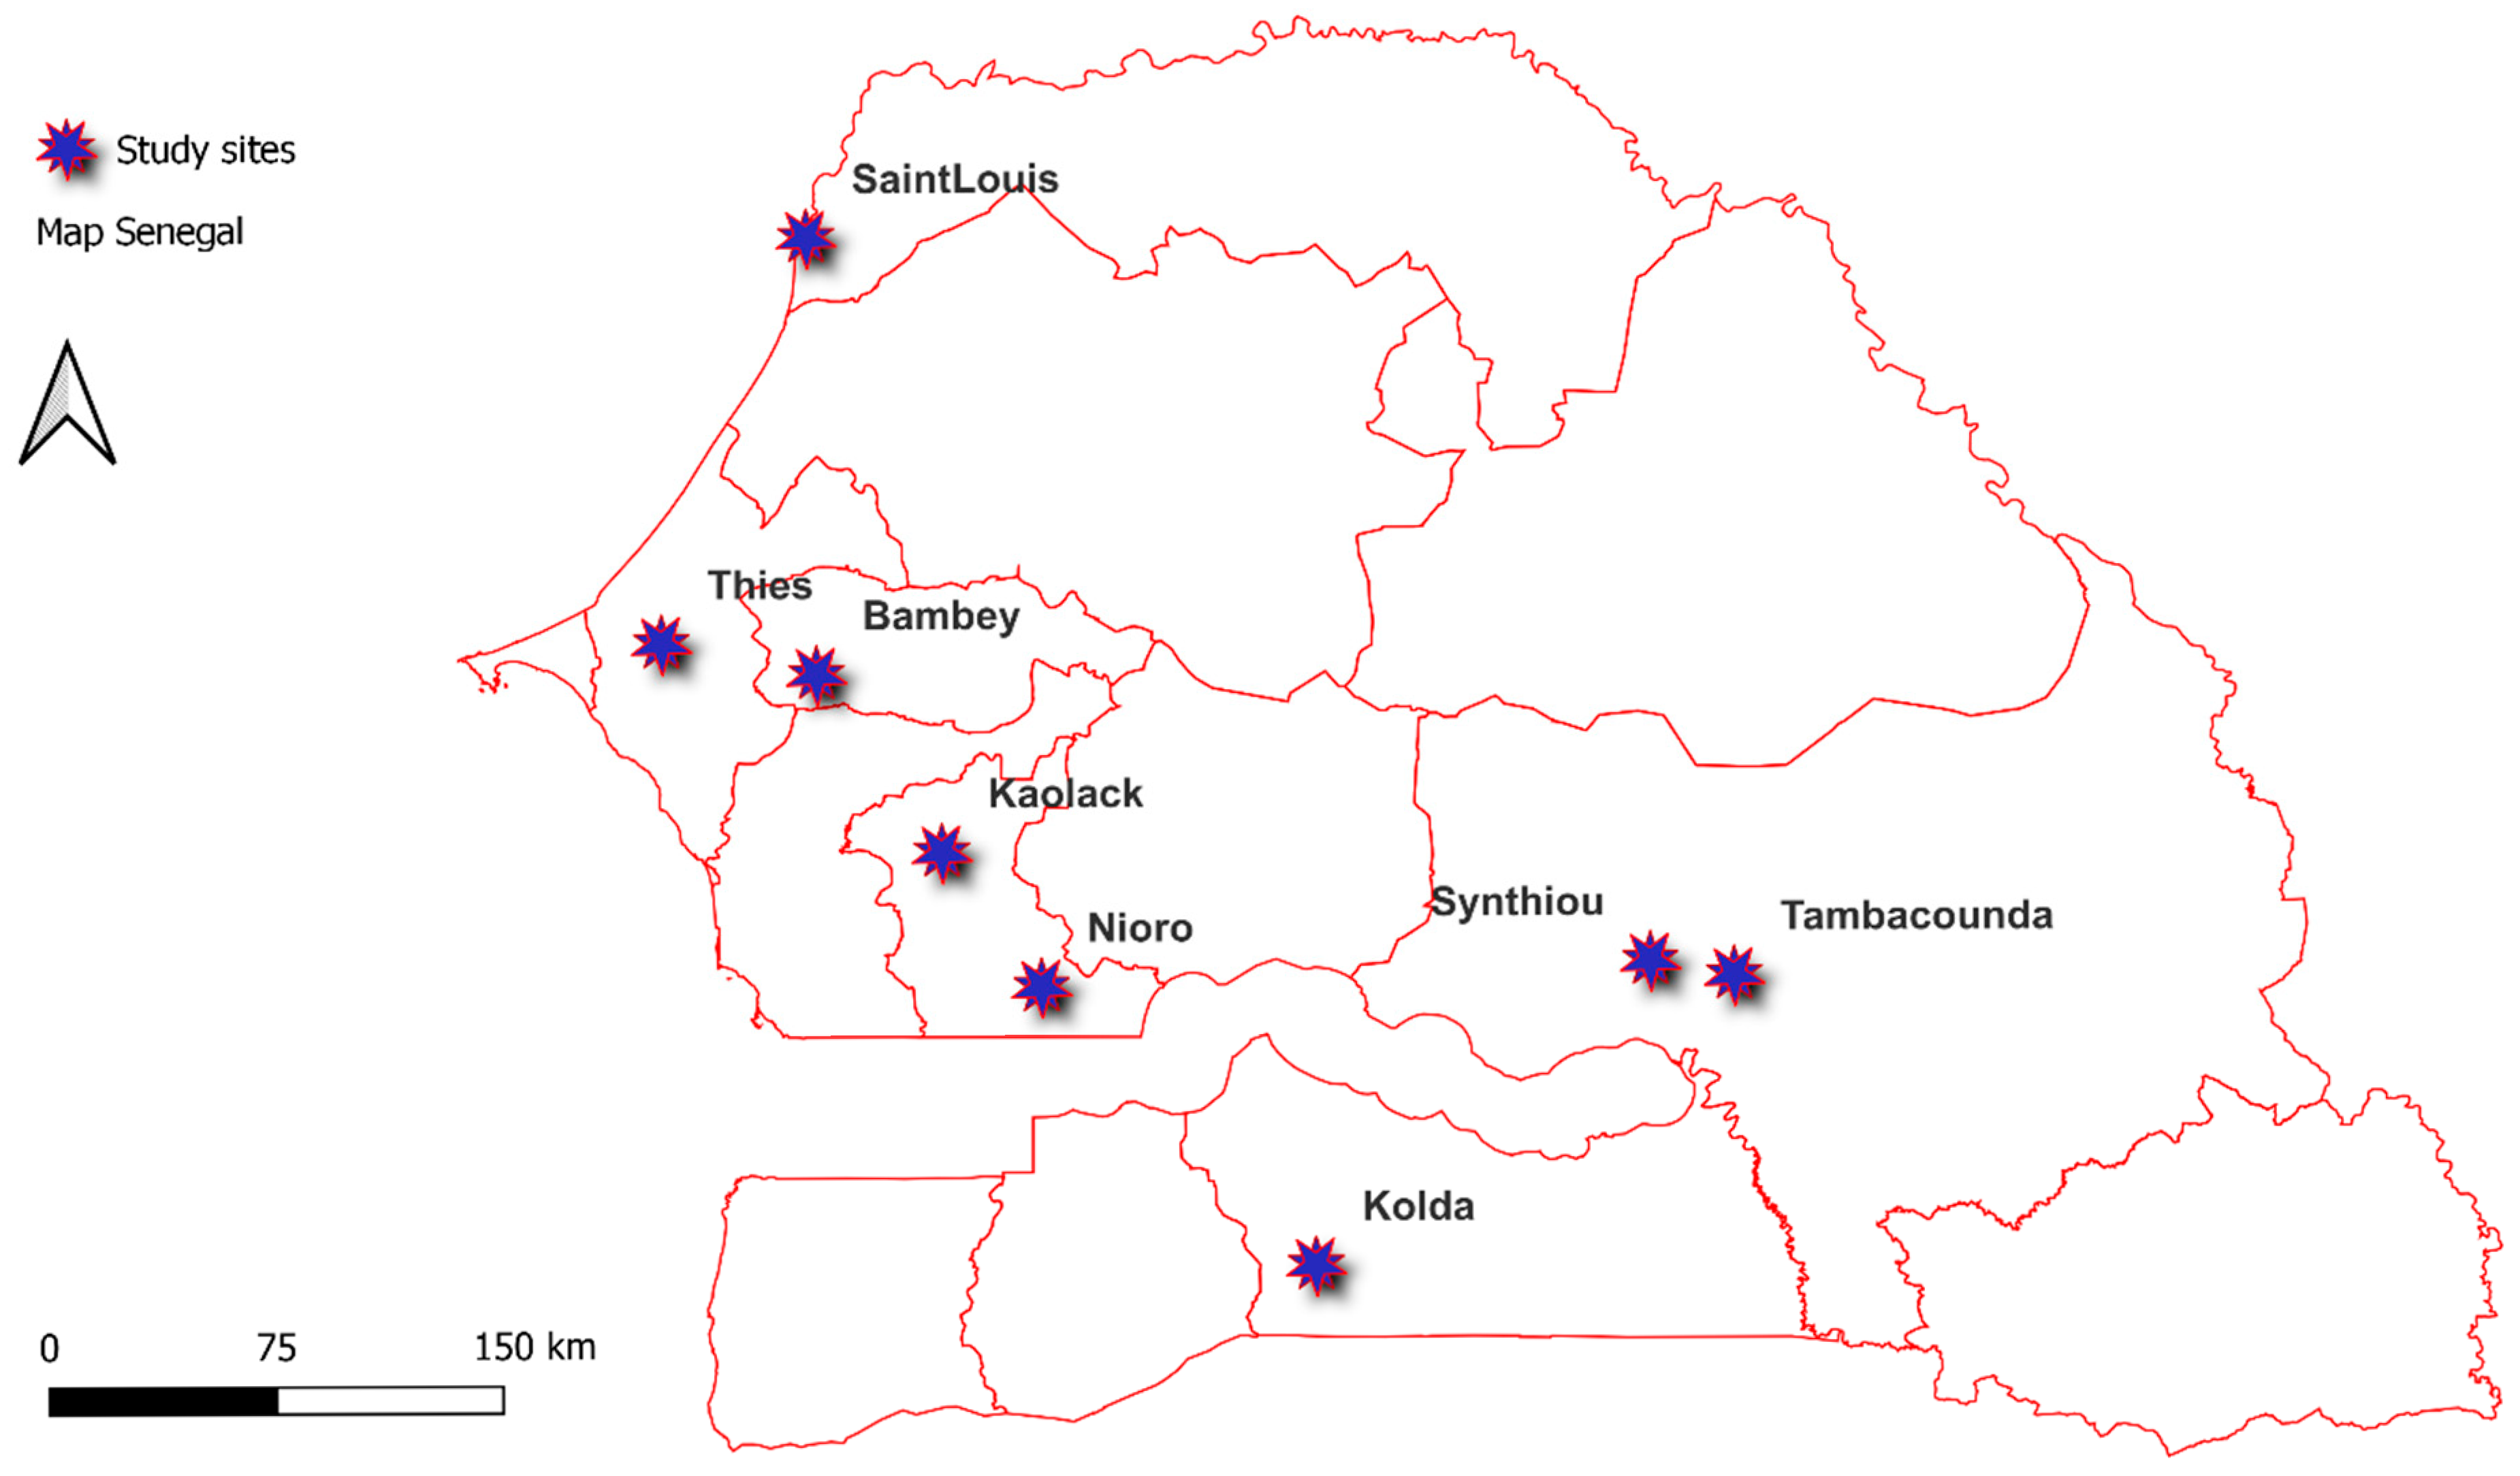
In this study, we selected ISRA’s four agricultural research experimental fields in Senegal, Bambey (14.71° N, 16.48° W), Nioro du Rip (13.76° N, 15.78° W), Sinthiou Maème (13.82° N, 13.9° W) and Kolda (12.88° N, 14.25° W), and four additional sites relevant for rice production (Appendix A Figure A3). Long-term weather data (i.e., daily maximum and minimum temperature, solar radiation and precipitation) from 1981 to 2018 were obtained from the ANACIM for defining meteorological onsets and for running the DSSAT millet, sorghum, peanut and rice models. The climate characteristics of the study sites are presented in Appendix A Figure A3.
In each study site, we used soils that are representative of those suitable for crop production and that represent the wide heterogeneity characteristic of Senegal: they are predominantly sandy in Bambey with a low water-holding capacity, while in Kolda, they are predominantly clayey with higher water holding capacity. Soils in Nioro and Sinthiou present an intermediate clayey-sandy texture. Due to agricultural practices and climatic conditions that cause wind and water erosion, land degradation has occurred in the different agroecological zones of Senegal. In addition, the removal of harvest residues typically for animal feed has accentuated the deterioration of soils due to net losses of organic carbon. Soils in the floodplains of the Senegal river valley are alluvial with high clay content and are locally described as Faux Hollaldé and Hollaldé.

2.3. Prices and Costs

Production costs and prices received by farmers used for the economic analyses in this article are presented in Appendix A (Table A4). The information was obtained from different available sources and checked by ISRA. The base production cost for all crops include labor, soil preparation, pesticides, herbicides and P and K fertilizers.

3. Results and Discussion

3.1. Yield Gaps of Sorghum and Millet

The model runs under ideal conditions—i.e., affected only by solar radiation and temperature, with no water or nutrient limitations—resulted in mean grain yields of 12–15 Mg/ha for sorghum and 9–10 Mg/ha for millet. Given the short rainy season characteristic of much of Senegal, “potential yields” under such ideal conditions were considered too far off from realistically attainable yields in the field. Consequently, we defined “potential yield” as the attainable grain yield under observed rainfall conditions but without nutrient deficiencies. (In this paper, we define “potential,” “optimal,” “N-limited” yields in different ways for different crops. Table A3 in the Appendix A summarizes these definitions for each crop.) In practical terms, this would require applying fertilizers whenever the crop shows signs of deficiency. While such intensive nutrient management is not feasible in the field, it provides a useful benchmark for the climate-based potential sorghum yield for evaluating the conceivable benefits of improved fertilizer practices. Among nutrients, phosphorus (P) and potassium (K) management tends to be more straightforward than nitrogen (N). Soil tests for P and K can be calibrated to specific soil types, and these nutrients typically have some residual effect, meaning they are not entirely lost if not taken up by the current crop. In contrast, N has little to no residual effect—any N not absorbed by the crop is often lost through leaching, runoff or denitrification. For this reason, our analysis focused on N management, assuming that P and K were non-limiting. We compared “potential yields” under no N limitation to simulated yields obtained using relatively high N fertilizer rates applied at three key crop growth stages. This approach allowed us to assess both the potential for yield improvement and the effectiveness of different N management strategies.

3.1.1. Sorghum Yield Gap

Optimal N fertilizer management in this study was defined as applying 20 kg N/ha at sowing, 20 kg N/ha 36 days after sowing and 60 kg N/ha at panicle initiation (51 days after sowing). Grain yields obtained with this N fertilizer strategy were defined as “optimal yields.” In Bambey—a location characterized by severe water limitations—the difference between “potential” and “optimal” yields was minimal, suggesting that nitrogen availability was not the primary constraint to achieving higher yields (Figure 1a). In contrast, results from the wetter locations—Kolda, Nioro and Sinthiou—indicate that improved N fertilizer management could significantly enhance grain yields. In these regions, “potential” sorghum yields were 40–80% higher than those achieved under the “optimal” nitrogen regime (Figure 1a), highlighting a substantial yield gap attributable to nitrogen limitations. Possible strategies for optimizing nitrogen management in these environments are discussed in a later section.

3.1.2. Millet Yield Gap

Optimal fertilizer management for millet was defined as applying 20 kg N/ha at sowing, 20 kg N/ha 20 days after sowing (near panicle initiation) and 30 kg N/ha 45 days after sowing (approximately 10 days before anthesis). Similar to the findings in sorghum, millet grain yield response to eliminating the N deficiencies in the “potential” yields were 80–100% higher than the “optimal” fertilizer strategies. Unlike sorghum, in the case of millet, even in the water limited location (Bambey), removing N deficiencies also resulted in important grain yield gains (Figure 1b). Millet is well adapted to low soil water content, and therefore, N response is evident even in environments with high water deficiencies such as Bambey.

3.2. Peanut Yield Gap

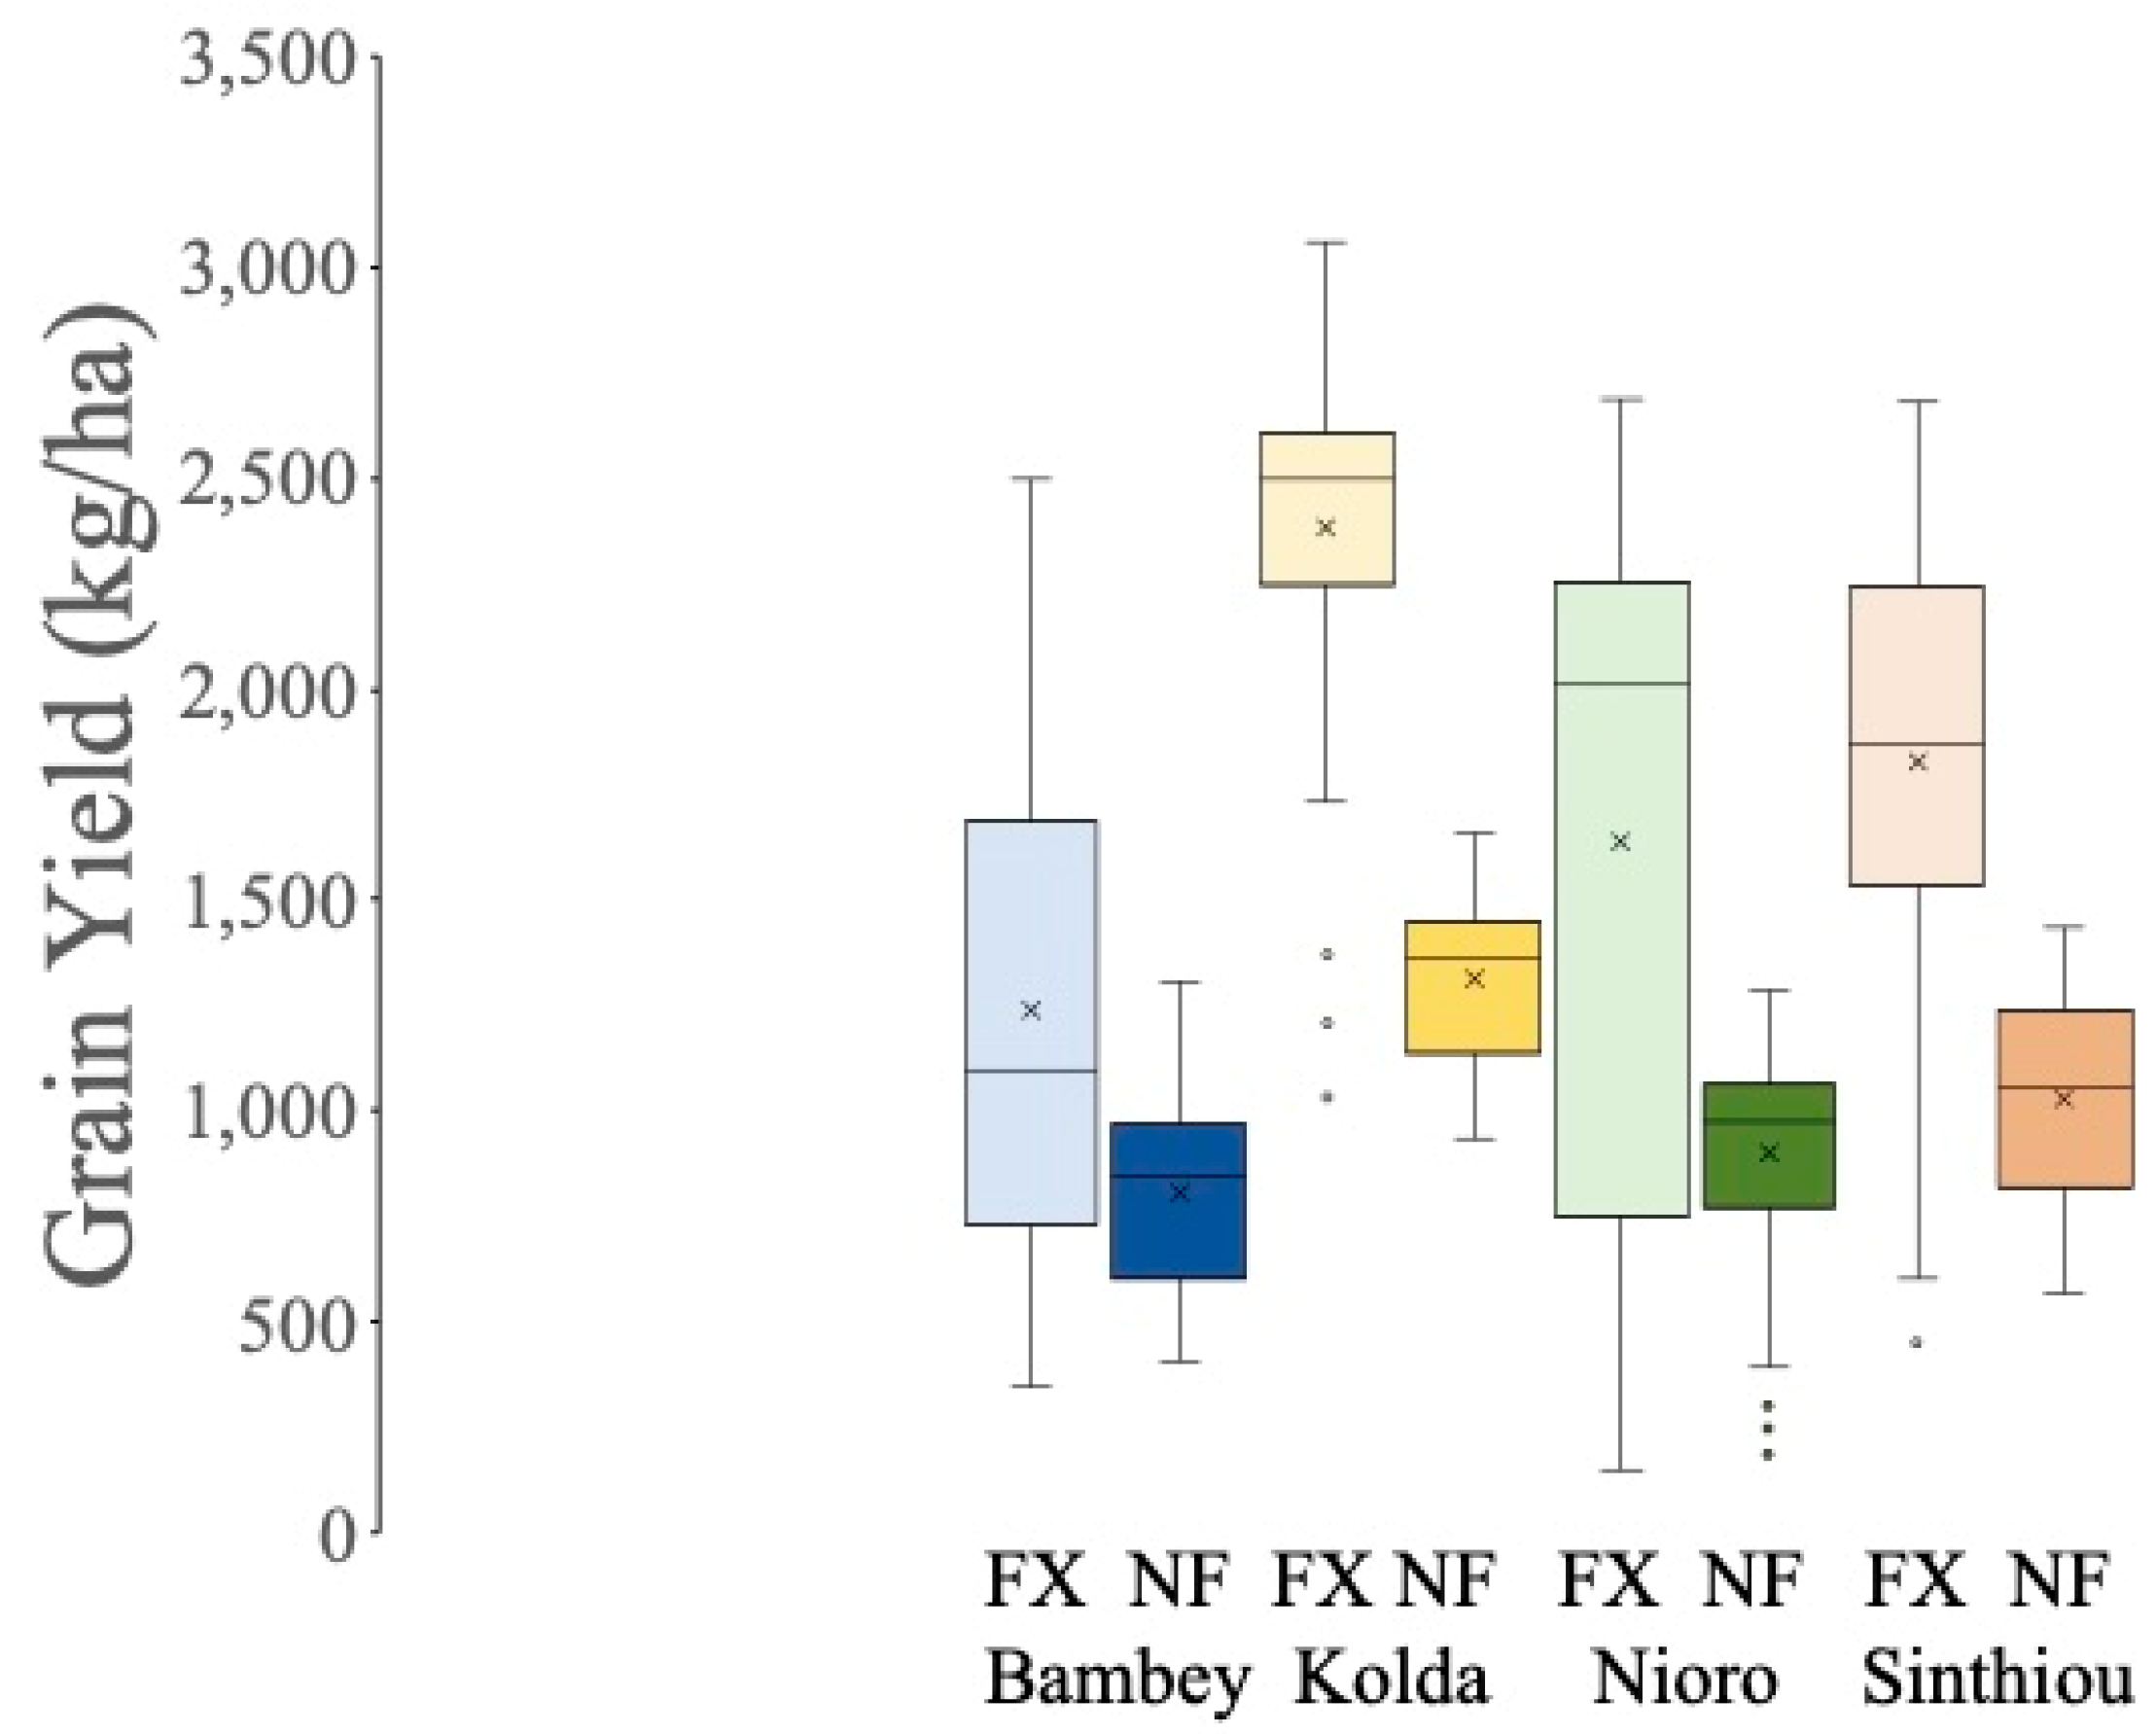
Following a similar criterion as for sorghum and millet, “potential” peanut yield was defined as the yield attainable with observed rainfall and temperature and with full symbiotic nitrogen (N) fixation capacity—i.e., when all of the nitrogen required for crop growth and development is supplied through symbiotic fixation. This ideal scenario was compared to the more frequent N-limited situation in which symbiotic fixation falls short and does not provide the total N demand over the growing season (in our case, we simulated the provision of 60% of the total N demand through symbiotic fixation). The results, presented in Figure 2, highlight the critical role of effective symbiotic N fixation: peanut yields were 20–100% higher under full symbiotic fixation conditions. As expected, the greatest yield response was observed in Kolda, the location with the highest rainfall, where favorable moisture conditions likely enhanced the efficiency of N fixation and overall crop performance.

3.3. Rice Yield Gap

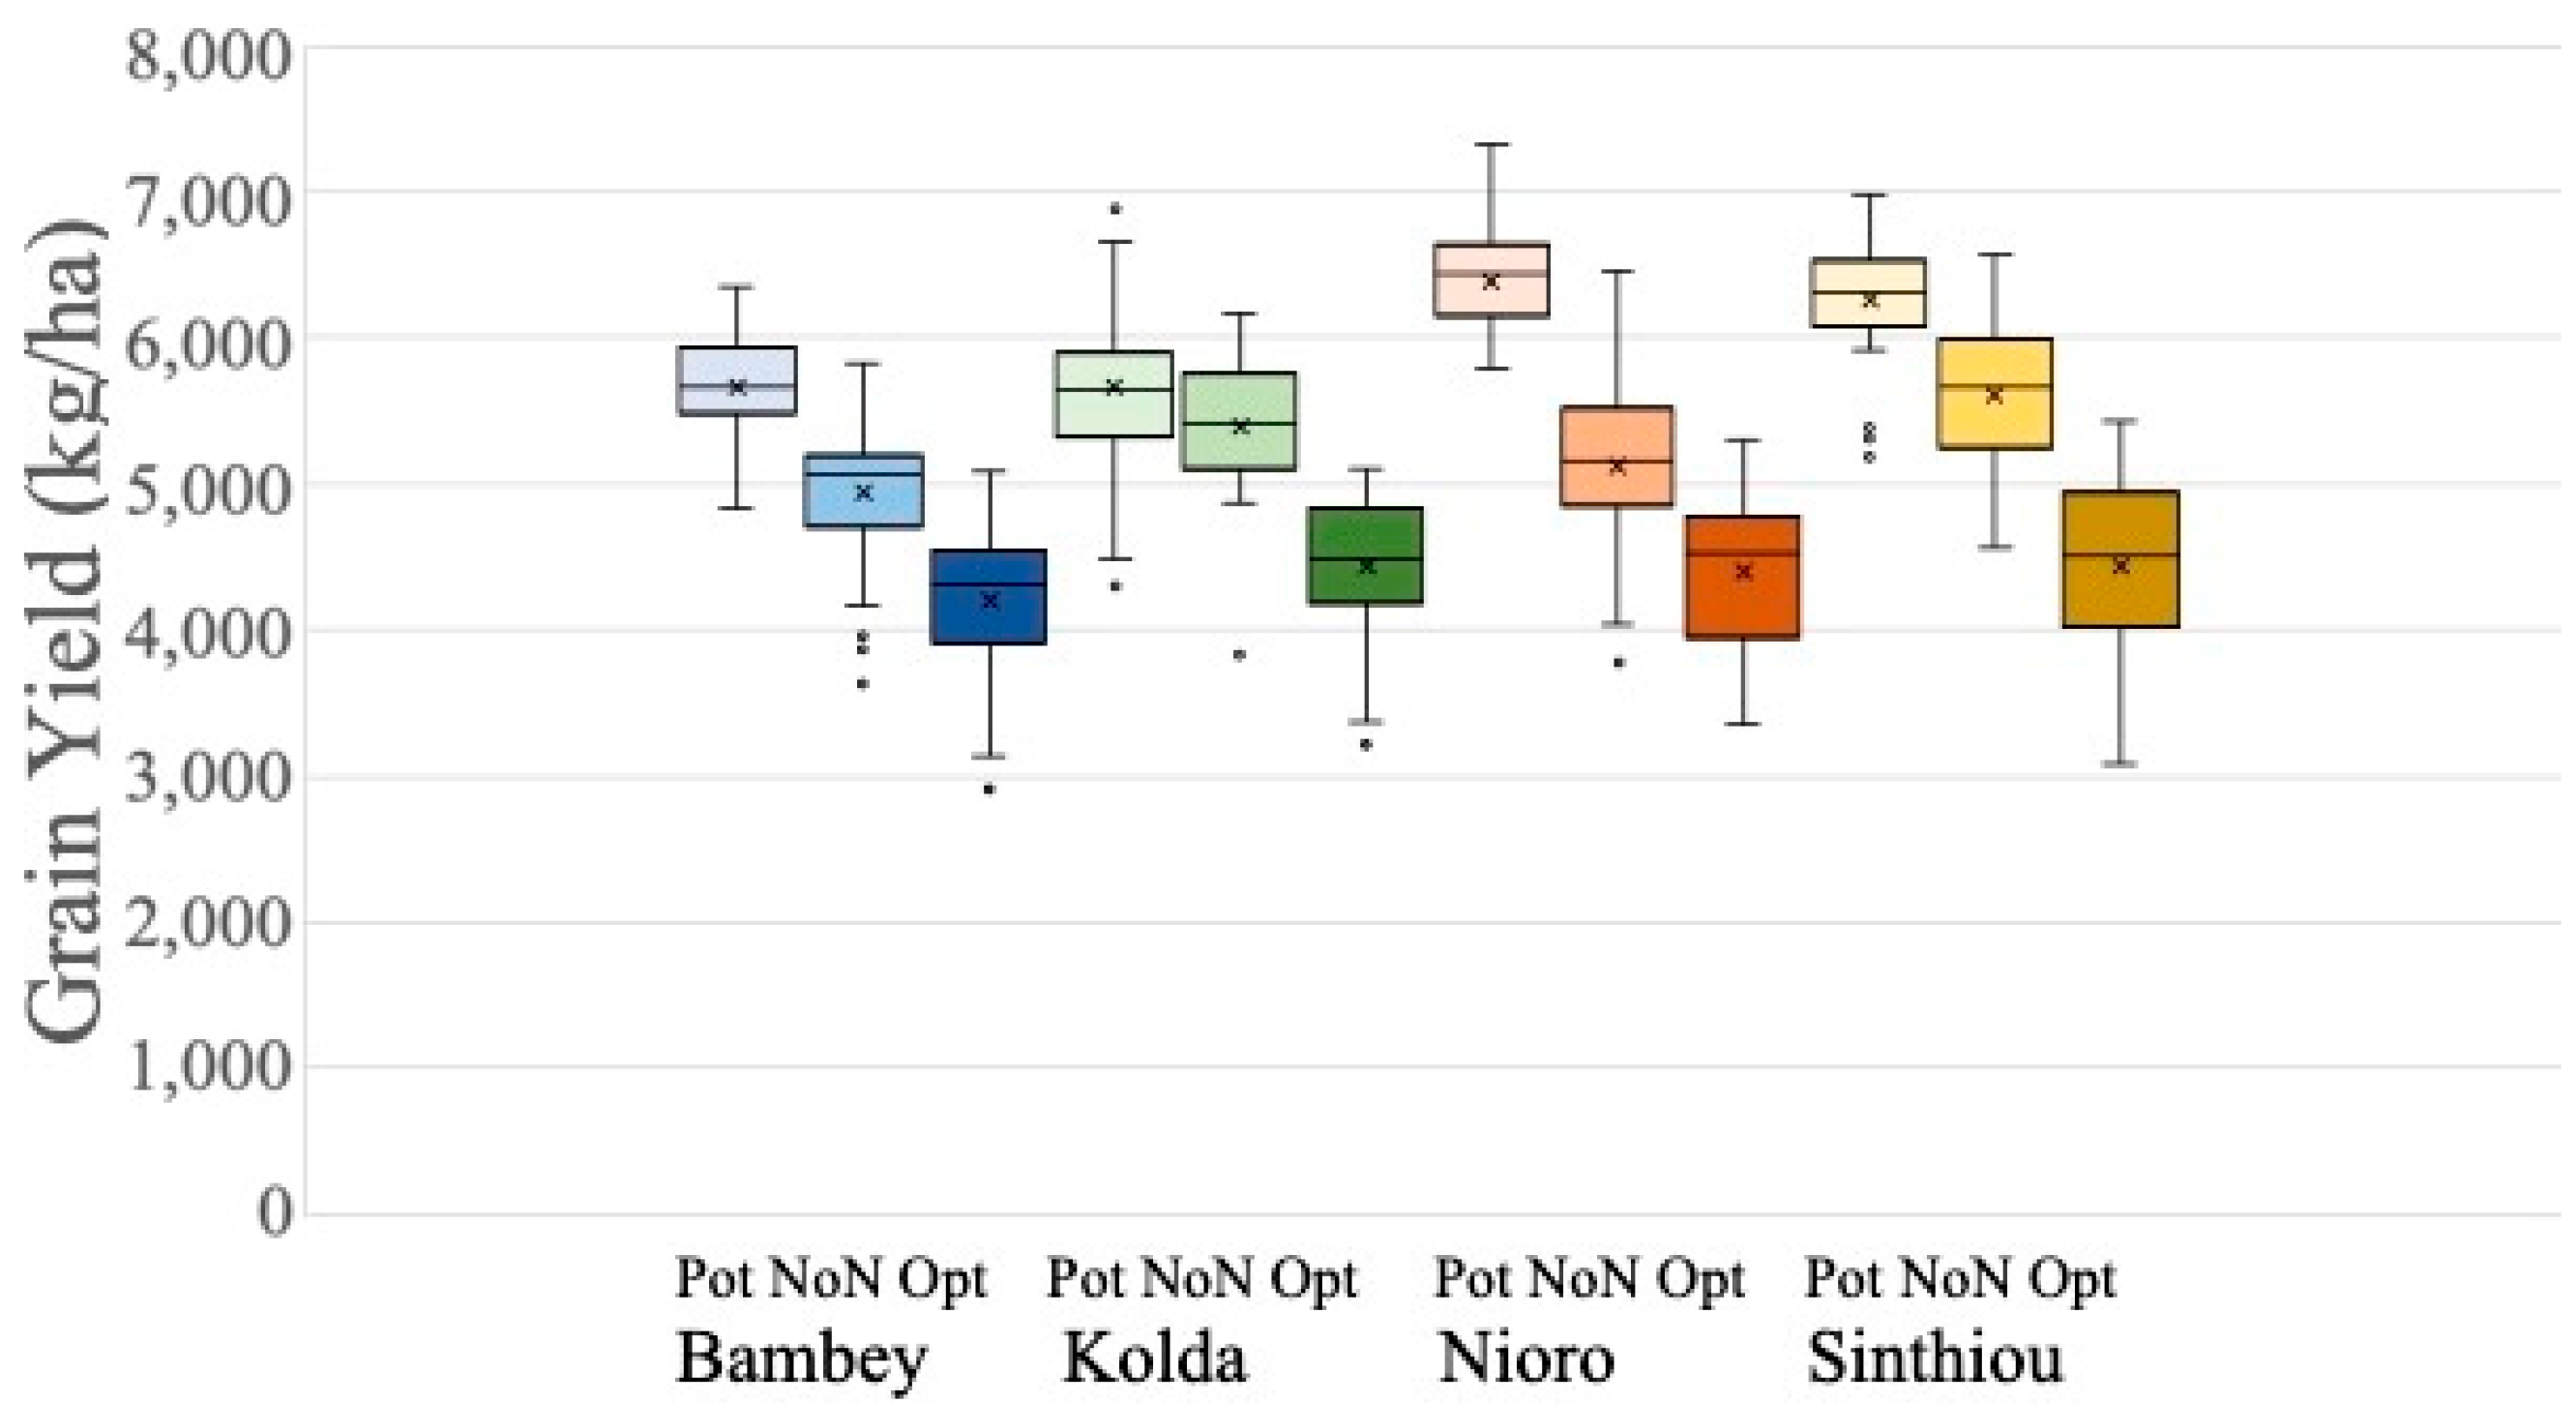
To estimate yield gaps in rice, we analyzed three scenarios: (1) potential yield—with no water or N limitations; (2) no N limitation—with optimal irrigation and unlimited nitrogen; and (3) optimal yield—with optimal irrigation and N fertilizer applied at 30 kg N/ha at three growth stages: sowing, 25 days after sowing (DAS) and 45 DAS. “Optimal irrigation” was defined as applying 10 mm of water whenever soil moisture dropped below 50% of the total available water (TAW).
The results underscore the critical importance of optimizing both irrigation and nitrogen management. In most locations, improved water use alone led to an approximate 20% increase in grain yield, while optimized nitrogen application contributed an additional 20% yield gain (Figure 3). The only exception was Kolda, the rainiest site, where enhancing water management beyond the tested strategy had little to no effect, likely due to sufficient natural rainfall.

3.4. Optimal N Fertilizer Recommendations for Sorghum and Millet

3.4.1. Sorghum

We evaluated the yield response of sorghum and millet using optimal planting dates. Our definition of the “optimal planting date” was guided by the findings of Han et al. [36], who identified the onset of the rainy season as the date when soil water content reaches 30% of the total plant-available water (TAW) in the soil. Based on this criterion, we used the DSSAT model’s automated planting function to initiate sowing when the soil moisture reached this threshold. To validate or refine this approach, we also tested an alternative definition of optimal planting—using a higher soil moisture threshold of 95% TAW (i.e., almost field capacity), which delayed planting by 10 to 20 days. The results confirmed that the 30% TAW threshold remains the most effective criterion for defining optimal planting dates, aligning with Han et al.’s [36] definition of the onset of rains (Appendix A Table A4). Subsequently, the response to nitrogen fertilizer was evaluated based on this confirmed definition of the optimal planting date.
We studied the sorghum response to N fertilizer applied at three growth stages: at sowing, 36 days after sowing (DAS) and at panicle initiation (51 DAS). The design of the simulation experiments allowed us to study the sorghum response to N applied at each one of those three growth stages and to identify optimal combinations of application rates and timing.
Sorghum responded positively to nitrogen (N) fertilizer applications at sowing and at 36 days after sowing (DAS), but the strongest yield response was observed when fertilizer was applied near panicle initiation (51 DAS). Given the frequency of intense rainfall events during the growing season—which can lead to significant N losses through leaching and runoff—splitting fertilizer applications is a reasonable strategy to reduce these losses. The first two applications (at sowing and 36 DAS) support early crop establishment and vegetative growth, a phase during which the crop’s N demand is relatively low but critical for proper development. The third application, just before panicle initiation, coincides with the crop’s peak growth period and highest N demand, explaining the particularly strong yield response at this stage. These results highlight the potential for a growth stage–specific N recommendation system, such as the one proposed by [37] for barley, which combines plant and soil indicators. Analysis of 35 years of data across four locations suggests that the most effective fertilizer strategy involves applying 20 kg N/ha at sowing and 20 kg N/ha around 30 DAS and then adjusting the third application—just before panicle initiation—based on location-specific factors and expected seasonal rainfall (Table 1). We also found a significant correlation between the onset of the rainy season and total seasonal rainfall: for every 10-day delay in onset, total rainfall decreases by approximately 65–80 mm. This relationship, along with seasonal climate forecasts—such as those provided by the IRI (International Research Institute for Climate and Society, Columbia University)—can inform adaptive nitrogen management. Table 3a summarizes sorghum fertilizer recommendations tailored to expected rainfall conditions.
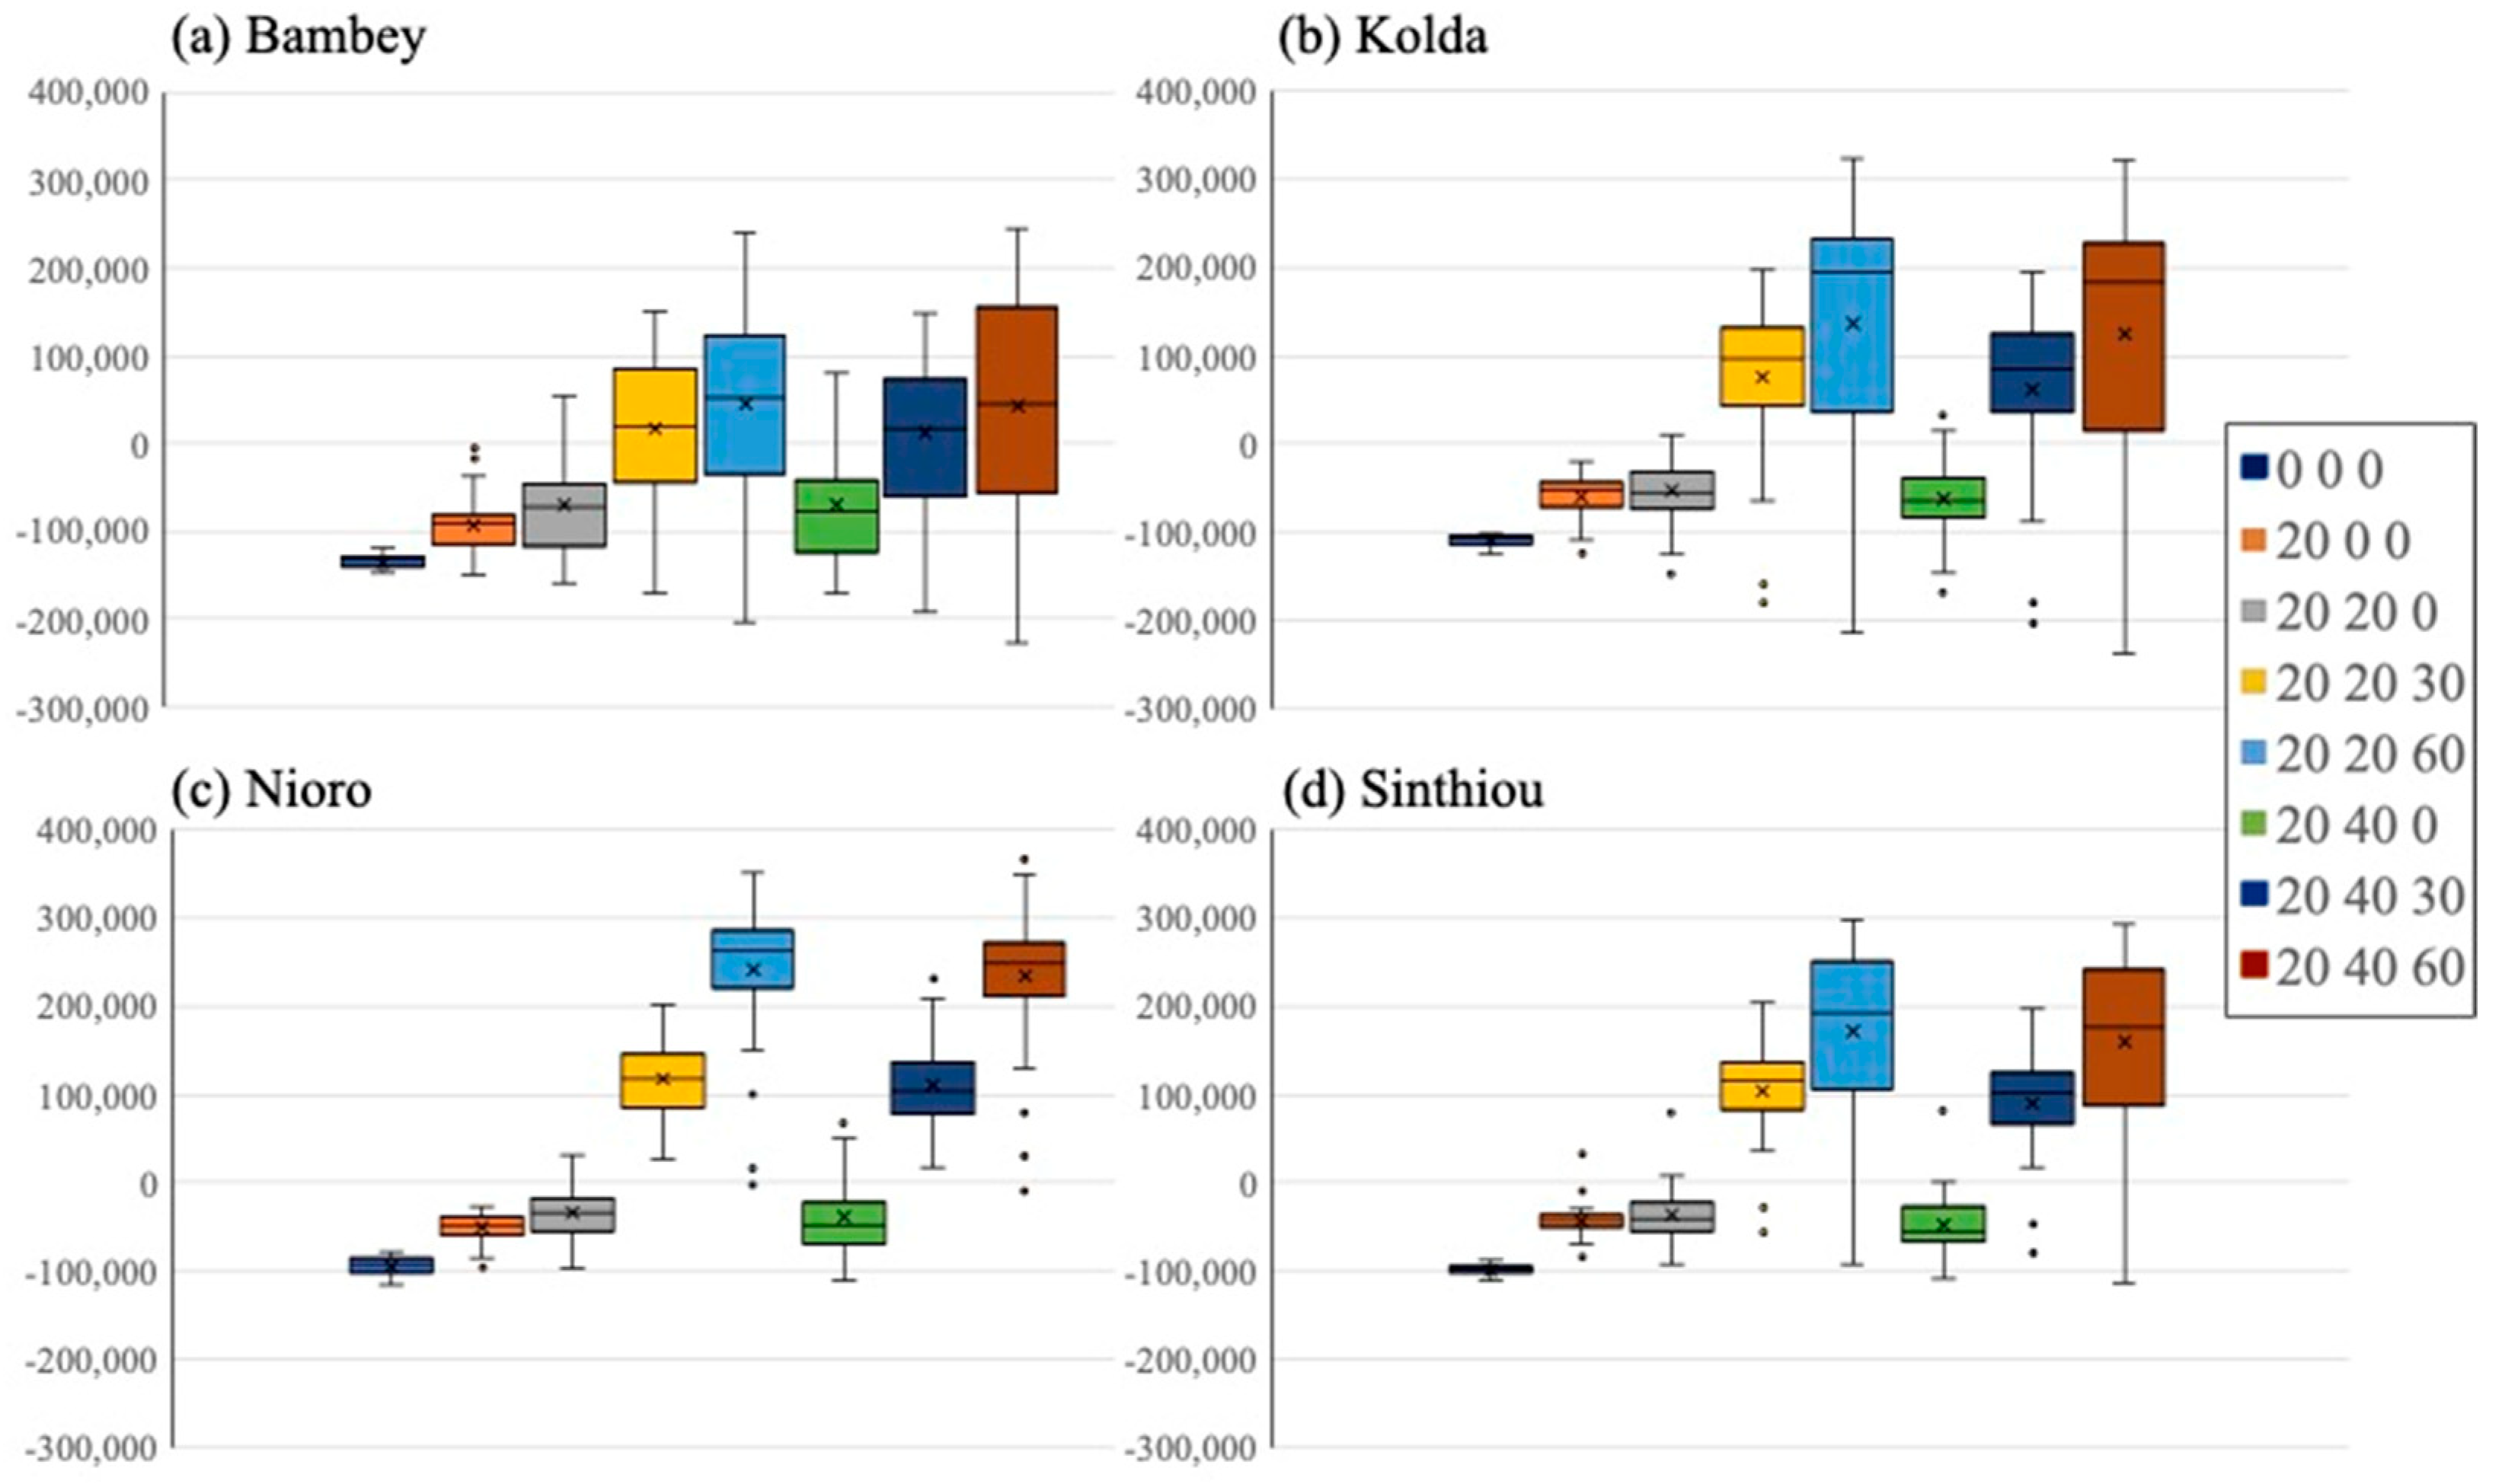
We then conducted an economic analysis of different nitrogen (N) fertilization strategies using the 2024 market prices for sorghum (as received by farmers), the base cost of sorghum production (excluding N fertilizer) and the prevailing price of N fertilizer. Gross margins were calculated for each fertilization strategy to assess economic viability. As shown in Figure 4, omitting N application at panicle initiation (51 DAS) frequently resulted in negative economic outcomes. In contrast, the application of N at panicle initiation consistently yielded the highest economic returns, underscoring the importance of this growth stage for optimizing profitability. Furthermore, increasing N rates beyond 20 kg/ha at sowing or 36 DAS—whether through single applications (e.g., 20-40-0 vs. 20-20-0) or split applications (e.g., 20-40-60 vs. 20-20-60)—did not lead to improved economic performance. These findings suggest that the most efficient fertilization strategy balances agronomic response with cost-effectiveness, with particular emphasis on the timely application of N at panicle initiation.

3.4.2. Millet

We also analyzed millet’s response to nitrogen (N) fertilization using optimal sowing dates tailored to each location. As with sorghum, we compared the optimal planting threshold defined by Han et al. [36]—where sowing occurs when plant-available water in the soil (TAW) reaches 30%—with a more conservative approach that delays sowing until TAW reaches 95%, following additional rainfall events. The results confirmed that the 30% TAW threshold resulted in superior performance: higher and more stable grain yields, as well as planting dates that were 10–20 days earlier (Table 2).
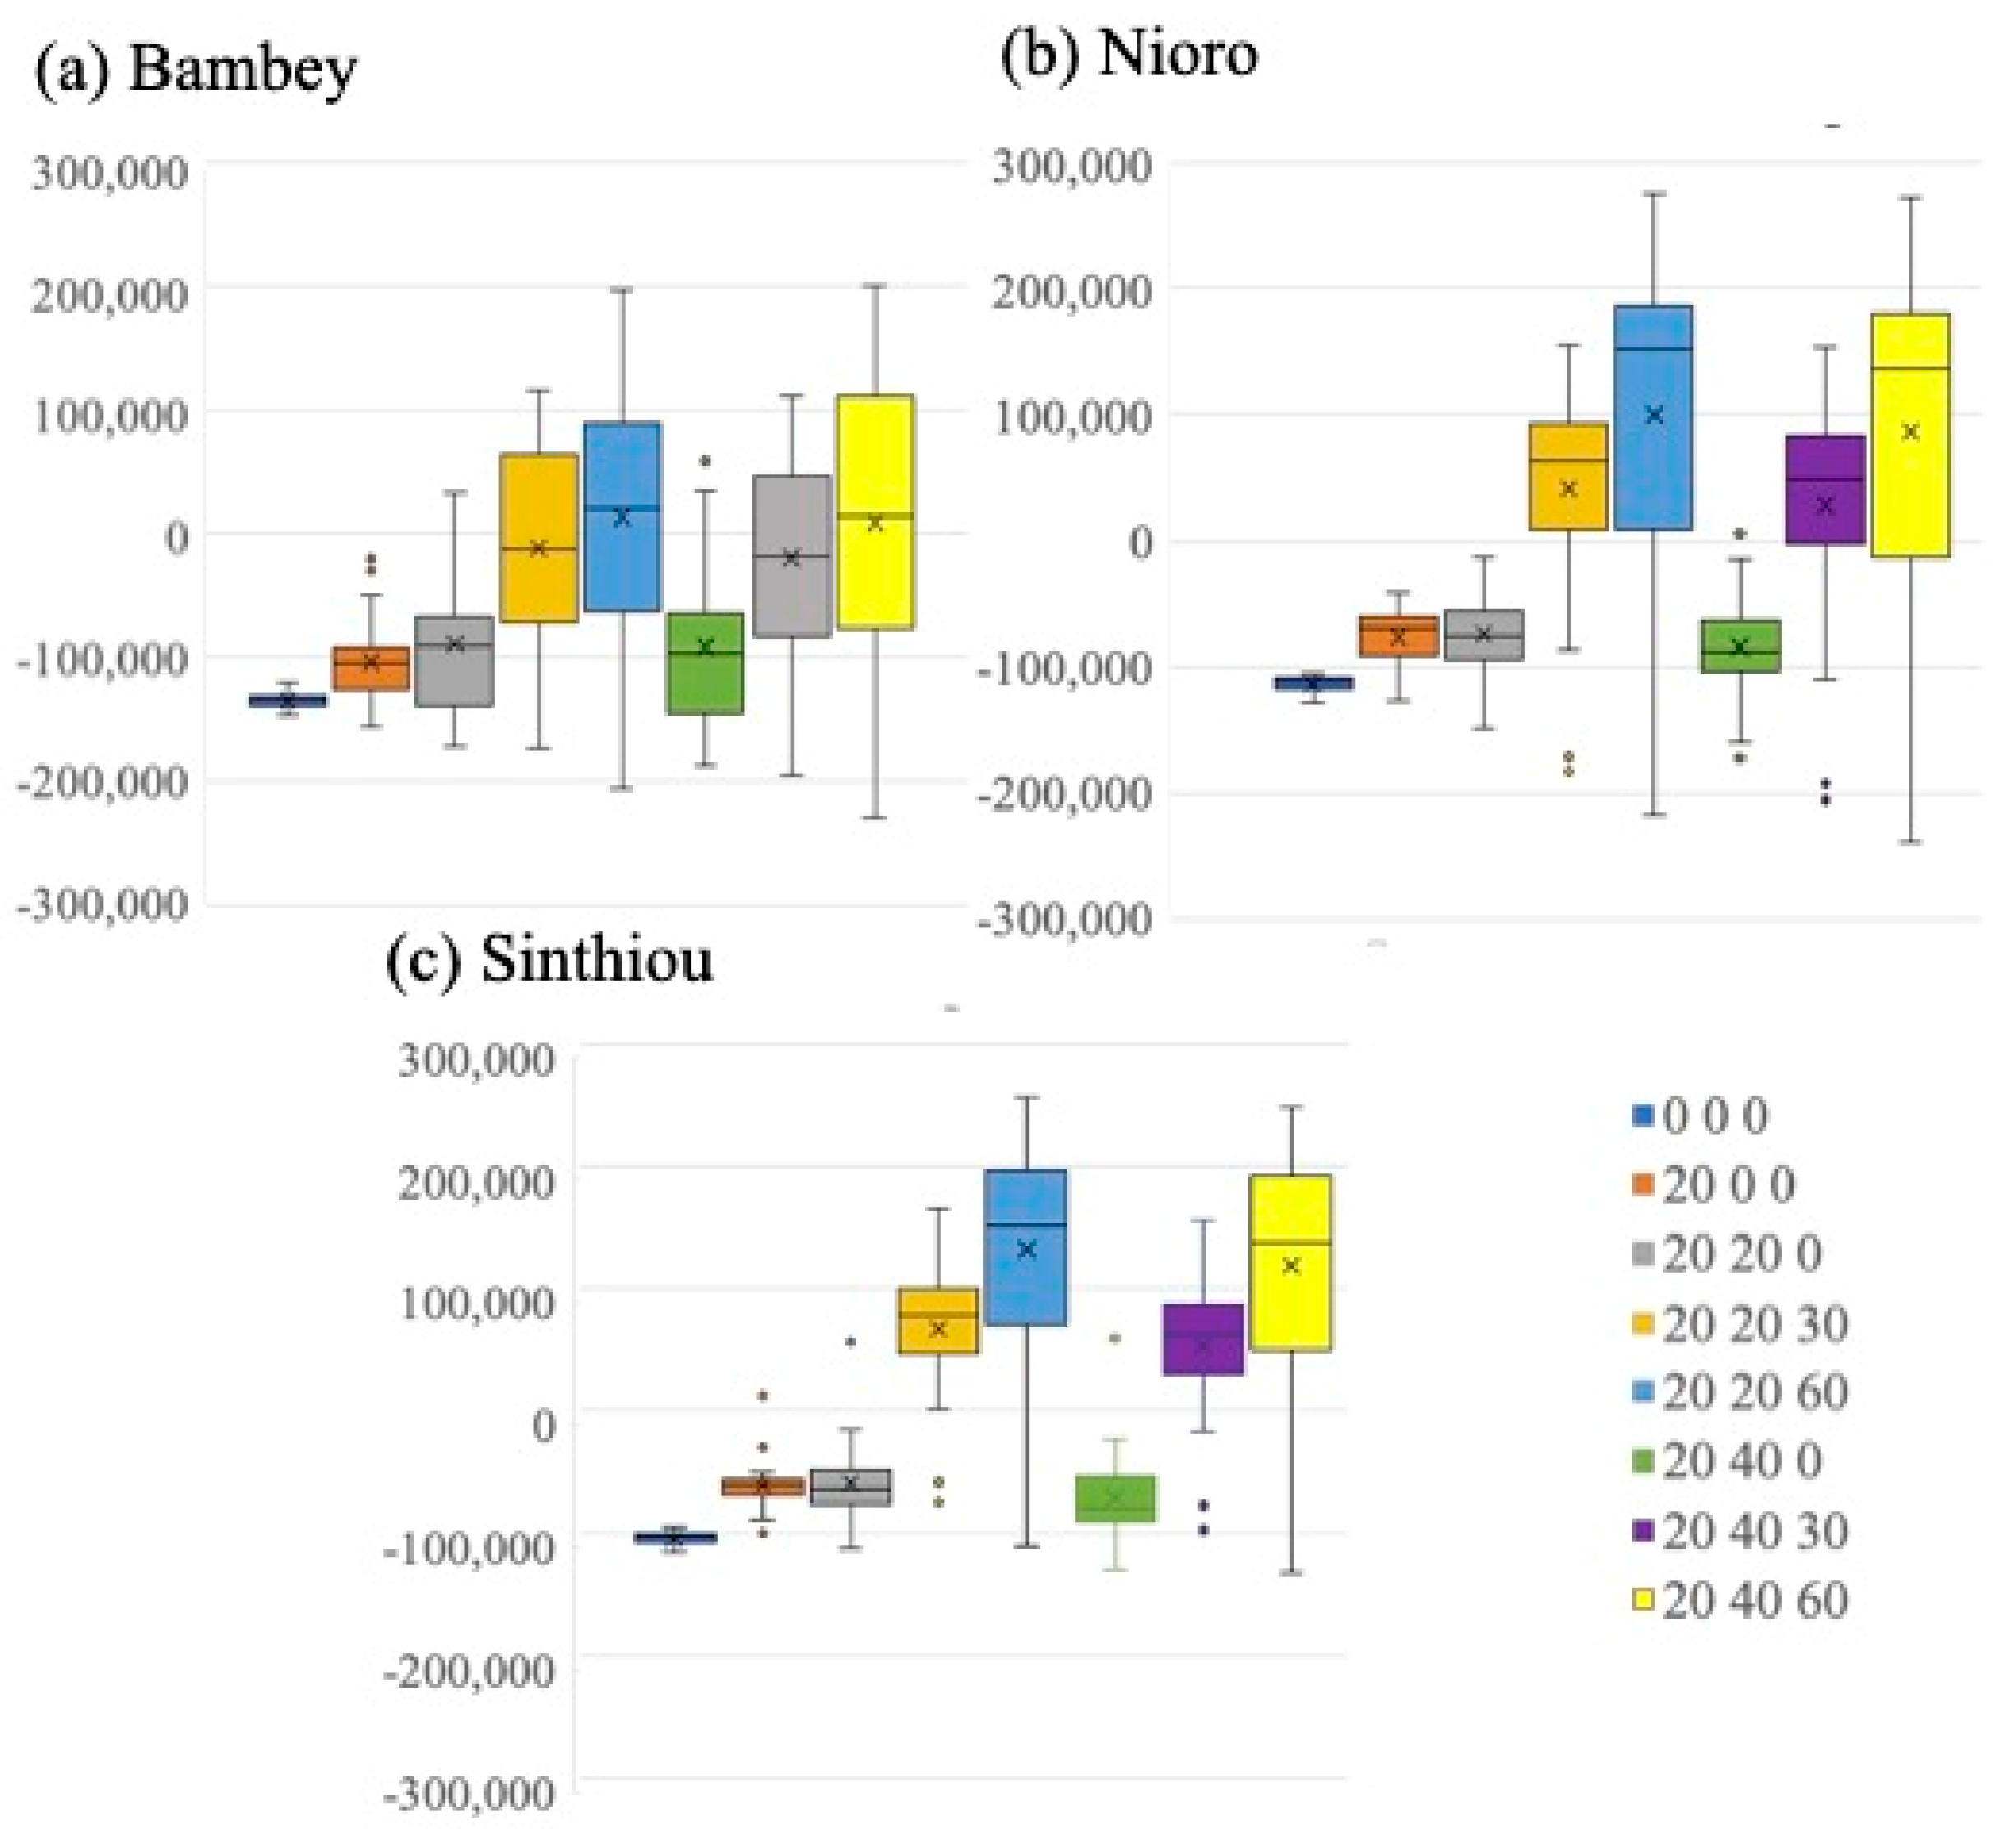
Millet’s response to N fertilizer rates and application timing closely mirrored that of sorghum. Moderate N applications—20 kg N/ha at sowing and 20 DAS (near panicle initiation)—were essential for proper crop establishment and early growth. However, the most pronounced yield response was observed with an application at 45 DAS, just before anthesis, indicating that this growth stage is critical for optimizing N uptake and grain production (Figure 5).
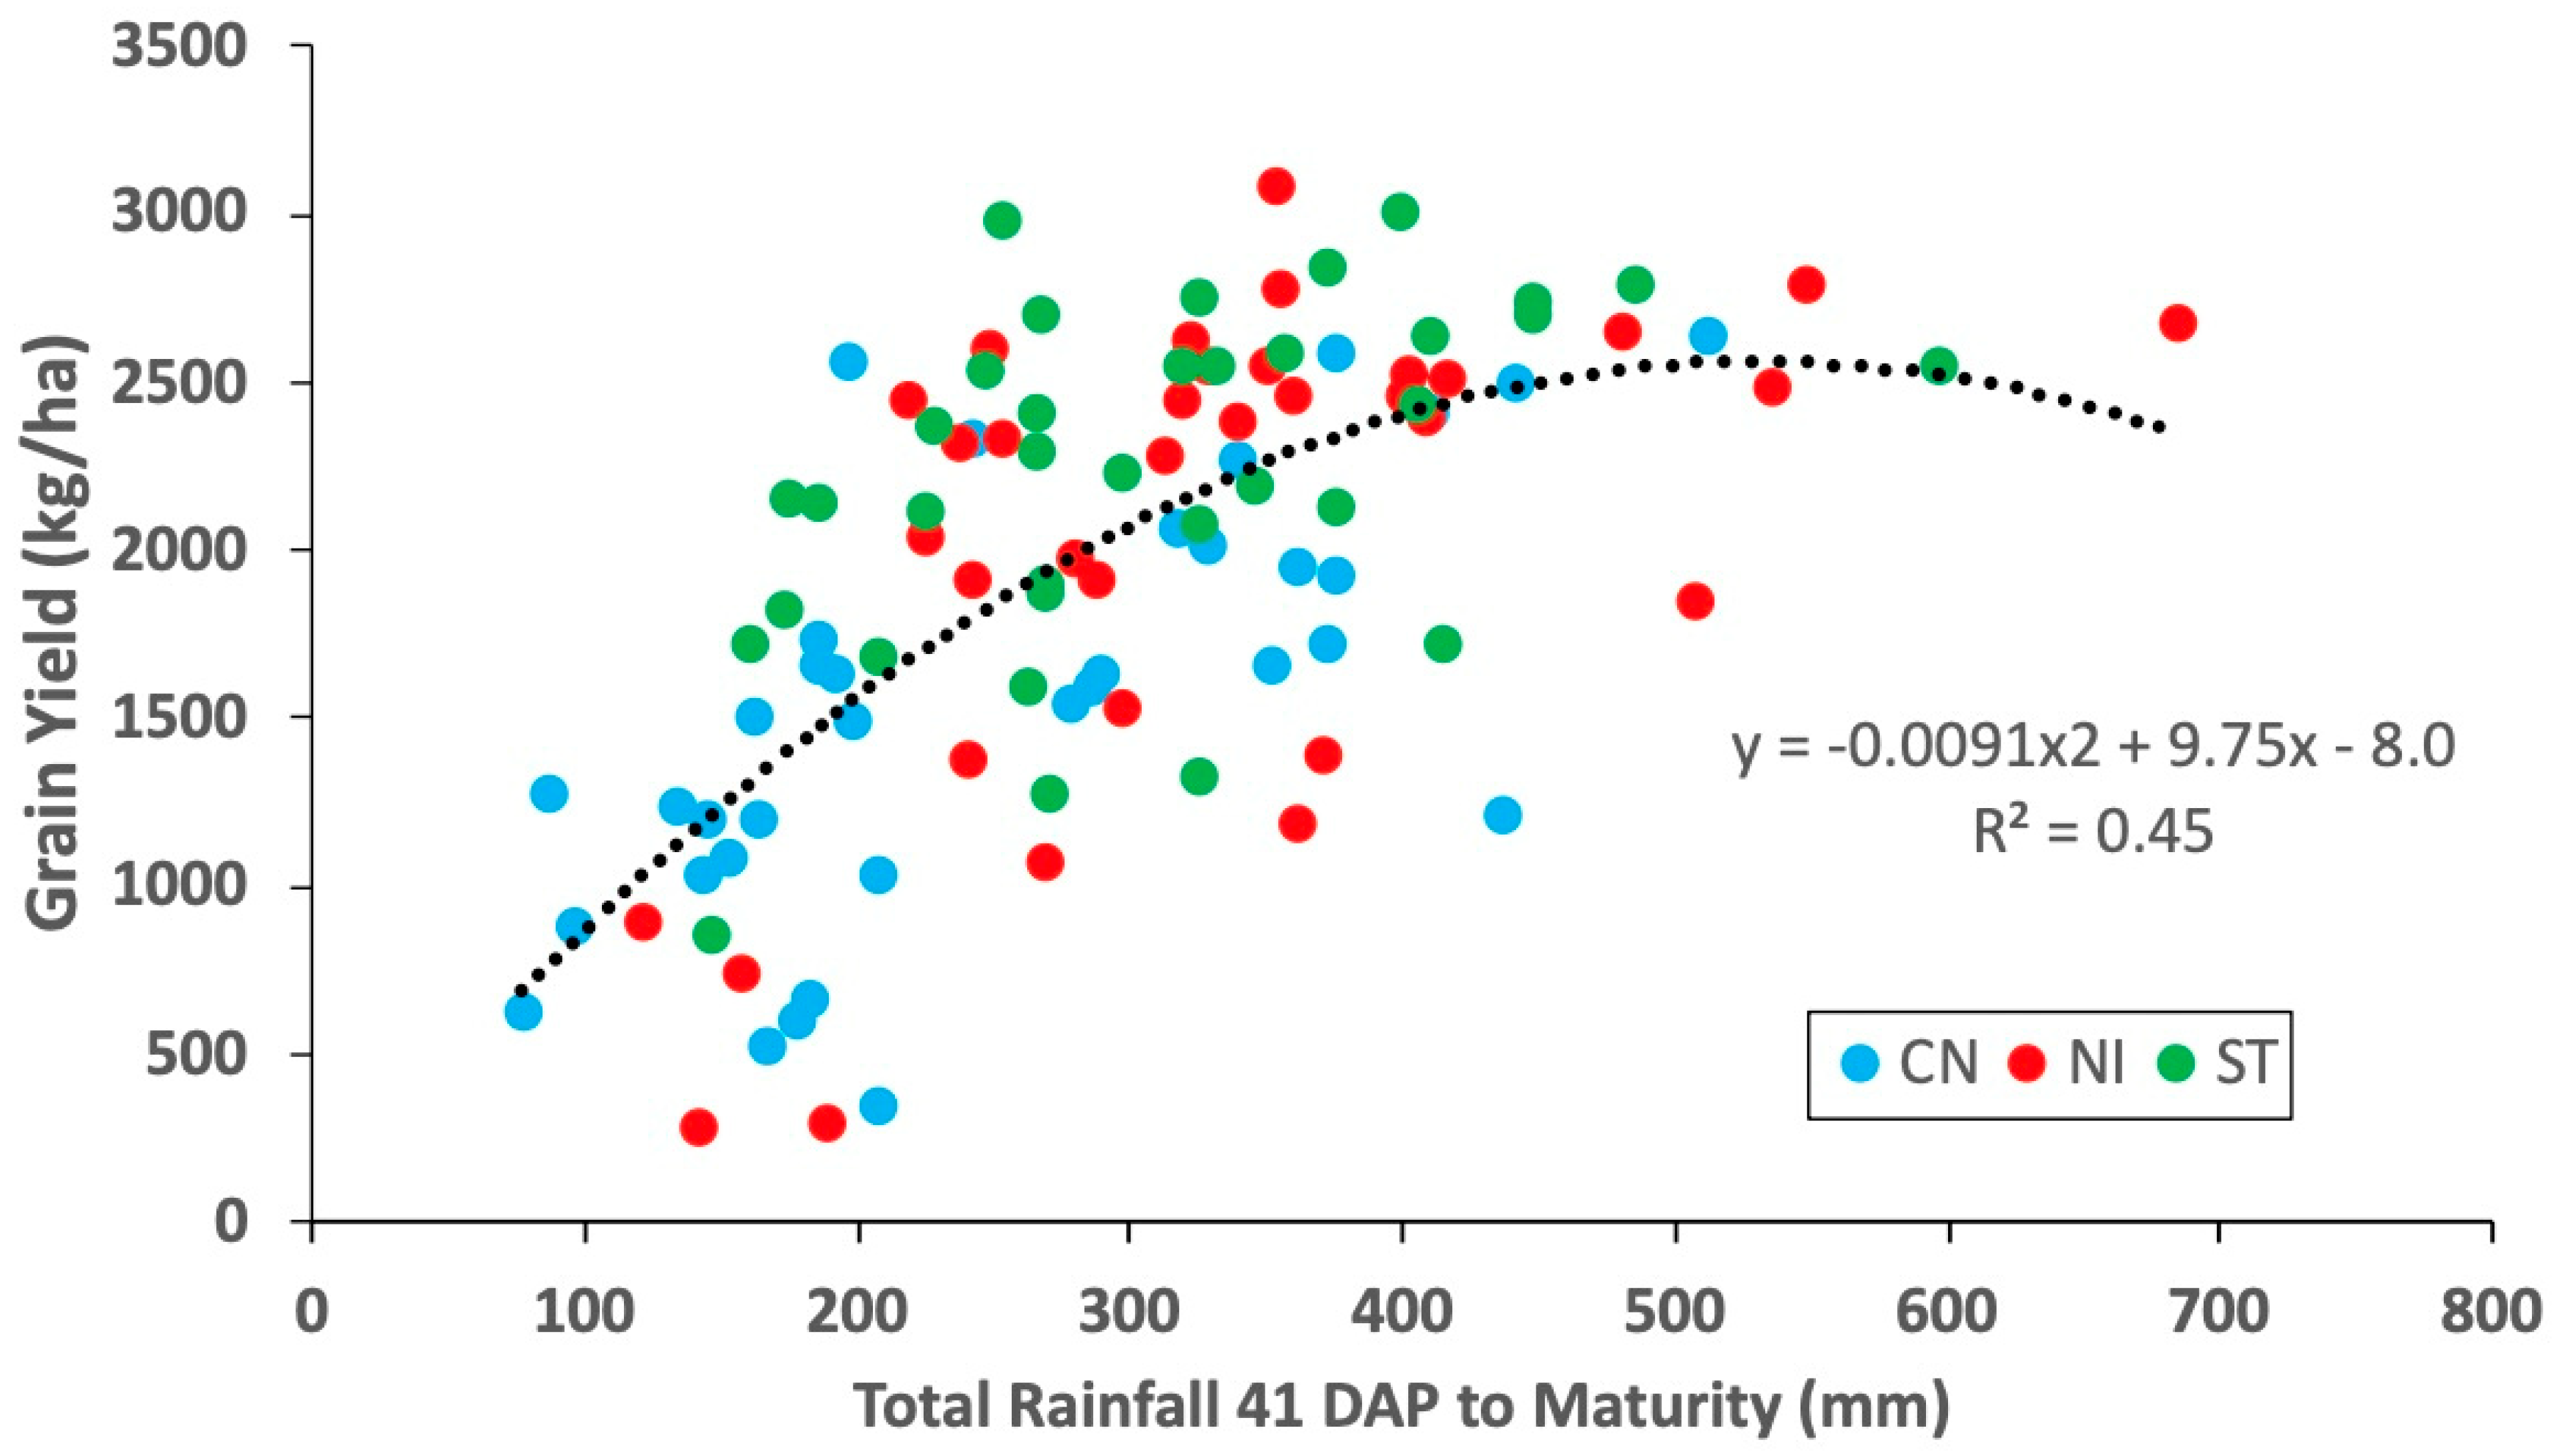
In addition, we found a significant correlation between millet yields and total rainfall from 41 DAS to crop maturity (Appendix A, Figure A3. This finding, along with the observed relationship between rainfall onset and growing season rainfall, informed the development of fertilizer recommendations. Table 3 presents a summary of optimal N fertilizer strategies for millet derived from 35 years of simulations.
Table 3. Summary of recommendation of N fertilizer application for (a) sorghum and (b) millet, based on onset date and rainfall forecast after panicle initiation (DAS = days after sowing).
(a)
ONSET
Sorghum
Forecast *
Post 51 DAS
N Recommendation **
(0 + 36 DAS + 51 DAS)
EarlyN or A20 + 20 + 60
EarlyB20 + 20 + 30
LateN or A20 + 20 + 30
LateB20 + 20 + 0
(b)
ONSET
Millet
Forecast *
Post 41 DAS
N Recommendation **
(0 + 20 DAS + 41 DAS)
EarlyN or A20 + 20 + 30
EarlyB20 + 20 + 0
LateN or A20 + 20 + 30
LateB20 + 20 + 0
* N = normal, B = below normal, A = above normal precipitation; ** N recommendations in kg N/ha.

3.5. Peanuts: Planting Dates, Varieties, and Feasibility of Irrigation

3.5.1. Planting Dates

We evaluated optimal sowing dates for peanuts by comparing two varieties, Fleur-11 and 73-33, the latter having a growing season approximately 15–20 days longer. Although yield differences between the two sowing date definitions were not substantial, the approach using a soil water threshold of 30% TAW (total available water) generally outperformed the 95% TAW threshold. Consequently, all subsequent analyses were conducted using sowing dates based on the 30% TAW threshold.
We further analyzed yield performance and gross margins for both varieties under optimal sowing dates. Across all four locations, 73-33 consistently produced higher yields than Fleur-11. The smallest yield advantage for 73-33 was observed in Bambey, the site characterized by a late onset of rains and the lowest total seasonal rainfall. This suggests that a shorter-season variety like Fleur-11 may still be better suited for more water-limited environments (Table 4).
A basic economic analysis was also performed using 2023 market prices for peanuts and input costs. Results indicated that Fleur-11 frequently resulted in negative gross margins in three of the four locations. While 73-33 outperformed Fleur-11 across all sites in terms of both yield and gross income, its performance in Nioro was marked by high variability, with a notable risk of negative returns as shown in Table 4.

3.5.2. Irrigation

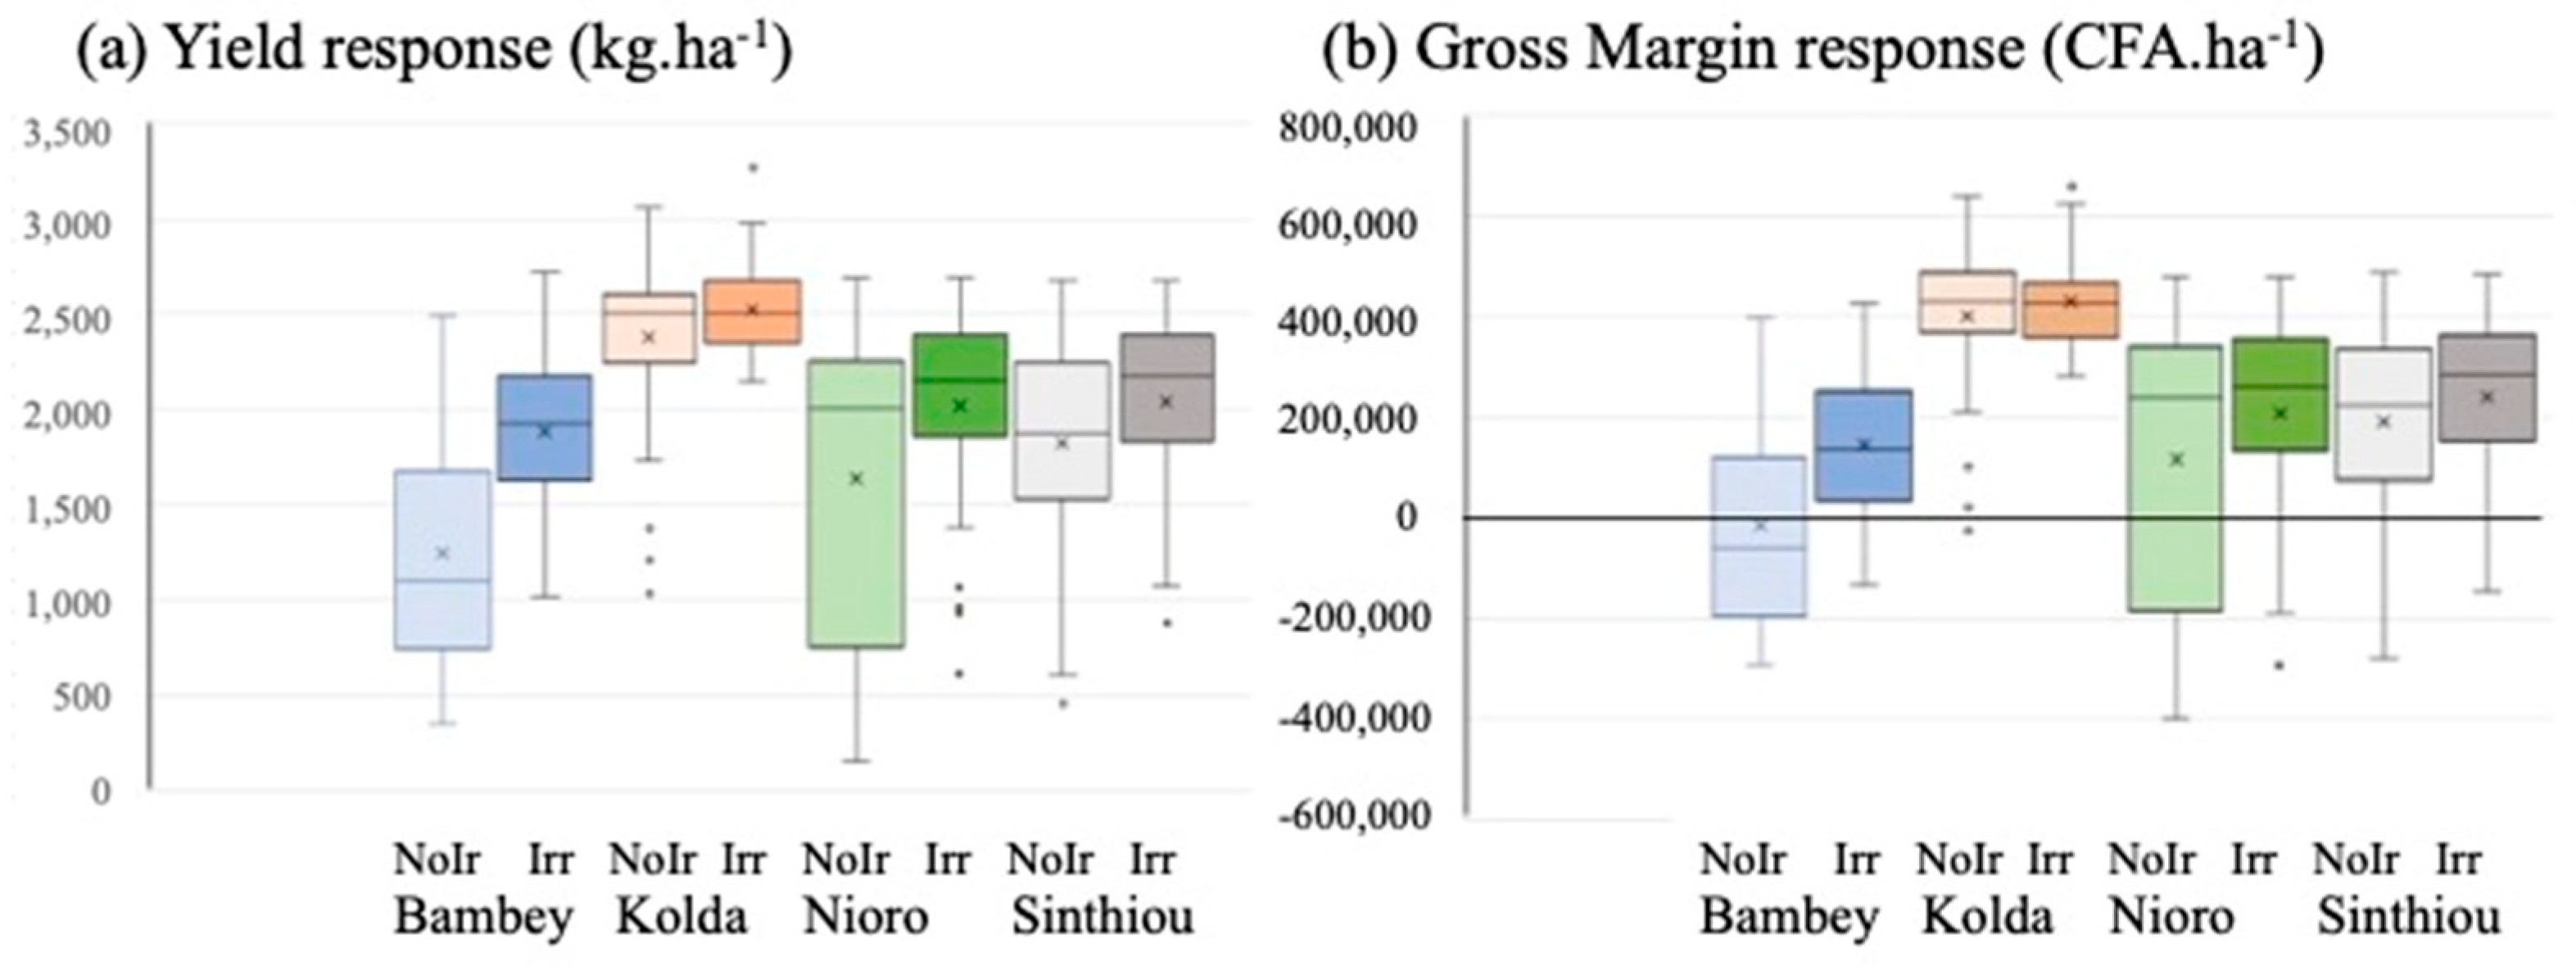
We assessed the feasibility of irrigating peanut crops across the four study locations using the following irrigation strategy: apply water (up to 10 mm per event) whenever soil moisture dropped below 50% of the total available water (TAW) and continue until field capacity is restored. While grain yield consistently responded positively to irrigation across all sites, the economic analysis revealed that irrigation does not present a clear advantage in any of the locations considered (Figure 6). In the driest sites—Bambey and Nioro—the relatively modest yield increases did not offset the high costs associated with water access and irrigation infrastructure, making such investments difficult to justify. However, irrigation in these areas did significantly reduce the probability of negative gross margins, indicating a potential role in risk mitigation rather than yield maximization. Conversely, in the wetter sites—Kolda and Sinthiou—the yield gains from irrigation were minimal, and variability in economic returns remained largely unchanged with or without irrigation.

3.6. Rice

The DSSAT rice simulation model was previously calibrated by [38] for two groups of cultivars: Nerica 1 and Nerica 4, characterized by a growing period of 95–100 days, and Nerica 8 and Nerica 11, with a shorter cycle of 75–85 days. For validation purposes, observed field data from 2012 to 2014 were collected and compared with model outputs for anthesis and maturity dates, as well as grain yield ranges (Appendix A, Table A4. As anticipated, the DSSAT model demonstrated satisfactory performance in simulating both phenological development and yield. However, the observed variability in flowering and maturity dates, as well as yields, was consistently greater than that produced by the model simulations. Given the comparable yield levels between the two cultivar groups, the shorter-duration varieties (represented by Nerica 8 and Nerica 11) were selected for subsequent simulations due to their potential advantage under water-limited conditions

3.6.1. N Fertilizer Strategy for Rainfed Rice

The response of rainfed rice to nitrogen (N) fertilization was evaluated using simulations based on optimal sowing dates, defined as the point at which plant-available water reaches 30% of the soil’s total available water capacity (TAW = 30%). The study was conducted across two locations: Kolda and Tambacounda (Figure 7). Nitrogen was applied at three crop growth stages: at planting, 25 days after sowing (DAS; approximately 10 days prior to panicle initiation) and 45 DAS (approximately 20 days before anthesis). Results indicated a consistent positive yield response to N applications at sowing and at 25 DAS, up to a maximum of 30 kg N/ha per application. Additional N applied at 45 DAS also contributed to yield increases; however, in most cases, rates exceeding 30 kg N/ha did not lead to further yield improvements. Based on these findings, a general recommendation for N fertilization in rainfed rice under similar agroecological conditions would consist of applying a total of 90 kg N/ha, distributed evenly as 30 kg N/ha at sowing, 25 DAS and 45 DAS.

3.6.2. Irrigated Rice

We evaluated the optimal sowing date for rice across six locations in Senegal, each characterized by distinct climatic conditions. The onset of the rainy season was defined using the same threshold employed by [36], specifically when soil water content reaches 30% of total available water (TAW = 30%). Optimal sowing dates ranged from June 15 in Kolda to between July 15 and July 30 in St. Louis and Bambey (Table 5). Simulated grain yields under these optimal planting dates were relatively uniform across locations, ranging from 4000 to 5000 kg/ha.
Subsequently, we estimated the irrigation requirements necessary to attain these yields. Results revealed considerable variation in irrigation needs, with drier regions such as Bambey and St. Louis requiring between 150 and 250 mm/year, while wetter locations such as Kolda and Tambacounda required less than 100 mm/year. Intermediate values were observed in Kaolak and Thiès, where irrigation needs ranged from 75 to 150 mm/year (Table 5). Although economic analyses confirmed that rice yields responded positively to irrigation in all sites, achieving irrigation demands greater than 200 mm/year may be economically unfeasible without substantial infrastructure investment or ready access to water sources. In regions such as the Senegal River Valley (e.g., St. Louis), irrigation is more viable due to the proximity to reliable water supplies. In contrast, locations such as Bambey, which are remote from water sources, present significant logistical and economic challenges for irrigation.
As part of Senegal’s ongoing national efforts to increase rice self-sufficiency and reduce dependency on imports, one promising strategy is to intensify production in irrigated areas through double cropping. We explored the feasibility of growing two rice crops per year by simulating multiple combinations of planting dates. While practical factors such as labor availability and competition with other agricultural activities (e.g., horticulture or rice processing) are important, these were not explicitly included in the present analysis. Instead, the focus was on identifying planting date combinations that maximized gross margins. The simulated strategies included a first rice crop sown in either January, February or March and a second rice crop sown in June, July or August.
Our initial results indicated that rice yields and their variability remained relatively stable across all sowing dates under optimal irrigation (triggered at TAW = 50%). However, gross margins (expressed in CFA/ha) varied significantly depending on the combination of sowing dates, rice market prices and irrigation costs. We tested four scenarios combining two rice prices (150 and 200 CFA/kg) and two irrigation costs (650 and 1100 CFA/mm). Under low irrigation cost conditions, the most favorable economic outcome was obtained when the first crop was sown in January or February, followed by a second crop in July (Table 6). Under high irrigation costs, a later first sowing date in March combined with a second sowing date in July yielded the highest margins. Across all scenarios, the combination of a January planting for the first crop and a July planting for the second crop showed the highest frequency of favorable gross margins.
Finally, we assessed the impact of irrigation management strategies—specifically, the threshold of soil moisture used to trigger irrigation—on gross margins. Using the best-performing double cropping strategy (January and July planting), we tested two thresholds: (a) irrigating when TAW falls to 50% and (b) delaying irrigation until TAW drops to 30%. Delaying irrigation to the 30% TAW threshold resulted in substantial reductions in gross margins (Table 7). Specifically, applying the 30% TAW threshold for both cropping cycles led to a 64% reduction in gross margins compared to the 50% TAW threshold. Delaying irrigation in only one of the two seasons resulted in gross margin losses ranging from 25% to 35%.

4. Conclusions

The best sowing date for the four crops included in the study was based on the definition of the onset of the rainy season described by Han et al. [36], i.e., sow when the soil water content reaches 30% of the maximum plant available water holding capacity (TAW = 30%).
The yield gaps in sorghum and millet of crops with observed weather and no N limitations vs. well fertilized crops was 40–80%, indicating the large potential to improve N fertilizer management based, e.g., on recommendation systems that consider expected rainfall conditions after panicle initiation. Yield gaps in rice indicated that optimizing water use resulted in a 20% increase in grain yield and optimizing N fertilizer use resulted in additional 20% yield gains, evidencing the potential for improving both water and N fertilizer management.
Sorghum, millet and rainfed rice responded to early applications of N fertilizers, i.e., at planting and before or around panicle initiation, which are critical for early growth and development. However, the strongest response in grain yield was found at later growth stages, i.e., immediately before the crops reach their fastest growth rates. The optimal N fertilizer rates at these later growth stages depend on the rainfall, and consequently, fertilizer recommendations can be adjusted considering the expected rainfall that is included in seasonal climate forecasts.
Peanut yields and gross margins obtained with variety 73-33 were 25–100% higher than with Fleur-11. Crop yields were affected by N symbiotic fixation: yields were 20–100% lower when symbiotic fixation provided only 60% of the crop N needs. Peanut yields responded consistently to irrigation in the four locations included in the study, but the economic analyses suggested that irrigation is not a clearly viable strategy in any of the locations, primarily due to the high costs associated with water access and infrastructure.
Optimal sowing dates of irrigated rice varied from mid-June in Kolda to mid-late July in St. Louis and Bambey. The obtained yields with optimal sowing dates were similar in all locations and varied between 4000 and 5000 kg/ha. The economic analyses indicated that rice responds well to irrigation in all locations, but the large needs of irrigation can only be realistically satisfied in regions with easy access to existing water sources such as the Senegal River Valley.
Economic assessments of double rice cropping systems in the Senegal River Valley indicated that the optimal strategy for planting dates involves sowing the first crop in March and the second crop in July. This combination yielded the most favorable gross margins, especially under scenarios of high irrigation costs.
The findings of our study corroborate results from previous field experiments and further identify agronomic management practices that can enhance productivity, in-crease farmers’ income and reduce yield variability. Our results highlight the value of using crop simulation models to evaluate a broad range of management strategies under diverse climatic and economic scenarios over extended time periods. This approach facilitates the identification of practices with the greatest potential to consistently improve cropping system performance. The most promising practices identified through simulation can subsequently be tested in pilot field experiments to validate model outputs and serve as demonstration sites for the dissemination of best management practices to farmers in Senegal.

Author Contributions

Conceptualization, W.E.B.; methodology, W.E.B., A.F. and M.D.; validation W.E.B., A.F. and M.D.; formal analysis, W.E.B., A.F. and M.D.; investigation, W.E.B.; resources, W.E.B. and M.D.; data curation, A.F. and M.D.; writing—original draft preparation, W.E.B.; writing—review and editing, A.F. and M.D.; funding acquisition, W.E.B. All authors have read and agreed to the published version of the manuscript.

Funding

This work was funded by the project “Accelerating Impacts of CGIAR in Climate Research for Africa” (AICCRA). Additional funding was provided by ISRA and by the IRI-Columbia University.

Data Availability Statement

Data used in this research are available upon request.

Conflicts of Interest

The authors declare that the research was conducted in the absence of any commercial or financial relationships that could be construed as a potential conflict of interest.

Appendix A

Figure A1. Theory of change used for the work presented in the current article.
Agronomy 15 01882 g0a1
Figure A2. Locations of Senegal used in the current paper.
Agronomy 15 01882 g0a2
Figure A3. Relationship of total rainfall between 41 days after planting (DAP) and millet grain yield.
Agronomy 15 01882 g0a3
Table A1. Description, application and source of collected data used in the calibration of the DSSAT models.
DataDescriptionPeriodApplicationSource
Sorghum field experiment dataDetermine the effect of fertilizer application on sorghum grain yield and formulation of tailored fertilization strategies according to sorghum varieties2015–2016 Calibration/Evaluation [38,39]
Peanuts management and yield dataEffects of fertilization rate and water availability on peanut growth and yield2014–2015 Calibration/Evaluation [29]
Soil dataAnalysis of soil physical and chemical properties at the experimental sites in 20142014–2015 Calibration/Evaluation [29]
Peanuts management and yield dataEvaluate the impact of climate change on peanut yield in Senegal2014–2015 Calibration/Evaluation [40]
Rice management and yield dataMeasure the agronomic traits of four upland rainfed rice NERICA (NERICA 1 and NERICA 4 (95–100 days); NERICA 8 and NERICA 11 (75–85 days) in a sudano-sahelian zone2013–2014 Calibration/Evaluation [6]
Table A2. Genetic coefficients used in the simulation runs of the four DSSAT crop models based on the work included in Table A2.
SORGHUMMILLET
CoefficientFaddaWCoefficientCIVT
P1200.0P1100.0
P2280.0P2O12.0
P2O12.6P2R142.0
P2R655.0P5390.0
PANTH617.5G11.0
P3145.0G40.6
P481.5PHINT43.0
P5400.0GT1.0
PHINT49.0G511.0
G13.0
G26.0
PEANUTSCultivarRICE
CoefficientFLEUR 11VAR 73-33CoefficientNERICA 1&4
CSDL11.8411.84P1380
PPSEN0.00.0P2R100
EM-FL16.020.0P5300
FL-SH 7.07.6P2O13
FL-SD12.013.0G175.0
SD-PM36.040.0G20.03
FL-LF66.066.0G31.0
LFMAX 1.71.55G483.0
SLAVR250250PHINT37.0
SIZLF25.015.0
XFRT0.950.9
WTPSD0.360.36
WTPSD0.360.36
SFDUR29.025.0
SDPDV1.651.65
PODUR8.010.0
THRSH95.095.0
SDPRO0.70.7
SDLIP0.510.51
Table A3. Grain prices and production costs for sorghum, millet, rice and peanuts in 2023 (CFA).
Sorghum
Base production cost156,500 CFA/ha
       Nitrogen fertilizer1130 CFA/kg N
       Sorghum price160 CFA/kg grain
Sorghum byproduct10 CFA/kg byproduct
      Millet
       Base production cost154,000 CFA/ha
       Nitrogen fertilizer1130 CFA/kg N
       Millet price 160 CFA/kg grain
       Millet byproduct5 CFA/kg byproduct
    Peanuts
Base production cost395,700 CFA/ha
         Irrigation 630 CFA/mm
   Peanut price 280 CFA/kg grain
Peanut byproduct33 CFA/kg byproduct
      Rice
Base production cost391,000 CFA/ha
      Irrigation 630 CFA/mm
      Nitrogen fertilizer1130 CFA/kg N
    Rice price 180 CFA/kg Grain
Rice byproduct0 CFA/kg byproduct
Table A4. Results of calibrated DSSAT rice model comparing observed* and simulated anthesis date, maturity date and grain yields.
Nerica 1 *Nerica 8 *
ObservedSimulatedObservedSimulated
AnthesisMedian66.267.064.863.0
Date (DAP)Q2563.766.061.063.0
Q7570.068.366.665.0
MaturityMedian92.091.086.088.0
date (DAP)Q2586.090.085.087.0
Q7595.094.094.090.0
Yield (kg/ha)Median1282218015321896
Q2574416298401413
Q752131262626562210
* 306 and 116 field observations were used for Nerica 1 and Nerica 8, respectively.

References

  1. Sultan, B.; Gaetani, M. Agriculture in West Africa in the Twenty-First Century: Climate Change and Impacts Scenarios, and Potential for Adaptation. Front. Plant Sci. 2016, 7, 1262. [Google Scholar] [CrossRef]
  2. Direction de l’Analyse, de la Prévision et des Statistiques Agricoles: Rapport de l’Enquête Agricole Annuelle (EAA) 2020–2021; DAPSA: Dakar, Sénégal, 2021.
  3. Salack, S.; Klein, C.; Giannini, A.; Sarr, B.; Worou, O.N.; Belko, N.; Bliefernicht, J.; Kunstman, H. Global warming induced hybrid rainy seasons in the Sahel. Environ. Res. Lett. 2016, 11, 104008. [Google Scholar] [CrossRef]
  4. Sultan, B.; Defrance, D.; Iizumi, T. Evidence of crop production losses in West Africa due to historical global warming in two crop models. Sci. Rep. 2019, 9, 12834. [Google Scholar] [CrossRef]
  5. Brosseau, A.; Saito, K.; van Oort, P.A.; Diagne, M.; Valbuena, D.; Groot, J.C. Exploring opportunities for diversification of smallholders’ rice-based farming systems in the Senegal River Valley. Agric. Syst. 2021, 193, 103211. [Google Scholar] [CrossRef]
  6. Kouakou, K.P.M.; Muller, B.; Fofana, A.; Guisse, A. Agronomic performance of four varieties of NERICA upland rice sown on different dates in Sudano-Sahelian zone in Senegal. J. Appl. Biosci. 2016, 99, 9382–9394. [Google Scholar] [CrossRef]
  7. Van Asten, P.J.A.; Wopereis, M.C.S.; Haefele, S.; Isselmou, M.O.; Kropff, M.J. Explaining yield gaps on farmer-identified degraded and non-degraded soils in a Sahelian irrigated rice scheme. NJAS-Wagening. J. Life Sci. 2003, 50, 277–296. [Google Scholar] [CrossRef]
  8. Fall, B. Recensement Général de la Population et de l’Habitat, de l’Agriculture et de l’Elevage (RGPHAE); ANSD: Dakar, Senegal, 2014. [Google Scholar]
  9. Araya, A.; Jha, P.K.; Zambreski, Z.; Faye, A.; Ciampitti, I.A.; Min, D.; Gowda, P.H.; Singh, U.; Prasad, P.V.V. Evaluating crop management options for sorghum, pearl millet and peanut to minimize risk under the projected midcentury climate scenario for different locations in Senegal. Clim. Risk Manag. 2022, 36, 100436. [Google Scholar] [CrossRef]
  10. Debieu, M.; Sine, B.; Passot, S.; Grondin, A.; Akata, E.; Gangashetty, P.; Vadez, V.; Gantet, P.; Foncéka, D.; Cournac, L. Response to early drought stress and identification of QTLs controlling biomass production under drought in pearl millet. PLoS ONE 2018, 13, e0201635. [Google Scholar] [CrossRef]
  11. Gowda, N.A.N.; Siliveru, K.; Prasad, P.V.V.; Bhatt, Y.; Netravati, B.P.; Gurikar, C. Modern processing of Indian millets: A perspective on changes in nutritional properties. Foods 2022, 11, 499. [Google Scholar] [CrossRef]
  12. Singh, P.; Singh, R.; Bhadauria, V.; Singh, H. The functionality and extraction of protein from sorghum, finger millet, and Kodo millet: A review. Int. J. Food Sci. Technol. 2023, 59, 512–521. [Google Scholar] [CrossRef]
  13. Dia, D.; Diop, A.M.; Fall, C.S.; Seck, T. Sur les Sentiers de la Collecte et de la Commercialisation de L’arachide au Sénégal: Tirer les Leçons du Passé Pour Rebâtir une Filière Performante; ISRA: Jeddah, Saudi Arabia, 2003. [Google Scholar]
  14. Sene, A.; Gueye, A.D.; Faye, I. Identification of Genetically Closely Related Peanut Varieties Using Deep Learning: The Case of Flower-Related Varieties 11. In Proceedings of the International Conference on Paradigms of Computing, Communication and Data Sciences, PCCDS 2022, Jaipur, India, 5–7 July 2023; pp. 273–283. [Google Scholar]
  15. Noba, K.; Ngom, A.; Guèye, M.; Bassène, C.; Kane, M.; Diop, I.; Ndoye, F.; Mbaye, M.S.; Kane, A.; Ba, A.T. L’arachide au Sénégal: État des lieux, contraintes et perspectives pour la relance de la filière. OCL 2014, 21, D205. [Google Scholar] [CrossRef]
  16. Baborska, R. Suivi des Politiques Agricoles et Alimentaires au Sénégal 2021: Rapport D’analyse Politique; Food & Agriculture Organization: Rome, Italy, 2021. [Google Scholar]
  17. Gama, A.P.; Adhikari, K.; Hoisington, D.A. Peanut consumption in Malawi: An opportunity for innovation. Foods 2018, 7, 112. [Google Scholar] [CrossRef]
  18. Allan, E.; Dunkel, F.; Lachapelle, P.; Kim, S.-H.; Kinnare, C.; Ndiaye, A.; Kuo, W.-Y. Developing culturally acceptable peanut nutrition bars with smallholder women farmers in Kaffrine, Senegal using participatory action research. Local Dev. Society 2023, 4, 289–311. [Google Scholar] [CrossRef]
  19. Kennedy, G.; Burlingame, B.; Nguyen, N. Nutrient impact assessment of rice in major rice consuming countries. Korea 2002, 165, 12–15. [Google Scholar]
  20. Danièle, C.; Verger, E.; Guetat-Bernard, H. Expanding and Intensifying Rice Production Consequences on Agrobiodiversity Management and Diet Quality. A Situated Transdisciplinary Gendered Analysis in Senegal Middle Valley River. 2020. Available online: https://hal.science/hal-02949499v1/document (accessed on 30 July 2025).
  21. Diallo, M.F.; Garba, A.A. Effect of Seed and Fertilizer Subsidies on the Technical Efficiency of Rice Farmers in Senegal. J. Agric. Sci. 2023, 16, 1–81. [Google Scholar] [CrossRef]
  22. Tanaka, A.; Diagne, M.; Saito, K. Causes of yield stagnation in irrigated lowland rice systems in the Senegal River Valley: Application of dichotomous decision tree analysis. Field Crop Res. 2015, 176, 99–1075. [Google Scholar] [CrossRef]
  23. THIAO, M.; Larbi, A. Analyse de la situation de la riziculture pluviale au sud du Sénégal. Rev. Marocaine Sci. Agron. Vétérinaires 2022, 10, 209–216. [Google Scholar]
  24. Kanfany, G.; El-Namaky, R.; Ndiaye, K.; Traore, K.; Ortiz, R. Assessment of rice inbred lines and hybrids under low fertilizer levels in Senegal. Sustainability 2014, 6, 1153–1162. [Google Scholar] [CrossRef]
  25. Gérardeaux, E.; Falconnier, G.; Gozé, E.; Defrance, D.; Kouakou, P.-M.; Loison, R.; Sultan, B.; Affholder, F.; Muller, B. Adapting rainfed rice to climate change: A case study in Senegal. Agron. Sustain. Dev. 2021, 41, 57. [Google Scholar] [CrossRef]
  26. Van Oosterom, E.J.; Weltzien, E.; Yadav, O.P.; Bidinger, F.R. Grain yield components of pearl millet under optimum conditions can be used to identify germplasm with adaptation to arid zones. Field Crop Res. 2006, 96, 407–421. [Google Scholar] [CrossRef]
  27. Soullier, G.; Moustier, P. The modernization of the rice value chain in Senegal: A move towards the Asian Quiet Revolution? Dev. Policy Rev. 2021, 39, O81–O101. [Google Scholar] [CrossRef]
  28. Faye, A.; Camara, I.; Diop, M.; OuryDiallo, A.; Sine, B.; Noblet, M.; Faye, B.; Defrance, D.; Sultan, B.; Ndour, N.Y.B. Millet and sorghum yield simulations under climate change scenarios in Senegal. Reg. Environ. Change 2022, 22, 86. [Google Scholar] [CrossRef]
  29. Faye, B.; Webber, H.; Gaiser, T.; Diop, M.; Owusu-Sekyere, J.D.; Naab, J.B. Effects of fertilization rate and water availability on peanut growth and yield in Senegal (West Africa). J. Sustain. Dev. 2016, 9, 111. [Google Scholar] [CrossRef]
  30. Wajid, A.; Hussain, K.; Ilyas, A.; Habib-ur-Rahman, M.; Shakil, Q.; Hoogenboom, G. Crop models: Important tools in decision support system to manage wheat production under vulnerable environments. Agriculture 2021, 11, 1166. [Google Scholar] [CrossRef]
  31. Han, E.; Baethgen, W.E.; Ines, A.V.M.; Mer, F.; Souza, J.S.; Berterretche, M.; Atunez, G.; Barreira, C. SIMAGRI: An agro-climate decision support tool. Comput. Electron. Agric. 2019, 161, 241–251. [Google Scholar] [CrossRef]
  32. Hoogenboom, G.; Jones, J.W.; Wilkens, P.W.; Porter, C.H.; Boote, K.J.; Hunt, L.A.; Singh, U.; Lizaso, J.I.; White, J.W.; Uryasev, O. Decision Support System for Agrotechnology Transfer (DSSAT) Version 4.6; DSSAT Foundation: Prosser, WA, USA, 2015. [Google Scholar]
  33. Jones, J.W.; Hoogenboom, G.; Porter, C.H.; Boote, K.J.; Batchelor, W.D.; Hunt, L.A.; Wilkens, P.W.; Singh, U.; Gijsman, A.J.; Ritchie, J.T. The DSSAT cropping system model. Eur. J. Agron. 2003, 18, 235–265. [Google Scholar] [CrossRef]
  34. Hoogenboom, G.; Porter, C.H.; Boote, K.J.; Shelia, V.; Wilkens, P.W.; Singh, U.; White, J.W.; Asseng, S.; Lizaso, J.I.; Moreno, L.P. The DSSAT crop modeling ecosystem. In Advances in Crop Modeling for a Sustainable Agriculture; Burleigh Dodds Science Publishing: Sawston, UK, 2019; pp. 173–216. ISBN 9780429266591. [Google Scholar]
  35. Asseng, S.; Foster, I.; Turner, N.C. The impact of temperature variability on wheat yields. Glob. Change Biol. 2011, 17, 997–1012. [Google Scholar] [CrossRef]
  36. Han, E.; Faye, A.; Diop, M.; Singh, B.; Ganyo, K.K.; Baethgen, W. Evaluating agronomic onset definitions in Senegal through crop simulation modeling. Atmosphere 2022, 13, 2122. [Google Scholar] [CrossRef]
  37. Baethgen, W.E.; Christianson, C.B.; Lamothe, A.G. Nitrogen fertilizer effects on growth, grain yield, and yield components of malting barley. Field Crops Res. 1995, 43, 87–99. [Google Scholar] [CrossRef]
  38. Ganyo, K.K.; Muller, B.; Ndiaye, M.; Gaglo, E.K.; Guissé, A.; Adam, M. Defining fertilization strategies for sorghum (Sorghum bicolor (L.) Moench) production under Sudano-Sahelian conditions: Options for late basal fertilizer application. Agronomy 2019, 9, 697. [Google Scholar] [CrossRef]
  39. Ganyo, K.K.; Muller, B.; Guissé, A.; Adam, M. Fertilization strategies based on climate information to enhance food security through improved dryland cereals production. In Handbook of Climate Change Resilience; Springer: Berlin/Heidelberg, Germany, 2018; pp. 1–18. [Google Scholar]
  40. Faye, B.; Webber, H.; Diop, M.; Mbaye, M.L.; Owusu-Sekyere, J.D.; Naab, J.B.; Gaiser, T. Potential impact of climate change on peanut yield in Senegal, West Africa. Field Crops Res. 2018, 219, 148–159. [Google Scholar] [CrossRef]
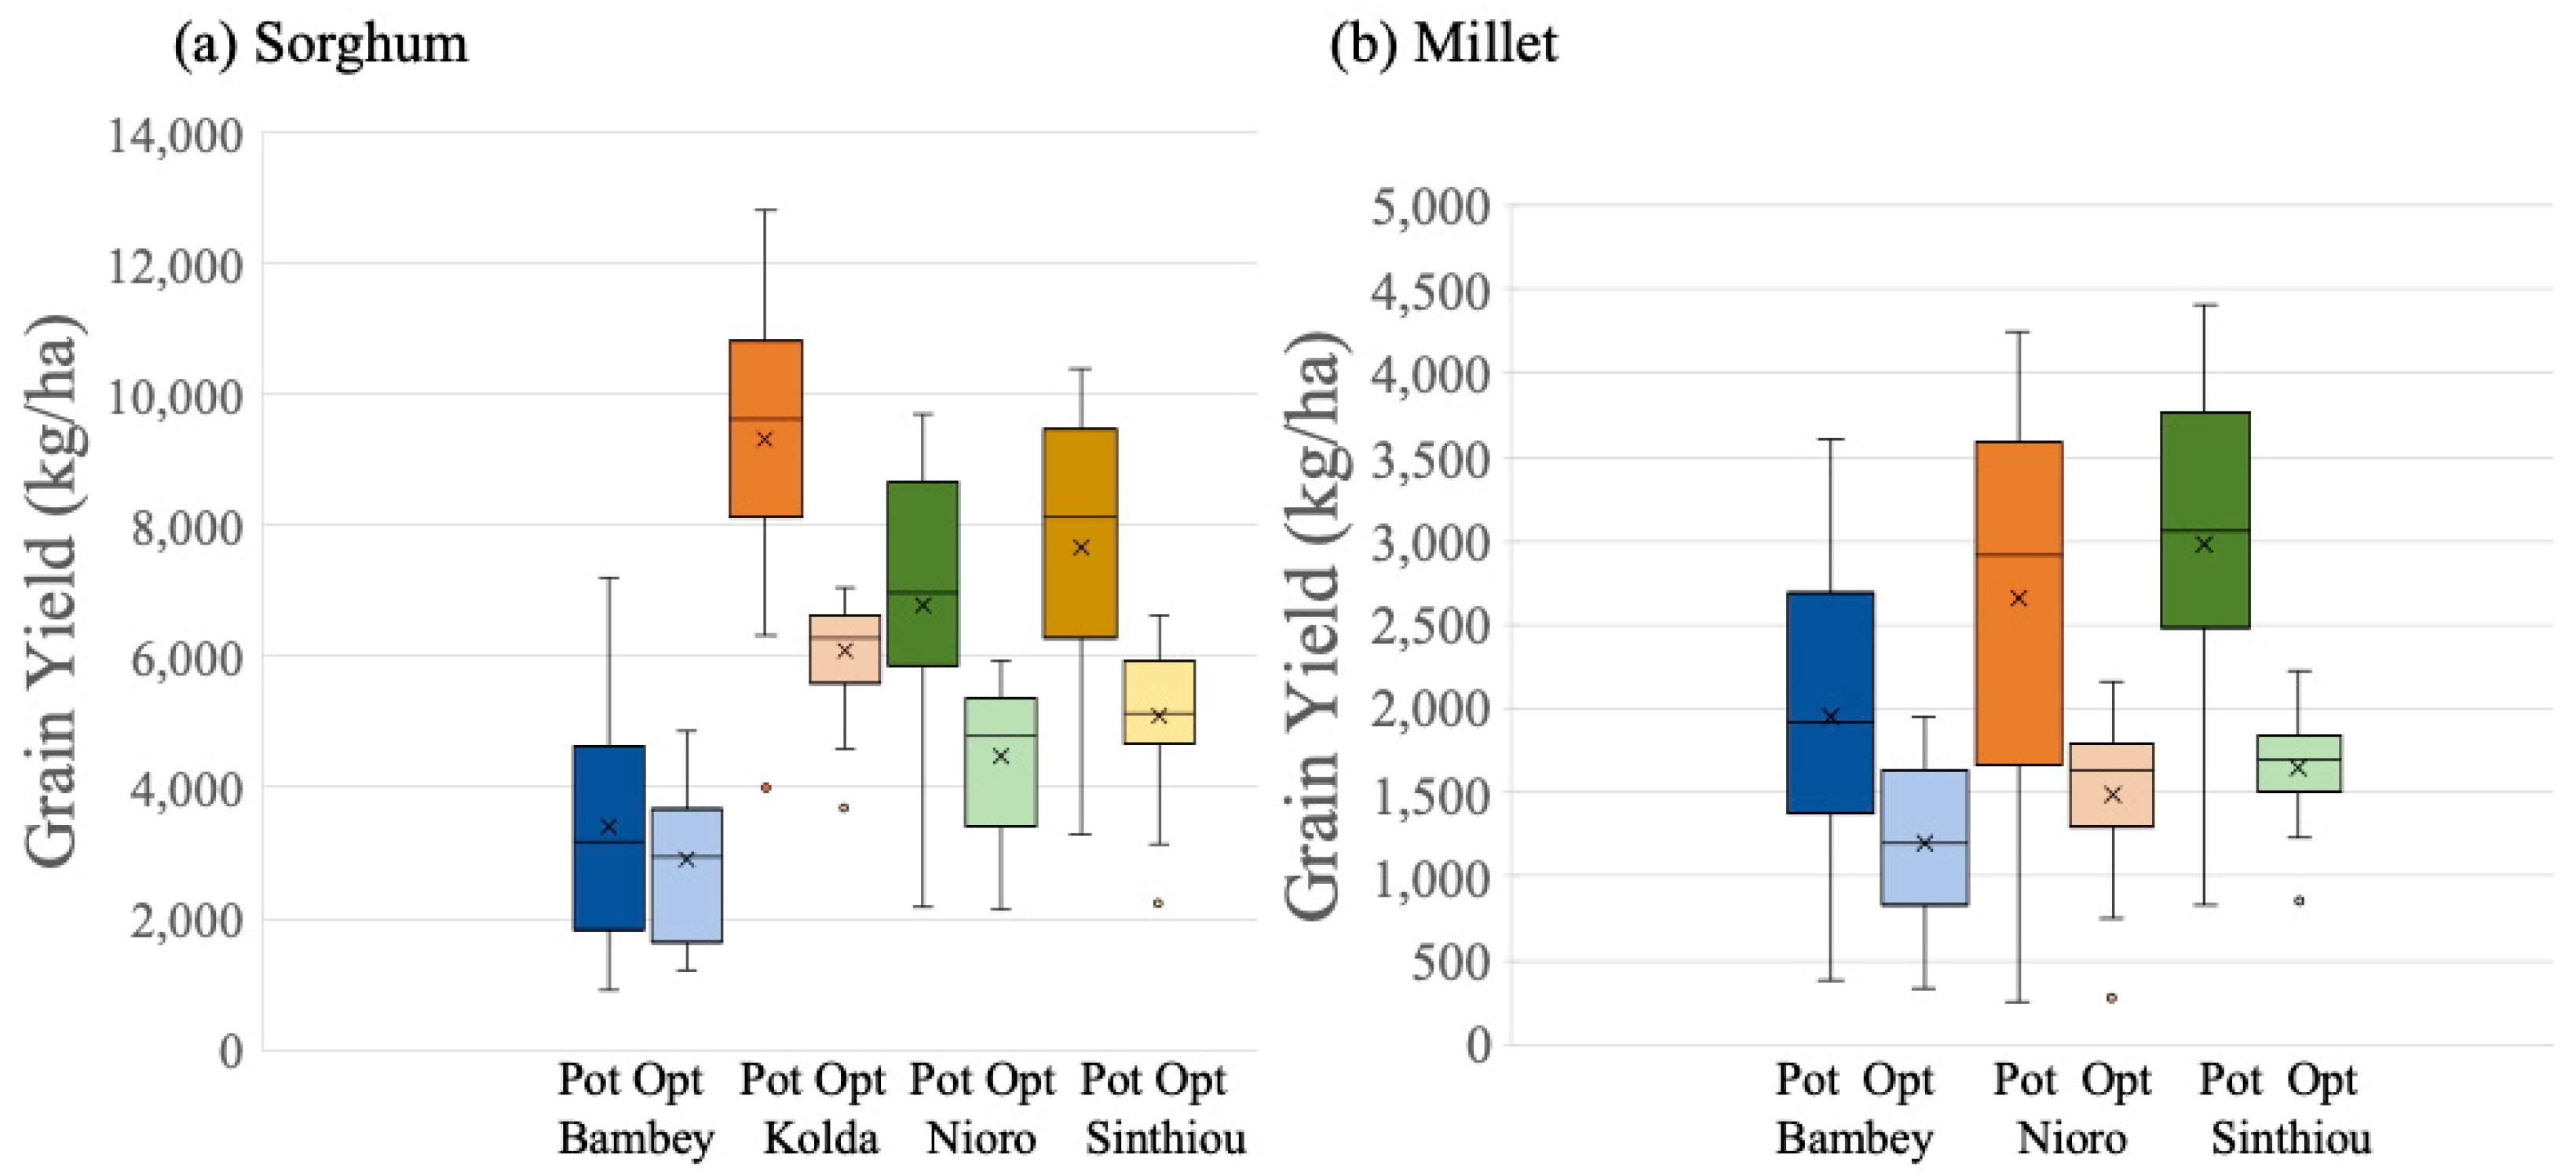
Figure 1. Potential (POT) and optimal (OPT) yields for (a) sorghum in four locations and (b) millet in three locations of Senegal (CN = Bambey, KO = Kolda, NI = Nioro, ST = Sinthiou). In all box plots presented in this article, the box represents the 25th and 75th percentiles, the horizontal line in the box represents the median and the “X” represents the mean value. The whiskers represent the 5th and 95th percentiles, and the points beyond the whiskers are minimum and maximum values.
Agronomy 15 01882 g001
Figure 2. Comparison between “potential” and N-limited yield simulated for peanut in four locations in Senegal (Bambey, Kolda, Nioro and Sinthiou). FX = full symbiotic N fixation, NF = 60% symbiotic N fixation).
Agronomy 15 01882 g002
Figure 3. Comparison between potential and optimal yield simulated for rice in four locations in Senegal (Pot = potential yield with no water or N limitations, NoN = no N limitation and optimal irrigation and Opt = fertilizer application of 30 kg N/ha at sowing, 25 days after sowing (DAS) and 45 DAS and optimal irrigation.
Agronomy 15 01882 g003
Figure 4. Gross margins of sorghum production in CFA/ha for different N fertilizer application strategies in four locations of Senegal (Bambey, Kolda, Nioro and Sinthiou). N fertilizer (kg N/ha) applied at three growth stages: sowing, 36 days after sowing (DAS) and 51 DAS.
Agronomy 15 01882 g004
Figure 5. Gross margins of millet production in CFA/ha for different N fertilizer application strategies in three locations of Senegal (Bambey, Nioro and Sinthiou). N fertilizer (kg N/ha) applied at planting, 20 days after sowing (DAS) and 41 DAS.
Agronomy 15 01882 g005
Figure 6. Yields in kg/ha (a) and gross margin in CFA/ha (b) of rainfed and irrigated peanuts (optimal planting date defined as total available water (TAW) is 30% of maximum, variety = 73-33).
Agronomy 15 01882 g006
Figure 7. Gross margin (CFA) of rainfed rice for different rates and timing of N fertilizer in two locations of Senegal. N applied at planting, 25 days after sowing (DAS) and 45 DAS.
Agronomy 15 01882 g007
Table 1. N Fertilizer response of sorghum (kg grain/ha) in four locations of Senegal (Bambey, Kolda, Nioro and Sinthiou). N fertilizer (kg N/ha) applied at sowing, 36 days after sowing (DAS) and 51 DAS.
N Fertilizer (kg N/ha) Applied at Sowing-36 DAS-51 DAS
0-0-020-0-020-20-020-20-3020-20-6020-40-020-40-3020-40-60
Bambey
Median12467492811231241103412071386
Q251076348391039112894311311217
Q75136705102813391458113214891605
Kolda
Median27383415413450326050487557136816
Q2523792984360745265465430252856037
Q7529893707442153096510511961877471
Nioro
Median24632937371246745371435251855939
Q2522612830339542235091398447945468
Q7527233325401248655711468554986432
Synthiou
Median26773223382947495572454152796288
Q2524372899349843195182406949515563
Q7530623631433852005974498457796663
Table 2. N fertilizer response of millet (kg grain/ha) in three locations of Senegal (Bambey, Nioro and Sinthiou). N fertilizer (kg N/ha) applied at sowing, 20 days after sowing (DAS) and 41 DAS.
N Fertilizer (kg N/ha) Applied at Sowing, 20 DAS and 41 DAS
0-0-020-0-020-20-020-20-3020-20-6020-40-020-40-3020-40-60
Bambey
Median913585461196158159912561694
Q257624136086611323729311172
Q751154236571625198077616802229
Nioro
Median2175346141631237767016552411
Q251854495171328168757813651735
Q752315877291777253080818542597
Synthiou
Median2605876831691228772817272338
Q252345396371535188167915631942
Q752816157801821260585318812695
Table 4. Yields (kg/ha) and gross margins (CFA/ha) of rainfed peanuts for two cultivars (73-33 and Fleur 11) in four locations of Senegal.
Cultivar73-33Fleur 11
SiteBambeyKoldaNioroSinthiouBambeyKoldaNioroSinthiou
Yield (kg/ha)
Median10992500201218702342411426122819
Q25744226680615731786363714902244
Q7516262598225422393090439932723322
Gross Margin (CFA/ha)
Median23,590512,628324,879308,530−49,876302,828−25,829−25,829
Q25−104,670455,641−75,657189,819−175,313252,345−205,295−205,295
Q75203,010564,101411,182418,50635,616366,724129,320129,320
Table 5. Optimal planting dates (day of year), irrigation needs (mm), grain yields (kg/ha) and gross margins (CFA/ha) of irrigated rice in six locations of Senegal.
BambeyKoldaSt LouisKaolakThiesTambactou
Optimal Planting
Date (DOY)
Median200165214182200159
Q25182159196170189155
Q75213172223194213165
Irrigation
need (mm)
Median165212057514457
Q25101181753910122
Q752124022411416581
Yield (kg/ha)
Median732670007619751675707479
Q25668264486842703368987040
Q75753774217908787079457799
Gross Margin
(CFA/ha)
Median179,305227,602206,493265,063223,976257,656
Q25116,928184,08599,341228,539171,500211,849
Q75244,269269,655245,101309,359299,669312,356
Table 6. Total gross margin for double rice crop in St. Louis using different scenarios of rice price (150 and 200 CFA/kg) and irrigation cost (650 and 1100 CFA/mm).
Total Double Crop Gross Margin (CFA/ha) in St. Louis
Rice = 150 CFA/kg and Irrigation Cost = 650 CFA/mm
Jan–JunJan–JulJan–AugFeb–JunFeb–JulFeb–AugMar–JunMar–JulMar–Aug
Median56,260141,34044,25457,240117,55519,345253,480309,052210,906
Q2534,218105,081−1746851863,335−37,548125,691194,535103,742
Q75125,195198,57688,89499,855175,05390,693352,979386,198299,541
Rice = 150 CFA/kg and Irrigation Cost = 1100 CFA/mm
Median−223,955−123,335−224,448−224,810−166,200−266,710140,161227,396118,574
Q25−264,778−144,205−261,814−293,090−199,475−311,905−190693,9929561
Q75−155,943−55,810−171,844−191,925−75,885−177,100252,186303,469198,418
Rice = 200 CFA/kg and Irrigation Cost = 650 CFA/mm
Median529,195623,990504,500518,225592,345470,165491,644538,595423,831
Q25501,292574,263449,533456,480514,440390,165363,167446,576307,694
Q75613,694701,624563,585577,633671,165546,780590,479630,042518,652
Rice = 200 CFA/kg and Irrigation Cost = 1100 CFA/mm
Median242,202369,182240,524232,520314,855175,330365,481450,821304,328
Q25200,843319,198179,989162,388251,060111,328232,107326,906219,217
Q75336,370447,738294,531276,908404,675285,248487,980542,816410,319
Table 7. Gross margins of rice double crops planted in January (first crop) and July (second crop) using two criteria to trigger irrigation: TAW = 30% and TAW = 50%. P5, P25, P75 and P95 are the 5th, 25th, 75th and 95th percentiles, respectively.
1st Crop
2nd Crop
Jan 30 *
Jul 30
Jan 50
Jul 30
Jan 30
Jul 50
Jan 50
Jul 50
Median208,875368,340410,435542,975
P5−110,907186,70315,953392,922
P2576,183300,123332,988494,355
P75318,305487,533471,738607,480
P95422,989609,047582,882707,378
* Jan 30, Jan 50 = first crop planted in January using total available water (TAW) of 30% and TAW 50%, respectively, as trigger for irrigation. Jul 30, Jul 50 = second crop planted in July, using TAW 30% and TAW 50%, respectively, as trigger for irrigation.
Disclaimer/Publisher’s Note: The statements, opinions and data contained in all publications are solely those of the individual author(s) and contributor(s) and not of MDPI and/or the editor(s). MDPI and/or the editor(s) disclaim responsibility for any injury to people or property resulting from any ideas, methods, instructions or products referred to in the content.