Article

Experimental and Numerical Study on the Restitution Coefficient and the Corresponding Elastic Collision Recovery Mechanism of Rapeseed

1
College of Intelligent and Manufacturing Engineering, Chongqing University of Arts and Sciences, Chongqing 402160, China
2
College of Engineering and Technology, Southwest University, Chongqing 400715, China
*
Author to whom correspondence should be addressed.
Agronomy 2025, 15(8), 1872; https://doi.org/10.3390/agronomy15081872
Submission received: 9 June 2025 / Revised: 29 July 2025 / Accepted: 30 July 2025 / Published: 1 August 2025
(This article belongs to the Section Precision and Digital Agriculture)

Abstract

In this study, we aimed to address the lack of systematic research on key collision dynamics parameters (elastic restitution coefficient) in the full mechanization of rapeseed operations, which hinders the development of precision agriculture. In this present work, the restitution coefficient of rapeseed was systematically investigated, and a predictive model (R2 = 0.959) was also established by using Box–Behnken design response surface methodology (BBD-RSM). The results show that the collision restitution coefficient varies in the range of 0.539–0.649, with the key influencing factors ranked as follows: moisture content (Mc) > material layer thickness (L) > drop height (H). The EDEM simulation methodology was adopted to validate the experimental results, and the results show that there is a minimal relative error (−1% < δ < 1%) between the measured and simulated rebound heights, indicating that the established model shows a reliable prediction performance. Moreover, by comprehensively analyzing stress, strain, and energy during the collision process between rapeseed and Q235 steel, it can be concluded that the process can be divided into five stages—free fall, collision compression, collision recovery, rebound oscillation, and rebound stabilization. The maximum stress (1.19 × 10⁻² MPa) and strain (6.43 × 10⁻⁶ mm) were observed at the beginning of the collision recovery stage, which can provide some theoretical and practical basis for optimizing and designing rapeseed machines, thus achieving the goals of precise control, harvest loss reduction, and increased yields.

1. Introduction

Rapeseed, as one of the world’s four major oilseed crops, accounts for more than 50% of the global oilseed production in terms of both planting yield and total output. Mechanized production is one of the core means to improve the production efficiency of rapeseed [1]. However, with the rapid development of precision agriculture, the traditional mechanized production model can no longer meet the current high demands of accuracy and efficient production, and there is an urgent need to upgrade in more refined and intelligent directions [2,3,4]. Although research on rapeseed sowing, harvesting, and processing has increased in recent years [5], existing equipment still has many shortcomings in precision operations (e.g., poor sowing uniformity, high harvest loss rate, and weak adaptability of operating parameters), which is due to the lack of basic data on the physical and mechanical properties of rapeseed during the mechanical design process [6,7], and thus leads to a lack of theoretical guidance for the design and optimization of related machinery.
The rapeseed restitution coefficient is the parameter characteristic regarding the ability of rapeseed grains to return to their original state after deformation under force [8], which is one of the key parameters in the design of rapeseed production mechanical structures, such as the cleaning devices of rapeseed combine harvesters [9], seed metering systems of high-precision seeders, and high-quality rapeseed drying equipment [10]. For example, during high-precision rapeseed sowing, seeds inevitably collide with and bounce off the seed scraper, seed metering device, and seed thrower [11,12,13]. These phenomena directly determine the accuracy, pass rate, and sowing efficiency of single-grain precision sowing and are key factors in achieving variable rate precision sowing [14]. Moreover, during the cleaning stage of rapeseed combine harvesting, collisions and bouncing between different seed kernels, seeds, the harvesting device, and the cleaning sieve [15,16,17] significantly affect the cleaning efficiency and harvest loss rate. Above all, the elastic collision recovery performance of rapeseed profoundly affects the design methods, optimization indicators, and performance of rapeseed combine harvester cleaning devices and the high-precision seeders. Therefore, it is of great theoretical and practical significance to have a deeper understanding of the rapeseed restitution coefficient as well as the corresponding elastic collision recovery mechanism.
Though researchers around the world have conducted work on agricultural machinery and equipment related to rapeseed, there are few reports on the elastic properties and collision mechanisms of rapeseed. On the other hand, though there are some studies on the restitution coefficient of corn kernels [18], peanut kernels, and wheat grains [19,20,21,22] reported in recent years, few works have been focused on rapeseed kernels, which might be due to the fact that the small volume and light weight of rapeseed kernels make experimental testing operations more difficult and impose higher requirements on the reliability and stability of testing equipment [23,24,25]. Moreover, although some scholars have adopted the MFBD–DEM coupling methodology to study the microstress characteristics of rapeseed in secondary collisions [26], along with high-speed imaging technology to study the energy change characteristics during the collision process [27,28,29], these studies are mostly concentrated at the microscopic level of the collision process [30,31], while there are few works on the interpretation of the collision mechanisms of granular crops such as rapeseed in the field of agricultural engineering [32]. Thus, it is difficult to directly provide sufficient basis for the precise design of key equipment in rapeseed production.
In order to have a comprehensive understanding of the elastic collision recovery mechanism of rapeseed, a high-speed video–photography system was established; based on this system, a single-factor experiment and a Box–Behnken Design (BBD) experiment were conducted by applying drop height, collision material type, material thickness, and rapeseed moisture content as the independent variables, while the rapeseed restitution coefficient was the dependent variable. Moreover, the stress, strain, and energy variation characteristics during the collision process have also been investigated by employing the EDEM (2022 version) and ANSYS (2023 version) software in the hope of providing some mechanical basis and theoretical references for designing as well as optimizing the related precision agricultural equipment.

2. Materials and Methods
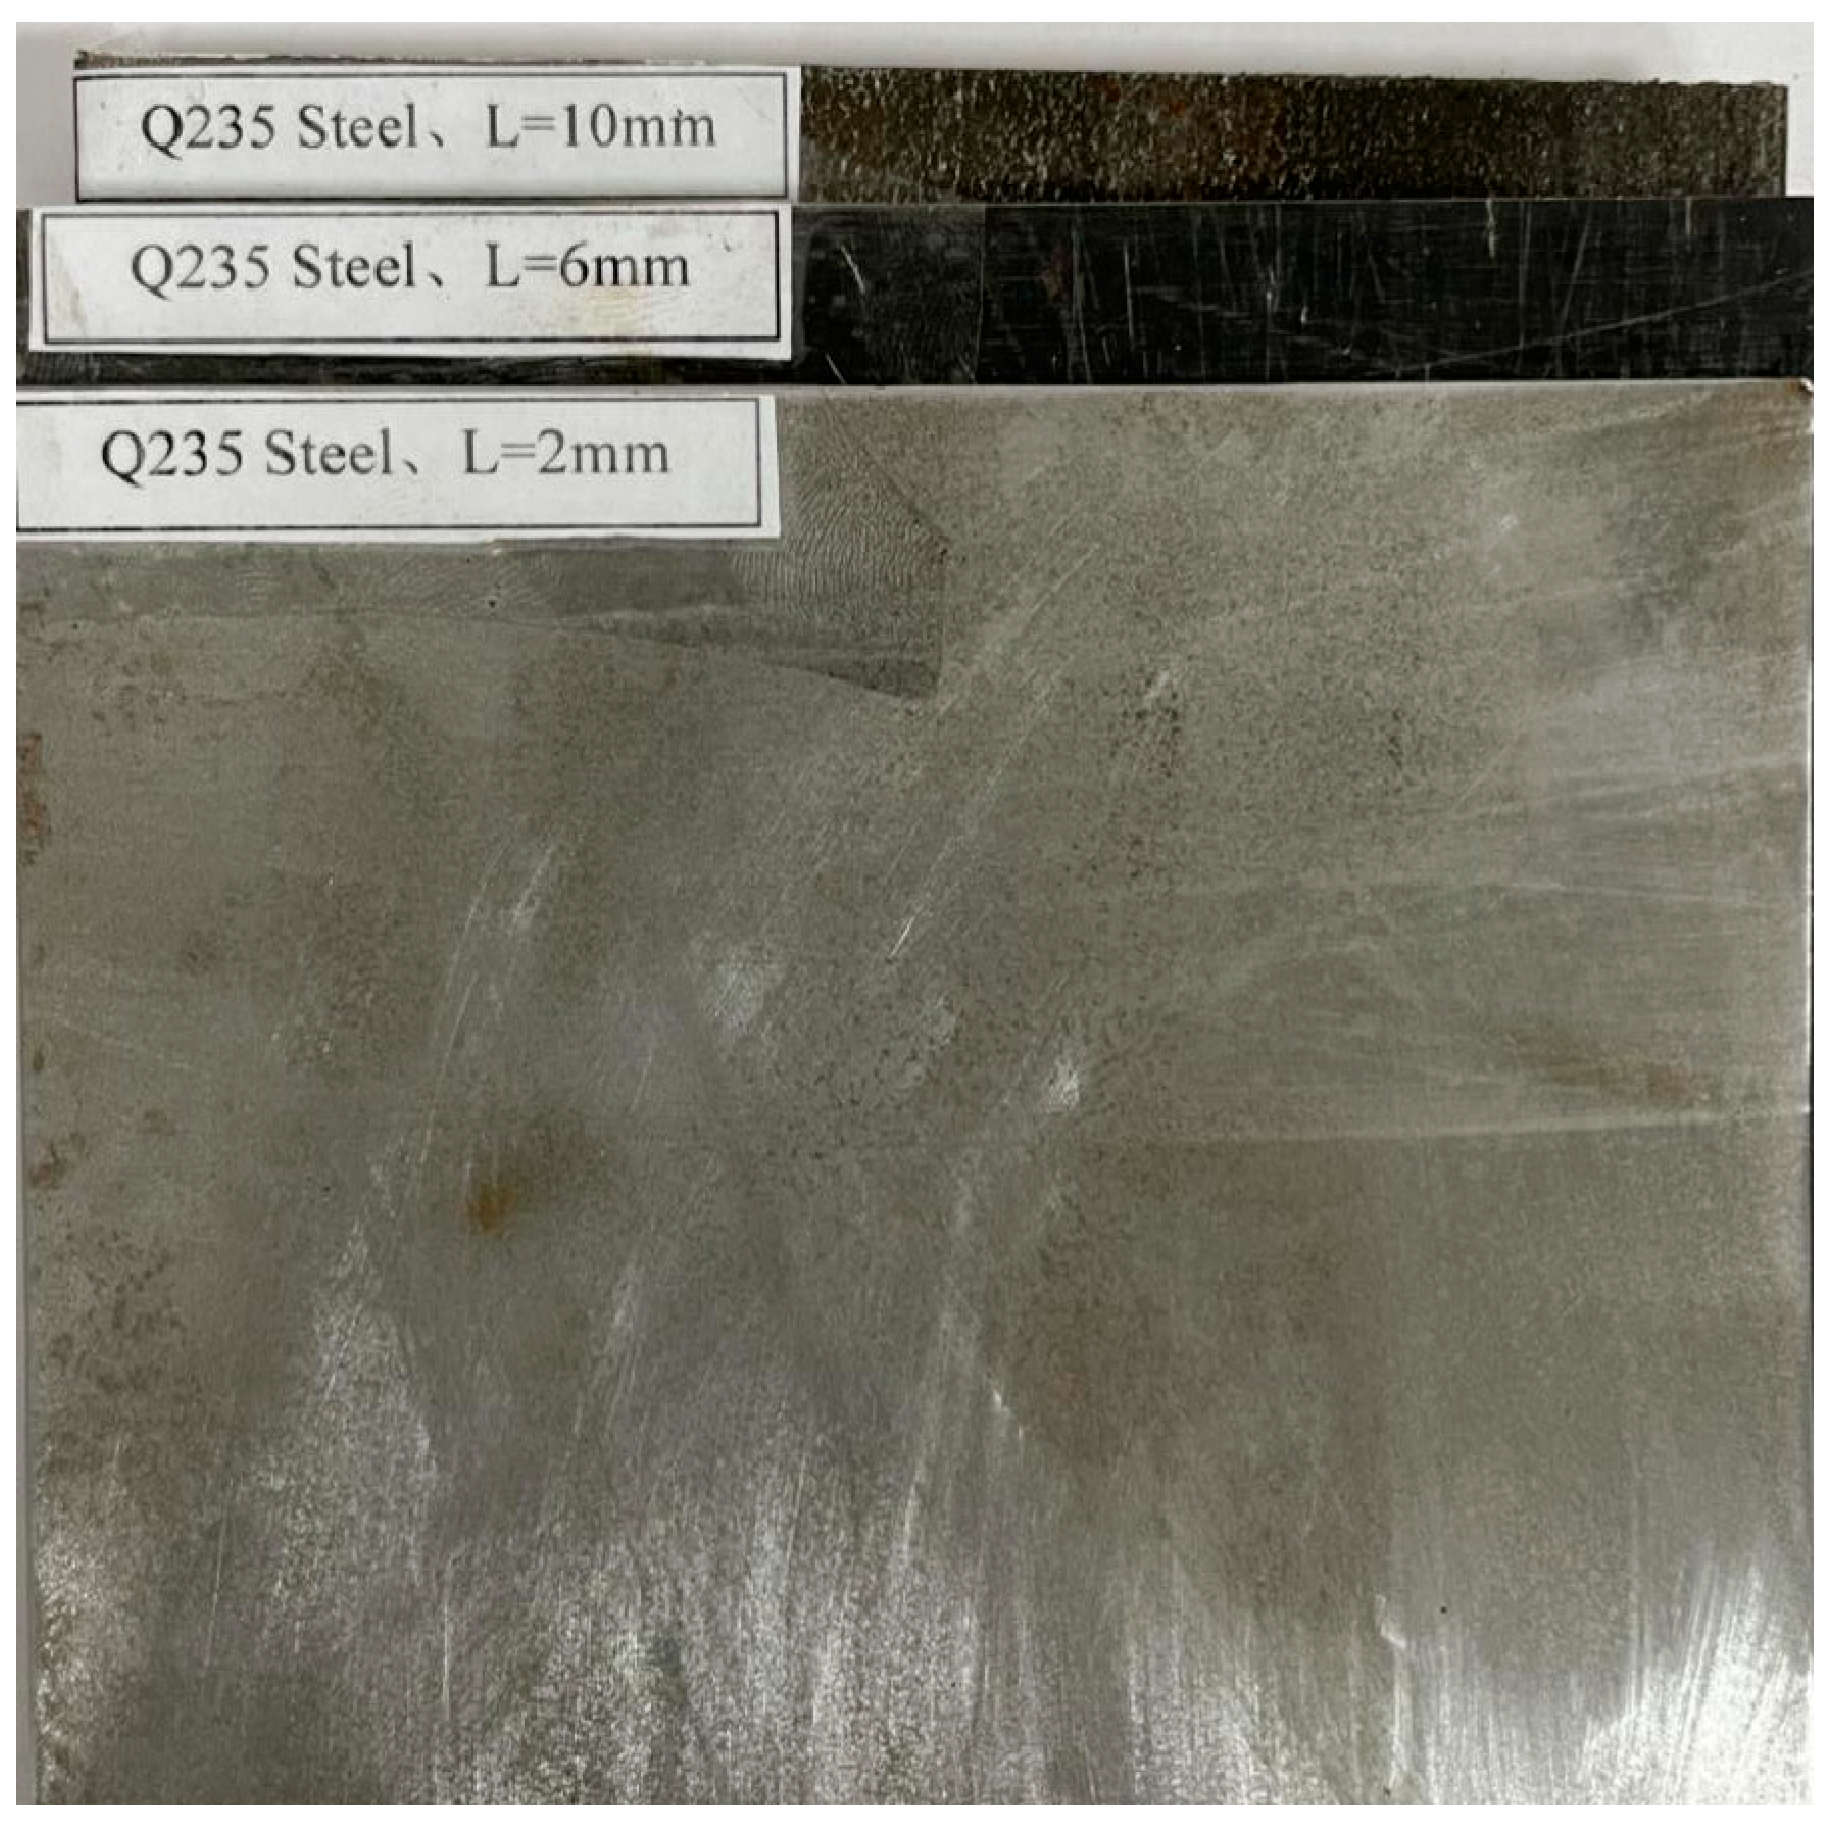
2.1. Materials

The rapeseed sample (Brassica napus L.) was harvested in May 2023 and purchased from a regional oilseed research center. The samples with similar size, uniform color, and full particles were selected for the experiments. The initial moisture content of the samples was determined to be 25.32%w.b. by using the 105 °C drying methodology, seen in the following Equation (1) [33]. The samples with different moisture content (10%w.b., 20%w.b., 30%w.b.) were prepared by using the humidification method, and the corresponding densities were measured for the experiments.
To precisely adjust the initial moisture content of rapeseed, we employed the artificial spray humidification method. Firstly, a certain amount (e.g., 10 g) of initially dry rapeseed samples (with an initial moisture content of approximately 25.32%w.b., determined by the constant weight method at 105 °C) was evenly spread in a shallow dish. Then, using a small spray bottle, the pre-calculated amount of distilled water was uniformly and slowly sprayed onto the surface of the rapeseed. The amount of water added was obtained from Equation (2). During and after the spraying process, the rapeseed was continuously manually mixed to ensure an even distribution of moisture, preventing local over-wetting or clumping.
After the spray humidification, the samples were not immediately used for experiments but were transferred to a well-sealed container to isolate them from changes in external environmental humidity. This ensured that the moisture inside the samples diffused evenly and reached an equilibrium state. The equilibrium period was set at 24 h, which was determined based on preliminary experiments. We monitored the changes in moisture content of the samples at different time points and found that after 5 h, the difference in moisture content between different parts of the samples was less than 0.2%w.b., and the moisture content remained stable over the subsequent 3 h (with changes less than 0.1%w.b.), indicating that the moisture had been fully balanced. During the equilibrium period, the samples were stored in the sealed container and kept in a constant-temperature environment.
M c = m 0 m t m 0 100 %
W = m 0 M ct M c 1 M c t
where Mc is the moisture content of rapeseed, %w.b; m0 is the initial mass of the sample rapeseed, g; mt is the mass of the rapeseed varying with time, g; W is the amount of water added, g; and Mct is the target moisture content, %w.b.

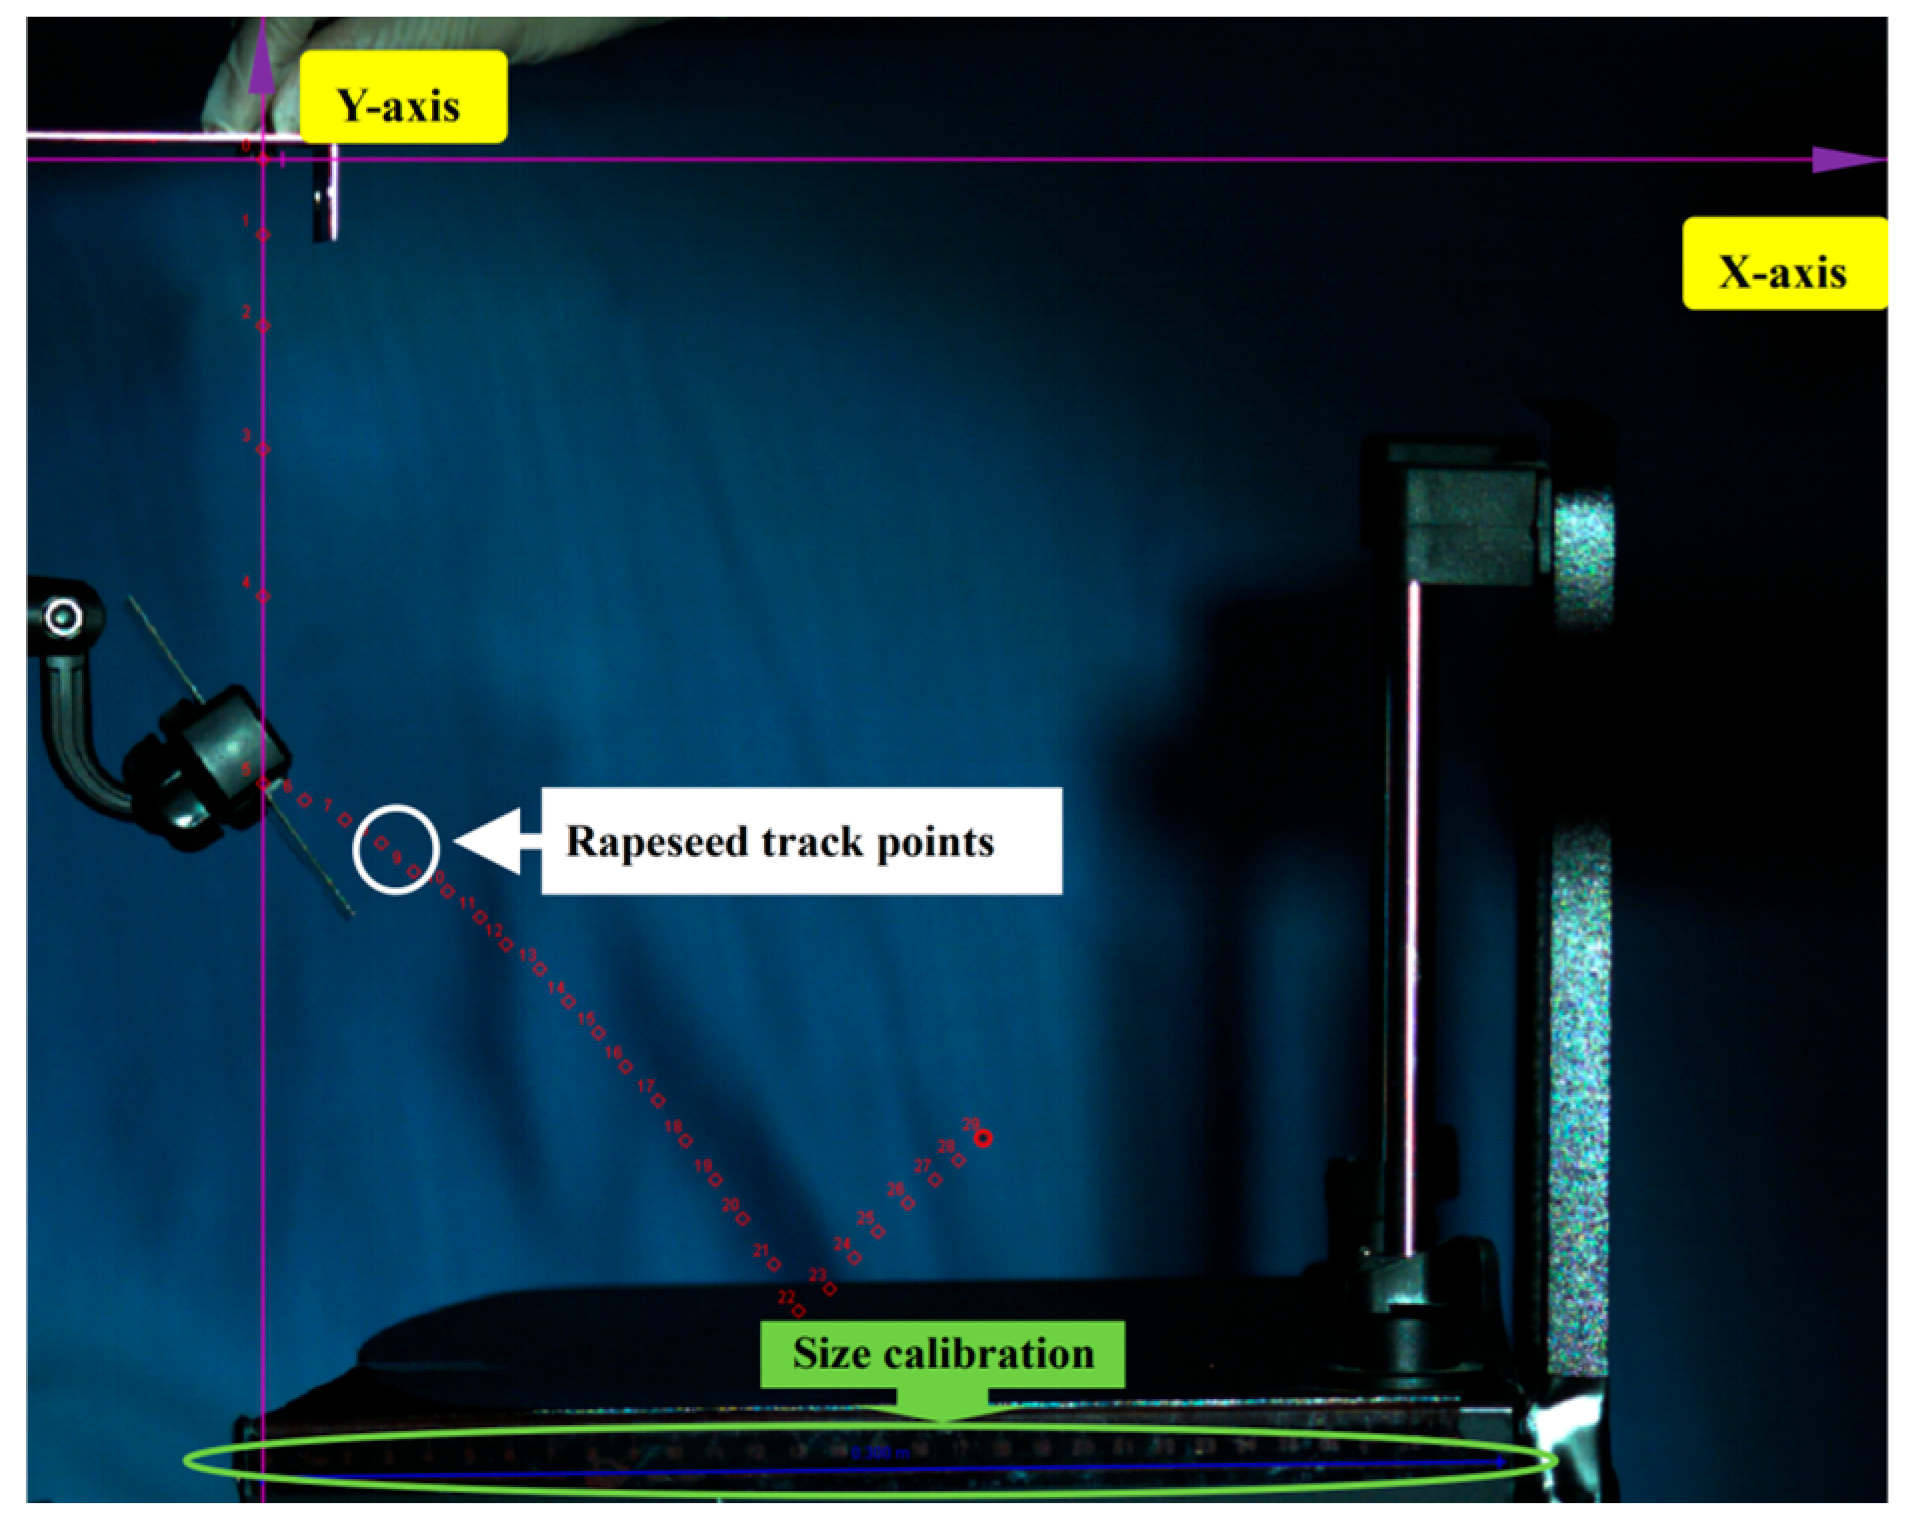
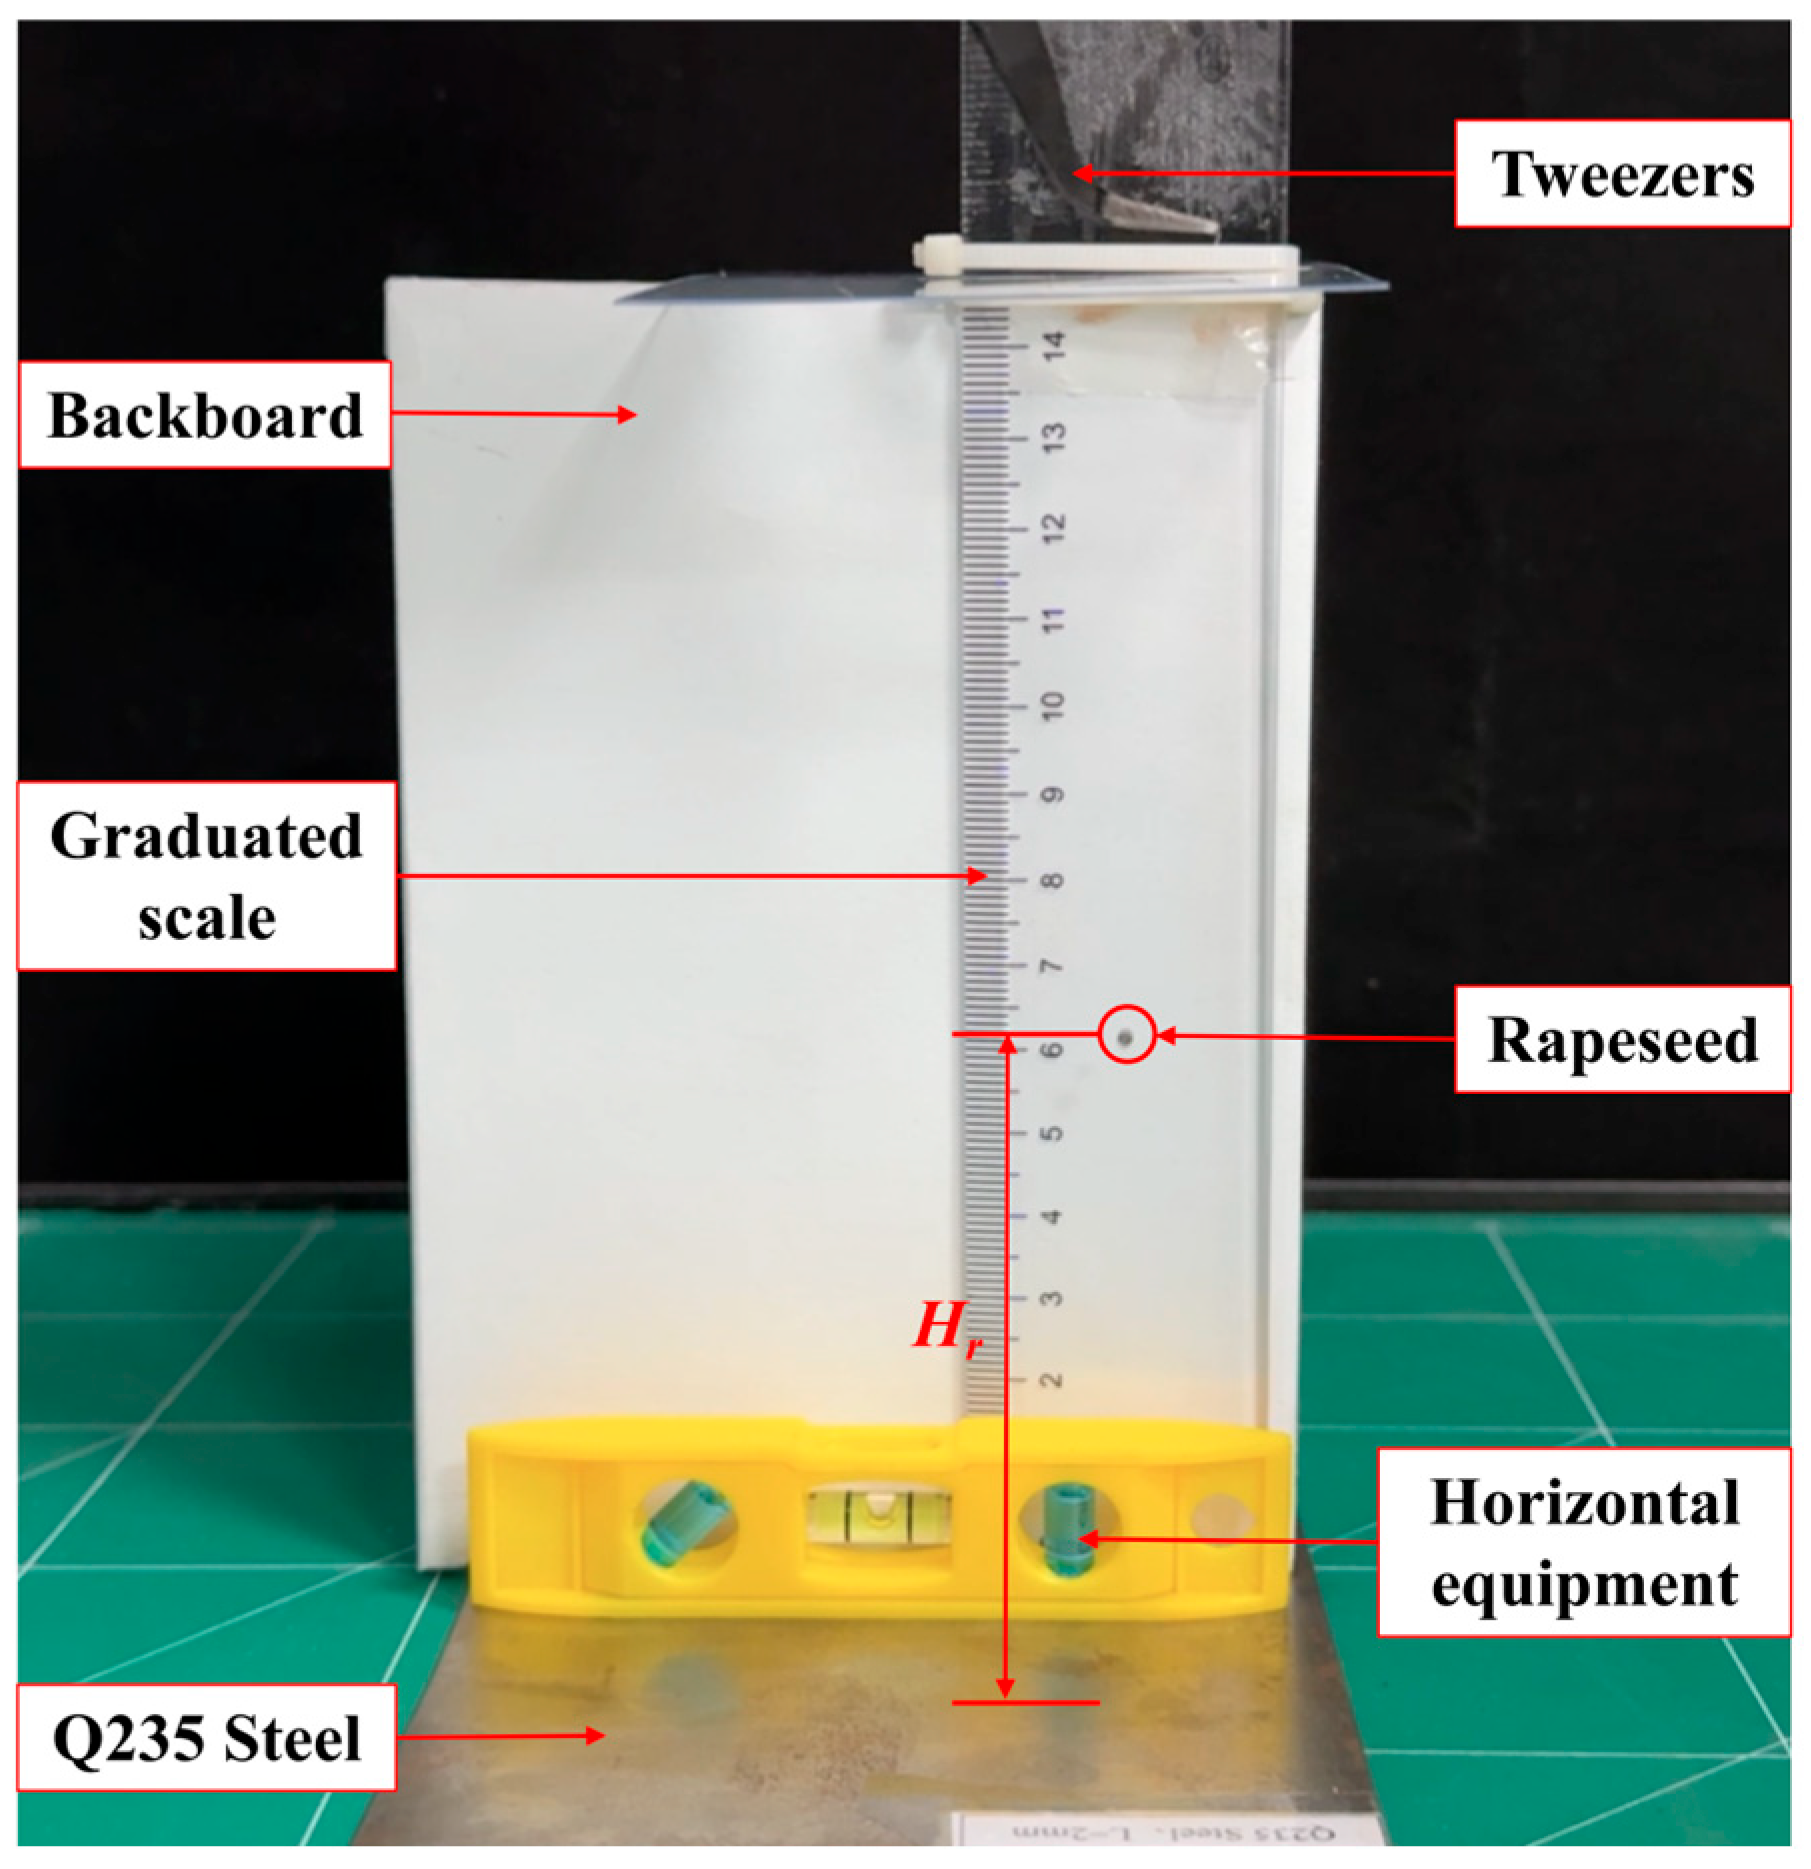
2.2. Device and Measurement Design

Huang, X.M. et al. [34] used the above method to calculate the elastic impact restitution coefficient of rapeseed grains by measuring the horizontal and vertical component velocities. Based on the same principle, the researchers built a platform for measuring the elastic collision restitution coefficient of rapeseed. Photographs of the experimental setup, its schematic diagram, and high-speed images of rapeseed trajectories are, respectively, shown in Figure 1a–c. Figure 1b shows that the device is mainly composed of four parts: a high-speed camera (Photron, Tokyo, Japan), a collision measurement system, a supplemental lighting device (Shenzhen Longood Intelligent Electric Co., Ltd., Shenzhen, China), and a human–computer interface. The collision measurement system comprises eight components: a support rod, a base, a sliding-lock mechanism, a feeding frame, a reference plate, a ruler, an oil film, and collision material, as shown in Figure 1c. The collision material was mounted between upper and lower sliding mechanisms at 45° to the horizontal plane, and the angle could be adjusted via a movable hinge. During the experiments, the rapeseed sample dropped vertically from the reference plate onto the collision material, then underwent parabolic motion (as indicated by the red dotted line in Figure 1c). A high-speed camera recorded the rapeseed trajectory pre- and post-collision. Tracker software measured the vertical velocity Vy pre-collision and the horizontal velocity Vx post-collision. Wang et al. [20] applied this method to wheat kernels, demonstrating the reliability of the derived restitution coefficient. Each experiment was repeated three times, with the average used for calculations. Experimental instruments are listed in Table 1.

2.3. Theoretical Calculations

The collision recovery coefficient (e) is defined in the kinematics principle as the absolute value of the ratio of the instantaneous velocity vout after the collision of the material to the instantaneous velocity vin before the collision, which can be expressed as Equations (3) and (4) [35]:
e = v o u t v i n
e c = V n V O n = V x 2 + V y 2 1 2 cos 45 ° ± arctan V y / V x V O sin 45 °
where ec is the elastic collision recovery coefficient of rapeseed. Vn is the velocity along the normal direction after the collision between the rapeseed and the collision material, m·s−1. Von is the partial velocity in the normal direction of the collision front between rapeseed and the collision material, m·s−1. Vo is the instantaneous velocity before collision between rapeseed and the collision material, m·s−1. Vx is the component velocity in the horizontal direction after the particle collision, m·s−1. Vy is the component velocity in the vertical direction after the particle collision, m·s−1. When Vy is negative, the ± sign in Equation (4) should be taken as a ‘–’ sign; otherwise, it should be taken as a ‘+’ sign.
During the test, the video recorded at 500 frames per second (fps) by the high-speed camera was transferred to the Tracker software to analyze the horizontal (Vx) and vertical (Vy) velocity components. A physical ruler with a length of 30 cm, mounted on the collision plate, was used for calibrating the scale between the Tracker simulation and the actual measurements. The trajectory of rapeseed’s movement obtained from the Tracker software is shown in Figure 2.

2.4. Experimental Design

To reveal the variation characteristics of the elastic collision recovery of rapeseed, this paper reviewed a large number of documents and found that the key factors affecting the elastic collision recovery characteristics of granular materials mainly include material moisture, collision material content, collision height, thickness of the collision material, and material variety. Moisture content (Mc), collision material, collision height (H), and thickness of the collision material (L) were selected as the key factors affecting the collision recovery coefficient. These factors directly affect the collision, rebound, and final landing position of rapeseed inside the seeder’s seed distributor (such as seed guides, shaped holes, nest wheels, seed plates, and other key components) and are one of the core physical parameters determining seeding accuracy and uniformity [35]. Considering the particularity of the materials of various components of rapeseed seeding machinery, four typical collision materials (aluminum alloy, Plexiglas, SBR rubber, and Q235 steel) were selected for single-factor experiments to determine the elastic collision recovery characteristics of rapeseed under different material conditions. Considering the practical engineering operations of rapeseed (such as sowing, harvesting, and processing), a single-factor experimental design was developed, which is detailed in Table 2. Based on the collision material that determines the maximum collision recovery coefficient (ec), a central composite rotational regression experiment based on BBD design was further conducted to explore the effects of Mc, H, and L on ec. The experimental design is detailed in Table 3.
To ensure the reliability of the BBD (Box–Behnken Design) experiment, each group of experiments was conducted three times independently, and the response variable value (elastic collision recovery coefficient of rapeseed) was taken as the arithmetic mean of the three measurements. Outlier detection was performed through intuitive observation and the criterion (a single measurement value exceeding the group mean ±3 times the standard deviation), with no outliers identified, and all data were retained. Before constructing the regression model, residual analysis was conducted to verify that the response variable met the assumptions of normality and homoscedasticity, and no data transformation was performed. In the regression modeling based on Design-Expert software (version 13), the criteria for model selection included:
(1)
Significance of terms (p < 0.05).
(2)
Maximizing the adjusted R2 (to avoid overfitting).
(3)
Predicted R2 close to the adjusted R2 (to ensure predictive capability).
(4)
Non-significant lack-of-fit test (p > 0.05).
(5)
Prioritizing a parsimonious model with fewer significant terms.

2.5. Uncertainty Analysis

In scientific research and engineering practices, the systematic identification, quantification, and evaluation of uncertainties are fundamental to model construction, experimental design, and system analysis. The core of this process lies in rigorously defining the spectrum of uncertainties introduced by factors such as input parameter fluctuations, model structural deviations, and measurement errors, and analyzing their propagation mechanisms and impact on the output results. Such a robust assessment of the results, based on uncertainty quantification, has become a standard method for verifying the reliability and reproducibility of the experimental conclusions. In this study, the uncertainty in the experimental data was quantified based on Equations (5) and (6).
N = i = 1 r N i r
u = 1 r 1 i = 1 r N i N
In the high-speed camera rig experiments, pixel resolution and frame rate are the main factors affecting the measurement accuracy of the key velocity parameters (Vx, Vy, V0). The uncertainty of these parameters will directly propagate to the final calculated value of the elastic collision recovery coefficient of rapeseed. Therefore, a detailed uncertainty assessment was carried out for the relevant measurement parameters (including Vx, Vy, V0) in the experiments, and the specific quantification results are shown in Table 4.

2.6. Theoretical Consideration

To study the elastic collision recovery coefficient of rapeseed, the following hypotheses were considered in this paper:
(1)
The internal water content gradient of a single rapeseed is ignored.
(2)
There is no rotational movement of the rapeseed during the falling process.
(3)
The surface of the colliding material is smooth.
(4)
The influence of individual shape differences of rapeseed on the experimental results can be ignored.
(5)
A single rapeseed is considered a standard sphere.

3. Results

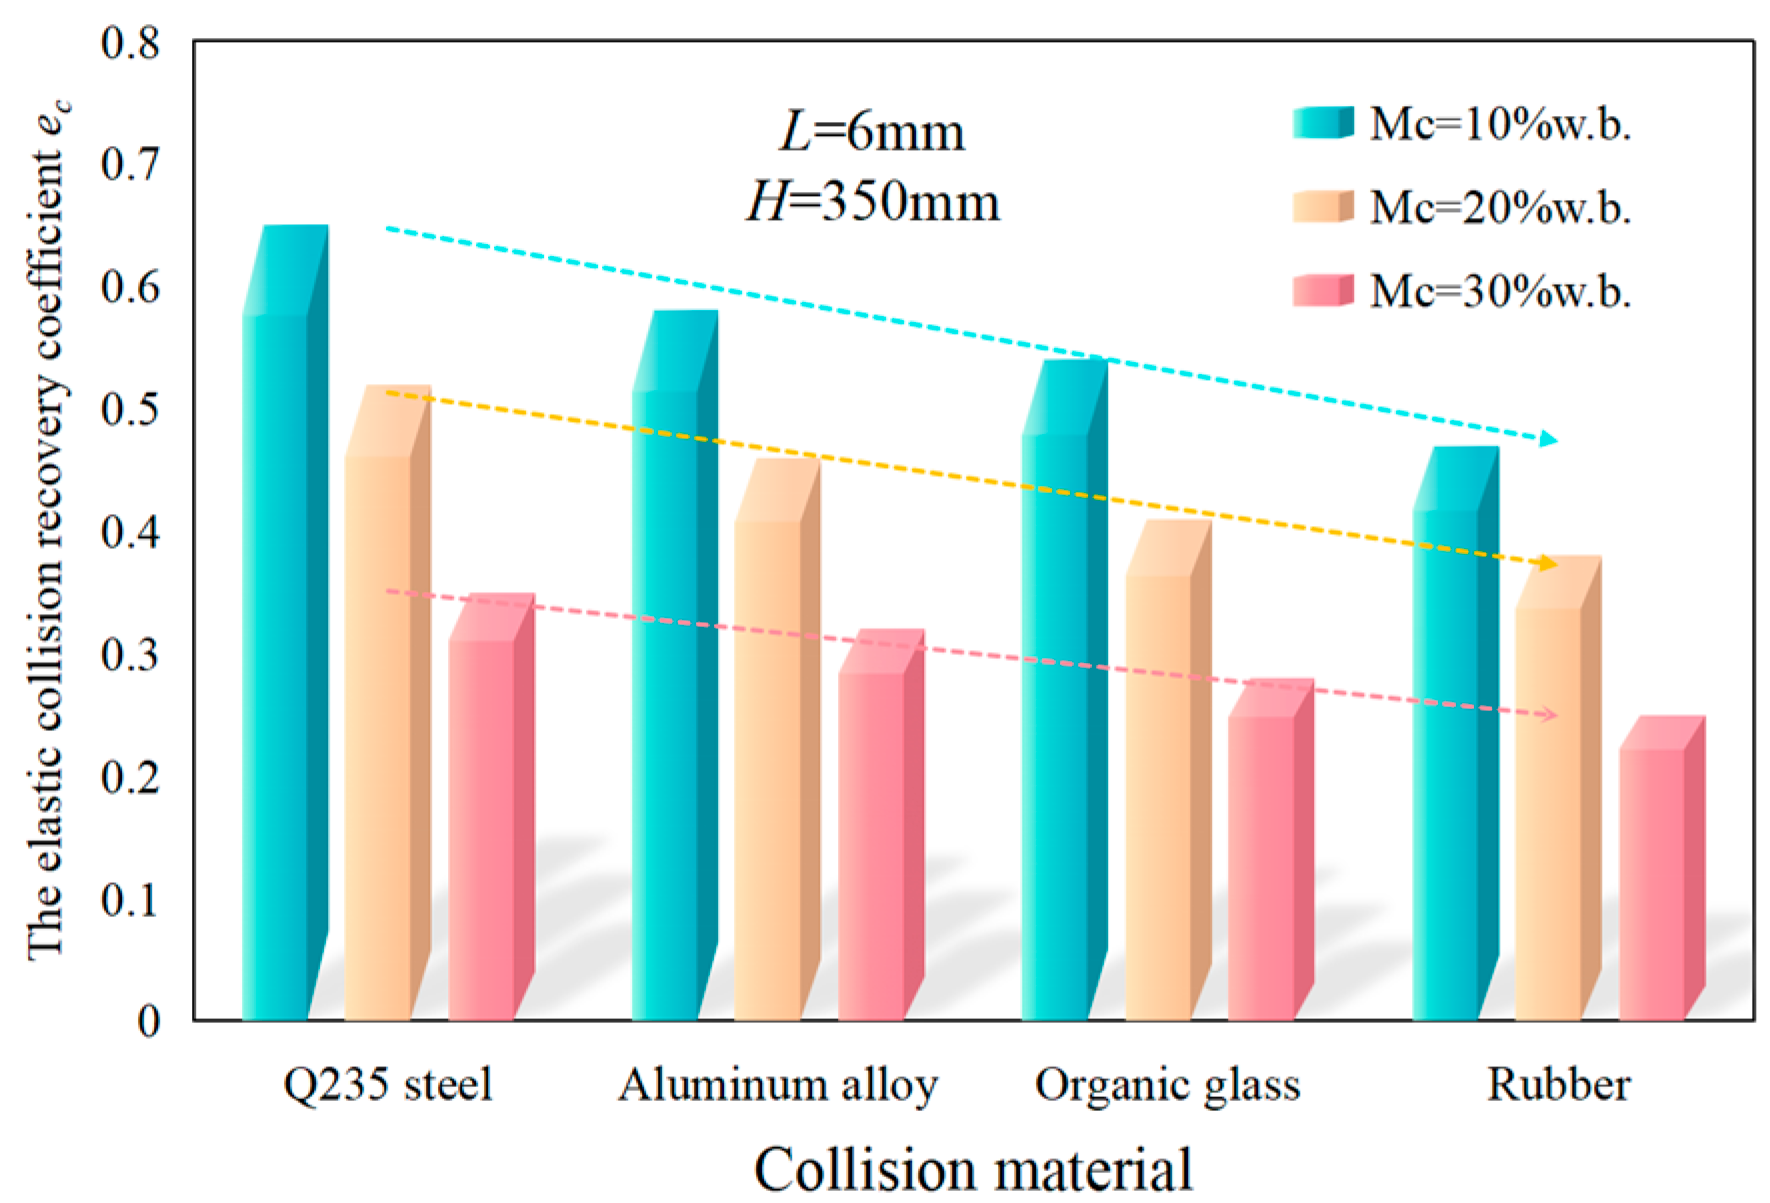
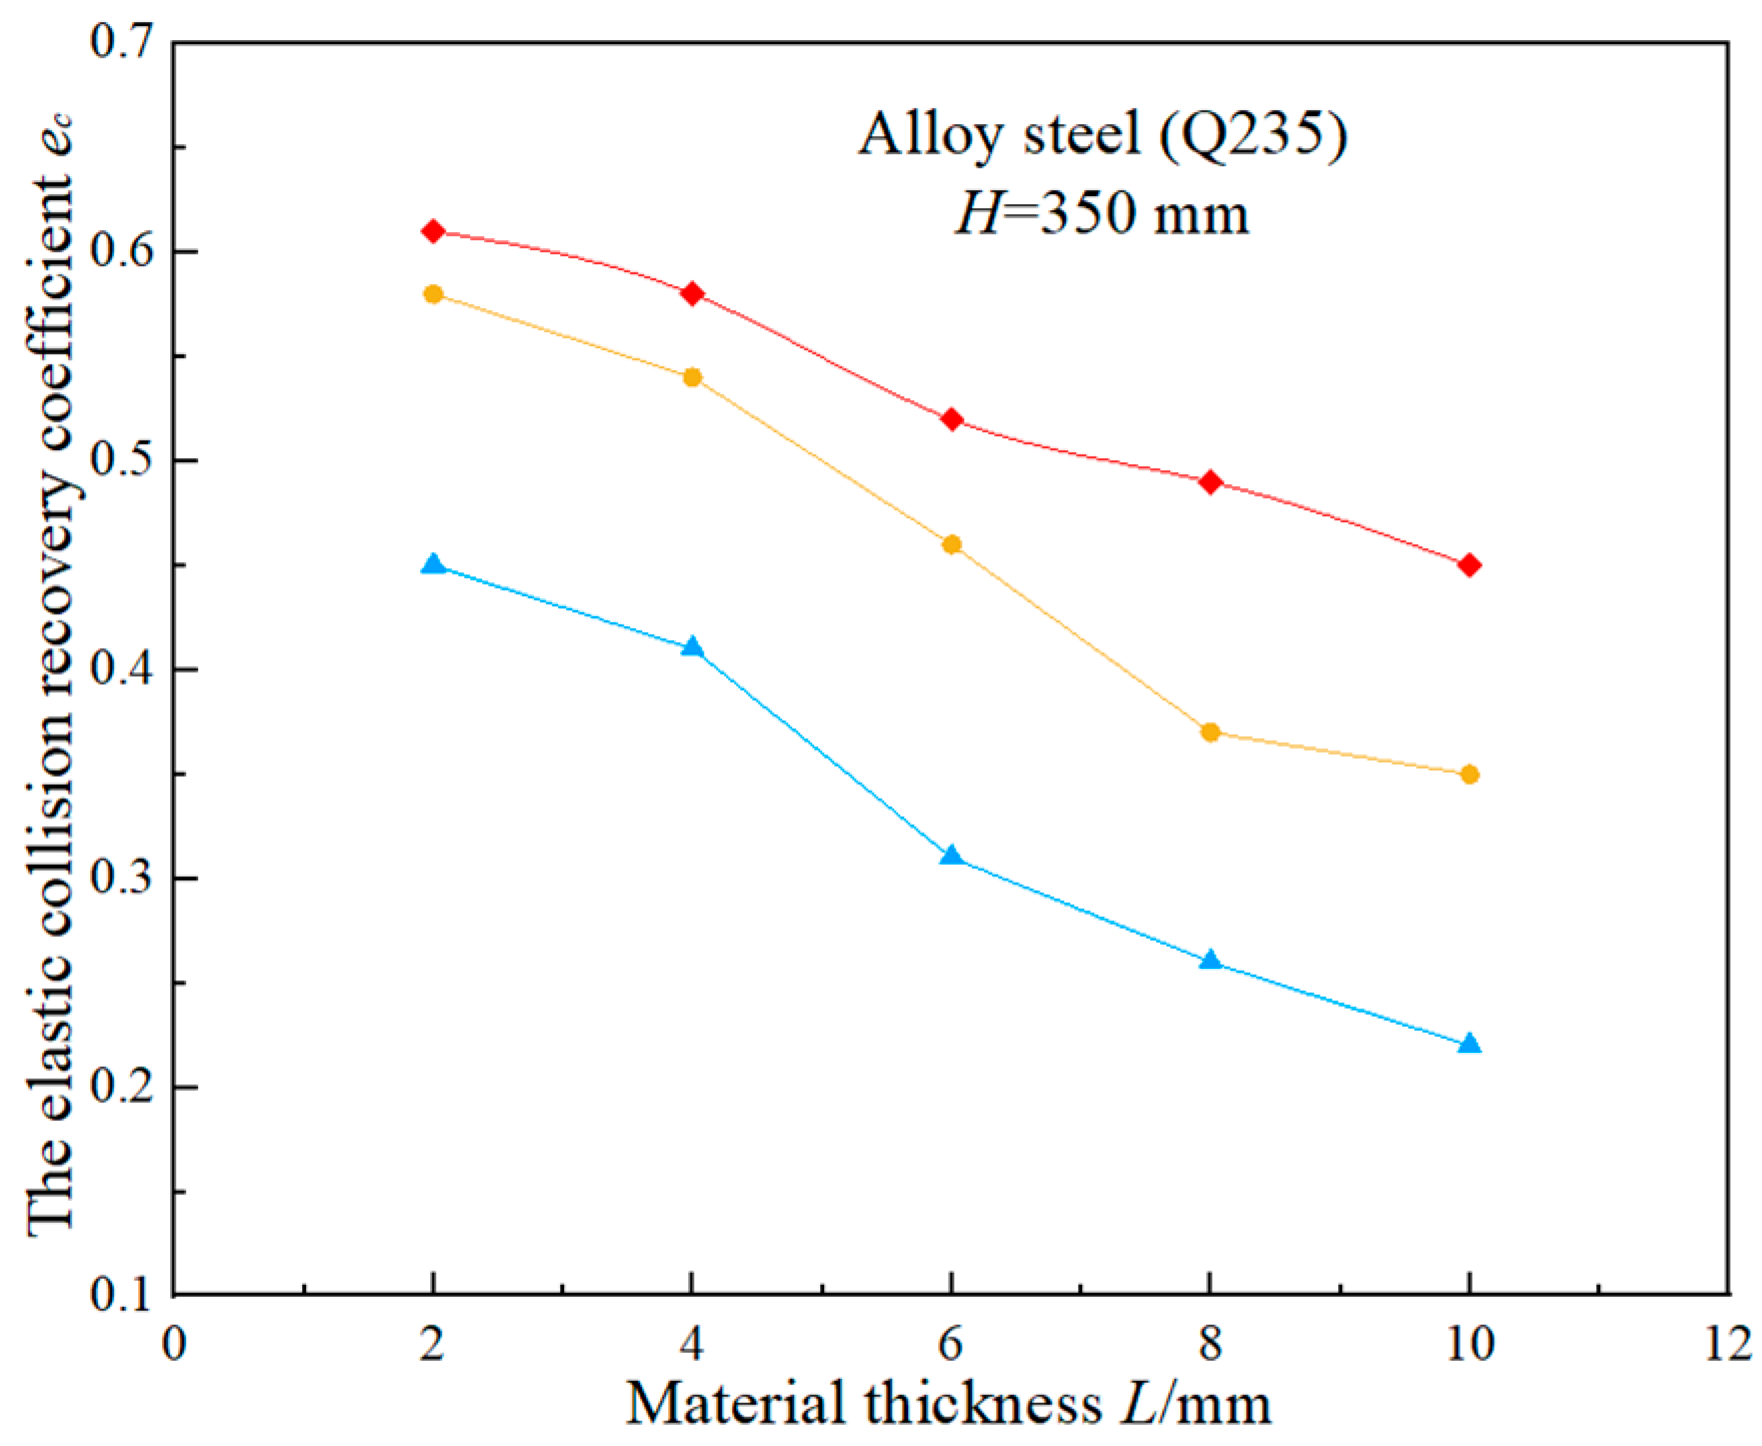
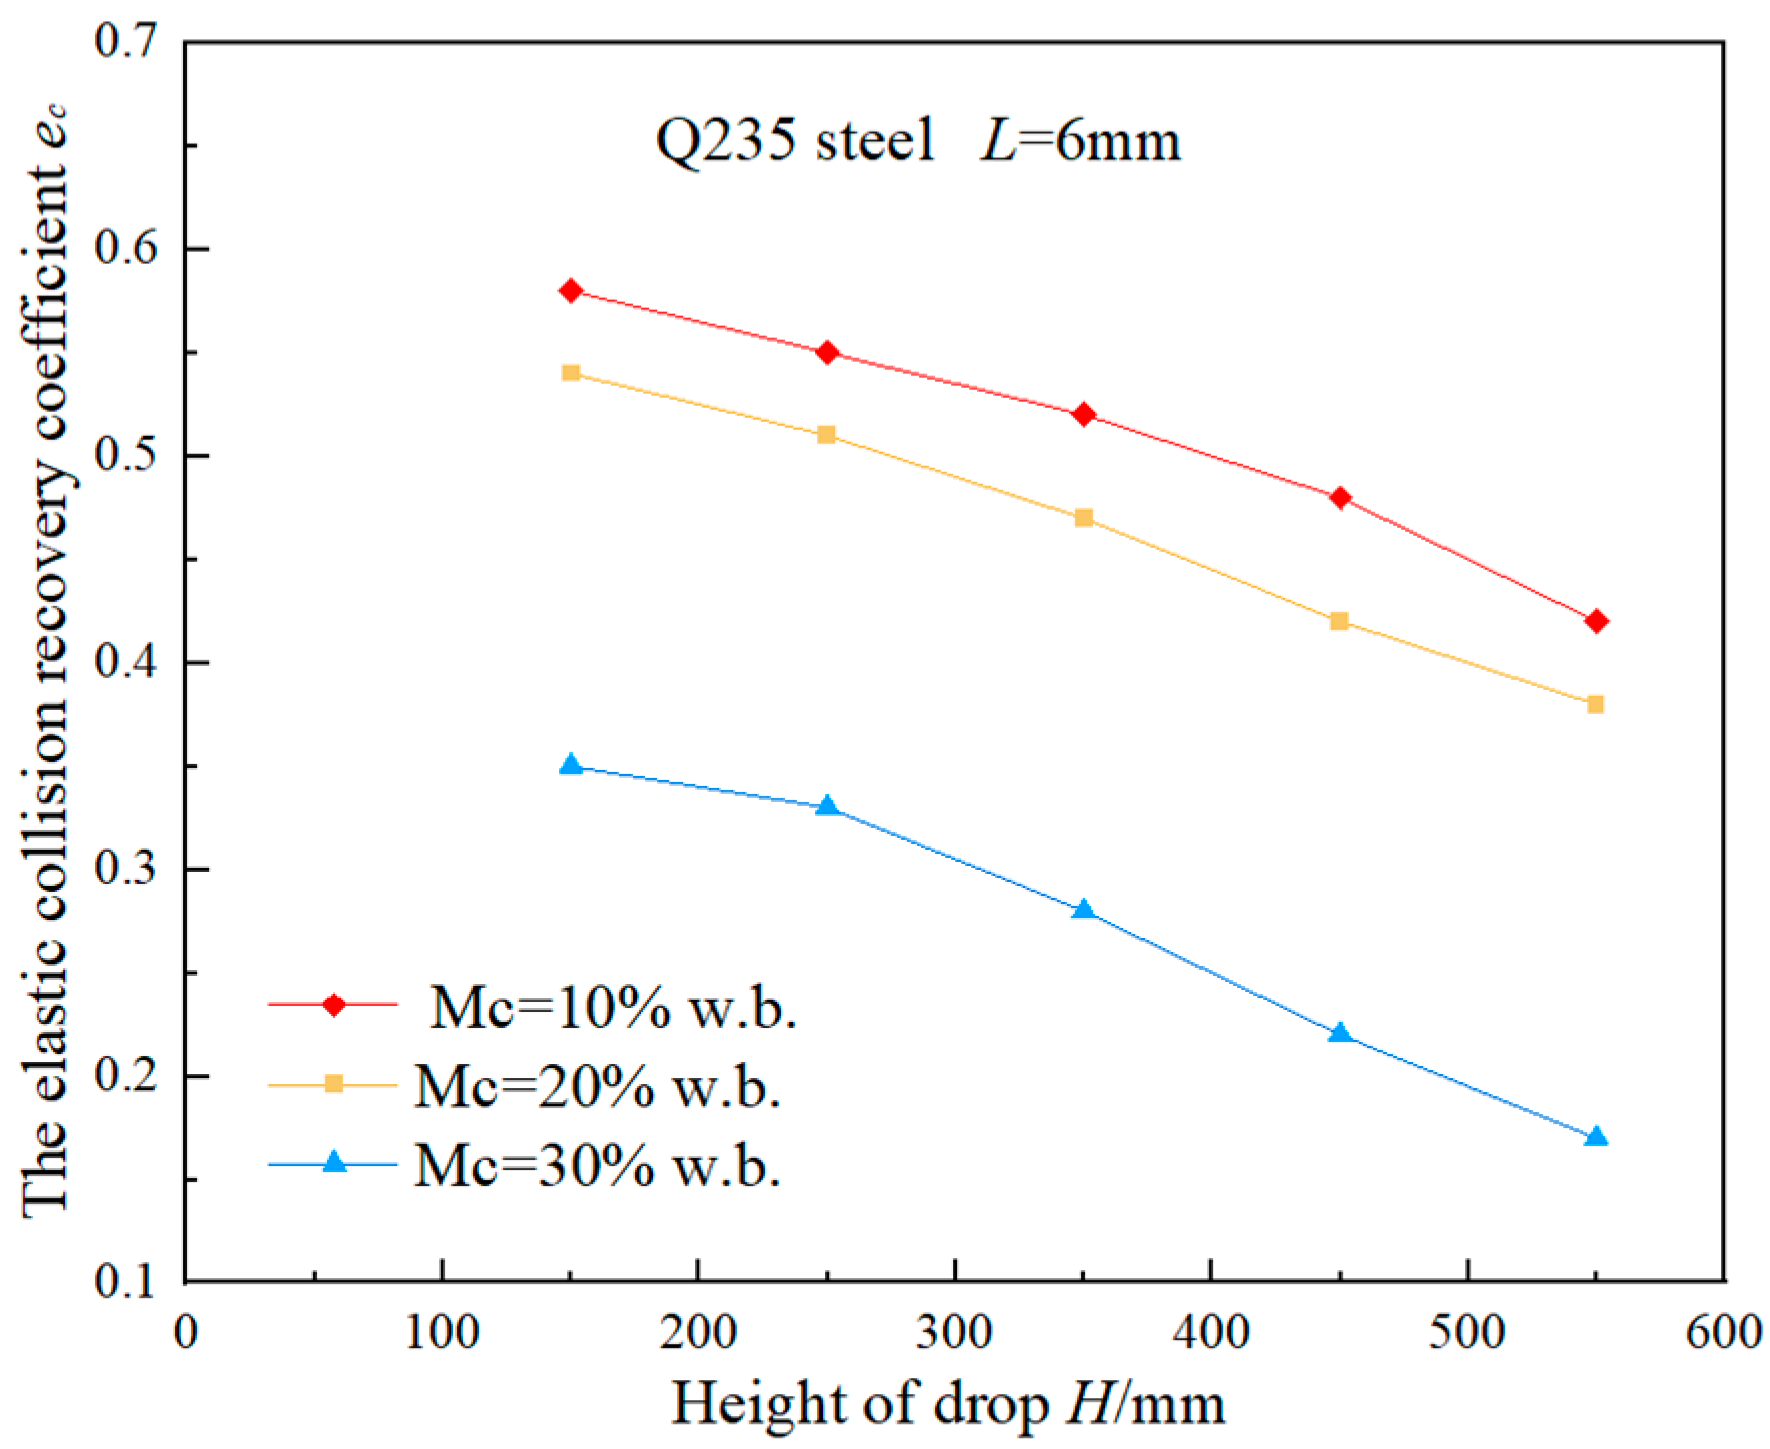
3.1. The Results of the Single-Factor Experiment

Based on Table 2, the effects of material type, drop height (H), moisture content (Mc), and layer thickness (L) on the ec are presented in Figure 3, Figure 4, Figure 5 and Figure 6. Figure 3 shows that the highest ec values occur during rapeseed–Q235 alloy steel collisions at specific moisture levels. For the rapeseed seeder, to ensure the smooth discharge of rapeseed and avoid clogging, it is necessary to increase the ec value of rapeseed. The material of the seeder is determined to be Q235 steel. On this basis, the influence of the other three factors on ec is further investigated. It can be seen from Figure 5 that the ec decreases with the increase of H and the Mc.

3.2. Center Rotation Regression Experiment

To examine interactions affecting ec, building on single-factor tests, we conducted additional experiments using Q235 steel, with the experiment design detailed in Table 3. The experimental results are tabulated in the following Table 5. The independent variables X1, X2, and X3 in the table represent the falling height H, material thickness L, and moisture content Mc, respectively, while the dependent variable Y represents the experimental response value of the ec. Table 5 shows ec values ranging from 0.539 to 0.649. A regression analysis via Design-Expert software (version 13) yielded the model shown in Equation (7). The correlation coefficient R2 of the model is ascertained to be 0.9589, indicating that the predicted value of the model is in good agreement with the measured value, and the reliability is high.
Y = 0.015719 M c + 0.238 × 10 3 M c 2 0.017438 L + 0.21 × 10 4 H L 0.000254 H + 0.656 × 10 3 L 2 + 5.375 × 10 6 H M c 0.56 × 10 4 L M c 0.5 × 10 9 H 2 + 0.883344
The ANOVA analysis of the experiments is tabulated in Table 6. Obviously, it can be seen from Table 6 that the p-value of the established model is 0.0005, while it is higher than 0.05 for the lack of fit term, indicating that the designed model is reliable. In addition, it can be seen from the table that the terms of H, L, Mc, H·L, and Mc2 have significant effects on the ec. Among them, the effect of falling moisture content on the rapeseed collision recovery coefficient was extremely significant (p < 0.0001). The order of influence of these factors is Mc > Mc2 > L > H·L > H.

4. Discussions

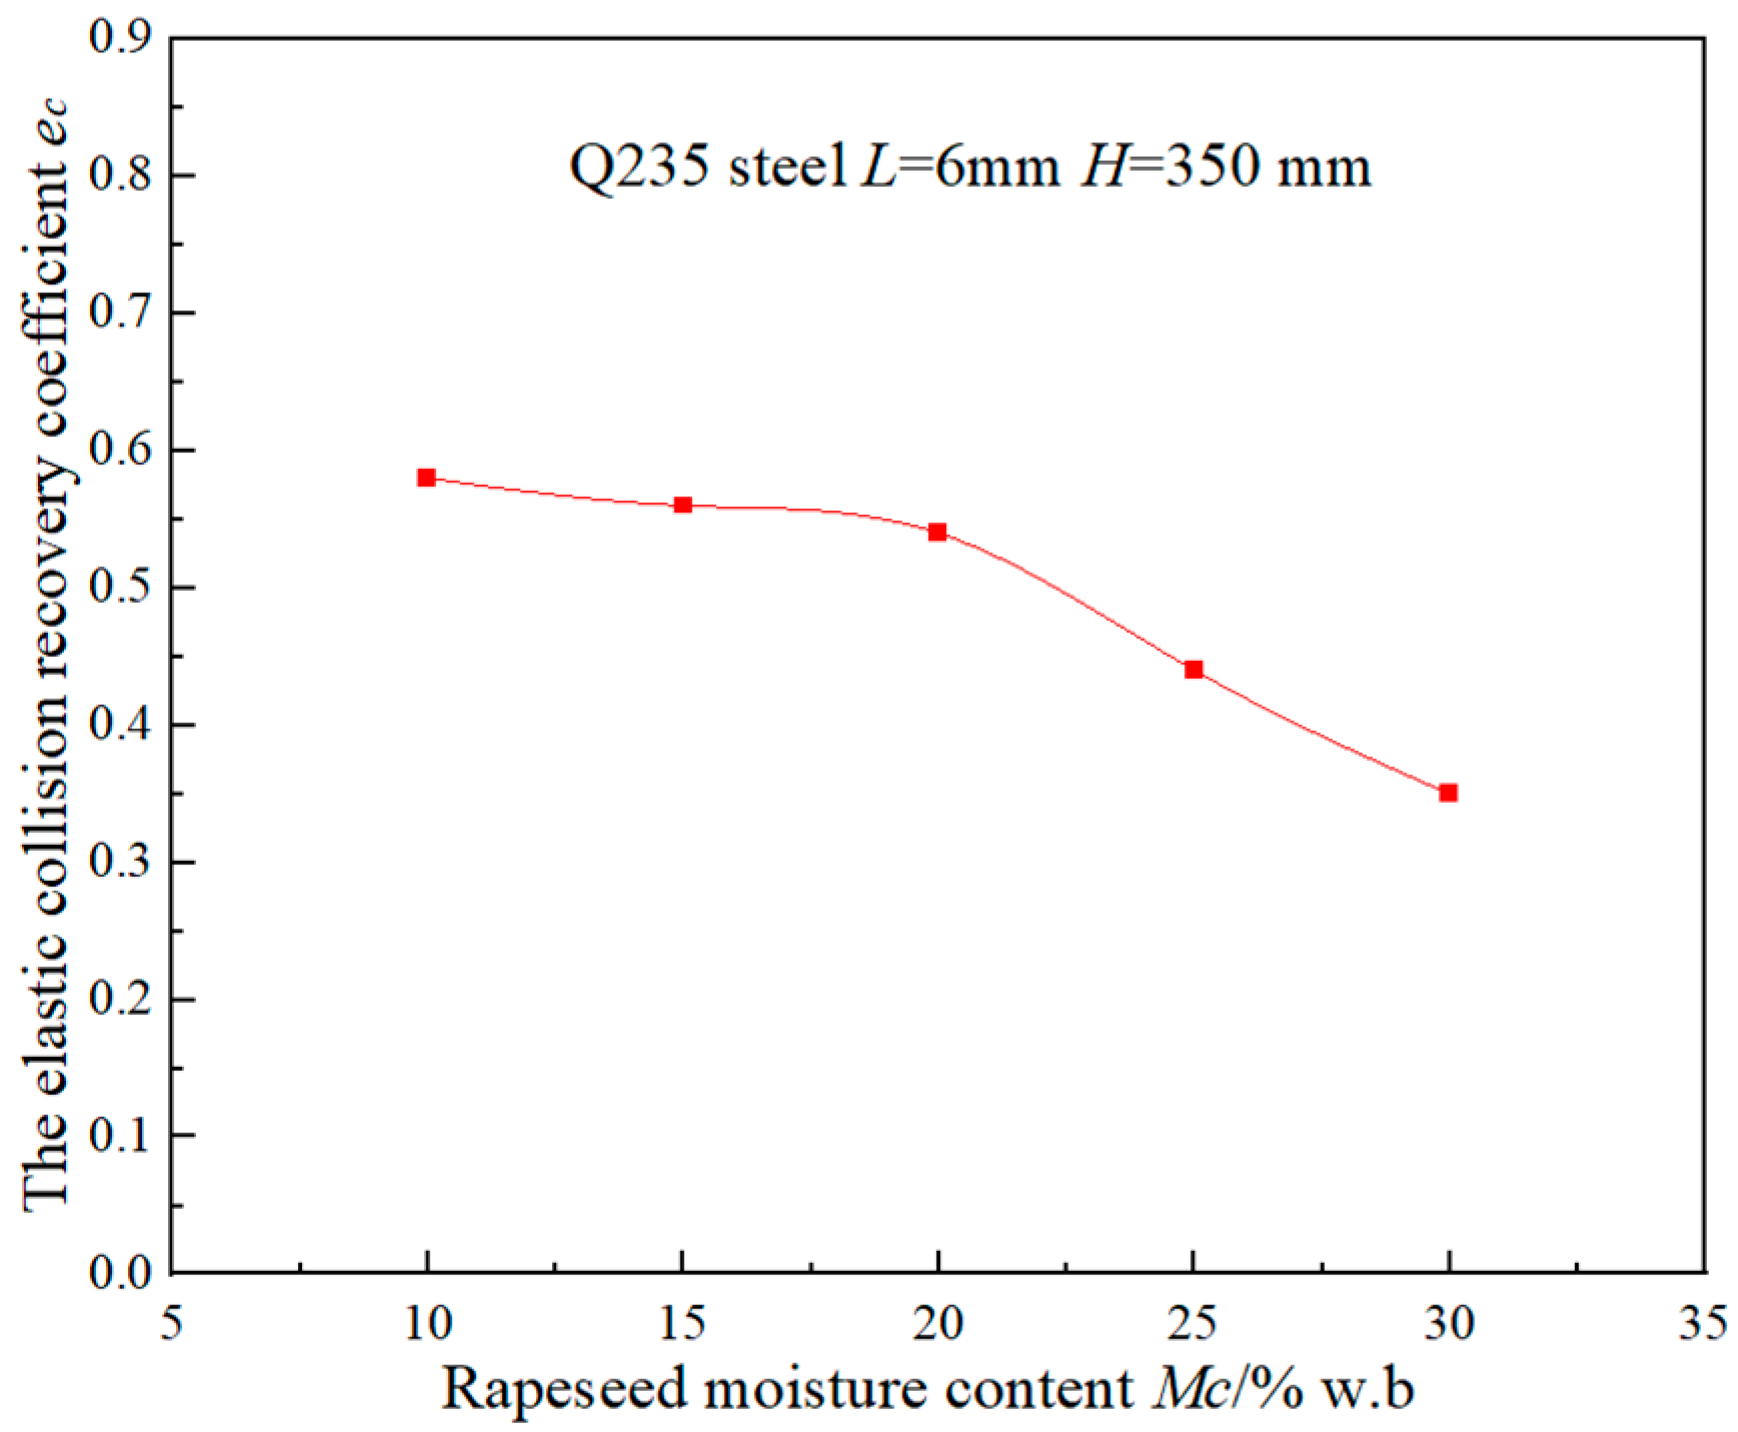
4.1. The Variations of H and Mc with ec

Based on the results obtained from the single-factor experiment shown in Section 3.1, the Q235 was determined to be the collision material. The results show that ec decreases with the increase of H and Mc, which might be due to the fact that increased dropping height (H) enhances the kinetic energy of the rapeseed at the moment of impact, thereby exacerbating plastic deformation at the collision point and internal micro-damage (such as cell wall rupture and crack propagation). These irreversible processes dissipate more kinetic energy, reducing the rebound kinetic energy and thus lowering the restitution coefficient (ec) [36]. Meanwhile, the elevated moisture content (Mc) softens the rapeseed and increases its viscosity, making it more prone to plastic deformation during collision and consuming more energy through viscoelastic dissipation mechanisms (converted into thermal energy), which further reduces the effective rebound energy and leads to a further decrease in the restitution coefficient (ec) [37].

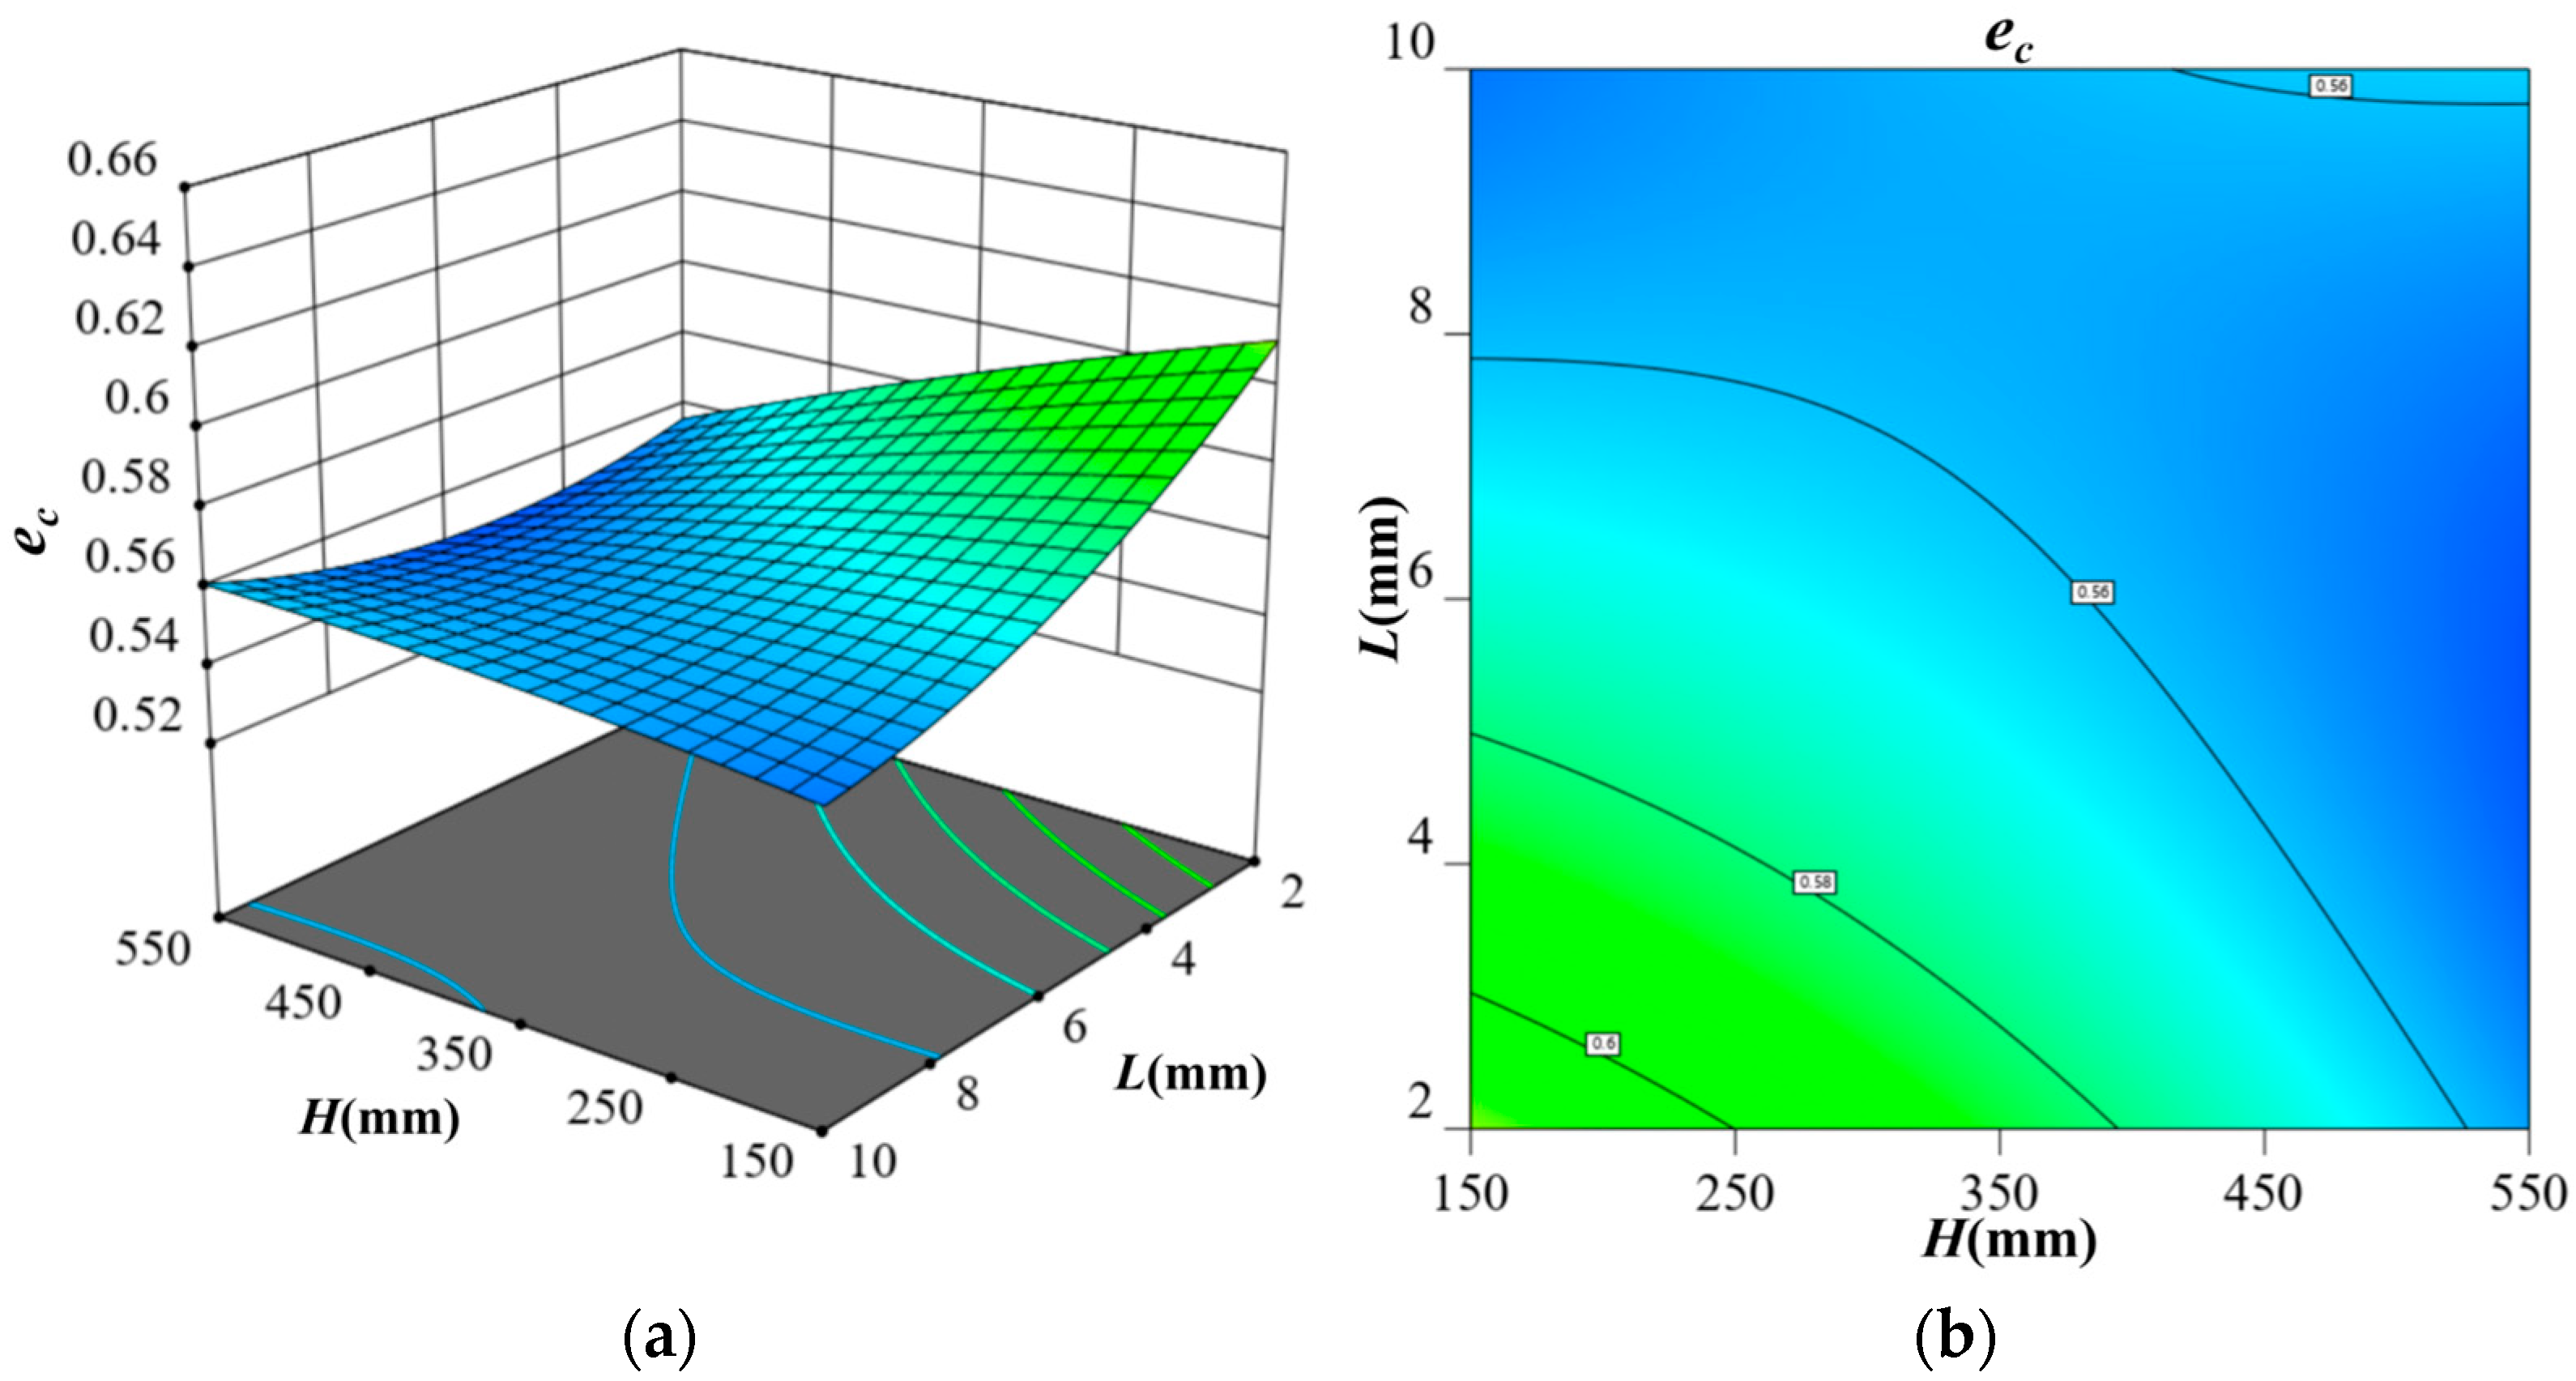
4.2. Effects of Interaction Between Factors on Elastic Rapeseed Collision Recovery Coefficient

As can be drawn from Table 6, it can be seen that the interaction of falling height and material thickness (H·L) has a significant effect on the ec. The specific impact is shown in Figure 7.
As shown in Figure 7a, the recovery coefficient (ec) between rapeseed and the collision material decreases with the increase of dropping height (H) and material thickness (L). This finding differs from the results of J. Wang et al. [21] on the elastic collision recovery coefficient of wheat seeds, a discrepancy that originates from the approximately spherical geometry of rapeseed. Further analysis indicates that higher falling heights (H) lead to greater air resistance during descent, thereby dissipating energy. Concurrently, increased material thickness (L) elevates stiffness, amplifying rapeseed deformation and associated energy loss. Per the energy conservation law, post-collision rebound velocity and energy are reduced, thereby reducing the elastic collision recovery coefficient. Figure 7b illustrates that minimizing the elastic collision recovery coefficient (ec) requires maintaining L and H within an optimal range. The L and H are either too high or too low, which is not suitable. For example, in rapeseed pipeline systems, preventing blockages requires ensuring sufficient particle mobility and bouncing during transport. Therefore, thinner Q235 steel materials need to be selected for processing and manufacturing [38].

4.3. Model Verification

To verify the mathematical model established above, under the existing experimental conditions, the predicted value of (ec) was calculated based on Equation (7), and the value of (ec) was measured using the high-speed camera experimental platform. The results are shown in Table 7. The relative error between the predicted value and the measured value is less than 1%, which confirms the reliability of the model.

5. The Experimental Validation of the Designed ec

5.1. Rapeseed Free-Fall Test Platform

The Q235 steel with relatively smooth surfaces and thicknesses of 2 mm, 6 mm, and 10 mm, respectively, was selected as the impact material, as shown in Figure 8. According to Table 3 above, the rapeseed free-fall test was carried out to verify the rapeseed collision recovery coefficient. The rapeseed free-fall test platform was built. The test platform was composed of a ruler, a feeding datum, a level, a collision material, and a camera, as shown in Figure 9. The ruler was used to determine the distance between the feeding datum and the collision material. The feeding datum ensured that the rapeseed was in the same horizontal plane to allow for free-fall movement. Level adjustment ensured that the collision material remained horizontal, while the high-speed camera clearly captured the rapeseed-impact surface collision.
Q235 steel plates (2, 6, and 10 mm thick) were ground in an angle grinder to achieve uniform surface roughness. A high-speed camera captured rapeseed rebound to peak height post-collision (Figure 9), while maximum rebound heights in free-fall tests under varying conditions were measured. On the test platform, the test was carried out according to the test design shown in Table 3, and the measured value Hr of the maximum height of the rapeseed after free-fall collision was obtained. Each group of tests was averaged three times for calculation.

5.2. Simulation Experiment of Rapeseed Free Fall Based on Discrete Element EDEM

5.2.1. Establishment of Rapeseed Particle Model and Platform

A 0.9 mm-radius spherical particle was added to the bulk material in EDEM software to simulation rapeseed, with a Hysteretic Spring contact model. The spherical particle model has a simple structure and an approximate shape to rapeseed, and the spherical model is consistent with the physical contact state of the actual rapeseed. To validate discrepancies between experimental and simulated restitution coefficients, the height from the particle generator to the collision material was set at 150, 350, and 550 mm. The collision material is Q235 steel with a thickness of 2 mm, 6 mm, and 10 mm, respectively. The test plan is consistent with Table 3 above, and the simulation test platform is shown in Figure 10.
In the EDEM software, the relevant contact parameters for Q235 steel and rapeseed were configured as presented in Table 8. The densities of rapeseed with varying moisture contents were measured. Using the discrete element simulation software EDEM, the process of the rapeseed simulation model freely falling from a specified height onto the Q235 steel model and subsequently rebounding to its maximum height can be observed, as illustrated in Figure 11, where H represents the falling height and Hs denotes the maximum rebound height.

5.2.2. Stiffness Sensitivity Analysis

As shown in Figure 12, in the EDEM rapeseed free-fall collision model, the stiffness parameter (a), damping coefficient (b), and friction coefficient (c) vary within different numerical ranges, and the relative change rate of the simulated rebound height (Hs) does not exceed ±2%. According to the sensitivity analysis criterion proposed by James T. Wassell [41], if the absolute value of the relative change rate caused by parameter variation is less than 5%, it can be considered that the effect of the parameter on the result is negligible. Therefore, the above three parameters do not show significant sensitivity to Hs.

5.2.3. Analysis of Simulation Results

The EDEM simulation results are presented in Table 9. Variables X1, X2, and X3 represent the drop height (H), material thickness (L), and rapeseed moisture content (Mc), respectively, while Y denotes the coefficient of restitution (ec) for rapeseed. Hr is the measured maximum rebound height after free-fall impact, and Hs is the corresponding EDEM-simulated value. The relative error between Hr and Hs remains within ±1%, convincingly demonstrating the reliability of the coefficient of restitution obtained from the experimental measurement platform.

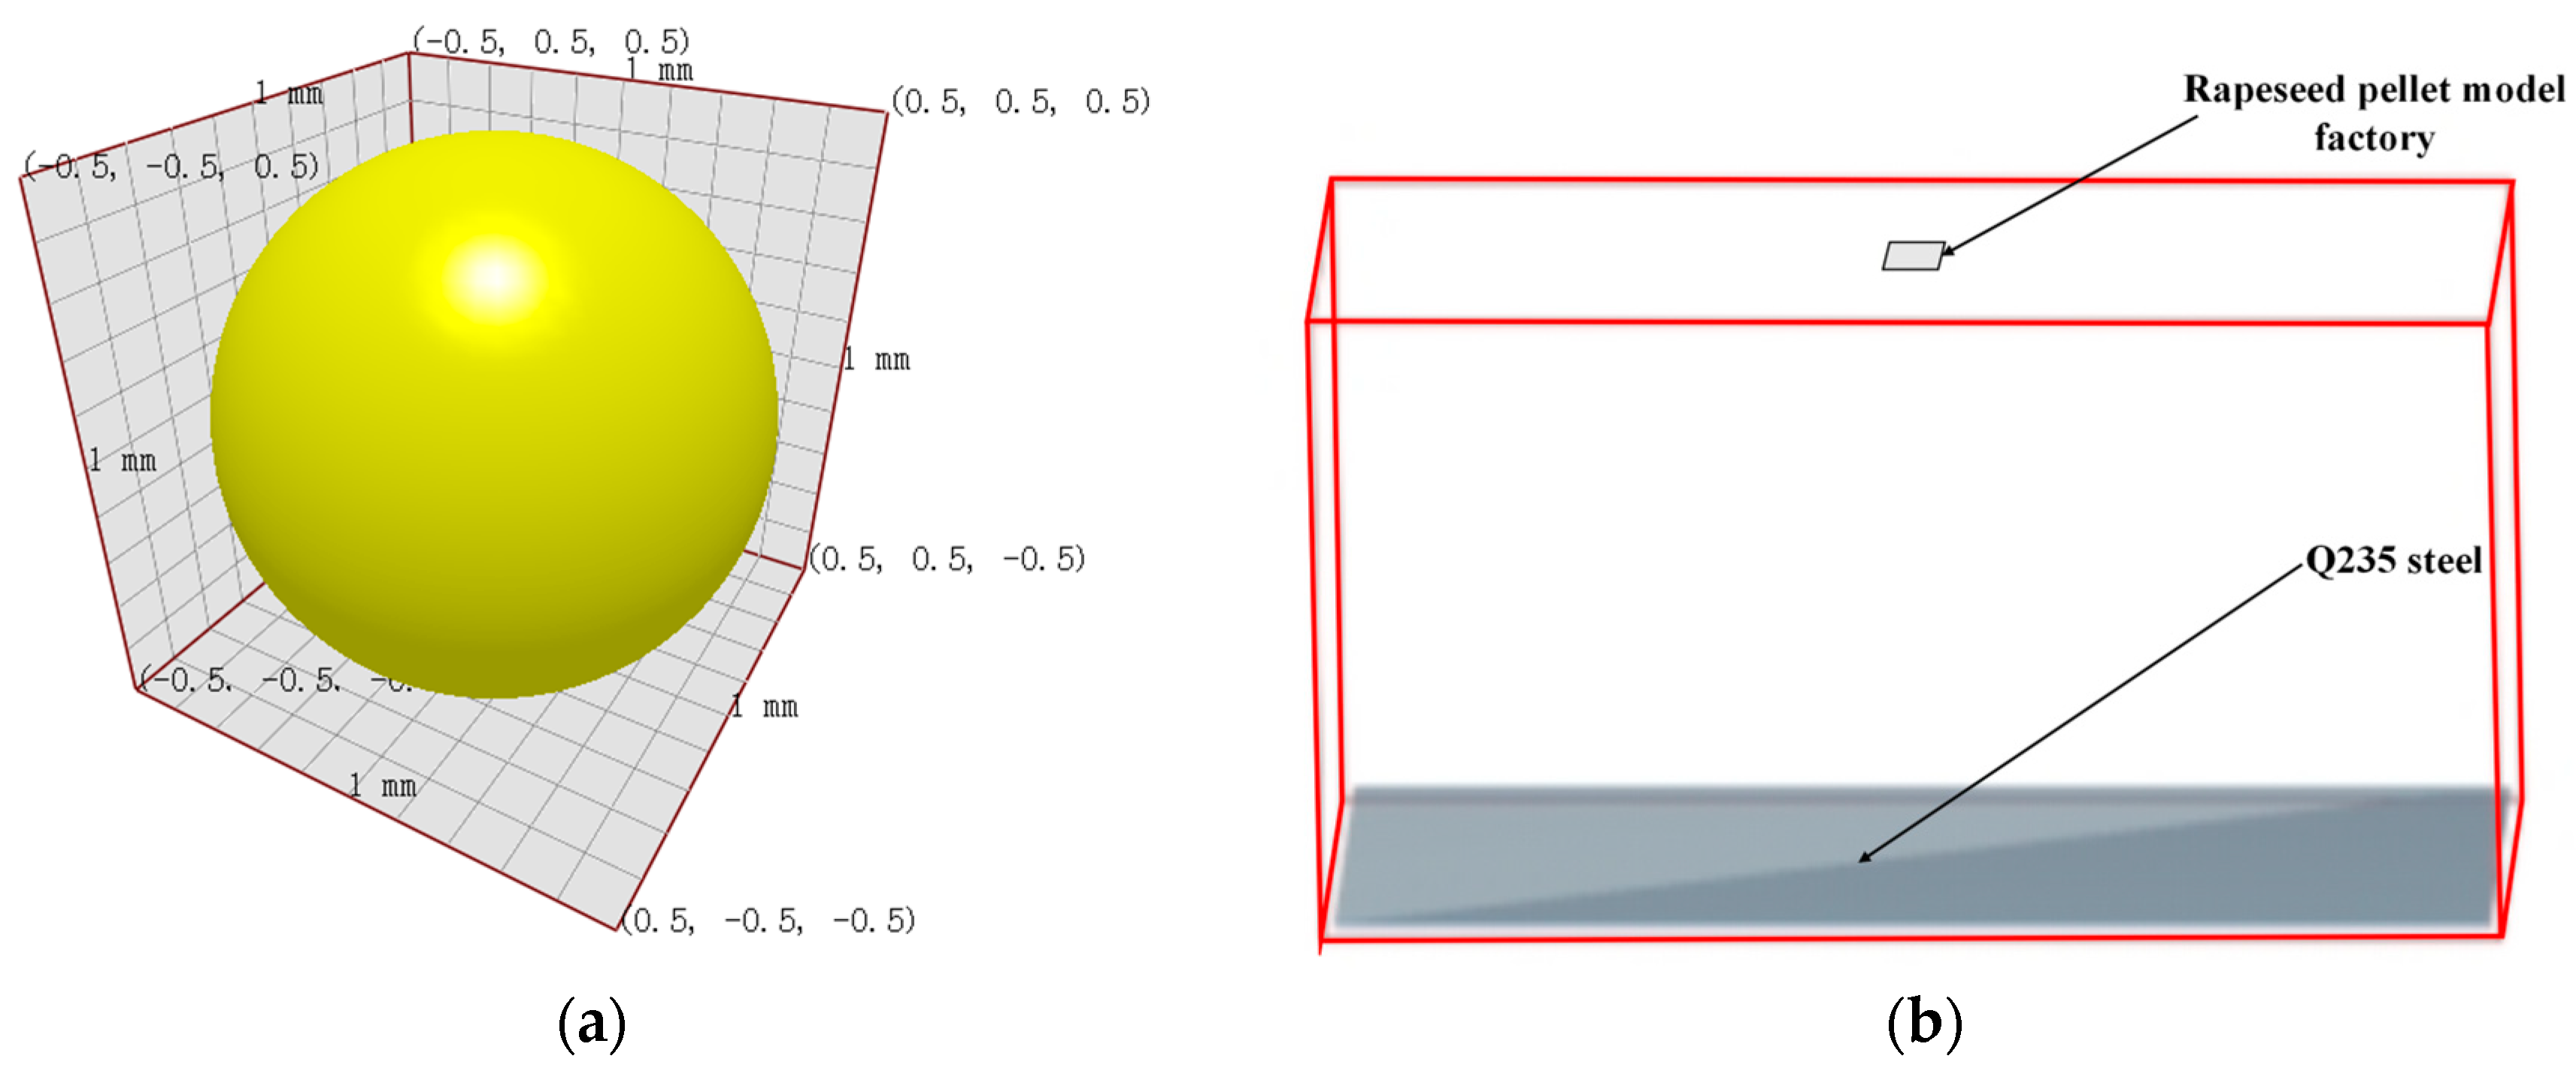
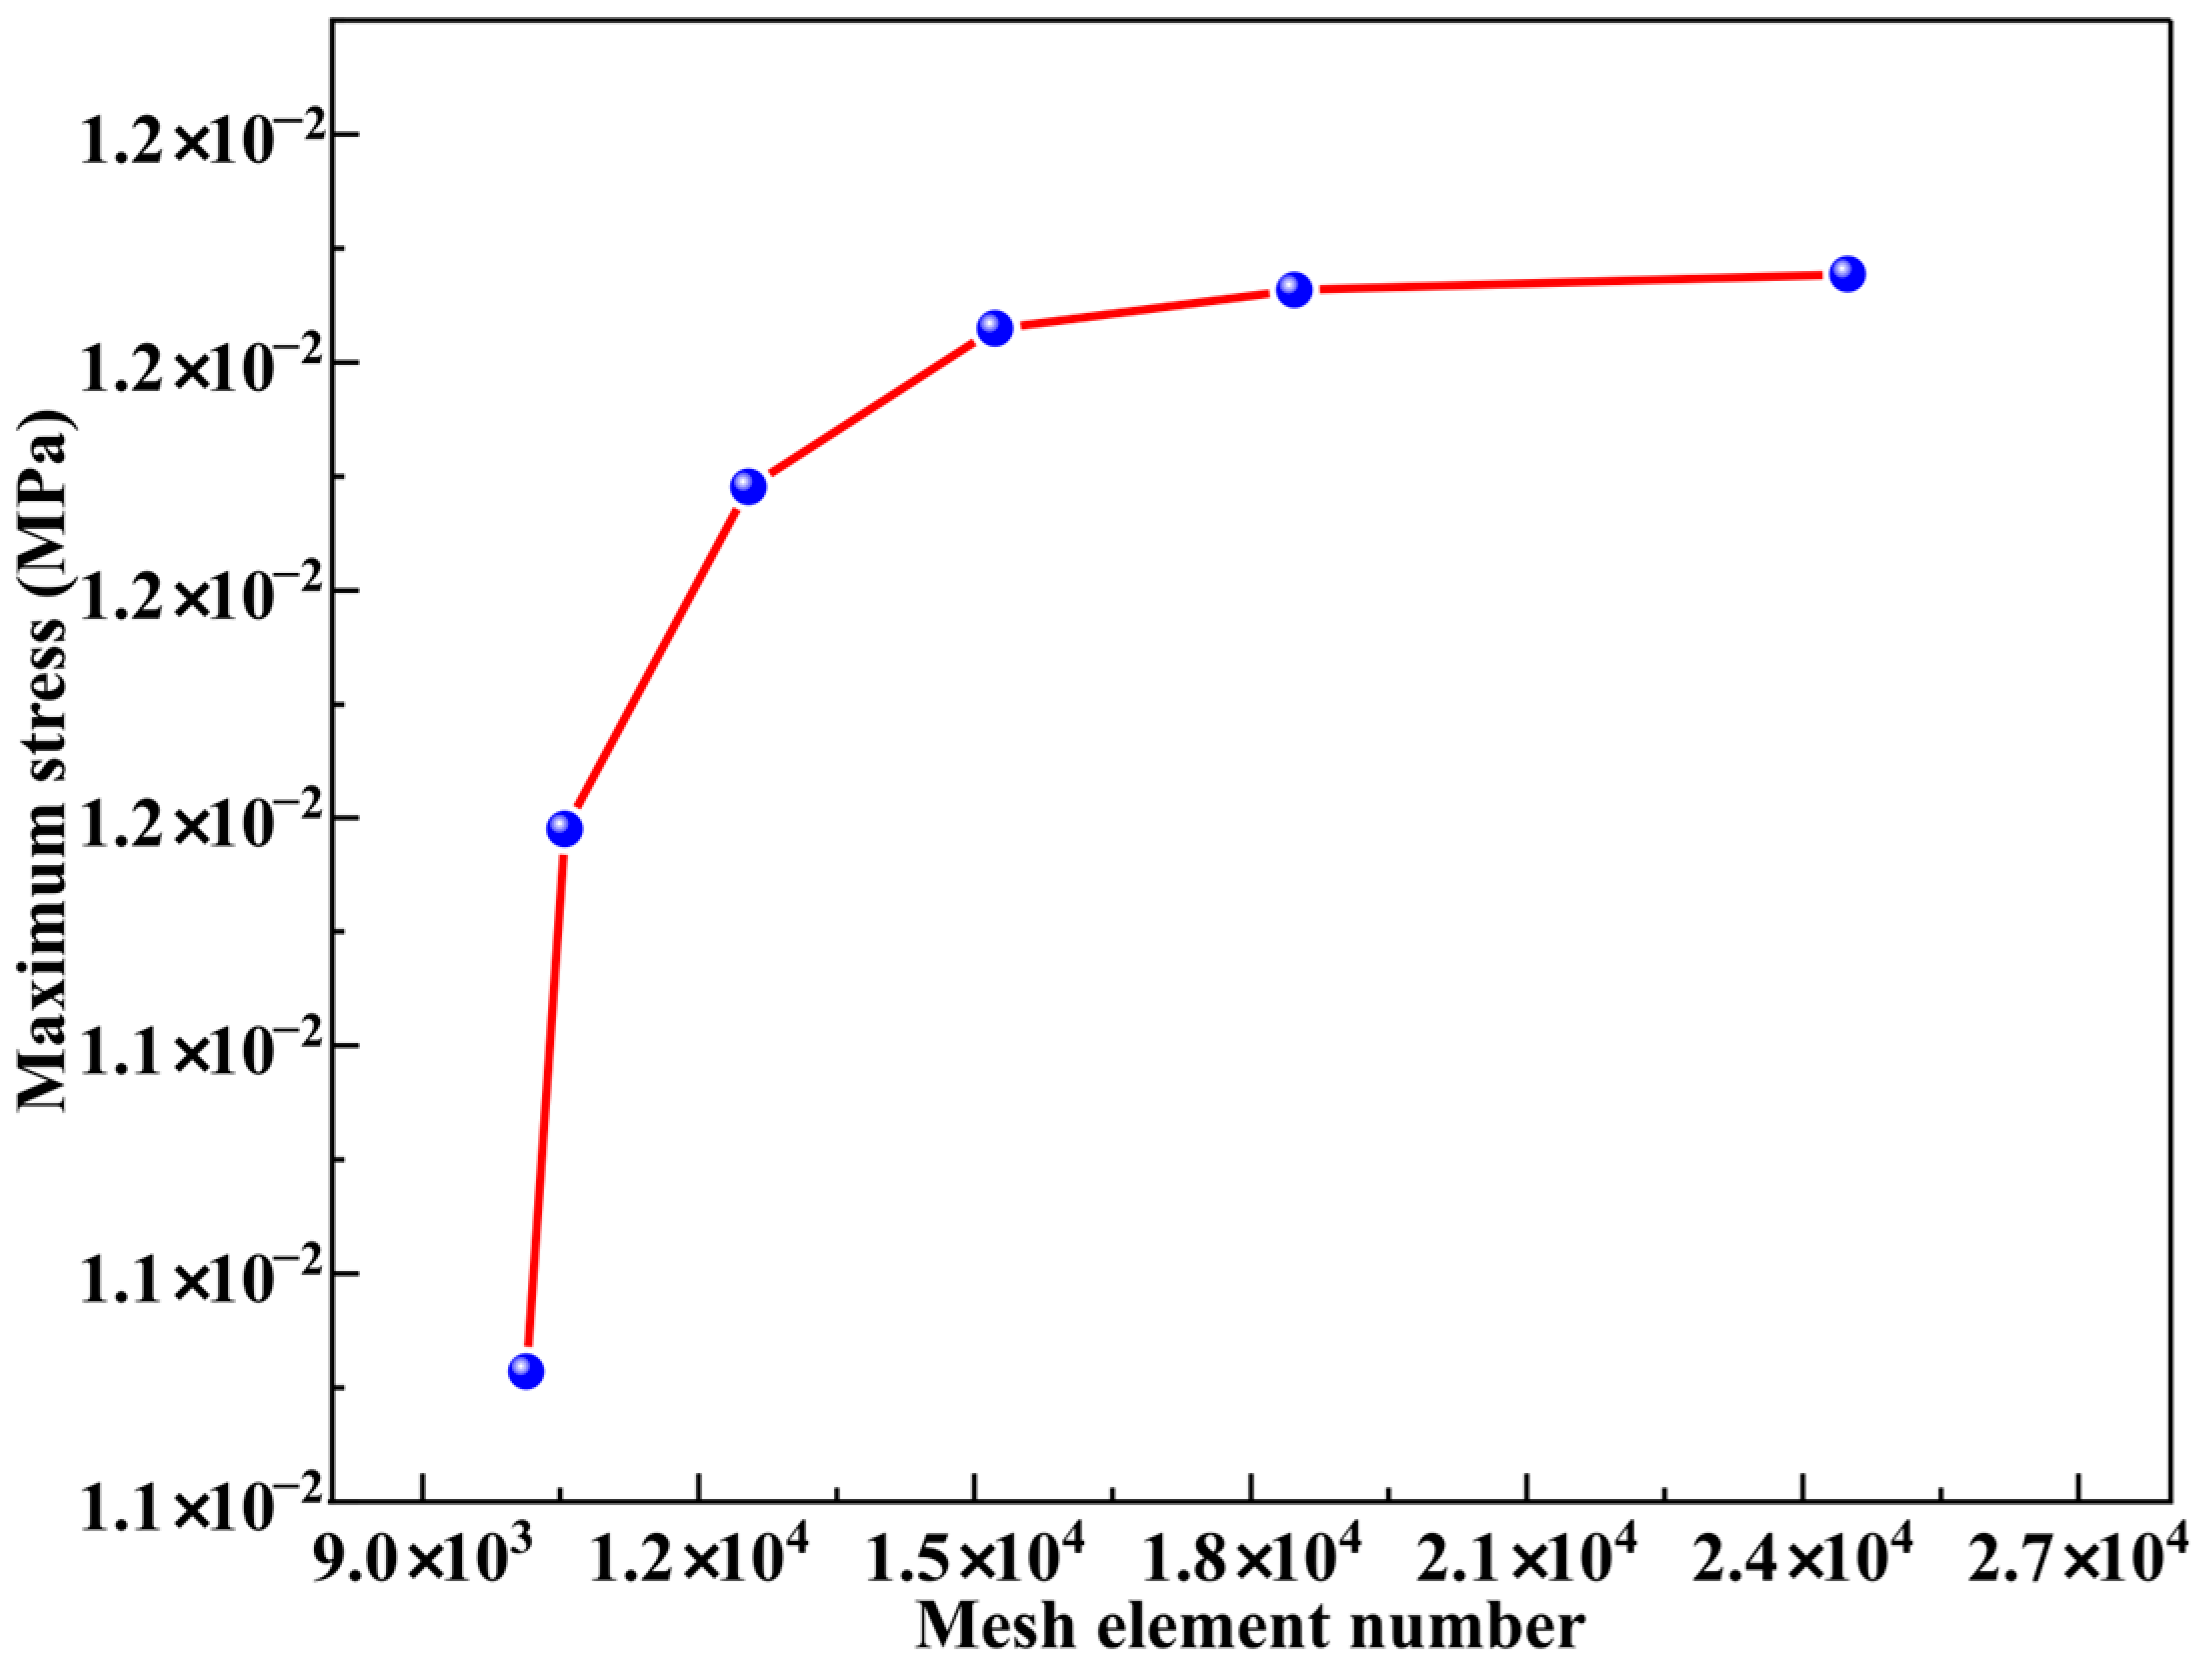
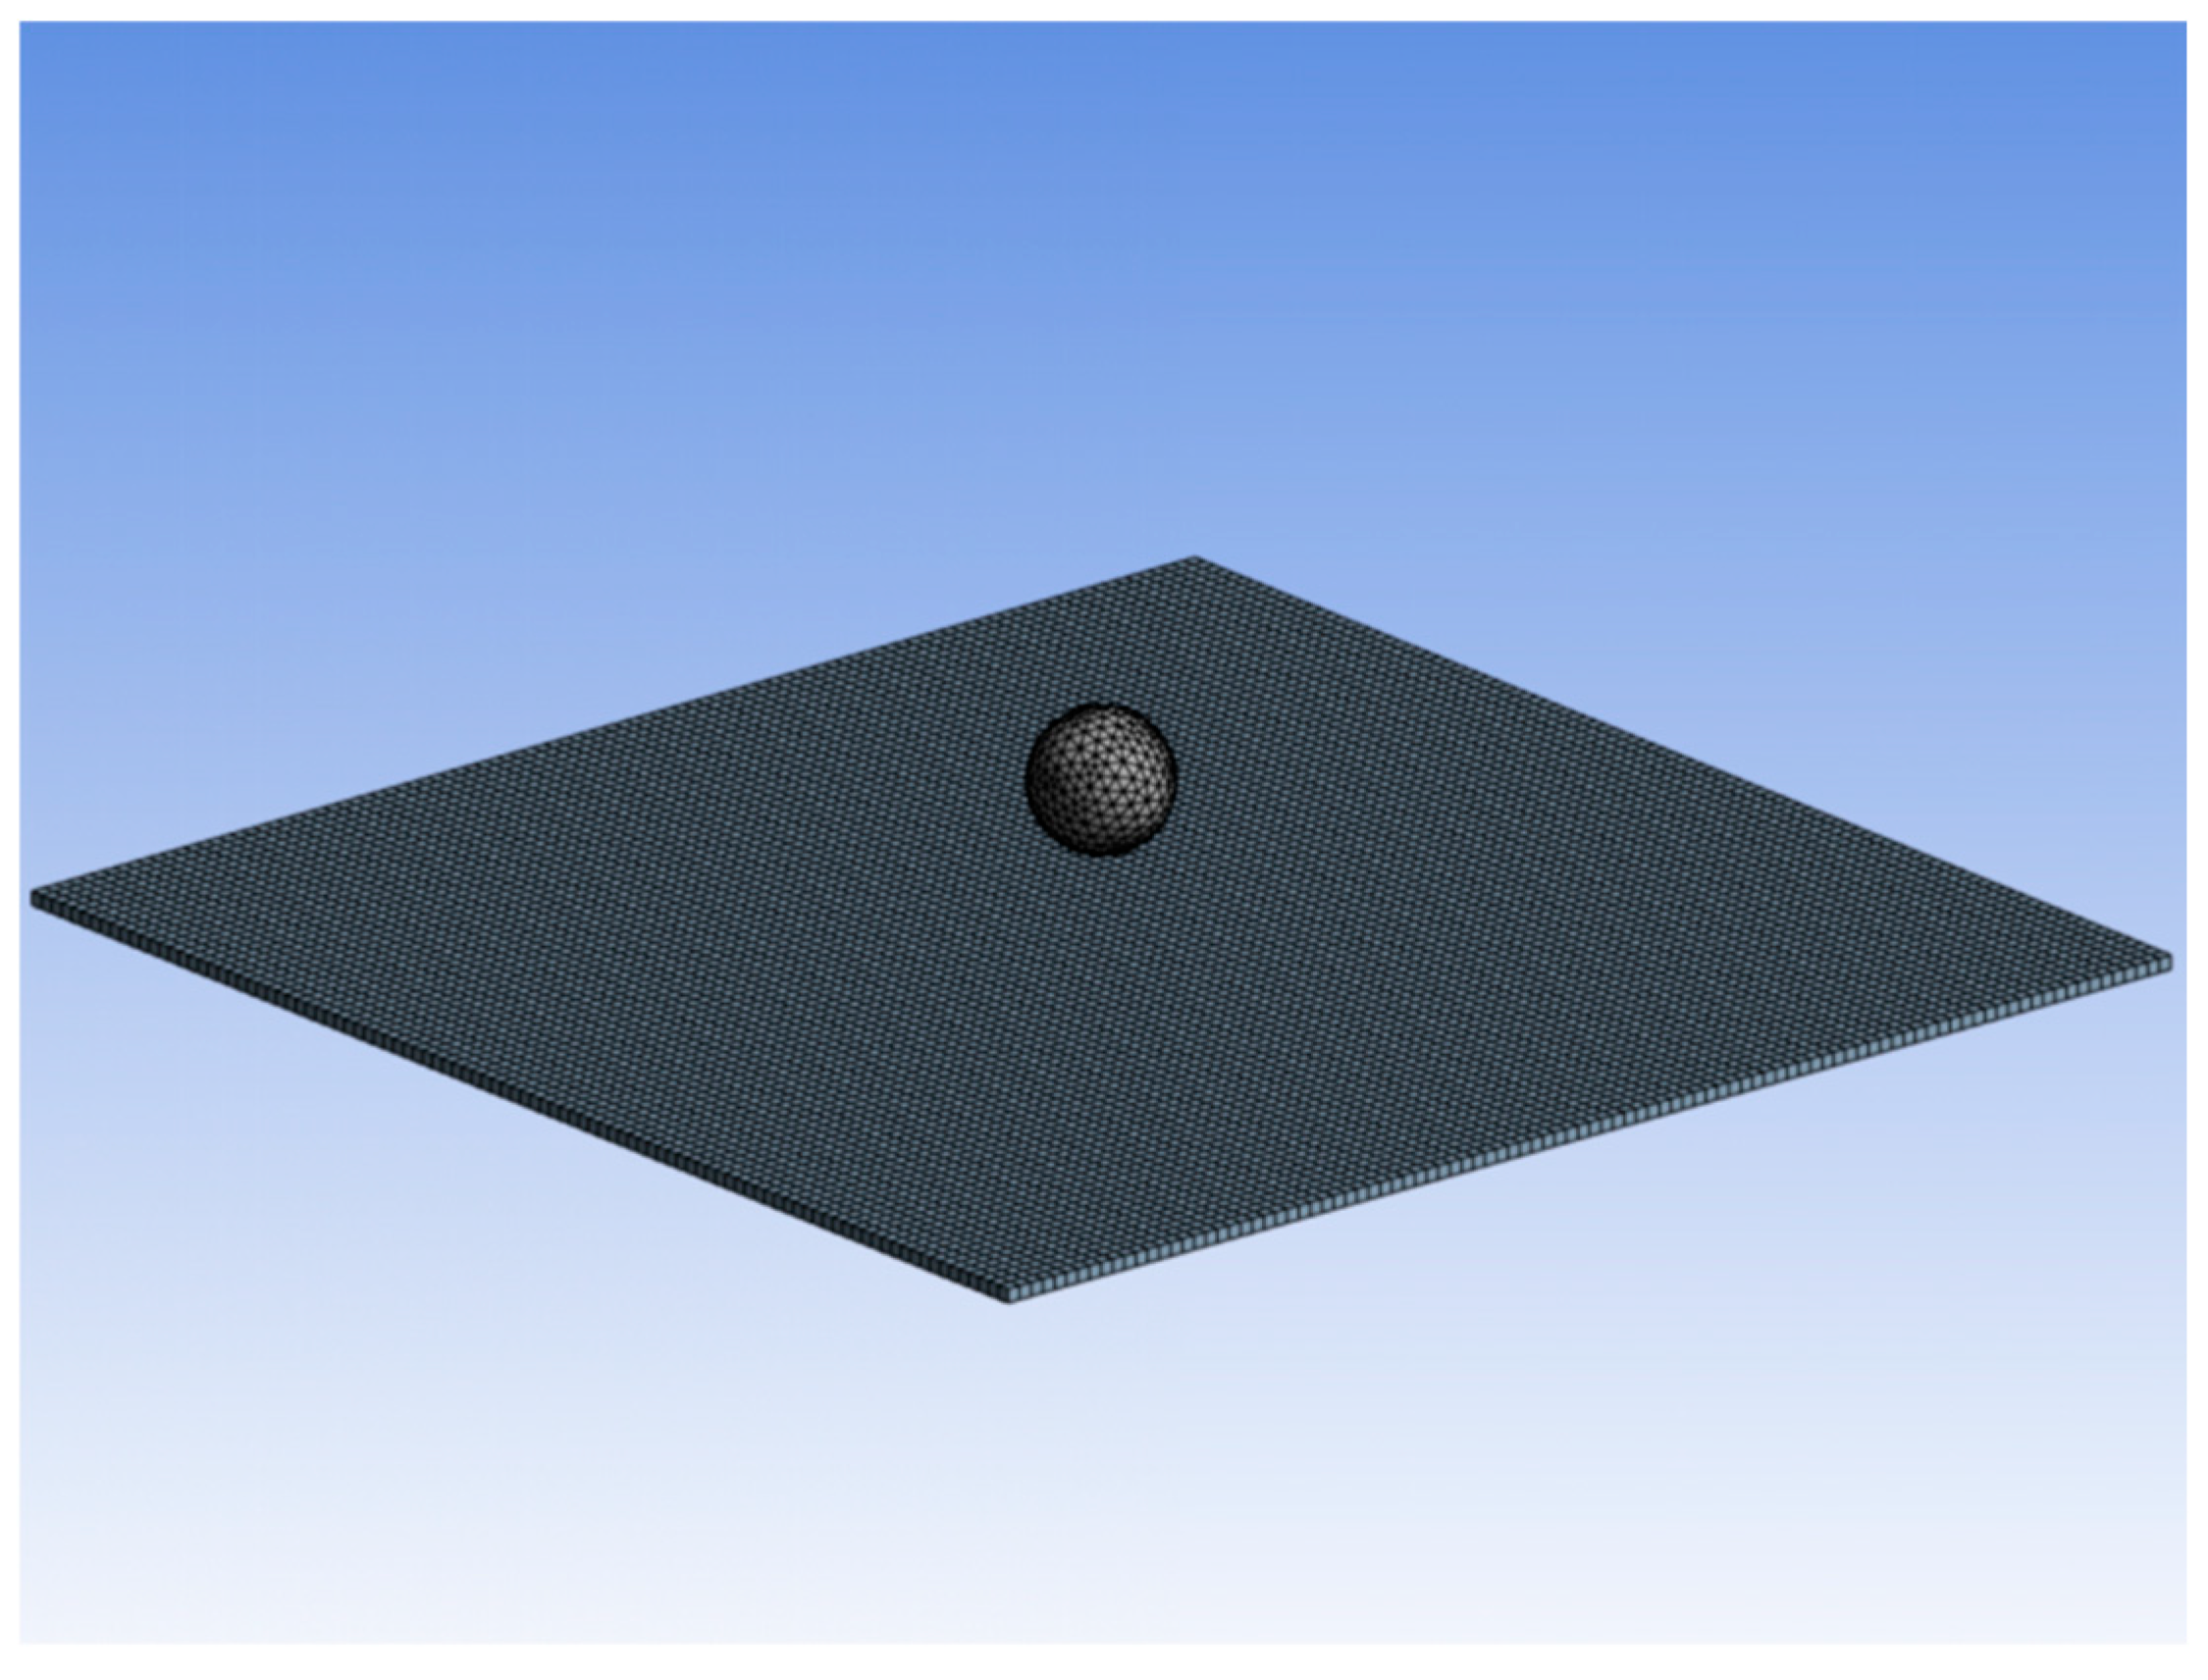
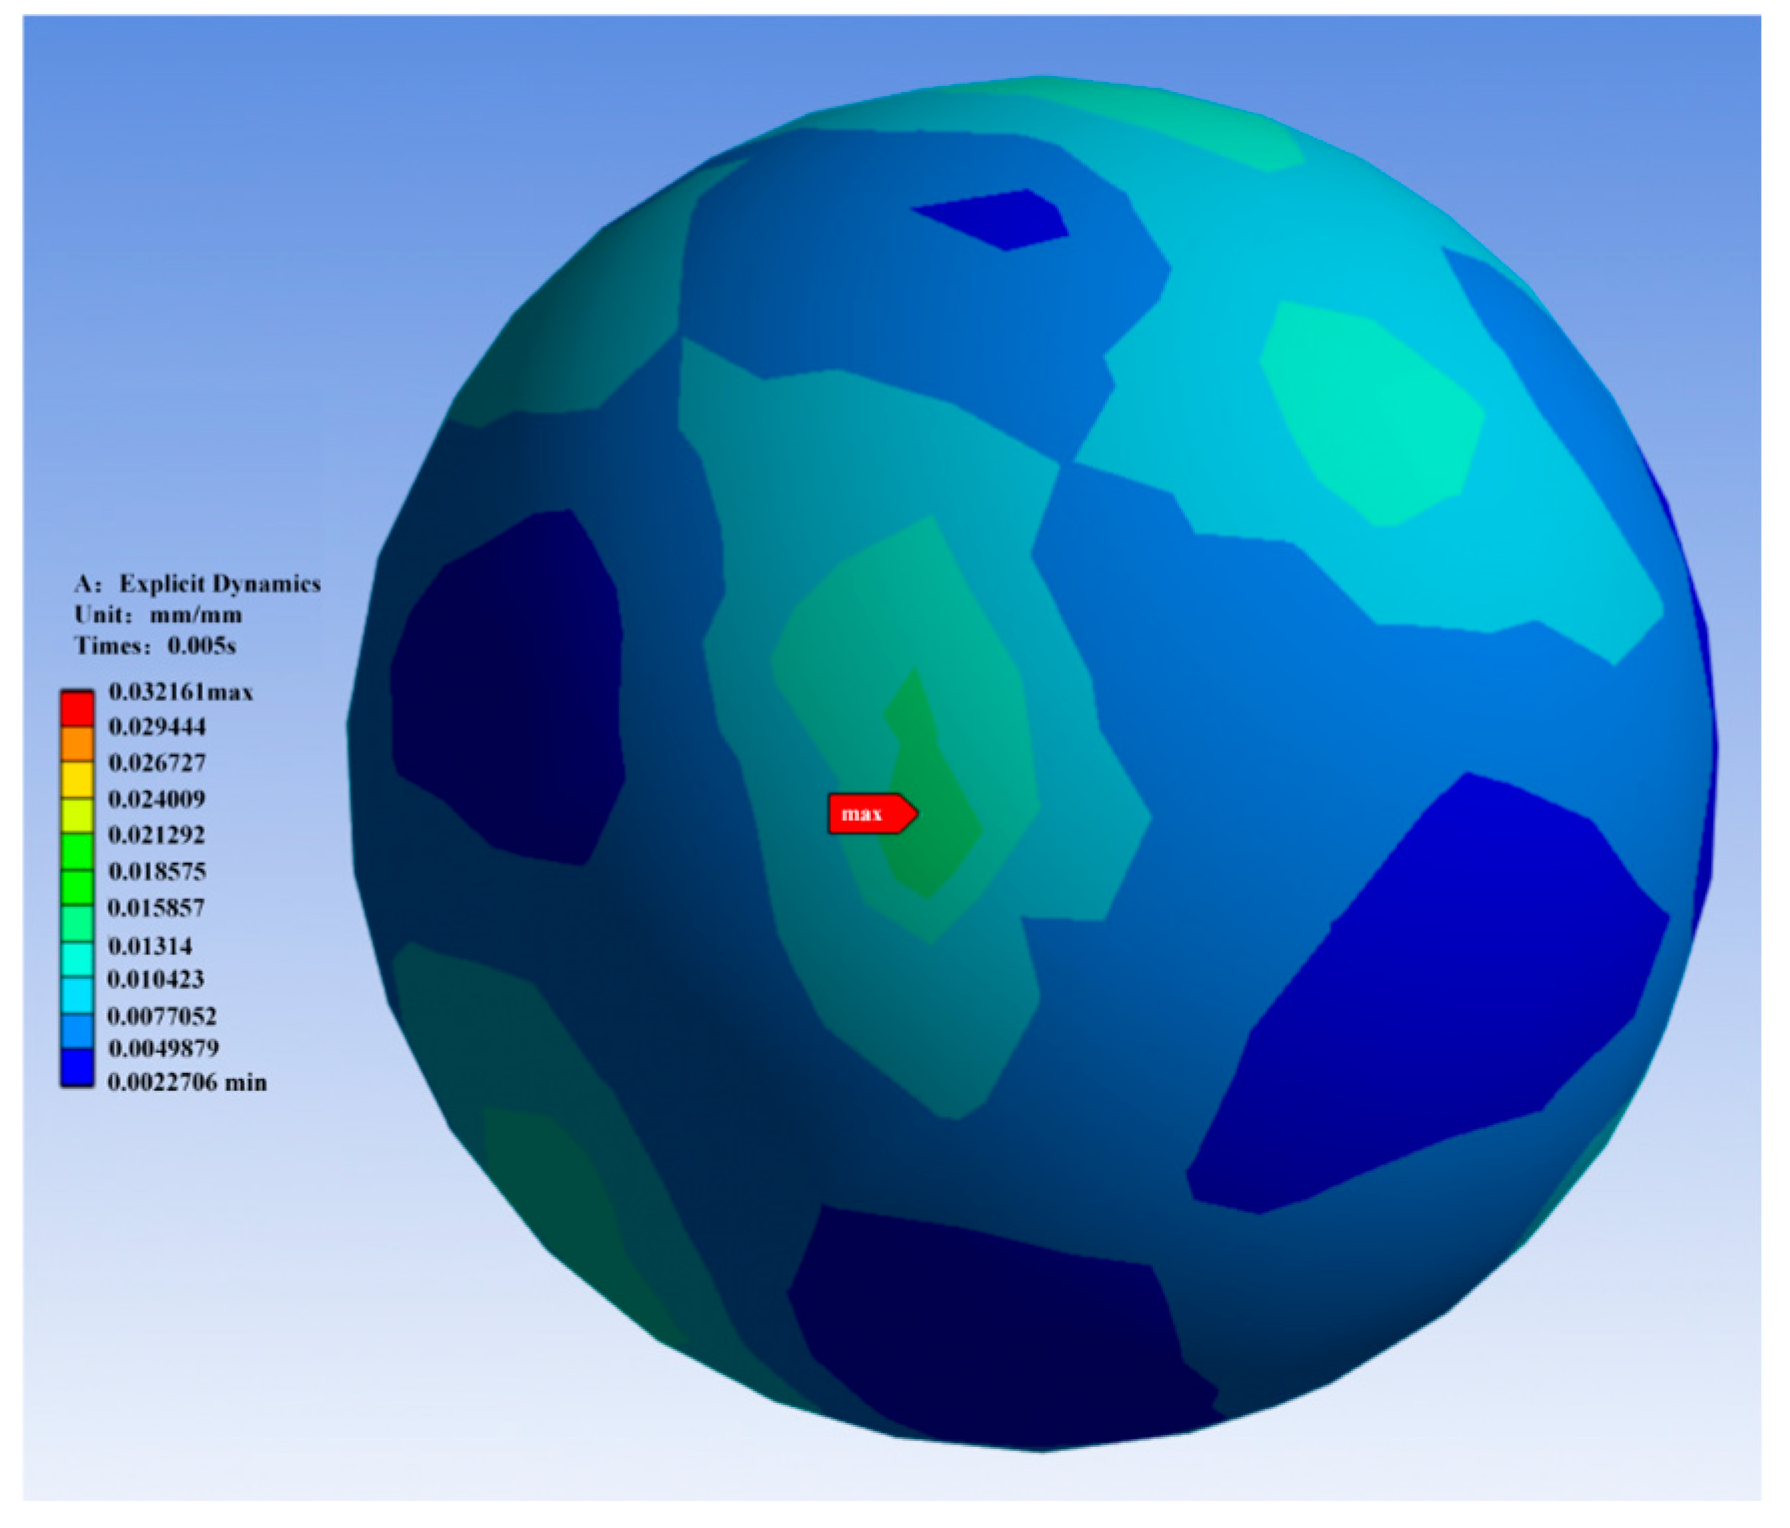
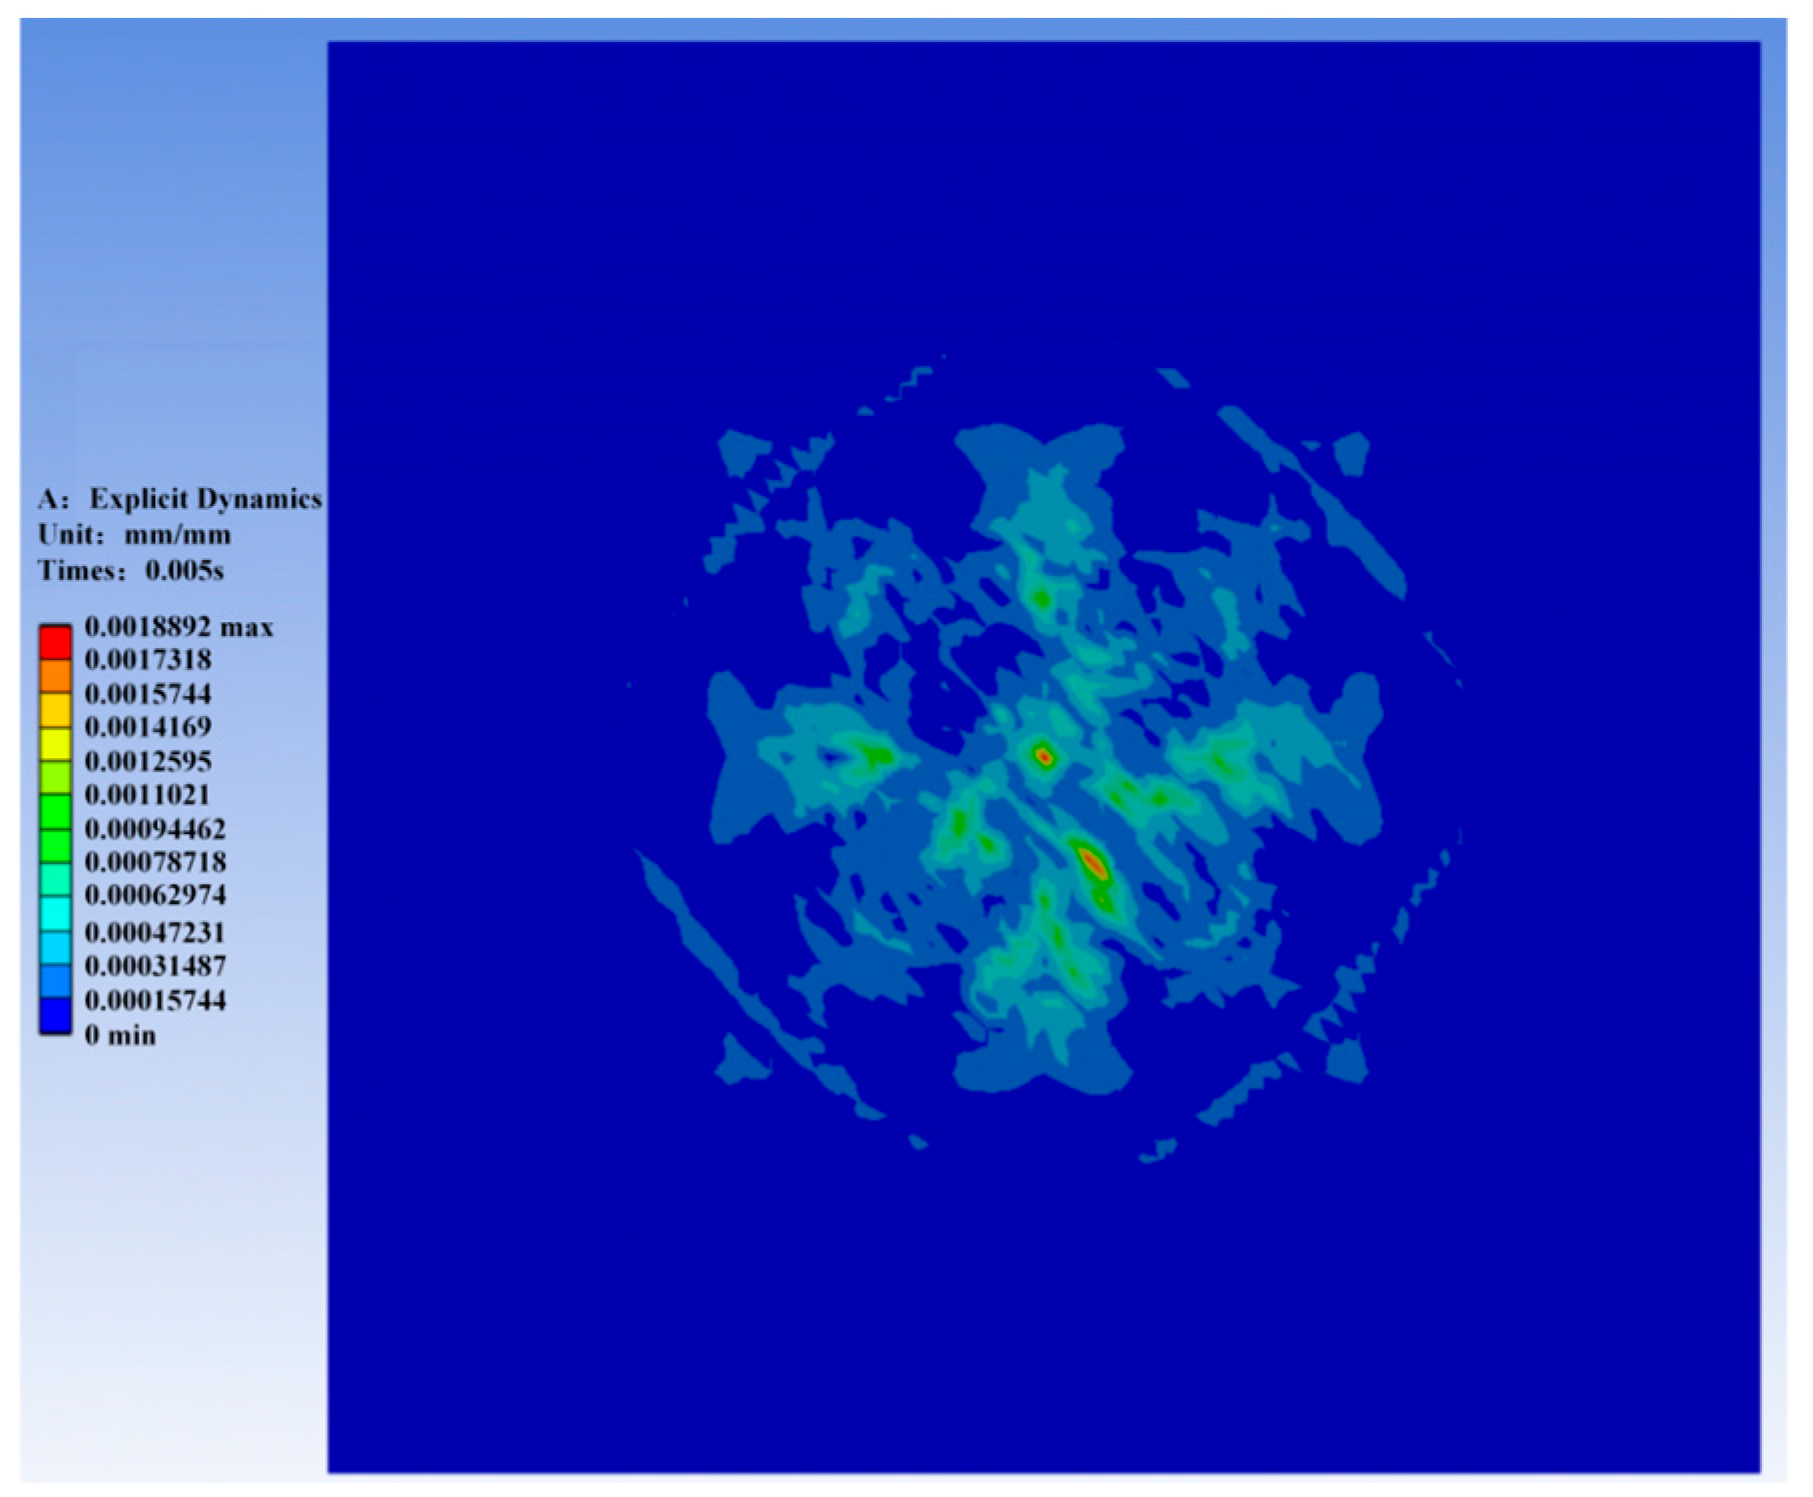
5.3. Analysis of Rapeseed Collision Stress Based on Finite Element ANSYS Software

Baran Yildirim et al. used the finite element method to study the normal impact of copper micron particles on rough copper surfaces at impact velocities of 25–150 m/s [42]. Alves et al. first investigated the effects of different state-of-the-art dispersion models and particle wall collision models on efficiency and erosion prediction by using the finite volume method of discretization in open-source OpenFOAM (v2212) packages [43]. Zhang, P. et al. studied the changes of hardness, fatigue strength, and surface roughness of nitrogen austenitic stainless steel after primary and secondary shot peening, employing a fatigue impact test [44]. In this paper, using the explicit dynamics module of the finite element software ANSYS, the simulation of rapeseed free-fall collision from a height of 150 mm was conducted, and the stress, strain, and energy conversion of rapeseed during the free-fall collision over a period of 0.005 s were analyzed. As shown in Figure 13, it is the grid independence analysis. When the number of grids is 14,528, the maximum stress of the rapeseed model tends to stabilize, as shown in Figure 14, which is a free-fall collision simulation analysis model.
According to the free-fall motion formula, the following can be obtained:
v = 2 g H
H = g t 2 2
The free-fall height of rapeseed is 150 mm. The required time is 0.175 s, as seen in Equation (9). Substituting this into Equation (8), the velocity of rapeseed collision with the collision material is 1.71464 m/s. Therefore, the velocity is inserted into the initial conditions of ANSYS. The rapeseed model is selected for the geometric structure, and the velocity of the Z component is set to −1.71464 m/s according to the selection component. The relevant parameters of the mesh quality, boundary conditions, and solver settings in the ANSYS numerical simulation are shown in Table 10.
After the simulation is solved in ANSYS, stress, strain, and energy analyses are performed in the post-processing module of the ANSYS software, and the relevant data are imported into Origin (2021) for analysis.
The relationship between stress, strain, and energy in rapeseed before and after free-fall collision over a period of 0.005 s is shown in Figure 15. Stage S1 corresponds to the free-fall stage of the rapeseed while its kinetic energy is 5.6716 × 10⁻⁴ mJ and its elastic potential energy, stress, and strain are all zero. At the time corresponding to point b, the rapeseed contacts the Q235 steel plate in a point contact manner. Stage S2 represents the elastic compression stage of rapeseed, during which its strain and stress increase sharply, reaching peak values of 6.3511 × 10⁻⁶ mm and 1.2089 × 10⁻² MPa, respectively. In addition, strain develops extensively in the rapeseed, affecting nearly all its surface layers. However, during this stage, its kinetic energy decreases from 5.6716 × 10⁻⁴ mJ to 5.5638 × 10⁻⁴ mJ, while its elastic potential energy increases to 8.2348 × 10⁻⁷ mJ. The results show that during the S2 stage, rapeseed energy transforms from kinetic energy to elastic potential energy, and the collision between the rapeseed and the Q235 steel progresses from point contact to surface contact. The S3 stage represents the elastic rebound stage, during which the elastic potential energy of the rapeseed increases slightly, from 8.2348 × 10⁻⁷ mJ to 8.6523 × 10⁻⁷ mJ, while its stress decreases by 1.95 × 10⁻⁴ mJ, and its strain decreases by 1.343 × 10⁻⁷ mm. At this stage, the kinetic energy of the rapeseed also undergoes an insignificant reduction, indicating that during this stage, the contact between the rapeseed and the Q235 steel transitions from surface contact to point contact. The S4 stage represents the elastic vibration stage, during which the elastic potential energy and kinetic energy of the rapeseed gradually stabilize with minimal fluctuations. The stress and strain in the rapeseed exhibit significant fluctuations, accompanied by changes in its elastic potential and kinetic energy. This indicates that during the S4 stage, the rapeseed rebounds and separates from the surface. Concentrated, the strain on its surface gradually becomes localized at specific points. The S5 stage is the stable stage of rapeseed, in which the kinetic energy, elastic potential energy, stress, and strain of rapeseed tend to be stable. The strain of rapeseed is mainly concentrated at the top right of rapeseed, and no obvious strain changes are observed in other parts, indicating that the rapeseed has bounced back to the air in the S5 stage, and the strain gradually returns to the original state. Compared with Baran Yildirim et al., the copper impact study only studied the deformation effect of copper particles with a diameter of 50 μm and 5 mm on the base surface. Based on the original study, this present work added the energy conversion relationship between rapeseed and the collision material during the collision process [45].
The relationship between the stress, strain, and energy of Q235 steel collision material during the free-fall collision process at the 0.005 s stage is shown in Figure 16. In the S1 stage, the stress, strain, and energy of the Q235 steel are all zero, indicating that there is no contact between the rapeseed and the Q235 steel collision material at this stage. In the S2 stage, the stress, strain, elastic potential energy, and kinetic energy of Q235 steel increase sharply, which are 6.0261 × 10⁻⁵ MPa, 4.4057 × 10⁻⁸ mm, 6.2136 × 10⁻⁶ mJ, and 4.4193 × 10⁻¹² mJ, respectively, while the elastic potential energy generated by Q235 steel is higher. The strain in the Q235 steel is localized near the point of impact, indicating that contact between the rapeseed and the Q235 steel is point-to-surface, resulting in elastic deformation. Furthermore, deformation initiates in the region surrounding the impact point within the tensile zone of the Q235 steel. In line with Baran Yildirim’s systematic analysis of a single copper, the impact of particles on a semi-infinite copper substrate was studied. Plastic deformation was confined to a small volume near the impact zone, and the maximum strain occurred on the surface of the substrate [42]. In the S3 stage, the stress in the Q235 steel increased by 2 × 10⁻⁶ mJ and the elastic potential energy increased by 2.016 × 10⁻⁷ mJ, but the kinetic energy decreased to 4.2524 × 10⁻¹² mJ and the strain decreased to 4.3433 × 10⁻⁸ mm, indicating that the contact process transitioned to surface-to-point (where the rapeseed surface contacts a point on the Q235 steel). The kinetic energy of Q235 steel begins to transform into elastic potential energy. In the elastic oscillation stage corresponding to the S4 stage, rapeseed has no contact with Q235 steel in this stage, but the elastic potential energy and kinetic energy are still converted under the tensile action of Q235 steel, resulting in the strain of Q235 still changing. During the S5 stage, the stress in the Q235 steel gradually stabilizes at 6.066 × 10⁻⁵ MPa, and its strain also stabilizes at 4.2 × 10⁻⁸ mm, while the elastic potential energy continues to increase gradually, and the kinetic energy continues to decrease.
Based on the post-processing results of the ANSYS simulation software, the collision between the rapeseed and Q235 steel is analyzed at 0.0005 s. At this instant, the contact is point contact. The maximum stress generated by the collision occurs 0.00025 s after the point contact is established. During this 0.00025 s interval, stress and strain develop in the rapeseed. At 0.00075 s, the stress in the rapeseed reaches its maximum value, as shown in Figure 17.
When the free-falling rapeseed collides with Q235 steel, strain develops in the rapeseed due to the applied stress. When the stress in the rapeseed reaches its maximum value, the strain in the rapeseed also reaches its peak, and both occur at the point of contact. As shown in Figure 18, the strain in the rapeseed then progressively decreases. Therefore, the contact between rapeseed and Q235 steel is a process from the point to the surface under elastic conditions, and then from the surface to the point. This process has elastic potential energy, so this process also has the energy required to fully recover the deformation so that the rapeseed rebounds in the opposite direction and continues to move.
After the collision of rapeseed free fall and Q235 steel, the stress distribution of the Q235 steel plane can be seen, as shown in Figure 19. It can be intuitively found that the stress of Q235 steel reaches the maximum at 0.00075 s, which corresponds to the stress of the contact between rapeseed and the Q235 steel surface, and the maximum stress lasts for some time. The Q235 steel produces strain around the surface contact. As shown in Figure 20, there is no obvious strain in the contact area with the rapeseed surface, indicating that the surface of the Q235 steel has a surface tension that causes it to deform first.

6. Conclusions

This study has thoroughly explored the impact mechanisms and collision processes of the restitution coefficient (ec) of rapeseed. The main conclusions and their significance are as follows:
(1)
The collision recovery coefficient (ec) of rapeseed is significantly influenced by the thickness of the collision material (L), the drop height (H), and the moisture content (Mc). Specifically, L, H, and Mc all have a negative correlation with ec.
(2)
By using a high-speed camera on a test bench, this study accurately measured the collision recovery coefficient of rapeseed under different conditions. Through discrete element EDEM software simulation and platform free-fall experiments, the rebound height of rapeseed in free fall was measured. The measured value (Hr) and the simulated value (Hs) were compared, and the relative error range was calculated to be between −1% and 1%, thereby verifying the reliability of the obtained collision recovery coefficient of rapeseed.
(3)
Data analysis was conducted using Design-Expert 12 software, and based on the response surface analysis of the three-factor rotational regression experiment, it was determined that the interaction effect of drop height and material thickness (H·L) has a significant impact on the collision recovery coefficient of rapeseed.
(4)
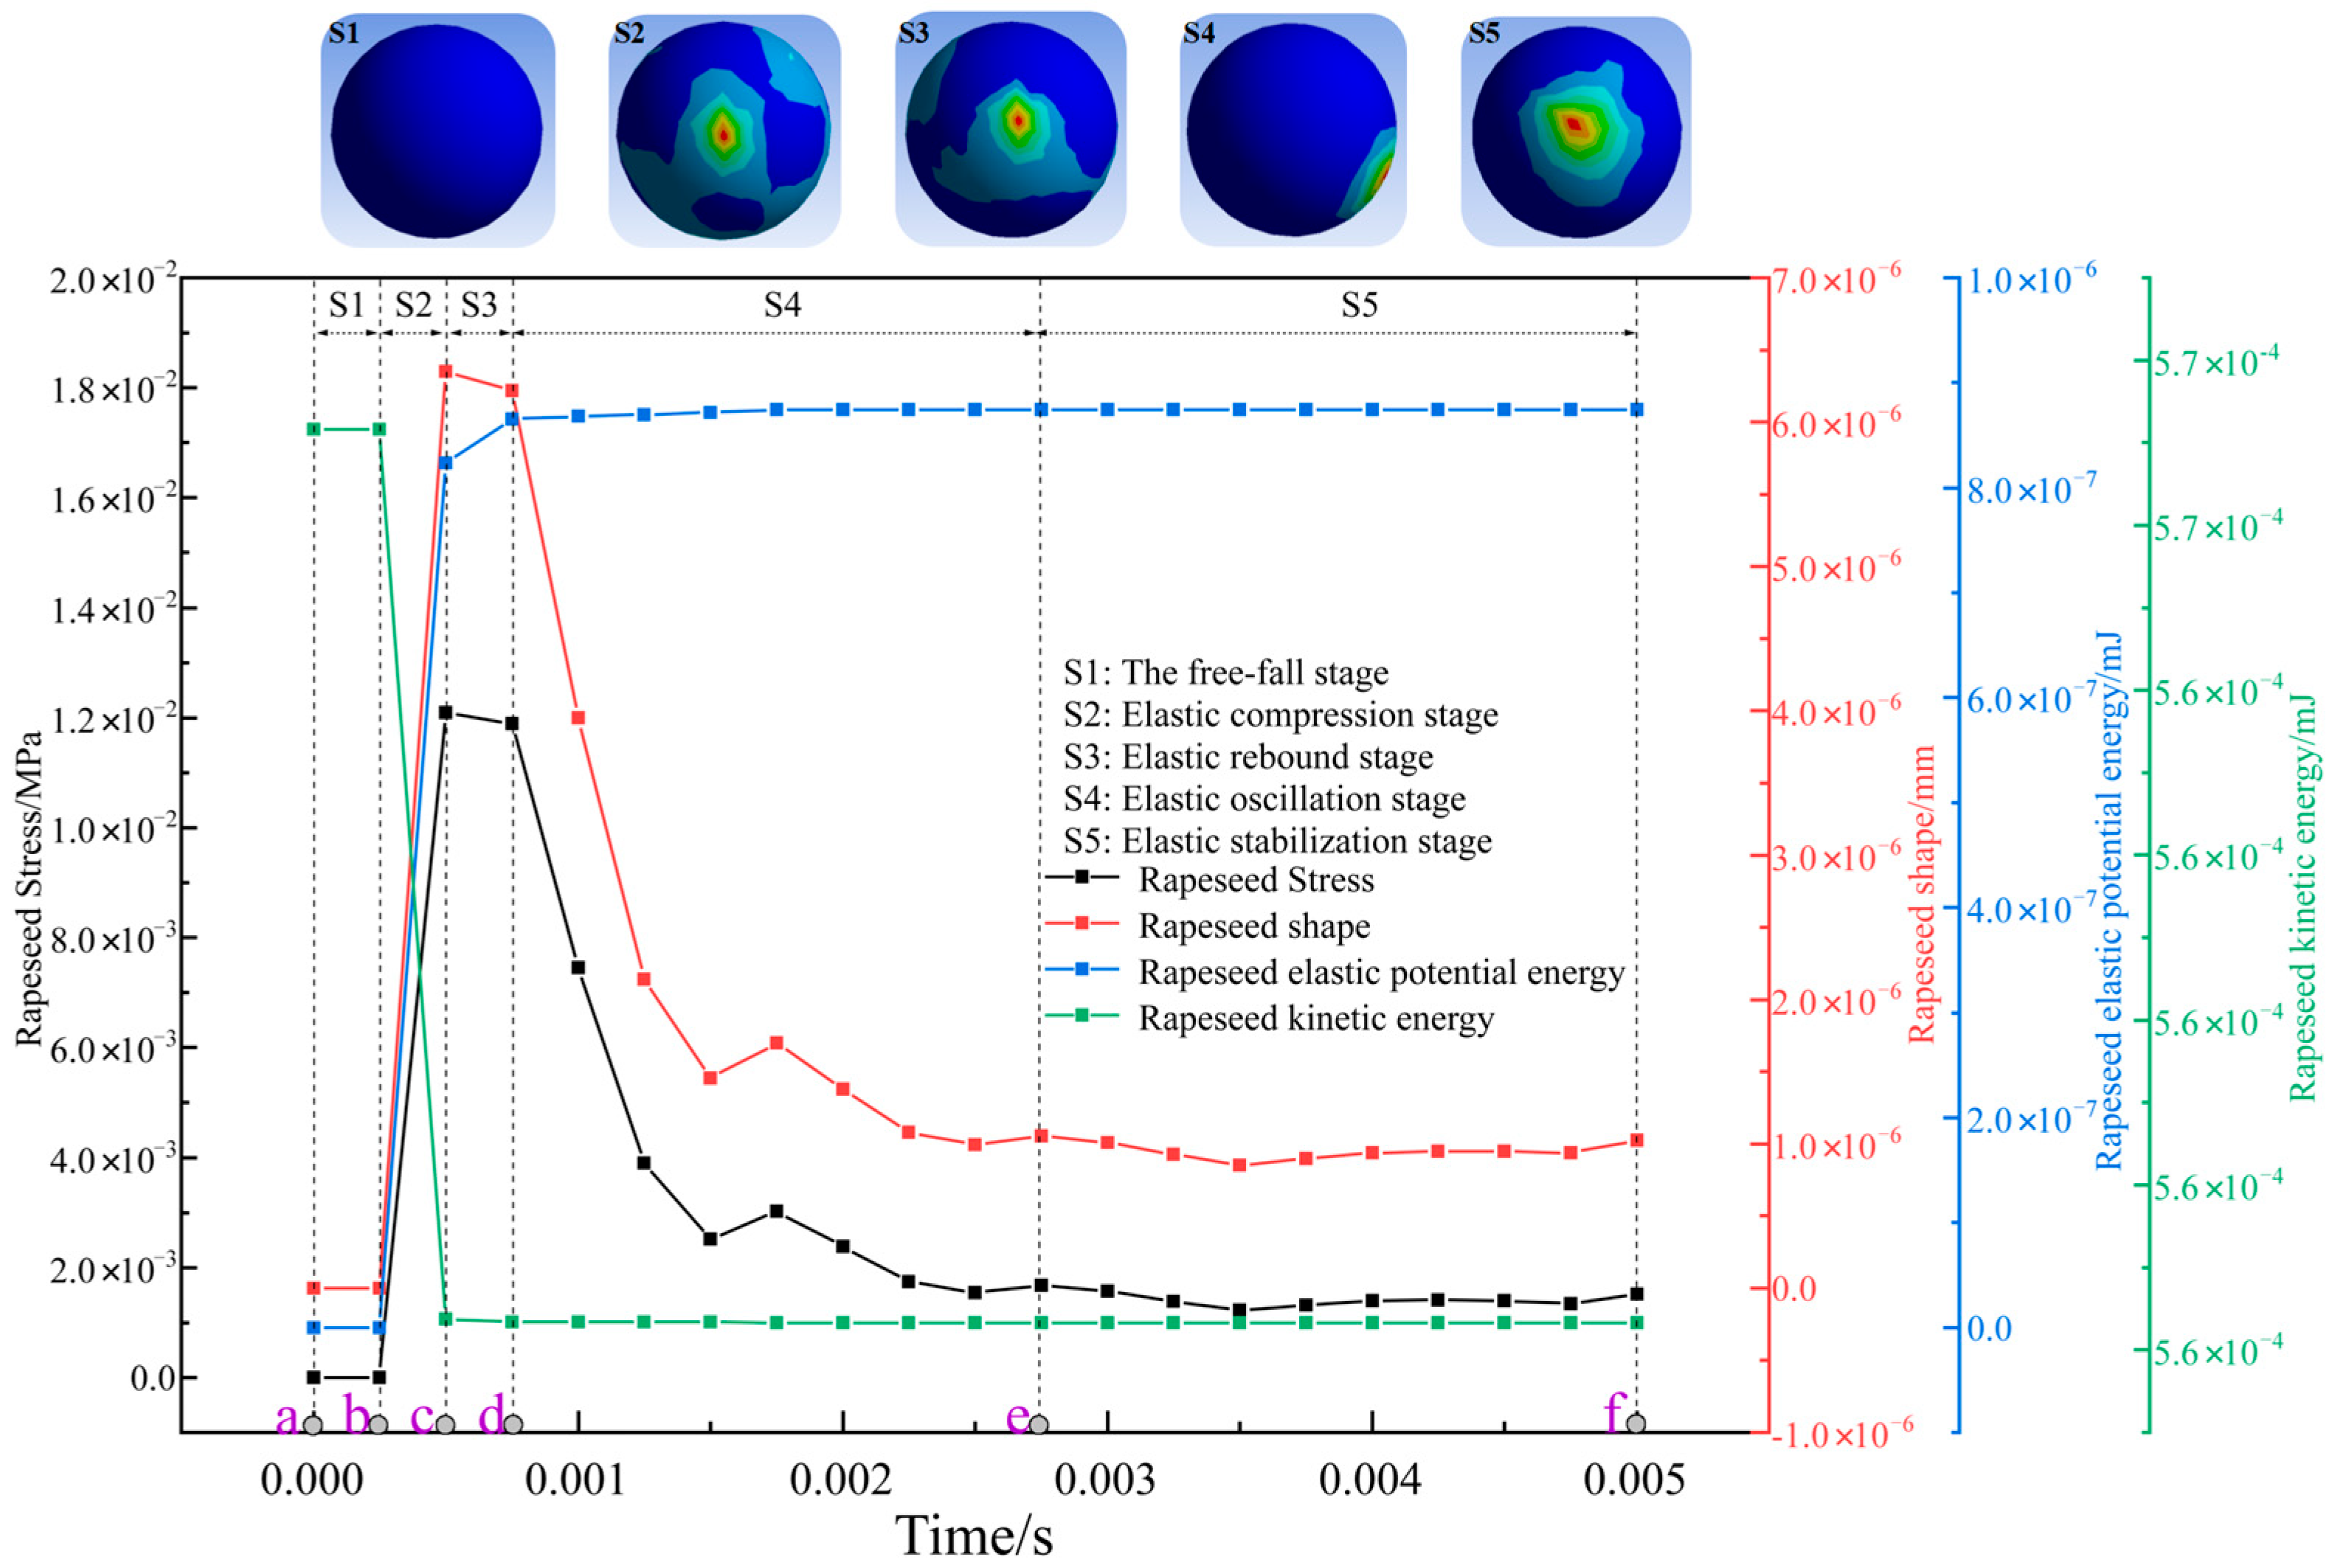
A finite element simulation software ANSYS was used to establish a free-fall collision model of rapeseed with Q235 steel. The simulation experiment showed that the collision process of rapeseed with Q235 steel includes the free-fall stage, elastic compression stage, elastic rebound stage, elastic oscillation stage, and stabilization stage. During the elastic compression stage, the contact between rapeseed and Q235 steel changes from point to surface until the contact area is maximized. In the elastic rebound stage, the rapeseed begins to move upward, and its internal energy transforms from kinetic energy to elastic potential energy. At this time, the contact between rapeseed and Q235 steel starts to change from surface to point. When there is no contact between rapeseed and Q235 steel, the surface deformation of rapeseed continues to change due to the elastic potential energy, which is the elastic oscillation stage. When the deformation of rapeseed and the stress it experiences become stable, this marks the stabilization stage.
This study has revealed the key mechanisms of the restitution coefficient of rapeseed during elastic collisions, but limitations still exist (such as the use of a single rapeseed variety, the interaction mechanism in group collisions, and non-steady-state dynamic impact scenarios). These limitations may cause model deviations in practical working conditions, such as high-flow conveying. Therefore, future research will focus on the analysis of energy transfer in group collisions, the construction of predictive sub-models for collision behavior under transient loads, and the development of intelligent control systems based on the feedback of the restitution coefficient. This will promote the engineering application of this parameter in the precise design of low-damage processing, seeding, and harvesting equipment for rapeseed, providing theoretical support for the development of the industry.

Author Contributions

Conceptualization, B.L. and C.L.; methodology, C.L. and B.L.; software, C.L., H.Z. and Z.L.; validation, B.L., X.Z. and Z.Z.; formal analysis, C.L. and B.L.; investigation, L.G.; resources, Z.Z.; data curation, Z.L.; writing—original draft preparation, C.L. and H.Z.; writing—review and editing, C.L. and B.L.; visualization, C.L. and H.Z.; supervision, L.G. and X.Z.; project administration, B.L.; funding acquisition, B.L. All authors have read and agreed to the published version of the manuscript.

Funding

This research was funded by the National Natural Science Foundation of China (Grant No. 32401733), the China Postdoctoral Science Foundation (Grant No. 2023T160768), the Special Support Project of Chongqing Postdoctoral Science Foundation (Grant No. 2021XM1034), and the Science and Technology Research Program of Chongqing Municipal Education Commission (Grant No. KJZD-K202501306).

Data Availability Statement

The original contributions presented in this study are included in the article. Further inquiries can be directed to the corresponding authors.

Acknowledgments

The authors would like to thank the editors and reviewers for their valuable and constructive comments.

Conflicts of Interest

The authors declare no conflicts of interest.

Abbreviations

LThe material layer thickness (mm)
McThe moisture content (%w.b.)
HThe drop height of rapeseed (mm)
HrThe actual value of the rebound height (mm)
HsSimulation value of rebound height (mm)
m0The initial mass of the sample rapeseed (g)
mtThe mass of the rapeseed varying with time (g)
WThe amount of water added (g)
MctThe target moisture content (%w.b.)
ecThe elastic collision recovery coefficient of rapeseed
VyThe horizontal component velocity (m/s)
VxThe vertical component velocity (m/s)
V0The instantaneous velocity after collision (m/s)
gThe gravity (m/s2)
vThe terminal velocity (m/s)
tThe free fall time of rapeseed (s)

References

  1. Zheng, M.; Terzaghi, W.; Wang, H.; Hua, W. Integrated strategies for increasing rapeseed yield. Trends Plant Sci. 2022, 27, 742–745. [Google Scholar] [CrossRef]
  2. Duff, H.; Hegedus, P.B.; Loewen, S.; Bass, T.; Maxwell, B.D. Precision Agroecology. Sustainability 2022, 14, 106. [Google Scholar] [CrossRef]
  3. Auernhammer, H. Precision farming—the environmental challenge. Comput. Electron. Agric. 2001, 30, 31–43. [Google Scholar] [CrossRef]
  4. Tauber, M.; Gollan, B.; Schmittner, C.; Knopf, P. Passive Precision Farming Reshapes the Agricultural Sector. Computer 2023, 56, 120–124. [Google Scholar] [CrossRef]
  5. Liao, Q.; Lei, X.; Liao, Y.; Ding, Y.; Zhang, Q.; Wang, L. Research Progress of Precision Seeding for Rapeseed. Trans. Chin. Soc. Agric. Mach. 2017, 48, 16. [Google Scholar] [CrossRef]
  6. Zhang, F.; Chen, T.H.; Chen, J.; Wang, Y.; Teng, S. Design and Simulation of Seeding and Fertilizing Control System Based on MCGS. J. Agric. Univ. Hebei 2019, 42, 117–121. [Google Scholar] [CrossRef]
  7. Li, Q.; Yu, Q.; Li, H.; Xu, C.; Ding, Y. Design and Test of Dust Removal Seeding Rate Monitoring System for Rapeseed Seeders. Smart Agric. 2024, 6, 107–117. [Google Scholar] [CrossRef]
  8. Zhang, L.; Liu, Y.; Wu, M.; Wu, Z. Sowing Performance of the seeder drill for the 2BYG-220 type combined rapeseed planter under vibration conditions. Appl. Sci. 2024, 14, 5091. [Google Scholar] [CrossRef]
  9. Liao, Q.; Wang, C.; He, K.; Yuan, J.; Wang, X. Design and Experiment on Re-cleaning Machine for Rapeseed after Combine Harvesting. Trans. Chin. Soc. Agric. Mach. 2021, 52, 175–185. [Google Scholar]
  10. Kumar, D.; Mishra, A.; Prasad, M.; Pyare, R.; Majhi, M. Performance analysis of deep bed drying of canola seeds using numerical technique. J. Stored Prod. Res. 2021, 94, 101891. [Google Scholar] [CrossRef]
  11. Wang, L.; Xi, R.; Liao, Y.; Zhang, Q.; Xiao, W.; Liao, Q. Effects of land slope on seeding performance of a broad width precision no-tillage planter for rapeseed. Trans. Chin. Soc. Agric. Eng. 2020, 36, 11–21. [Google Scholar] [CrossRef]
  12. Wang, L.J.; Liu, T.H.; Feng, X.; Gao, Y.P. Research Progress of the Restitution Coefficients of Collision of Particles in Agricultural and Food Fields. Trans. Chin. Soc. Agric. Eng. 2021, 37, 313–322. [Google Scholar]
  13. Fang, R.; Shu, C.; Liao, Y.; Tian, B.; Liao, Q. Design and Performance testing of 2BZ-4 Vibrational Planter for Rapeseed. J. Huazhong Agric. Univ. 2015, 34, 115–120. [Google Scholar] [CrossRef]
  14. Zuo, Q.; You, J.; Wang, L.; Zheng, J.; Li, J.; Qian, C.; Lin, G.; Yang, G.; Leng, S. A Balanced Sowing Density Improves Quality of Rapeseed Blanket Seedling. Agronomy 2022, 12, 1539. [Google Scholar] [CrossRef]
  15. Martinez-Soberanes, E.E.; Purdy, S.K.; Reaney, M.J.T.; Zhang, W.J. Mechanical stress on canola seed during dehulling. J. Food Sci. 2022, 87, 3472–3481. [Google Scholar] [CrossRef] [PubMed]
  16. Yang, Y.; Li, X.; Wu, C. Feasibility analysis and promotion recommendations for rapeseed segmented mechanical harvesting. Chin. J. Agric. Mech. 2025, 46, 1–4. [Google Scholar] [CrossRef]
  17. Yang, J.; Wan, X.; Liao, Y.; Liao, Q. Design and Experiment of Cylinder Sieve Type Re-cleaning Device for Rape Combine Harvester. Trans. Chin. Soc. Agric. Mach. 2022, 53, 99–108. [Google Scholar]
  18. Wang, Y.; Zhang, W.; Qi, B.; Ding, Y.; Xia, Q. Research on Control System of Corn Planter Based on Radar Speed Measurement. Agronomy 2024, 14, 1043. [Google Scholar] [CrossRef]
  19. Li, Y.; Zhou, W.; Yi, S.; Chen, T.; Zhang, D.; Wang, S.; Tari, V.S. Analysis measurements of millet collision coefficient of restitution for mechanized seeding. PLoS ONE 2025, 20, e0320001. [Google Scholar] [CrossRef]
  20. Wang, J.; Zhang, W.; Wang, F.; Liu, Y.; Zhao, B.; Fang, X. Experimental Analysis and Verification of the Influence on the Elastic Recovery Coefficient of Wheat. Appl. Sci. 2023, 13, 5481. [Google Scholar] [CrossRef]
  21. Lu, Y.G.; Wu, N.; Lin, D.Z.; Yu, Z.Y.; You, Y.Z.; Hu, Z.C. Study on the Recovery Coefficient and Friction Coefficient of Peanut Kernel. Jiangsu Agric. Sci. 2016, 44, 386–390. [Google Scholar] [CrossRef]
  22. Kong, F.; Shi, L.; Zhang, Y.; Chen, C.; Sun, Y.; Xie, Q. Measurement and Analysis of Seed Cotton’ Restitution Coefficient in Point-to-plate Collision Model. J. Agric. Sci. Technol. 2019, 21, 92–99. [Google Scholar]
  23. Shi, L.R.; Ma, Z.T.; Zhao, W.Y.; Yang, X.P.; Sun, B.G.; Zhang, J.P. Calibration of Simulation Parameters of Flaxed Seeds Using Discrete Element Method and Verification of Seed-Metering Test. Trans. Chin. Soc. Agric. Eng. 2019, 35, 25–33. [Google Scholar]
  24. Wang, W.Z.; Liu, W.R.; Yuan, L.H. Calibration of Discrete Element Parameters of Wheat Plants at Harvest Period Based on EDEM. J. Henan Agric. Univ. 2021, 55, 64–72. [Google Scholar] [CrossRef]
  25. Xu, J. The Key Technology Research of Rapeseed Low Dehumidification Drying. Master’s Thesis, Huazhong Agricultural University, Wuhan, China, 2014. [Google Scholar]
  26. Wu, W.; Deng, X.; Li, J.; Hu, J.; Cheng, H.; Zhou, W.; Deng, F.; Chen, Y.; Ren, W.; Lei, X. Micro-level stress characteristics of rapeseed particle during the seeding process using the MFBD-DEM coupled method. Comput. Electron. Agric. 2024, 220, 108929. [Google Scholar] [CrossRef]
  27. Bester, C.S.; Behringer, R.P. Collisional model of energy dissipation in three-dimensional granular impact. Phys. Rev. E 2017, 95, 032906. [Google Scholar] [CrossRef]
  28. Hansen, J.; Tuchin, K. Collisional energy loss and the chiral magnetic effect. Am. Phys. Soc. 2021, 104, 034903. [Google Scholar] [CrossRef]
  29. Jiang, B.; Cheng, C.; Yang, D.; Guo, H.; Xie, D.; Shen, X. Dynamics of collision-induced energy transfer. Fundam. Res. 2023, 12, 28. [Google Scholar] [CrossRef]
  30. Zhan, G.; Zong, W.; Ma, L.; Wei, J.; Liu, W. Biomechanical properties of ready-to-harvest rapeseed plants: Measurement and analysis. Inf. Process. Agric. 2023, 10, 391–399. [Google Scholar] [CrossRef]
  31. Bravina, L.; Kvasiuk, Y.; Sivoklokov, S.; Vitiuk, O.; Zabrodin, E. Directed Flow in Microscopic Models in Relativistic A+A Collisions. Universe 2019, 5, 69. [Google Scholar] [CrossRef]
  32. Yuan, J.; Wan, X.; Liao, Q.; Gao, D.; Xiao, W.; Yang, J. Mechanical compression characteristics of rapeseed based on continuous damage theory. Biosyst. Eng. 2022, 224, 301–312. [Google Scholar] [CrossRef]
  33. Zhang, X.F.; Li, B.; Peng, G.L.; Meng, G.D.; Luo, C.W.; Yang, L. Analysis of Vacuum Drying Kinetics of Rapeseed and Analysis of Weibull Model. Food Ferment. Ind. 2019, 45, 66–73. [Google Scholar] [CrossRef]
  34. Huang, X.M.; Zha, X.T.; Pan, H.B.; Zong, W.Y.; Chen, H. Measurement and Analysis of Rapeseeds’ Restitution Coefficient in Point-to-Plate Collision Model. Trans. Chin. Soc. Agric. Eng. 2014, 30, 22–29. [Google Scholar]
  35. Wang, L.; Liao, Y.; Li, M.; Ren, N.; Zheng, X.; Wang, M.; Liao, Q. Motion characteristics of rapeseed and wheat seeds within mixing components of air-assisted centralized metering device based on DEM-CFD. Comput. Electron. Agric. 2024, 221, 108986. [Google Scholar] [CrossRef]
  36. Wang, G.; He, B.; Han, D.; Zhang, H.; Wang, X.; Chen, Y.; Chen, X.; Zhao, R.; Li, G. Investigation of Collision Damage Mechanisms and Reduction Methods for Pod Pepper. Agriculture 2024, 14, 117. [Google Scholar] [CrossRef]
  37. Moya, M.; Sánchez, D.; Romero, J.Á.; Villar-García, J.R. Influence of Moisture Content on Some Mechanical Properties of Wheat. Agronomy 2024, 14, 347. [Google Scholar] [CrossRef]
  38. Wang, C.; Zhang, J.P.; Wang, Y.; He, W.; Chen, H.Y. Structural Design Optimization of Built-in Vertical Clapboard for Rapeseed Fluidized Bed Dryer. Food Mach. 2019, 35, 82–88. [Google Scholar] [CrossRef]
  39. Li, W. Difficulties and Suggestions for Developing Green Food Processing Products. Grain Sci. Technol. Econ. 2020, 45, 75–78. [Google Scholar] [CrossRef]
  40. Rao, G.; Zhao, W.Y.; Shi, L.R.; Sun, B.G.; Guo, J.H.; Wang, Z. Calibration and Experimental Validation of Discrete Element Simulation Parameters for Double-low Rapeseed. J. China Agric. Univ. 2023, 28, 192–207. [Google Scholar]
  41. James, T.W. Sensitivity Analysis in Practice, Andrea Saltelli. Technometrics 2005, 47, 236. [Google Scholar] [CrossRef]
  42. Yıldırım, B.; Müftü, S. Simulation and Analysis of the Impact of Micron-Scale Particles onto a Rough Surface. Int. J. Solids Struct. 2012, 49, 1375–1386. [Google Scholar] [CrossRef]
  43. Tofighian, H.; Amani, E.; Saffar-Avval, M. A Large Eddy Simulation Study of Cyclones: The Effect of Sub-Models on Efficiency and Erosion Prediction. Powder Technol. 2020, 360, 1237–1252. [Google Scholar] [CrossRef]
  44. Zhang, P.C. Studies on Rapeseed Drying Technology in A Novel Spouted Bed. Master’s Thesis, Jiangsu University, Zhenjiang, China, 2007. [Google Scholar]
  45. Yildirim, B.; Muftu, S.; Gouldstone, A. Modeling of High Velocity Impact of Spherical Particles. Wear 2011, 270, 703–713. [Google Scholar] [CrossRef]
Figure 1. Scene graph (a), schematic diagram (b), and rapeseed elastic collision trajectory (c).
Agronomy 15 01872 g001
Figure 2. The trajectory of rapeseed movement.
Agronomy 15 01872 g002
Figure 3. The effect of collision material on ec.
Agronomy 15 01872 g003
Figure 4. The variations of ec with L.
Agronomy 15 01872 g004
Figure 5. The variations of ec with H.
Agronomy 15 01872 g005
Figure 6. The variations of ec with Mc.
Agronomy 15 01872 g006
Figure 7. The interactions of H·L on ec (a) and its contour line (b).
Agronomy 15 01872 g007
Figure 8. Collision material.
Agronomy 15 01872 g008
Figure 9. Free-fall test platform.
Agronomy 15 01872 g009
Figure 10. Rapeseed particle model (a) and simulation test model (b).
Agronomy 15 01872 g010
Figure 11. Collision restitution coefficient calibration simulation test.
Agronomy 15 01872 g011
Figure 12. Sensitivity analysis of stiffness (a), damping coefficient (b), and coefficient of Friction (c).
Agronomy 15 01872 g012
Figure 13. The grid independence analysis.
Agronomy 15 01872 g013
Figure 14. Rapeseed free-fall collision model.
Agronomy 15 01872 g014
Figure 15. The stress, strain, and energy relationship diagram of rapeseed free-fall collision test.
Agronomy 15 01872 g015
Figure 16. Stress, strain, and energy diagram of Q235 steel.
Agronomy 15 01872 g016
Figure 17. Stress diagram of rapeseed free-fall collision test.
Agronomy 15 01872 g017
Figure 18. The strain diagram of the rapeseed free-fall collision test.
Agronomy 15 01872 g018
Figure 19. Stress distribution of Q235 steel.
Agronomy 15 01872 g019
Figure 20. Strain distribution of Q235 steel.
Agronomy 15 01872 g020
Table 1. The details of the experimental instruments.
DevicesModelProduction InformationMeasurement RangePrecision
High-speed cameraFASTCAM Mini UX50(Photron) Tokyo, JapanMax fps 2000-
LED lighting power supplyCLG-150-48A(Shenzhen Longood Intelligent Electric Co., Ltd.) Shenzhen, China48 V, 0~3.20 A±1 (%U)
Electronic balanceFA-2204BN(Shanghai Youke Instrument Co., Ltd.) Shanghai, China0.01–220 g0.0001 g
Moisture analyzerSFY-001(Shenzhen Guanya Technology Co., Ltd.) Shenzhen, China0–50 g0.001 g/0.5%
Table 2. Single-factor experiment design.
NumberCollision MaterialL/mmMc/%w.b.H/mm
1Q235 steel610350
220
330
4Organic glass10
520
630
7SBR Rubber10
820
930
10Aluminum alloy10
1120
1230
13Q235 steel220
144
156
168
1710
18610150
19250
20350
21450
22550
2320150
24250
25350
26450
27550
2830150
29250
30350
31450
32550
3310350
3415
3520
3625
3730
Table 3. Levels and codes of experimental factors.
LevelL/mmMc/%w.b.H/mm
−1210150
0620350
+11030550
Table 4. Uncertainty of experiment parameters.
NameUnitsUncertainty
Horizontal component velocity (Vx)m·s−1±0.04
Vertical component velocity (Vy)m·s−1±0.03
Instantaneous velocity after collision (V0)m·s−1±0.03
The actual value of the rebound height (Hr)mm±0.04
Simulation value of rebound height (Hs)mm±0.02
Table 5. The experimental results.
Test NumberX1X2X3Vx/m·s−1Vy/m·s−1V0/m·s−1Y
1350 (0)2 (−1)10 (−1)1.9710.2542.6460.649
2350 (0)6 (0)20 (0)1.9690.5022.5970.565
3550 (+1)6 (0)10 (−1)2.8360.8783.2340.605
4150 (−1)6 (0)10 (−1)1.3950.3151.6660.648
5550 (+1)6 (0)30 (+1)2.5080.7583.2340.541
6150 (−1)10 (+1)20 (0)1.1010.2491.5680.543
7150 (−1)6 (0)30 (+1)1.2120.3051.6760.541
8550 (+1)10 (+1)20 (0)2.7120.9193.2540.551
9350 (0)10 (+1)30 (+1)1.9490.5592.5770.539
10350 (0)6 (0)20 (0)1.9710.5032.5970.565
11350 (0)2 (−1)30 (+1)2.0450.6012.6170.552
12350 (0)6 (0)20 (0)1.9650.5112.5970.550
13350 (0)10 (+1)10 (−1)1.9950.3212.5770.645
14350 (0)6 (0)20 (0)1.9750.5082.5970.565
15350 (0)6 (0)20 (0)1.9680.5012.5970.565
16550 (+1)2 (−1)20 (0)2.6690.8143.2830.565
17150 (−1)2 (−1)20 (0)1.3790.311.7150.623
Table 6. The ANOVA analysis.
Variation SourceQuadratic SumDegree of FreedomMean SquareFp
Model0.024690.002718.160.0005
H0.001110.00117.170.0316
L0.001510.001510.220.0151
Mc0.017510.0175115.98<0.0001
HL0.001110.00117.220.0312
HMc0.000510.00053.070.1234
LMc0100.13430.7248
H20100.11170.748
L20.000510.00053.080.1227
Mc20.002410.002415.750.0054
Residual error0.001170.0002
Lack of fit0.000930.00036.480.0513
Error0.000240
Summation0.025716
Table 7. The relative error between the predicted value and the measured value of ec.
Mc (%w.b.)L (mm)H (mm)The Predicted Value of ecThe Measured Value of ecRD (%)
15102000.5428340.5052282350.074
2564000.6053770.5675022170.066
3023000.5774920.4897155720.179
2162500.54332250.5204065680.044
1821500.552147250.4733555290.166
22103200.56788680.5655105940.004
Table 8. Intrinsic parameters of rapeseed and Q235 steel [39,40].
ParameterValue
Poisson’s ratio of rapeseed0.28
Rapeseed density/(kg·m−3)749, 779, 801
The shear modulus of rapeseed/Pa1.1 × 107
Poisson’s ratio of Q235 steel0.304
Density of Q235 steel/(kg·m−3)7850
Shear modulus of Q235 steel/Pa7 × 1010
The static friction coefficient between rapeseed and Q235 steel0.25
The rolling friction coefficient between rapeseed and Q235 steel0.08
The normal stiffness between rapeseed and Q235 steel (N·m−1)1.56 × 10⁵
The tangential stiffness between rapeseed and Q235 steel (N·m−1)9.36 × 10⁴
Table 9. Comparison of simulation value and actual value.
Test NumberX1X2X3Simulative Value Hs/mmMeasured Value Hr/mmRD%
1350 (0)2 (−1)10 (−1)158.807158.330.3012695
2350 (0)6 (0)20 (0)115.268114.660.530263387
3550 (+1)6 (0)10 (−1)191.415191.73−0.164293538
4150 (−1)6 (0)10 (−1)63.834964.23−0.615133115
5550 (+1)6 (0)30 (+1)163.115162.130.607537162
6150 (−1)10 (+1)20 (0)46.869546.670.427469466
7150 (−1)6 (0)30 (+1)44.38544.330.124069479
8550 (+1)10 (+1)20 (0)175.639174.230.808701142
9350 (0)10 (+1)30 (+1)100.402101.17−0.759118316
10350 (0)6 (0)20 (0)115.225116.33−0.949883951
11350 (0)2 (−1)30 (+1)102.724103.12−0.384018619
12350 (0)6 (0)20 (0)108.492107.930.520707866
13350 (0)10 (+1)10 (−1)145.796145.130.458898918
14350 (0)6 (0)20 (0)115.249115.93−0.587423445
15350 (0)6 (0)20 (0)115.289116.34−0.903386625
16550 (+1)2 (−1)20 (0)179.135180.01−0.486084106
17150 (−1)2 (−1)20 (0)57.178556.650.932921447
Table 10. Parameters and methods for ANSYS numerical simulation.
CategoryItemValue/Methods
Mesh QualityOrthogonal quality0.25
Skewness0.53
Jacobian ratio0.38
Boundary ConditionsFixed supportQ235 steel bottom
Gravitational acceleration−Z, 9.81 m/s2
Pre-impact velocity1.71464 m/s
Solver SettingsEnd time0.005 s
Time step controlAutomatic time step adaptation
Contact algorithmPenalty/Node-based
Hourglass controlKhoury
Disclaimer/Publisher’s Note: The statements, opinions and data contained in all publications are solely those of the individual author(s) and contributor(s) and not of MDPI and/or the editor(s). MDPI and/or the editor(s) disclaim responsibility for any injury to people or property resulting from any ideas, methods, instructions or products referred to in the content.

