
Quantifying Macropore Variability in Terraced Paddy Fields Using X-Ray Computed Tomography

Abstract
1. Introduction
2. Materials and Methods
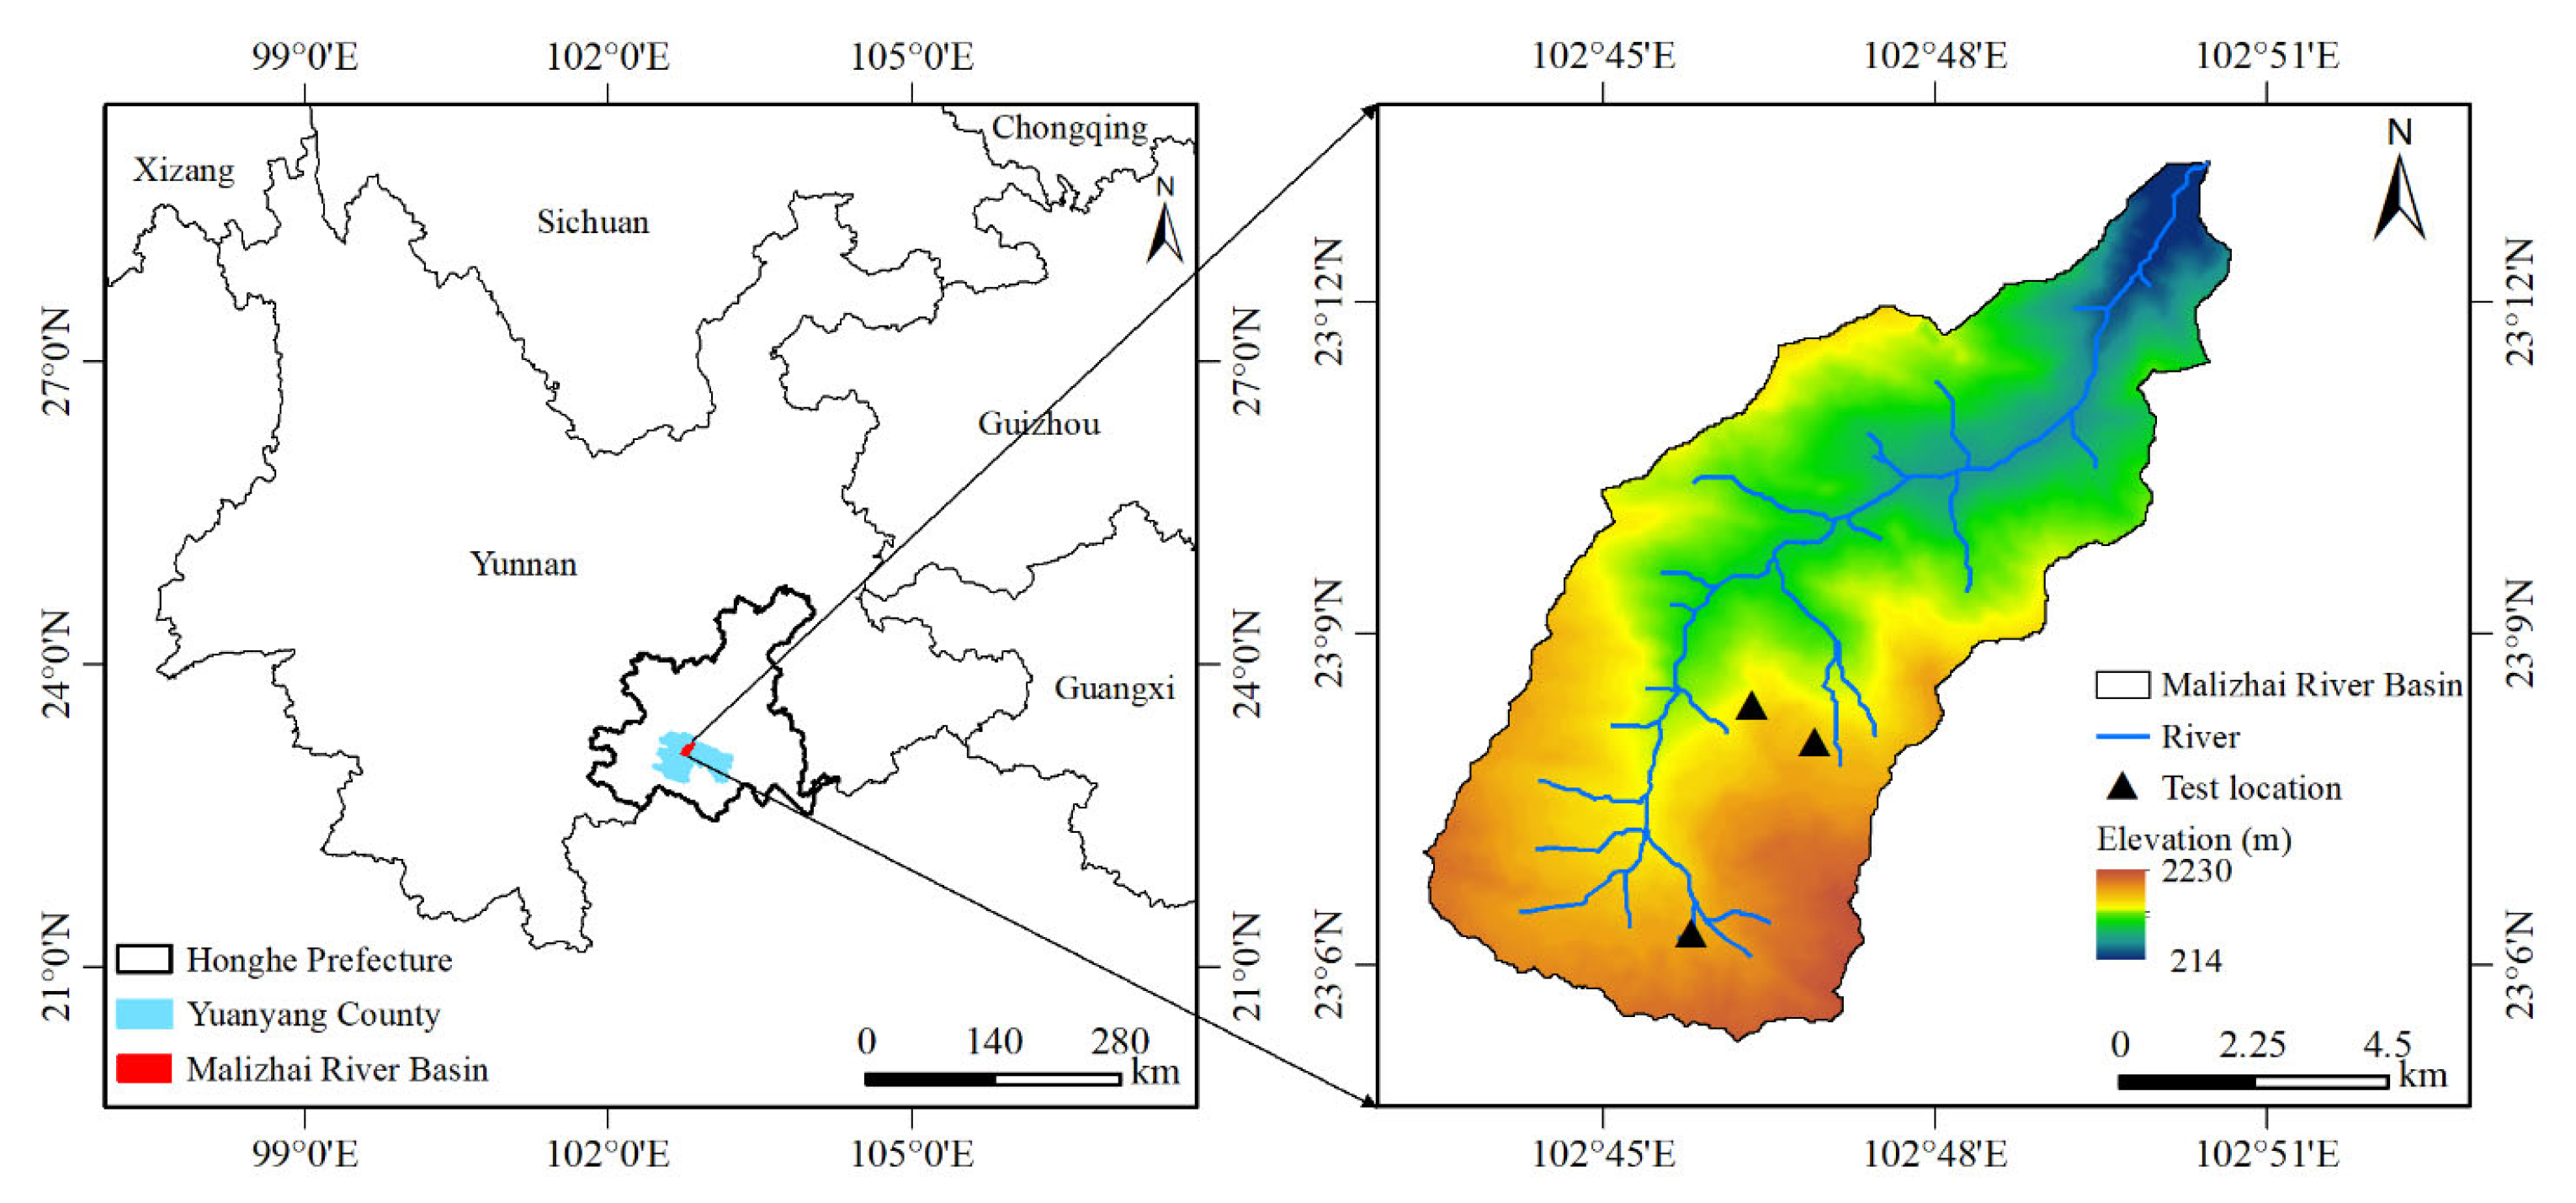
2.1. Study Area
2.2. Soil Sampling
2.3. CT Scanning and Image Analysis
2.4. Extraction of Soil Macropore Structure Parameters
- (1)
- Porosity. The term ‘porosity’ refers to the total number of independently distributed pores within a three-dimensional model. Avizo 2020 software is utilized to automatically count the number of large pores present in the model.
- (2)
- Porosity (). Porosity is defined as the ratio of pore volume to the total volume of the soil. The calculation formula is as follows:where is the pore volume, mm3; is the total volume of the soil, mm3.
- (3)
- Pore volume (). Pore volume refers to the sum of the volumes of voxels occupied by pores in a three-dimensional model. The calculation formula is as follows:where is the number of pore voxel units; is the minimum voxel unit volume, mm3.
- (4)
- Equivalent diameter (). The equivalent diameter refers to the diameter of a sphere with the same volume as an irregular object in three dimensions. The calculation formula is:where is the pore volume, mm3.
- (5)
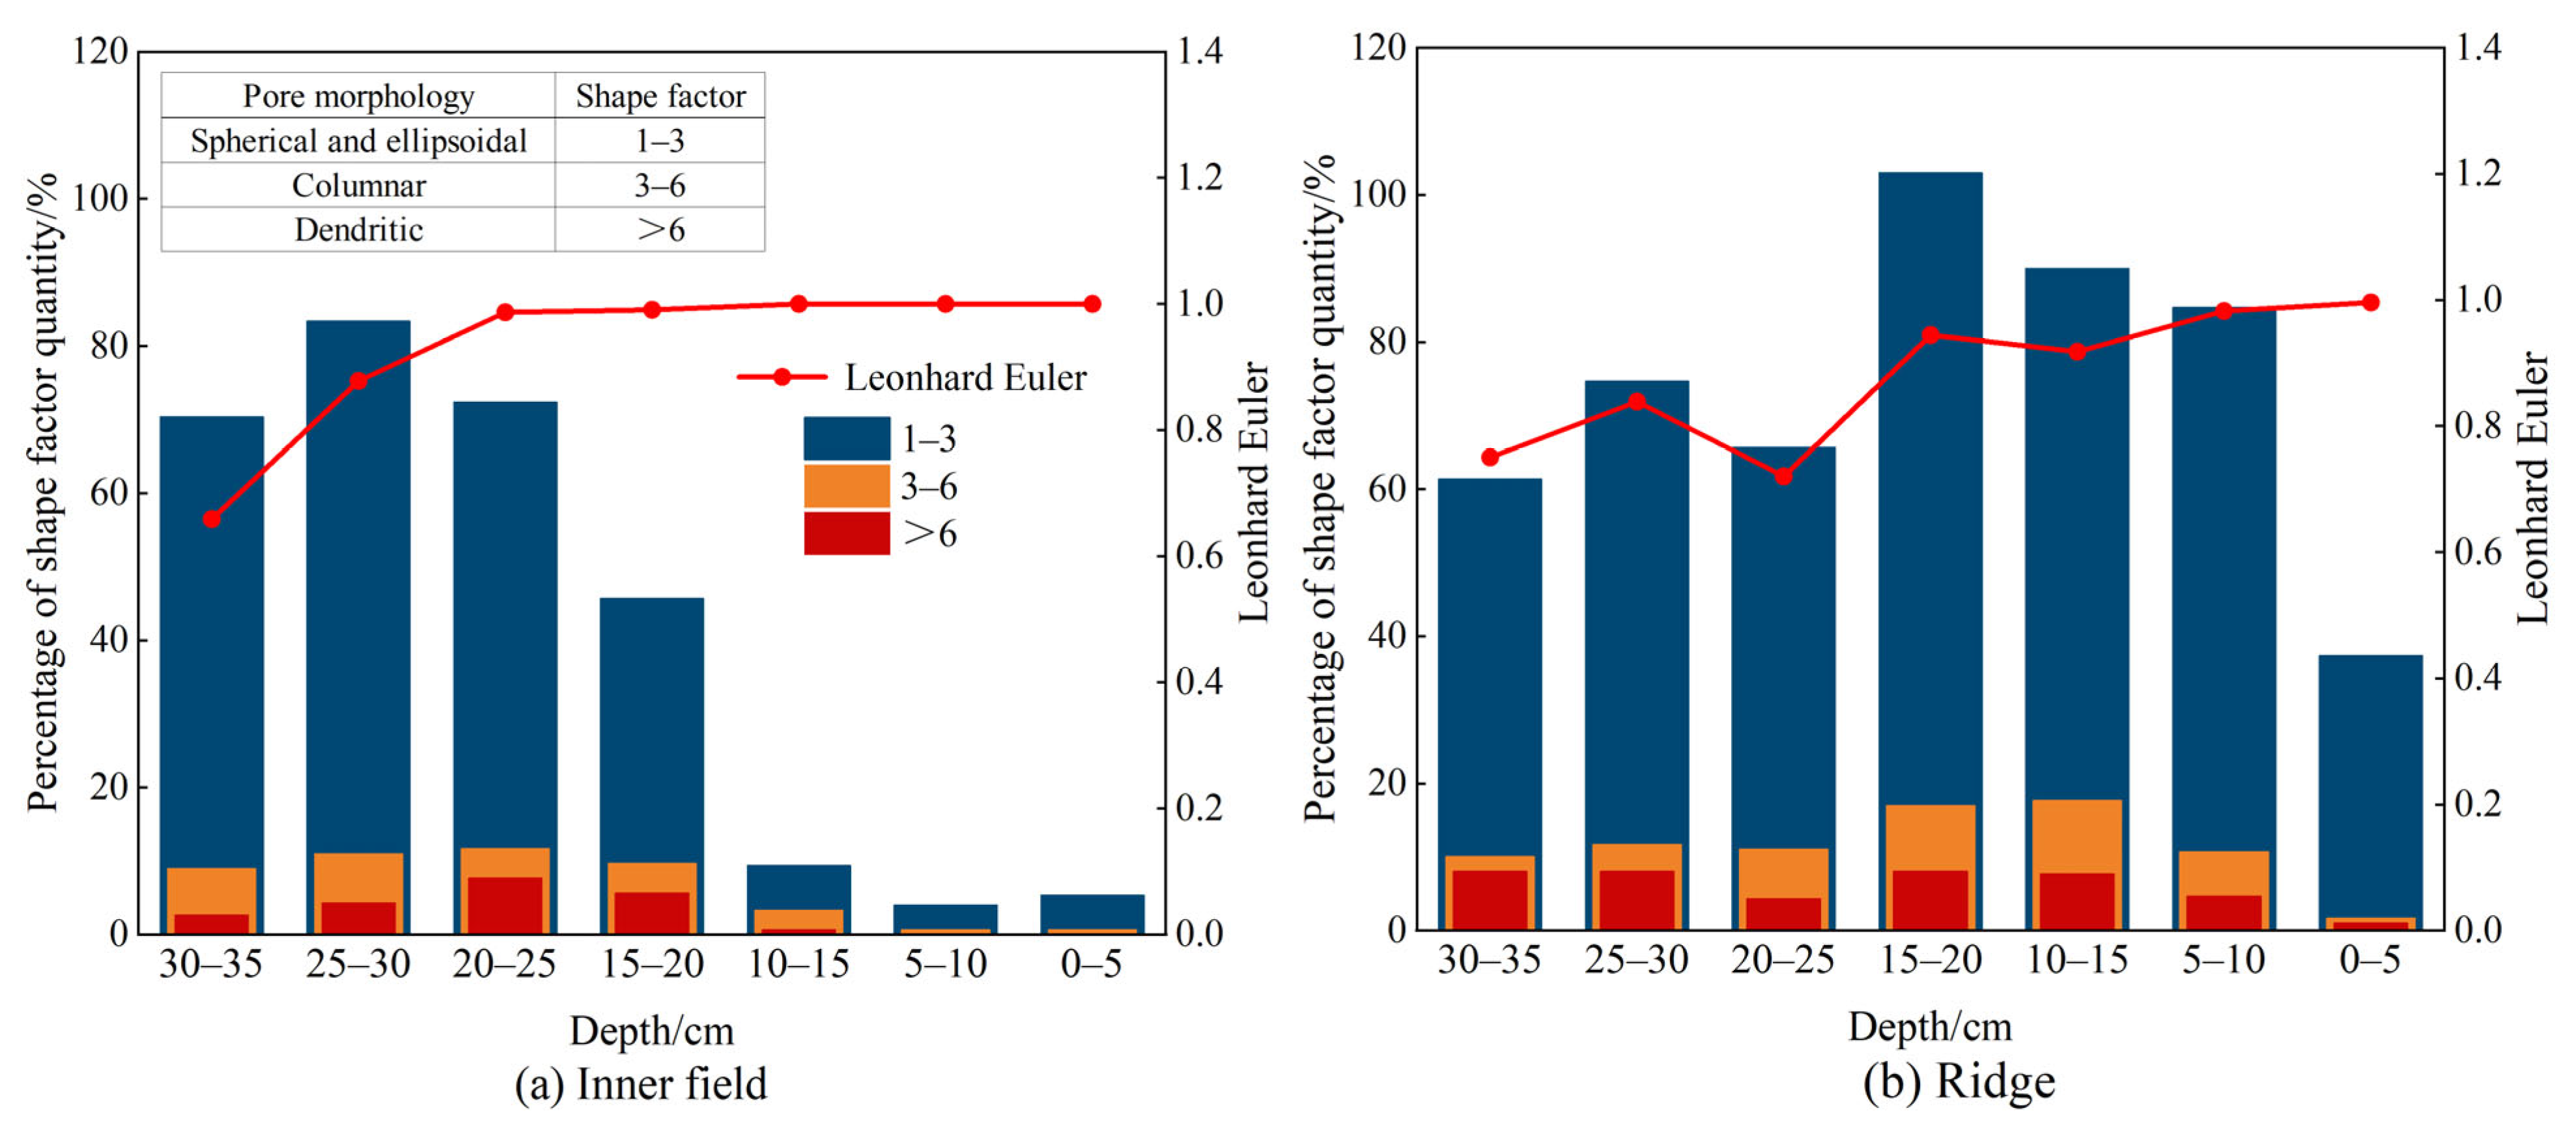
- Shape Factor (). In three dimensions, the degree to which an object approximates a sphere is quantified using the three-dimensional shape factor. A standard sphere has a shape factor of 1, while elongated, flat, or irregular shapes yield higher shape factors. Based on the classification method for soil pore shapes [32] and taking into account the actual conditions observed in the images, large pores with shape factors less than 3 are classified as spherical ellipsoidal pores. Those with shape factors ranging from 3 to 6 are classified as columnar pores, while large pores with shape factors greater than 6 are categorized as branched pores. The calculation formula is as follows:where is the surface area of the pores, mm2; is the pore volume, mm3.
- (6)
- Euler number (). Euler’s number serves as an indicator for assessing the connectivity of three-dimensional complex structures. It quantifies the connectivity of the structure by evaluating the degree of multiple connections among each component of the object [33]. A stronger connectivity within the soil structure corresponds to a smaller Euler value, while a weaker connectivity results in a larger Euler value. The calculation formula is as follows [34]:where is the number of connecting components; is the number of holes; and is the number of closed pores.
2.5. Statistical Analysis
3. Results
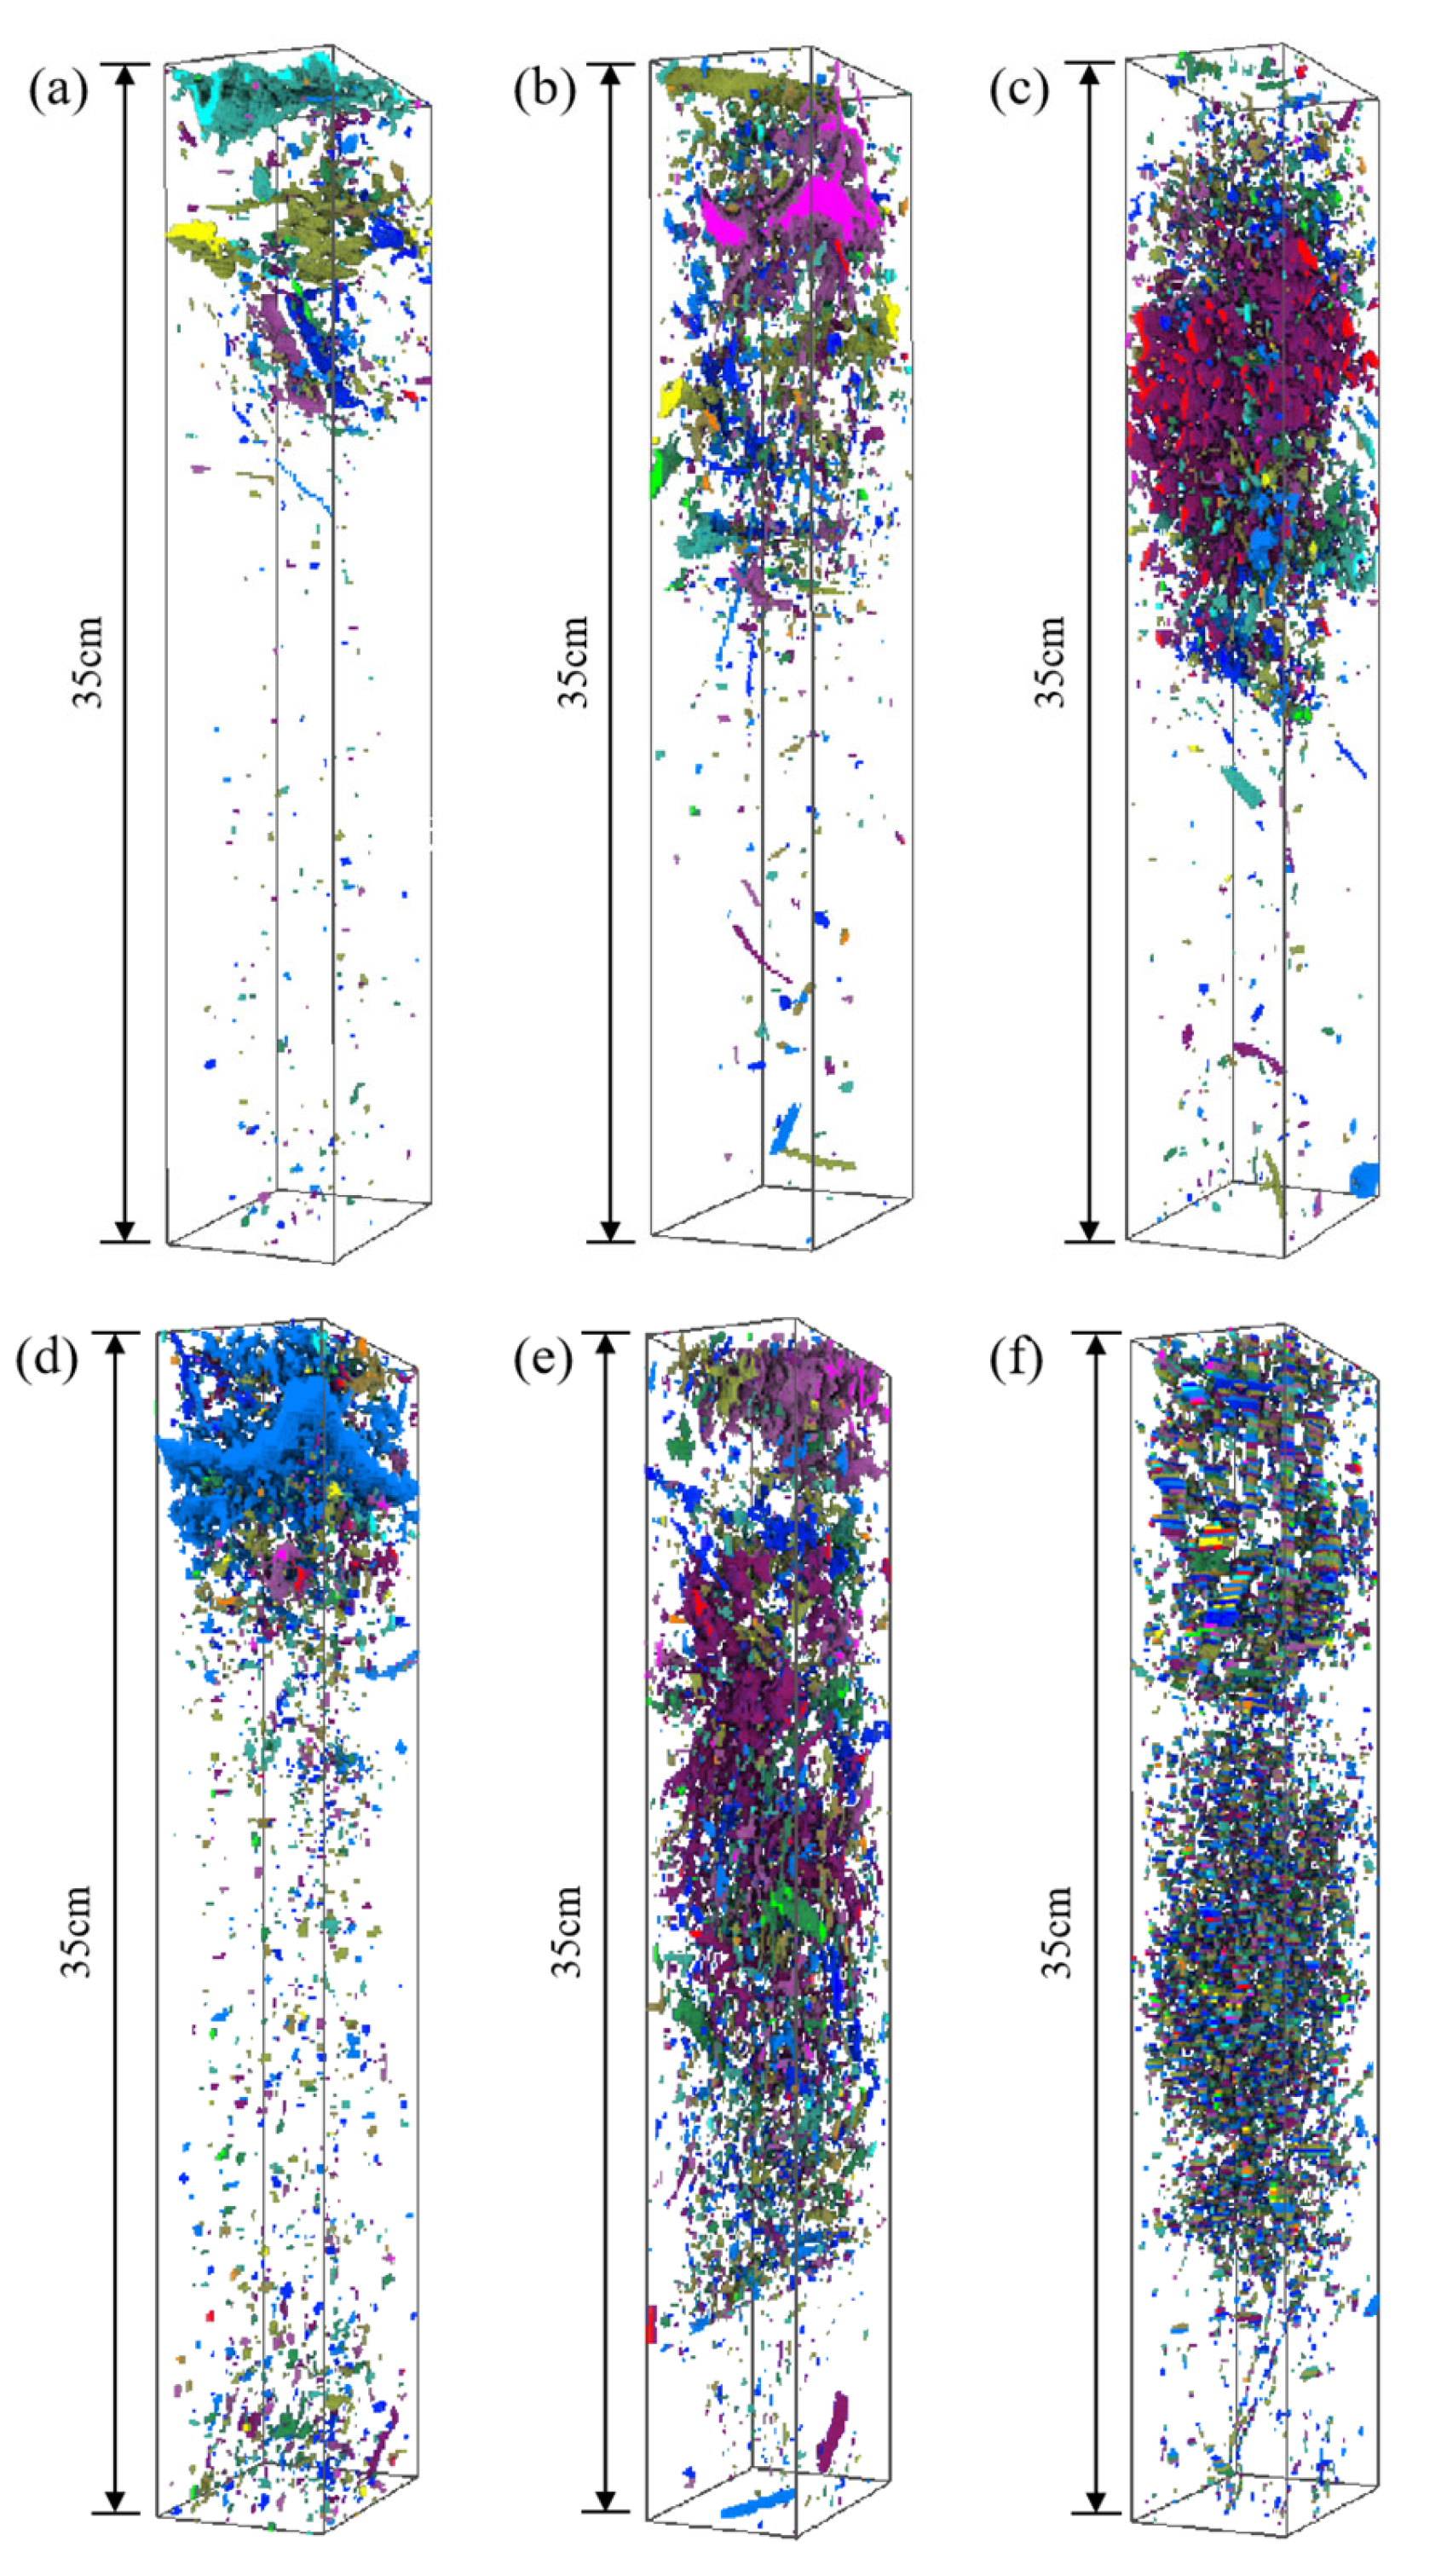
3.1. Visualization and Three-Dimensional Characteristics of Soil in Different Altitudes and Field Position
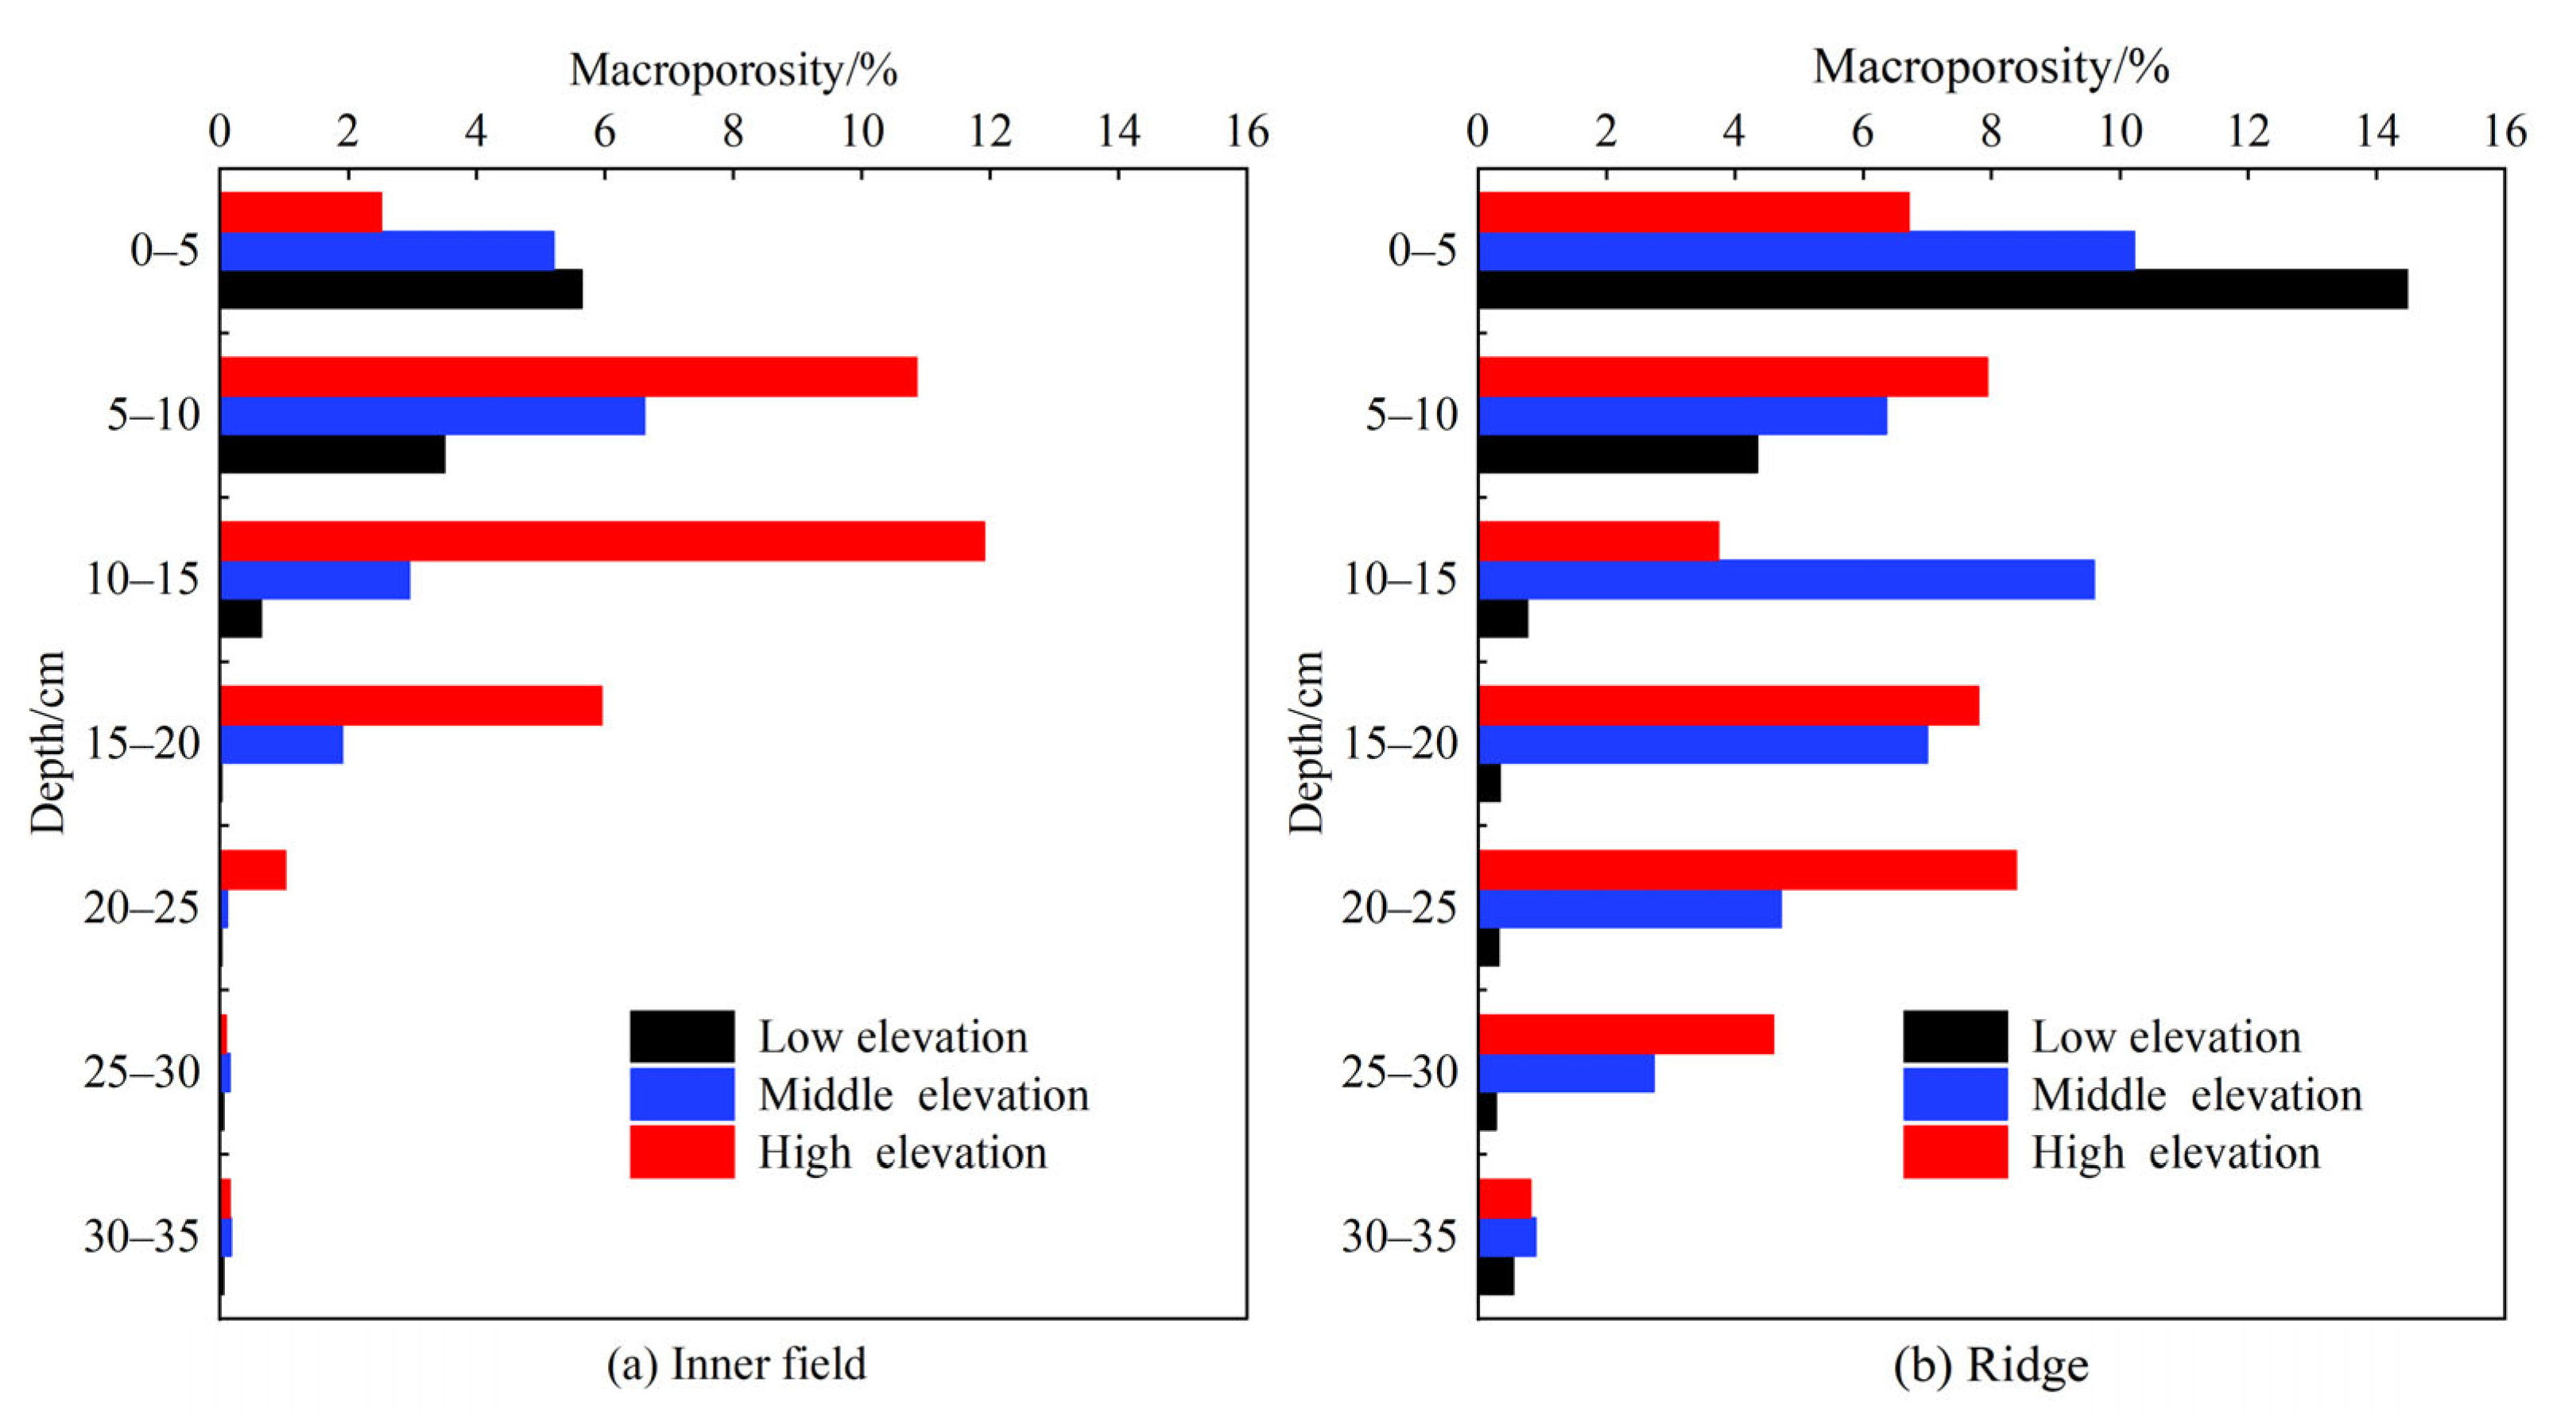
3.2. Three-Dimensional Porosity Distribution Law
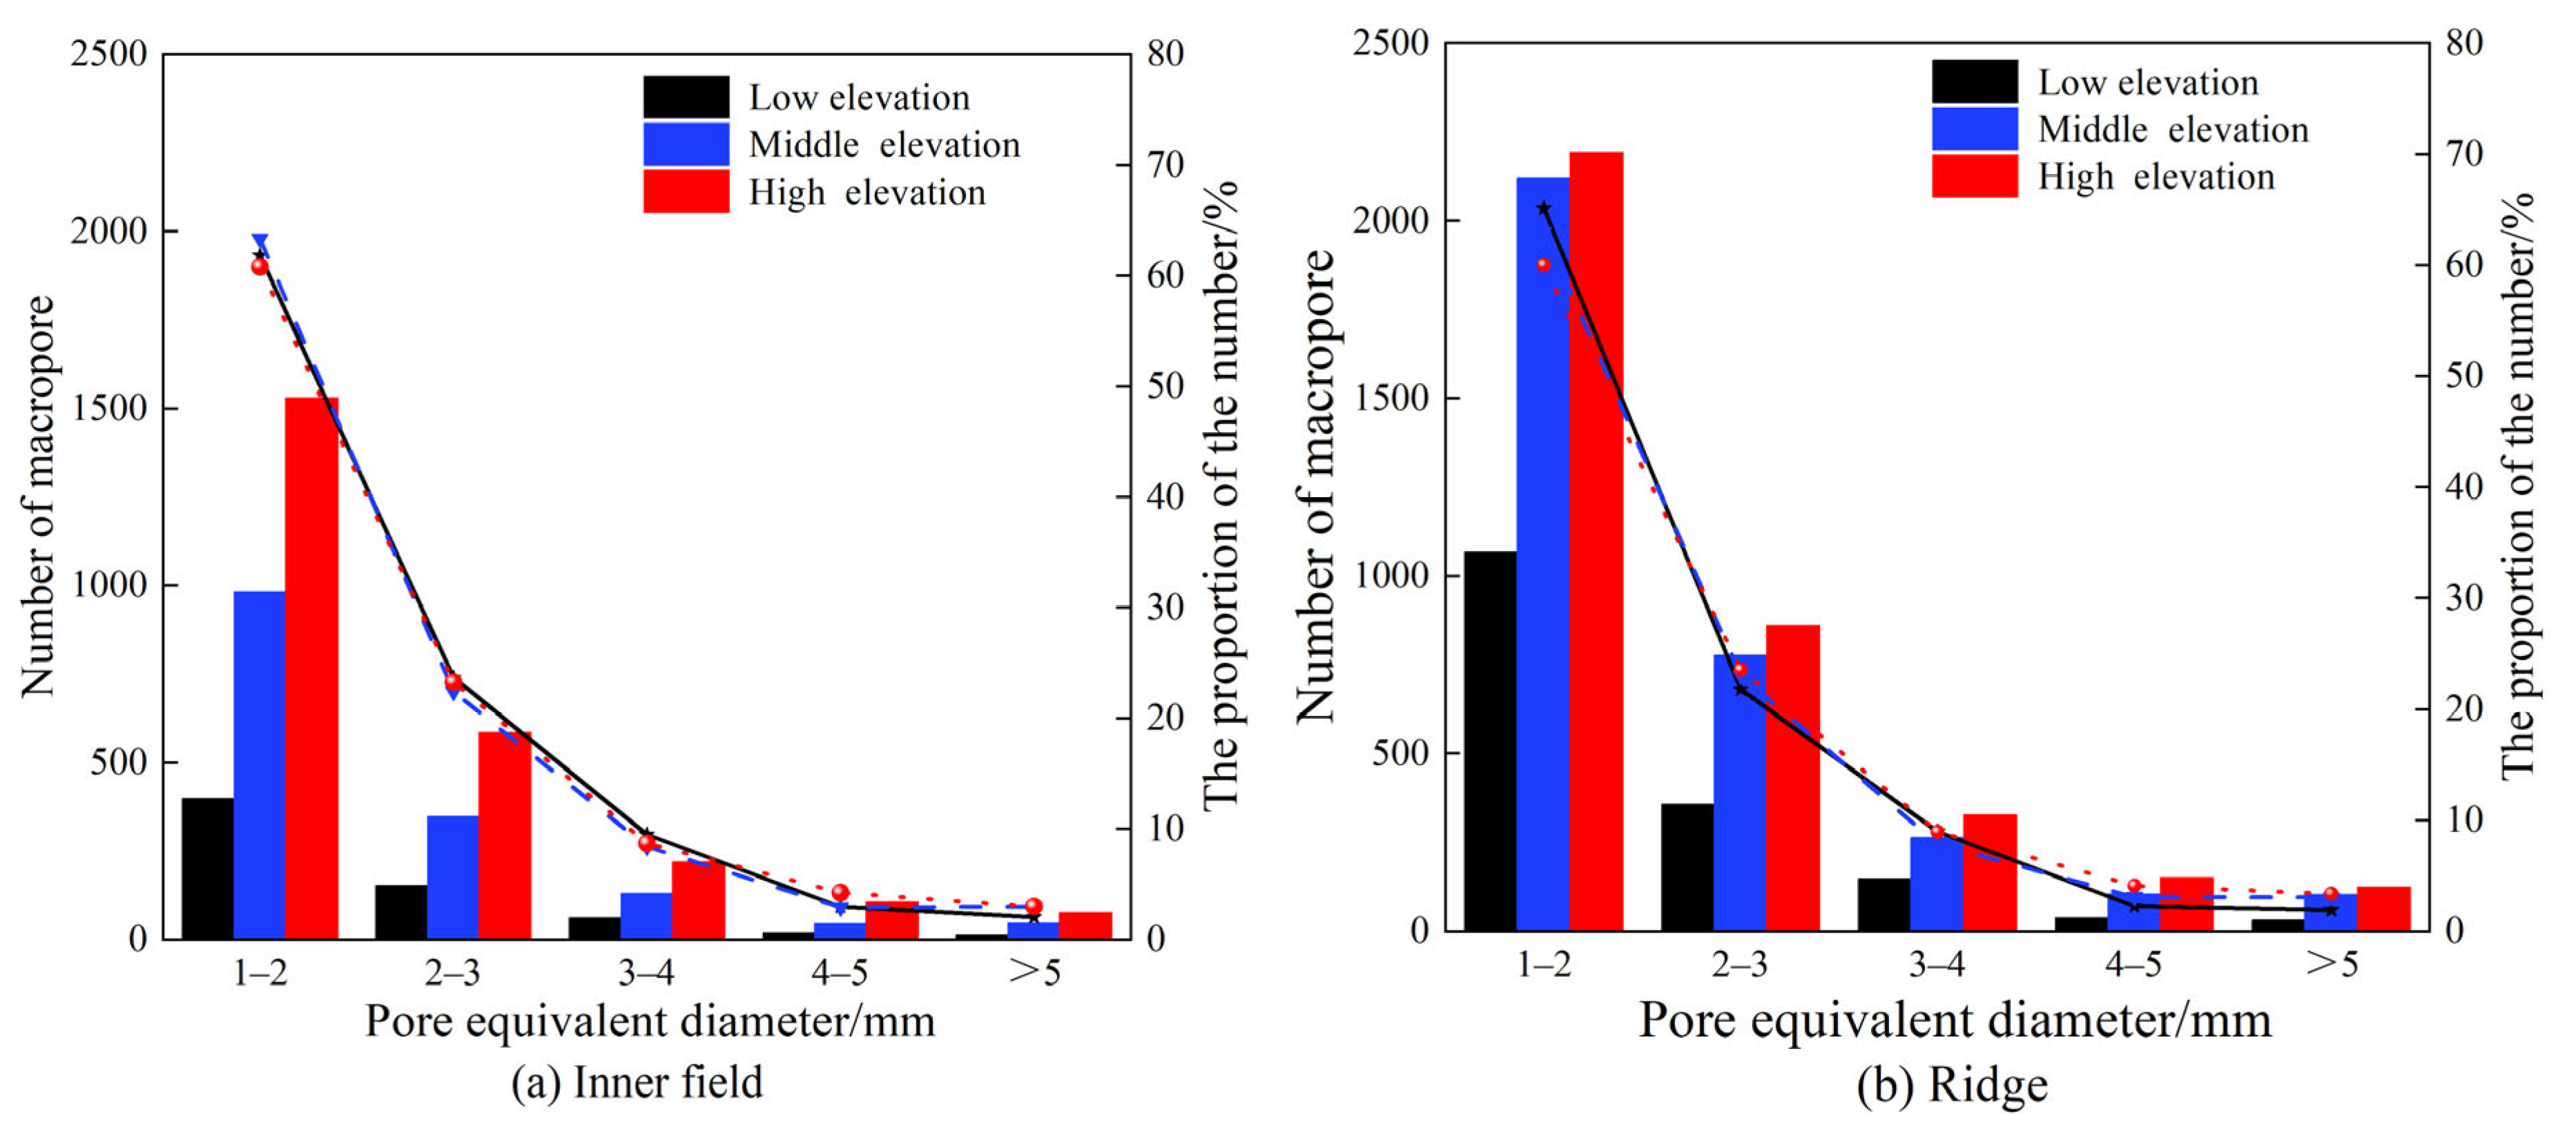
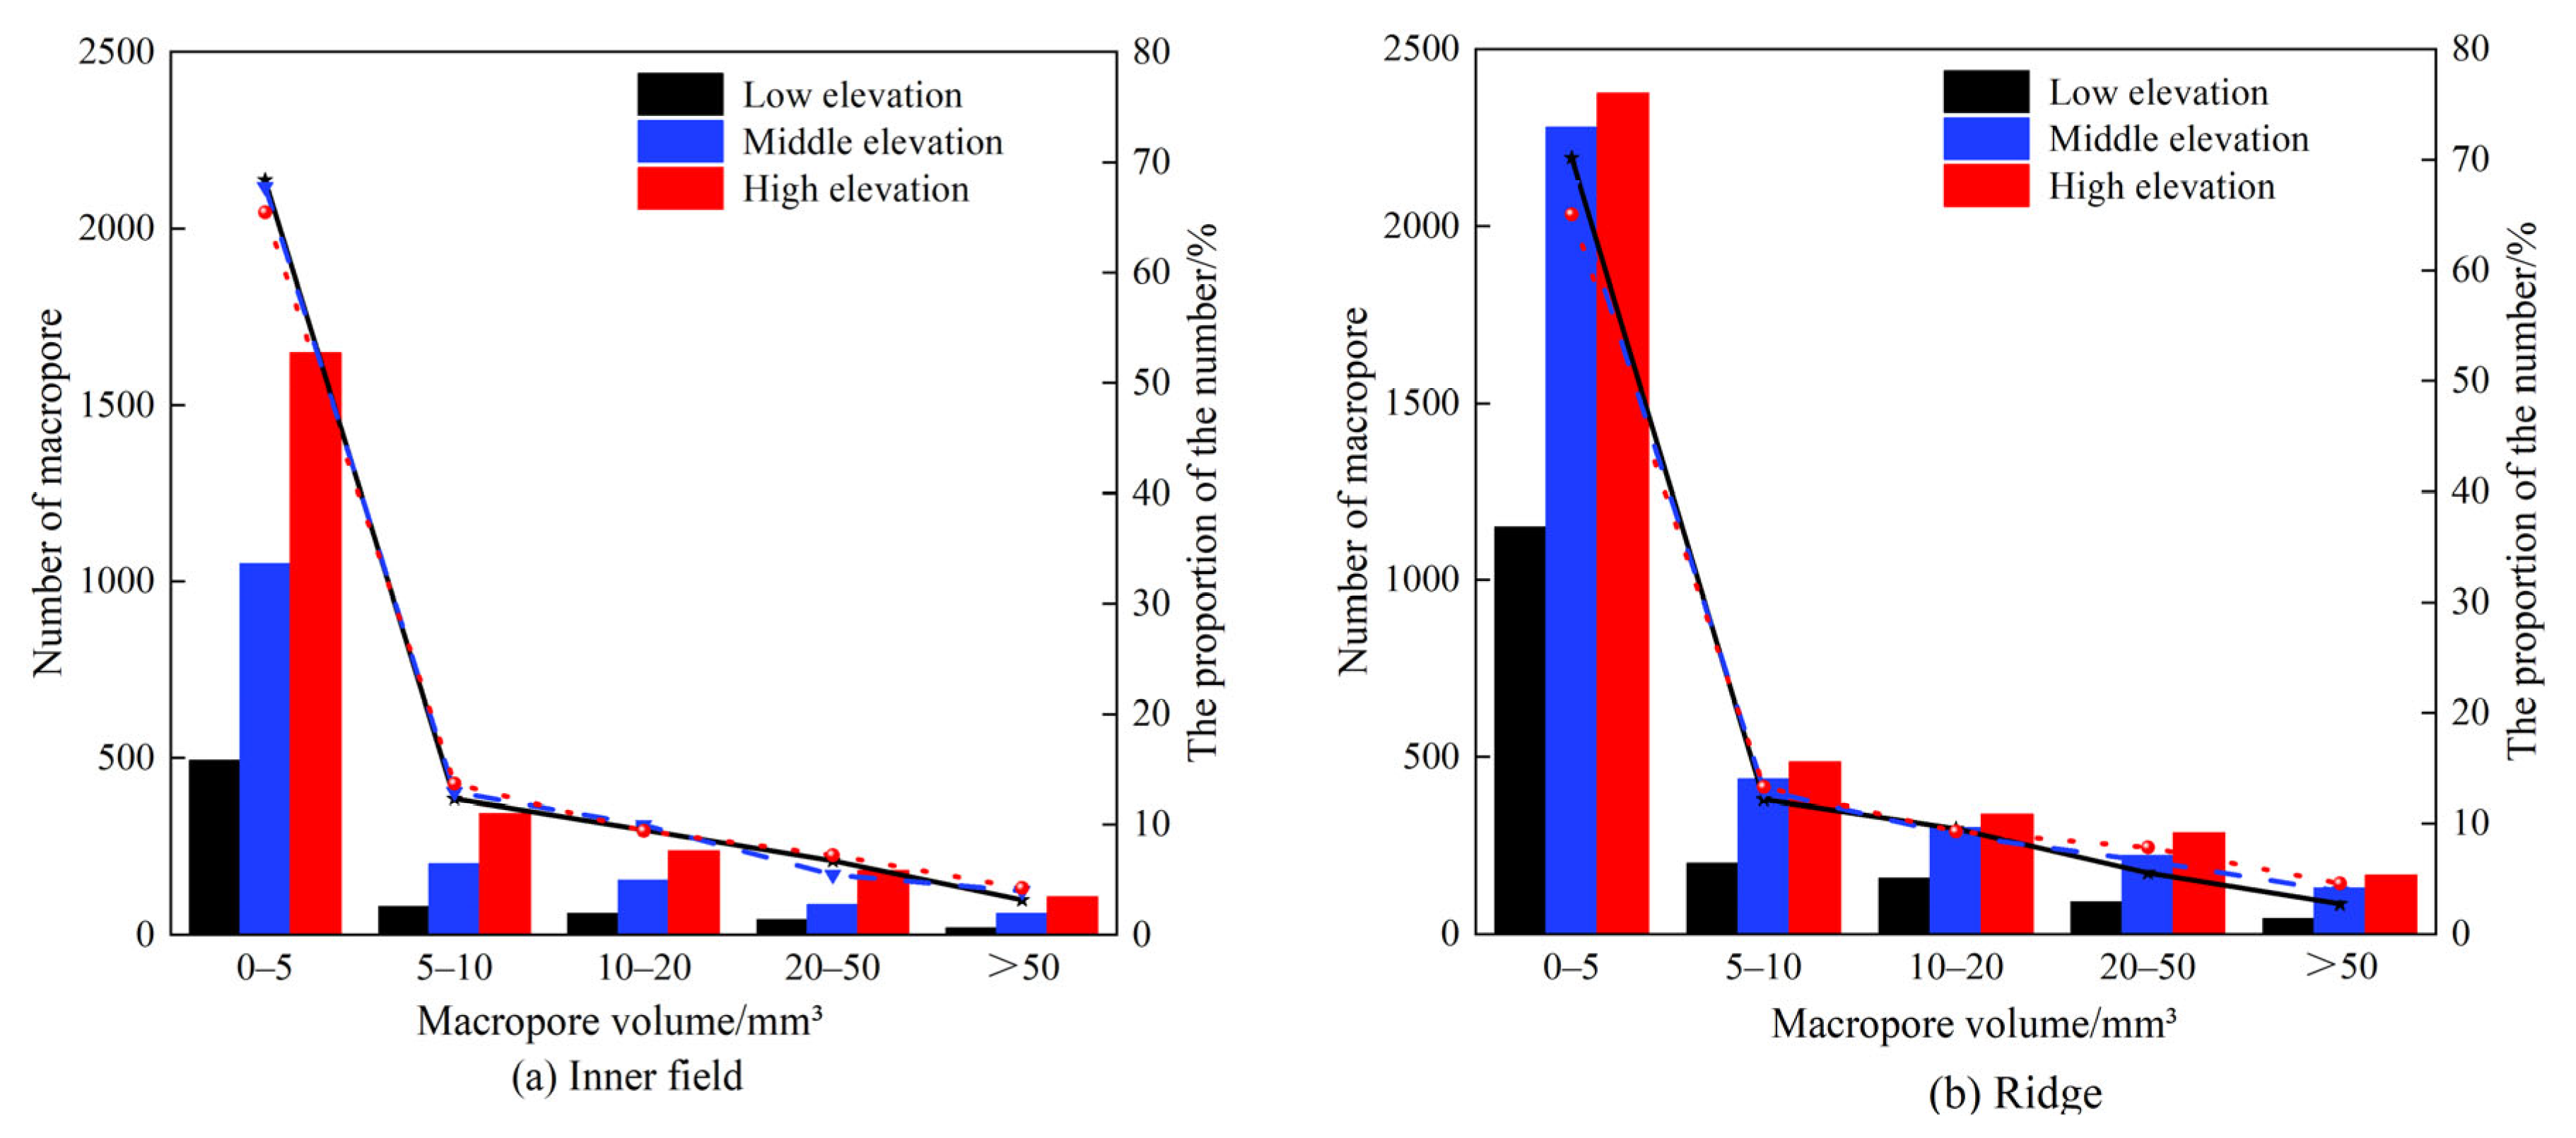
3.3. Three-Dimensional Equivalent Diameter and Volume Distribution Law
3.4. Distribution Law of Shape Factors and Connectivity of Large Pores in Paddy Fields and Ridges
4. Discussion
4.1. The Influence of Different Altitude Gradients on Soil Macropores Characteristic
4.2. Evaluation of Soil Macropores Characteristic at Different Field Positions
4.3. The Number of Large Pore
4.4. Effect of Analyzed Soil Volume on Macropore Characteristics
5. Conclusions
Author Contributions
Funding
Data Availability Statement
Acknowledgments
Conflicts of Interest
References
- Xu, Q.; Jiao, Y.M.; Liu, C.J.; Liu, Z.; Ding, Y.; Zhang, H.; Tao, Y.; Zhang, Z. The spatial patterns and impact factors of stable oxygen and hydrogen isoscapes in pond water: A case study on the water-source forests of the Hani terraced fields in Yunnan, China. J. Hydrol. 2021, 603, 127097. [Google Scholar] [CrossRef]
- Yao, M.; Cui, B.S. Vertical characteristics of the hani terraces wetland ecosystem. Acta Ecol. Sin. 2006, 7, 2115–2124. [Google Scholar]
- Zheng, C.; Guo, X.; Zu, Y.; He, Y.; Xu, Y. Evaluation on service value of paddy field ecosystem in yuanyang terraces. Ecol. Sci. 2018, 37, 124–130. [Google Scholar] [CrossRef]
- Peng, Z.Y.; Song, W.F.; Xia, X. Adsorption-desorption characteristics of ammonium nitrogen in the soil of yuanyang hani terraces wetland. Wetl. Sci. 2024, 22, 651–663. [Google Scholar] [CrossRef]
- Zhang, M.N. Impact of Tourism development on the ecological environment of terraced rice landscapes. North. Rice 2024, 54, 64–66. [Google Scholar]
- Zha, Z.Q.; Jiao, Y.M.; Liu, Z.L.; Liu, C.; Gao, X.; Ding, Y.; Zhao, D. Evaluation of eutrophication and retention effects of water bodies in the hani terraces wetland landscape. Chin. J. Ecol. 2018, 37, 3413–3421. [Google Scholar] [CrossRef]
- Wang, M.; Rong, L.; Li, Y.B.; Huang, J.; Jiao, Y.; Wei, X. Drainage of paddy terraces impacts structures and soil properties in the globally important agricultural heritage of Hani Paddy Terraces, China. Int. Soil Water Conserv. Res. 2024, 12, 64–76. [Google Scholar] [CrossRef]
- Xu, X.T. Study on the Characteristics and Influencing Mechanisms of Soil Macropores in Typical Wastewater Irrigation Areas. Ph.D. Thesis, Henan Polytechnic University, Zhenzhou, China, 2020. [Google Scholar]
- Zhang, W.J.; Li, S.Y.; Xu, Y.D.; Liu, X.; An, T.; Zhu, P.; Peng, C.; Wang, J. Research progress on the relationship between soil pore structure and soil microenvironment as well as organic carbon turnover. J. Soil Water Conserv. 2019, 33, 1–9. [Google Scholar] [CrossRef]
- Li, S.L. Distribution of Soil Macropores and Characteristics of Water and Nitrogen Leakage in the Transition Zone Between Paddy Fields and Ridges. Master’s Thesis, Central China Normal University, Wuan, China, 2018. [Google Scholar]
- Ruan, X.Z.; Cheng, J.H.; Zhang, H.J.; Du, S.; Li, S.; Zhang, F.; Chen, X. Characteristics of soil macropores and their influencing factors in different forest lands in simian mountain, chongqing. J. Soil Water Conserv. 2015, 29, 68–74+80. [Google Scholar]
- Fluey, M.; Fltihler, H. Blue FCF as a dye tracer for solute transport studies-a toxicological overview. J. Environ. Qual. 1994, 23, 1108–1112. [Google Scholar] [CrossRef]
- Liu, M.X.; Wu, D.; Wu, S.P.; Liao, L. Characteristics of forest soil macropores and their impact on saturated hydraulic conductivity in the three gorges reservoir area. Acta Ecol. Sin. 2016, 36, 3189–3196. [Google Scholar]
- Sun, X.Q.; She, D.L.; Sanz, E.; Martín-Sotoca, J.J.; Tarquis, A.M.; Gao, L. Multifractal analysis on CT soil images: Fluctuation analysis versus mass distribution. Chaos Solitons Fractals 2023, 176, 114080. [Google Scholar] [CrossRef]
- Tang, W.X.; Ma, Z.M.; Lian, C.Y.; Luo, S. Effects of different irrigation amounts on yield, water consumption characteristics, and water use efficiency of rice under mulch drip irrigation in the hexi oasis irrigation area. Barley Cereal Sci. 2023, 40, 1–7. [Google Scholar] [CrossRef]
- Goutham, T.; Poulamee, C.; Jasdeep, S.; Xu, S.; Kovács, P.; Iqbal, J.; Kumar, S. X-ray computed tomography-measured pore characteristics and hydro-physical properties of soil profile as influenced by long-term tillage and rotation systems. Catena 2024, 237, 107801. [Google Scholar] [CrossRef]
- Vermeul, V.R.; Istok, J.D.; Flint, A.L.; Pikul, J.L., Jr. An improved method for quantifying soil macroporosity. Soil Sci. Soc. Am. J. 1993, 57, 809–816. [Google Scholar] [CrossRef]
- Zhang, Z.Y.; Wang, Y.B.; Ma, Z.H.; Lv, M. Response mechanism of soil structural heterogeneity in permafrost active layer to freeze-thaw action and vegetation degradation. Catena 2023, 230, 107250. [Google Scholar] [CrossRef]
- Wang, P.; Li, X.J.; Min, X.Y.; Yang, D.; Wang, X.; Li, J.; Sun, X. Experimental study on profile layering of coastal saline soil using GPR measurement. Soils 2016, 48, 1261–1269. [Google Scholar] [CrossRef]
- Radulovich, R.; Solorzano, E.; Sollins, P. Soil macropore size distribution from water breakthrough curves. Soil Sci. Soc. Am. J. 1989, 53, 556–559. [Google Scholar] [CrossRef]
- Akay, Y.O.; Fox, G.A.; Šimůnek, J. Numerical simulation of flow dynamics during macropore-subsurface drain interactions using Hydrus. Vadose Zone J. 2008, 7, 909–918. [Google Scholar] [CrossRef]
- Cortina-januchs, M.G.; Quintanilla-Dominguez, J.; Vega-Corona, A.; Tarquis, A.M.; Andina, D. Detection of pore space in CT soil images using artificial neural networks. Biogeosciences 2011, 8, 279–288. [Google Scholar] [CrossRef]
- Grevers, M.C.J.; Jong, E.D.E.; Arnaud, R.J.S. The Characterization of soil macroporosity with CT scanning. Can. J. Soil Sci. 1989, 69, 629–637. [Google Scholar] [CrossRef]
- Kumar, S.; Anderson, S.H.; Udawatta, R.P.; Gantzer, C.J. CT-measured macropores as affected by agroforestry and grass buffers for grazed pasture systems. Agrofor. Syst. 2010, 79, 59–65. [Google Scholar] [CrossRef]
- Udawatta, R.P.; Gantzer, C.J.; Anderson, S.H.; Garrett, H.E. Agroforestry and grass buffer effects on high resolution X-ray CT-measured pore characteristics. Soil Sci. Soc. Am. J. 2008, 72, 295–304. [Google Scholar] [CrossRef]
- Ma, J.; Song, W.F.; Wu, J.K.; Wang, Z.; Zhang, X.J. Isotopic characteristics of precipitation and soil water in forested areas of the water source region of yuanyang terraces. J. Soil Water Conserv. 2016, 30, 243–248+254. [Google Scholar] [CrossRef]
- Zhang, X.J.; Song, W.F.; Wu, J.K.; Wang, Z. Characteristics of hydrogen and oxygen isotopes in soil water from the water source region of yuanyang terraces. Environ. Sci. 2015, 36, 2102–2108. [Google Scholar] [CrossRef]
- Duan, X.F.; Song, W.F.; Li, J.; Wang, L. Study on soil infiltration characteristics of forest in the water source area of yuanyang terraces, yunnan province. Bull. Soil Water Conserv. 2011, 31, 47–52. [Google Scholar] [CrossRef]
- Chu, L.L.; Zhang, X.S.; Yang, G.W.; Tu, T.; Zhao, Y. Organic matter, nutrient characteristics and fertility evaluation after alteration from paddy fields to dry land under different altitudes in hani terrace system. China Rural Water Hydropower 2023, 6, 183–189. [Google Scholar] [CrossRef]
- Luo, L.; Lin, H.; Halleck, P. Quantifying soil structure and preferential flow in intact soil using X-ray computed tomography. Soil Sci. Soc. Am. J. 2008, 72, 1058–1069. [Google Scholar] [CrossRef]
- Carwy, S.K.; Quinton, W.L.; Goeller, N.T. Field and laboratory estimates of pore size properties and hydraulic characteristics for subarctic organic soils. Hydrol. Process. 2007, 21, 2560–2571. [Google Scholar] [CrossRef]
- Li, X. Study on Micro- and Meso-Scale Pore Structure and Preferential Flow Characteristics of Loess Based on CT. Ph.D. Thesis, Chang’an University, Xi’an, China, 2020. [Google Scholar]
- Odgaard, A.; Gundersen, H.J.G. Quantification of connectivity in cancellous bone, with special emphasis on 3D Reconstructions. Bone 1993, 14, 173–182. [Google Scholar] [CrossRef]
- Vogel, H.-J.; Roth, K. Quantitative morphology and network representation of soil pore structure. Adv. Water Resour. 2001, 24, 233–242. [Google Scholar] [CrossRef]
- Bojko, O.; Kabala, C. Transformation of physicochemical soil properties along a mountain slope due to land management and climate changes—A case study from the Karkonosze Mountains, SW Poland. Catena 2016, 140, 43–54. [Google Scholar] [CrossRef]
- Fan, Y.; Clark, M.; Lawrence, D.; Swenson, S.; Band, L.E.; Brantley, S.L.; Brooks, P.D.; Dietrich, W.E.; Flores, A.; Grant, G.; et al. Hillslope hydrology in global change research and Earth system modeling. Water Resour. Res. 2019, 55, 1737–1772. [Google Scholar] [CrossRef]
- Rubinić, V.; Lazarević, B.; Husnjak, S.; Durn, G. Climate and relief influence on particle size distribution and chemical properties of Pseudogley soils in Croatia. Catena 2015, 127, 340–348. [Google Scholar] [CrossRef]
- Tong, X.; Brand, M.; Wang, K.; Horion, S.; Wang, K.; De Keersmaecker, W.; Tian, F.; Schurgers, G.; Xiao, X.; Luo, Y.; et al. Increased vegetation growth and carbon stock in China karst via ecological engineering. Nat. Sustain. 2018, 1, 44–50. [Google Scholar] [CrossRef]
- Zhang, J.G.; Wang, L.D.; Yao, T.; Li, H.; Gao, Y.; Hu, Y.; Lan, X.; Zhou, T. Characteristics of plant community and soil nutrient of different degraded grasslands in east Oilian Mountains. J. Soil Water Conserv. 2019, 33, 227–233. [Google Scholar] [CrossRef]
- Wang, J.; Qin, Q.; Bai, Z.K. Characterizing the effects of opencast coal-mining and land reclamation on soil macropore distribution characteristics using 3D CT scanning. Catena 2018, 171, 212–221. [Google Scholar] [CrossRef]
- Xia, X.; Song, W.F.; Peng, Z.Y. Spatiotemporal distribution characteristics of different forms of phosphorus in hani terraces wetland soils. Acta Ecol. Sin. 2024, 44, 676–685. [Google Scholar] [CrossRef]
- Shah, A.N.; Tanveer, M.; Shahzad, B.; Guozheng, Y.; Shah, F.; Saif, A.; Adnan, B.M.; Atta, T.S.; Abdul, H.; Biangkham, S. Soil compaction effects on soil health and cropproductivity: An overview. Environ. Sci. Pollut. Res. 2017, 24, 10056–10067. [Google Scholar] [CrossRef]
- Shougrakpam, S.; Sarkar, R.; Dutta, S. An experimental investigation to characterise soil macroporosity under different land use and land covers of northeast India. J. Earth Syst. Sci. 2010, 119, 655–674. [Google Scholar] [CrossRef]
- Zhang, J.; Sun, Q.; Wen, N.; Robert, H.; Gang, L. Quantifying preferential flows on two farmlands in the North China Plain using infiltration and dye tracer methods. Geoderma 2022, 428, 116205. [Google Scholar] [CrossRef]
- Panday, D.; Nkongolo, N.V. No tillage improved soil pore space indices under cover crop and crop rotation. Soil Syst. 2021, 5, 38. [Google Scholar] [CrossRef]
- Kukal, S.S.; Aggarwal, G.C. Percolation losses of water in relation to puddling intensity and depth in a sandy loam rice (Oryza sativa) field. Agric. Water Manag. 2002, 57, 49–59. [Google Scholar] [CrossRef]
- Walker, J.C.; Trudgill, S.T. Quantimet image analysis of soil pore geometry.Comparison with tracer breakthrough curves. Earth Surf. Process. Land Forms 1983, 8, 465–472. [Google Scholar] [CrossRef]
- Janssen, M.; Lennartz, B. Characterization of preferential flow pathways through paddy bunds with dye tracer tests. Soil Sci. Soc. Am. J. 2008, 72, 1756–1766. [Google Scholar] [CrossRef]
- Li, S.L.; Zhang, H.L.; Liu, M.X.; Yi, J.; Wu, T.; Zhu, Z. Characteristics of Soil Water Transport and Holding Capacity inPaddy and Inner Field-Bund Transition Zones. J. Soil Water Conserv. 2017, 31, 122–128. [Google Scholar] [CrossRef]
- Huang, H.C.; Liu, C.W.; Chen, S.K.; Chen, J.-S. Analysis of percolation and seepage through paddy bunds. J. Hydrol. 2003, 284, 13–25. [Google Scholar] [CrossRef]
- Patil, M.D.; Da, B.S.; Bhadoria, P. A simple bund plugging technique for improving water productivity in wetland rice. Soil Tillage Res. 2011, 112, 66–75. [Google Scholar] [CrossRef]
- Deurer, M.; Grinev, D.; Young, I.; Clothier, B.E.; Müller, K. The impact of soil carbon management on soil macropore structure: A comparison of two apple orchard systems in New Zealand. Eur. J. Soil Sci. 2009, 60, 945–955. [Google Scholar] [CrossRef]
- Musso, A.; Lamorski, K.; Sławiński, C.; Geitner, C.; Hunt, A.; Greinwald, K.; Egli, M. Evolution of soil pores and their characteristics in a siliceous and calcareous proglacial area. Catena 2019, 182, 104154. [Google Scholar] [CrossRef]
- Wan, Y.P.; Zhao, Y.Y.; Duan, X.; Wang, K.; Chen, T.; Wan, Y. Effects of plant roots and gravel on the formation of soil preferential paths in the dry hot valley region of the red river. Res. Soil Water Conserv. 2022, 29, 140–147. [Google Scholar] [CrossRef]
- Tang, Q.Y.; Yang, J.J.; Zhao, L.; Song, Z.; Wang, G.; Li, Y. Effects of nitrogen application rates on root morphological architecture and fractal characteristics of drip irrigated rice. Acta Agron. Sin. 2024, 50, 1–16. [Google Scholar]
- Peng, W.; Zhu, X.M.; Zheng, W.J.; Xie, Q.; Wang, M.; Ran, E. Rice cultivation can mitigate soil salinization and alkalization by modifying the macropore structure in saline–sodic paddy fields. Agric. Water Manag. 2025, 313, 109473. [Google Scholar] [CrossRef]
- Ge, J.M.; She, D.L.; Ju, X.N.; Cao, T.; Xia, Y. Revealing soil hydraulic parameters via X–ray tomography depends on the relationship between soil pore structure and saturated hydraulic conductivity. J. Hydrol. Reg. Stud. 2025, 60, 102563. [Google Scholar] [CrossRef]
- Rab, M.A.; Haling, R.E.; Aarons, S.R.; Hannah, M.; Young, I.; Gbson, D. Evaluation of X-ray computed tomography for quantifying macroporosity of loamy pasture soils. Geoderma 2014, 213, 460–470. [Google Scholar] [CrossRef]
- Piccoli, I.; Schjønning, P.; Lamandé, M.; Zanini, F.; Morari, F. Coupling gas transport measurements and X-ray tomography scans for multiscale analysis in silty soils. Geoderma 2019, 338, 576–584. [Google Scholar] [CrossRef]
- Budhathoki, S.; Lamba, J.; Srivastava, P.; Malhotra, K.; Way, T.R.; Katuwal, S. Using X-ray computed tomography to quantify variability in soil macropore characteristics in pastures. Soil Tillage Res. 2022, 215, 105194. [Google Scholar] [CrossRef]
Disclaimer/Publisher’s Note: The statements, opinions and data contained in all publications are solely those of the individual author(s) and contributor(s) and not of MDPI and/or the editor(s). MDPI and/or the editor(s) disclaim responsibility for any injury to people or property resulting from any ideas, methods, instructions or products referred to in the content. |
© 2025 by the authors. Licensee MDPI, Basel, Switzerland. This article is an open access article distributed under the terms and conditions of the Creative Commons Attribution (CC BY) license (https://creativecommons.org/licenses/by/4.0/).
Share and Cite
Ma, R.; Chu, L.; Bi, L.; Chen, D.; Luo, Z. Quantifying Macropore Variability in Terraced Paddy Fields Using X-Ray Computed Tomography. Agronomy 2025, 15, 1873. https://doi.org/10.3390/agronomy15081873
Ma R, Chu L, Bi L, Chen D, Luo Z. Quantifying Macropore Variability in Terraced Paddy Fields Using X-Ray Computed Tomography. Agronomy. 2025; 15(8):1873. https://doi.org/10.3390/agronomy15081873
Chicago/Turabian StyleMa, Rong, Linlin Chu, Lidong Bi, Dan Chen, and Zhaohui Luo. 2025. "Quantifying Macropore Variability in Terraced Paddy Fields Using X-Ray Computed Tomography" Agronomy 15, no. 8: 1873. https://doi.org/10.3390/agronomy15081873
APA StyleMa, R., Chu, L., Bi, L., Chen, D., & Luo, Z. (2025). Quantifying Macropore Variability in Terraced Paddy Fields Using X-Ray Computed Tomography. Agronomy, 15(8), 1873. https://doi.org/10.3390/agronomy15081873