Article

Deep Storage Irrigation Enhances Grain Yield of Winter Wheat by Improving Plant Growth and Grain-Filling Process in Northwest China

Key Laboratory of Agricultural Soil and Water Engineering in Arid and Semiarid Areas, Ministry of Education, Northwest A&F University, Yangling 712100, China
*
Authors to whom correspondence should be addressed.
Agronomy 2025, 15(8), 1852; https://doi.org/10.3390/agronomy15081852
Submission received: 24 June 2025 / Revised: 26 July 2025 / Accepted: 29 July 2025 / Published: 31 July 2025
(This article belongs to the Section Water Use and Irrigation)

Abstract

In the irrigation districts of Northern China, the flood resources utilization for deep storage irrigation, which is essentially characterized by active excessive irrigation, aims to have the potential to mitigate freshwater shortages, and long-term groundwater overexploitation. It is crucial to detect the effects of irrigation amounts on agricultural yield and the mechanisms under deep storage irrigation. A three-year field experiment (2020–2023) was conducted in the Guanzhong Plain, according to five soil wetting layer depths (RF: 0 cm; W1: control, 120 cm; W2: 140 cm; W3: 160 cm; W4: 180 cm) with soil saturation water content as the irrigation upper limit. Results exhibited that, compared to W1, the W2, W3, and W4 treatments led to the increased plant height, leaf area index, and dry matter accumulation. Meanwhile, the W2, W3, and W4 treatments improved kernel weight increment achieving maximum grain-filling rate (Wmax), maximum grain-filling rate (Gmax), and average grain-filling rate (Gave), thereby enhancing the effective spikes (ES) and grain number per spike (GS), and thus increased wheat grain yield (GY). In relative to W1, the W2, W3, and W4 treatments increased the ES, GS, and GY by 11.89–19.81%, 8.61–14.36%, and 8.17–13.62% across the three years. Notably, no significant difference was observed in GS and GY between W3 and W4 treatments, but W4 treatment displayed significant decreases in ES by 3.04%, 3.06%, and 2.98% in the respective years. The application of a structural equation modeling (SEM) revealed that deep storage irrigation improved ES and GS by positively regulating Wmax, Gmax, and Gave, thus significantly increasing GY. Overall, this study identified the optimal threshold (W3 treatment) to maximize wheat yields by optimizing both the vegetative growth and grain-filling dynamics. This study provides essential support for the feasibility assessment of deep storage irrigation before flood seasons, which is vital for the balance and coordination of food security and water security.

1. Introduction

The Sixth Assessment Report of the IPCC has demonstrated that the intensity, frequency, and duration of extreme climate events, particularly extreme precipitation events, is expected to further increase due to global climate warming [1]. The terrestrial water cycle will be impacted by extreme precipitation, which will alter surface runoff pattern and raise flood risk [2]. This means the hazard of impending floods in Mainland China steadily climbs by roughly 10–30% [3,4]. Observations detect that the intense convective rainfall and extreme precipitation events are the primary reasons for the rise in precipitation in Northwest China [5]. This area is characterized by a concentrated rainy season and a high contribution to annual precipitation, which may result in an abundance of flood resources throughout the flood season [6]. Pragmatic use and management of flood resources in the established agricultural facilities, taking into consideration the anticipated contribution to irrigation water, is an alternative strategy for solving the supply–demand contradiction of regional water resources.
Winter wheat (Triticum aestivum L.) is one of the most widely cultivated cereal crops in Northwest China, with an annual output accounting for about 40% of the whole province’s total crop production [7,8,9]. Due to the unique geographic location and climatic patterns, this area has a semi-humid and semi-arid climate that significantly contributes to the total amount of precipitation resources, whereas the spatial and temporal distribution of precipitation is highly unstable [10,11]. Notably, the mean annual precipitation in the Guanzhong Plain fluctuates from 544 to 863 mm, but more than 60% of it falls as storms between July and September (summer maize growing seasons) [12,13], which is not overlapping with the wheat growing season. In contrast, the precipitation over the wheat growing season only meets 25–40% of crop water demands [14,15]. To address the challenge of inadequate precipitation, over 70% of irrigation water is generally supplemented by the groundwater [16]. Currently, more than 2.5 billion m3 of groundwater is extracted annually in the Guanzhong Plain, 50% of which is utilized for farmland irrigation [17,18]. The overexploitation of groundwater resources from shallow and deep aquifers for irrigation has induced a continuous drop of the groundwater table, and thereby eventually leads to critical groundwater exhaustion and multiple environmental challenges in aquifers [19,20]. Thus, the investigation of more sustainable irrigation strategies is imperative to balance yield improvement and water resources protection in semi-arid areas with limited water resources.
From a functional viewpoint, the active root zone of soil profiles serves as a reservoir, storing water generated by irrigation or precipitation events and making it available to crops during the long-term water shortage [21]. The significant long-term trend of spring precipitation in Asia is undeniable in previous studies [22,23]. In recent years, China has suffered from extreme precipitation in spring, which has resulted in waterlogging and severe damage to crops [24]. However, the construction of reservoirs involves significant financial investment and extended timeframes. Currently, many regions face challenges due to inadequate storage capacity to cope with the increasingly frequent extreme precipitation events, like Baojixia Irrigation District and Jinghuiqu Irrigation District in the Wei River Basin (i.e., Guanzhong Plain) [25], which leads to the continuous increase in flood control pressure in the downstream areas. Therefore, it is imperative to develop a variety of measures for comprehensive regulation to maximize utilization of flood resources, thus more efficiently and actively leveraging the positive role of unconventional water resources.
In view of this, this study conducted an investigation on the Baojixia Irrigation District and put forward a new concept of deep storage irrigation, aiming at the problems of large amount of water abandonment over flood season and a persistent decline in the groundwater level caused by insufficient regulation capacity of reservoir. Specifically, the concentrated precipitation time in the irrigation districts is forecasted based on a specific probability distribution followed by the long-term hydrological sequence, and reservoir capacity is vacated through flood discharge before the flood season. The farmlands are regarded as groundwater recharge surfaces and soil saturation water content is set as the irrigation upper limit. Then, the large-quota and long-duration irrigation is conducted by canal systems in the irrigation districts without significantly reducing crop yields. On one hand, deep storage irrigation would enable maximizing the excess water storage in the deep soil layer, and thus delay the adverse effects of drought conditions progression on wheat production and conserve conventional irrigation consumption. On the other hand, deep storage irrigation recharges the groundwater resources during dry seasons and regulates the water spatial distribution, which has the potential function to recharge groundwater, and thus delays the continuous decline of groundwater tables and maintains the normal ecological service of the ecosystem.
Sufficient and prompt water provision is deterministic for assuring superior development and output of winter wheat [26]. The alterations of root activity, soil aeration, and soil water and nutrient availability to roots are the primarily driving factors that the discrepancies in irrigation amounts influence crop biomass and productivity [27]. An appropriate improvement of irrigation levels is able to boost plant height and leaf area index of crops, facilitate the accumulation and transport of dry matter, stimulate crop photosynthetic capacity, and accelerate the crop yield development [28,29]. Continuing to increase irrigation amounts within a certain range will attenuate the cumulative effect of wheat plant height, while excessive irrigation will induce a reduction in leaf area [30]. In addition, the response of wheat grain yield to irrigation amounts follows a quadratic curve. Specifically, grain yield linearly increases within a certain range with irrigation amounts increasing, whereas the yield exhibits a reduction when irrigation amounts exceed a certain threshold [29,31]. As evidenced by Du [32], the negative influences of excessive irrigation on root oxygen absorption weakened the ability of the root system to absorb N, thereby leading to a decrease in grain weight. It can be seen that before the practical application of deep storage irrigation, it is vital to explore the safety threshold of irrigation amount to ensure high yield and high efficiency of agriculture, and realize the synergistic improvement in food security and water security.
Structural equation modeling (SEM) is an efficient, multivariate statistical technique for the testing and evaluation of multivariate causal links in science research [33]. Compared with ordinary regression analysis, SEM has four main advantages: (1) it provides a comparison between multiple variables; (2) it calculates a correlation between multiple variables; (3) it explicitly assesses measurement error; and (4) it provides a way to assess direct and indirect causality [34]. Previous studies have utilized SEM to investigate various benefits of irrigation in agriculture. Zewdie [35] employed SEM analysis and demonstrated that dam-driven irrigation water has both direct and indirect effects on crop revenue. Jiang [36] utilized SEM and further revealed that optimal irrigation water salinity enhances tomato yield in sand culture by regulating substrate salinity. SEM has gained popularity in agriculture due to its ability to provide a quantitative and conceptual understanding of the relationships between key variables [37]. The novelty of this study lies in the utilization of SEM to analyze the key contributing factors and regulatory pathways that contribute to grain yield formation under deep storage irrigation.
To address the problem of water shortage, prior research has principally focused on the optimization of deficit irrigation patterns in Northern China, especially in Northwest semi-arid regions [38,39]. Also, a great deal of studies have also been carried out on the efficient utilization of water, fertilizer, heat, and other resources to serve agricultural development via deficit irrigation combined with other measures, such as fertilization regime or tillage methods [40,41]. However, there is little information regarding the flood resources utilization for agricultural production. Unfortunately, the few existing studies are mostly directed against muddy water irrigation [42], which is committed to making full use of the sediment carried by floods to improve soil texture and soil fertility in low-yield fields and depressions, with significant regional limitations in application. In this study, it is proposed to use water storage from reservoirs for deep storage irrigation in farmland before the flood season. This strategy breaks through the traditional patterns of water-saving irrigation with limited freshwater resources in irrigation districts, thereby realizing spatial water storage in exchange for extended irrigation time. In order to alleviate the flood control pressure downstream during the flood season, it is necessary to vacate the reservoir capacity before the concentrated rainfall, and thus this strategy has the particularity of relatively fixed irrigation time and large irrigation amount for a single irrigation. Nowadays, it is not elucidated whether deep storage irrigation negatively affects crop growth and yield, and the suitable range of irrigation amount for various crops in different precipitation type years has not yet been quantified, so the relevant aspects are far from forming a systematic technical framework. This point constitutes the motivation and significance of the current study. Thus, this study took the typical semi-humid and semi-arid region in Northwest China as an example, which focused on the feasibility of deep storage irrigation prior to the flood season and explored the safety irrigation threshold. The main aims of this study were to (1) elucidate the influences of deep storage irrigation on growth, grain-filling process, grain yield, and yield components of winter wheat; (2) analyze the key contributing factors and regulatory pathways that contribute to grain yield formation under deep storage irrigation; (3) identify the optimal threshold of deep storage irrigation in different precipitation type years.

2. Materials and Methods

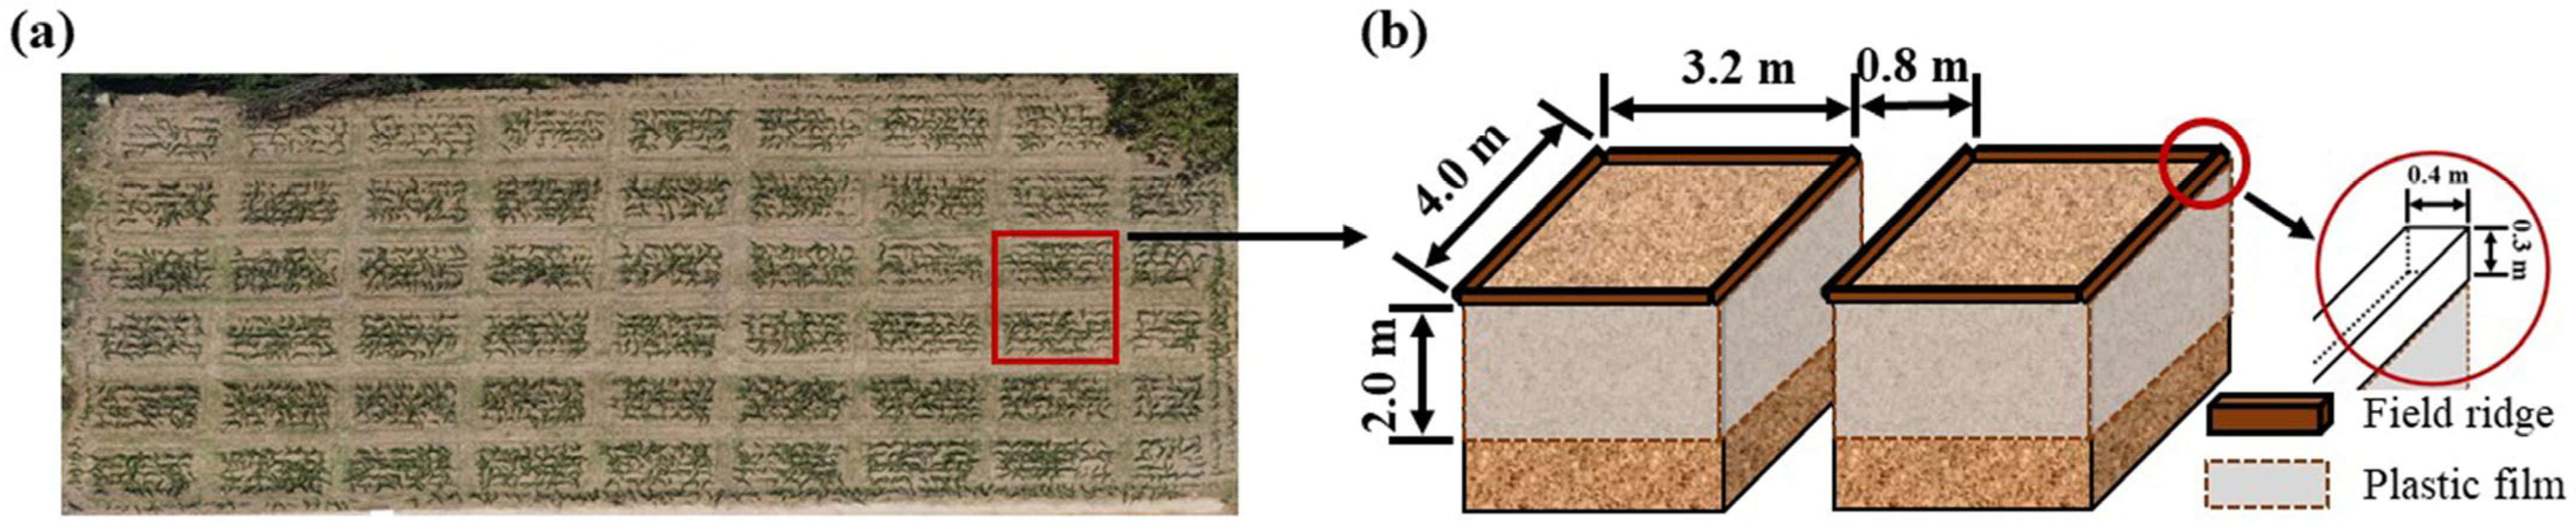
2.1. Experimental Site Description

Winter wheat experiments were conducted on 16 October 2020–10 June 2021, 18 October 2021–12 June 2022, and 16 October 2022–9 June 2023 at the Water Conservation Irrigation Experiment Station of Key Laboratory of Agricultural Soil and Water Engineering in Dry Areas of the Ministry of Education (108°24′ E, 34°20′ N, 521 m a.s.l.) in the Guanzhong Plain in Northwest China (Figure 1). The Guanzhong Plain was selected as the study region; it covers an area of 55,000 km2 and consists of five cities and one agricultural demonstration district. The trial area is a typically warm temperature monsoon semi-humid climate zone, with the annual mean temperature, precipitation (1984–2023), as well as potential evaporation of 12.9 °C, 558.7 mm and 1500 mm, respectively. The mean temperature, precipitation, and reference crop evapotranspiration were 10.3 °C, 282.5 mm, and 544.0 mm in 2020–2021, 10.2 °C, 191.0 mm, and 557.6 mm in 2021–2022, and 9.9 °C, 308.4 mm, and 538.9 mm in 2022–2023, respectively (Figure 2). The study site is characterized by a silty clay loam soil texture based on the US Department of Agriculture’s Soil Taxonomy, with a soil bulk density of 1.35 g cm−3 and a saturated water content of 0.43 cm3 cm−3 in the upper 200 cm soil profile. The basic soil features in the 0–100 cm layer were described in Table 1. The soil samples were collected at depth of 0–100 cm with 20 cm increments from each plot by using a hand auger with a diameter of 4.5 cm.

2.2. Experimental Design

This experiment was conducted with XiaoYan (XY22, 1990), a winter wheat variety generally planted in the Guanzhong Plain, with a planting density of 187.5 kg hm−2. The fertilization rates were 200 kg ha−1 N fertilizer (urea, 46% N), 130 kg P2O5 ha−1 diammonium hydrogen phosphate (42% P2O5), and 60 kg K2O ha−1 potassium sulfate (52% K2O), which were all spread as basal fertilizers prior to sowing. The experiments were conducted under no nutrient deficits, and weeds and pests were regularly controlled. The field experiment set up five soil wetting layer depths utilized for deep storage irrigation, which were 0 cm (RF), 120 cm (W1), 140 cm (W2), 160 cm (W3), and 180 cm (W4), respectively. The W1 treatment was regarded as the control treatment (CK). The irrigation amounts were calculated based on the soil water content on the day before deep storage irrigation and different soil wetting layer depths, and the irrigation upper limit was set as saturated water content in this study. Notably, the traditional scientific irrigation pattern takes field capacity as the irrigation upper limit, while deep storage irrigation put forward in the present study regards the saturated water content as the irrigation upper limit. The irrigation amounts calculations and the calculations of the additional irrigation amounts compared with the traditional scientific irrigation patterns are detailed in Section 2.3. The five irrigation treatments represented five soil water status, and the design scheme along with irrigation amounts is displayed in Table 2. A total of 45 experimental plots, each measuring 3.2 m by 4 m, were divided with a randomized block design characterized by nine replications for each treatment. In order to guarantee uniform irrigation, the plots were leveled, and a 0.8 m isolation strip was arranged to reduce mutual interferences between neighboring plots. To prevent lateral water exchange between adjacent plots, each plot was ridged around the ground and plastic film was embedded vertically in the soil between the plots from the ground surface to a depth of 200 cm (Figure 3). According to the analysis of precipitation frequency for this area in the last decade (2009–2021), we decided to utilize the surface water for deep storage irrigation during the jointing stage of winter wheat (peak water demand period, 15 March to 17 March), owing to >30% probability of the rainstorm and flood appearing at jointing stage of wheat plants in the Guanzhong Plain. A low-pressure tube transportation system was installed to carry out the irrigation applications, and the irrigation water was uniformly poured into each plot. To track the amounts of water utilized to each plot, a flow meter was fixed at the hydrant of the system.

2.3. Calculation of Deep Storage Irrigation Amount

The deep storage irrigation amount (W, mm) is calculated according to the gravimetric soil water content on the day before deep storage irrigation (SWC, %) and soil wetting layer depths (SD, mm), and the irrigation upper limit was set as soil saturated water content (θsat, cm3 cm−3). Compared with the traditional scientific irrigation method, the additional irrigation amount of deep storage irrigation (AW, mm) is calculated based on the soil field capacity (FC, cm3 cm−3) and different soil wetting layer depths (SD, mm).
W = (θsat − SWC × BD) × SD
AW = (θsat − FC) × SD
where BD is soil bulk density (g cm−3). As mentioned before, the θsat and BD of this experimental farmland in the upper 200 cm soil profile are 0.43 cm3 cm−3 and 1.35 g cm−3, respectively. The FC in the 0–100 cm soil layer was determined at 20 cm intervals, with values of 0.326, 0.336, 0.344, 0.339, and 0.337 cm3 cm−3 (Table 1). The average FC in the 100–200 cm soil profile is 0.337 cm3 cm−3. This wheat field experiment set up five soil wetting layer depths used for deep storage irrigation, which were 0 cm, 120 cm, 140 cm, 160 cm, and 180 cm, respectively. Hence, the AW corresponding to different soil wetting layer depths are 0 mm, 112.2 mm, 130.8 mm, 149.4 mm, and 168.0 mm.

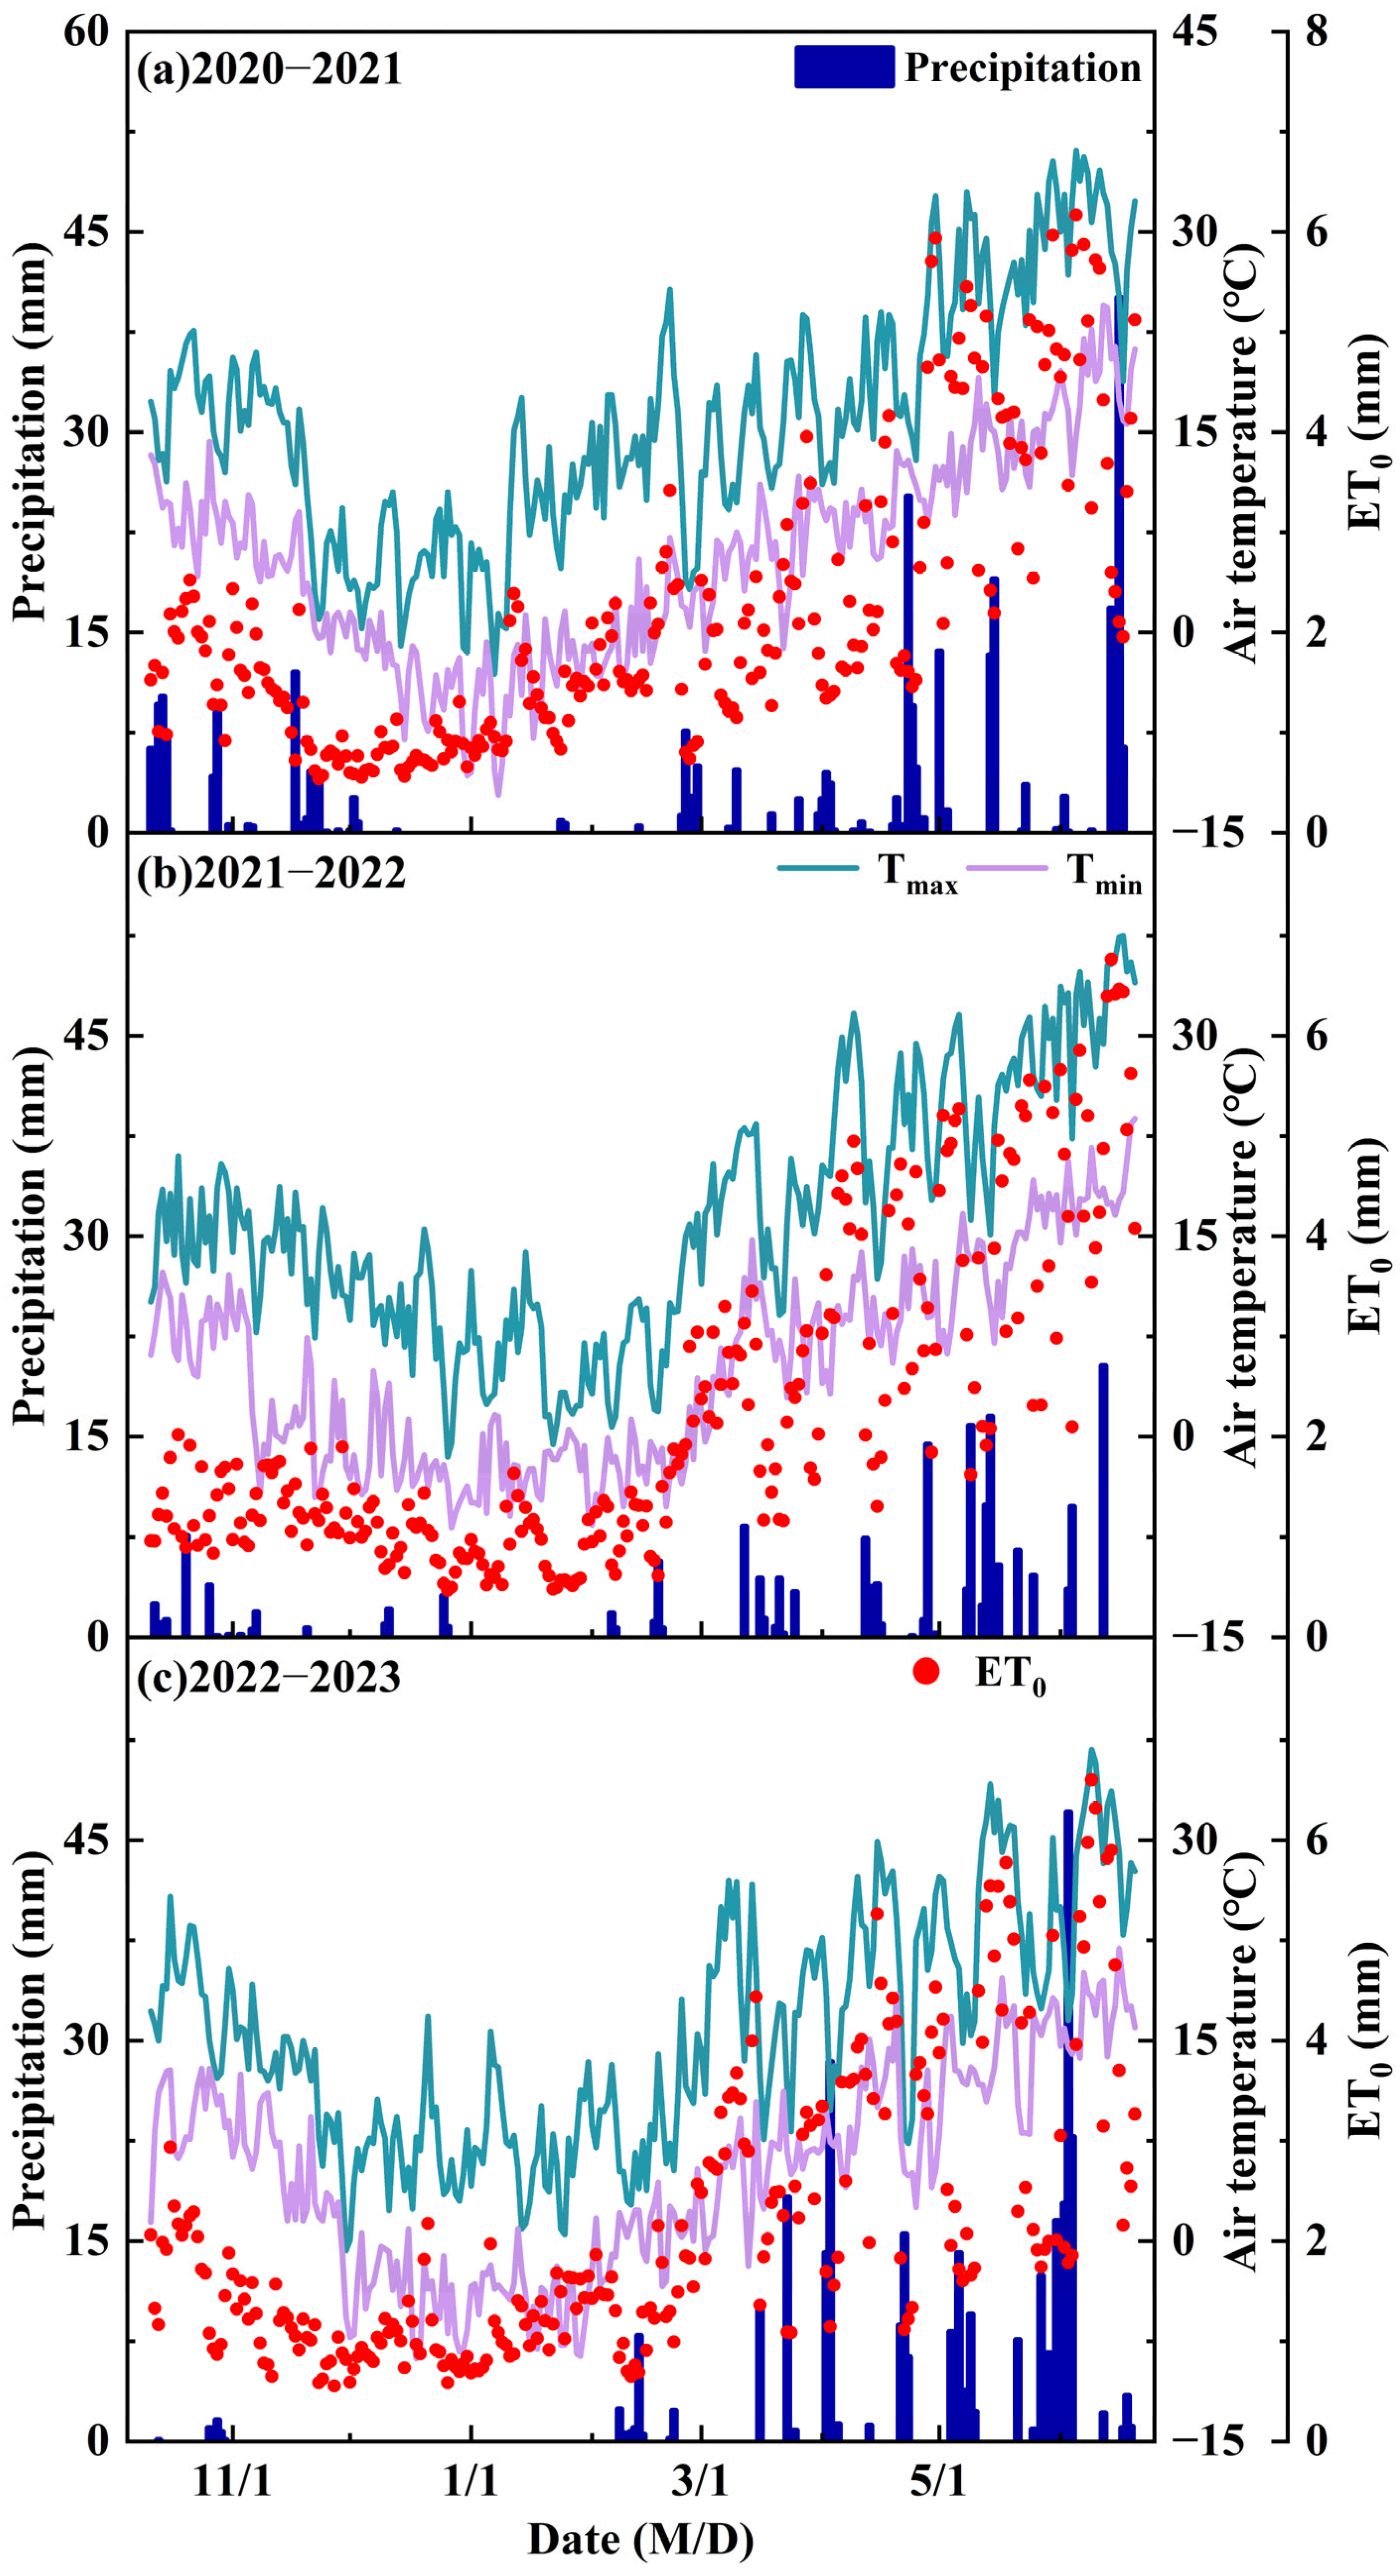
2.4. Division of Precipitation Type Years

Precipitation during each wheat growing season was categorized as wet, normal, or dry to determine the growth and yields responses to different irrigation treatments in different precipitation type years.
Wet season: Pi > P + 0.33σ;
Normal season: P − 0.33σ ≤ Pi ≤ P + 0.33σ;
Dry season: Pi < P − 0.33σ;
where Pi is the precipitation of i season (mm), P is precipitation of average seasons from 1984 to 2023 (mm), and σ is standard deviation of P (mm). The average season precipitation of winter wheat was 221.3 ± 57.1 mm from 1984 to 2023; that is, Pi > 240.1 mm for wet season, Pi < 202.5 mm for dry season, as well as 202.5 ≤ Pi ≤ 240.1 mm for normal season. Si [14] proposed that the basic water requirement of wheat was 428.6 mm. The precipitation over wheat seasons was 282.5 mm, 191.0 mm, and 308.4 mm in 2020–2021, 2021–2022, and 2022–2023, respectively; thus, the wheat seasons during the experiment period were wet, dry, and wet season, respectively. Therefore, in order to fundamentally satisfy the water requirements of winter wheat in dry seasons, it is theoretically necessary to apply irrigation amount with at least 218.64 mm (428.6–202.5 mm). As shown in Table 2, the irrigation amounts for W1 treatment were 218.64 mm, 236.41 mm, and 247.87 mm in the three years, which precisely met the aforementioned water demand requirements. This may be considered as the most important reason for W1 treatment as the control treatment.

2.5. Measurement Methods

Three years of data, from 2021 to 2023, were included in the field measurement data. Data collection is carried out annually in accordance with the wheat phenology in the study area. Table 3 exhibits the measurement times and data for the five important wheat growth phases that were chosen for field measurement and sampling.

2.5.1. Methods of Soil Water Measurement

Manual sampling and gravimetric soil water content (SWC) measurements were carried out for each plot by using the oven-drying method. Using a hand auger, soil samples were taken from topsoil (upper 0–2 m) in 20 cm increments at the center of each plot as the measuring point. The soil samples were weighed, dried at 105 °C for over 24 h, and then weighed again to obtain the SWC. The SWC was measured on the day before deep storage irrigation to calculate the irrigation amount. The formula for calculating SWC is as follows:
SWC (g/g) = (MW − MD)/MD × 100
Here, SWC (g/g) represents the gravimetric SWC per 100 g of dry soil, and MW and MD stand for the mass of the soil sample before and after drying (g), respectively.

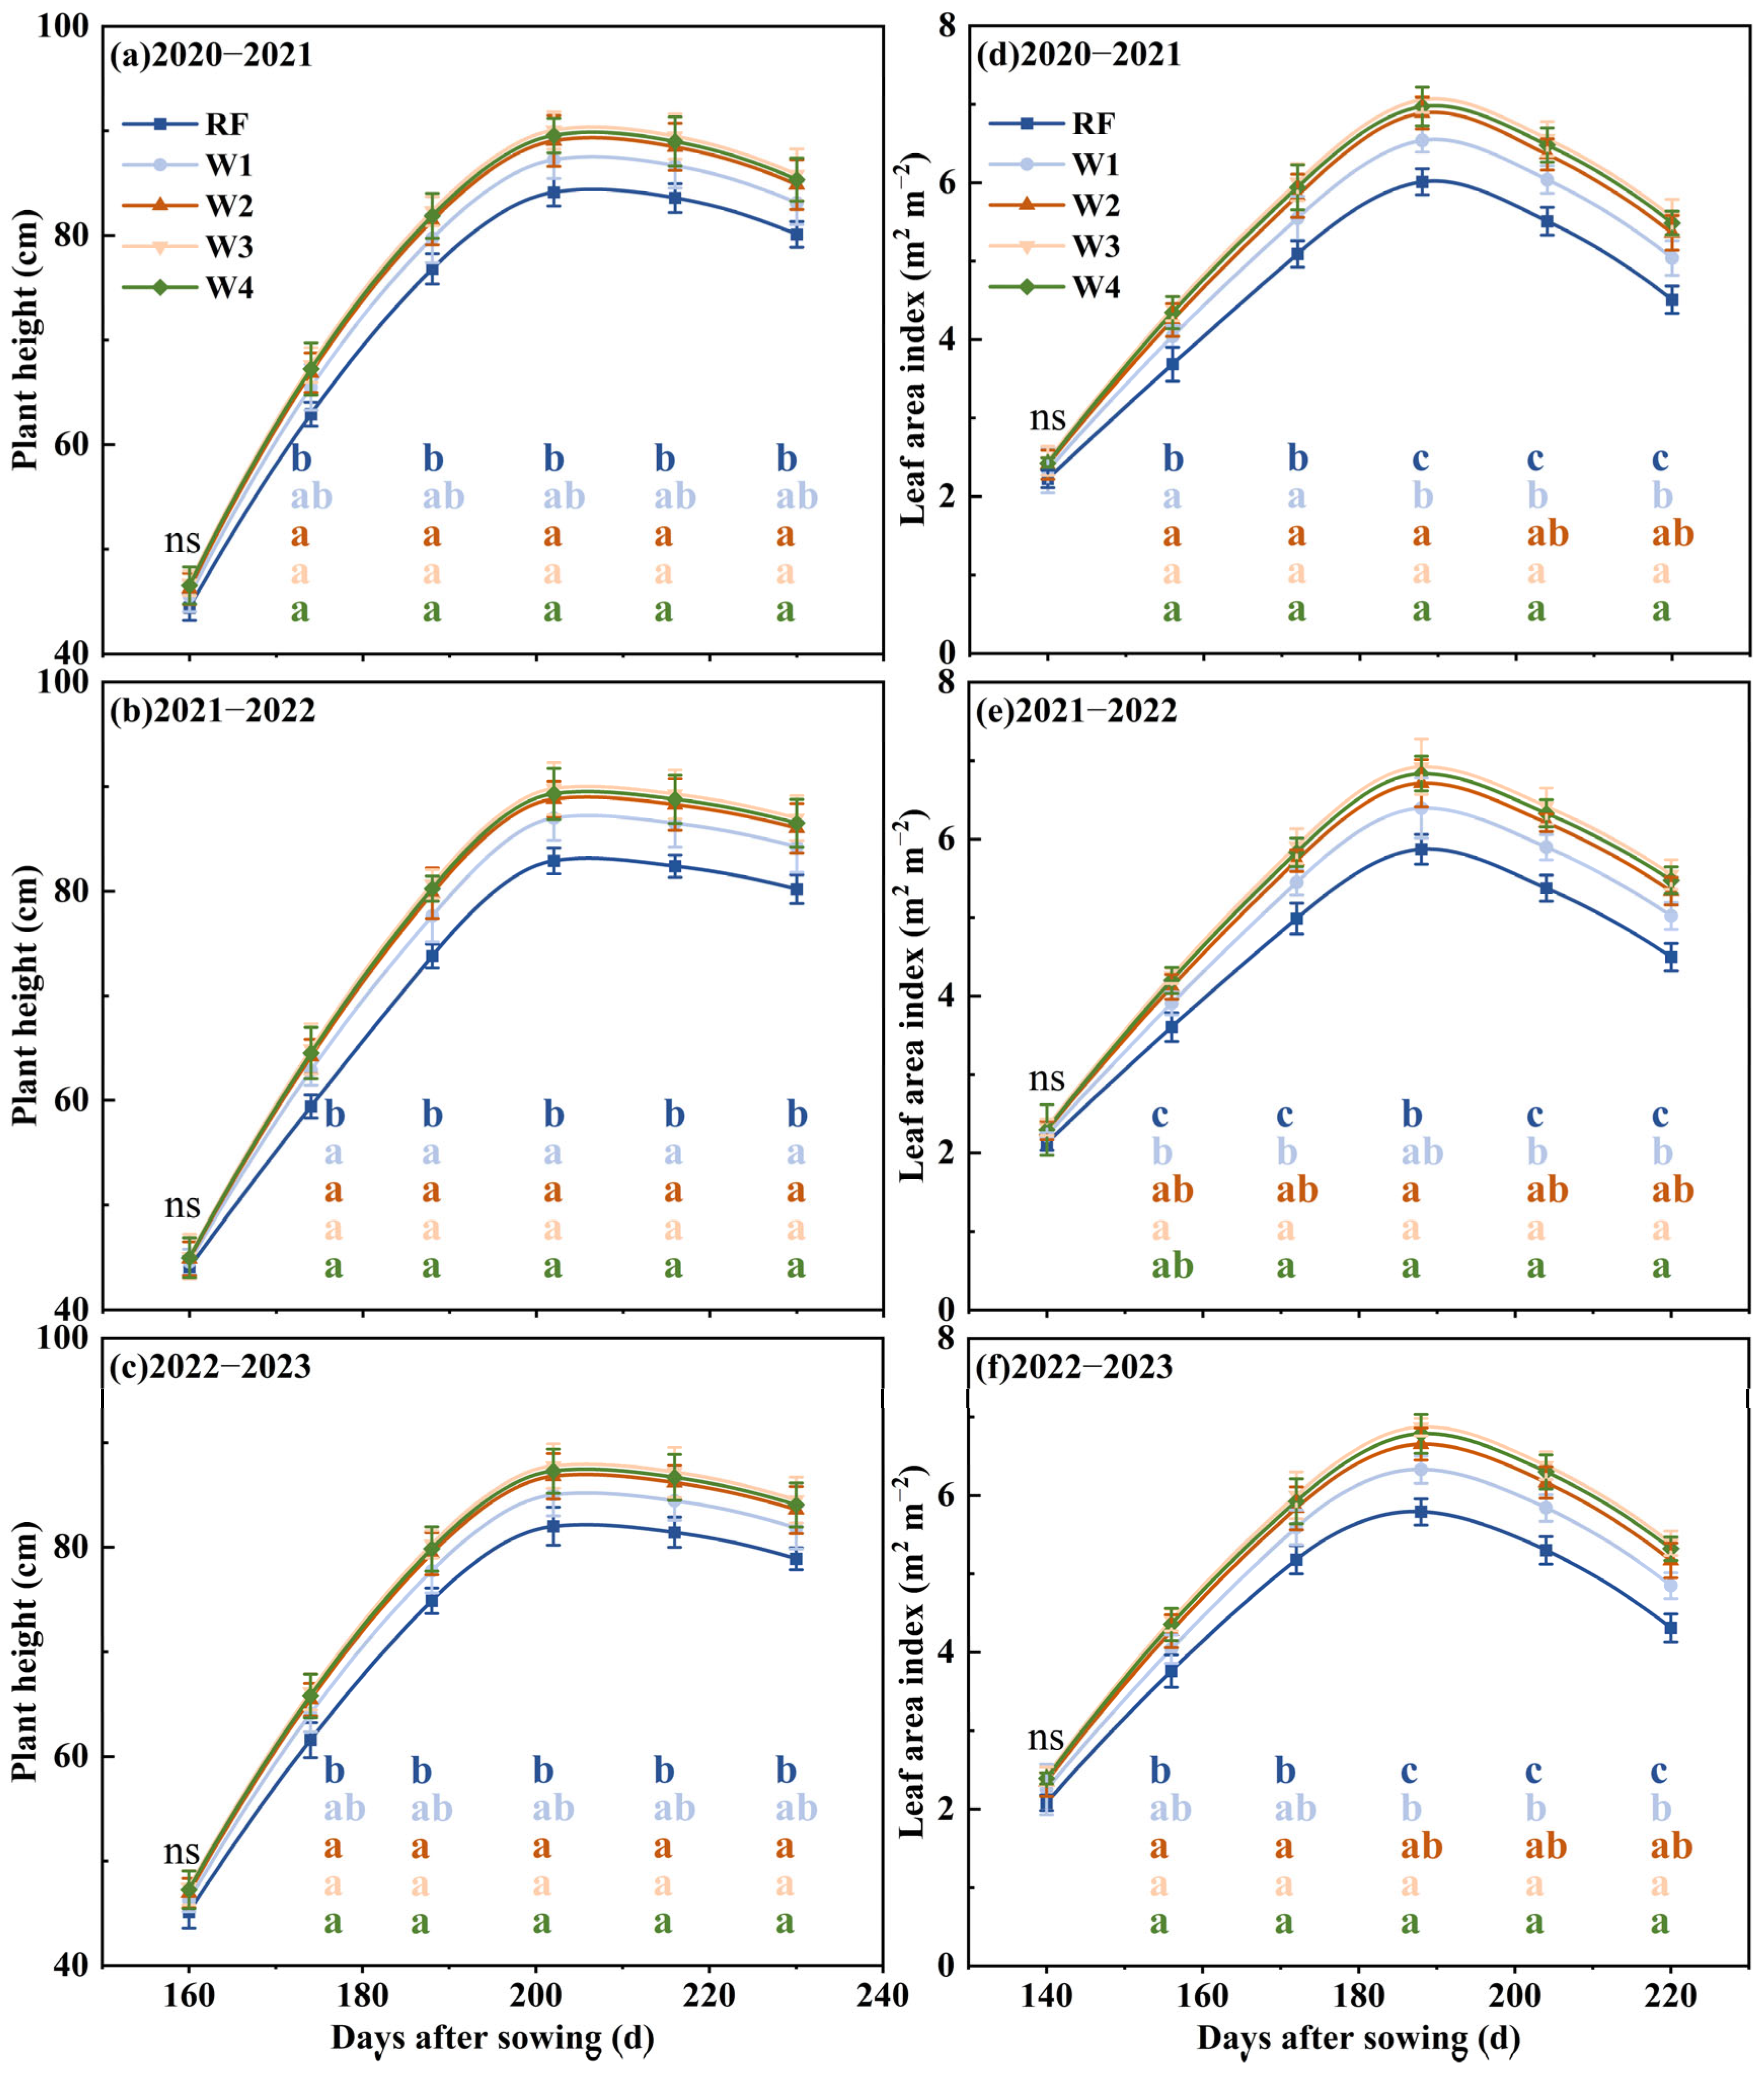
2.5.2. Plant Height and Leaf Area Index

Plant height (PH, cm): Ten central wheat plants from each plot were chosen to measure PH at 14-day intervals from the Zadoks 34 (jointing stage) utilizing a tape measure with a minimum scale of 1 mm. The PH was recorded as the range from the top of the spike (awn excluded) to the soil surface of stem culm.
Leaf area index (LAI): At 16-day intervals from the Zadoks 34, LAI was measured by utilizing the LI-COR LAI-2200 C Plant Canopy Analyzer (Li-COR Inc., Lincoln, NW, USA).

2.5.3. Dry Matter Accumulation

Ten representative wheat plants were selected from each plot for destructive sampling at the Zadoks 34, Zadoks 55 (heading stage), Zadoks 65 (middle anthesis stage), Zadoks 75 (milk stage), and Zadoks 92 (maturity stage). Then, the plants were separated into stems (including sheaths), leaves, and spikes by using scissors. The separated organs were placed in an oven at 105 °C for half an hour for the killing process. These samples were dried to a constant weight at 75 °C and weighed again to determine the dry matter accumulation (DMA) in each part of the wheat plant.

2.5.4. Grain-Filling Process Measurement

The grain-filling process of wheat was recorded from the 5th day after the anthesis day to Zadoks 92. Prior to the Zadoks 60 (initial anthesis stage), a total of 100 spikes with uniform size and growth rate were selected and labeled on wheat plants in each plot for different deep storage irrigation treatments. From Zadoks 60 to Zadoks 92, ten samples were gathered from tagged wheat plants at 6-day intervals. Following threshing the grain, kernels were dried at 105 °C for 30 min and subsequently at 75 °C to constant weight; then, the kernels were weighed, and grain-filling parameters were then computed.
The kernel weight (KW) during the grain-filling stage was the dependent variable, and the number of days after anthesis was the independent variable. The logistic equation was utilized to fit the grain-filling process [51], which can be calculated as follows:
W = A/(1 + Be−Ct)
where W represents the kernel weight, A denotes the final growth mass, B is the primary parameter, C denotes growth rate parameter, and t is the number of days after anthesis (the day of anthesis was set as day 0). The fitting performance is evaluated using the determination coefficient (R2).
Occurrence time of maximal grain-filling rate (Tmax) = lnB/C
Kernel weight increment achieving maximum grain-filling rate (Wmax) = A/2
Maximum grain-filling rate (Gmax) = (C × Wmax) [1 − (Wmax/A)]
Active grain-filling period (AGP) = 6/C
Average grain-filling rate (Gave) = W/41
Here, W is the kernel weight after 41 days of anthesis.
The first derivative of the logistic model was applied to acquire the grain-filling rate (GR) curve. The equation is a continuously varying single-peak curve and is calculated as below:
Y = ABCe−Ct/(1 + Be−Ct)2
In accordance with the shape of logistic curve, the whole grain-filling process was categorized into three stages: gradual increase period (GIP), rapid increase period (RIP), as well as slight increase period (SIP). The average grain-filling rate, increased grain weight, and duration of GIP, RIP, and SIP were designated as G1, W1, T1, G2, W2, T2, G3, W3, and T3, and these parameters were determined according to Wei [51].

2.5.5. Grain Yield and Yield Components

Throughout the winter wheat harvesting period, 3 × 1 m2 of wheat plants were randomly reaped in each plot and then threshed, dried, and weighed to calculate the wheat yield per unit area, which was then converted to the standard grain yield (GY) at a grain moisture content of 13%. Wheat yield components (the number of effective spikes per m2, the number of grains per spike, and 1000-kernel weight) were taken from an area of 1.0 × 1.0 m at three different sites in each plot.

2.6. Statistical Analysis

The data recording and processing were conducted using Microsoft Excel 2016 (Microsoft Corp., Redmond, WA, USA). All data were tested for the normality using Shapiro–Wilk method and the homogeneity of variance using Levene’s method [52]. After transforming and verifying the normality and homoscedasticity, one-way analysis of variance (ANOVA) was performed to test the effects of deep storage irrigation on the PH, LAI, DMA, KW, GY, and yield components followed by the Least Significant Difference (LSD) (p < 0.05). Two-way ANOVA was used to estimate the main and interactive effects of irrigation treatments and years on the GY and yield components. The Pearson correlation method was applied to determine the relationships among PH, LAI, DMA, GY, grain-filling parameters, and yield components. In IBM SPSS AMOS 28.0 software (IBM Corp, Armonk, NY, USA), structural equation modeling (SEM) was adjusted to check the impacts of deep storage irrigation on GY. It is assumed that the effects of the different deep storage irrigation treatments were reflected in grain-filling process, grain yield, and yield components. In addition, the grain-filling parameters directly affect yield components, thereby affecting GY. The maximum likelihood method was employed to acquire the pathway coefficients as standardized regression weights during the process of running SEM. The fit of final SEM was assessed via the following metrics: Root Mean Square Error of Approximation (RMSEA < 0.08), goodness-of-fit index (GFI > 0.9), Comparative Fit Index (CFI > 0.9), and CMIN/DF (discrepancy (Chi-square) divided by degree of freedom < 3). In order to obtain a better model of data fit, the SEM was performed numerous times and was updated by eliminating paths or observed variables with the lowest loading factor in each modulation. The threshold for statistical significance analyses was set at the standard 0.05 level. All statistical analyses were performed with SPSS 26.0 software (IBM Corp, Armonk, NY, USA). Origin 2024 b software (OriginLab Software Inc., Northampton, MA, USA) was utilized to visualize the results.

3. Results

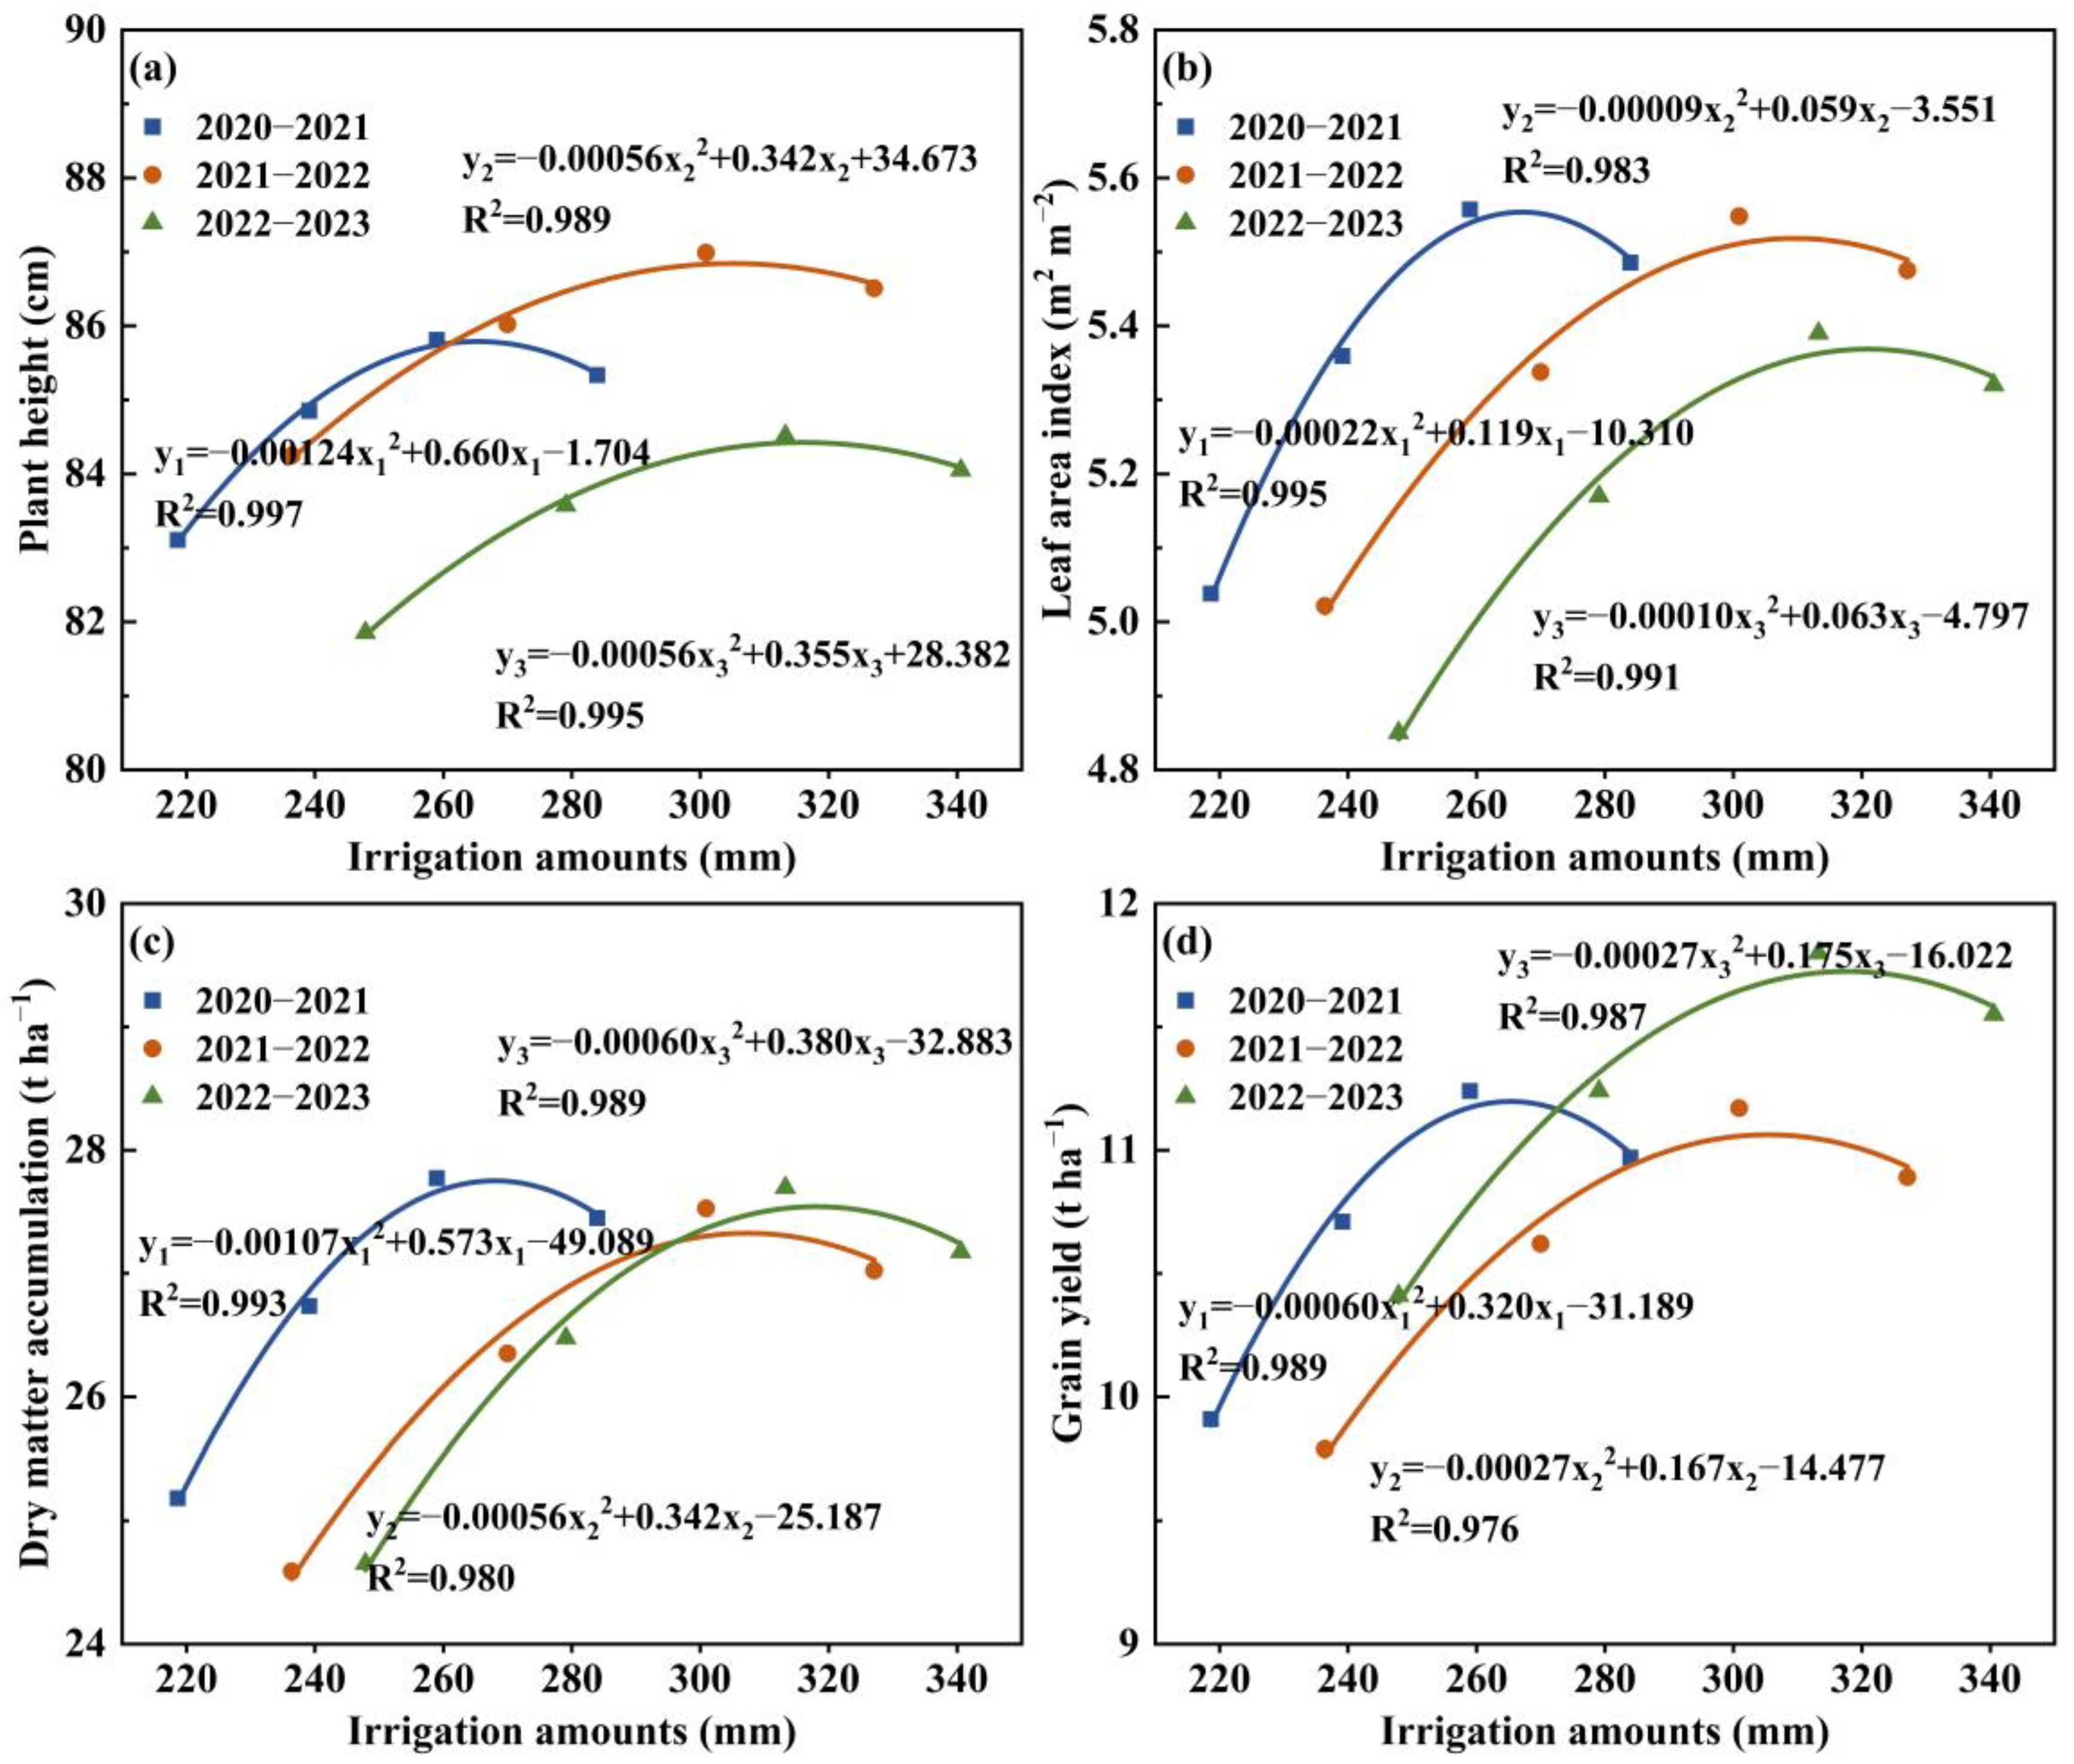
3.1. Plant Height and Leaf Area Index

The PH and LAI presented the same change trend during wheat growing season across the three years (Figure 4). On the whole, PH and LAI first increased and then decreased with time, reaching peak values at 202 and 188 days after sowing, respectively. The differences between PH and LAI among various irrigation treatments gradually intensified over time, and remained largely stable after both achieved the highest values. After deep storage irrigation, both PH and LAI initially increased and then decreased as irrigation amounts increased over the three years, as follows: W3 > W4 > W2 > W1 > RF. Statistical analysis indicated PH and LAI in rainfed condition were significantly lower than that supplied with any irrigation (p < 0.05), whereas no significant differences were observed between the different irrigation treatments (p > 0.05), especially for PH. The W3 treatment throughout exhibited the highest PH and LAI values during the growth process. Compared with the other irrigation treatments, PH and LAI of W3 treatment were increased by 0.56–7.13% and 1.31–23.28% in 2020–2021, by 0.56–8.47% and 1.33–23.43% in 2021–2022, and by 0.56–7.13% and 1.32–25.06% in 2022–2023, respectively, at the Zadoks 92. In relative to W1 (CK), the W2, W3, and W4 treatments displayed increases in PH and LAI of 2.10–3.25% and 6.42–10.64%, respectively, over three-year mean. Additionally, the differences in PH and LAI from the RF to W1 treatment were the largest one, with an average of about 4% and 12% over the three years. The average differences from W1 to W2, W2 to W3, and W3 to W4 were 2.10%, 1.13%, and 0.55% in PH, respectively, as well as 6.42%, 3.97%, and 1.30% in LAI, respectively. Therefore, the differences in PH and LAI between adjacent irrigation treatments presented a gradually decreasing trend with irrigation amounts increasing. Regression analysis between PH/LAI and irrigation amounts presented the stationary point for PH and LAI occurred at W3 treatment (Figure 5a,b).

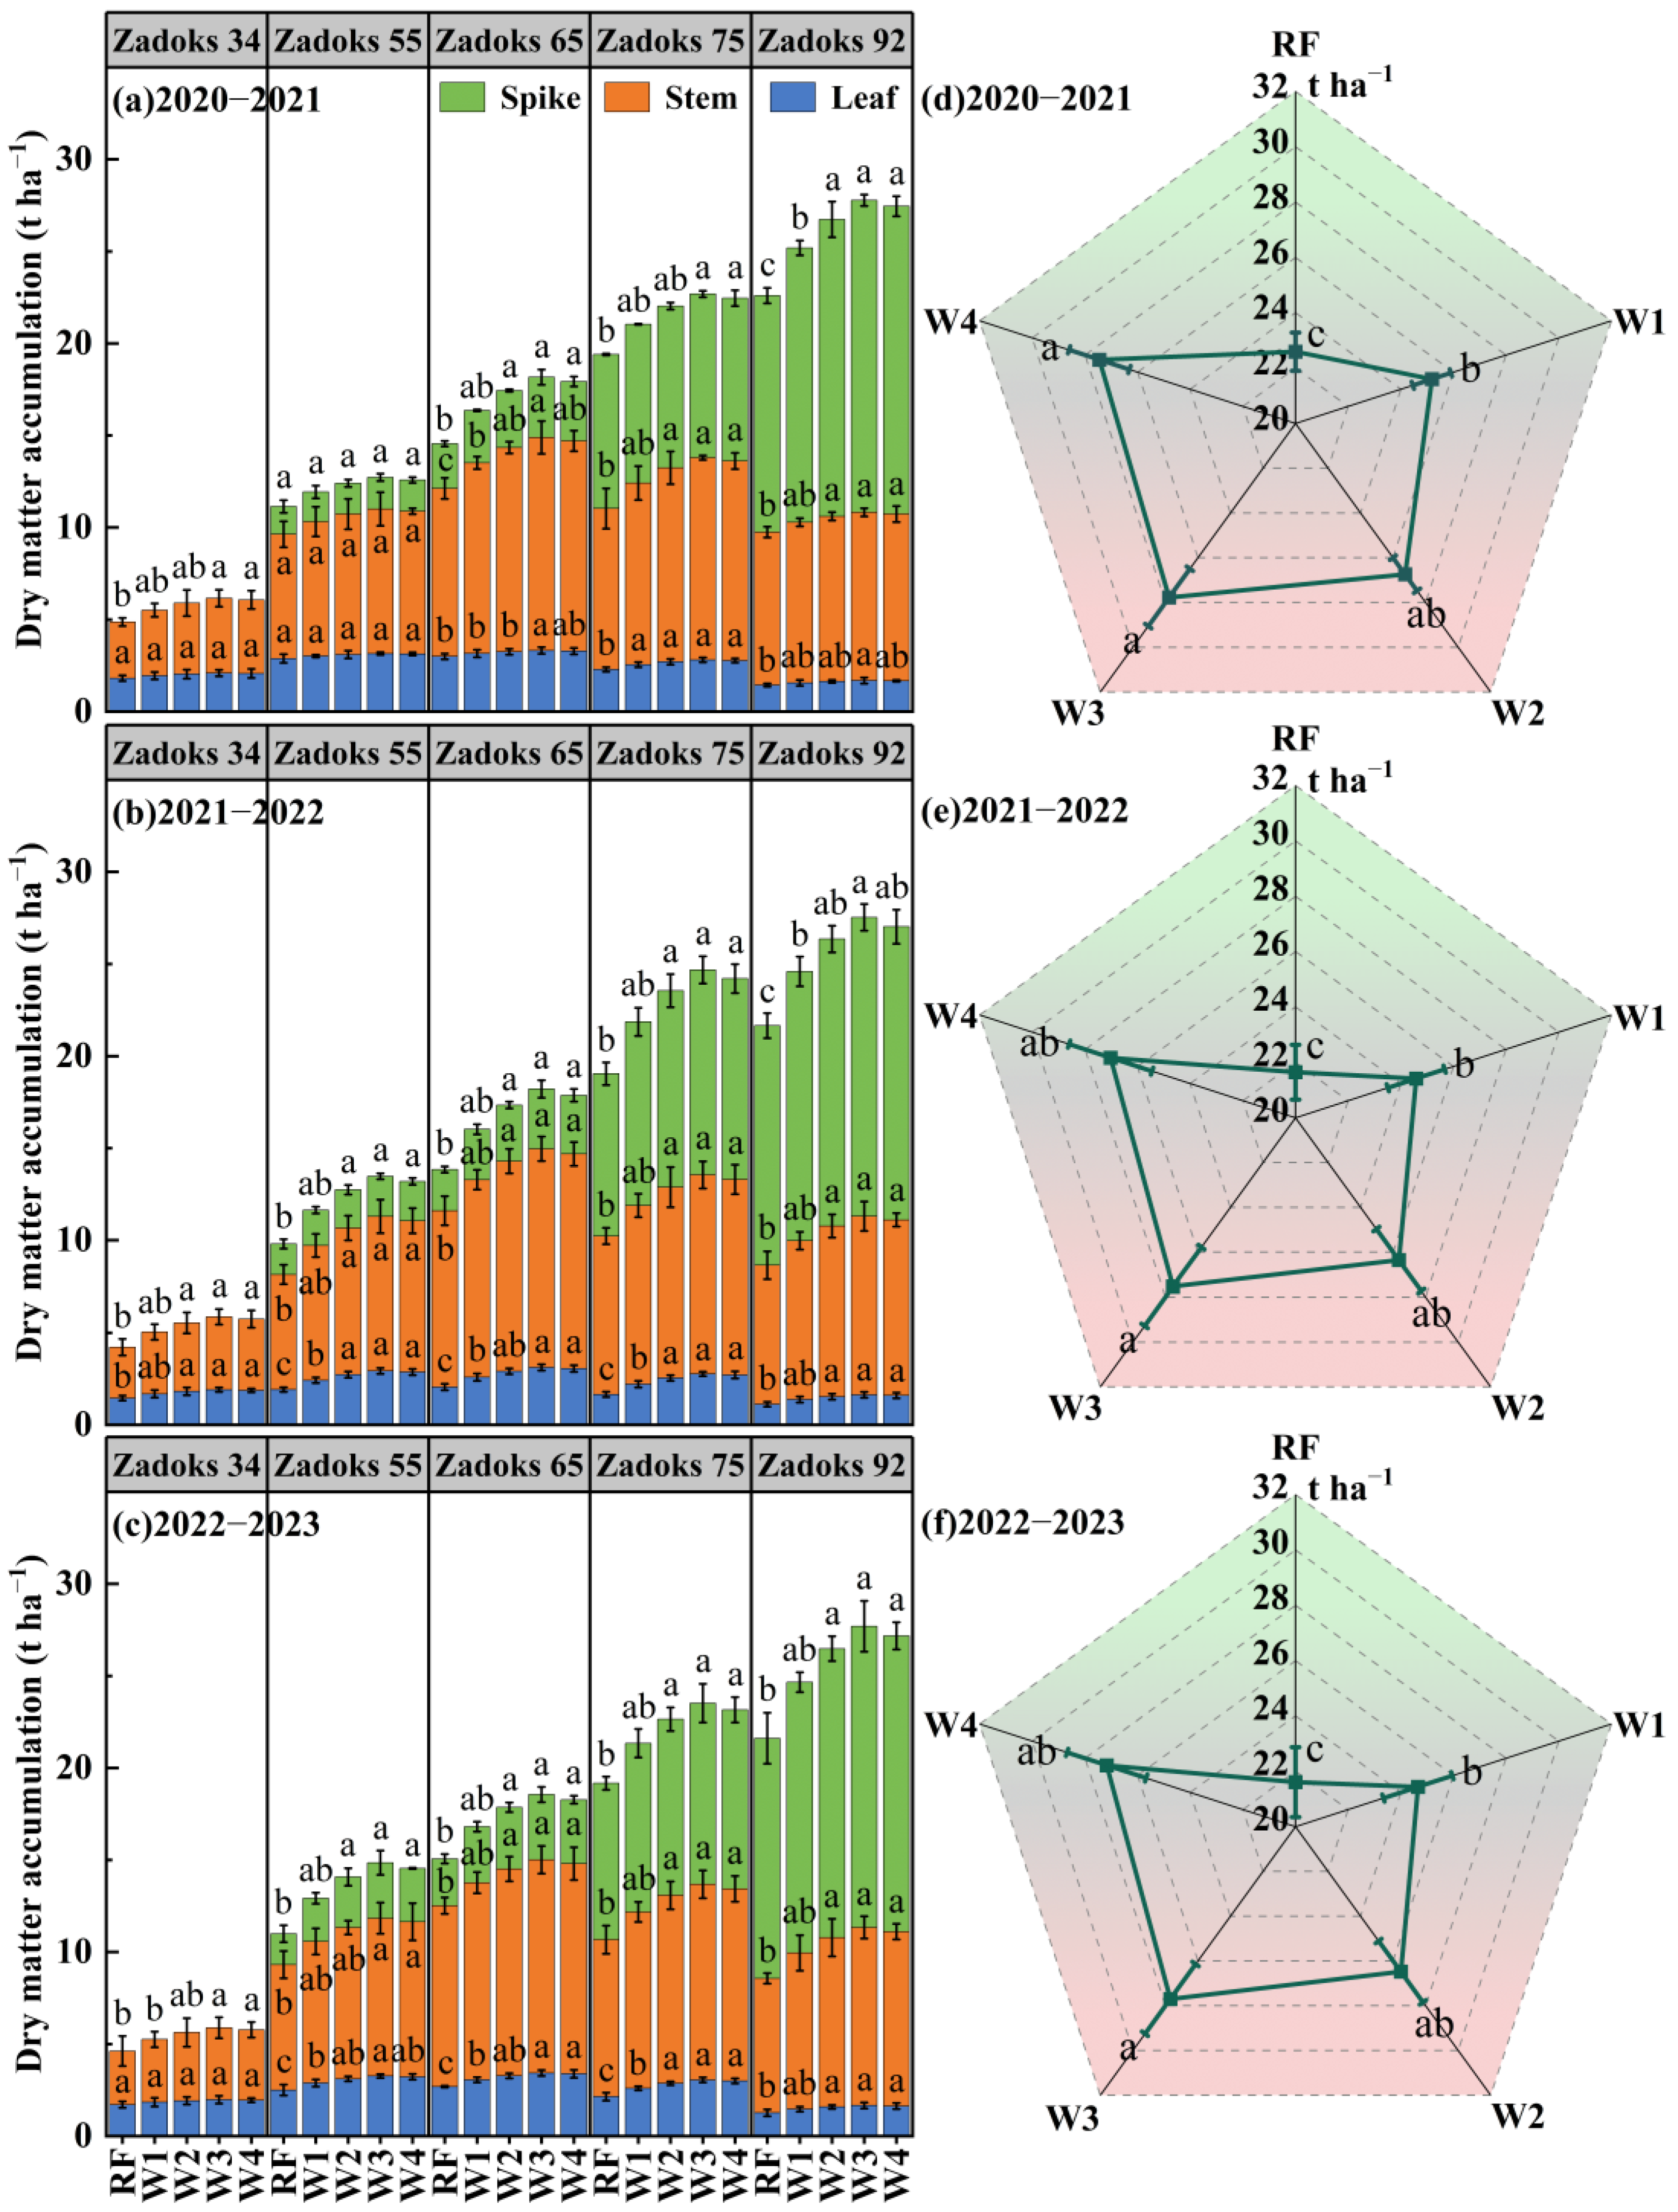
3.2. Dry Matter Accumulation

The DMA of winter wheat followed a similar accumulation pattern with growth process during the three years (Figure 6a–c). Specifically, the stem dry matter accumulation (SDMA) and leaf dry matter accumulation (LDMA) of the vegetative organs showed an increasing trend from Zadoks 34 to Zadoks 65, followed by a decline from Zadoks 65 to Zadoks 92. The spike dry matter accumulation (EDMA, including grain, ear axis, and glume) gradually raised with the growth process after the Zadoks 55, reaching a maximum value at Zadoks 92. On the whole, the total dry matter accumulation (TDMA) under different treatments presented an increasing trend from Zadoks 34 to Zadoks 92. The SDMA, LDMA, EDMA, and TDMA exhibited an increasing trend followed by a slight decrease in response to intensifying irrigation amounts, which were in the order of W3 > W4 > W2 > W1 > RF. The pattern was consistent over the three years. Specifically, the TDMA of the W3 treatment was significantly higher than that of the RF and W1 treatments (p < 0.05), whereas not significantly different from the W2 and W4 treatments (p > 0.05). The TDMA of the W3 treatment achieved its maximum at the Zadoks 92 (2020–2021: 27.77 t ha−1, 2021–2022: 27.53 t ha−1, and 2022–2023: 27.70 t ha−1), increasing by 1.18–22.92%, 1.87–27.15%, and 1.92–28.16%, respectively, compared to the other irrigation treatments (Figure 6d–f). In contrast, the lowest TDMA among different treatments was observed in the RF treatment, showing values of 22.60 t ha−1, 21.65 t ha−1, 21.61 t ha−1 during three years, respectively. Furthermore, the TDMA of W2, W3, and W4 treatments exhibited increases of 6.17–10.28% in 2020–2021, 7.17–11.95% in 2021–2022, and 7.41–12.34%, respectively, compared to the W1 (CK). Likewise, the differences for SDMA, LDMA, EDMA, and TDMA between the adjacent irrigation treatments tended to decrease gradually as irrigation amounts increased. Taking the TDMA at the Zadoks 92 as an example, the average differences in TDMA between adjacent irrigation treatments were 13.04%, 6.92%, 4.01%, and 1.60%, respectively, with increasing irrigation amounts over the three years. Moreover, the responses of the TDMA of winter wheat to the total irrigation amounts conformed to quadratic curves with an opening downward, from which it is evident that the occurrence of stationary point at W3 treatment contributed to obtaining the maximum TDMA (Figure 5c).

3.3. Grain-Filling Characteristics

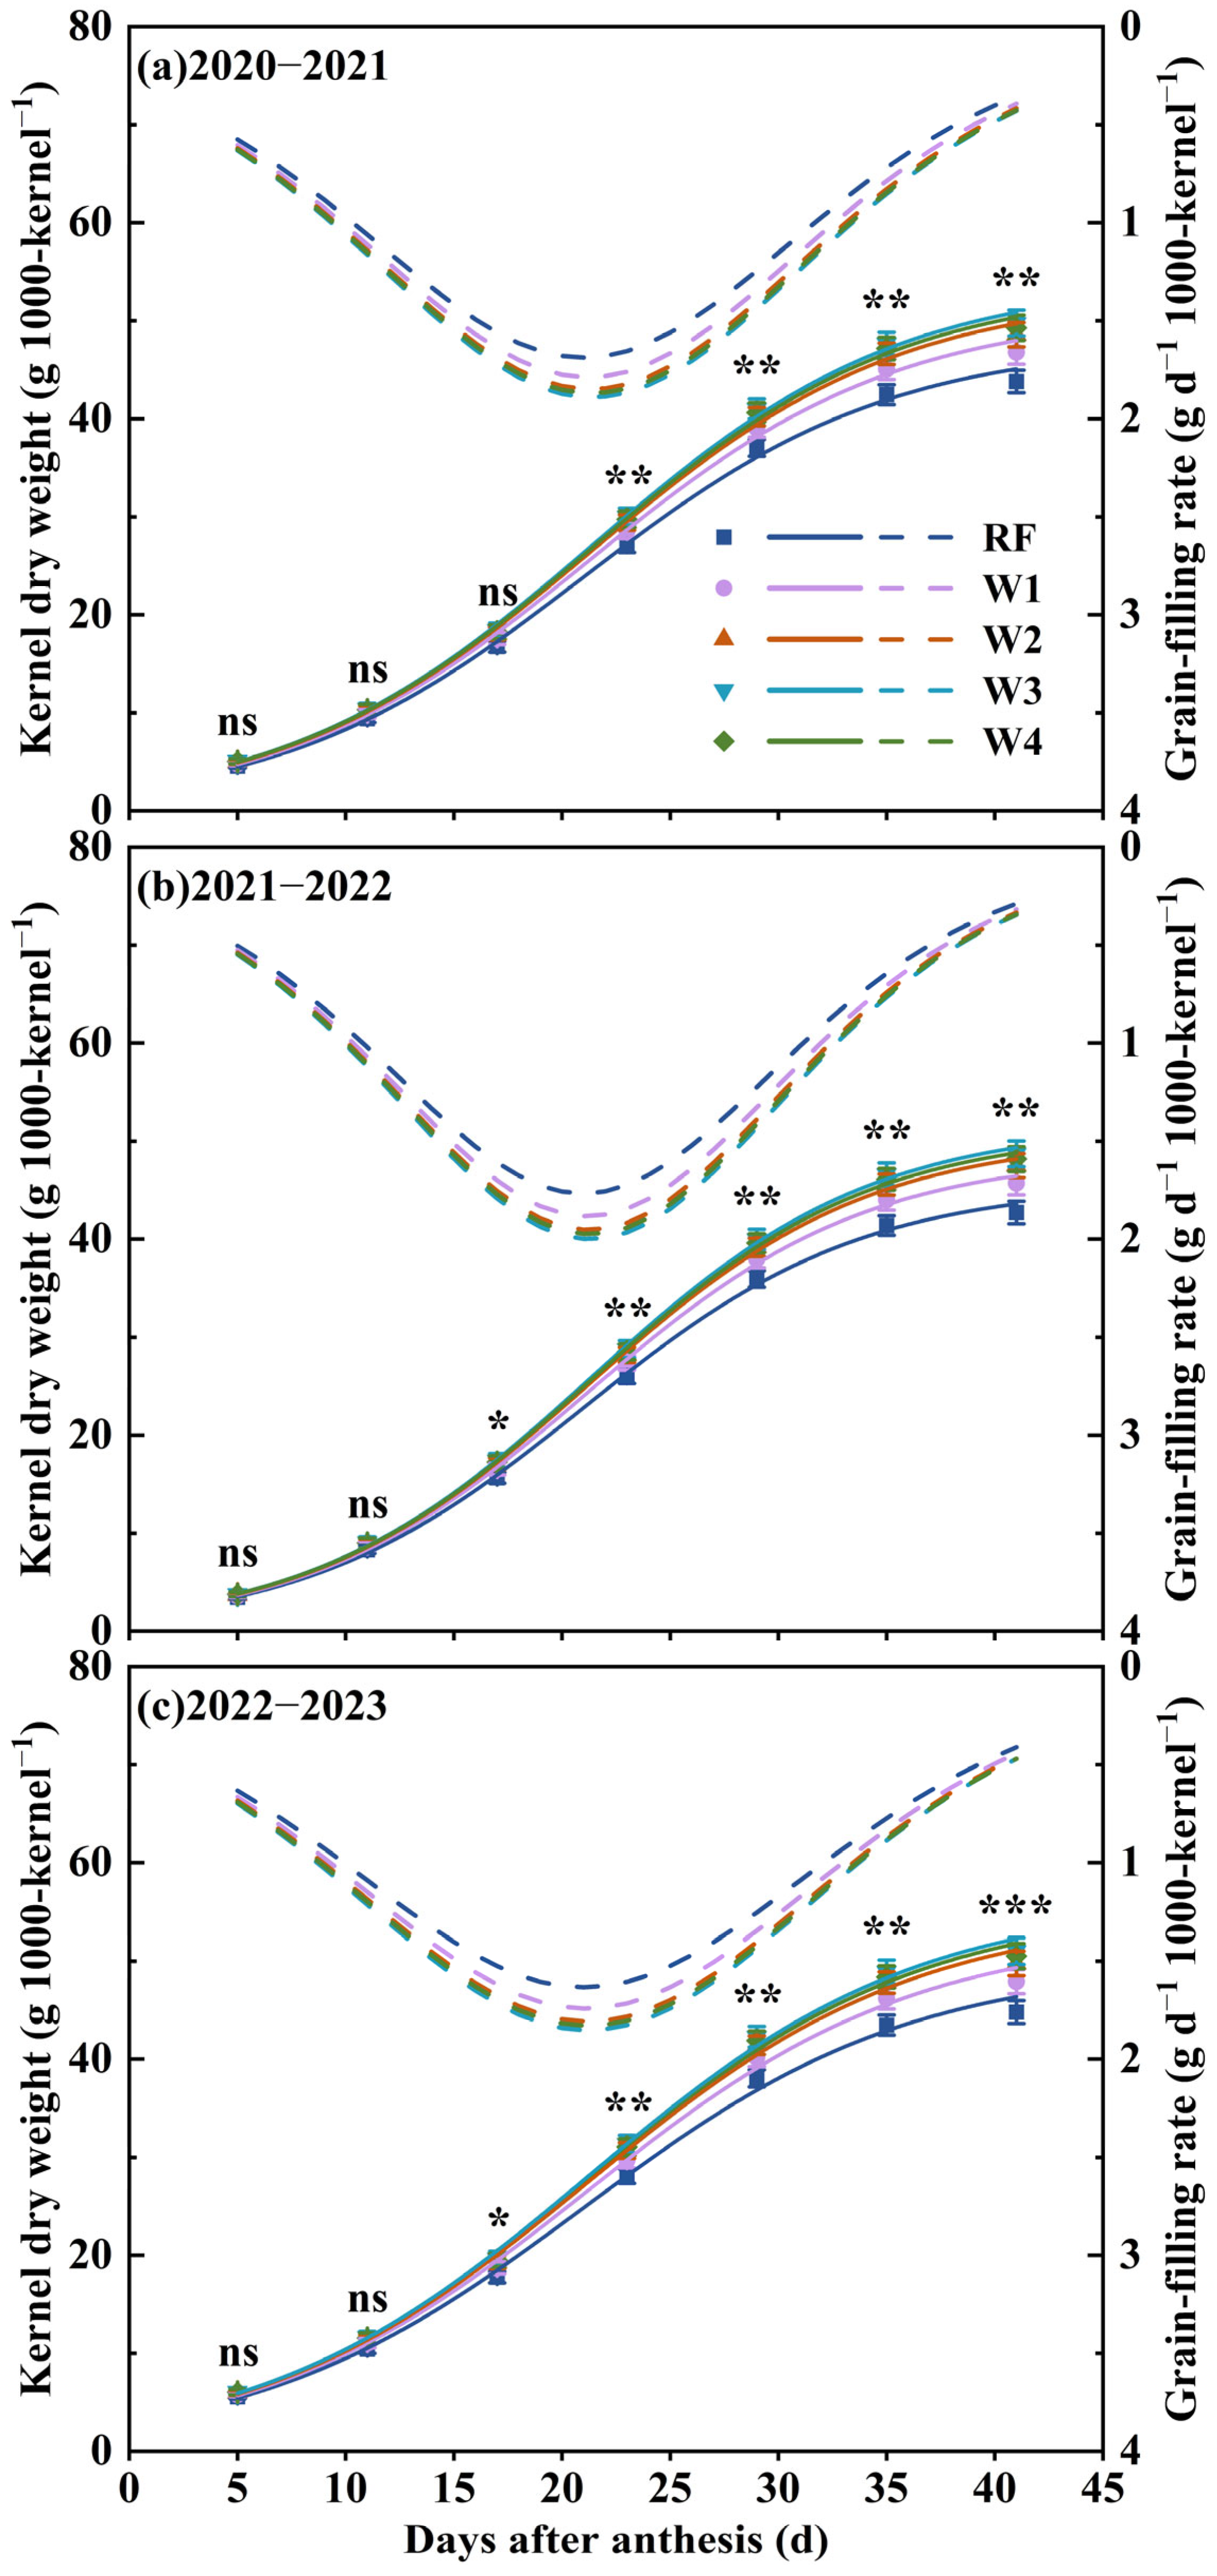
3.3.1. Dynamic Changes of Grain Dry Matter Accumulation and Grain-Filling Rate

The grain-filling process of winter wheat was modeled through fitting the logistic equation and computing the grain-filling rate (Figure 7a–c). The decision coefficients (R2) of the fitted equations under different irrigation treatments were all over 0.99, suggesting a reasonable fit by the logistic equation (Table 4). The KW of all irrigation treatments followed a slow–fast–slow trend, similar to an “S” shaped growth curve, achieving the peak values between 35 and 41 days after anthesis across the three years (Figure 7a–c). Correspondingly, the GR presented a unimodal curve during the grain-filling process (Figure 7a–c), with the maximum values appearing between 20.97 and 21.38 days after anthesis (Table 4). The differences in KW between the different irrigation treatments continued to intensify with the grain-filling process progressing and reached the highest values at the late stage of grain filling, but showed an increasing trend followed by a slight decline for GR, with the peak values achieved at the occurrence time of maximal grain-filling rate. The KW and GR exhibited a trend of initially increasing and subsequently slightly reducing as irrigation input increased during the grain-filling process during the three years, ranking from the highest to lowest as W3 > W4 > W2 > W1 > RF. The maximum KW and GR were observed in the W3 treatment, with the three-year average values of 49.82 g and 1.91 g 1000-grains−1 d−1. Compared with the other treatments, the KW and GR of W3 treatment increased by 1.02–13.82% and 1.20–12.83%, respectively, over three-year mean. Furthermore, the differences in KW and GR between adjacent irrigation treatments generally followed a similar trend with total performances of PH, LAI, and DMA, which displayed a tendency to decrease as irrigation amounts increased for the three years (Figure 7a–c).

3.3.2. Grain-Filling Characteristic Parameters

The patterns of maximum grain weight (parameter A) and the velocity of grain weight accumulation (parameter B and C) varied as irrigation amounts increased, which initially increased and subsequently slightly decreased (Table 4). However, the growth rate parameter (parameter C) showed a gradual decrease in 2020–2021 and 2021–2022. The different grain-filling parameters presented varying responses to deep storage irrigation amounts throughout the three years. Wmax, Gmax, and Gave displayed a tendency to initially increase followed by a slight decline with irrigation amounts increasing, whereas Tmax and AGP exhibited a tendency to gradually increase, except for AGP in 2022–2023. Concretely, W3 treatment had higher Wmax, Gmax, and Gave in each year, while W4 treatment showed higher Tmax and AGP compared to the other irrigation treatments. Averaged over the different years, the Wmax, Gmax, and Gave in W3 were 13.24%, 12.84%, and 12.36% higher than those in RF, respectively, and 0.96%, 1.20%, and 1.11% greater than those under W4 treatment, respectively. The averaged Tmax and AGP of W4 treatment were 1.46% and 1.02% higher than those of RF treatment, respectively, but essentially had no differences relative to W3 treatment. The differences in Wmax, Gmax, and Gave between adjacent irrigation treatment exhibited a progressively declining trend with an increase in irrigation amounts. Overall, W3 treatment had general advantages in improving KW and GR during the grain-filling process over the three years.

3.3.3. Stage Characteristic Analysis of Grain-Filling Process

There are differences in the duration of different phases (GIP, RIP, and SIP) during the grain-filling process for various irrigation treatment (Table 5). The duration of GIP (T1) experienced an increase followed by a slight decline with the increase in irrigation amounts over the three years, while the duration of RIP and SIP (T2 and T3) showed a slightly prolonged trend with irrigation amounts increasing, excluding T2 and T3 in 2022–2023. However, basically no differences were observed between W3 and W4 treatments for T2 and T3 in 2020–2021 and 2021–2022. Moreover, the increased grain weight (W1, W2, and W3) and mean grain-filling rate (G1, G2, and G3) during GIP, RIP, and SIP exhibited a tendency to initially increase followed by a slight decrease with an increase in irrigation amounts, which displayed consistent trends across all three years with the order of W3 > W4 > W2 > W1 > RF. In conclusion, the advantage was more pronounced in W3 treatment than the other irrigation treatments for the grain-filling process.

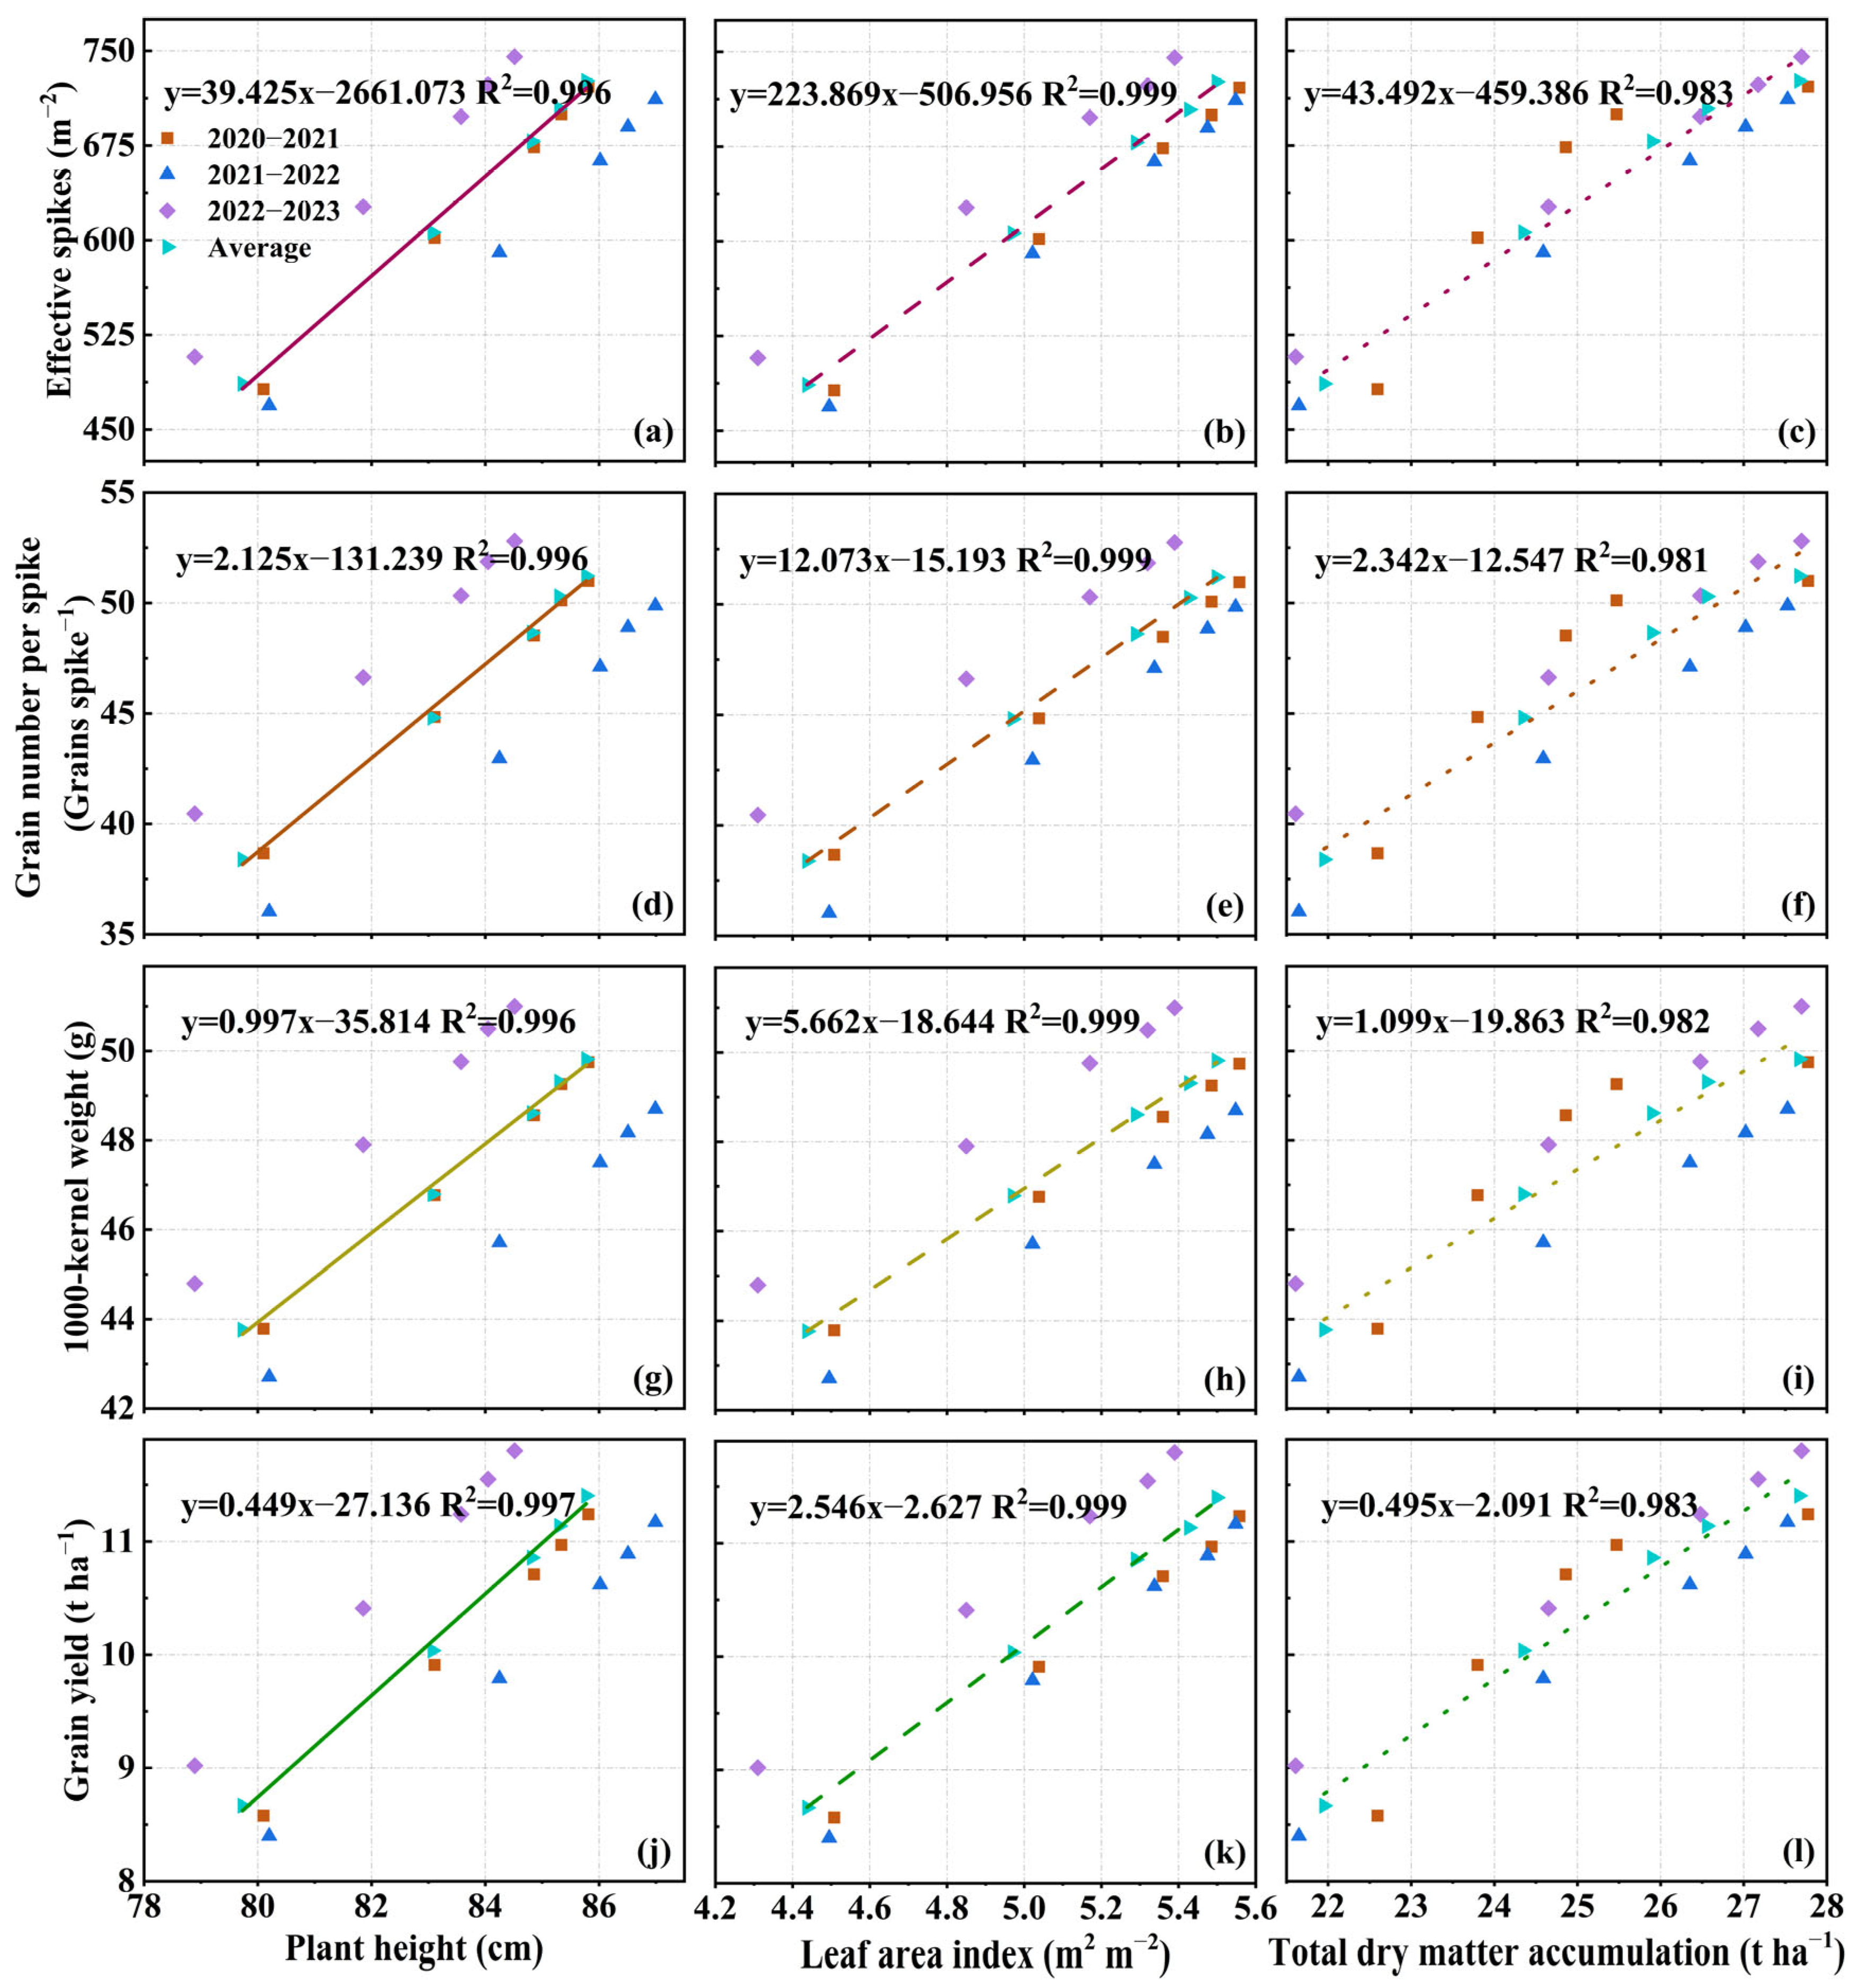
3.4. Grain Yield and Yield Components

Deep storage irrigation exerted statistically significant influences on grain yield and yield components of winter wheat over the three years in this study (p < 0.001; Table 6). The effective spikes (ES), grain number per spike (GS), 1000-kernel weight (TKW), and grain yield (GY) all exhibited a first increasing and subsequently decreasing trend with irrigation amounts increasing, with values exhibiting the following trend across treatments for the three years (descending order): W3 > W4 > W2 > W1 > RF. The statistical analysis presented that the least average annual ES, GS, TKW, and GY of 486.22 m−2, 38.39 grains spike−1, 43.77 g, and 8.67 t ha−1 occurred in rainfed conditions. The W3 treatment displayed the maximal annual average ES, GS, TKW, and GY of 726.23 m−2, 51.23 grains spike−1, 49.82 g, and 11.40 t ha−1, closely followed by W4 treatment of 704.23 m−2, 50.29 grains spike−1, 49.31 g, and 11.14 t ha−1, which were significantly higher than the other irrigation treatments (p < 0.05). Thus, the annual average ES, GS, TKW, and GY was increased by 3.12–49.36%, 1.86–33.45%, 1.03–13.82%, as well as 2.39–31.58% in W3 treatment compared with the other irrigation treatments. Meanwhile, no significant differences were observed between W3 and W4 treatment for GS, TKW, and GY (p > 0.05), while a significant reduction in ES was observed under W4 treatment relative to W3 treatment in any year (p < 0.05). Compared with W1 (CK), the ES, GS, TKW, and GY from W2 to W4 treatments increased significantly by 11.89–19.81%, 8.61–14.36%, 3.88–6.46%, and 8.17–13.62% over three years, respectively. The differences in ES, GS, TKW, and GY between adjacent irrigation treatments showed a consistent pattern with the differences of growth indicators and grain-filling parameters, which displayed a gradually downward trend as irrigation amounts increased. According to the three-year average, the GY values ranged from 8.67 t ha−1 to 11.40 t ha−1, with the differences between the adjacent irrigation treatments of 1.37 t ha−1, 0.82 t ha−1, 0.55 t ha−1, and 0.27 t ha−1, respectively, with a gradual increase in irrigation amounts. In addition, it was found that there was a quadratic curve relationship between GY and irrigation amounts, experiencing a trend of first increasing and then decreasing as irrigation amounts increased, and thus, there exists an irrigation threshold point. As can be seen from Figure 5d, the stationary point of GY also occurred at the W3 treatment. That is, the GY would actually decline with the irrigation amount attaining a certain level. Additionally, the ES, GS, TKW, and GY were insignificantly influenced by experimental year and two-factor interactions (p > 0.05), except for the effect of experimental year on TKW (p < 0.05).

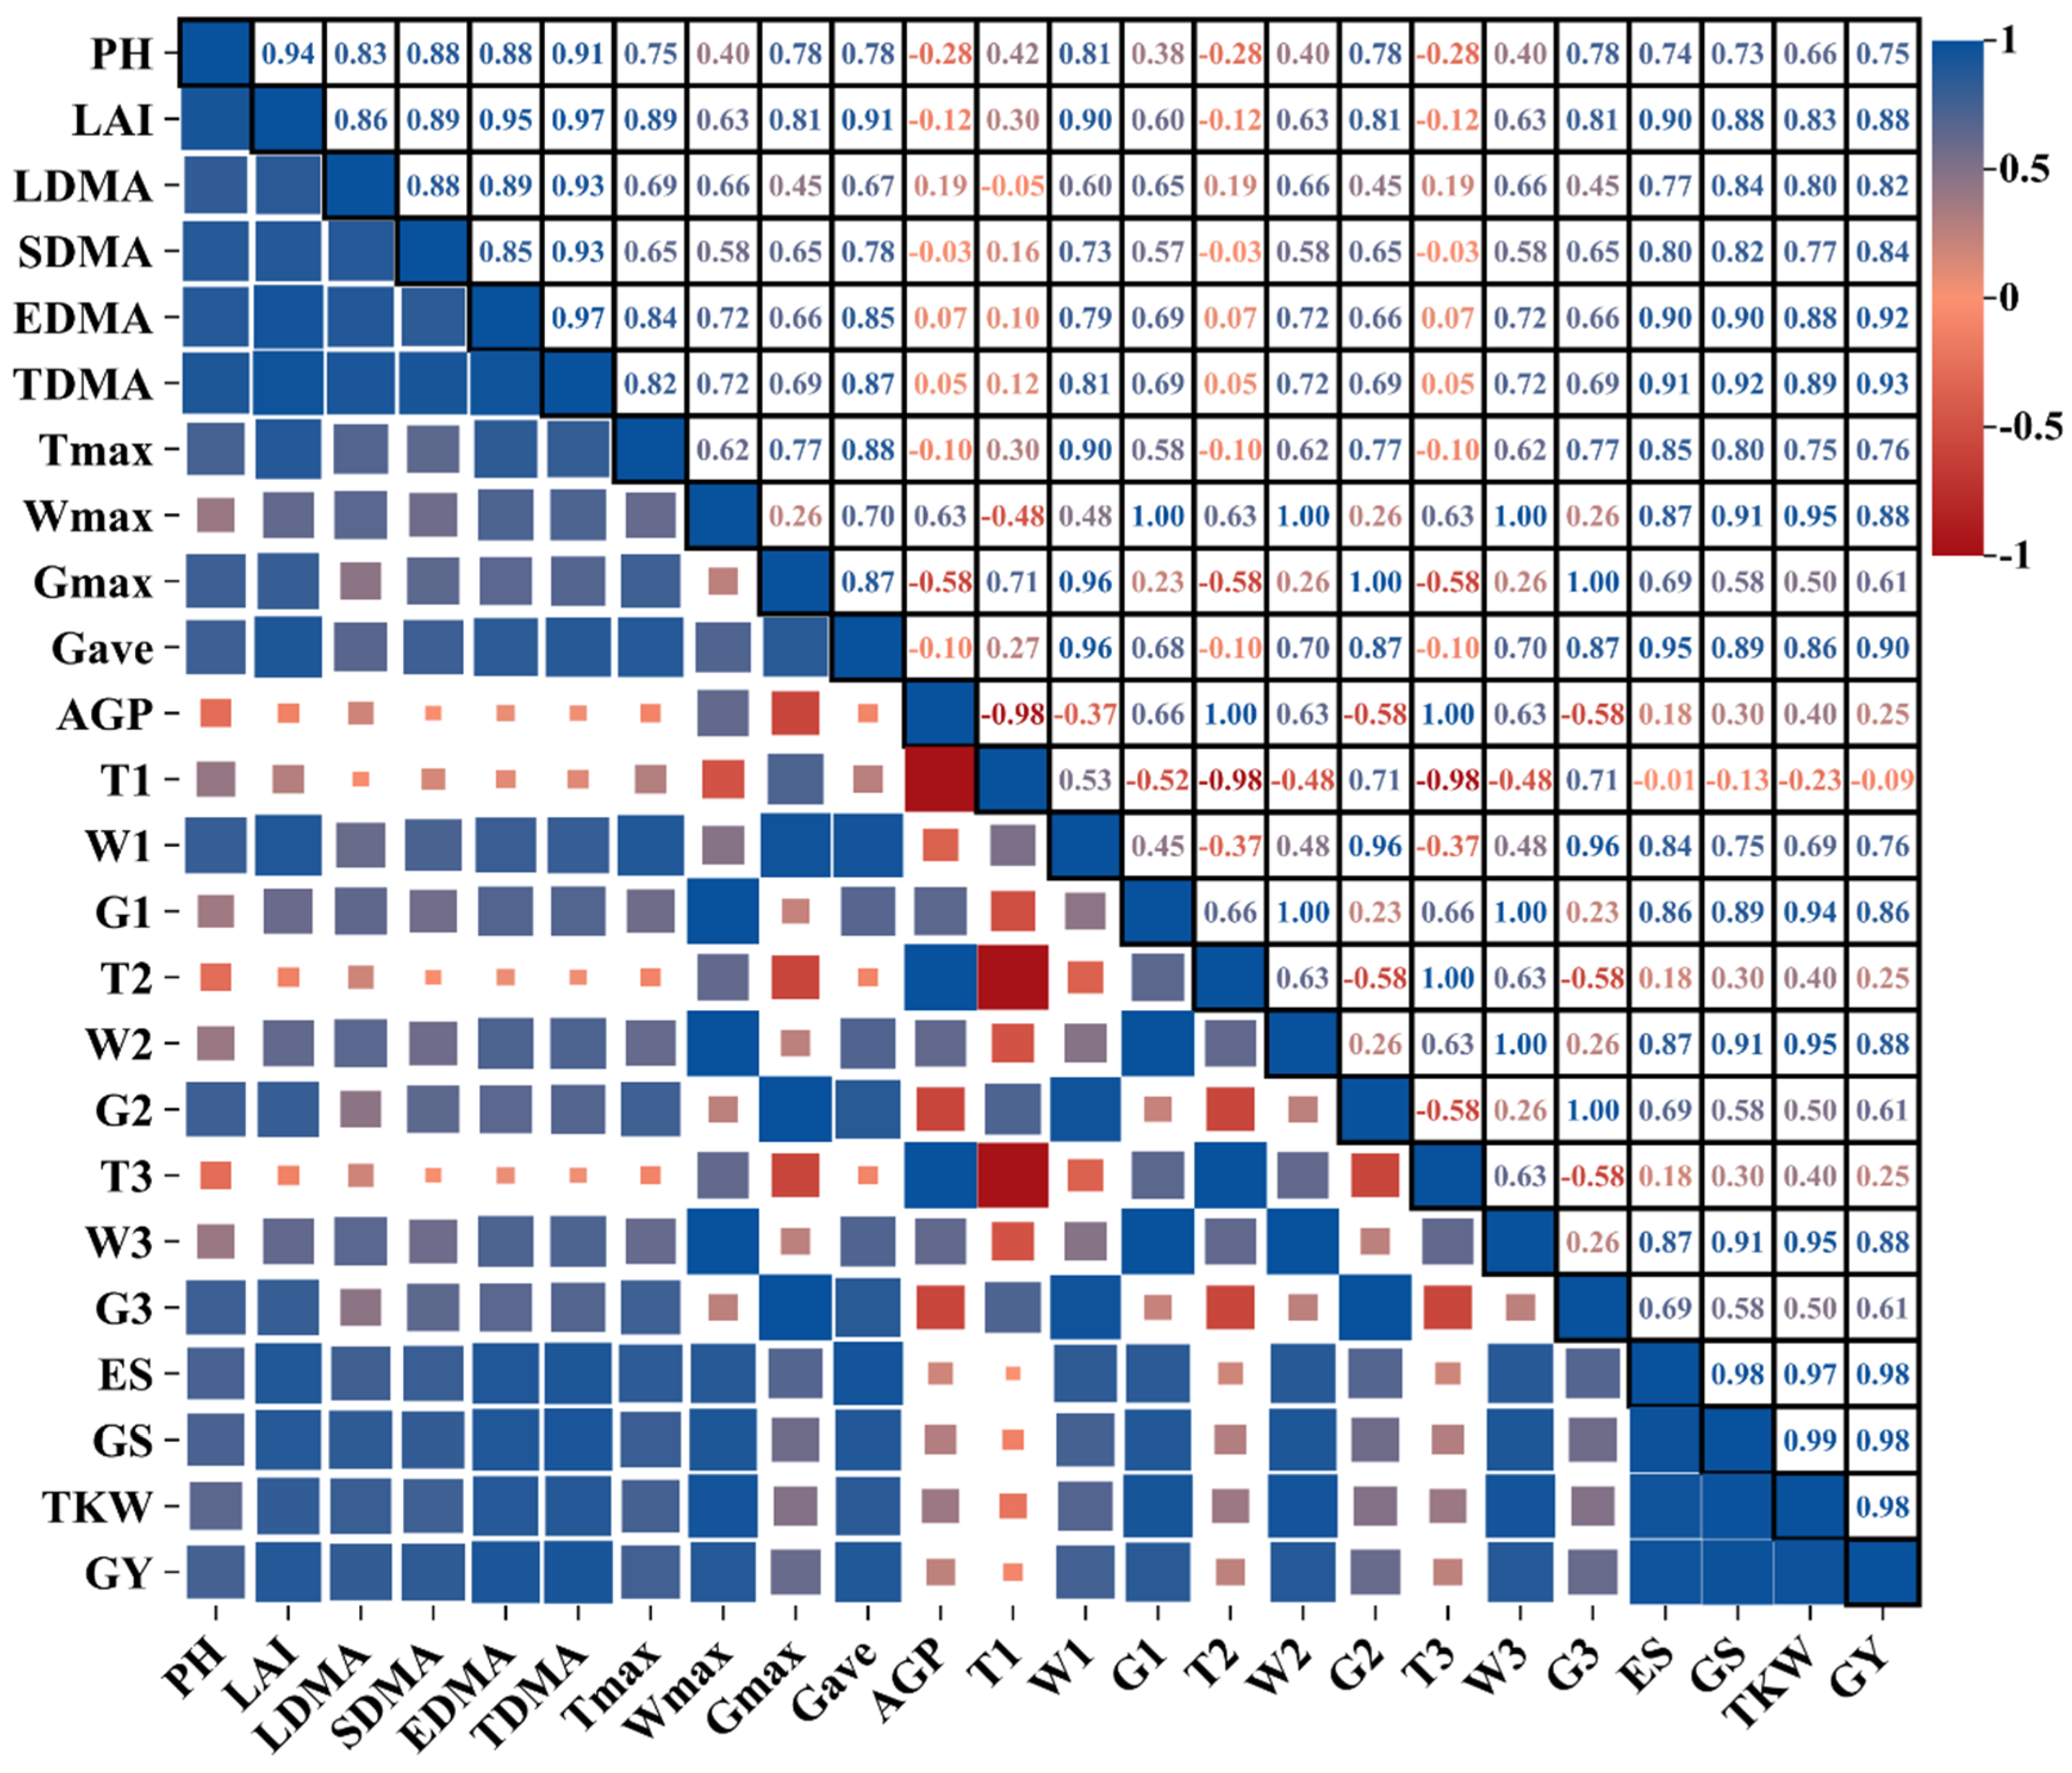
3.5. Correlation Analysis

The correlations between the growth indicators (PH and LAI), the biomass characteristics indicators (LDMA, SDMA, EDMA, and TDMA), the grain-filling parameters (Tmax, Wmax, Gmax, Gave, AGP, T, W, and G), grain yield, and yield components (ES, GS, TKW, and GY) throughout the three growing seasons were determined by Pearson correlation analysis (Figure 8). It is worth noting that these indicators were all significantly positively correlated with each other (p < 0.05), excluding grain-filling parameters. For the subfactor indicators within grain-filling parameters, AGP, T2, and T3 showed significant negative correlations with Gmax, T1, W1, G2, and G3 (p < 0.05). Likewise, T1 was extremely negatively correlated with Wmax, G1, W2, and W3 (p < 0.001). However, the subfactors in the grain-filling parameters primarily exhibited a significant positive correlation with each other, except for the negative correlations mentioned above. In addition, the pronounced positive connections were identified between grain-filling parameters and grain yield and yield components (ES, GS, TKW, and GY). Interestingly, a significant linear positive correlation was also observed between the growth indicators (PH, LAI, and TDMA) and ES, GS, TKW, and GY, respectively (Figure 9, R2 > 0.9). Therefore, the ES, GS, TKW, and GY initially all increased as the growth indicators improved, while ultimately declining as the growth indicators decreased. This tendency is ascribed to the facilitation of wheat growth by increasing irrigation amounts.

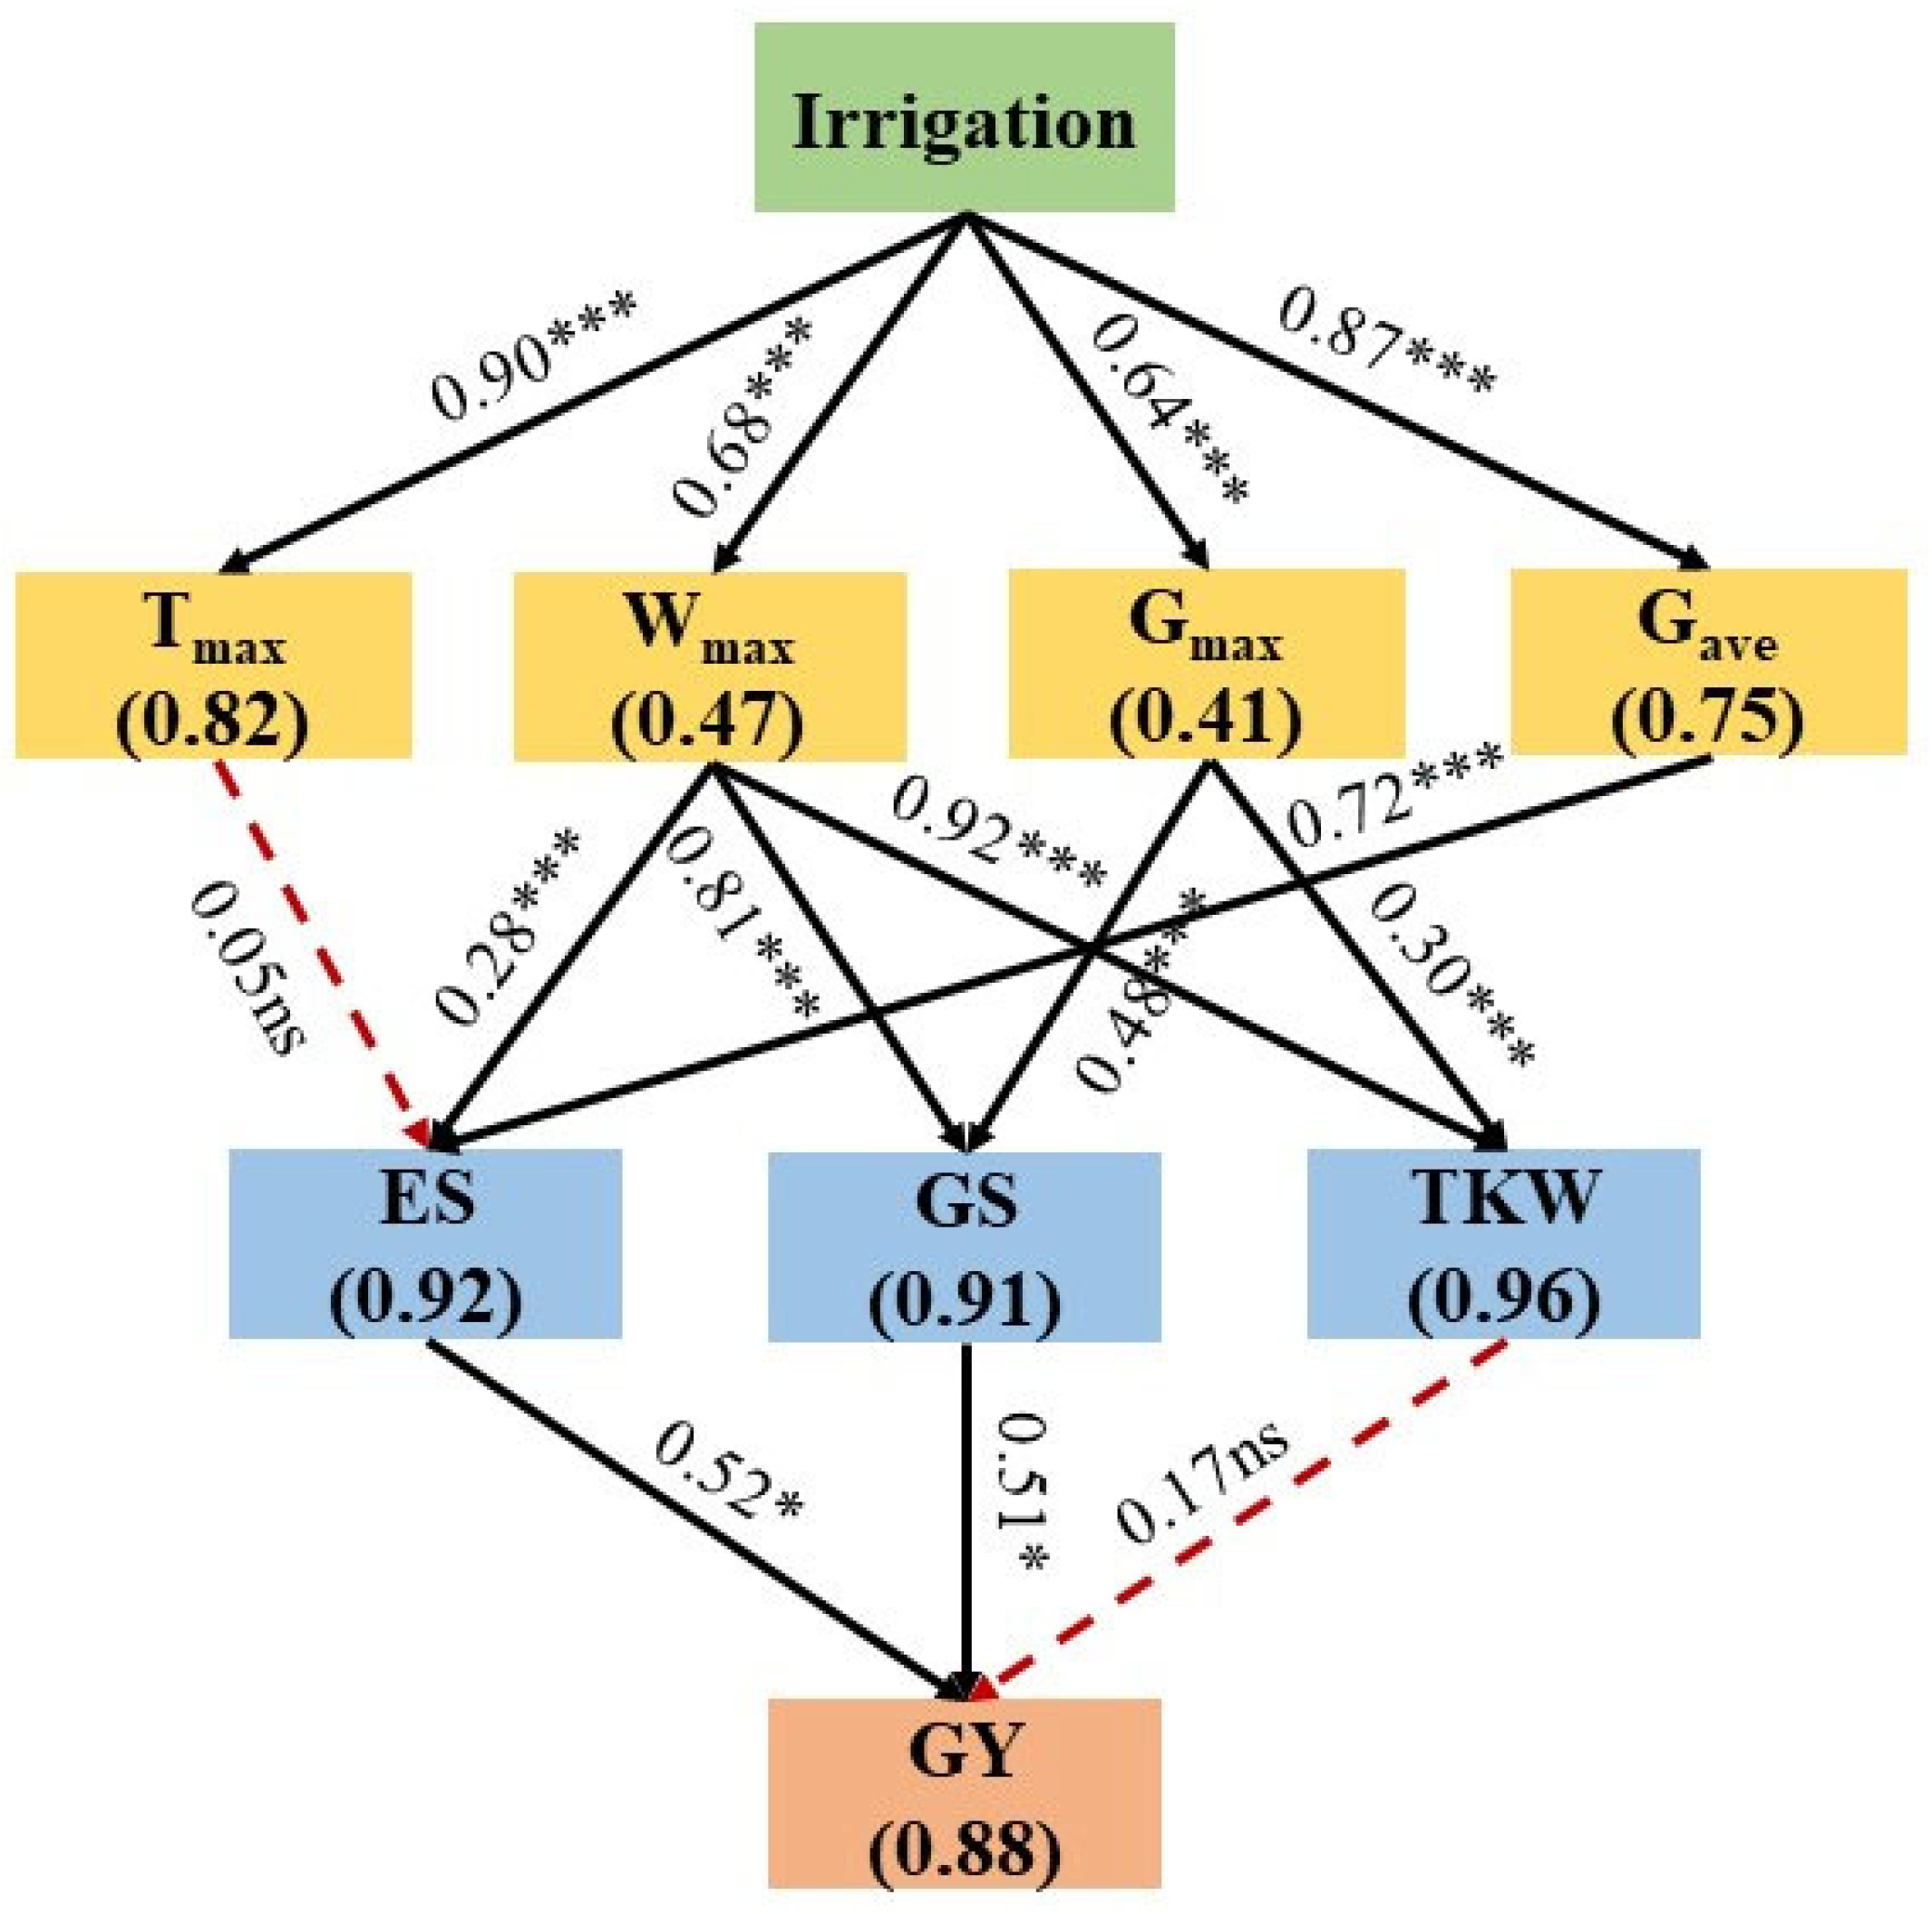
3.6. Structural Equation Modeling

The direct and indirect relationships between grain-filling parameters, yield components, and grain yield were analyzed by employing SEM, and thus reveal the potential mechanism by which deep storage irrigation affects GY (Figure 10). The parameters of goodness-of-fit indices (CMIN/DF = 1.254 < 3, GFI = 0.924 > 0.9, CFI = 0.959 > 0.9, RMSEA = 0.076 < 0.08) indicated that the model had good consistency with the hypothetical model. Deep storage irrigation produced a direct positive impact on Tmax, with a standardized path coefficient of 0.90 (***), whereas the indirect effect of irrigation on ES was not significant by altering Tmax. This indicated that Tmax had no significant promoting effect on ES. Irrigation indirectly regulated ES through the Wmax and Gave pathways, and then the Gave regulation with the greatest effect reached an extremely significant level of 0.72 (***). Irrigation had highly significant direct regulation effects on Wmax and Gmax (0.68 and 0.64, respectively, ***), while Wmax and Gmax had indirect positive effects on GY by regulating GS. Furthermore, both Wmax and Gmax exhibited significant positive regulatory effects on TKW (p < 0.001), indicating that increased Wmax and Gmax would lead to an increase in TKW. Although not statistically significant, TKW showed a positive regulatory effect on GY. The ES and GS produced significant direct regulation influences on GY, with path coefficients of 0.52 and 0.51 (*), respectively. The ES, GS, and TKW could explain 88% of GY variations in different irrigation treatments.

4. Discussion

4.1. Effects of Deep Storage Irrigation on Wheat Growth

In semi-arid areas of Northwest China, soil moisture is generally limited; thus, the mismatch between crop water demand and precipitation distribution poses a considerable challenge to achieving stable and high wheat yields [53]. Therefore, the irrigation practices play a crucial role in fulfilling the substantial water requirements of crops to ensure the high wheat production [54]. Specifically, delivering an appropriate water supply is vital for the thriving growth and development of wheat [55]. PH, LAI, and DMA, as crop phenotypic features indicators, all can be influenced by irrigation management practices, which provide a strong foundation for evaluating wheat growth status [56,57,58]. According to previous studies, increasing water supply within a certain range can promote the PH, LAI, and DMA of wheat [59,60]. In the present study, the PH, LAI, and DMA increased almost linearly as irrigation amounts increased from W1 to W3 treatment. This phenomenon could be attributed to the following three possible reasons. Firstly, the soil microbial activities were enhanced under the sufficient irrigation conditions, and thus increased soil nitrogen mineralization and soil nitrogen availability, which positively influenced nutrient uptake and wheat growth [61,62]. Secondly, the jointing stage is recognized as a momentous developmental phase for the concurrent vegetative expansion and reproductive initiation in wheat. At this stage, the supplementary irrigation increased the DMA of wheat, largely owing to the improvement in the content of nutrients like chlorophyll, carotenoid, and proline in the leaves [63,64]. Additionally, the adequate irrigation can extend the duration of leaf greenness, sustain a higher photosynthetic rate, facilitate root growth, and thereby improve DMA of crops [65]. Similarly, the consistent pattern is also observed in maize (Zea mays L.). Qi [66] revealed that the highest PH, stem diameter, LAI, and DMA of maize were achieved under full irrigation compared with those under water deficit conditions. Yan [67] also ascertained that increasing irrigation amount promoted maize growth and the maximal LAI and DMA were obtained under irrigation amounts of 120% and 105% crop evapotranspiration, respectively, which were similar to this research’s results.
However, it is universally accepted that the irrigation amounts beyond certain thresholds can be deleterious to crop health [68]. As the irrigation amounts augmented from W3 to W4, the PH, LAI, and DMA of winter wheat displayed an overall reduction, even though the magnitude of the decline failed to achieve statistical significance in this research (p > 0.05). The reason for this is two-fold: (1) Excessive irrigation led to chronically high SWC within the rhizosphere of wheat, which compacted the soil and reduced soil porosity. The reduction in soil porosity restricts the oxygen diffusion through soil pores in root zone, weakens the airflow and respiratory performance, enhances the enzymatic activity of anaerobic respiratory, and results in abnormal respiratory system and wheat growth [65]. (2) Excessive irrigation possibly aggravated soil NO3-N leaching loss in root zone, which resulted in the lower residual soil NO3-N and ultimately increased competition by wheat plants for soil-available N [69,70]. A previous study on Pinus densiflora and Pinus thunbergii determined a similar finding, whereby excessive irrigation markedly reduced the phenotypic attributes, especially PH, LAI, and stem diameter, which may be attributed to suppressed ATP synthesis in an anaerobic environment [68]. Another pot experiment demonstrated that the surplus irrigation restricted nitrogen uptake by celeriac plants and accumulated in the leaves, which pondered harmful effects on celeriac growth, yield, and quality [71].
In this present study, the results showed that wheat growth and irrigation amounts had substantial quadratic quadrant function correlations. It is concluded that there is a critical irrigation threshold with increasing irrigation amounts. Upon surpassing this vital point, excessive irrigation may not be conducive to wheat growth [68]. This is also the reason why the wheat growth indicators exhibited an increasing trend followed by a decline with the increase in irrigation amounts (Figure 5a–c). Moreover, irrigation accelerated the dry matter transfer from the vegetative organs to grains by facilitating spike development and enhancing the synthesis of photosynthetic products both prior to and after anthesis [72]. This explains the observation of an overall reduction in PH, LAI, LDMA, and SDMA of wheat during later growth, while EDMA and TDMA tended to continuously increase with the growth process. The increments of PH, LAI, and DMA between the adjacent irrigation treatments gradually reduced as irrigation amounts increased, which indicated that the promotive effect of deep storage irrigation on wheat growth gradually weakened and even produced negative impacts.

4.2. Effects of Deep Storage Irrigation on Grain-Filling Process of Wheat

The dynamics of wheat KW days after anthesis is commonly employed to quantitatively describe the grain-filling process. The EDMA during the grain-filling process influences wheat KW and GY, which are predominantly determined by both grain-filling rate and duration time [73]. In the present study, Gmax and Gave held the same trend with the increase in irrigation amounts, and the peak values both were obtained at W3, perhaps due to a strong relationship between them (Figure 8). The AGP, T2, and T3 continuously increased with increasing irrigation amounts, whereas T1 exhibited a trend of initially increasing and subsequently slightly decreasing, which achieved the highest values in W3 treatment. The longer the RIP lasts, the larger the final KW will be. However, the shorter the RIP lasts, the lower the final KW will be [74]. The AGP was positively correlated with TKW. Also, the T2 and T3 presented a significant correlation with TKW, suggesting that T2 and T3 primarily influenced KW, which is in agreement with the results of Yue [75]. Wei [51] proved that shortening T1, prolonging T2, and maintaining GR increased KW. Interestingly, the TKW of W4 treatment was significantly greater than that for other irrigation treatments (except for W3 treatment) following the above mechanism. The TKW exhibited positive correlations with Gmax, Gave, G1, G2, and G3, but there was a low correlation with AGP, T2, and T3, which is consistent with the conclusions of Li [76]. The GR is mostly genetically controlled and markedly positively correlated with KW, whereas the T1, T2, and T3 are heavily impacted by environmental variables and have less positive correlations with KW [77]. The W3 treatment had higher Gmax, Gave, G1, G2, and G3 than those of W4 treatment, but basically no difference was detected in AGP, T2, and T3 between W3 and W4 treatments, which explained the difference in TKW between two irrigation treatments to some extent. Overall, the longer T2 and T3 and the higher G2 and G3 were considered as the most important factors for the higher TKW for W3 treatment in relative to the other irrigation treatments. This may support in comprehending the causes for increasing KW and thus GY under deep storage irrigation.

4.3. Effects of Deep Storage Irrigation on Grain Yield and Yield Components of Wheat

Crop yield along with yield components are the most crucial indicators for assessing irrigation strategies [78]. The yields of winter wheat are closely linked to the processes of dry matter accumulation and distribution [79], while the accomplishment of high production is contingent upon a large extent on the enhanced EDMA at flowering and GS [80]. In this study, the ES, GS, TKW, and GY all initially increased and subsequently declined with irrigation amounts increasing, and the maximum values occurred in W3 treatment (Table 6). As previously noted, crop growth promotion is generally associated with increased crop yields [81]. In a certain range, the ES, GS, TKW, and GY of wheat all gradually increased as irrigation amounts increased, while all presented a downward trend when the irrigation amount exceeded a certain threshold. Thus, a quadratic curve between GY and irrigation amounts is also observed (Figure 6d). This means that there exists a clear irrigation threshold, beyond which GY will not increase significantly, and may even decline. The reasons for this phenomenon are similar to those for the growth indicators. On one hand, appropriate irrigation during the jointing can enhance vertical root penetration by improving soil water conditions. This enhanced uptake and exploitation of water in deep soil layers, and extended root functionality, thereby leading to higher wheat yield [82,83]. On the other hand, the irrigation at jointing contributed positively to vegetative growth and reproductive growth of winter wheat [84]. Specifically, the irrigation facilitated the transfer from photosynthetic products to the grains by enhancing their synthesis both before and after anthesis and promoting wheat spike formation, which improved ES, GS, TKW, and DMA of wheat, ultimately increasing GY.
However, the negative influences of excessive irrigation on root oxygen absorption weakened the capability of the root system to absorb N and restricted N utilization efficiency, thereby leading to the reduction in GY [32]. The soil at the study site is classified as silty clay loam. The soil texture generally has balanced water retention, efficient drainage, and good aeration [85]. However, the poor infiltration and fine texture of the relatively high clay content may contribute to waterlogging problems in the root zone, thereby resulting in which reduced the oxygen availability to the root system. This transient root suffocation ultimately led to a decrease in crop yields [86]. Notably, the GS, TKW, and GY were significantly higher in W3 and W4 treatments than those in other irrigation treatments (p < 0.05), but there was no considerable difference between them (p > 0.05). In addition, the greatest GY improvement appeared between RF and W1, which is in line with findings by Zhang [87], who observed that irrigation at the jointing stage markedly increased wheat GY. Compared to deficit irrigation, plastic film mulching, no-till seeding, and other measures, deep storage irrigation not only did not lead to a reduction in winter wheat yields, but showed the potential for yield improvement in some cases [88,89]. However, the effects of different years on TKW differed, owing to the different precipitation features of the experimental years.

4.4. Correlation Analysis and Structural Equation Modeling

The SEM can identify a structural causal relationship between grain-filling characteristic parameters and grain yield and yield components through direct and indirect effects [90,91]. As the SEM was employed, the variable inclusion principles were according to goodness-of-fit indices, such as CMIN/DF, GFI, CFI, and RMSEA, and then the most pertinent variables were extracted to prevent overfitting [92]. In order to improve the accuracy in each SEM model operation, the variables with the lowest loading factor (i.e., AGP) were excluded since there was no increase in model efficiency. Thus, the Tmax, Wmax, Gmax and Gave were the most crucial variables influencing yield components among the grain-filling parameters [33,93]. In this study, ES and GS are the most importantly direct factors affecting GY of wheat. Meanwhile, the direct influence of TKW on GY under deep storage irrigation was weak but still existed (with loading factor of 0.17). A similar result was also proven by Zhang [94], who revealed that the improved wheat GY was owing to an increase in grain number per meter. Wmax and Gave were the dominant controlling factors of ES (Figure 9), while Wmax was mainly directly influenced by G1, W2, and W3 via a positive correlation, and W1, G2, and G3 produced direct and positive influences on Gave (Figure 8). In addition, the SEM results also demonstrated the indirect effects of Wmax and Gmax on GY through the GS pathway. Likewise, the positive direct effects of W1, G2, and G3 on Gmax were evident. Therefore, the increased kernel weight (W1, W2, and W3) and average grain-filling rate (G1, G2, and G3) of GIP, RIP, and SIP not only affected GY directly, but also indirectly through Wmax, Gave, and Gmax. This suggested that the appropriate increase in irrigation amounts favored the improvement of the increased kernel weight and mean grain-filling rate of GIP, RIP, and SIP, thereby increasing Wmax, Gave, and Gmax, which was advantageous for the transport of dry matter to the grains, and thereby facilitated ES and GS. This may be regarded as the most essential factors influencing wheat GY during the grain-filling period.

4.5. Limitations and Recommendations

Despite this study having made some progress in deep storage irrigation, there are still several limitations that may potentially affect the accuracy and practical application value of the research results. Firstly, the definition of flood season is influenced by various factors, including climatic conditions, topography, and hydrological characteristics, which makes accurate and comprehensive determination quite challenging [95,96]. This limitation may interfere with the determination of time for deep storage irrigation during the experimental process, and thereby affect the accuracy and reliability of these study results. The second limitation is nutrient leaching (i.e., N, P, and K) owing to deep soil water recharge, which thereby decreases nutrient utilization efficiency and increases groundwater pollution risk, although deep drainage-induced deep storage irrigation can recharge deep soil water and potentially recharge groundwater [97,98]. Therefore, further research should consider split nitrogen application to explore the optimal proportion of base and topdressing applications of nitrogen fertilizer under deep storage irrigation conditions.

5. Conclusions

This study showed that W3 treatment led to an increase in PH, LAI, and TDMA, which further improved Wmax, Gmax, and Gave, stimulated ES and GS, and ultimately, boosted wheat GY. The optimum coordination of growth and grain-filling process was observed in the W3 treatment. Meanwhile, the increased kernel weight (W1, W2, and W3) and average grain-filling rate (G1, G2, and G3) of GIP, RIP, and SIP encouraged the improvement of Wmax, Gmax, and Gave, respectively. These results highlight the potential of soil wetting layer depth of 160 cm as a feasible irrigation strategy for sustaining high wheat yields, and maintains relative stability in wet and dry seasons. The further increase in irrigation amount (W4 treatment) did not significantly decrease GY. Thus, it is feasible to appropriately increase irrigation amounts during flood seasons in the irrigation districts. Overall, this study identified the optimal threshold to maximize grain yield. Also, it is imperative to perform further investigation to determine the safety threshold to maximize flood resources utilization without significantly reducing wheat GY and explore the critical threshold of waterlogging that triggers waterlogging stress.

Author Contributions

Conceptualization, X.F., D.C. and X.H.; Data curation, X.F., D.C., Y.W., Y.D. and X.H.; Formal analysis, X.F.; Investigation, X.F., D.C., H.C., Y.W., Y.D. and X.H.; Methodology, X.F., D.C. and X.H.; Resources, D.C., H.C., Y.W., Y.D. and X.H.; Writing—original draft, X.F.; Writing—review and editing, X.F., D.C., H.C., Y.W., Y.D. and X.H.; Supervision, D.C. and X.H.; Funding acquisition, X.H.; Project administration, X.H. All authors have read and agreed to the published version of the manuscript.

Funding

This work was supported by the National Natural Science Foundation of China [grant number U2243235].

Data Availability Statement

Data will be made available on request.

Conflicts of Interest

The authors declare that they have no known competing financial interests or personal relationships that could have appeared to influence the work reported in this paper.

References

  1. IPCC. Climate Change 2022: Impacts, Adaptation and Vulnerability. Contribution of Working Group Ⅱ to the Sixth Assessment Report of the Intergovernmental Panel on Climate Change; Cambridge University Press: Cambridge, UK, 2022. [Google Scholar] [CrossRef]
  2. Davenport, F.V.; Burke, M.; Diffenbaugh, N.S. Contribution of historical precipitation change to US flood damages. Proc. Natl. Acad. Sci. USA 2021, 118, 1–7. [Google Scholar] [CrossRef]
  3. Yin, J.B.; Guo, S.L.; Gentine, P.; Sullivan, S.C.; Gu, L.; He, S.K.; Chen, J.; Liu, P. Does the hook structure constrain future flood intensification under anthropogenic climate warming? Water Resour. Res. 2021, 57, e2020WR028491. [Google Scholar] [CrossRef]
  4. Yin, J.B.; Guo, S.L.; Gu, L.; Zeng, Z.Y.; Liu, D.D.; Chen, J.; Shen, Y.J.; Xu, C.Y. Blending multi-satellite, atmospheric reanalysis and gauge precipitation products to facilitate hydrological modelling. J. Hydrol. 2021, 593, 125878. [Google Scholar] [CrossRef]
  5. Ji, Z.M.; Tian, S.T. A novel potential cause of extreme precipitation in the northwest China. Heliyon 2024, 10, e30826. [Google Scholar] [CrossRef]
  6. Wang, C.H.; Zhang, S.N.; Zhang, F.M.; Li, K.C.; Yang, K. On the increase of precipitation in the Northwestern China under the global warming. Adv. Earth Sci. 2021, 36, 980–989. [Google Scholar] [CrossRef]
  7. Zhao, H.L.; Shar, A.G.; Li, S.; Chen, Y.L.; Shi, J.L.; Zhang, X.Y.; Tian, X.H. Effect of straw return mode on soil aggregation and aggregate carbon content in an annual maize-wheat double cropping system. Soil Tillage Res. 2018, 175, 178–186. [Google Scholar] [CrossRef]
  8. Zheng, Z.; Hoogenboom, G.; Cai, H.J.; Wang, Z.K. Winter wheat production on the Guanzhong Plain of Northwest China under projected future climate with SimCLIM. Agric. Water Manag. 2020, 239, 106233. [Google Scholar] [CrossRef]
  9. Fu, W.; Fan, J.; Hao, M.D.; Hu, J.S.; Wang, H. Evaluating the effects of plastic film mulching patterns on cultivation of winter wheat in a dryland cropping system on the Loess Plateau, China. Agric. Water Manag. 2021, 244, 106550. [Google Scholar] [CrossRef]
  10. Lyu, J.Y.; Jiang, Y.N.; Xu, C.; Liu, Y.J.; Su, Z.H.; Liu, J.C.; He, J.Q. Multi-objective winter wheat irrigation strategies optimization based on coupling AquaCrop-OSPy and NSGA-Ⅲ: A case study in Yangling, China. Sci. Total Environ. 2022, 843, 157104. [Google Scholar] [CrossRef]
  11. Peng, X.B.; Wang, Y.F.; Ma, J.; Liu, X.A.; Gu, X.B.; Cai, H.J. Seasonal variation and controlling factors of carbon balance over dry semi-humid cropland in Guanzhong Plain. Eur. J. Agron. 2023, 149, 126912. [Google Scholar] [CrossRef]
  12. Wang, Y.H.; Li, P.Y. Appraisal of shallow groundwater quality with human health risk assessment in different seasons in rural areas of the Guanzhong Plain (China). Environ. Res. 2022, 207, 112210. [Google Scholar] [CrossRef] [PubMed]
  13. Xie, L.J.; Li, P.Y.; Mu, D.W. Spatial distribution, source apportionment and potential ecological risk assessment of trace metals in surface soils in the upstream region of the Guanzhong Plain, China. Environ. Res. 2023, 234, 116527. [Google Scholar] [CrossRef]
  14. Si, Z.Y.; Zain, M.; Mehmood, F.; Wang, G.S.; Gao, Y.; Duan, A.W. Effects of nitrogen application rate and irrigation regime on growth, yield, and water-nitrogen use efficiency of drip-irrigated winter wheat in the North China Plain. Agric. Water Manag. 2020, 231, 106002. [Google Scholar] [CrossRef]
  15. Lu, J.S.; Hu, T.T.; Geng, C.M.; Cui, X.L.; Fan, J.L.; Zhang, F.C. Response of yield, yield components and water-nitrogen use efficiency of winter wheat to different drip fertigation regimes in Northwest China. Agric. Water Manag. 2021, 255, 107034. [Google Scholar] [CrossRef]
  16. Niu, J.; Zhu, X.G.; Parry, M.A.J.; Kang, S.Z.; Du, T.S.; Tong, L.; Ding, R.S. Environmental burdens of groundwater extraction for irrigation over an inland river basin in Northwest China. J. Clean. Prod. 2019, 222, 182–192. [Google Scholar] [CrossRef]
  17. Wang, H.L.; Wang, Z.Z.; Zheng, T.L. Study on the present situation of groundwater resources and the networking of Monotoring Stations in Shaanxi Province. Ground Water 2018, 40, 5. [Google Scholar]
  18. Wang, Z.P.; Zhang, L.; Wang, B.; Hou, L.Y.; Xiao, C.W.; Zhang, X.M.; Han, X.G. Dissolved methane in groundwater of domestic wells and its potential emissions in arid and semi-arid regions of Inner Mongolia, China. Sci. Total Environ. 2018, 626, 1193–1199. [Google Scholar] [CrossRef]
  19. Yang, X.L.; Chen, Y.Q.; Pacenka, S.; Steenhuis, T.S.; Sui, P. Managing food and bioenergy crops with declining groundwater levels in the North China Plain. Field Crops Res. 2019, 234, 1–14. [Google Scholar] [CrossRef]
  20. Gao, Z.Z.; Wang, C.; Zhao, J.C.; Wang, K.C.; Shang, M.F.; Qin, Y.S.; Bo, X.Z.; Chen, F.; Chu, Q.Q. Adopting different irrigation and nitrogen management based on precipitation year types balances winter wheat yields and greenhouse gas emissions. Field Crops Res. 2022, 280, 108484. [Google Scholar] [CrossRef]
  21. Romano, N.; Santini, A. Water retention and storage: Field. In Methods of Soil Analysis, Part 4: Physical Methods; Dane, J.H., Topp, G.C., Eds.; Soil Science Society of America: Madison, WI, USA, 2002; pp. 721–738. [Google Scholar]
  22. Kim, M.K.; Lau, W.K.M.; Kim, K.M.; Lee, W.S. A GCM study of effects of radiative forcing of sulfate aerosol on large scale circulation and rainfall in East Asia during boreal spring. Geophys. Res. Lett. 2007, 34, L24701. [Google Scholar] [CrossRef]
  23. Endo, N.; Matsumoto, J.; Lwin, T. Trend in precipitation extremes over Southeast Asia. SOLA 2009, 5, 168–171. [Google Scholar] [CrossRef]
  24. Chen, C.A.; Hsu, H.H.; Liang, H.C.; Chiu, P.G.; Tu, C.Y. Future change in extreme precipitation in East Asian spring and Mei-yu seasons in two high-resolution AGCMs. Weather Clim Extreme. 2022, 35, 100408. [Google Scholar] [CrossRef]
  25. Gao, J.; Xie, P.X.; Zhuo, L.; Shang, K.H.; Ji, X.X.; Wu, P.T. Water footprints of irrigated crop production and meteorological driving factors at multiple temporal scales. Agric. Water Manag. 2021, 255, 107014. [Google Scholar] [CrossRef]
  26. Liu, J.M.; Si, Z.Y.; Li, S.; Kader Mounkaila Hamani, A.; Zhang, Y.Y.; Wu, L.F.; Gao, Y.; Duan, A.W. Variations in water sources used by winter wheat across distinct rainfall years in the North China Plain. J. Hydrol. 2023, 618, 129186. [Google Scholar] [CrossRef]
  27. Li, G.C.; Niu, W.Q.; Ma, L.; Du, Y.D.; Zhang, Q.; Gan, H.C.; Siddique, K.H.M. Effects of drip irrigation upper limits on rhizosphere soil bacterial communities, soil organic carbon, and wheat yield. Agric. Water Manag. 2024, 293, 108701. [Google Scholar] [CrossRef]
  28. Xiao, C.; Ji, Q.Y.; Zhang, F.C.; Li, Y.; Fan, J.L.; Hou, X.H.; Yan, F.L.; Liu, X.Q.; Gong, K.Y. Effects of various soil water potential thresholds for drip irrigation on soil salinity, seed cotton yield and water productivity of cotton in northwest China. Agric. Water Manag. 2023, 279, 108172. [Google Scholar] [CrossRef]
  29. Zhang, F.; Chen, M.R.; Fu, J.T.; Zhang, X.Z.; Li, Y.; Shao, Y.T.; Xing, Y.Y.; Wang, X.K. Coupling effects of irrigation amount and fertilization rate on yield, quality, water and fertilizer use efficiency of different potato varieties in Northwest China. Agric. Water Manag. 2023, 287, 108446. [Google Scholar] [CrossRef]
  30. Yue, L. Analysis of Water Use Efficiency and Influencing Factors of Winter Wheat-Summer Maize Under Different Irrigation Strategies; Henan Agricultural University: Zhengzhou, China, 2022. [Google Scholar]
  31. Yan, Z.X.; Zhang, W.Y.; Liu, X.W.; Wang, Q.S.; Liu, B.H.; Mei, X.R. Grain yield and water productivity of winter wheat controlled by irrigation regime and manure substitution in the North China Plain. Agric. Water Manag. 2024, 295, 108731. [Google Scholar] [CrossRef]
  32. Du, Y.D.; Niu, W.Q.; Zhang, Q.; Cui, B.J.; Zhang, Z.H.; Wang, Z.; Sun, J. A synthetic analysis of the effect of water and nitrogen inputs on wheat yield and water- and nitrogen-use efficiencies in China. Field Crops Res. 2021, 265, 108105. [Google Scholar] [CrossRef]
  33. Wu, W.N.; Han, J.Y.; Gu, Y.N.; Li, T.; Xu, X.R.; Jiang, Y.H.; Li, Y.P.; Sun, J.F.; Pan, G.X.; Cheng, K. Impact of biochar amendment on soil hydrological properties and crop water use efficiency: A global meta-analysis and structural equation model. GCB Bioenergy 2022, 14, 657–668. [Google Scholar] [CrossRef]
  34. Zhao, X.L.; Mak-Mensah, E.; Zhao, W.C.; Wang, Q.; Zhou, X.J.; Zhang, D.K.; Zhu, J.H.; Qi, W.J.; Liu, Q.L.; Li, X.L.; et al. Optimized ridge-furrow technology with biochar amendment for alfalfa yield enhancement and soil erosion reduction based on a structural equation model on sloping land. Agric. Water Manag. 2024, 298, 108866. [Google Scholar] [CrossRef]
  35. Zewdie, M.C.; Passel, S.V.; Cools, J.; Tenessa, D.B.; Ayele, Z.A.; Tsegaye, E.A.; Minale, A.S.; Nyssen, J. Direct and indirect effect of irrigation water availability on crop revenue in northwest Ethiopia: A structural equation model. Agric. Water Manag. 2019, 220, 27–35. [Google Scholar] [CrossRef]
  36. Jiang, W.G.; Gong, Z.; Yang, Y.H.; Tan, Z.M.; Li, Z.Y.; Li, D.W. Optimal irrigation water salinity enhances tomato (Solanum lycopersicum L.) yield in sand culture by regulating substrate salinity. Agric. Water Manag. 2025, 317, 109632. [Google Scholar] [CrossRef]
  37. Dar, A.A.; Parthasarathy, N. Ecological drivers of soil carbon in Kashmir Himalayan forests: Application of machine learning combined with structural equation modelling. J. Environ. Manag. 2023, 330, 117147. [Google Scholar] [CrossRef]
  38. Xu, J.T.; Mu, Q.; Ding, Y.B.; Sun, S.K.; Zou, Y.F.; Yu, L.Y.; Zhang, P.Y.; Yang, N.; Guo, W.; Cai, H.J. Considering spatio-temporal dynamics of soil water with evapotranspiration partitioning helps to clarify water utilization characteristics of summer maize under deficit irrigation. J. Hydrol. 2023, 617, 129102. [Google Scholar] [CrossRef]
  39. Wang, L.; Liu, X.L.; Liu, X.J.; Bao, X.Y.; Zhang, X.C.; Yin, B.Z.; Wang, W.T.; Wang, Y.D.; Zhen, W.C. Effects of spring limited irrigation on grain yield and root characteristics of winter wheat in groundwater-overexploitation areas in the North China Plain. Agric. Water Manag. 2024, 294, 108729. [Google Scholar] [CrossRef]
  40. Amine, B.E.; Mosseddaq, F.; Houssa, A.A.; Bouaziz, A.; Moughli, L.; Oukarroum, A. How far can the interactive effects of continuous deficit irrigation and foliar iron fertilization improve the physiological and agronomic status of soybeans grown in calcareous soils under arid climate conditions? Agric. Water Manag. 2024, 300, 108926. [Google Scholar] [CrossRef]
  41. Wang, C.; Zhao, J.C.; Gao, Z.Z.; Feng, Y.P.; Chu, Q.Q. Cleaner tillage and irrigation options for food-water-energy-carbon synergism in wheat-maize cropping systems. Environ. Res. 2024, 242, 117710. [Google Scholar] [CrossRef]
  42. Guo, Y.P. On Modern Flood Diversion and Silt Irrigation Technology in Guanzhong Area; Shaanxi Normal University: Xi’an, China, 2009. [Google Scholar]
  43. Food and Agriculture Organization of the United Nations (FAO). Standard Operating Procedure for Soil pH Determination, Rome. 2021. Available online: https://openknowledge.fao.org/handle/20.500.14283/cb3637en (accessed on 12 July 2024).
  44. Food and Agriculture Organization of the United Nations (FAO). Standard Operating Procedure for Soil Electrical Conductivity, Soil/Water, 1:5. 2021. Available online: https://openknowledge.fao.org/handle/20.500.14283/cb3354en (accessed on 12 July 2024).
  45. Reynolds, W.D. An analytic description of field capacity and its application in crop production. Geoderma 2018, 326, 56–67. [Google Scholar] [CrossRef]
  46. Bao, S.D. Soil Agricultural Chemical Elements Analysis; China Agriculture Press: Beijing, China, 2000; pp. 106–107. [Google Scholar]
  47. Kachurina, O.M.; Zhang, H.; Raun, W.R.; Krenzer, E.G. Simultaneous determination of soil aluminum, ammonium-and nitrate-nitrogen using 1M potassium chloride extraction. Commun. Soil Sci. Plant Anal. 2000, 31, 893–903. [Google Scholar] [CrossRef]
  48. Olsen, S.R. Estimation of available phosphorus in soils by extraction with sodium bicarbonate. In Circular No. 939; USDA, Ed.; USDA: Washington, DC, USA, 1954; pp. 1–19. [Google Scholar]
  49. Walkley, A.; Black, I.A. An examination of the degtjareff method for determining soil organic matter and a proposed modification of the chromic acid titration method. Soil Sci. 1934, 37, 29–38. [Google Scholar] [CrossRef]
  50. Van Bemmelen, J.M. Über die Bestimmung des Wassers, des Humus, des Schwefels, der in den colloïdalen Silikaten gebundenen Kieselsäure, des Mangans u.s. w. im Ackerboden. Die Landwirthschaftlichen Versuchs-Stationen. 1890, 37, 279–290. [Google Scholar]
  51. Wei, S.S.; Wang, X.Y.; Li, G.H.; Qin, Y.Y.; Jiang, D.; Dong, S.T. Plant density and nitrogen supply affect the grain filling parameters of maize kernels located in different ear positions. Front. Plant Sci. 2019, 10, 180. [Google Scholar] [CrossRef]
  52. Liu, Z.; Gao, J.; Zhao, S.Y.; Sha, Y.; Huang, Y.W.; Hao, Z.H.; Ke, L.H.; Chen, F.J.; Yuan, L.X.; Mi, G.H. Nitrogen responsiveness of leaf growth, radiation use efficiency and grain yield of maize (Zea mays L.) in Northeast China. Field Crops Res. 2023, 291, 108806. [Google Scholar] [CrossRef]
  53. Shi, X.R.; Li, C.; Li, P.; Zong, Y.Z.; Zhang, D.S.; Gao, Z.Q.; Hao, X.Y.; Wang, J.; Lam, S.K. Deep plowing increase soil water storage and wheat yield in a semiarid region of Loess Plateau in China: A simulation study. Field Crops Res. 2024, 308, 109299. [Google Scholar] [CrossRef]
  54. Zeng, R.Y.; Yao, F.M.; Zhang, S.; Yang, S.S.; Bai, Y.; Zhang, J.H.; Wang, J.W.; Wang, X. Assessing the effects of precipitation and irrigation on winter wheat yield and water productivity in North China Plain. Agric. Water Manag. 2021, 256, 107063. [Google Scholar] [CrossRef]
  55. Li, H.R.; Jia, B.; Wang, H.G.; Li, D.X.; Fang, Q.; He, J.N.; Li, R.Q. Yield response of supplementary irrigation at the anthesis stage of winter wheat. Agric. Water Manag. 2023, 284, 108352. [Google Scholar] [CrossRef]
  56. Xu, D.G.; Jia, C.F.; Lyu, X.R.; Yang, T.Z.; Qin, H.M.; Wang, Y.L.; Hao, Q.L.; Liu, W.X.; Dai, X.H.; Zeng, J.B.; et al. In silico curation of QTL-rich clusters and candidate gene identification for plant height of bread wheat. Crop J. 2023, 11, 1480–1490. [Google Scholar] [CrossRef]
  57. Ilniyaz, O.; Du, Q.Y.; Shen, H.F.; He, W.W.; Feng, L.W.; Azadi, H.; Kurban, A.; Chen, X. Leaf area index estimation of pergola-trained vineyards in arid regions using classical and deep learning methods based on UAV-based RGB images. Comput. Electron. Agric. 2023, 207, 107723. [Google Scholar] [CrossRef]
  58. Shu, M.Y.; Li, Q.; Ghafoor, A.; Zhu, J.Y.; Li, B.G.; Ma, Y.T. Using the plant height and canopy coverage to estimation maize aboveground biomass with UAV digital images. Eur. J. Agron. 2023, 151, 126957. [Google Scholar] [CrossRef]
  59. Li, W.Q.; Han, M.M.; Pang, D.W.; Chen, J.; Wang, Y.Y.; Dong, H.H.; Chang, Y.L.; Jin, M.; Luo, Y.L.; Li, Y.; et al. Characteristics of lodging resistance of high-yield winter wheat as affected by nitrogen rate and irrigation managements. J. Integr. Agric. 2022, 21, 1290–1309. [Google Scholar] [CrossRef]
  60. Wang, N.; Zhang, T.H.; Cong, A.Q.; Lian, J. Integrated application of fertilization and reduced irrigation improved maize (Zea mays L.) yield, crop water productivity and nitrogen use efficiency in a semi-arid region. Agric. Water Manag. 2023, 289, 108566. [Google Scholar] [CrossRef]
  61. Cheraghi, M.; Mousavi, S.M.; Zarebanadkouki, M. Functions of rhizosheath on facilitating the uptake of water and nutrients under drought stress: A review. Plant Soil 2023, 491, 239–263. [Google Scholar] [CrossRef]
  62. Li, D.; Zhang, J.B.; Gruda, N.S.; Wang, Z.Y.; Duan, Z.Q.; Müller, C.; Li, X. The regulation of gross nitrogen transformation rates in greenhouse soil cultivated with cucumber plants under elevated atmospheric [CO2] and increased soil temperature. Geoderma 2023, 439, 116680. [Google Scholar] [CrossRef]
  63. Li, F.S.; Wei, C.H.; Zhang, F.C.; Zhang, J.H.; Nong, M.L.; Kang, S.Z. Water-use efficiency and physiological responses of maize under partial root-zone irrigation. Agric. Water Manag. 2010, 97, 1156–1164. [Google Scholar] [CrossRef]
  64. Wang, D.; Yu, Z.W.; White, P.J. The effect of supplemental irrigation after jointing on leaf senescence and grain filling in wheat. Field Crops Res. 2013, 151, 35–44. [Google Scholar] [CrossRef]
  65. Zhang, Z.; Yu, Z.W.; Shi, Y.; Zhang, Y.L. Effects of micro-sprinkling with different irrigation levels on winter wheat grain yield and greenhouse gas emissions in the North China Plain. Eur. J. Agron. 2023, 143, 126725. [Google Scholar] [CrossRef]
  66. Qi, D.L.; Hu, T.T.; Song, X. Effects of nitrogen application rates and irrigation regimes on grain yield and water efficiency of maize under alternate partial root-zone irrigation. J. Integr. Agric. 2020, 19, 2792–2806. [Google Scholar] [CrossRef]
  67. Yan, F.L.; Zhang, F.C.; Fan, X.K.; Fan, J.L.; Wang, Y.; Zou, H.Y.; Wang, H.D.; Li, G.D. Determining irrigation amount and fertilization rate to simultaneously optimize grain yield, grain nitrogen accumulation and economic benefit of drip-fertigated spring maize in northwest China. Agric. Water Manag. 2021, 243, 106440. [Google Scholar] [CrossRef]
  68. Bhusal, N.; Adhikari, A.; Lee, M.; Han, A.; Han, A.R.; Kim, H.S. Evaluation of growth responses of six gymnosperm species under long-term excessive irrigation and traits determining species resistance to waterlogging. Agric. Forest Meteorol. 2022, 323, 109071. [Google Scholar] [CrossRef]
  69. Egerer, S.; Puente, A.F.; Peichl, M.; Rakovec, O.; Samaniego, L.; Schneider, U.A. Limited potential of irrigation to prevent potato yield losses in Germany under climate change. Agric. Syst. 2023, 207, 103633. [Google Scholar] [CrossRef]
  70. Fang, X.T.; Xiang, Z.Q.; Ma, H.Y.; Wang, F.; Wang, Q.; Li, P.H.; Zheng, S.L. Effect of N fertilizer dosage and base/topdressing ratio on potato growth characteristics and yield. Agronomy 2023, 13, 909. [Google Scholar] [CrossRef]
  71. Siluch, M.; Siedliska, A.; Bartmiński, P.; Kociuba, W.; Baranowski, P.; Krzyszczak, J. The impact of water availability on the discriminative status of nitrogen (N) in sugar beet and celery using hyperspectral imaging methods. Appl. Sci. 2023, 13, 6072. [Google Scholar] [CrossRef]
  72. Yang, L.; Fang, X.Y.; Zhou, J.; Zhao, J.; Hou, X.Q.; Yang, Y.D.; Zang, H.D.; Zeng, Z.H. Optimal irrigation for wheat-maize rotation depending on precipitation in the North China Plain: Evidence from a four-year experiment. Agric. Water Manag. 2024, 294, 108726. [Google Scholar] [CrossRef]
  73. Wu, Y.W.; Zhao, B.; Li, X.L.; Liu, Q.L.; Feng, D.J.; Lan, T.Q.; Kong, F.L.; Li, Q.; Yuan, J.C. Nitrogen application affects maize grain filling by regulating grain water relations. J. Integr. Agric. 2022, 21, 977–994. [Google Scholar] [CrossRef]
  74. Chen, Y.J.; Hoogenboom, G.; Ma, Y.T.; Li, B.G.; Guo, Y. Maize kernel growth at different floret positions of the ear. Field Crops Res. 2013, 149, 177–186. [Google Scholar] [CrossRef]
  75. Yue, K.; Li, L.L.; Xie, J.H.; Wang, L.L.; Liu, Y.Q.; Anwar, S. Tillage and nitrogen supply affects maize yield by regulating photosynthetic capacity, hormonal changes and grain filling in the Loess Plateau. Soil Till Res. 2022, 218, 105317. [Google Scholar] [CrossRef]
  76. Li, Q.; Du, L.J.; Feng, D.J.; Ren, Y.; Li, Z.X.; Kong, F.L.; Yuan, J.C. Grain-filling characteristics and yield differences of maize cultivars with contrasting nitrogen efficiencies. Crop J. 2020, 8, 990–1001. [Google Scholar] [CrossRef]
  77. Shi, J.G.; Cui, H.Y.; Zhao, B.; Dong, S.T.; Liu, P.; Zhang, J.W. Effect of light on yield and characteristics of grain-filling of summer maize from flowering to maturity. Sci. Agric. Sin. 2013, 46, 4427–4434. [Google Scholar]
  78. Ma, Z.L.; Liu, J.; Wen, Y.; Zhang, J.Z.; Yin, F.H.; Guo, L.; Li, W.H.; He, J.; Ma, J.Y.; Liang, Y.H.; et al. Optimizing cotton yield through appropriate irrigation water salinity: Coordinating above- and below-ground growth and enhancing photosynthetic capacity. Eur. J. Agron. 2024, 154, 127095. [Google Scholar] [CrossRef]
  79. Yan, S.C.; Wu, Y.; Fan, J.L.; Zhang, F.C.; Guo, J.J.; Zheng, J.; Wu, L.F. Optimization of drip irrigation and fertilization regimes to enhance winter wheat grain yield by improving post-anthesis dry matter accumulation and translocation in northwest China. Agric. Water Manag. 2022, 271, 107782. [Google Scholar] [CrossRef]
  80. Duan, J.Z.; Wu, Y.P.; Zhou, Y.; Ren, X.X.; Shao, Y.H.; Feng, W.; Zhu, Y.J.; Wang, Y.H.; Guo, T.C. Grain number responses to pre-anthesis dry matter and nitrogen in improving wheat yield in the Huang-Huai Plain. Sci. Rep. 2018, 8, 7126. [Google Scholar] [CrossRef]
  81. Gu, X.B.; Cai, H.J.; Fang, H.; Chen, P.P.; Li, Y.P.; Li, Y.N. Soil hydro-thermal characteristics, maize yield and water use efficiency as affected by different biodegradable film mulching patterns in a rain-fed semi-arid area of China. Agric. Water Manag. 2021, 245, 106560. [Google Scholar] [CrossRef]
  82. Yuan, T.G.; Tai, A.P.K.; Mao, J.; Tam, O.H.F.; Li, R.K.K.; Wu, J.; Li, S.E. Effects of different irrigation methods on regional climate in North China Plain: A modeling study. Agric. Forest Meteorol. 2023, 342, 109728. [Google Scholar] [CrossRef]
  83. Gao, Z.Z.; Wang, Y.X.; Feng, Y.P.; Laraib, I.; Wang, C.; Zhao, J.C.; Chu, Q.Q. Optimized irrigation management mitigates reactive nitrogen loss and shapes nitrogen fate in wheat production. Field Crops Res. 2024, 308, 109269. [Google Scholar] [CrossRef]
  84. Wang, M.J.; Shi, W.; Kamran, M.; Chang, S.H.; Jia, Q.M.; Hou, F.J. Effects of intercropping and regulated deficit irrigation on the yield, water and land resource utilization, and economic benefits of forage maize in arid region of Northwest China. Agric. Water Manag. 2024, 298, 108876. [Google Scholar] [CrossRef]
  85. Le Anh, T. Irrigation and Drainage Systems. Department of Agronomy-Vietnam Academy of Agriculture. 2009. Available online: https://sites.google.com/site/lophocphank57vnua/ (accessed on 28 July 2025).
  86. Huang, C.; Gao, Y.; Qin, A.; Liu, Z.; Zhao, B.; Ning, D.; Ma, S.; Duan, A.; Liu, Z. Effects of waterlogging at different stages and durations on maize growth and grain yields. Agric. Water Manag. 2022, 261, 107334. [Google Scholar] [CrossRef]
  87. Zhang, X.Y.; Qin, W.L.; Chen, S.Y.; Shao, L.W.; Sun, H.Y. Responses of yield and WUE of winter wheat to water stress during the past three decades-a case study in the North China Plain. Agric. Water Manag. 2017, 179, 47–54. [Google Scholar] [CrossRef]
  88. Chai, Y.W.; Chai, Q.; Yang, C.G.; Chen, Y.Z.; Li, R.; Li, Y.W.; Chang, L.; Lan, X.M.; Cheng, H.B.; Chai, S.X. Plastic film mulching increases yield, water productivity, and net income of rain-fed winter wheat compared with no mulching in semiarid Northwest China. Agric. Water Manag. 2022, 262, 107420. [Google Scholar] [CrossRef]
  89. Liu, M.; Wu, X.L.; Li, M.; Xiong, T.; Li, C.S.; Tang, Y.L. Innovative no-till seeding technology improves yield and nitrogen use efficiency while reducing environmental pressure in wheat after rice harvesting. Soil Till Res. 2024, 235, 105908. [Google Scholar] [CrossRef]
  90. Yang, Z.; Kong, T.T.; Xie, J.R.; Yang, T.G.; Jiang, Y.; Feng, Z.Q.; Zhang, Z. Appropriate water and fertilizer supply can increase yield by promoting growth while ensuring the soil ecological environment in melon production. Agric. Water Manag. 2023, 289, 108561. [Google Scholar] [CrossRef]
  91. Liang, X.Y.; Wang, H.T.; Wang, C.J.; Qin, J.J.; Qiu, X.F.; Wen, Y.X.; Wang, J.D.; Mei, X.R. Biogas slurry topdressing enhances the comprehensive benefits of maize: New perspectives on grain filling process, yield, and endogenous microbiome. J. Agric. Food Res. 2025, 22, 102111. [Google Scholar] [CrossRef]
  92. Kaveh, N.; Ebrahimi, A.; Asadi, E. Comparative analysis of random forest, exploratory regression, and structural equation modeling for screening key environmental variables in evaluating rangeland above-ground biomass. Ecol. Inform. 2023, 77, 102251. [Google Scholar] [CrossRef]
  93. Zheng, C.Y.; Li, C.L.; Tian, L.B.; Shen, Z.Y.; Feng, G.Z.; Hou, W.F.; Liu, F.L.; Gao, Q.; Wang, Y. Mixture of controlled-release and normal urea to improve maize root development, post-silking plant growth, and grain filling. Eur. J. Agron. 2023, 151, 126994. [Google Scholar] [CrossRef]
  94. Zhang, Z.; Li, J.; Hu, N.Y.; Li, W.; Qin, W.L.; Li, J.P.; Gao, Y.M.; Liu, Y.; Sun, Z.C.; Yu, K.; et al. Spike growth affects spike fertility through the number of florets with green anthers before floret abortion in wheat. Field Crops Res. 2021, 260, 108007. [Google Scholar] [CrossRef]
  95. Xu, Z.; Mo, L.; Zhou, J.; Zhang, X. Optimal dispatching rules of hydropower reservoir in flood season considering flood resources utilization: A case study of Three Gorges Reservoir in China. J. Clean. Prod. 2023, 388, 135975. [Google Scholar] [CrossRef]
  96. Liu, Y.; Wang, C.; Jiang, C.; Chin, R.; Xiang, Z.; Long, Y.; Deng, B.; Wu, Z. Water storage capacity estimation for a large complex lake system incorporating the water levels during flooding season. J. Hydrol. Reg. Stud. 2024, 51, 101634. [Google Scholar] [CrossRef]
  97. Reading, L.; Bajracharya, K.; Wang, J. Simulating deep drainage and nitrate leaching on a regional scale: Implications for groundwater management in an intensively irrigated area. Irrig. Sci. 2019, 37, 561–581. [Google Scholar] [CrossRef]
  98. Zhou, H.; Zhao, W. Modeling soil water balance and irrigation strategies in a flood-irrigated wheat-maize rotation system. A case in dry climate, China. Agric. Water Manage 2019, 221, 286–302. [Google Scholar] [CrossRef]
Figure 1. Location of Yangling in the Guanzhong Plain of Shaanxi Province in China.
Agronomy 15 01852 g001
Figure 2. Daily precipitation, maximum/minimum temperature, and reference crop evapotranspiration (ET0) during the growing seasons of winter wheat in 2020–2021 (a), 2021–2022 (b), and 2022–2023 (c) in Yangling, China.
Agronomy 15 01852 g002
Figure 3. Schematic diagram of test design. (a) Division map of the test area; (b) layout of the deep storage irrigation experimental area.
Agronomy 15 01852 g003
Figure 4. Dynamics of plant height and leaf area index of winter wheat during growing seasons in 2020–2021 (a and d), 2021–2022 (b and e), and 2022–2023 (c and f) in Yangling, China. Error bars represent the standard deviation of the mean (n = 9). The different lowercase letters represent significant differences at the same time under different irrigation treatments at the p < 0.05 significance level. “ns” indicates no significant differences at the p < 0.05 significance level. RF, W1, W2, W3, and W4 treatments correspond to five soil wetting layer depths of 0, 120, 140, 160, and 180 cm utilized for deep storage irrigation, respectively. The same applies below.
Agronomy 15 01852 g004
Figure 5. Relationship of plant height (a), leaf area index (b), total dry matter accumulation (c), and grain yield (d) at maturity stage of winter wheat with various irrigation amounts in 2020–2021, 2021–2022, and 2022–2023 in Yangling, China. y1, y2, and y3 represent simulation equation in 2020–2021, 2021–2022, and 2022–2023, respectively.
Agronomy 15 01852 g005
Figure 6. Dynamics of dry matter accumulation of winter wheat over the growing seasons from 2021 to 2023 (ac), and total aboveground dry matter for different irrigation treatments at maturity stage (df) in Yangling, China. Zadoks 34, jointing stage; Zadoks 55, heading stage; Zadoks 65, middle anthesis stage; Zadoks 75, milk stage; Zadoks 92; maturity stage. Error bars represent the standard deviation of the mean (n = 9). The different lowercase letters represent significant differences at the same time under different irrigation treatments at the p < 0.05 significance level. The green lines represent the total aboveground dry matter accumulation.
Agronomy 15 01852 g006
Figure 7. Dynamics of kernel dry weight as a function (solid lines and solid point) and grain-filling rate (dashed lines) in different irrigation treatments during 2020–2021 (a), 2021–2022 (b), and 2022–2023 (c) wheat growing seasons. *, **, *** indicate significant differences at p < 0.05, p < 0.01, and p < 0.001. “ns” indicates no significant differences at the p < 0.05 significance level. The same applies below.
Agronomy 15 01852 g007
Figure 8. Correlation coefficient matrix of relationships among wheat growth parameters, grain-filling characteristic parameters, grain yield and its components. PH, plant height; LAI, leaf area index; LDMA, leaf dry matter accumulation; SDMA, stem dry matter accumulation; EDMA, ear dry matter accumulation; TDMA, total dry matter accumulation; Tmax, the day of maximum grain-filling rate; Wmax, kernel weight increment achieving maximum grain-filling rate; Gmax, maximum grain-filling rate; Gave, average grain-filling rate; AGP, active grain-filling period; T1, grain-filling duration of gradual increase period; W1, increased grain weight of gradual increase period; G1, mean grain-filling rate of gradual increase period; T2, grain-filling duration of rapid increase period; W2, increased grain weight of rapid increase period; G2, mean grain-filling rate of rapid increase period; T3, grain-filling duration of slight increase period; W3, increased grain weight of slight increase period; G3, mean grain-filling rate of slight increase period; ES, effective spikes; GS, grain number per spike; TKW, 1000-kernel weight; GY, grain yield.
Agronomy 15 01852 g008
Figure 9. Correlations between wheat harvested plant height, leaf area index, and total dry matter accumulation to effectives spikes (ac), grain number per spike (df), 1000-kernel weight (gi), and grain yield (jl) during 2020–2021, 2021–2022, and 2022–2023 wheat growing seasons.
Agronomy 15 01852 g009
Figure 10. Structural equation modeling (SEM) of the effect of irrigation on characteristic parameters and yield of the grain-filling period. Tmax, occurrence time of maximal grain-filling rate; Wmax, kernel weight increment achieving maximum grain-filling rate; Gmax, maximum grain-filling rate; Gave, average grain-filling rate; ES, effective spikes; GS, grain number per spike; TKW, 1000-kernel weight; GY, grain yield. The boxes represent variable names, and numbers in parentheses show the variance explained by this model (R2). The solid and dashed arrows represent the significance and non-significance of the relationship, respectively. The numbers next to the arrows represent the standardized path coefficients, which means how much standard deviation changes the independent variable if each of the independent variables changes by one standard deviation. A line with arrowhead indicates a putative causal link between the cause (base of the arrow) and effect (tip of the arrow). Results of the model fitting: CMIN/DF = 1.254, p = 0.239, GFI = 0.924, CFI = 0.959, RMSEA = 0.076. *, *** indicate significant differences at p < 0.05 and p < 0.001. “ns” indicates no significant differences at the p < 0.05 significance level.
Agronomy 15 01852 g010
Table 1. Basic soil properties of the 0–100 cm soil layer at the experimental site in Yangling, China.
Soil PropertySoil Depth (cm)Measurement Method
0–2020–4040–6060–8080–100
pH8.18.28.28.38.1Acid–Alkali indicator method [43]
Electrical conductivity (μs cm−1)171.1139.1118.6124.0122.2Time domain reflectometer (TDR) technology [44]
Field capacity soil moisture (cm3 cm−3)0.3260.3360.3440.3390.337Ring knife method [45]
Total nitrogen (g kg−1)1.5550.9510.6310.5070.535Kjeldahl digestion [46]
Available nitrogen (mg kg−1)159.585.351.439.735.2Colorimetric method by 2 mol L−1 cold Kcl extractable [47]
Available phosphorus (mg kg−1)44.70722.56310.6807.4497.703Olsen method by 0.5 mol L−1 NaHCO3 extractable [48]
Available potassium (mg kg−1)259140138124127Colorimetric method by 2 mol L−1 cold HNO3 extractable [46]
Organic matter (g kg−1)19.2818.7525.2504.2344.964Potassium dichromate oxidation method [49]
Note: Soil organic matter was analyzed based on the soil organic carbon content measured via the Walkley and Black chromic acid wet oxidation method [49]. This involved oxidizing organic carbon in soil with a potassium dichromate (K2Cr2O7) solution in concentrated sulfuric acid. The remaining unreduced dichromate was measured by back-titrating with ferrous sulfate, using the o-phenanthroline-ferrous complex as an indicator. The resulting soil organic carbon values were converted to soil organic matter using the conventional van Bemmelen factor of 1.724, which assumes that soil organic matter contains 58% carbon [50].
Table 2. Irrigation amounts for the five irrigation treatments during winter wheat seasons from 2020 to 2023 in Yangling, China.
Experiment YearsIrrigation Depth and AbbreviationTotal Irrigation Amounts for Winter Wheat (mm)
2020–2021Rain-fed (RF)-
120 cm (W1, CK)218.64 mm
140 cm (W2)239.11 mm
160 cm (W3)258.97 mm
180 cm (W4)283.95 mm
2021–2022Rain-fed (RF)-
120 cm (W1, CK)236.41 mm
140 cm (W2)269.98 mm
160 cm (W3)300.91 mm
180 cm (W4)327.08 mm
2022–2023Rain-fed (RF)-
120 cm (W1, CK)247.87 mm
140 cm (W2)279.09 mm
160 cm (W3)313.27 mm
180 cm (W4)340.54 mm
Table 3. Field experiment times and measured data.
No.Wheat PhenologyMeasured Data
1Zadoks 34Crop data: plant height, leaf area index, dry matter accumulation; soil data: moisture content
2Zadoks 55Crop data: plant height, leaf area index, dry matter accumulation
3Zadoks 65Crop data: plant height, leaf area index, dry matter accumulation
4Zadoks 75Crop data: plant height, leaf area index, dry matter accumulation, grain-filling parameters
5Zadoks 92Crop data: plant height, leaf area index, dry matter accumulation, grain yield and yield components
Note: Zadoks 34, jointing stage; Zadoks 55, heading stage; Zadoks 65, middle anthesis stage; Zadoks 75, milk stage; Zadoks 92, maturity stage.
Table 4. The logistic analysis for grain-filling parameters of wheat kernels with different irrigation treatments in 2020–2021, 2021–2022, and 2022–2023 in Yangling, China.
YearTreatmentR2ABCTmaxWmaxGmaxGaveAGP
(d)(g 1000-kernels)(g 1000-grains−1 d−1)(g 1000-grains−1 d−1)(d)
2020–2021RF0.999147.7219.570.141621.0023.861.68920.883742.37
W10.999350.9419.680.140521.2125.471.78880.935242.71
W20.999352.8719.760.139921.3326.441.84940.966342.88
W30.999454.1219.850.139821.3827.061.89080.987442.93
W40.999453.6119.720.139521.3826.801.86950.977143.01
2021–2022RF0.999445.5126.010.155420.9722.761.76770.891338.62
W10.999648.5826.600.155121.1524.291.88390.947238.68
W20.999650.4426.900.154921.2625.221.95300.980538.74
W30.999751.6727.140.154921.3225.832.00011.003138.75
W40.999751.1226.940.154621.3025.561.97590.991938.81
2022–2023RF0.998549.7115.800.131421.0024.851.63310.879245.66
W10.998852.9316.130.131621.1226.461.74190.935245.58
W20.999054.8616.340.131821.1927.431.80810.969145.51
W30.999156.0816.450.132121.2028.041.85240.991945.41
W40.999055.6116.330.131621.2227.811.82970.980745.59
Note: A, B, C represent equation coefficients; Tmax, the day of maximum grain-filling rate; Wmax, kernel weight increment achieving maximum grain-filling rate; Gmax, maximum grain-filling rate; Gave, average grain-filling rate; AGP, active grain-filling period.
Table 5. The parameters of the three grain-filling phases of wheat kernels with different irrigation treatments in 2020–2021, 2021–2022, and 2022–2023 in Yangling, China.
Gradual Increase Period (GIP)Rapid Increase Period (RIP)Slight Increase Period (SIP)
YearTreatmentT1W1G1T2W2G2T3W3G3
(d)(g)(g 1000-grains−1 d−1)(d)(g)(g 1000-grains−1 d−1)(d)(g)(g 1000-grains−1 d−1)
2020–2021RF11.707.760.663518.6027.551.481023.159.610.4149
W111.848.300.701318.7529.411.568423.3410.250.4394
W211.918.630.724118.8330.531.621623.4310.640.4543
W311.968.840.739318.8531.251.657923.4610.900.4645
W411.938.740.732418.8830.951.639123.5010.790.4592
2021–2022RF12.507.930.634816.9626.281.549921.109.160.4342
W112.668.510.671816.9828.051.651821.139.780.4628
W212.758.850.694017.0129.121.712321.1710.150.4797
W312.819.080.708817.0129.831.753721.1710.400.4913
W412.788.970.701917.0429.511.732421.2010.290.4854
2022–2023RF10.987.550.687120.0428.701.431924.9410.010.4012
W111.128.090.728120.0130.561.527324.9010.660.4279
W211.208.430.752619.9831.681.585324.8711.040.4442
W311.238.640.769319.9432.381.624124.8111.290.4550
W411.218.540.761820.0132.111.604324.9111.200.4495
Note: T1, grain-filling duration of gradual increase period; W1, increased grain weight of gradual increase period; G1, mean grain-filling rate of gradual increase period; T2, grain-filling duration of rapid increase period; W2, increased grain weight of rapid increase period; G2, mean grain-filling rate of rapid increase period; T3, grain-filling duration of slight increase period; W3, increased grain weight of slight increase period; G3, mean grain-filling rate of slight increase period.
Table 6. Variation trends of grain yield and its components of winter wheat in different irrigation treatments in 2020–2021, 2021–2022, and 2022–2023 in Yangling, China.
TreatmentsEffective Spikes
(m−2)
Grain Number Per Spike
(Grains Spike−1)
1000-Kernel Weight
(g)
Grain Yield
(t ha−1)
2020–2021
RF482.00 ± 13.73 e38.67 ± 0.72 d43.79 ± 0.25 d8.58 ± 0.08 d
W1601.84 ± 5.44 d44.84 ± 1.28 c46.77 ± 0.54 c9.91 ± 0.05 c
W2673.74 ± 7.83 c48.53 ± 0.47 b48.56 ± 0.42 b10.71 ± 0.33 b
W3721.67 ± 12.00 a51.00 ± 2.16 a49.75 ± 0.30 a11.24 ± 0.29 a
W4699.70 ± 7.32 b50.12 ± 0.72 ab49.26 ± 0.31 a10.97 ± 0.29 ab
2021–2022
RF469.00 ± 8.33 e36.03 ± 1.33 d42.71 ± 0.61 d8.40 ± 0.49 d
W1590.29 ± 7.83 d42.96 ± 1.34 c45.71 ± 0.48 c9.79 ± 0.32 c
W2663.06 ± 11.83 c47.11 ± 1.69 b47.50 ± 0.50 b10.62 ± 0.18 b
W3711.57 ± 10.71 a49.88 ± 1.57 a48.70 ± 0.21 a11.17 ± 0.33 a
W4689.78 ± 7.38 b48.89 ± 0.75 ab48.17 ± 0.57 ab10.89 ± 0.28 ab
2022–2023
RF507.67 ± 14.18 e40.46 ± 1.22 c44.80 ± 0.75 d9.02 ± 0.71 d
W1626.56 ± 9.23 d46.63 ± 1.92 b47.90 ± 0.72 c10.41 ± 0.41 c
W2697.89 ± 10.48 c50.33 ± 1.46 a49.76 ± 0.51 b11.24 ± 0.32 b
W3745.44 ± 11.11 a52.80 ± 0.97 a51.00 ± 0.45 a11.80 ± 0.40 a
W4723.22 ± 11.40 b51.87 ± 0.94 a50.50 ± 0.60 ab11.55 ± 0.28 ab
ANOVA analysis
Yearsnsns*ns
Treatments************
Years × Treatmentsnsnsnsns
Note: Values given are means ± SD. The mean values were compared by the one-way analysis of variance (ANOVA) at p < 0.05 followed by the Least Significant Difference (LSD) (p < 0.05). The different lowercase letters indicate statistical differences at p < 0.05, and the same lowercase letters indicate statistical differences at p > 0.05. * indicates significant difference among treatments at p < 0.05 level; *** indicates significant differences among treatments at p < 0.001 level; ns indicates no significant differences at p < 0.05 level.
Disclaimer/Publisher’s Note: The statements, opinions and data contained in all publications are solely those of the individual author(s) and contributor(s) and not of MDPI and/or the editor(s). MDPI and/or the editor(s) disclaim responsibility for any injury to people or property resulting from any ideas, methods, instructions or products referred to in the content.

