Article

Transcriptome and Metabolome Analyses Reveal the Physiological Variations of a Gradient-Pale-Green Leaf Mutant in Sorghum

Molecular Improvement Laboratory, Liaoning Academy of Agricultural Sciences, Shenyang 110161, China
*
Authors to whom correspondence should be addressed.
Agronomy 2025, 15(8), 1841; https://doi.org/10.3390/agronomy15081841
Submission received: 4 July 2025 / Revised: 28 July 2025 / Accepted: 28 July 2025 / Published: 30 July 2025
(This article belongs to the Section Plant-Crop Biology and Biochemistry)

Abstract

Sorghum is an important cereal crop. The maintenance of leaf color significantly influences sorghum growth and development. Although the mechanisms of leaf color mutation have been well studied in many plants, those in sorghum remain largely unclear. Here, we identified a sorghum gradient-pale-green leaf mutant (sbgpgl1) from the ethyl methanesulfonate (EMS) mutagenesis mutant library. Phenotypic, photosynthesis-related parameter, ion content, transcriptome, and metabolome analyses were performed on wild-type BTx623 and the sbgpgl1 mutant at the heading stage, revealing changes in several agronomic traits and physiological indicators. Compared with BTx623, sbgpgl1 showed less height, with a smaller length and width of leaf and panicle. The overall Chl a and Chl b contents in sbgpgl1 were lower than those in BTx623. The net photosynthetic rate, stomatal conductance, and transpiration rate were significantly reduced in sbgpgl1 compared to BTx623. The content of copper (Cu), zinc (Zn), and manganese (Mn) was considerably lower in sbgpgl1 leaves than in BTx623. A total of 4469 differentially expressed genes (DEGs) and 775 differentially accumulated metabolites (DAMs) were identified by RNA-seq and UPLC-MS/MS. The results showed that sbgpgl1 primarily influenced sorghum metabolism by regulating metabolic pathways and the biosynthesis of secondary metabolites, especially flavonoids and phenolic acids, resulting in the gradient-pale-green leaf phenotype. These findings reveal key genes and metabolites involved on a molecular basis in physiological variations of the sorghum leaf color mutant.

1. Introduction

Sorghum (Sorghum bicolor [L.] Moench) originated in Africa and is a widely cultivated crop with importance as feed, food, and renewable fuel and is used in the Baijiu industry in China [1,2,3]. Increasing sorghum biomass requires an integrated approach, such as the appropriate application of fertilizers (nitrogen, phosphorus, potassium, etc.) and the utilization of light and carbon dioxide [4,5,6]. Changes in leaf color are mainly related to the synthesis and metabolism of chlorophyll and normal chloroplast development, which ultimately affect plant growth and yield [7]. Chlorophylls (Chls), predominantly chlorophyll a (Chl a) and chlorophyll b (Chl b), are the most important components in plant photosynthesis and are present in core complexes and light-harvesting complexes (LHCs) [8,9]. Chls are characterized by different groups linked with an isocyclic “E” ring, and a central magnesium ion is bound with four central nitrogen atoms [10,11].
Leaf color controlling genes are usually associated with chlorophyll metabolism or chloroplast development. Magnesium chelatase (MgCH) is composed of three subunits, and the H subunit of MgCH (CHLH), encoded by GENOMES UNCOUPLED 5 (GUN5), catalyzes Mg2+ insertion into protoporphyrin [12,13]. A single-nucleotide substitution in SlGUN5 causes Chl deficiency and delayed fruit ripening [14]. The mut26 tomato mutant presents a yellow–green leaf phenotype, and massive relative genes are compromised during fruit ripening. OsbHLH156 colocalizes with IRO2 in the nucleus to regulate iron absorption, and the osbhlh156 mutant exhibits an Fe-deficient light-green phenotype [15]. OsbHLH156 is a rice transcription factor involved in Strategy II Fe acquisition, and Fe deficiency could cause a yellow stripe phenotype in rice. OsPGL1 encodes a chloroplast-targeted signal recognition particle, cpSPR54, which might ensure the correct assembly of PSI complexes [16]. The expression of various photosynthesis-related proteins is reduced in ospgl1, resulting in a pale-green leaf phenotype. Other genes, such as HEMA, PORA, PORB, and PORC, also play roles in maintaining chloroplast morphology and are essential for plant growth [17,18].
In addition to photosynthesis-related genes, plant hormones participate in regulating the chlorophyll cycle or chloroplast development. Auxin plays a negative regulatory role in chlorophyll biosynthesis. The yuc2 yuc6 double mutant in Arabidopsis maintains a greener leaf color upon exposure to auxin, which generally inhibits chlorophyll accumulation in seedlings during de-etiolation [19]. Cytokinin could maintain the Chl a/b ratio in rice, improving the stability of photosynthetic complexes [20]. The Chl transcript levels in 6-benzyl adenine (BA)-treated N22 samples are increased by cytokinin degradation. Moreover, cytokinin-deficient oilseed rape exhibits enrichment of leaf mineral elements and increased chlorophyll concentration under nutrient-limited conditions [21]. In addition, exogenous gibberellin facilitates the regreening progress in Valencia oranges [22]. Gibberellic acid (GA) increases chlorophyll content and accumulation at the transcript level but decreases carotenoid content.
Variations in leaf color also lead to changes in metabolites. For example, malvidin-, pelargonidin-, and cyanidin-based anthocyanins contribute to color formation in ramie [23]. Flavonoid metabolites, such as malvidin 3-O-glucoside, cyanidin, naringenin, and dihydromyricetin, cause a color shift from bright-purplish red to brownish green in Populus [24]. Additionally, in sorghum, RL1 causes red pigments to accumulate in mesophyll cells, associated with abundant flavonoids and chloroplast degradation [25]. While the genetic basis of leaf color has been extensively characterized in numerous plant species, the underlying mechanisms in sorghum are still poorly understood. In this study, we obtained a novel sorghum leaf color mutant. The basal leaves of the mutant exhibited coloration comparable to the wild type, whereas the upper leaves present a distinct pale-green phenotype. We designate this mutant as the ‘gradient-pale-green mutant’, sbgpgl1. sbgpgl1 shows reduced pigment content as well as mineral element reductions. Transcriptome and metabolome analyses revealed several genes and metabolites related to the pale-green leaf, which provide a basis for photosynthesis-related regulatory mechanisms in sorghum.

2. Materials and Methods

2.1. Plant Materials and Growth Conditions

Plant material acquisition has been reported in a previous study [26]. The gradient-pale-green leaf mutant sbgpgl1, with a stably inherited phenotype, was generated from the BTx623 background ethyl methanesulfonate (EMS) mutagenesis mutant library. The pot and field experiments were conducted in Shenyang, Liaoning Province, China. Pots (30 cm in diameter and 30 cm in height) were filled with 10 kg of sun-dried soil obtained from nearby farmland.

2.2. Measurement of Agronomic Traits and Chlorophyll Content

BTx623 and sbgpgl1 plants were randomly selected at the heading stage for agronomic trait determination. Chl content was measured according to previously described methods [27]. Approximately 0.5 g of fresh leaves were collected, and 15 mL of 95% ethanol was added. The mixtures were maintained at 4 °C for 24 h in the dark to extract the chlorophyll. The extractions were diluted, and the absorbance values were measured at 665, 649, and 470 nm.

2.3. Measurement of Photosynthesis-Related Parameters

The net photosynthetic rate (PN), stomatal conductance (gs), and transpiration rate (Tr) of BTx623 and sbgpgl1 were measured using an in-chamber quantum sensor (PAR) of 1000 μmol m−2 s−1 with LI-6400 between 09:30 and 11:30 in the morning, with ten replicates for each line.

2.4. Total Nitrogen, Phosphorus, Potassium, and Mineral Element Content Measurement

The flag and second leaves of BTx623 and sbgpgl1 plants were collected and dried to a constant weight at the heading stage as described in a previous study [28]. In brief, approximately 0.1 g of dry samples were weighed and digested using HNO3 and H2O2 in a microwave digestor (MICROWAVE6000, ANTON-PAAR, Graz, Austria). The mineral element contents were measured using ICP-OES (Optima 8000 DV, PerkinElmer, Waltham, MA, USA), and the total N, P, and K contents were measured using a SAN++ continuous flow analyzer (SKALAR, Breda, The Netherlands).

2.5. RNA-Seq Analysis

The flag leaves of BTx623 and sbgpgl1 plants were collected, and three biological replicates were created. After extracting total RNA, a cDNA library was constructed and sequenced using the Illumina platform to obtain raw data, which was then filtered to obtain clean data. Clean reads were mapped to the reference genome of Sorghum bicolor v3.1.1, which was obtained from Phytozome v13 (https://phytozome-next.jgi.doe.gov/). Fragments per Kilobase of transcript per Million fragments mapped (FPKM) were calculated to quantify gene expression levels, and DESeq2 was used to screen differentially expressed genes (DEGs) between BTx623 and sbgpgl1 with a |log2fold change (FC)| ≥ 1 and false discovery rate (FDR) < 0.05. Gene Ontology (GO, https://www.geneontology.org/) and Kyoto Encyclopedia of Genes and Genomes (KEGG, https://www.genome.jp/kegg/) were searched for DEG enrichment analysis.

2.6. Widely Targeted Metabolome Analysis

Widely targeted metabolome analysis of BTx623 and sbgpgl1 was performed by Metware Biotechnology (Wuhan, China). Briefly, 0.05 g of the dried sample was added to 1.2 mL of −20 °C pre-cooled 70% methanolic aqueous internal standard extract and vortexed for 30 s every 30 min a total of six times. The supernatants were filtered and analyzed by UPLC-MS/MS after centrifugation. Differentially accumulated metabolites (DAMs) were determined by variable importance in projection (VIP) based on orthogonal partial least squares discriminant analysis (OPLS-DA), with |log2FC| ≥ 1 and VIP ≥ 1. Based on the DAMs and KEGG enrichment analysis of DEGs, we conducted integrated analysis of the sbgpgl1 mutant.

2.7. Data Statistics

The data were statistically analyzed by a t-test and one-way ANOVA with Tukey’s honestly significant difference (HSD) test using SPSS 26.0, and p < 0.05 was considered to show significance between groups. For the graphs, GraphPad Prism 9.3 was used. All the experiments were conducted from May 2023 to October 2024.

3. Results

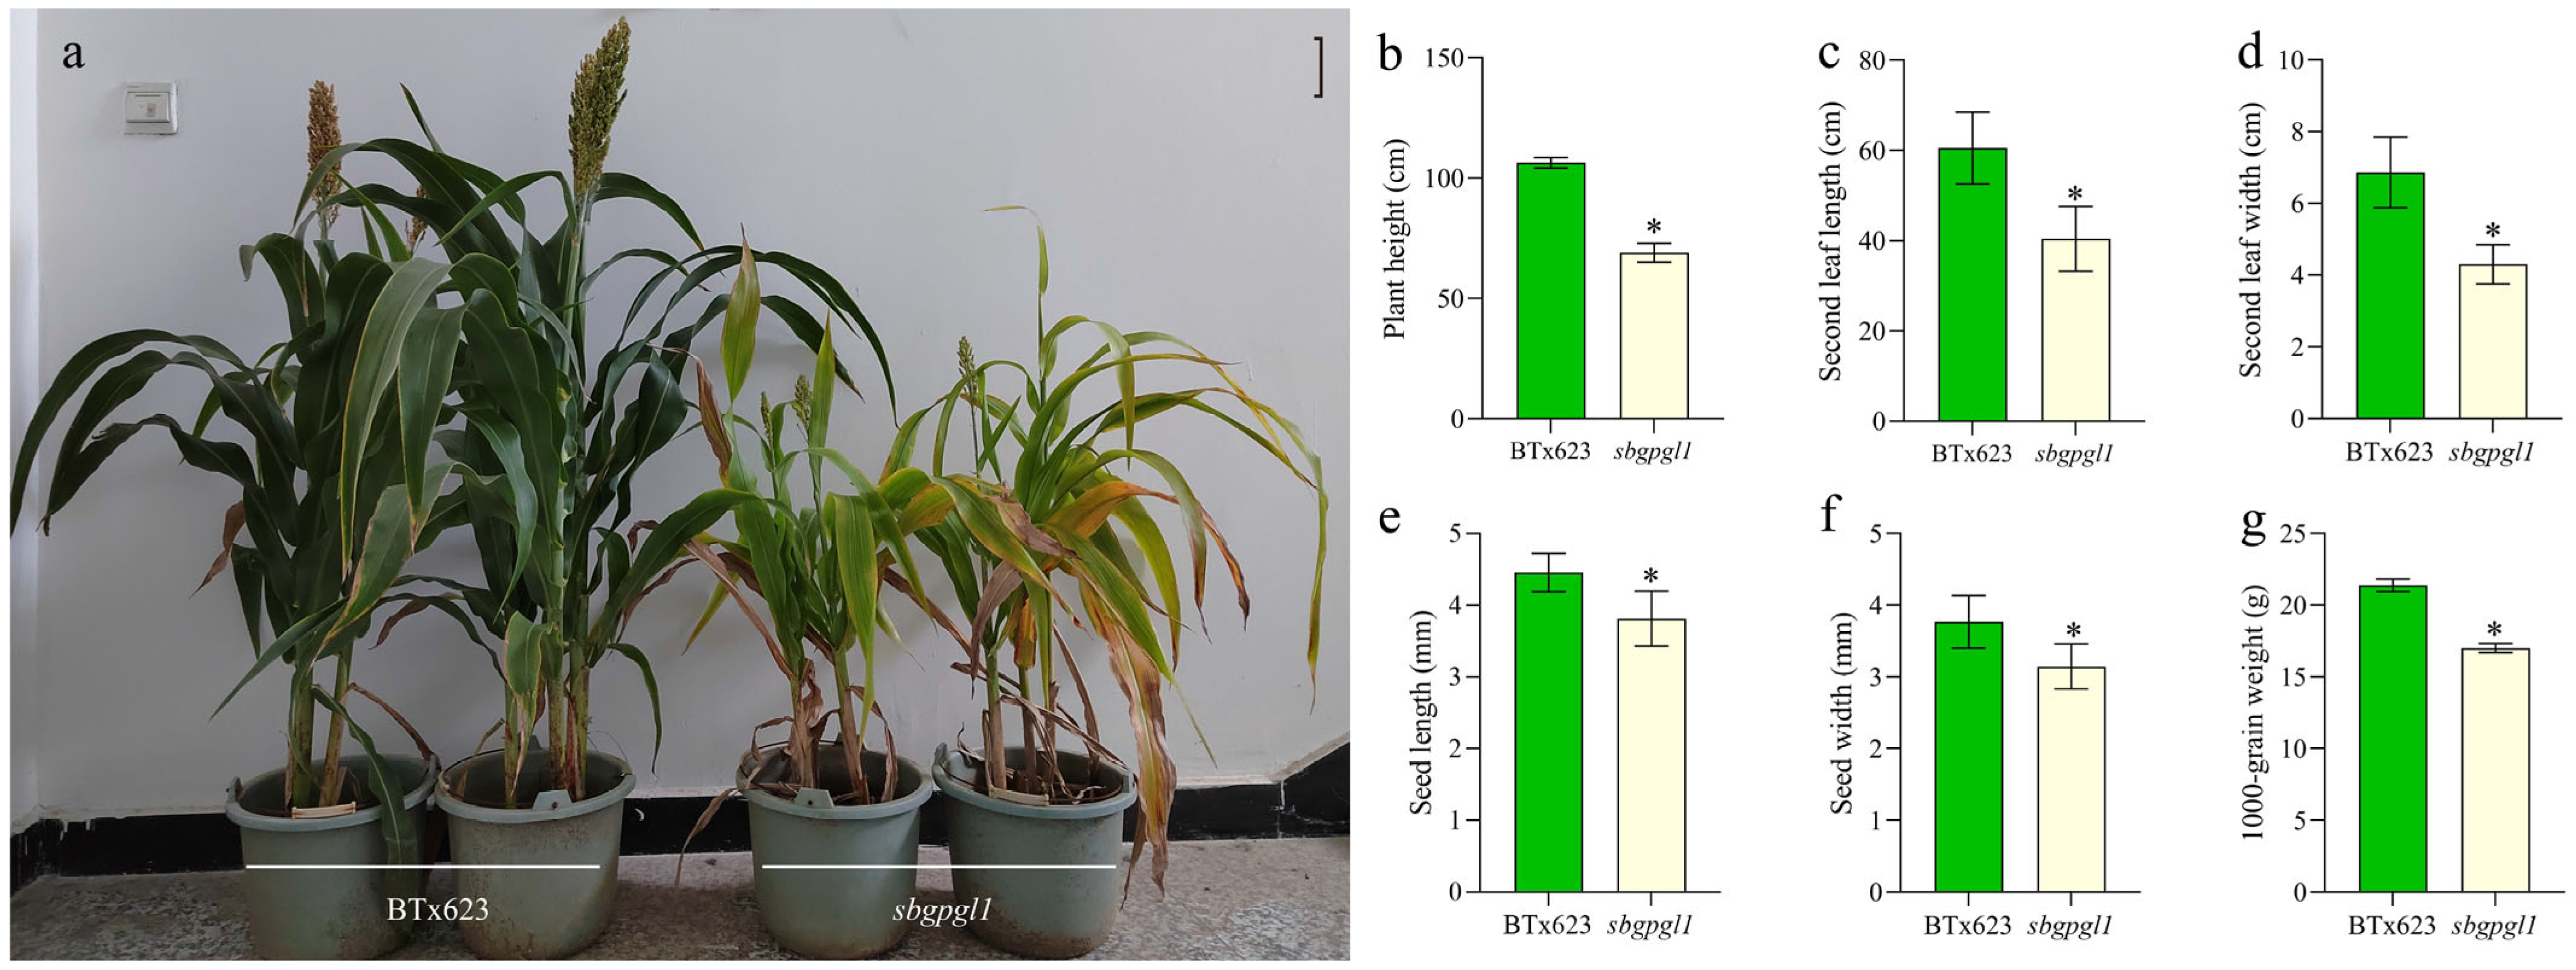
3.1. Phenotypic Characterization of sbgpgl1 Mutant

The sorghum gradient-pale-green leaf mutant sbgpgl1 was identified in an EMS mutagenesis screen and confirmed to be stably inherited over several generations of breeding. The leaves of sbgpgl1 became lighter than those of BTx623 in the field at the heading stage (Figure S1a,b). In the pot experiment, sbgpgl1 presented more obvious pale-green leaves (Figure 1a).
Several agronomic trait parameters of the sbgpgl1 mutant were significantly reduced compared with those of wild-type BTx623 (Figure 1b–d). Specifically, the average plant heights of BTx623 and sbgpgl1 were 106.4 cm and 69.0 cm, respectively. The second leaf length of sbgpgl1 was shorter than that of BTx623, with an average of 60.55 cm and 40.4 cm. Similarly, the average width of the sbgpgl1 second leaf was 4.3 cm, shorter than that of BTx623. The average panicle length and width of BTx623 were 23.0 cm and 4.8 cm, respectively, whereas those of sbgpgl1 were 13.0 cm and 3.7 cm, respectively (Figure S1c,d). The seed length, seed width, and 1000-grain weight of sbgpgl1 were also significantly lower than those of BTx623 (Figure 1e–g and Figure S1e). Taken together, these results suggested that the sbgpgl1 pale-green leaf mutant also shows changed agronomic traits, highly likely to affect sorghum yield.

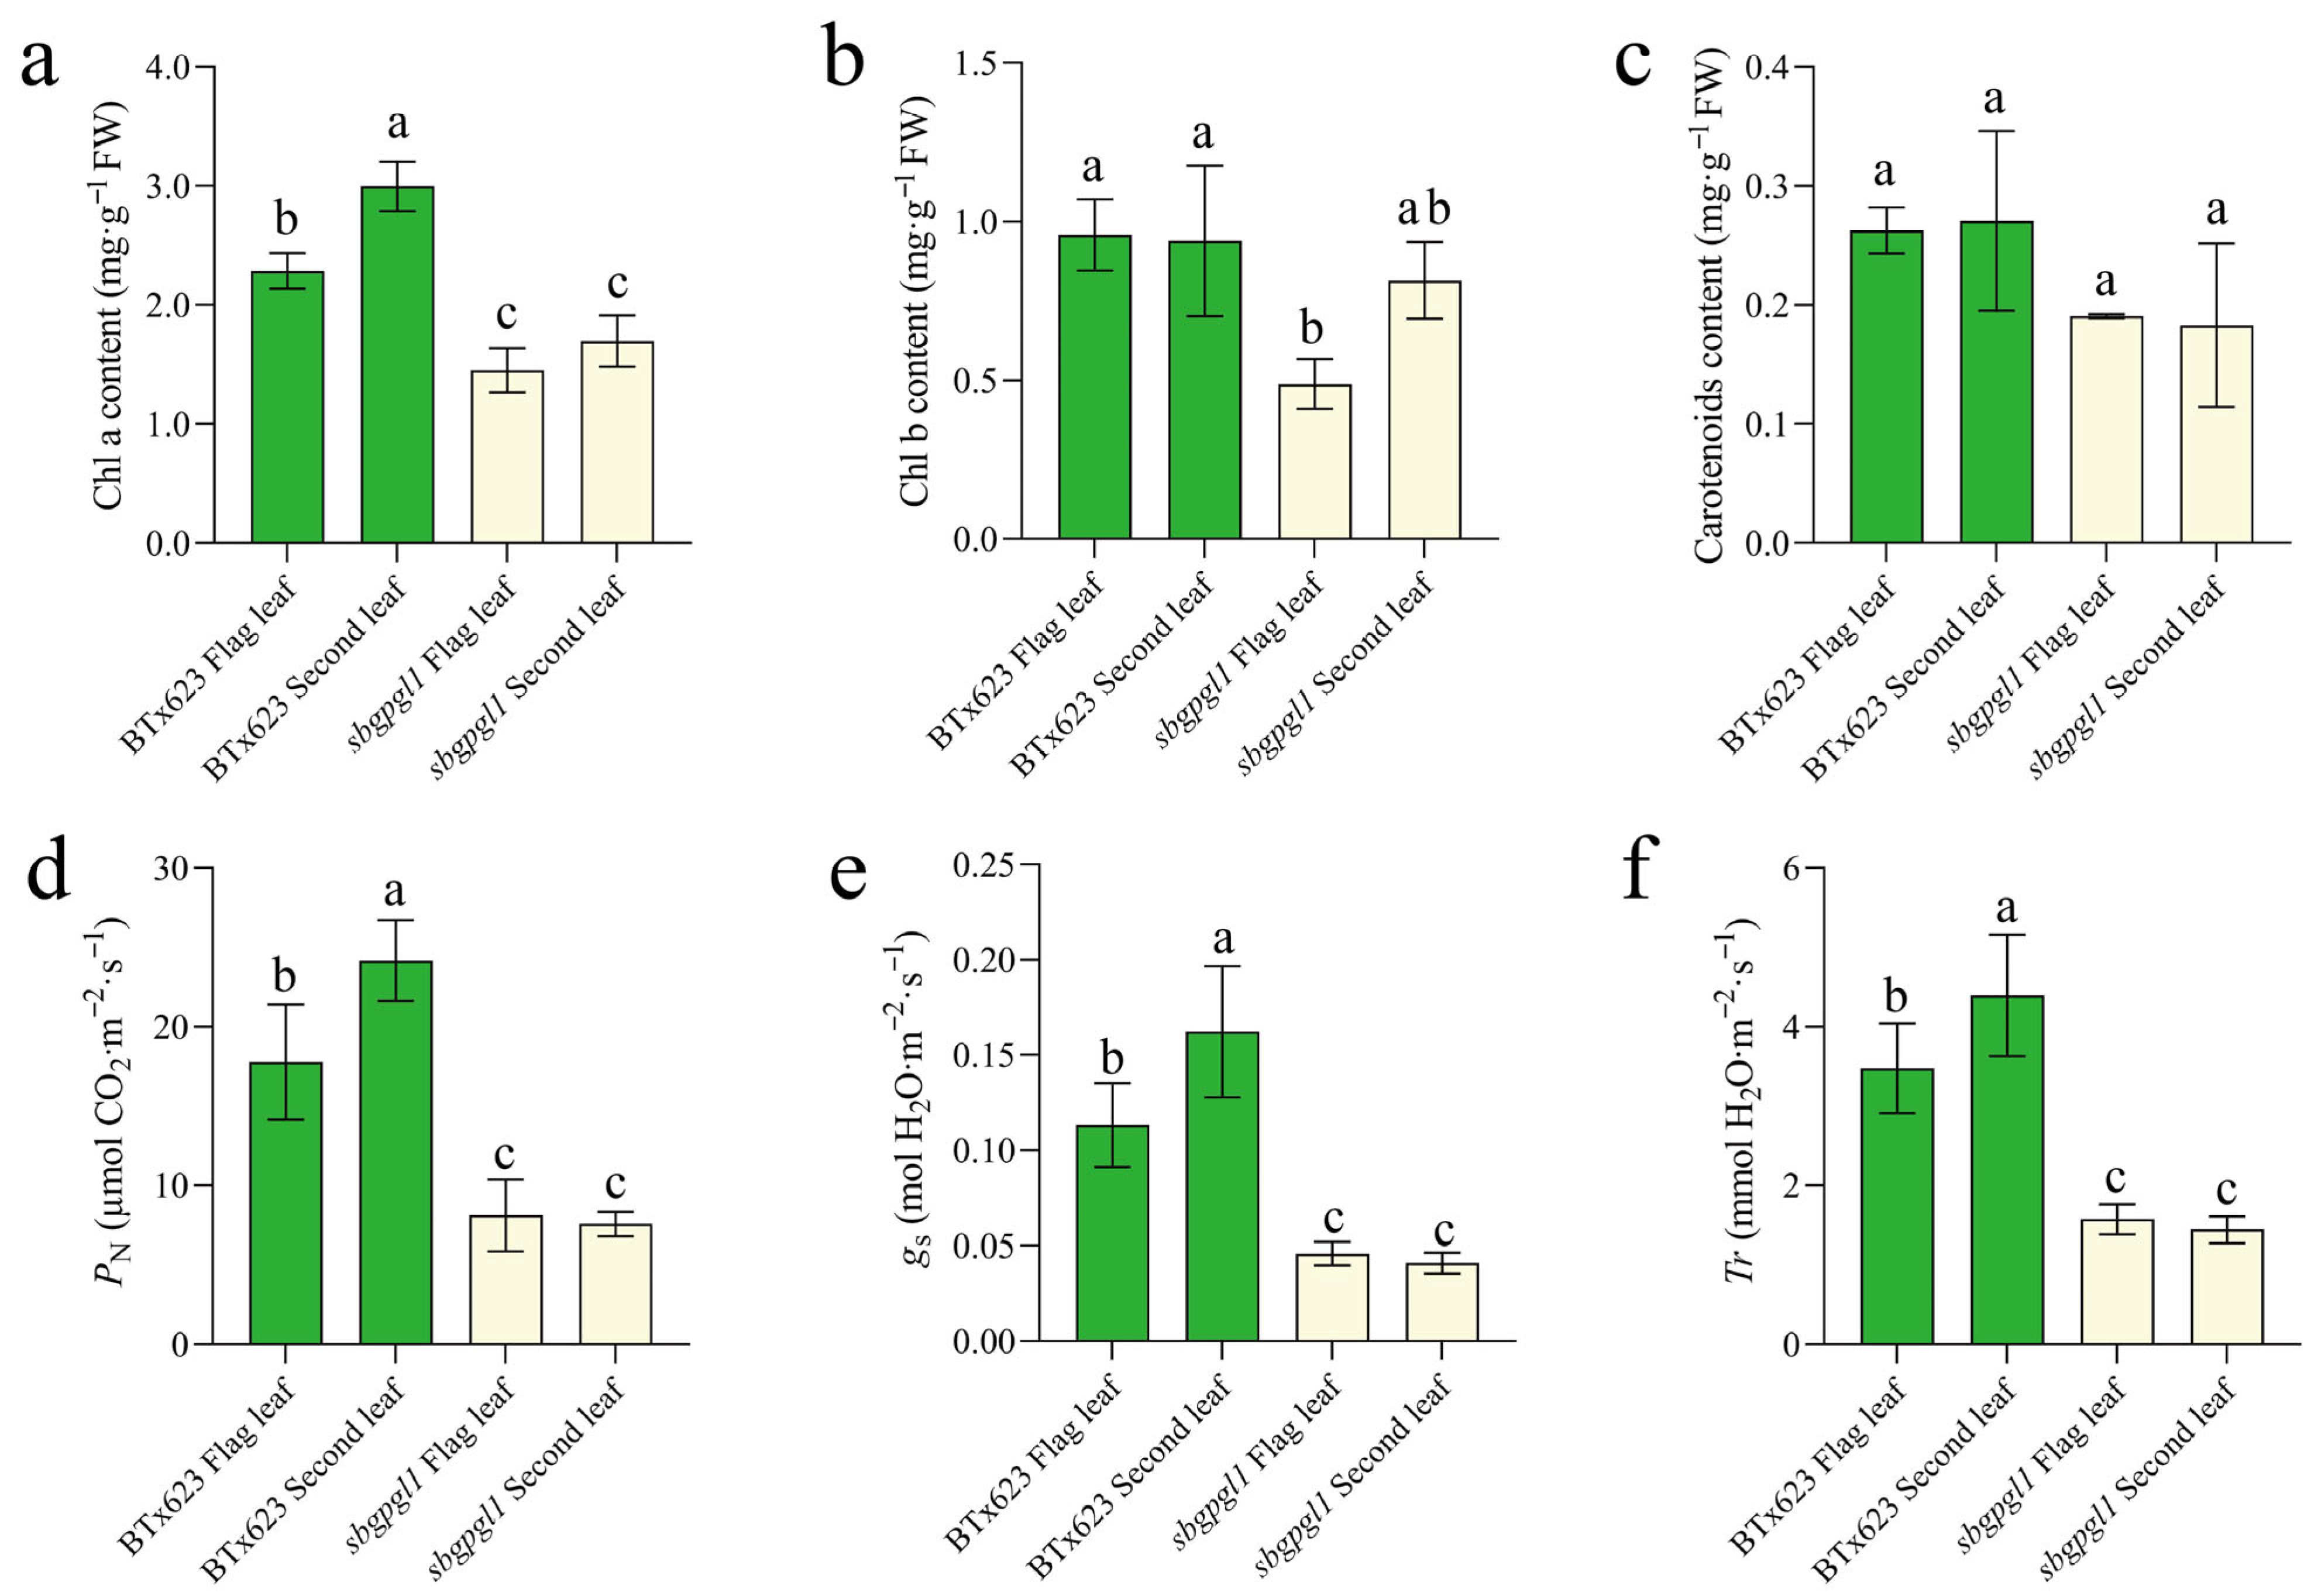
3.2. Chlorophyll Content and Photosynthesis Reduced in sbgpgl1 Mutant

To investigate the effects of the sbgpgl1 leaf color mutation on photosynthesis, we analyzed the chlorophyll content and photosynthesis-related parameters. In general, the contents of total Chl a and Chl b were significantly lower in sbgpgl1 than in BTx623. The Chl a content of the flag leaf and second leaf in sbgpgl1 were 36.68% and 43.33% lower than those in BTx623, respectively (Figure 2a). The Chl b content of the flag leaf in sbgpgl1 was 48.96% lower than that of BTx623, but no significant difference in Chl b was observed in the second leaf (Figure 2b). Additionally, there were no significant differences in carotenoid levels between sbgpgl1 and BTx623 (Figure 2c). These findings suggested that the pale-green leaf phenotype of sbgpgl1 was mainly due to the decrease in Chl a content.
Compared with BTx623, the average PN of sbgpgl1 was 8.13 µmol CO2·m−2·s−1 in the flag leaf and 7.57 µmol CO2·m−2·s−1 in the second leaf, with a decrease of 54.22% and 68.68%, respectively (Figure 2d). Similarly, the average gs and Tr in sbgpgl1 had an obvious reduction in the flag leaf and the second leaf (Figure 2e,f). Our results suggested that sbgpgl1 reduced photosynthesis-related parameters.

3.3. Mineral Element Content Analysis of sbgpgl1 Leaves

To evaluate whether the sbgpgl1 phenotype is related to the mineral element content, we determined the contents of total N, P, K, and some mineral elements in both BTx623 and sbgpgl1.
Among them, no differences were measured in the contents of P, Mg, and Fe between BTx623 and sbgpgl1 in either the flag leaf or second leaf (Figure S2a,c,f). The K content in the BTx623 flag leaf was lower than that in the others (Figure S2b), while the total N content of sbgpgl1 was lower than that of BTx623 (Figure 3a). The Ca content in sbgpgl1 leaves was also lower than that in BTx623 leaves, presenting a decrease of approximately 50% (Figure 3b). In addition, the total contents of Cu, Zn, and Mn of sbgpgl1 were significantly reduced compared to BTx623 (Figure 3c,d and Figure S2e). The contents of Cu and Mn in BTx623 leaves were about four to five times higher than those in sbgpgl1 leaves. Our results indicated that sbgpgl1 might affect N, Cu, and Mn transportation.

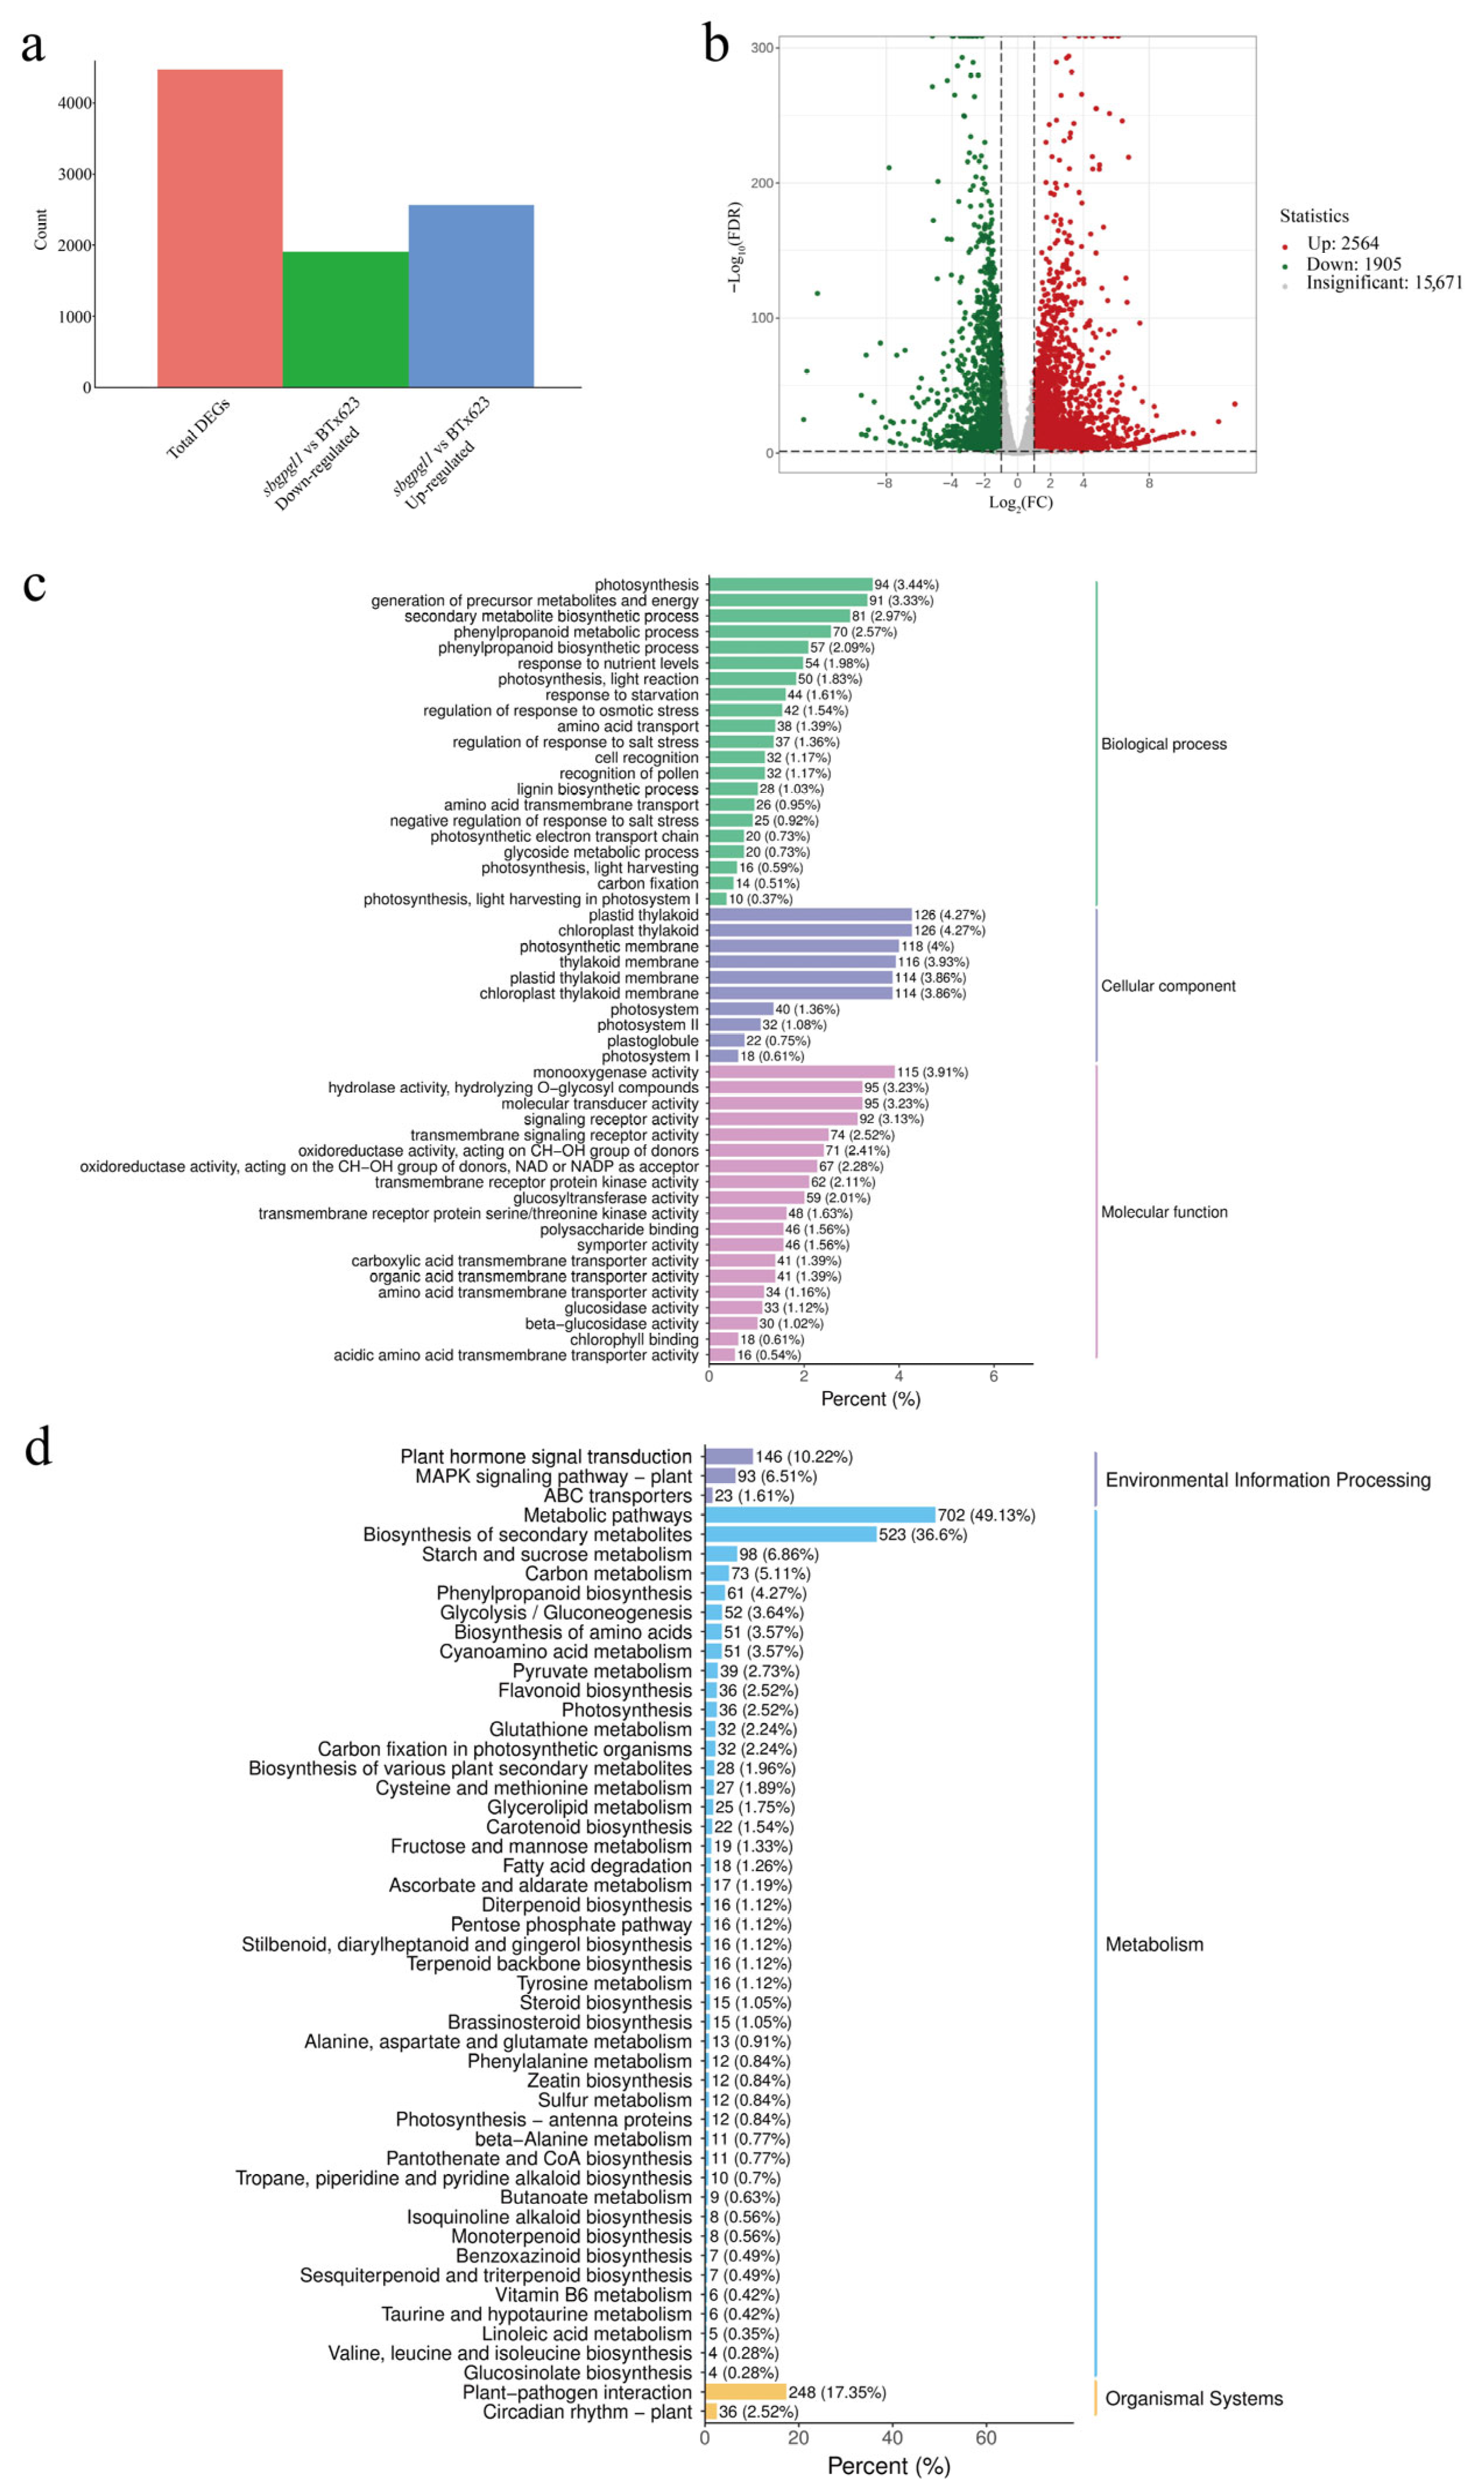
3.4. Transcriptome Analysis of sbgpgl1 Compared with BTx623

To further investigate the potential molecular mechanisms underlying the pale-green leaf phenotype of sbgpgl1, transcriptome analysis was performed. In total, six groups were generated, and 315,981,882 raw reads were sequenced for sbgpgl1 and BTx623 (Table S1). An average of 7.8 G and 7.7G clean bases for each group remained. The Q20, Q30, and GC content values of the clean reads were 97.83–98.19%, 93.76–94.60%, and 51.36–51.97%, respectively. Clean reads were then mapped to the sorghum reference genome, with mapping percentages between 98.27 and 98.53%, among which 93.96–94.91% were uniquely mapped. These results indicated that the RNA-seq results were reliable and the selected genome was appropriate. Correlation analysis and principal component analysis (PCA) indicated great biological repeatability and both sbgpgl1 and BTx623 clustered in their respective groups (Figure S3).
The gene expression patterns of sbgpgl1 and BTx623 were analyzed, and a total of 4469 DEGs were identified, with 2564 upregulated and 1905 downregulated (Figure 4a,b). DEGs could be classified into three GO ontologies: biological process (BP), cellular component (CC), and molecular function (MF) (Figure S4). DEGs were mostly clustered in the photosynthesis-related process in the BP group, showing a total of 201 photosynthesis-related identified DEGs, with 192 downregulated and 9 upregulated (Figure 4c). Downregulated DEGs were described in the light reaction, light-harvesting, and photosynthetic electron transport chains. In the CC group, plastid thylakoid and chloroplast thylakoid related were the most enriched terms, and chlorophyll binding terms in the MF group were mostly downregulated.
Meanwhile, KEGG analysis revealed that DEGs were particularly enriched in the plant hormone signal transduction, plant MAPK signaling, metabolic, secondary metabolite biosynthesis, starch and sucrose metabolism, carbon metabolism, and plant pathogen interaction pathways (Figure 4d). Notably, the photosynthesis-related pathways were all downregulated. Transcriptomic GO and KEGG results suggested that photosynthesis, especially the chloroplast membrane system and secondary metabolites, were the main factors involved in the sbgpgl1 pale-green leaf phenotype.

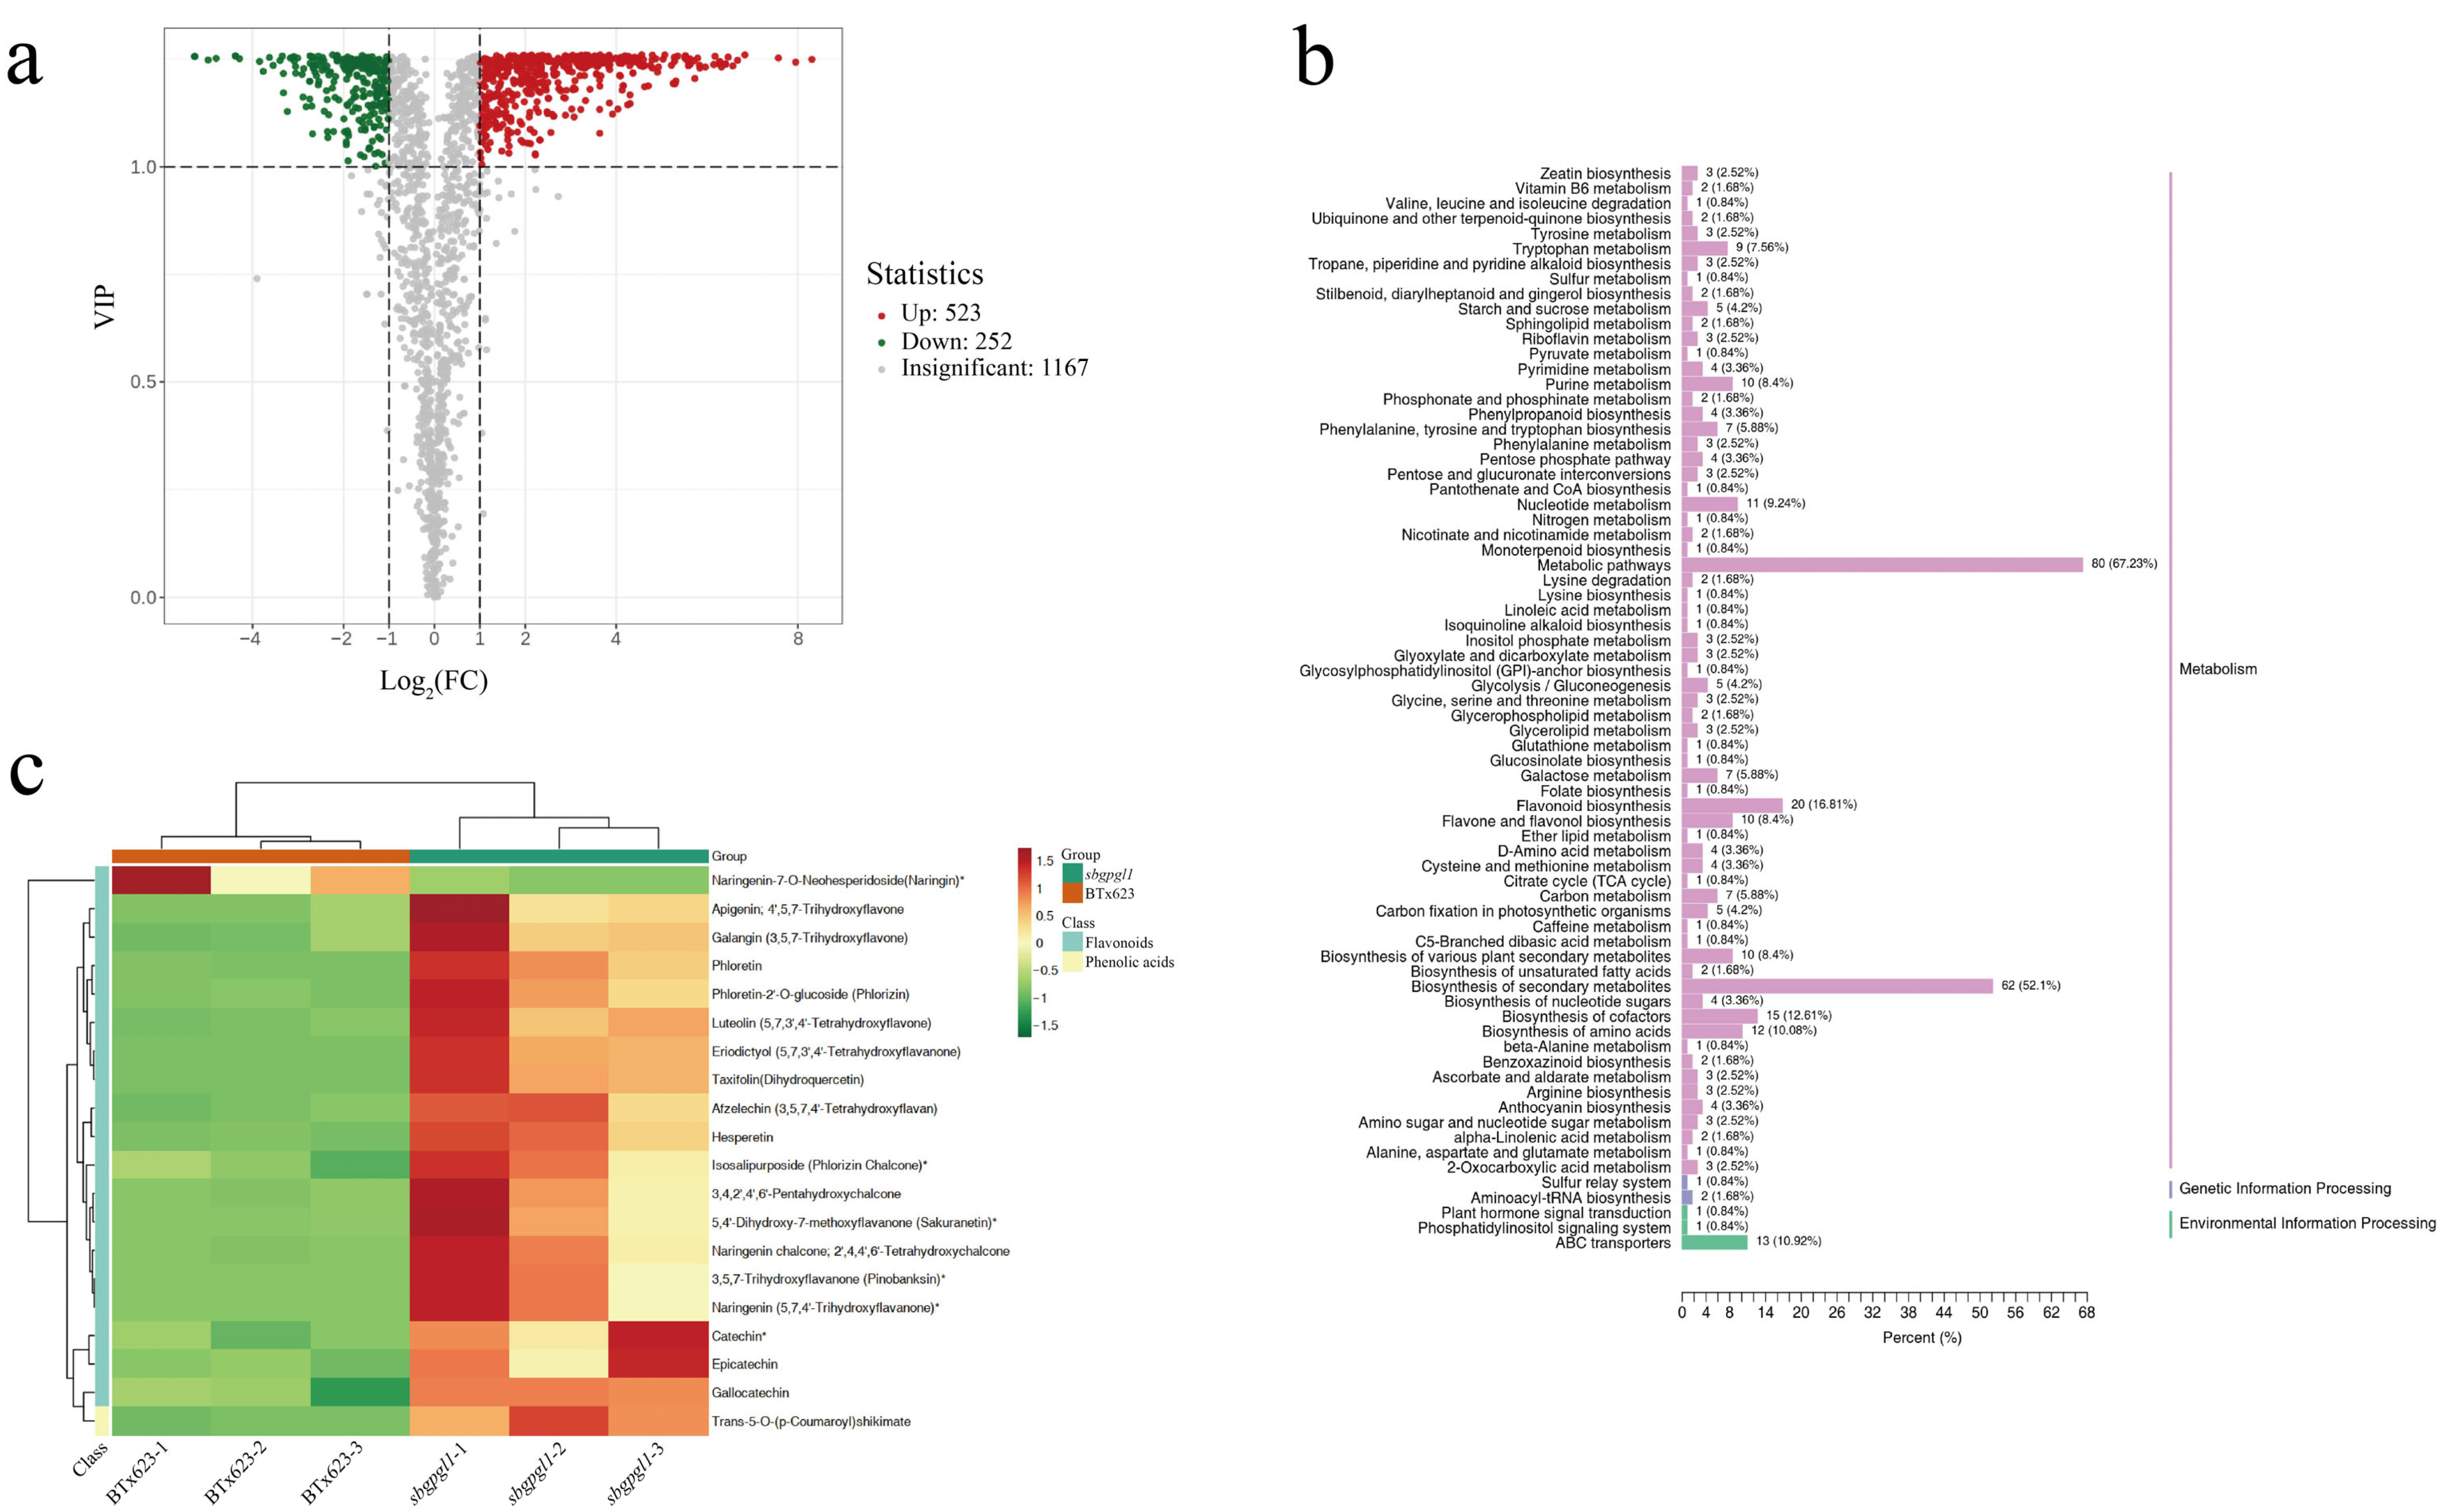
3.5. Metabolome Analysis of sbgpgl1 Compared with BTx623

To clarify the secondary metabolites involved in sbgpgl1 leaf color, widely targeted metabolome analysis was conducted. The BTx623 and sbgpgl1 groups were separated in correlation analysis, PCA, and orthogonal partial least squares discriminant analysis (OPLS-DA), indicating great repeatability for all samples (Figure S5). Overall, 1942 metabolites were detected, among which flavonoids and phenolic acids were the two most abundant metabolites, accounting for 31.41%, and 15.86%, respectively (Figure S5). Further analysis identified 775 DAMs, with 523 upregulated and 252 downregulated (Figure 5a).
In total, 72 metabolic KEGG pathways were annotated, of which metabolic pathways, biosynthesis of secondary metabolites, and flavonoid biosynthesis were the most enriched (Figure 5b). In addition, flavone and flavonol biosynthesis and biosynthesis of various plant secondary metabolites were significantly annotated in KEGG.
The flavonoid and phenolic acid KEGG heatmaps indicated that the levels of 18 compounds were significantly different in the sbgpgl1 and BTx623 groups, including naringenin chalcone (2′,4,4′,6′-tetrahydroxychalcone), phloretin, taxifolin (dihydroquercetin), naringenin (5,7,4′-trihydroxyflavanone), and 3,5,7-trihydroxyflavanone (pinobanksin) (Figure 5c and Table S3). In addition, jasmonoyl-L-isoleucine and L-glutamine were DAMs in plant hormone signal transduction and nitrogen metabolism pathways, respectively. The results of the metabolome analysis were consistent with our transcriptome results.

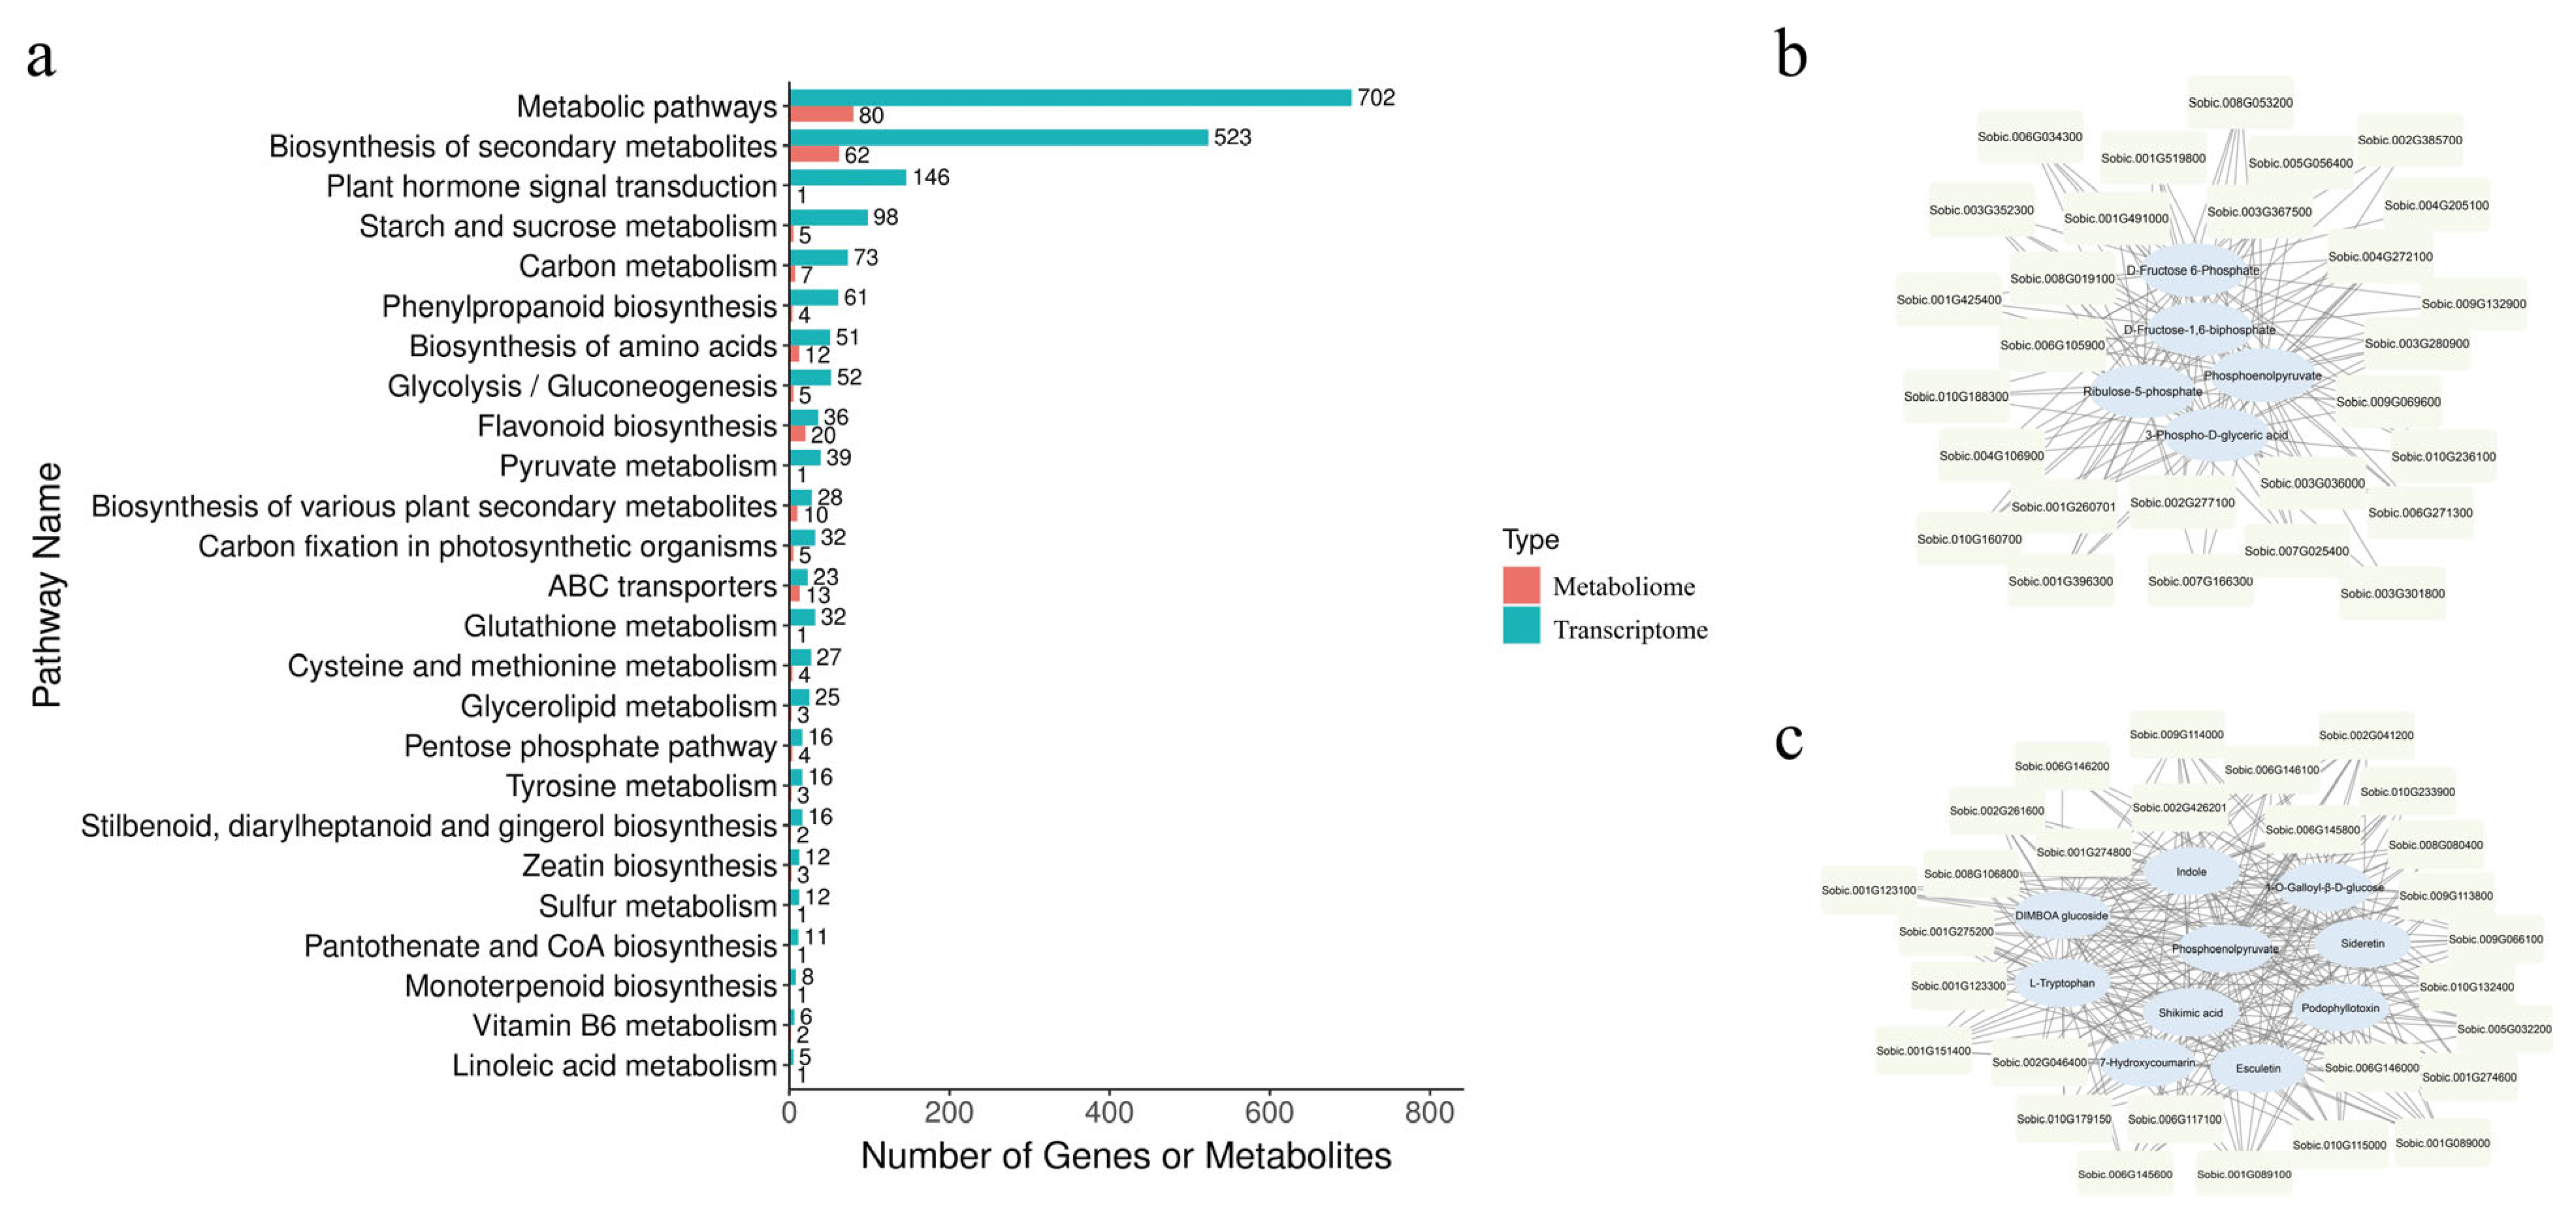
3.6. Integrated Transcriptome and Metabolome Analyses of sbgpgl1 Mutant

We then conducted conjoint analysis using the DEGs and DAMs annotated above. The KEGG of the conjoint analysis showed similarity to that of the transcriptome and metabolome analyses, including metabolic pathways, biosynthesis of secondary metabolites, plant hormone signal transduction, starch and sucrose metabolism, and carbon metabolism (Figure 6a).
In particular, five DAMs related to photosynthetic organisms, 3-phospho-D-glyceric acid, D-fructose 6-phosphate, D-fructose-1,6-biphosphate, phosphoenolpyruvate, and ribulose-5-phosphate, which were annotated in the carbon metabolism KEGG pathway, were detected (Figure 6b). Another ten metabolites were clustered in biosynthesis of various plant secondary metabolites such as esculetin (6,7-dihydroxycoumarin), DIMBOA glucoside, L-tryptophan, and phosphoenolpyruvate (Figure 6c). The conjoint analysis indicated that the DEGs and DAMs related to photosynthesis pathways and carbon fixation in photosynthetic organism pathways affected flavonoid, flavone, and flavonol biosynthesis, causing a pale-green leaf phenotype in sbgpgl1.

4. Discussion

4.1. sbgpgl1 Showed Reduced Chlorophyll Pigment Content and Agronomic Trait Parameters

Sorghum is one of the top five cereal crops in the world but has a declining planting area; however, it still plays an important role in feed crops and cash crops [29]. Several studies have shown that leaf color mutants exhibit reduced photosynthesis and agronomic traits, which might ultimately lead to a decline in grain yield and quality in different plants [30,31,32,33,34]. For example, a non-synonymous change in chlorophyllide a oxygenase 1 (pgl, LOC_Os10g41780) in rice resulted in premature senescence, a decreased photosynthesis rate, and reduced grain yield and quality. Similarly, rice yellow–green leaf 19 (ygl19, LOC_Os03g21370) was mainly expressed in leaf organs, and the YGL19 protein was localized in the chloroplast, showing reduced plant height, tiller number per plant, and total number of grains per plant. A chlorophyll-deficient (Chl-deficient) “yellow” soybean mutant (MinnGold) was isolated from two green varieties, with large differences in Chl content and total biomass production. Additionally, leaf mutants in Cucumis melo L. and ornamental crabapple presented decreased Chl content and chloroplast development. In this study, a pale-green leaf mutant sbgpgl1 of sorghum was compared with BTx623. The mutant sbgpgl1 presented a pale leaf color in the field and in the pot, where the lower leaves appear normal, while the upper leaves exhibited as pale green. As there are very few reports of pale-green leaf mutants in sorghum, it is likely that the genes in sbgpgl1 regulating leaf color might be different from the identified genes.
The Chl content of sbgpgl1 reduced significantly, caused by the change in leaf color. Decreases in Chl content are usually accompanied by changes in the chloroplast microstructure, such as the disorder of thylakoid structure and the loss of grana structure [16,35]. For example, cpSRP54 affected the assembly and integration of LHCs in the PSI core complex in rice; the chloroplasts in the mutant were smaller and contained fewer stroma lamellae. Similarly, the pgl-sd mutant in maize presented pale-green leaves at later growth stages, with irregular shapes and small granal stacks of mesophyll cells in chloroplasts. These changes also caused the leaf color mutants to have different light utilization efficiency [36]. Under high light treatment, a pgl mutant of rice had higher chlorophyll synthesis and solar conversion efficiency, while the wild-type plants were inhibited under high light treatment. In our previous study of sbgpgl1, we conducted transmission electron microscopy (TEM) experiments to observe the differences in chloroplast morphology between sbgpgl1 and BTx623, which indicated that sbgpgl1 presented abnormal chloroplast development and loosely arranged thylakoids [37]. Our study revealed that compared with the BTx623, sbgpgl1 led to reduced agronomic trait parameters and might finally affect the yield of sorghum.

4.2. sbgpgl1 Mutant Presented Reduced Photosynthesis and Mineral Element Contents

Maintaining the greenness of leaves has a great effect on the growth and development of plants, and studies have shown that the pale-green leaf phenotype of sbgpgl1 affects the intensity of photosynthesis. Previous results revealed that the PN of the ygl19 mutant was significantly lower than that of the wild type [34]. Similarly, in soybean, the yellow–green leaf mutant jym165 possessed abnormal chloroplasts, with decreased PN and starch contents compared with those of Jiyu47 [38]. Compared with those of BTx623, the PN of sbgpgl1 was decreased and the gs and Tr were also significantly decreased, ultimately leading to restriction of sbgpgl1 growth and development.
Usually, iron (Fe) and magnesium (Mg) are two vital micronutrients affecting plant growth and development, especially photosynthesis, respiration, and amino acid biosynthesis [39,40,41,42]. OE-PbbHLH155 in Arabidopsis lines exhibited greener leaf color and higher Fe content. The expression of MeChlD was related to Mg-protoporphyrin IX in biosynthesis, which affected chlorophyll biosynthesis, photosynthesis, and starch metabolism in cassava. It is also reported that Mg can promote N uptake and nitrogen-use efficiency [43]. In red-pigmented lettuce (Lactuca sativa L.) cultivars, leaf mineral concentrations differ significantly within the same cultivar, except for Cu [44]. However, the contents of Fe and Mg show no significant differences between sbgpgl1 and BTx623 (Figure S2c,f), indicating a different mechanism causing pale-green leaf. It is interesting that the sbgpgl1 flag leaf total K content is increased compared with BTx623 (Figure S2b), but the underlying mechanisms require further study. Our results revealed that mineral elements in sbgpgl1, such as Zn and Mn, were reduced compared with BTx623, which might also lead to the leaf color change and might affect the growth and development of sbgpgl1.

4.3. DEGs and DAMs Showed Potential Mechanisms of Pale-Green Leaf in sbgpgl1

Previous studies have reported the transcriptomic features of leaf color changes and photosynthesis in plants [45,46]. In Liquidambar formosana Hance, six DEGs identified (CHS, CHI, F3′H, DFR, ANS, and FLS) were related to anthocyanin biosynthesis. In a ygl mutant of Chinese cabbage, key genes related to carbon fixation, starch syntheses, and sugar metabolism pathways were upregulated.
Electrons are transferred from PSII to PSI by intersystem electron carriers, like flavonoid 3′, 5′-hydroxylase (F3′5′H) and cytochrome b5 isoform D, resulting in flower petals in petunia and an obligate electron shuttle intermediate, respectively [47,48,49]. In total, 19 downregulated genes were annotated in the photosynthetic electron transport chain in our study, including Sobic.010G000500, Sobic.009G143100, Sobic.007G004800, Sobic.003G168700, and Sobic.003G168600, which might be involved in photosynthesis and the mineral contents. LHC superfamily proteins play a vital role in photosynthesis [8,9]. LHCI influenced the efficiency of energy transferring in Arabidopsis, and in albino tea plant, a lower accumulation of CsLHCB1 and CsLHCB5 had a Chl influence [50,51]. In our study, LHC-related DEGs were also downregulated, such as Sobic.003G209900, Sobic.010G189300, Sobic.005G087000, Sobic.002G338000, and Sobic.002G159100.
DAMs in flavonoid metabolic pathways, especially the anthocyanin pathway, reflected increased anthocyanin content, resulting in the differences between HX_1 and ZZ_1 in ramie [23]. Additionally, in Brassica napus, anthocyanins may play important roles in deepening the color of leaves [52]. Recently, in wild rice and cultivated rice, the MYB transcription factor OsC1 was determined to regulate cyanidin-3-Galc, cyanidin 3-O-rutinoside, and cyanidin O-syringic acid [53]. In our study, several flavonoids, flavones, and flavonols, such as naringenin chalcone, were detected as DAMs and were mostly upregulated (Table S3). The fruit rinds of yellow casaba muskmelons accumulated naringenin chalcone, negatively regulated by the CmKFB gene, encoding a Kelch domain-containing F-box protein [54]. Recently, we also identified a light-green leaf mutant, zmpgl, in maize, which presented lower photosynthetic parameters and pigment content [55]. Although both sbgpgl1 and zmpgl are leaf color mutants, there are significant differences between these lines. sbgpgl1 presents a gradient change in color with plant development, with a relatively normal color in the bottom leaves, whereas zmpgl had mainly light leaves. Additionally, the DEGs in sbgpgl1 and BTx623 suggest that the leaf color changes may be caused by different mechanisms in maize and sorghum.
There are studies focused on the effect of plant hormones on leaf color, as changes in plant hormones often lead to changes in leaf color [23,24]. We also noted alterations in the expression of plant hormone synthesis-related genes in sbgpgl1 (Figure S6). Genes related to JA synthesizing, including Sobic.001G125700, Sobic.001G125900, Sobic.001G483400, Sobic.003G385500, and Sobic.004G078600, were upregulated, while Sobic.001G077400, Sobic.010G084700, Sobic.010G084400, and Sobic.010G084600 were downregulated. Moreover, Sobic.001G248600 in GA synthesis, which controls converting geranylgeranyl diphosphate to copalyl disphophate, was also downregulated. The transcriptome and metabolome analyses demonstrated that DEGs and DAMs might result in the pale-green leaf phenotype in sbgpgl1. Our results will improve understanding of the leaf color regulation mechanism in sorghum and provide genetic materials related to leaf color mutations.

5. Conclusions

In conclusion, the sbgpgl1 mutant presented inhibited development, including decreases in Chl content, photosynthesis-related parameters, total N, and several mineral element contents. DEG and DAM analyses indicated that photosynthesis genes and flavonoid-related metabolites were significantly affected. However, the regulatory gene of sbgpgl1 affecting leaf color needs further investigation.

Supplementary Materials

The following supporting information can be downloaded at: https://www.mdpi.com/article/10.3390/agronomy15081841/s1, Figure S1. Phenotype in field and panicle traits of BTx623 and sbgpgl1; Figure S2. Total P, K, and other mineral element contents of BTx623 and sbgpgl1; Figure S3. Transcriptomic correlation analysis of sbgpgl1 and BTx623; Figure S4. Up- and downregulated genes of sbgpgl1 and BTx623 by GO classification; Figure S5. Metabolic correlation analysis of sbgpgl1 and BTx623; Figure S6. DEG analysis of sbgpgl1 and BTx623 in hormone synthesis. (a) JA synthesis; (b) GA synthesis; Table S1. RNA-seq data statistics; Table S2: All DEGs; Table S3: All DAMs.

Author Contributions

Conceptualization, K.Q. and Z.Z.; methodology, K.Q.; software, K.Q.; validation, K.Q., X.L., and Z.Z.; formal analysis, K.Q. and D.L.; investigation, K.Q. and D.L.; resources, Z.Z.; data curation, K.Q. and Z.Z.; writing—original draft preparation, K.Q.; writing—review and editing, K.Q. and Z.Z.; visualization, D.L. and Z.Z.; supervision, Z.Z.; project administration, X.L. and Z.Z.; funding acquisition, X.L. All authors have read and agreed to the published version of the manuscript.

Funding

This research was funded by the National Modern Agricultural Industrial Technology System Construction Project (CARS-06-14.5-A3); the Liaoning Province germplasm innovation grain storage technology special plan (2023JH1/10200009); The Presidential Foundation of the Liaoning Academy of Agricultural Sciences (2024QN1801, 2025XKJS8504); the Excellent Youth Natural Science Foundation of Liaoning Province of China (2021-YQ-04).

Data Availability Statement

Data will be made available on request.

Conflicts of Interest

The authors declare no conflicts of interest.

References

  1. Dahlberg, J. The Role of Sorghum in Renewables and Biofuels. Methods Mol. Biol. 2019, 1931, 269–277. [Google Scholar]
  2. Wang, C.; Zhou, L.; Zhang, G.; Xu, Y.; Zhang, L.; Gao, X.; Gao, J.; Jiang, N.; Shao, M. Optimal fertilization for high yield and good quality of waxy sorghum (Sorghum bicolor L. Moench). Field Crops Res. 2017, 203, 1–7. [Google Scholar] [CrossRef]
  3. Lopes, L.D.; Chai, Y.N.; Marsh, E.L.; Rajewski, J.F.; Dweikat, I.; Schachtman, D.P. Sweet Sorghum Genotypes Tolerant and Sensitive to Nitrogen Stress Select Distinct Root Endosphere and Rhizosphere Bacterial Communities. Microorganisms 2021, 9, 1329. [Google Scholar] [CrossRef] [PubMed]
  4. Ribeiro, R.V.; Ottosen, C.O.; Rosenqvist, E.; Medanha, T.; Abdelhakim, L.; Machado, E.C.; Struik, P.C. Elevated CO2 concentration increases photosynthetic sensitivity to nitrogen supply of sorghum in a genotype-dependent manner. Plant Physiol. Biochem. 2021, 168, 202–210. [Google Scholar] [CrossRef] [PubMed]
  5. Maw, M.J.W.; Houx, J.H.; Fritschi, F.B. Nitrogen fertilization of high biomass sorghum affects macro- and micronutrient accumulation and tissue concentrations. Ind. Crops Prod. 2020, 156, 112819. [Google Scholar] [CrossRef]
  6. Makino, Y.; Ueno, O. Structural and physiological responses of the C4 grass Sorghum bicolor to nitrogen limitation. Plant Prod. Sci. 2018, 21, 39–50. [Google Scholar] [CrossRef]
  7. Yong, S.; Chen, Q.; Xu, F.; Fu, H.; Liang, G.; Guo, Q. Exploring the interplay between angiosperm chlorophyll metabolism and environmental factors. Planta 2024, 260, 25. [Google Scholar] [CrossRef]
  8. Hu, X.; Gu, T.; Khan, I.; Zada, A.; Jia, T. Research Progress in the Interconversion, Turnover and Degradation of Chlorophyll. Cells 2021, 10, 3134. [Google Scholar] [CrossRef]
  9. Takabayashi, A.; Kurihara, K.; Kuwano, M.; Kasahara, Y.; Tanaka, R.; Tanaka, A. The oligomeric states of the photosystems and the light-harvesting complexes in the Chl b-less mutant. Plant Cell Physiol. 2011, 52, 2103–2114. [Google Scholar] [CrossRef]
  10. Bryant, D.A.; Hunter, C.N.; Warren, M.J. Biosynthesis of the modified tetrapyrroles-the pigments of life. J. Biol. Chem. 2020, 295, 6888–6925. [Google Scholar] [CrossRef]
  11. Tamiaki, H.; Kichishima, S. Chlorophyll Pigments and Their Synthetic Analogs. Plant Cell Physiol. 2025, 66, 153–167. [Google Scholar] [CrossRef]
  12. Sun, M.; Shen, Y. Integrating the multiple functions of CHLH into chloroplast-derived signaling fundamental to plant development and adaptation as well as fruit ripening. Plant Sci. 2024, 338, 111892. [Google Scholar] [CrossRef]
  13. Ibata, H.; Nagatani, A.; Mochizuki, N. CHLH/GUN5 Function in Tetrapyrrole Metabolism Is Correlated with Plastid Signaling but not ABA Responses in Guard Cells. Front. Plant Sci. 2016, 7, 1650. [Google Scholar] [CrossRef] [PubMed]
  14. Xu, D.; Lin, L.; Liu, X.; Wangzha, M.; Pang, X.; Feng, L.; Wan, B.; Wu, G.Z.; Yu, J.; Rochaix, J.D.; et al. Characterization of a tomato chlh mis-sense mutant reveals a new function of ChlH in fruit ripening. Plant Biotechnol. J. 2025, 23, 911–926. [Google Scholar] [CrossRef] [PubMed]
  15. Wang, S.; Li, L.; Ying, Y.; Wang, J.; Shao, J.F.; Yamaji, N.; Whelan, J.; Ma, J.F.; Shou, H. A transcription factor OsbHLH156 regulates Strategy II iron acquisition through localising IRO2 to the nucleus in rice. New Phytol. 2020, 225, 1247–1260. [Google Scholar] [CrossRef] [PubMed]
  16. Gao, P.; Xia, H.; Li, Q.; Li, Z.; Zhai, C.; Weng, L.; Mi, H.; Yan, S.; Datla, R.; Wang, H.; et al. PALE-GREEN LEAF 1, a rice cpSRP54 protein, is essential for the assembly of the PSI-LHCI supercomplex. Plant Direct 2022, 6, e436. [Google Scholar] [CrossRef]
  17. Frick, G.; Su, Q.; Apel, K.; Armstrong, G.A. An Arabidopsis porB porC double mutant lacking light-dependent NADPH: Protochlorophyllide oxidoreductases B and C is highly chlorophyll-deficient and developmentally arrested. Plant J. 2003, 35, 141–153. [Google Scholar] [CrossRef]
  18. Kumar, A.M.; SoÈll, D. Antisense HEMA1 RNA expression inhibits heme and chlorophyll biosynthesis in arabidopsis. Plant Physiol. 2000, 122, 49–55. [Google Scholar] [CrossRef]
  19. Luo, W.G.; Liang, Q.W.; Su, Y.; Huang, C.; Mo, B.X.; Yu, Y.; Xiao, L.T. Auxin inhibits chlorophyll accumulation through ARF7-IAA14-mediated repression of chlorophyll biosynthesis genes in Arabidopsis. Front. Plant Sci. 2023, 14, 1172059. [Google Scholar] [CrossRef]
  20. Talla, S.K.; Panigrahy, M.; Kappara, S.; Nirosha, P.; Neelamraju, S.; Ramanan, R. Cytokinin delays dark-induced senescence in rice by maintaining the chlorophyll cycle and photosynthetic complexes. J. Exp. Bot. 2016, 67, 1839–1851. [Google Scholar] [CrossRef]
  21. Nehnevajova, E.; Ramireddy, E.; Stolz, A.; Gerdemann-Knorck, M.; Novak, O.; Strnad, M.; Schmulling, T. Root enhancement in cytokinin-deficient oilseed rape causes leaf mineral enrichment, increases the chlorophyll concentration under nutrient limitation and enhances the phytoremediation capacity. BMC Plant Biol. 2019, 19, 83. [Google Scholar] [CrossRef]
  22. Keawmanee, N.; Ma, G.; Zhang, L.; Yahata, M.; Murakami, K.; Yamamoto, M.; Kojima, N.; Kato, M. Exogenous gibberellin induced regreening through the regulation of chlorophyll and carotenoid metabolism in Valencia oranges. Plant Physiol. Biochem. 2022, 173, 14–24. [Google Scholar] [CrossRef] [PubMed]
  23. Feng, X.; Gao, G.; Yu, C.; Zhu, A.; Chen, J.; Chen, K.; Wang, X.; Abubakar, A.S.; Chen, P. Transcriptome and metabolome analysis reveals anthocyanin biosynthesis pathway associated with ramie (Boehmeria nivea (L.) Gaud.) leaf color formation. BMC Genom. 2021, 22, 684. [Google Scholar] [CrossRef] [PubMed]
  24. Chen, M.; Chang, C.; Li, H.; Huang, L.; Zhou, Z.; Zhu, J.; Liu, D. Metabolome analysis reveals flavonoid changes during the leaf color transition in Populus x euramericana ‘Zhonghuahongye’. Front. Plant Sci. 2023, 14, 1162893. [Google Scholar] [CrossRef] [PubMed]
  25. Lv, Y.; Chen, J.; Zhu, M.; Liu, Y.; Wu, X.; Xiao, X.; Yuyama, N.; Liu, F.; Jing, H.; Cai, H. Wall-associated kinase-like gene RL1 contributes to red leaves in sorghum. Plant J. 2022, 112, 135–150. [Google Scholar] [CrossRef]
  26. Li, D.; Zhu, Z.; Qu, K.; Li, J.; Ma, D.; Lu, X. A coiled-coil domain mutation in the NLR receptor SbYR1 coordinates plant growth and stress tolerance in sorghum. Plant Sci. 2025, 350, 112246. [Google Scholar] [CrossRef]
  27. Li, W.; Yang, S.; Lu, Z.; He, Z.; Ye, Y.; Zhao, B.; Wang, L.; Jin, B. Cytological, physiological, and transcriptomic analyses of golden leaf coloration in Ginkgo biloba L. Hortic. Res. 2018, 5, 12. [Google Scholar]
  28. Zhu, Z.; Qu, K.; Li, D.; Zhang, L.; Wang, C.; Cong, L.; Bai, C.; Lu, X. SbPHO2, a conserved Pi starvation signalling gene, is involved in the regulation of the uptake of multiple nutrients in sorghum. Plant Sci. 2023, 327, 111556. [Google Scholar] [CrossRef]
  29. Zheng, H.; Dang, Y.; Sui, N. Sorghum: A Multipurpose Crop. J. Agric. Food Chem. 2023, 71, 17570–17583. [Google Scholar] [CrossRef]
  30. Yang, Y.; Xu, J.; Huang, L.; Leng, Y.; Dai, L.; Rao, Y.; Chen, L.; Wang, Y.; Tu, Z.; Hu, J.; et al. PGL, encoding chlorophyllide a oxygenase 1, impacts leaf senescence and indirectly affects grain yield and quality in rice. J. Exp. Bot. 2016, 67, 1297–1310. [Google Scholar] [CrossRef]
  31. Han, H.; Zhou, Y.; Liu, H.; Chen, X.; Wang, Q.; Zhuang, H.; Sun, X.; Ling, Q.; Zhang, H.; Wang, B.; et al. Transcriptomics and Metabolomics Analysis Provides Insight into Leaf Color and Photosynthesis Variation of the Yellow-Green Leaf Mutant of Hami Melon (Cucumis melo L.). Plants 2023, 12, 1623. [Google Scholar] [CrossRef] [PubMed]
  32. Sakowska, K.; Alberti, G.; Genesio, L.; Peressotti, A.; Delle Vedove, G.; Gianelle, D.; Colombo, R.; Rodeghiero, M.; Panigada, C.; Juszczak, R.; et al. Leaf and canopy photosynthesis of a chlorophyll deficient soybean mutant. Plant Cell Environ. 2018, 41, 1427–1437. [Google Scholar] [CrossRef]
  33. Zhang, L.; Zhang, J.; Mao, Y.; Yin, Y.; Shen, X. Physiological analysis and transcriptome sequencing of a delayed-green leaf mutant ‘Duojiao’ of ornamental crabapple (Malus sp.). Physiol. Mol. Biol. Plants 2022, 28, 1833–1848. [Google Scholar] [CrossRef] [PubMed]
  34. Wang, Q.; Zhang, H.; Wei, L.; Guo, R.; Liu, X.; Zhang, M.; Fan, J.; Liu, S.; Liao, J.; Huang, Y.; et al. Yellow-Green Leaf 19 Encoding a Specific and Conservative Protein for Photosynthetic Organisms Affects Tetrapyrrole Biosynthesis, Photosynthesis, and Reactive Oxygen Species Metabolism in Rice. Int. J. Mol. Sci. 2023, 24, 16762. [Google Scholar] [CrossRef] [PubMed]
  35. Yao, G.; Zhang, H.; Leng, B.; Cao, B.; Shan, J.; Yan, Z.; Guan, H.; Cheng, W.; Liu, X.; Mu, C. A large deletion conferring pale green leaves of maize. BMC Plant Biol. 2023, 23, 360. [Google Scholar] [CrossRef]
  36. Gu, J.; Zhou, Z.; Li, Z.; Chen, Y.; Wang, Z.; Zhang, H.; Yang, J. Photosynthetic Properties and Potentials for Improvement of Photosynthesis in Pale Green Leaf Rice Under High Light Conditions. Front. Plant Sci. 2017, 8, 1082. [Google Scholar] [CrossRef]
  37. Qu, K.Z.; Lu, P.; Li, D.; Cong, L.; Lu, X.C.; Zhu, Z.X. Phenotypic Identification of Pale-green Leaf Mutant sbpgl1 During Seedling Stage. Liaoning Agric. Sci. 2024, 3, 66–69. [Google Scholar]
  38. Zhao, Y.; Zhu, M.; Gao, H.; Zhou, Y.; Yao, W.; Zhao, Y.; Zhang, W.; Feng, C.; Li, Y.; Jin, Y.; et al. Photosynthetic characteristics and genetic mapping of a yellow-green leaf mutant jym165 in soybean. BMC Plant Biol. 2024, 24, 1009. [Google Scholar] [CrossRef]
  39. Liang, G. Iron uptake, signaling, and sensing in plants. Plant Commun. 2022, 3, 100349. [Google Scholar] [CrossRef]
  40. Gao, F.; Dubos, C. Transcriptional integration of plant responses to iron availability. J. Exp. Bot. 2021, 72, 2056–2070. [Google Scholar] [CrossRef]
  41. Dong, W.; Liu, L.; Sun, Y.; Xu, X.; Guo, G.; Heng, W.; Jiao, H.; Wei, S.; Jia, B. PbbHLH155 enhances iron deficiency tolerance in pear by directly activating PbFRO2 and PbbHLH38. Plant Physiol. Biochem. 2024, 213, 108786. [Google Scholar] [CrossRef]
  42. Yang, X.; Cai, J.; Xue, J.; Luo, X.; Zhu, W.; Xiao, X.; Xue, M.; An, F.; Li, K.; Chen, S. Magnesium chelatase subunit D is not only required for chlorophyll biosynthesis and photosynthesis, but also affecting starch accumulation in Manihot esculenta Crantz. BMC Plant Biol. 2023, 23, 258. [Google Scholar] [CrossRef] [PubMed]
  43. Qin, H.; Zhang, X.; Tian, G.; Liu, C.; Xing, Y.; Feng, Z.; Lyu, M.; Liu, J.; Xu, X.; Zhu, Z.; et al. Magnesium alleviates growth inhibition under low potassium by enhancing photosynthesis and carbon-nitrogen metabolism in apple plants. Plant Physiol. Biochem. 2024, 214, 108875. [Google Scholar] [CrossRef] [PubMed]
  44. Qin, X.X.; Zhang, M.Y.; Han, Y.Y.; Hao, J.H.; Liu, C.J.; Fan, S.X. Beneficial Phytochemicals with Anti-Tumor Potential Revealed through Metabolic Profiling of New Red Pigmented Lettuces (Lactuca sativa L.). Int. J. Mol. Sci. 2018, 19, 1165. [Google Scholar] [CrossRef] [PubMed]
  45. Li, Y.; Zhou, Y.; Chen, H.; Chen, C.; Liu, Z.; Han, C.; Wu, Q.; Yu, F. Transcriptomic Analyses Reveal Key Genes Involved in Pigment Biosynthesis Related to Leaf Color Change of Liquidambar formosana Hance. Molecules 2022, 27, 5433. [Google Scholar] [CrossRef]
  46. Li, G.; Liang, H.; Ren, X.; Ma, W.; Lu, Y.; Zhang, Z.; Wang, Z.; Zhao, T.; Zhao, J. Transcriptome Analysis Reveals Association of Photosynthesis and Phytohormone Pathways with Leaf Color in Chinese Cabbage. Agronomy 2023, 13, 2273. [Google Scholar] [CrossRef]
  47. Dumas, L.; Chazaux, M.; Peltier, G.; Johnson, X.; Alric, J. Cytochrome b6f function and localization, phosphorylation state of thylakoid membrane proteins and consequences on cyclic electron flow. Photosynth. Res. 2016, 129, 307–320. [Google Scholar] [CrossRef]
  48. Liu, C.J. Cytochrome b5: A versatile electron carrier and regulator for plant metabolism. Front. Plant Sci. 2022, 13, 984174. [Google Scholar] [CrossRef]
  49. Gou, M.; Yang, X.; Zhao, Y.; Ran, X.; Song, Y.; Liu, C.J. Cytochrome b5 Is an Obligate Electron Shuttle Protein for Syringyl Lignin Biosynthesis in Arabidopsis. Plant Cell 2019, 31, 1344–1366. [Google Scholar] [CrossRef]
  50. Schiphorst, C.; Achterberg, L.; Gomez, R.; Koehorst, R.; Bassi, R.; van Amerongen, H.; Dall’Osto, L.; Wientjes, E. The role of light-harvesting complex I in excitation energy transfer from LHCII to photosystem I in Arabidopsis. Plant Physiol. 2022, 188, 2241–2252. [Google Scholar] [CrossRef]
  51. Ye, J.J.; Lin, X.Y.; Yang, Z.X.; Wang, Y.Q.; Liang, Y.R.; Wang, K.R.; Lu, J.L.; Lu, P.; Zheng, X.Q. The light-harvesting chlorophyll a/b-binding proteins of photosystem II family members are responsible for temperature sensitivity and leaf color phenotype in albino tea plant. J. Adv. Res. 2024, 66, 87–104. [Google Scholar] [CrossRef] [PubMed]
  52. Li, H.; Du, Y.; Zhang, J.; Feng, H.; Liu, J.; Yang, G.; Zhu, Y. Unraveling the Mechanism of Purple Leaf Formation in Brassica napus by Integrated Metabolome and Transcriptome Analyses. Front. Plant Sci. 2022, 13, 945553. [Google Scholar] [CrossRef]
  53. Jiang, L.; Lyu, S.; Yu, H.; Zhang, J.; Sun, B.; Liu, Q.; Mao, X.; Chen, P.; Pan, D.; Chen, W.; et al. Transcription factor encoding gene OsC1 regulates leaf sheath color through anthocyanidin metabolism in Oryza rufipogon and Oryza sativa. BMC Plant Biol. 2024, 24, 147. [Google Scholar] [CrossRef]
  54. Feder, A.; Burger, J.; Gao, S.; Lewinsohn, E.; Katzir, N.; Schaffer, A.A.; Meir, A.; Davidovich-Rikanati, R.; Portnoy, V.; Gal-On, A.; et al. A Kelch Domain-Containing F-Box Coding Gene Negatively Regulates Flavonoid Accumulation in Muskmelon. Plant Physiol. 2015, 169, 1714–1726. [Google Scholar] [PubMed]
  55. Li, D.; Qu, K.Z.; Ma, D.R.; Zhu, Z.X.; Lu, X.C. Transcriptome and Metabolome Analysis of the Leaf Colour Mutation Mechanism in a Light-Green Leaf Mutant of Maize. Agronomy 2025, 15, 1364. [Google Scholar] [CrossRef]
Figure 1. Phenotypes and agronomic traits of BTx623 and sbgpgl1. (a) Phenotypes of pot-grown BTx623 and sbgpgl1, bar = 5 cm. (b) Plant heights of BTx623 and sbgpgl1. (c) Second leaf lengths of BTx623 and sbgpgl1. (d) Second leaf widths of BTx623 and sbgpgl1. (e) Seed lengths of BTx623 and sbgpgl1. (f) Seed widths of BTx623 and sbgpgl1. (g) The 1000-grain weights of BTx623 and sbgpgl1. Data are presented as the average and standard deviation (SD) (n ≥ 3) and are analyzed using a t-test, * p < 0.05.
Agronomy 15 01841 g001
Figure 2. Chlorophyll content and photosynthesis-related parameters of BTx623 and sbgpgl1. (a) Chl a content of BTx623 and sbgpgl1. (b) Chl b content of BTx623 and sbgpgl1. (c) Carotenoid content of BTx623 and sbgpgl1. (d) PN of BTx623 and sbgpgl1. (e) gs of BTx623 and sbgpgl1. (f) Tr of BTx623 and sbgpgl1. The data are presented as the average and SD (n ≥ 3) and are analyzed using the Tukey HSD test. Different letters indicate significant differences (p < 0.05).
Agronomy 15 01841 g002
Figure 3. Total N and several mineral element contents of BTx623 and sbgpgl1. (a) Total N content of BTx623 and sbgpgl1. (b) Ca content of BTx623 and sbgpgl1. (c) Cu content of BTx623 and sbgpgl1. (d) Mn content of BTx623 and sbgpgl1. The data are presented as the average and SD (n ≥ 3) and are analyzed using the Tukey HSD test. Different letters indicate significant differences (p < 0.05).
Agronomy 15 01841 g003
Figure 4. Comparative transcriptome analysis of sbgpgl1 and BTx623. (a) Total counts of sbgpgl1 vs. BTx623. The red bar represents the total DEGs. The green bar represents downregulated genes, and the blue bar represents upregulated genes. (b) Volcano plot of differences in expression levels. Each dot represents a gene; the x-axis indicates the log2FC in gene expression, and the y-axis represents the −log10padj. (c) GO enrichment analysis of BP, CC, and MF. (d) KEGG enrichment analysis. DEGs are mostly enriched in metabolism. The horizontal axis represents the number of differentially expressed genes annotated to this pathway, and the vertical axis represents the name of the KEGG pathway. The rightmost label represents the classification to which the KEGG pathway belongs.
Agronomy 15 01841 g004
Figure 5. Metabolome analysis of sbgpgl1 compared with BTx623. (a) Volcano plot of total DAMs. Each dot represents a metabolite, where green points represent downregulated DAMs, and red points represent upregulated DAMs. (b) KEGG enrichment analysis. The vertical axis represents the KEGG metabolic pathway, and the horizontal axis represents the number of DAMs annotated under this pathway and their proportion in the total number of annotated differential metabolites. * Represents the existence of isomers. (c) Flavonoid and phenolic acid KEGG heatmap. The horizontal axis represents the sample name, and the vertical axis represents the metabolites. Red represents high regulated, while green represents low regulated.
Agronomy 15 01841 g005
Figure 6. Conjoint comparative analysis of sbgpgl1 compared with BTx623. (a) Conjoint analysis using DEGs and DAMs. The horizontal axis represents the number of DAMs and DEGs enriched in the pathway, and the vertical axis represents the KEGG pathway name. The red and green bars represent metabolome and transcriptome, respectively. (b) Carbon fixation-related pathway in photosynthetic organisms, with 28 DEGs and 5 DAMs. (c) Biosynthesis of various plant secondary metabolites, with 28 DEGs and 10 DAMs.
Agronomy 15 01841 g006
Disclaimer/Publisher’s Note: The statements, opinions and data contained in all publications are solely those of the individual author(s) and contributor(s) and not of MDPI and/or the editor(s). MDPI and/or the editor(s) disclaim responsibility for any injury to people or property resulting from any ideas, methods, instructions or products referred to in the content.

