Abstract
Drought is a key limitation for rice productivity. While oxidative stress markers like hydrogen peroxide (H2O2) are important for drought adaptation, the predictive value of combining root anatomical and physiological traits is underexplored. We assessed 20 rice cultivars under drought and control conditions using a random forest, a multi-layer perceptron, and a SHAP-optimized stacking ensemble. The stacking ensemble achieved the highest classification accuracy (81.8%) and identified hydrogen peroxide, relative water content, and endodermis inner circumference as key predictors. SHAP analysis revealed important interactions between root anatomical and physiological traits, providing new biological insights into drought tolerance. Our integrative approach, supported by robust cross-validation, improves predictive power and transparency for breeding drought-resilient rice cultivars.
1. Introduction
Drought stress is one of the most severe abiotic stresses affecting global agricultural productivity, particularly for staple crops such as rice (Oryza sativa L.), which is highly sensitive to water limitations [1,2]. Water deficit conditions disrupt cellular homeostasis, leading to impaired photosynthesis, reduced stomatal conductance, and an imbalance in oxidative processes [2,3,4]. A primary response to drought is the decline in relative water content (RWC) [5,6], along with the accumulation of reactive oxygen species (ROS) that cause oxidative damage, as evidenced by elevated malondialdehyde (MDA) and hydrogen peroxide (H2O2) [7,8,9] and by chlorophyll degradation, which limits photosynthetic efficiency and growth [10,11].
The urgent need to develop drought-tolerant rice cultivars necessitates efficient and accurate screening methods that integrate the physiological and anatomical traits associated with drought adaptation [12,13]. Traditional drought tolerance assessment methods, such as phenotypic selection, physiological measurements, and molecular marker-assisted selection (MAS), have limitations in capturing the complexity of drought tolerance [14,15]. Phenotypic selection often lacks the resolution needed to capture the drought-induced physiological changes [13,16]. To overcome these limitations, machine learning (ML) and artificial intelligence (AI) have emerged as transformative tools in plant science, enabling the integration of large-scale physiological, anatomical, and omics datasets to enhance predictive accuracy [17]. ML approaches excel in capturing non-linear interactions, identifying key features, and enhancing classification efficiency in drought stress phenotyping [18,19,20].
Recent advancements in AI-driven plant phenotyping underscore the potential of ML for drought tolerance prediction, trait association studies, and multi-omics integration [21,22,23]. Specifically, random forest (RF) models have been widely employed for feature selection and ranking, providing insights into the most influential physiological traits that drive drought adaptation [24,25]. Meanwhile, deep-learning architectures, including multi-layer perceptron (MLP) networks, have been utilized to model complex trait interactions and enhance classification precision in plant stress phenotyping [26,27]. However, most existing ML studies focus primarily on physiological data, often neglecting the critical role of root anatomical traits in drought resistance [28,29,30]. To address this gap, an integrated stacking ensemble ML framework that combines physiological and anatomical features is needed to improve drought tolerance classification accuracy and model interpretability [31,32].
While ML-based drought tolerance prediction has made significant progress, several research gaps remain. Existing models predominantly rely on physiological indices, overlooking the root anatomical parameters that influence water uptake efficiency [33,34]. Additionally, while ANN models offer high accuracy, they often function as “black boxes,” making a biological interpretation of feature importance challenging [35,36]. Current studies rarely explore stacking ensembles that integrate multiple ML classifiers to enhance drought tolerance classification [37,38]. This study aims to bridge these gaps by developing a novel stacking ensemble ML framework that integrates a random forest, neural networks, and a stacking ensemble model to classify drought tolerance based on both physiological and anatomical traits. By leveraging SHAP (Shapley additive explanations) for feature interpretability, this research aims to provide high predictive accuracy and valuable biological insights into drought adaptation mechanisms [37,38,39].
Thus, our study introduces a robust, interpretable, and reproducible AI-driven pipeline for rice drought tolerance prediction by integrating both physiological and root anatomical traits within a novel stacking ensemble machine-learning framework optimized with SHAP. This approach not only improves classification accuracy but also provides transparent insight into synergistic trait interactions under drought stress, advancing precision phenotyping in rice. Our work is novel in that it unifies diverse phenotypic data, addresses both model performance and interpretability, and delivers a validated workflow that supports the acceleration of drought-resilient rice breeding under climate change.
2. Materials and Methods
2.1. Plant Material
For rice (Oryza sativa L.), 20 landrace varieties and 2 comparative varieties (i.e., KDML105 as a susceptibility and CT9993 as a tolerance to drought conditions) were selected for this study, as shown in Appendix A Table A1. Seeds were soaked using a sterilization method of 0.5% sodium hypochlorite for 10 min, then rinsed thoroughly with distilled water for 1 min 3 times. The sterilized seeds were sown in trays containing moisture germination paper tower and germinated under controlled conditions. After 3 days, uniform seedlings were transplanted into a tray containing vermiculite planting media and maintained under these growth conditions until the initiation of drought treatments.
2.2. Experimental Design
Greenhouse experiments were conducted. The two main treatments were well-watered (control), and PEG 6000 simulated drought. In the well-watered treatment, plants were cultivated in Yoshida nutrient solution [40] at full nutrient and water availability. Plants were cultivated in Yoshida nutritional solution with PEG 6000 to simulate drought. Dissolving 20% PEG 6000 in Yoshida nutrition solution and mixing carefully to ensure complete dissolution. Treatments were given 30 days after transplanting, and the drought lasted 10 days. To ensure nutrient availability, nutrient solutions were refreshed every 4 days. Three replicates of 10 plants each were grown for each treatment.
2.3. Physiological Measurements
2.3.1. Proline Content
Proline levels were measured using Bates et al.’s [41] technique. In 10 mL of 3% sulfosalicylic acid, 0.5 g of fresh leaf tissue were homogenized and centrifuged at 3000 rpm for 10 min. Acid ninhydrin and glacial acetic acid were mixed 1:1:1 in the supernatant and heated at 100 °C for an hour. The process was stopped by cooling the mixture in an ice bath. After adding 4 mL of toluene, the chromophore was extracted. We then examined the toluene layer’s absorbance at 520 nm with a spectrophotometer.
2.3.2. Chlorophyll Content
Chlorophyll content was measured using the method of Arnon (1949). Leaf samples (0.2 g) were homogenized in 80% acetone and centrifuged at 5000 rpm for 5 min. The supernatant was collected, and the absorbance was measured at 645 and 663 nm. Chlorophyll a, chlorophyll b, and total chlorophyll concentrations were calculated using the following equations:
Chlorophyll a = 12.7(A663) − 2.69(A645)
Chlorophyll b = 22.9(A645) − 4.68(A663)
Total chlorophyll = 20.2(A645) + 8.02(A663)
2.3.3. Malondialdehyde (MDA) Content
MDA content, an indicator of lipid peroxidation, was determined using the thiobarbituric acid (TBA) assay [42]. Fresh leaf tissue (0.5 g) was homogenized in 5 mL of 0.1% trichloroacetic acid (TCA) and centrifuged at 10,000 rpm for 10 min. The supernatant was mixed with 4 mL of 20% TCA containing 0.5% TBA and heated at 95 °C for 30 min. After cooling, the mixture was centrifuged at 10,000 rpm for 10 min, and the absorbance was measured at 532 and 600 nm. MDA content was calculated using the extinction coefficient of 155 mM−1 cm−1.
2.3.4. Relative Water Content (RWC)
RWC was measured using the method described by Turner (1986). Fresh leaf samples were weighed (fresh weight, FW), then rehydrated in distilled water for 4 h to obtain the turgid weight (TW). Samples were then oven-dried at 60 °C for 48 h to obtain the dry weight (DW). RWC was calculated using the formula:
RWC(%) = (TW − DW/FW − DW) × 100
2.4. Root Anatomical Measurements
Root samples were collected at the end of the drought treatment period. Roots were carefully washed to remove planted media particles and fixed in FAA solution (formalin–acetic acid–alcohol) until used for cross-section. Fixed root samples were dehydrated through a graded ethanol series and sectioned using a free-hand section method. Transverse sections (10–15 µm thick) were stained with safranin O and observed under a light microscope (Axio Imager 2; Carl Zeiss AG, Germany) and analyzed via Zen 3.5 software (Carl Zeiss AG, Germany).
2.4.1. Cortex Area
The cortex area was measured using image analysis software. Microscopic images of root sections were captured, and the cortex area was delineated and quantified.
2.4.2. Endodermis Characteristics
Endodermis thickness was measured at four equidistant points around the root circumference using a calibrated ocular micrometer.
2.4.3. Exodermis Characteristics
Exodermis characteristics, such as the number of cell layers and lignification, were assessed qualitatively and quantitatively using light microscopy and image analysis.
2.4.4. Metaxylem Vessel Dimensions
Metaxylem vessel diameter and number were measured in transverse root sections using image analysis software. The average vessel diameter was calculated from measurements of at least 10 vessels per root.
2.5. Data Summary and Descriptive Statistics
Before applying machine-learning models, a descriptive statistical analysis was conducted to summarize the dataset structure and ensure data quality. The dataset comprised physiological and anatomical traits measured under well-watered and drought-stressed conditions, with a total of 132 observations. Normality of the dataset was assessed using the Shapiro–Wilk test, and homogeneity of variance was verified using Levene’s test. Pearson’s correlation analysis revealed significant relationships between RWC and oxidative stress markers (MDA and H2O2), indicating drought-induced physiological stress. Boxplots and histograms were used to visualize data distribution and detect potential outliers. All statistical analyses were conducted using Python (version 3.12.6) within a Jupyter Notebook environment (version 7.2.2). The following Python libraries were used:
Pandas (2.2.3) [43]: for data manipulation and summary statistics, numpy (2.1.0) [44]: for numerical computations, scipy.stats (1.14.1) [45]: for hypothesis testing, including normality and variance tests, matplotlib (3.10.0) [46] and seaborn (0.13.2) [47]: for data visualization (histograms, boxplots, and correlation heatmaps), and statsmodels (0.14.5) [48]: for additional statistical analysis, including regression modeling. This statistical foundation ensures the dataset’s integrity before machine learning applications and strengthens the interpretation of results.
2.6. Machine Learning and AI Implementation
The integration of machine-learning (ML) and artificial intelligence (AI) techniques in plant stress research enhances predictive capacity and provides novel insights into physiological and anatomical responses. This study leverages Python (version 3.12.6) [49] within a Jupyter Notebook environment [50], operating on an HP 15.6-inch Laptop PC 15-d5000 equipped with a 12th Gen Intel® Core™ i7-1260P processor (2.10 GHz, 16 GB RAM) and Windows 11 (64-bit). The analysis was conducted using well-established machine learning libraries, including scikit-learn (1.6.1) [51] (Pedregosa et al., 2011), TensorFlow (2.18.0)/Keras (3.8.0) [52], XGBoost (2.1.4) [53], and SHAP (0.46.0) for explainability [39].
2.6.1. Data Overview and Target Variable
The dataset comprised physiological and root anatomical traits of rice cultivars under both well-watered and drought conditions. The target variable for classification was drought tolerance level, categorized into tolerant, moderate, and susceptible groups. The features included relative water content (RWC), hydrogen peroxide (H2O2), malondialdehyde (MDA), chlorophyll content (total, a, and b), plant height, endodermis inner circumference, exodermis thickness, cortex area, and vascular cylinder.
To mitigate class imbalance, SMOTE (synthetic minority oversampling technique) [54] was applied, ensuring equal representation of all drought tolerance groups. Data preprocessing involved StandardScaler normalization [51], and an 80–20% train–test split was employed with stratified sampling to preserve class distributions.
2.6.2. Random Forest Model
Random forest, an ensemble-learning method, was chosen due to its ability to manage high-dimensional data, handle feature interactions, and provide insights through feature importance analysis. This model constructs multiple decision trees and aggregates their predictions to enhance classification stability. To determine the key drought tolerance predictors, Gini impurity-based ranking and permutation importance [55] were applied.
2.6.3. Neural Network Model
A multi-layer perceptron (MLP) [56] neural network was implemented to capture the non-linear relationships between physiological and anatomical traits. The architecture consisted of three hidden layers with BatchNormalization [57] and LeakyReLU [58] activation (α = 0.1) to enhance convergence. Dropout regularization [59] (30%) was included to mitigate overfitting. The Adam optimizer [60] was used for training, with early stopping (patience = 10) and adaptive-learning rate reduction (factor = 0.5, min_lr = 1 × 10⁻⁵). Feature importance was evaluated using SHAP analysis [39] to provide interpretable model outputs.
2.6.4. Stacking Ensemble Model
A stacking ensemble approach [61] was developed to integrate multiple classifiers for improved predictive performance. The base models included random forest (RF) [55], XGBoost (XGB) [53], support vector machine (SVM) [62], and multi-layer perceptron (MLP) [56], with XGBoost [53] serving as the meta-learner. Predictions from each base model were combined as meta-features for the final classification. A SHAP [39] analysis was performed to highlight the most influential physiological and anatomical traits affecting drought tolerance.
To assess and compare model performance, confusion matrices, receiver operating characteristic (ROC) curves [63], model classification reports, and feature importance rankings were used. These evaluations provided insights into model reliability, predictive power, and the key factors influencing classification accuracy.
2.6.5. Reproducibility and Computational Environment
Reproducibility is a crucial aspect of ML-based plant science research. All computations were executed in Python (version 3.12.6) [49] using Jupyter Notebook [50] to ensure traceability. The following libraries were utilized: scikit-learn [51] for ML model implementation and evaluation, TensorFlow/Keras [52] for deep-learning-based classification, XGBoost [53] for gradient boosting techniques, and SHAP [39] for model interpretability and feature ranking. This methodological framework facilitates the adoption of ML and AI in plant stress data analysis, offering a reproducible and interpretable approach for identifying key drought tolerance traits. To enhance clarity and reproducibility, we provide both schematic block diagrams and detailed algorithmic steps for each machine-learning model applied in this study (Figure 1). This includes random forest (RF), multi-layer perceptron (MLP), and the stacking ensemble. The full workflow encompasses data preprocessing, class balancing with SMOTE, train–test splitting, model training, feature importance analysis, and evaluation using ten classification metrics.
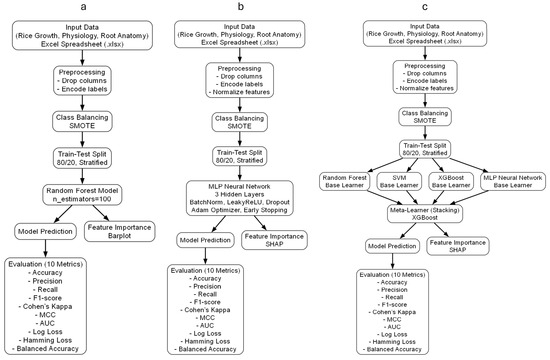
Figure 1.
Block diagrams of machine-learning workflows for drought tolerance classification in rice using root anatomical and physiological traits. (a) Random forest, (b) multi-layer perceptron (MLP), (c) stacking ensemble. Each pipeline includes preprocessing, class balancing (SMOTE), model development, feature importance analysis, and evaluation.
In this study, a multi-model machine-learning strategy was adopted to both maximize prediction accuracy and extract interpretable biological insights into rice drought tolerance. Each model was selected to address distinct analytical objectives, as summarized in Table 1. This multi-model framework was designed so that each algorithm complements the others: random forest provides interpretability and robust feature ranking, MLP uncovers complex nonlinear patterns, and the stacking ensemble achieves maximum predictive power by integrating multiple models. This approach enables rigorous benchmarking of model performance, as well as in-depth biological interpretation. Importantly, SHAP analysis was applied throughout to provide transparent, quantitative insights into feature contributions and trait interactions, thereby offering actionable guidance for breeders and plant scientists in rice drought phenotyping

Table 1.
Overview of machine-learning models, rationale, and unique contributions as implemented in this study.
The explicit algorithmic steps and corresponding mathematical equations are provided in the Supplementary Materials.
2.6.6. Model Performance Evaluation and Statistical Comparison
To ensure both practical and statistical rigor, model performance was evaluated using two approaches. Reporting the best single train–test split facilitates direct comparison with prior work and highlights the model’s peak potential. Five-fold cross-validation provides a more robust estimate of generalizability and model stability. For each approach, ten standard classification metrics were calculated: accuracy, balanced accuracy, macro precision, macro recall, macro F1-score, ROC AUC, log loss, Matthews correlation coefficient, Cohen’s kappa, and hamming loss. The mean and standard deviation across folds are reported for cross-validation.
Statistical comparisons between models for all metrics were conducted using paired t-tests or Wilcoxon signed-rank tests.
The authors acknowledge the use of ChatGPT-4o (OpenAI, version as of June 2025) as a supportive instrument during the production of this manuscript. In particular, ChatGPT-4o was employed to aid in the formulation and refinement of the methodology section, as well as the generation of initial Python code templates for machine-learning techniques, including SMOTE, random forests, multi-layer perceptrons (MLP), stacking ensembles, and SHAP analysis. The authors thoroughly reviewed, tested, modified, and executed all code and text outputs. The authors are solely responsible for the accuracy and integrity of the research presented, having conducted the study design, code implementation, data analysis, and interpretation.
3. Results
3.1. Trait Variability and Physiological Correlations Under Contrasting Water Regimes
A descriptive statistical analysis was conducted to characterize the distribution, variability, and interrelationships among the measured physiological and anatomical traits under both well-watered and drought-stressed conditions. The dataset comprised 132 observations across 20 rice landrace cultivars and two reference checks, representing a diverse phenotypic response spectrum. Key traits included plant height, relative water content (RWC), oxidative stress markers (malondialdehyde [MDA] and hydrogen peroxide [H2O2]), chlorophyll pigments (chlorophyll a, b, and total), and detailed root anatomical metrics. Normality assessment using the Shapiro–Wilk test indicated that several physiological traits, particularly RWC, MDA, and H2O2, significantly deviated from a Gaussian distribution (p < 0.05), reflecting heterogeneous stress responses across genotypes. Levene’s test further revealed heteroscedasticity between water treatments in RWC, MDA, and chlorophyll content, underscoring drought-induced physiological changes. Pearson’s correlation analysis revealed strong positive relationships between RWC and chlorophyll traits, as well as between MDA and H2O2, highlighting their co-regulated behaviors as indicators of oxidative stress. The comprehensive trait interactions are visualized in Appendix A, Figure A2, which displays a Pearson correlation heatmap illustrating patterns of association among 16 traits under water-stress conditions. Additionally, treatment-specific variability in key anatomical and physiological traits was visualized using histograms overlaid with kernel density estimations and boxplots (Appendix A, Figure A1). These visualizations highlight treatment-driven shifts, trait-specific skewness, and the presence of genotype outliers, offering deeper insight into stress adaptation mechanisms. Together, these data provide a statistical and visual foundation for subsequent machine-learning analyses.
3.2. Random Forest Analysis
A random forest (RF) classification model was developed to predict drought response categories, namely tolerant, moderate, and susceptible, among diverse rice cultivars, based on a comprehensive set of physiological and root anatomical traits. After preprocessing and class rebalancing using the synthetic minority over-sampling technique (SMOTE), the optimized model achieved an overall classification accuracy of 77%, as evaluated on an independent test set. The model’s internal feature ranking, visualized in Figure 2a, identified hydrogen peroxide (H2O2) as the most influential trait, followed by vascular cylinder thickness, plant height, endodermis thickness, and cortex size. These traits collectively reflect a combination of oxidative stress signaling and root morphological adaptation, aligning with known mechanisms of drought tolerance. In contrast, features such as chlorophyll b, malondialdehyde (MDA), and external endodermal circumference contributed minimally to prediction and were subsequently excluded during model refinement. The confusion matrix (Figure 2b) revealed that the model achieved perfect classification of susceptible cultivars, high performance in the tolerant group, and minor misclassification in the moderate class, likely due to phenotypic overlap. Complementary to this, the multiclass ROC curves (Figure 2c) demonstrated excellent class separability, with AUC values of 0.99 for both the tolerant and susceptible groups and 0.94 for the moderate group. These results confirm the model’s high sensitivity and specificity, particularly in identifying extreme phenotypes under drought stress.
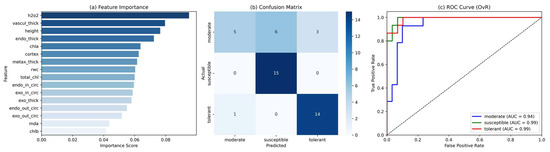
Figure 2.
Performance of the random forest classification model in predicting drought response groups of rice cultivars. (a) Ranked feature importance scores based on the Gini index. Key predictors include hydrogen peroxide (H2O2), vascular cylinder thickness, and plant height, indicating the relevance of oxidative stress and root anatomical traits under drought stress. (b) Confusion matrix showing model predictions across three drought response classes (tolerant, moderate, and susceptible). The model correctly classified all susceptible cultivars and showed high performance on tolerant cultivars, with minor misclassification in the moderate group. (c) Multiclass ROC curves using a one-vs.-rest strategy. The model achieved AUC values of 0.99 for both susceptible and tolerant classes, and 0.94 for the moderate class, confirming strong discriminative ability.
Collectively, these findings underscore the utility of random forest models for drought response classification in rice and highlight interpretable, biologically relevant traits that can support future phenotypic screening and breeding strategies under water-limited conditions.
3.3. Neural Network Model Analysis
The multi-layer perceptron (MLP) neural network exhibited strong performance in classifying rice genotypes into drought tolerance categories, namely moderate, susceptible, and tolerant, based on physiological and root anatomical features. As illustrated in the confusion matrix (Figure 3a), the model accurately identified most instances of the susceptible and tolerant classes, while a degree of overlap was observed in the moderate group, which is biologically plausible given its intermediate phenotype. This trend was further confirmed by the ROC curves (Figure 3b), which revealed high discriminative ability with area under the curve (AUC) values of 0.98 for the susceptible class, 0.95 for the tolerant, and 0.91 for the moderate. These results underscore the model’s capacity to capture complex, non-linear patterns in the input data and reflect its strength in multi-class classification under physiological heterogeneity.
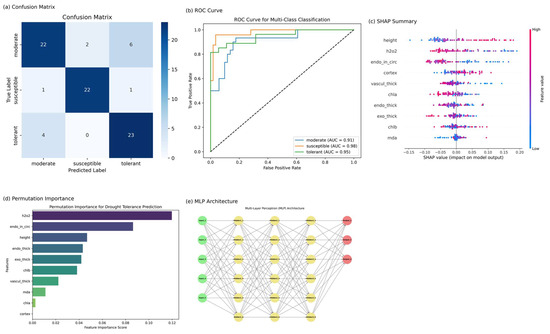
Figure 3.
Integrated visualization of model performance and feature contribution in drought classification. (a) Confusion matrix: performance evaluation of the optimized ensemble classifier (random forest + SVM) on the test dataset. Class-wise prediction accuracy is presented for three drought tolerance categories: moderate, susceptible, and tolerant. (b) ROC curve: receiver operating characteristic (ROC) curves for the multi-class classification task, with class-specific area under the curve (AUC) values reported. The ensemble model demonstrates high discriminative power, particularly for the susceptible class (AUC = 0.98). (c) SHAP Summary: SHAP (Shapley additive explanations) values for classifying susceptible genotypes reveal the directional impact of each feature on model output. Key traits such as plant height, hydrogen peroxide content (H2O2), and endodermis inner circumference show the strongest influence. (d) Permutation importance: Global feature importance derived from permutation analysis of the random forest model. Physiological (H2O2) and anatomical (endodermis, cortex) variables emerge as critical determinants of drought tolerance prediction. (e) MLP architecture: Schematic of the multi-layer perceptron (MLP) model used in the study. The network consists of 10 input nodes, three hidden layers (with 512, 256, and 128 neurons), and a softmax-activated output layer. Nodes are color-coded by layer type: green (input), yellow (hidden), and red (output).
To gain insight into the internal decision-making process of the MLP, we applied SHAP (Shapley additive explanations) and permutation importance techniques (Figure 3c,d). Both analyses consistently highlighted hydrogen peroxide (H2O2), plant height, and endodermis inner circumference as the most influential features driving the model’s predictions—an alignment that reinforces their biological relevance in drought stress response. SHAP summary plots revealed that higher values of these traits increased the likelihood of a genotype being classified as susceptible, suggesting a physiological profile marked by oxidative stress and elongation. Permutation importance rankings confirmed this pattern, with H2O2 emerging as the top predictor. The architecture of the MLP model (Figure 3e) consisted of ten input nodes connected to three hidden layers of 512, 256, and 128 neurons, followed by a three-node softmax output layer. This design allowed the model to learn intricate interactions among input traits, enabling accurate classification while maintaining interpretability through post hoc explanation methods. These findings collectively demonstrate the effectiveness of neural network-based modeling in elucidating the physiological and anatomical signatures of drought tolerance in rice.
3.4. Stacking Ensemble Model Analysis
To enhance classification performance and model explainability, we implemented a stacking ensemble strategy that integrated four base classifiers, namely random forest (RF), XGBoost (XGB), support vector machine (SVM), and multi-layer perceptron (MLP), into a two-layer stacking framework with logistic regression as the meta-learner. While the initial ensemble performance stabilized at an accuracy of 0.7727, further optimization was achieved by incorporating SHAP-based feature selection. Using SHAP (Shapley additive explanations), we quantified the contribution of each input trait and subsequently retrained all base models using the top 10 most influential features. This refined stacking ensemble model reached a final test accuracy of 0.8181, representing the best-performing configuration in our study. The SHAP interaction plot (Figure 4a) reveals important nonlinear interdependencies among key physiological traits, particularly between cortex, chla, and chlb. These interactions suggest that drought responsiveness cannot be fully captured by individual traits in isolation, highlighting the need for models that accommodate synergistic physiological effects.
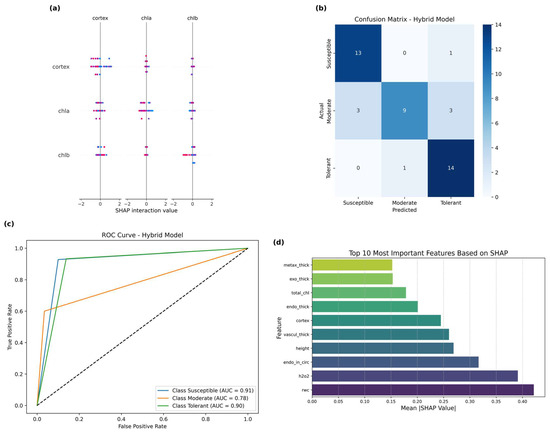
Figure 4.
Performance evaluation and model interpretation of the SHAP-optimized stacking ensemble model for drought tolerance classification. (a) SHAP interaction plot illustrating second-order relationships among three key physiological traits: cortex, chla, and chlb. The x-axis represents SHAP interaction values, highlighting synergistic or antagonistic feature effects on classification outcomes. (b) Confusion matrix of the final stacking ensemble model, showing class-wise prediction accuracy across three drought response categories: susceptible, moderate, and tolerant. High classification accuracy was observed in the tolerant group (recall = 0.93). (c) Receiver operating characteristic (ROC) curves for multiclass classification performance. The model achieved area under the curve (AUC) values of 0.91, 0.78, and 0.90 for susceptible, moderate, and tolerant classes, respectively. (d) Ranked bar plot of the top 10 most important features based on mean absolute SHAP values. Physiological parameters, including rwc (relative water content) and H2O2 (hydrogen peroxide), were among the most influential, alongside key root anatomical traits such as endo_in_circ, vascul_thick, and cortex, suggesting the combined importance of water retention, oxidative stress response, and structural resilience under drought conditions.
Classification performance across three drought-responsiveness classes (susceptible, moderate, and tolerant) was evaluated via a confusion matrix analysis (Figure 4b). The stacking ensemble model correctly identified tolerant genotypes with high reliability (recall = 0.93), while maintaining balanced precision across other classes. A corresponding ROC analysis (Figure 4c) demonstrated strong overall discriminative capacity, with area under the curve (AUC) values of 0.91, 0.78, and 0.90 for the susceptible, moderate, and tolerant groups, respectively. The SHAP-derived importance rankings (Figure 3d) consistently prioritized traits linked to oxidative stress response and anatomical resilience. Physiological markers such as relative water content (RWC) and hydrogen peroxide (H2O2) emerged as the most influential, followed by root anatomical metrics, including endo_in_circ, vascul_thick, and cortex. These results suggest that both hydraulic maintenance under water stress and root structural adaptations play pivotal roles in conferring drought tolerance—particularly among landrace cultivars with intermediate phenotypes.
3.5. Model Comparison and Statistical Validation
To comprehensively assess model performance, we compared random forest (RF), multi-layer perceptron (MLP), and the stacking ensemble across ten standard metrics using both the best single train–test split and five-fold cross-validation (Table 2). Random forest demonstrated the highest mean values across most metrics in five-fold cross-validation, including accuracy (0.546 ± 0.067), balanced accuracy (0.469 ± 0.054), macro precision (0.494 ± 0.052), macro recall (0.469 ± 0.054), and macro F1-score (0.459 ± 0.058). RF also had the highest mean ROC AUC (0.730 ± 0.033) and the lowest mean log loss (0.946 ± 0.032) and hamming loss (0.454 ± 0.077), indicating strong and consistent multi-class classification. The stacking ensemble achieved the highest single-split performance in terms of accuracy (0.818), balanced accuracy (0.821), macro precision (0.830), and macro F1-score (0.812), illustrating its potential for optimal classification when trained and tested on a specific data split. However, its cross-validated mean metrics were generally lower than RF, with greater variability (accuracy 0.433 ± 0.100, hamming loss 0.567 ± 0.093). The MLP model performed moderately across all metrics, with cross-validated means between those of the RF and stacking ensemble for some metrics. Notably, MLP had the lowest single-split log loss (0.555), reflecting fewer high-confidence errors under optimal conditions. Statistical comparisons (Table 3) revealed that the differences between RF and stacking ensemble, and between RF and MLP, were statistically significant for balanced accuracy, precision, F1-score, ROC AUC, log loss, MCC, and kappa (p < 0.05 in most cases), consistently favoring random forest for generalizability. Stacking ensemble’s higher best single-split metrics suggest it may be more sensitive to specific data partitions.
Table 2.
Mean (±SD) across 5 folds and best single-split for each model.
Table 3.
Statistical comparison of model performance across 10 metrics (p-values).
4. Discussion
The integration of physiological and root anatomical traits in this study provided new insights into the complex mechanisms underlying drought tolerance in rice. Across all three machine learning (ML) approaches, namely random forest (RF), multi-layer perceptron (MLP), and a SHAP-optimized stacking ensemble, the consistent emergence of oxidative stress markers (notably hydrogen peroxide, H2O2), root anatomical structures (such as endodermis inner circumference and vascular cylinder thickness), and classical physiological indicators (like relative water content, RWC, and plant height) as top-ranked features underscores their central role in mediating adaptive responses to water deficit.
Hydrogen peroxide (H2O2), identified as the most influential trait across models, plays a dual role in drought stress: as a damaging reactive oxygen species (ROS) and as a signaling molecule involved in stress-responsive gene expression [7,8,9]. Under drought, ROS accumulation—especially H2O2—is commonly observed due to enhanced photorespiration and disrupted electron transport chains in chloroplasts [3,7]. Our results reinforce previous findings that oxidative stress markers, particularly H2O2, are reliable indicators of drought sensitivity and can serve as early biomarkers for genotype screening [8,20].
Relative water content (RWC) emerged as a strong physiological predictor, reflecting the plant’s ability to maintain cellular hydration during drought—a classic trait associated with drought avoidance mechanisms [5,6,16]. Its significant correlation with chlorophyll content observed in this study is consistent with established physiological theories where RWC preservation helps maintain chloroplast integrity and delay senescence [3,11,16].
The anatomical traits, especially endodermis inner circumference and vascular cylinder thickness, provided mechanistic insights into water uptake and retention strategies. These structures are central to regulating radial water flow and limiting uncontrolled water loss through apoplastic pathways [30,33]. A thicker endodermis is associated with enhanced suberization and Casparian strip formation, which increase root selectivity and protect against desiccation [28,30]. Similarly, a robust vascular cylinder facilitates efficient axial water transport, improving water use under limited availability—a trait linked to improved drought adaptation in maize and other cereals [28,33].
The cortex area, often overlooked in drought phenotyping, showed strong interactions with photosynthetic traits such as chlorophyll a and b in the SHAP interaction analyses. Recent reports suggest that the development of root cortical aerenchyma and reduced metabolic activity in the cortex can enhance drought adaptation by lowering root respiration and facilitating deeper rooting [28,34]. These results align with the growing emphasis on integrating root anatomical efficiency into drought-tolerant ideotypes [28,30].
Interestingly, plant height, a trait traditionally associated with agronomic performance, also surfaced as a key predictor in both the RF and MLP models. While taller genotypes may have higher water demand, the association of height with drought tolerance could reflect favorable root-to-shoot signaling or deeper rooting capacity, particularly in landraces with balanced growth and stress adaptation [6,13,16]. These findings warrant further exploration into the physiological trade-offs between vegetative growth and stress resilience.
The stacking ensemble model, achieving the highest classification accuracy (81.81%), illustrated the power of combining diverse algorithms—each capturing distinct trait interaction patterns. Importantly, the SHAP-based feature refinement retained only biologically meaningful predictors, improving both interpretability and model performance. This layered approach supports earlier findings that ensemble learning, particularly stacking, enhances classification reliability in complex phenotypic datasets [37,38].
Beyond single train–test split evaluations, our use of five-fold cross-validation with ten complementary metrics provided a rigorous assessment of model generalizability and reliability. Random forest consistently demonstrated the highest mean performance across accuracy, balanced accuracy, precision, recall, F1-score, and ROC AUC, indicating its robustness for classifying drought tolerance under diverse data splits. The stacking ensemble, while achieving the highest peak accuracy in the best split, showed greater variability across folds—highlighting its sensitivity to data partitioning, but also its potential for optimal classification under certain scenarios. Importantly, the best single split remains valuable from a biological perspective, as it may represent the optimal conditions or data structure encountered in specific breeding programs or field environments. Nevertheless, single split results can overestimate performance due to chance data partitioning, while cross-validation provides a more balanced estimate of model generalizability—though still limited by sample size and experimental scope. Statistical comparisons revealed that the differences between models were significant for several key metrics, affirming the value of thorough multi-metric validation in phenotyping studies. Collectively, these results underscore the necessity of integrating both single split and cross-validated, multi-metric benchmarking to draw reliable and biologically meaningful conclusions in plant science machine-learning applications.
This study validates known mechanisms of drought tolerance and uncovers the predictive power of lesser-studied root traits, such as endodermis inner circumference. These traits can be incorporated into high-throughput phenotyping platforms using image-based anatomical screening, thus expanding the breeder’s toolbox beyond conventional physiological metrics [22,30,31]. Furthermore, the dominance of oxidative stress indicators like H2O2 across all models suggests that redox homeostasis remains a pivotal aspect of early drought stress detection and may be amenable to molecular marker-assisted selection [8,20].
Unlike previous studies that have focused exclusively on either physiological or anatomical parameters for drought response prediction [5,13], our work integrates both trait domains within a unified predictive framework. While most existing ML-based phenotyping relies on single-model classifiers or simple data fusion, we introduce a SHAP-optimized stacking ensemble that not only enhances classification accuracy but also provides interpretable insights into how trait combinations interact to influence drought tolerance [3,6]. This approach moves beyond conventional feature ranking to uncover biologically meaningful synergies between physiological and root anatomical adaptations—a dimension rarely explored in the plant phenotyping literature. By openly sharing our code and dataset, we further promote transparency and reproducibility for the wider research community.
Future research should expand this integrative ML framework by incorporating dynamic, time-series physiological measurements and field-based multi-environment trials. Additionally, coupling phenotypic data with transcriptomic and metabolomic profiling will further enhance mechanistic understanding and facilitate gene-to-trait translation [22,23,31]. Such interdisciplinary pipelines could accelerate breeding for resilience, especially under climate-induced drought variability.
With all code and data openly available, this pipeline can now be directly implemented in rice-breeding programs or adapted for high-throughput phenotyping platforms. Ongoing work will focus on piloting these models in field environments and integrating them into breeding pipelines for rapid cultivar screening.
Limitations: While this study demonstrates the predictive value of integrative ML models for drought tolerance, it is constrained by reliance on greenhouse, seedling-stage data and a moderate sample size. Larger, field-based, and multi-environment trials are needed to establish generalizability. Moreover, as the models are based on early phenotypic traits and short-term stress, future research should incorporate time-series and multi-omics data and assess applicability to long-term and reproductive-stage drought responses.
5. Conclusions
This study demonstrated the value of integrating physiological and root anatomical traits with advanced machine-learning models to classify drought tolerance in rice. Through a comparative analysis of random forest, multi-layer perceptron, and a SHAP-optimized stacking ensemble, we achieved high predictive accuracy and identified key biological indicators of drought response. Notably, hydrogen peroxide (H2O2), relative water content (RWC), endodermis inner circumference, vascular cylinder thickness, and cortex area consistently emerged as critical features across models.
These findings highlight the importance of oxidative stress signaling and root structural adaptations as central mechanisms of drought resilience in rice. The success of the stacking ensemble approach reinforces the value of ensemble learning in capturing complex, nonlinear trait interactions, while SHAP-based explainability offers new opportunities for interpretable, biology-driven trait selection.
Moving forward, the integration of these insights into breeding pipelines—supported by high-throughput phenotyping and field validation—could accelerate the development of drought-resilient rice cultivars. This work underscores the potential of AI-guided, trait-informed strategies for addressing agricultural challenges under climate change.
Supplementary Materials
The following supporting information can be downloaded at: Raw data file: https://docs.google.com/spreadsheets/d/1UWMTjAXj4jf-YTm_FPSVSWypj3GsZk-a/edit?usp=drive_link&ouid=102385778533248453463&rtpof=true&sd=true (accessed on 18 June 2025). Technical Algorithms and Mathematical Formulations: https://docs.google.com/document/d/1l01g5OqQbWbW_Vb45qwl8AZXP33hvVXg/edit?usp=sharing&ouid=102385778533248453463&rtpof=true&sd=true (accessed on 17 July 2025). Detailed Python Workflow for Data Preprocessing, Model Training, and Evaluation: https://docs.google.com/document/d/1jGA6zUL1FG5Pm1NaQI3NVJAjZLuTYtBM/edit?usp=sharing&ouid=102385778533248453463&rtpof=true&sd=true (accessed on 17 July 2025).
Author Contributions
Conceptualization, W.G., N.K., H.C., and P.P.; Data curation, W.G. and P.P.; Formal analysis, W.G. and P.P.; Funding acquisition, P.P.; Investigation, W.G., N.K., H.C., and P.P.; Methodology, W.G., N.K., and P.P.; Project administration, P.P.; Writing—original draft, W.G. and P.P.; Writing—review and editing, W.G. and P.P. All authors have read and agreed to the published version of the manuscript.
Funding
This research was funded by the Research and Innovation Fund, Nakhon Phanom University with the fundamental fund of the year 2023. The grant number FF15/2566.
Data Availability Statement
All raw data supporting the findings of this study are available in the Supplementary Materials and can be accessed via the following publicly shared link: https://docs.google.com/spreadsheets/d/1UWMTjAXj4jf-YTm_FPSVSWypj3GsZk-a/edit?usp=drive_link&ouid=102385778533248453463&rtpof=true&sd=true (accessed on 18 June 2025). The dataset includes detailed measurements of rice seedling growth, physiological parameters (e.g., chlorophyll content, malondialdehyde, and hydrogen peroxide), and root anatomical traits under control and drought conditions. This open-access file enables transparency and reproducibility of the machine-learning-based analyses described in the manuscript. Researchers are encouraged to use or adapt the dataset for further comparative studies, model training, or validation purposes, with appropriate citation of this work.
Acknowledgments
The authors express gratitude to the Faculty of Science, Nakhon Phanom University, for laboratory facilities, and the Sakon Nakhon Rice Research Center for providing rice seeds for this study. During the preparation of this publication, the authors used ChatGPT-4o (OpenAI, version as of June 2025) to support the drafting of the methodology section and preliminary coding tasks. All AI-assisted content was reviewed and edited by the authors, who take full responsibility for the final publication’s accuracy and integrity.
Conflicts of Interest
The authors declare no conflicts of interest related to the content of this manuscript. All analyses, interpretations, and conclusions presented are solely the result of the authors’ academic work and scientific judgment. The funders had no role in the design of the study; in the collection, analysis, or interpretation of the data; in the writing of the manuscript; or in the decision to publish the results. The authors affirm that there were no financial, personal, or professional interests that could be perceived to have influenced the outcome of this research.
Abbreviations
The following abbreviations are used in this manuscript:
| AI | Artificial Intelligence |
| AUC | Area Under the Curve |
| Chla | Chlorophyll a |
| Chlb | Chlorophyll b |
| DL | Deep Learning |
| FW | Fresh Weight |
| H2O2 | Hydrogen Peroxide |
| MDA | Malondialdehyde |
| ML | Machine Learning |
| MLP | Multi-Layer Perceptron |
| PEG | Polyethylene Glycol |
| RF | Random Forest |
| RWC | Relative Water Content |
| SHAP | Shapley Additive Explanations |
| SMOTE | Synthetic Minority Over-sampling Technique |
| SVM | Support Vector Machine |
| TW | Turgid Weight |
| DW | Dry Weight |
| ROC | Receiver Operating Characteristic |
| TCA | Trichloroacetic Acid |
| TBA | Thiobarbituric Acid |
| FAA | Formalin-Acetic Acid-Alcohol |
Appendix A
Table A1.
List of rice cultivars used in the study, their drought tolerance classification, and cultivar type.
Table A1.
List of rice cultivars used in the study, their drought tolerance classification, and cultivar type.
| Cultivar | Drought Tolerant Class | Type |
|---|---|---|
| Kab yang | tolerant | Landrace |
| Kam | tolerant | Landrace |
| Khao soi | moderate | Landrace |
| Luang bunma | moderate | Landrace |
| Luang kaeo | susceptible | Landrace |
| Hang nak | tolerant | Landrace |
| Hom thung | moderate | Landrace |
| Long ma | moderate | Landrace |
| Samart | susceptible | Landrace |
| Sam ruang | moderate | Landrace |
| Mae phueng | moderate | Landrace |
| Mayom | moderate | Landrace |
| Mafai | moderate | Landrace |
| Maprang | moderate | Landrace |
| Dor yuan | susceptible | Landrace |
| Jaew daeng | moderate | Landrace |
| Khithom dam | susceptible | Landrace |
| Phra in | tolerant | Landrace |
| I-daeng noi | moderate | Landrace |
| I-khiao non thung | tolerant | Landrace |
| CT9993 | tolerant | Tolerant check (CT9993) |
| KDMLl105 | moderate | Susceptible check (KDML105) |
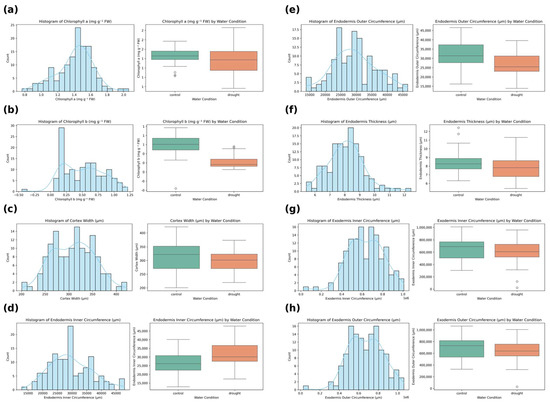
Figure A1.
Distribution and water condition effects on key physiological and anatomical traits in rice cultivars. Histograms and boxplots illustrate the frequency distribution and treatment effects (control vs. drought) for eight selected traits: (a) Chlorophyll a content, (b) chlorophyll b content, (c) cortex width, (d) endodermis inner circumference, (e) endodermis outer circumference, (f) endodermis thickness, (g) exodermis inner circumference, and (h) exodermis outer circumference. Each panel shows a histogram with a kernel density estimation and a corresponding boxplot comparing values under control and drought conditions. The results reveal distinct shifts in anatomical and physiological parameters under drought stress, with potential implications for drought-response mechanisms among rice genotypes.

Figure A2.
Pearson correlation heatmap of physiological and anatomical traits in rice under water stress conditions. The heatmap illustrates the pairwise Pearson correlation coefficients among 16 key traits, including plant height, relative water content (RWC), malondialdehyde (MDA), hydrogen peroxide (H2O2), chlorophyll a (Chl a), chlorophyll b (Chl b), total chlorophyll, and various root anatomical parameters (e.g., metaxylem thickness, endodermis and exodermis circumferences, and vascular cylinder thickness). Stronger positive correlations are indicated in red, while negative correlations appear in blue. Notably, strong positive correlations were observed among root anatomical traits such as endodermis inner/outer circumference, exodermis inner/outer circumference, vascular thickness, and cortex width (r > 0.7). A significant negative correlation was found between RWC and MDA (r = −0.59), reflecting physiological stress responses. This matrix provides insight into trait interdependencies relevant to drought tolerance.
References
- Barkla, B.J.; Garibay-Hernández, A.; Melzer, M.; Rupasinghe, T.W.T.; Roessner, U. Single Cell-type Analysis of Cellular Lipid Remodelling in Response to Salinity in the Epidermal Bladder Cells of the Model Halophyte Mesembryanthemum crystallinum. Plant Cell Environ. 2018, 41, 2390–2403. [Google Scholar] [CrossRef]
- Farooq, M.; Wahid, A.; Kobayashi, N.; Fujita, D.; Basra, S.M.A. Plant Drought Stress: Effects, Mechanisms and Management. Agron. Sustain. Dev. 2009, 29, 185–212. [Google Scholar] [CrossRef]
- Chaves, M.M.; Flexas, J.; Pinheiro, C. Pinheiro Photosynthesis under Drought and Salt Stress: Regulation Mechanisms from Whole Plant to Cell. Ann. Bot. 2009, 103, 551–560. [Google Scholar] [CrossRef]
- Lawlor, D.W.; Cornic, G. Cornic Photosynthetic Carbon Assimilation and Associated Metabolism in Relation to Water Deficits in Higher Plants. Plant Cell Environ. 2002, 25, 275–294. [Google Scholar] [CrossRef] [PubMed]
- Barrs, H.D.; Weatherley, P.E. Weatherley A Re-Examination of the Relative Turgidity Technique for Estimating Water Deficits in Leaves. Aust. J. Biol. Sci. 1962, 15, 413–428. [Google Scholar] [CrossRef]
- Yue, B.; Xue, W.; Xiong, L.; Yu, X.; Luo, L.; Cui, K.; Jin, D.; Xing, Y.; Zhang, Q. Genetic Basis of Drought Resistance at Reproductive Stage in Rice: Separation of Drought Tolerance from Drought Avoidance. Genetics 2006, 172, 1213–1228. [Google Scholar] [CrossRef]
- Mittler, R. Oxidative Stress, Antioxidants and Stress Tolerance. Trends Plant Sci. 2002, 7, 405–410. [Google Scholar] [CrossRef]
- Apel, K.; Hirt, H. REACTIVE OXYGEN SPECIES: Metabolism, Oxidative Stress, and Signal Transduction. Annu. Rev. Plant Biol. 2004, 55, 373–399. [Google Scholar] [CrossRef]
- Hasanuzzaman, M.; Nahar, K.; Alam, M.M.; Roychowdhury, R.; Fujita, M. Physiological, Biochemical, and Molecular Mechanisms of Heat Stress Tolerance in Plants. Int. J. Mol. Sci. 2019, 14, 9643–9684. [Google Scholar] [CrossRef] [PubMed]
- Ding, Y.; Shi, Y.; Yang, S. Molecular Regulation of Plant Responses to Environmental Temperatures. Molecular Plant. 2020, 13, 544–564. [Google Scholar] [CrossRef]
- Flexas, J.; Bota, J.; Loreto, F.; Cornic, G.; Sharkey, T.D. Diffusive and Metabolic Limitations to Photosynthesis under Drought and Salinity in C3 Plants. Plant Biol. 2004, 6, 269–279. [Google Scholar] [CrossRef]
- Blum, A. Effective Use of Water (EUW) and Not Water-Use Efficiency (WUE) Is the Target of Crop Yield Improvement under Drought Stress. Field Crops Res. 2019, 112, 119–123. [Google Scholar] [CrossRef]
- Hallajian, M.T.; Ebadi, A.A.; Kordrostami, M. Advancing Rice Breeding for Drought Tolerance: A Comprehensive Study of Traditional and Mutant Lines through Agronomic Performance and Drought Tolerance Indices. BMC Plant Biol. 2024, 24, 1087. [Google Scholar] [CrossRef] [PubMed]
- Tuberosa, R. Phenotyping for Drought Tolerance of Crops in the Genomics Era. Front. Physio. 2012, 3, 347. [Google Scholar] [CrossRef] [PubMed]
- Ndikuryayo, C.; Ndayiragije, A.; Kilasi, N.L.; Kusolwa, P. Identification of Drought Tolerant Rice (Oryza sativa L.) Genotypes with Asian and African Backgrounds. Plants 2023, 12, 922. [Google Scholar] [CrossRef] [PubMed]
- Kadam, N.N.; Xiao, G.; Melgar, R.J.; Bahuguna, R.N.; Quinones, C.; Tamilselvan, A.; Prasad, P.V.V.; Jagadish, S.V.K. Chapter Three-Agronomic and Physiological Responses to High Temperature, Drought, and Elevated CO2 Interactions in Cereals. Adv. Agron. 2014, 127, 111–156. [Google Scholar] [CrossRef]
- Visakh, R.L.; Anand, S.; Nalishma, R.; Sah, R.P.; Beena, R. Unlocking Rice Drought Tolerance through Affordable Phenotyping Methods. Plant Physiol. Rep. 2024, 29, 726–735. [Google Scholar] [CrossRef]
- Zhao, C.; Zhang, Y.; Du, J.; Guo, X.; Wen, W.; Gu, S.; Wang, J.; Fan, J. Crop Phenomics: Current Status and Perspectives. Front. Plant Sci. 2019, 12, 620–634. [Google Scholar] [CrossRef]
- Montesinos-López, O.A.; Montesinos-López, A.; Crossa, J.; Toledo, F.H.; Pérez-Hernández, O.; Eskridge, K.M.; Rutkoski, J. A Review of Deep Learning Applications for Genomic Selection. BMC Genom. 2021, 22, 19. [Google Scholar] [CrossRef]
- Anand, S.; Visakh, R.L.; Nalishma, R.; Sah, R.P.; Beena, R. High Throughput Phenomics in Elucidating Drought Stress Responses in Rice (Oryza sativa L.). J. Plant Biochem. Biotechnol. 2024, 33, 150–165. [Google Scholar] [CrossRef]
- Furbank, R.T.; Tester, M. Phenomics—Technologies to Relieve the Phenotyping Bottleneck. Trends Plant Sci. 2023, 16, 635–644. [Google Scholar] [CrossRef]
- Cembrowska-Lech, D.; Krzemińska, A.; Miller, T.; Nowakowska, A.; Adamski, C.; Radaczyńska, M.; Mikiciuk, G.; Mikiciuk, M. An Integrated Multi-Omics and Artificial Intelligence Framework for Advance Plant Phenotyping in Horticulture. Biology 2023, 12, 1298. [Google Scholar] [CrossRef]
- Murmu, S.; Sinha, D.; Chaurasia, H.; Sharma, S.; Das, R.; Jha, G.K.; Archak, S. A Review of Artificial Intelligence-Assisted Omics Techniques in Plant Defense: Current Trends and Future Directions. Front. Plant Sci. 2024, 15, 1292054. [Google Scholar] [CrossRef]
- Wang, Q.; Zhao, L.; Wang, M.; Wu, J.; Zhou, W.; Zhang, Q.; Deng, M. A Random Forest Model for Drought: Monitoring and Validation for Grassland Drought Based on Multi-Source Remote Sensing Data. Remote Sens. 2022, 14, 4981. [Google Scholar] [CrossRef]
- Okyere, F.G.; Cudjoe, D.K.; Virlet, N.; Castle, M.; Riche, A.B.; Greche, L.; Mohareb, F.; Simms, D.; Mhada, M.; Hawkesford, M.J. Hyperspectral Imaging for Phenotyping Plant Drought Stress and Nitrogen Interactions Using Multivariate Modeling and Machine Learning Techniques in Wheat. Remote Sens. 2024, 16, 3446. [Google Scholar] [CrossRef]
- Barbedo, J. A Review on the Use of Unmanned Aerial Vehicles and Imaging Sensors for Monitoring and Assessing Plant Stresses. Drones 2019, 3, 40. [Google Scholar] [CrossRef]
- Xing, D.; Wang, Y.; Sun, P.; Huang, H.; Lin, E. A CNN-LSTM-Att Hybrid Model for Classification and Evaluation of Growth Status under Drought and Heat Stress in Chinese Fir (Cunninghamia lanceolata). Plant Methods 2023, 19, 66. [Google Scholar] [CrossRef] [PubMed]
- Lynch, J.P. Steep, Cheap and Deep: An Ideotype to Optimize Water and N Acquisition by Maize Root Systems. Ann. Bot. 2013, 112, 347–357. [Google Scholar] [CrossRef]
- Yamauchi, T.; Noshita, K.; Tsutsumi, N. Climate-Smart Crops: Key Root Anatomical Traits That Confer Flooding Tolerance. Breed. Sci. 2021, 71, 51–61. [Google Scholar] [CrossRef]
- Shoaib, M.; Banerjee, B.P.; Hayden, M.; Kant, S. Roots’ Drought Adaptive Traits in Crop Improvement. Plants 2022, 11, 2256. [Google Scholar] [CrossRef] [PubMed]
- Zhao, J.; Bodner, G.; Rewald, B. Phenotyping: Using Machine Learning for Improved Pairwise Genotype Classification Based on Root Traits. Front. Plant Sci. 2016, 7, 1864. [Google Scholar] [CrossRef]
- Zhang, Y.; Jin, X.; Shi, L.; Wang, Y.; Qiao, H.; Zha, Y. A Hybrid Method for Water Stress Evaluation of Rice with the Radiative Transfer Model and Multidimensional Imaging. Plant Phenomics 2025, 7, 100016. [Google Scholar] [CrossRef]
- Licaj, I.; Felice, D.; Germinario, C.; Zanotti, C.; Fiorillo, A.; Marra, M.; Rocco, M. An Artificial Intelligence-Integrated Analysis of the Effect of Drought Stress on Root Traits of “Modern” and “Ancient” Wheat Varieties. Front. Plant Sci. 2023, 14, 1241281. [Google Scholar] [CrossRef] [PubMed]
- De Souza, G.A.R.; Baroni, D.F.; Bernado, W.D.P.; Santos, A.R.; Barcellos, L.C.D.S.; Barcelos, L.F.T.; Correia, L.Z.; De Almeida, C.M.; Verdin Filho, A.C.; Rodrigues, W.P.; et al. Leaf to Root Morphological and Anatomical Indicators of Drought Resistance in Coffea Canephora After Two Stress Cycles. Agriculture 2025, 15, 574. [Google Scholar] [CrossRef]
- Mostafa, S.; Mondal, D.; Panjvani, K.; Kochian, L.; Stavness, I. Explainable Deep Learning in Plant Phenotyping. Front. Artif. Intell. 2023, 6, 1203546. [Google Scholar] [CrossRef]
- Paul, N.; Sunil, G.C.; Horvath, D.; Sun, X. Deep Learning for Plant Stress Detection: A Comprehensive Review of Technologies, Challenges, and Future Directions. Comput. Electron. Agric. 2025, 229, 109734. [Google Scholar] [CrossRef]
- Zhao, H.; Wang, J.; Guo, J.; Hui, X.; Wang, Y.; Cai, D.; Yan, H. Detecting Water Stress in Winter Wheat Based on Multifeature Fusion from UAV Remote Sensing and Stacking Ensemble Learning Method. Remote Sens. 2024, 16, 4100. [Google Scholar] [CrossRef]
- Centorame, L.; Gasperini, T.; Ilari, A.; Del Gatto, A.; Foppa Pedretti, E. An Overview of Machine Learning Applications on Plant Phenotyping, with a Focus on Sunflower. Agronomy 2024, 14, 719. [Google Scholar] [CrossRef]
- Lundberg, S.M.; Lee, S.-I. A Unified Approach to Interpreting Model Predictions. In Advances in Neural Information Processing Systems 30 (NeurIPS 2017); Guyon, I., Von Luxburg, U., Bengio, S., Wallach, H., Fergus, R., Vishwanathan, S., Garnett, R., Eds.; Curran Associates, Inc.: Red Hook, NY, USA, 2017; pp. 4765–4774. [Google Scholar]
- Yoshida, S.; Forno, D.A.; Cock, J.H.; Gomez, K.A. Laboratory Manual for Physiological Studies of Rice, 3rd ed.; International Rice Research Institute: Manila, Philippines, 1976. [Google Scholar]
- Bates, L.S.; Waldren, R.P.; Teare, I.D. Rapid Determination of Free Proline for Water-stress Studies. Plant Soil 1973, 39, 205–207. [Google Scholar] [CrossRef]
- Heath, R.L.; Packer, L. Photoperoxidation in Isolated Chloroplasts I. Kinetics and Stoichiometry of Fatty Acid Peroxidation. Arch. Biochem. Biophys. 1968, 125, 189–198. [Google Scholar] [CrossRef]
- McKinney, W. Data Structures for Statistical Computing in Python. In Proceedings of the 9th Python in Science Conference (SciPy 2010); van der Walt, S., Millman, J., Eds.; SciPy: Austin, TX, USA, 2010; pp. 51–56. Available online: https://conference.scipy.org/proceedings/scipy2010/mckinney.html (accessed on 24 July 2025).
- Harris, C.R.; Millman, K.J.; van der Walt, S.J.; Gommers, R.; Virtanen, P.; Cournapeau, D.; Wieser, E.; Taylor, J.; Berg, S.; Smith, N.J.; et al. Array Programming with NumPy. Nature 2020, 585, 357–362. [Google Scholar] [CrossRef] [PubMed]
- Virtanen, P.; Gommers, R.; Oliphant, T.E.; Haberland, M.; Reddy, T.; Cournapeau, D.; Burovski, E.; Peterson, P.; Weckesser, W.; Bright, J.; et al. SciPy 1.0: Fundamental Algorithms for Scientific Computing in Python. Nat. Methods 2020, 17, 261–272. [Google Scholar] [CrossRef] [PubMed]
- Hunter, J.D. Matplotlib: A 2D Graphics Environment. Comput. Sci. Eng. 2007, 9, 90–95. [Google Scholar] [CrossRef]
- Waskom, M.L. Seaborn: Statistical Data Visualization. J. Open Source Softw. 2021, 6, 3021. [Google Scholar] [CrossRef]
- Seabold, S.; Perktold, J. Statsmodels: Econometric and Statistical Modeling with Python. In Proceedings of the 9th Python in Science Conference, Austin, TX, USA, 28 June–3 July 2010; pp. 92–96. [Google Scholar]
- van Rossum, G.; Drake, F.L. Python 3 Reference Manual; CreateSpace: Scotts Valley, CA, USA, 2009. [Google Scholar]
- Kluyver, T.; Ragan-Kelley, B.; P’erez, F.; Granger, B.E.; Bussonnier, M.; Frederic, J.; Kelley, K.; Hamrick, J.; Willing, C. Jupyter Notebooks—A Publishing Format for Reproducible Computational Workflows. In Proceedings of the Positioning and Power in Academic Publishing: Players, Agents and Agendas; IOS Press: Amsterdam, The Netherlands, 2016; pp. 87–90. [Google Scholar]
- Pedregosa, F.; Varoquaux, G.; Gramfort, A.; Michel, V.; Thirion, B.; Grisel, O.; Blondel, M.; Prettenhofer, P.; Weiss, R.; Dubourg, V.; et al. Scikit-Learn: Machine Learning in Python. J. Mach. Learn. Res. 2011, 12, 2825–2830. [Google Scholar]
- Abadi, M.; Barham, P.; Chen, J.; Chen, Z.; Davis, A.; Dean, J.; Devin, M.; Ghemawat, S.; Irving, G.; Isard, M.; et al. TensorFlow: A System for Large-Scale Machine Learning. In Proceedings of the 12th USENIX Symposium on Operating Systems Design and Implementation (OSDI 16), Savannah, GA, USA, 2–4 November 2016; pp. 265–283. [Google Scholar]
- Chen, T.; Guestrin, C. XGBoost: A Scalable Tree Boosting System. In Proceedings of the 22nd ACM SIGKDD International Conference on Knowledge Discovery and Data Mining, San Francisco, CA, USA, 13 August 2016; pp. 785–794. [Google Scholar]
- Chawla, N.V.; Bowyer, K.W.; Hall, L.O.; Kegelmeyer, W.P. SMOTE: Synthetic Minority Over-Sampling Technique. J. Artif. Intell. Res. 2002, 16, 321–357. [Google Scholar] [CrossRef]
- Breiman, L. Random Forests. Mach. Learn. 2001, 45, 5–32. [Google Scholar] [CrossRef]
- Rumelhart, D.E.; Hinton, G.E.; Williams, R.J. Learning Representations by Back-Propagating Errors. Nature 1986, 323, 533–536. [Google Scholar] [CrossRef]
- Ioffe, S.; Szegedy, C. Batch Normalization: Accelerating Deep Network Training by Reducing Internal Covariate Shift. arXiv 2015, arXiv:1502.03167. [Google Scholar] [CrossRef]
- Maas, A.L.; Hannun, A.Y.; Ng, A.Y. Rectifier Nonlinearities Improve Neural Network Acoustic Models. In Proceedings of the ICML, Atlanta, GA, USA, 16–21 June 2013; Volume 30, p. 3. [Google Scholar]
- Srivastava, N.; Hinton, G.; Krizhevsky, A.; Sutskever, I.; Salakhutdinov, R. Dropout: A Simple Way to Prevent Neural Networks from Overfitting. J. Mach. Learn. Res. 2014, 15, 1929–1958. [Google Scholar]
- Kingma, D.P.; Ba, J. Adam: A Method for Stochastic Optimization. arXiv 2014, arXiv:1412.6980. [Google Scholar]
- Wolpert, D.H. Stacked Generalization. Neural Netw. 1992, 5, 241–259. [Google Scholar] [CrossRef]
- Cortes, C.; Vapnik, V. Support-Vector Networks. Mach. Learn. 1995, 20, 273–297. [Google Scholar] [CrossRef]
- Provost, F.; Fawcett, T. Robust Classification for Imprecise Environments. Mach. Learn. 2001, 42, 203–231. [Google Scholar] [CrossRef]
Disclaimer/Publisher’s Note: The statements, opinions and data contained in all publications are solely those of the individual author(s) and contributor(s) and not of MDPI and/or the editor(s). MDPI and/or the editor(s) disclaim responsibility for any injury to people or property resulting from any ideas, methods, instructions or products referred to in the content. |
© 2025 by the authors. Licensee MDPI, Basel, Switzerland. This article is an open access article distributed under the terms and conditions of the Creative Commons Attribution (CC BY) license (https://creativecommons.org/licenses/by/4.0/).