
Optimizing Row Spacing and Seeding Rate for Yield and Quality of Alfalfa in Saline–Alkali Soils

 , ,
, ,
Abstract
1. Introduction
2. Materials and Methods
2.1. Experiment Site Description
2.2. Experimental Design
2.3. Measurement Indicators and Methods
2.3.1. Photosynthetic Pigments
2.3.2. Chlorophyll Fluorescence Parameters
2.3.3. Yield
2.3.4. Nutritional Quality
2.4. Statistical Analyses
3. Results
3.1. ChIM and NFI
3.2. Chlorophyll Fluorescence Parameters
3.3. Nutritional Quality
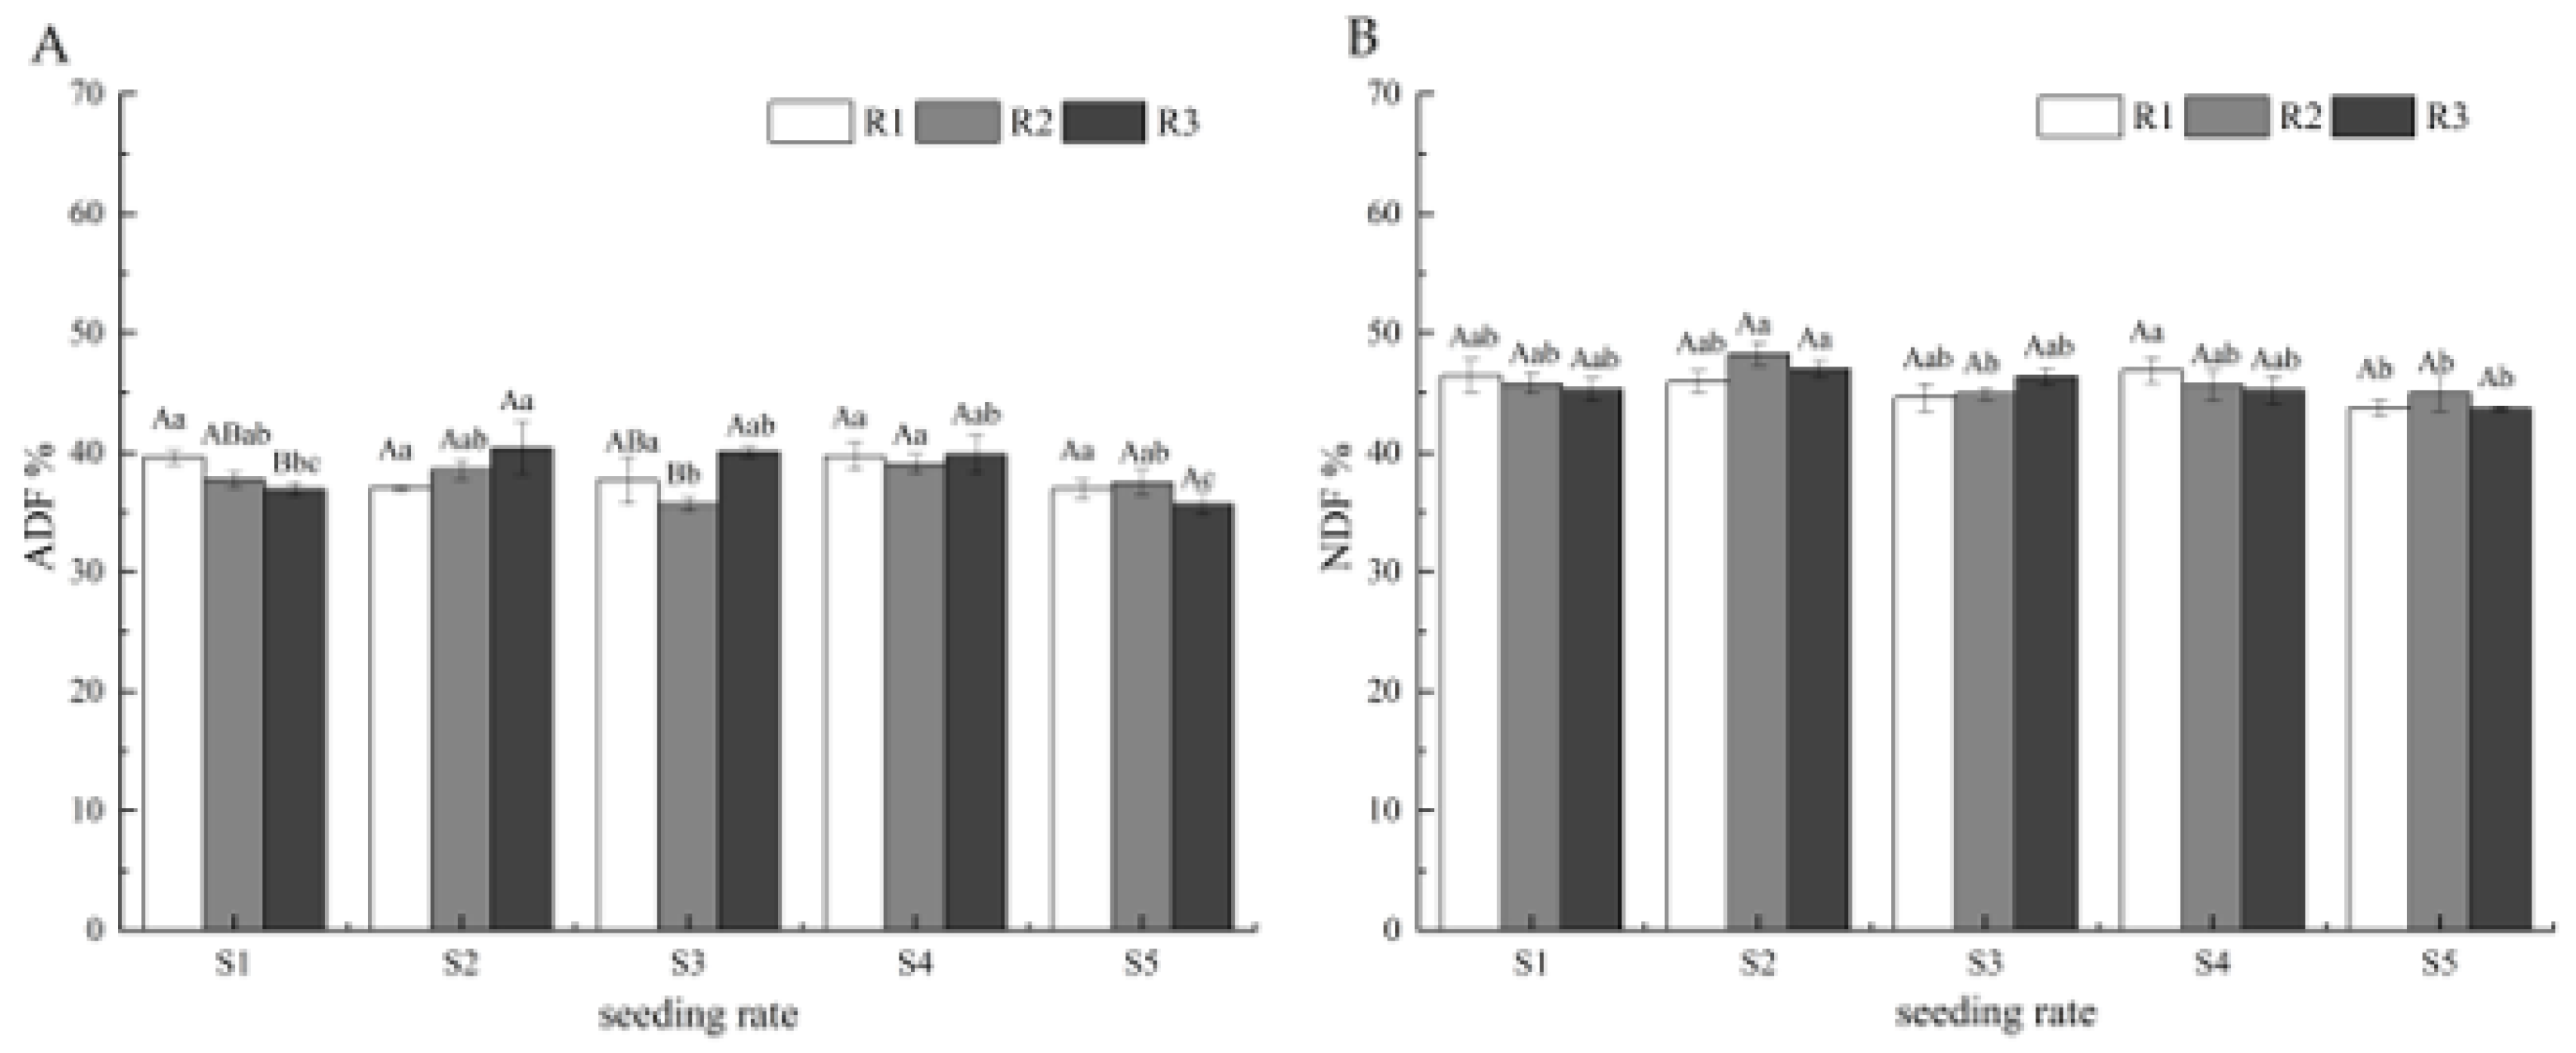
3.3.1. ADF and NDF
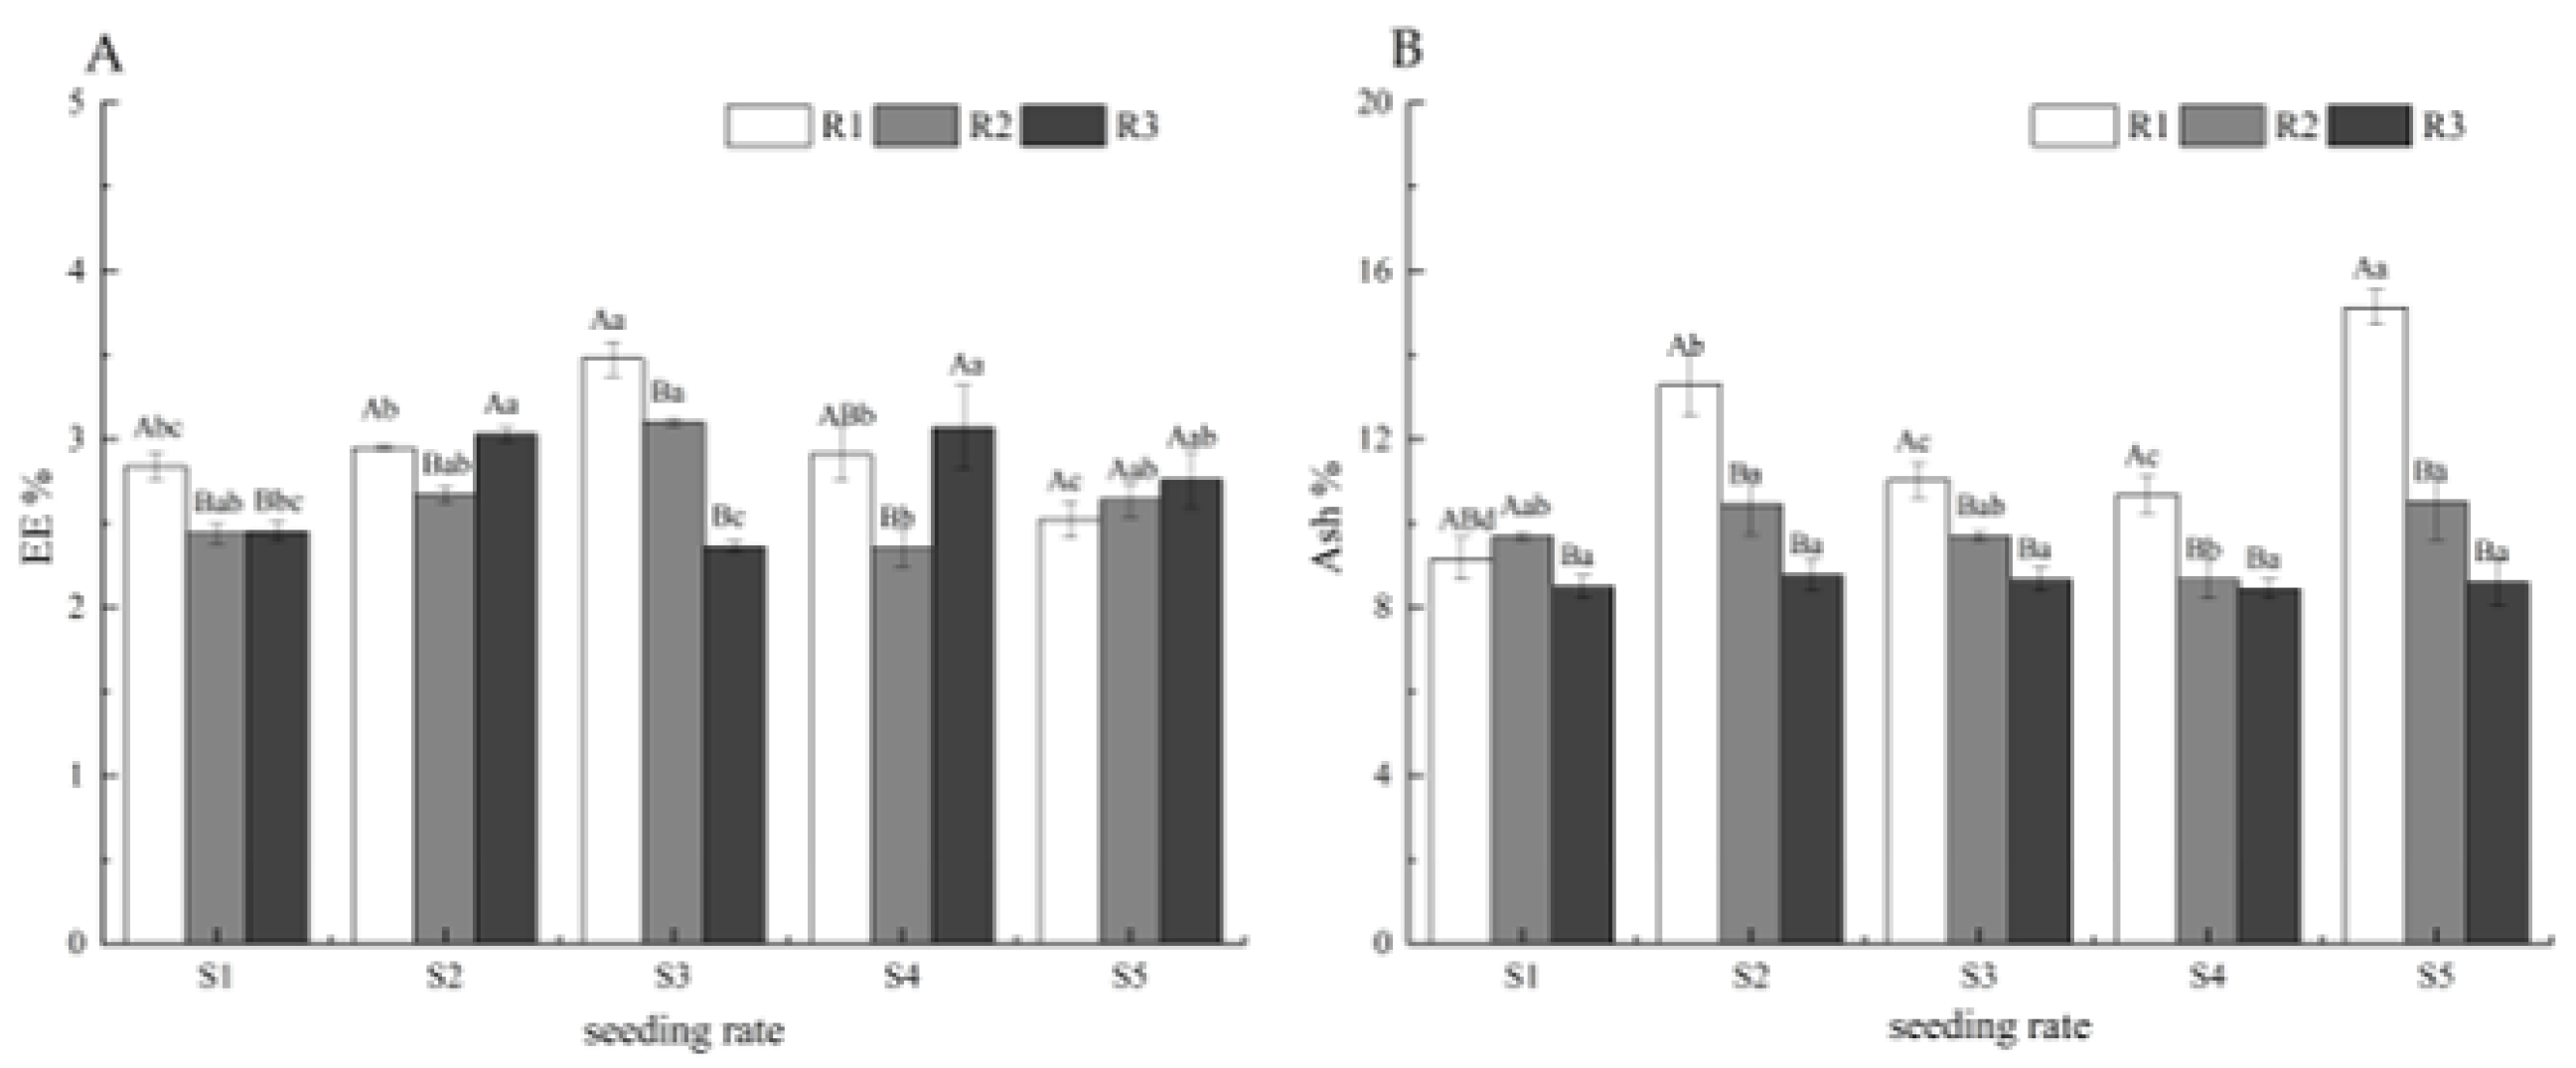
3.3.2. EE and Ash
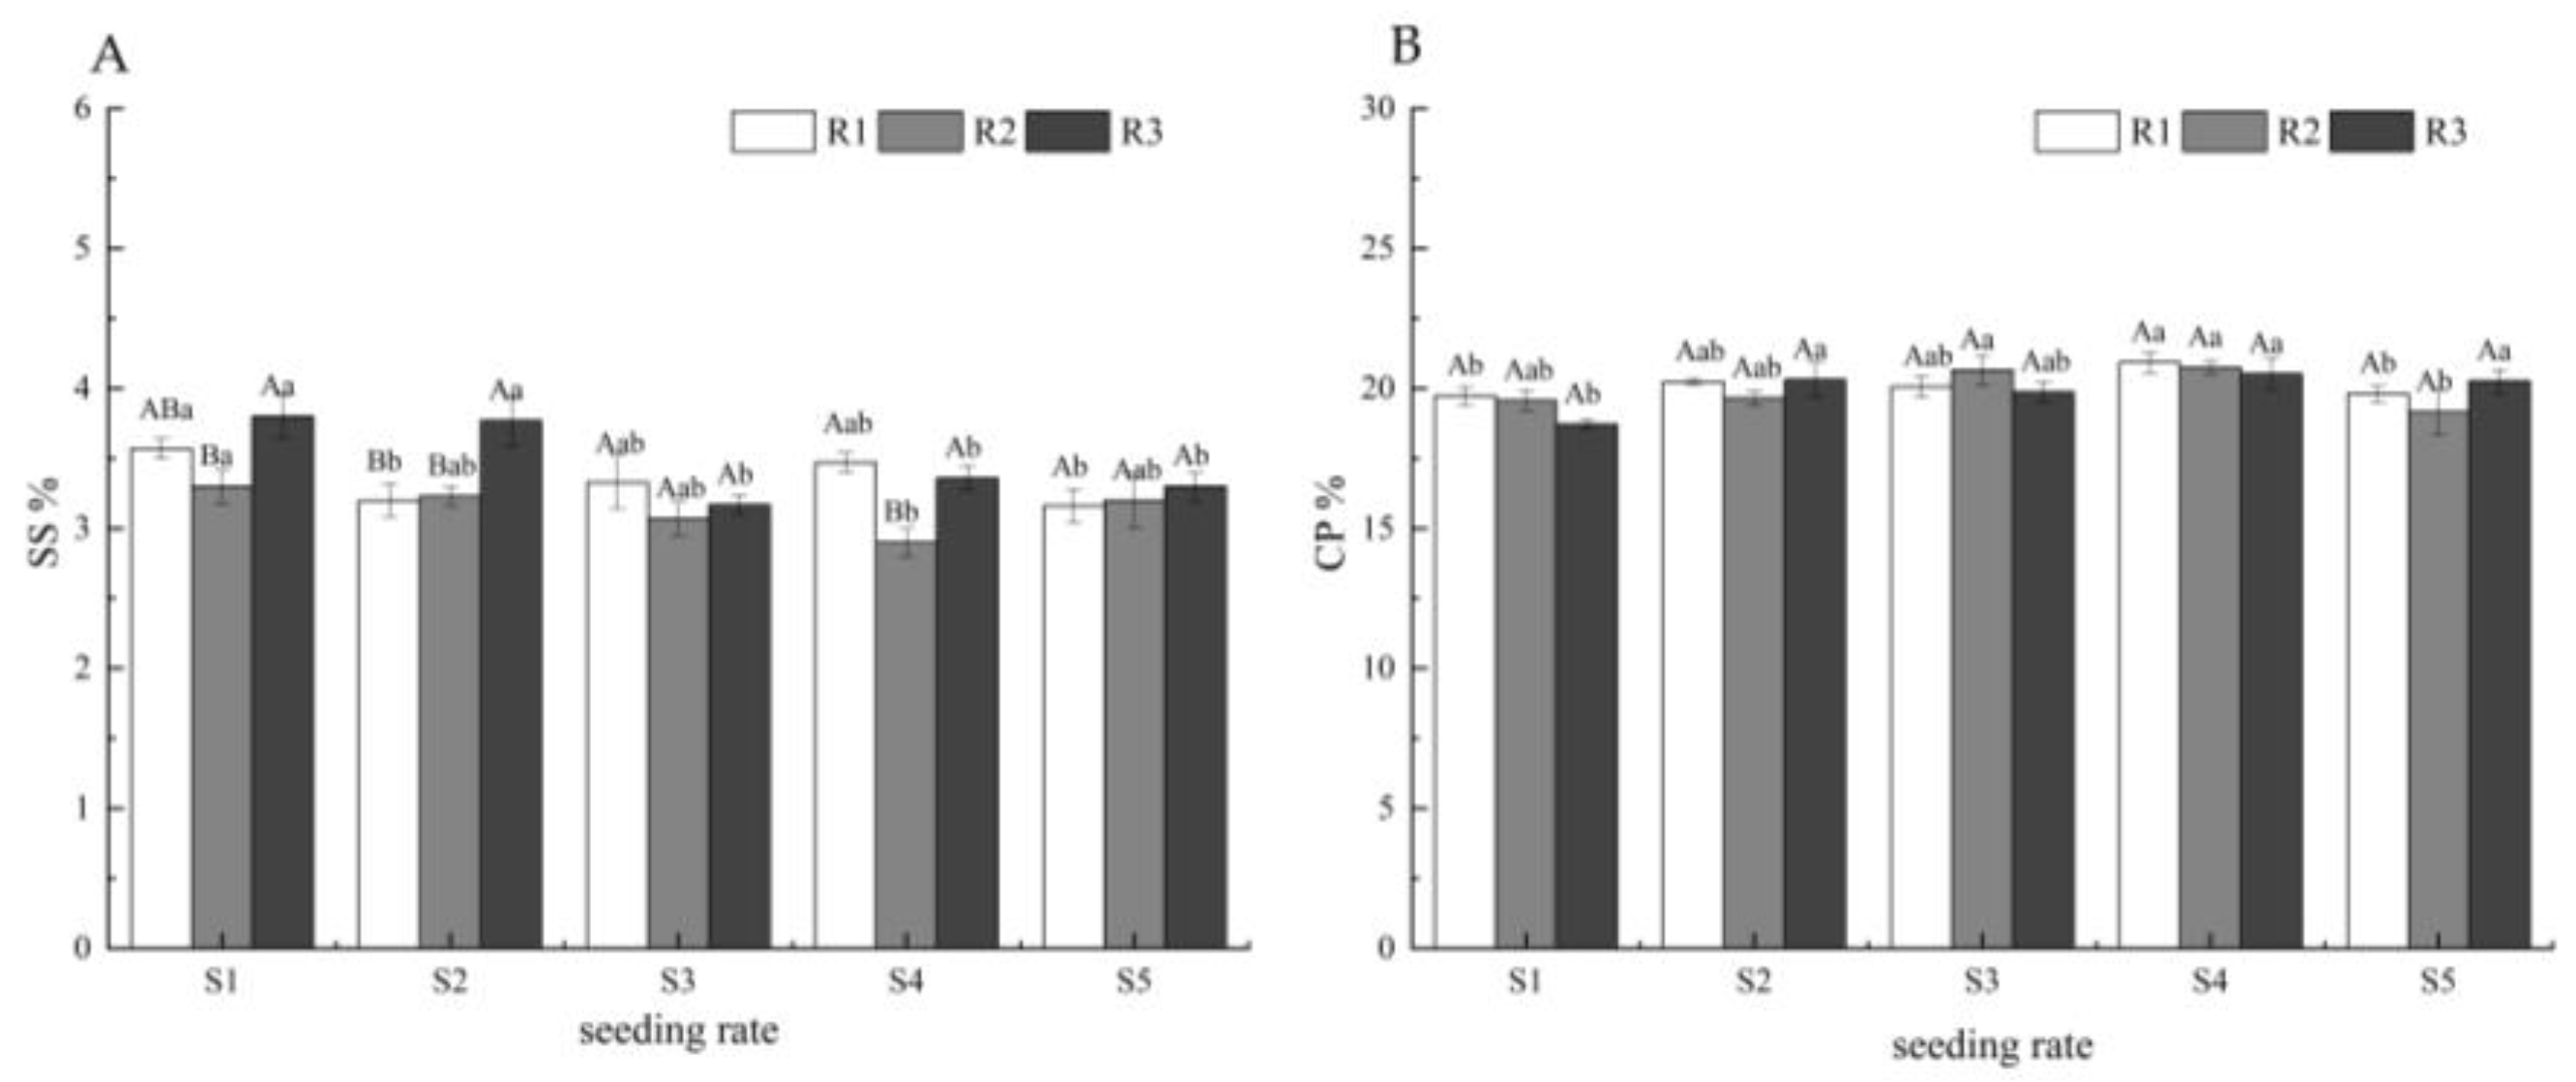
3.3.3. SS and CP
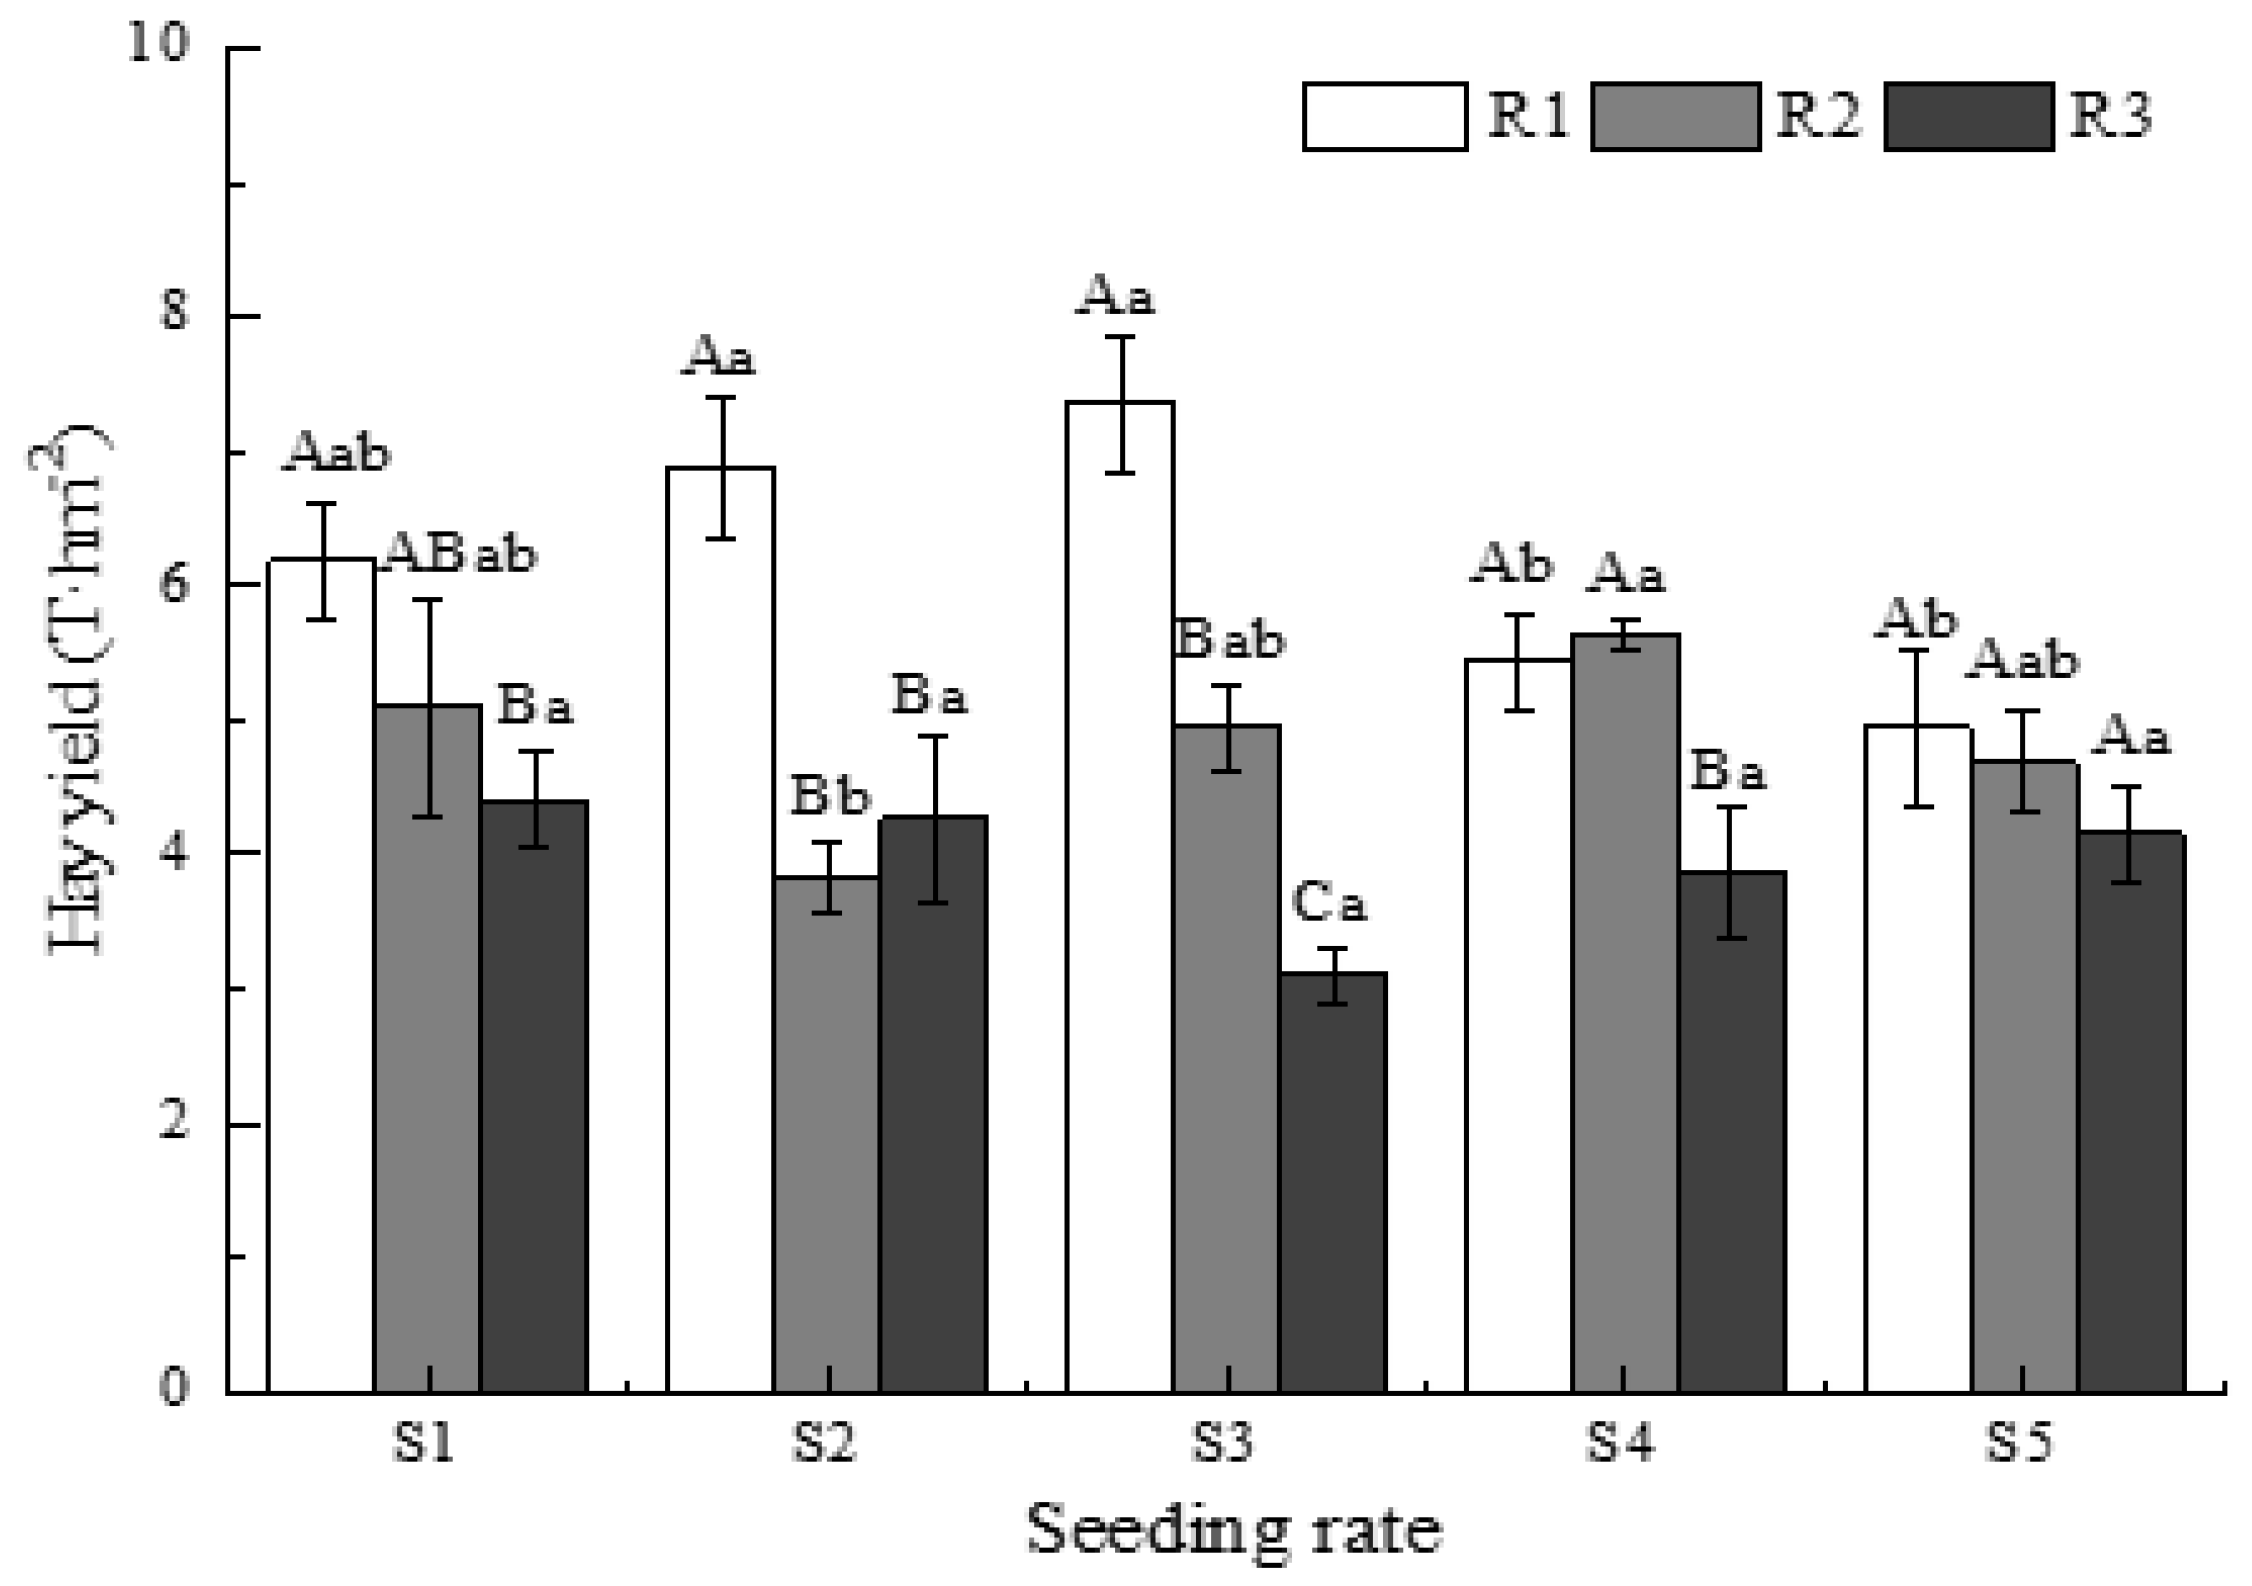
3.4. Hay Yield
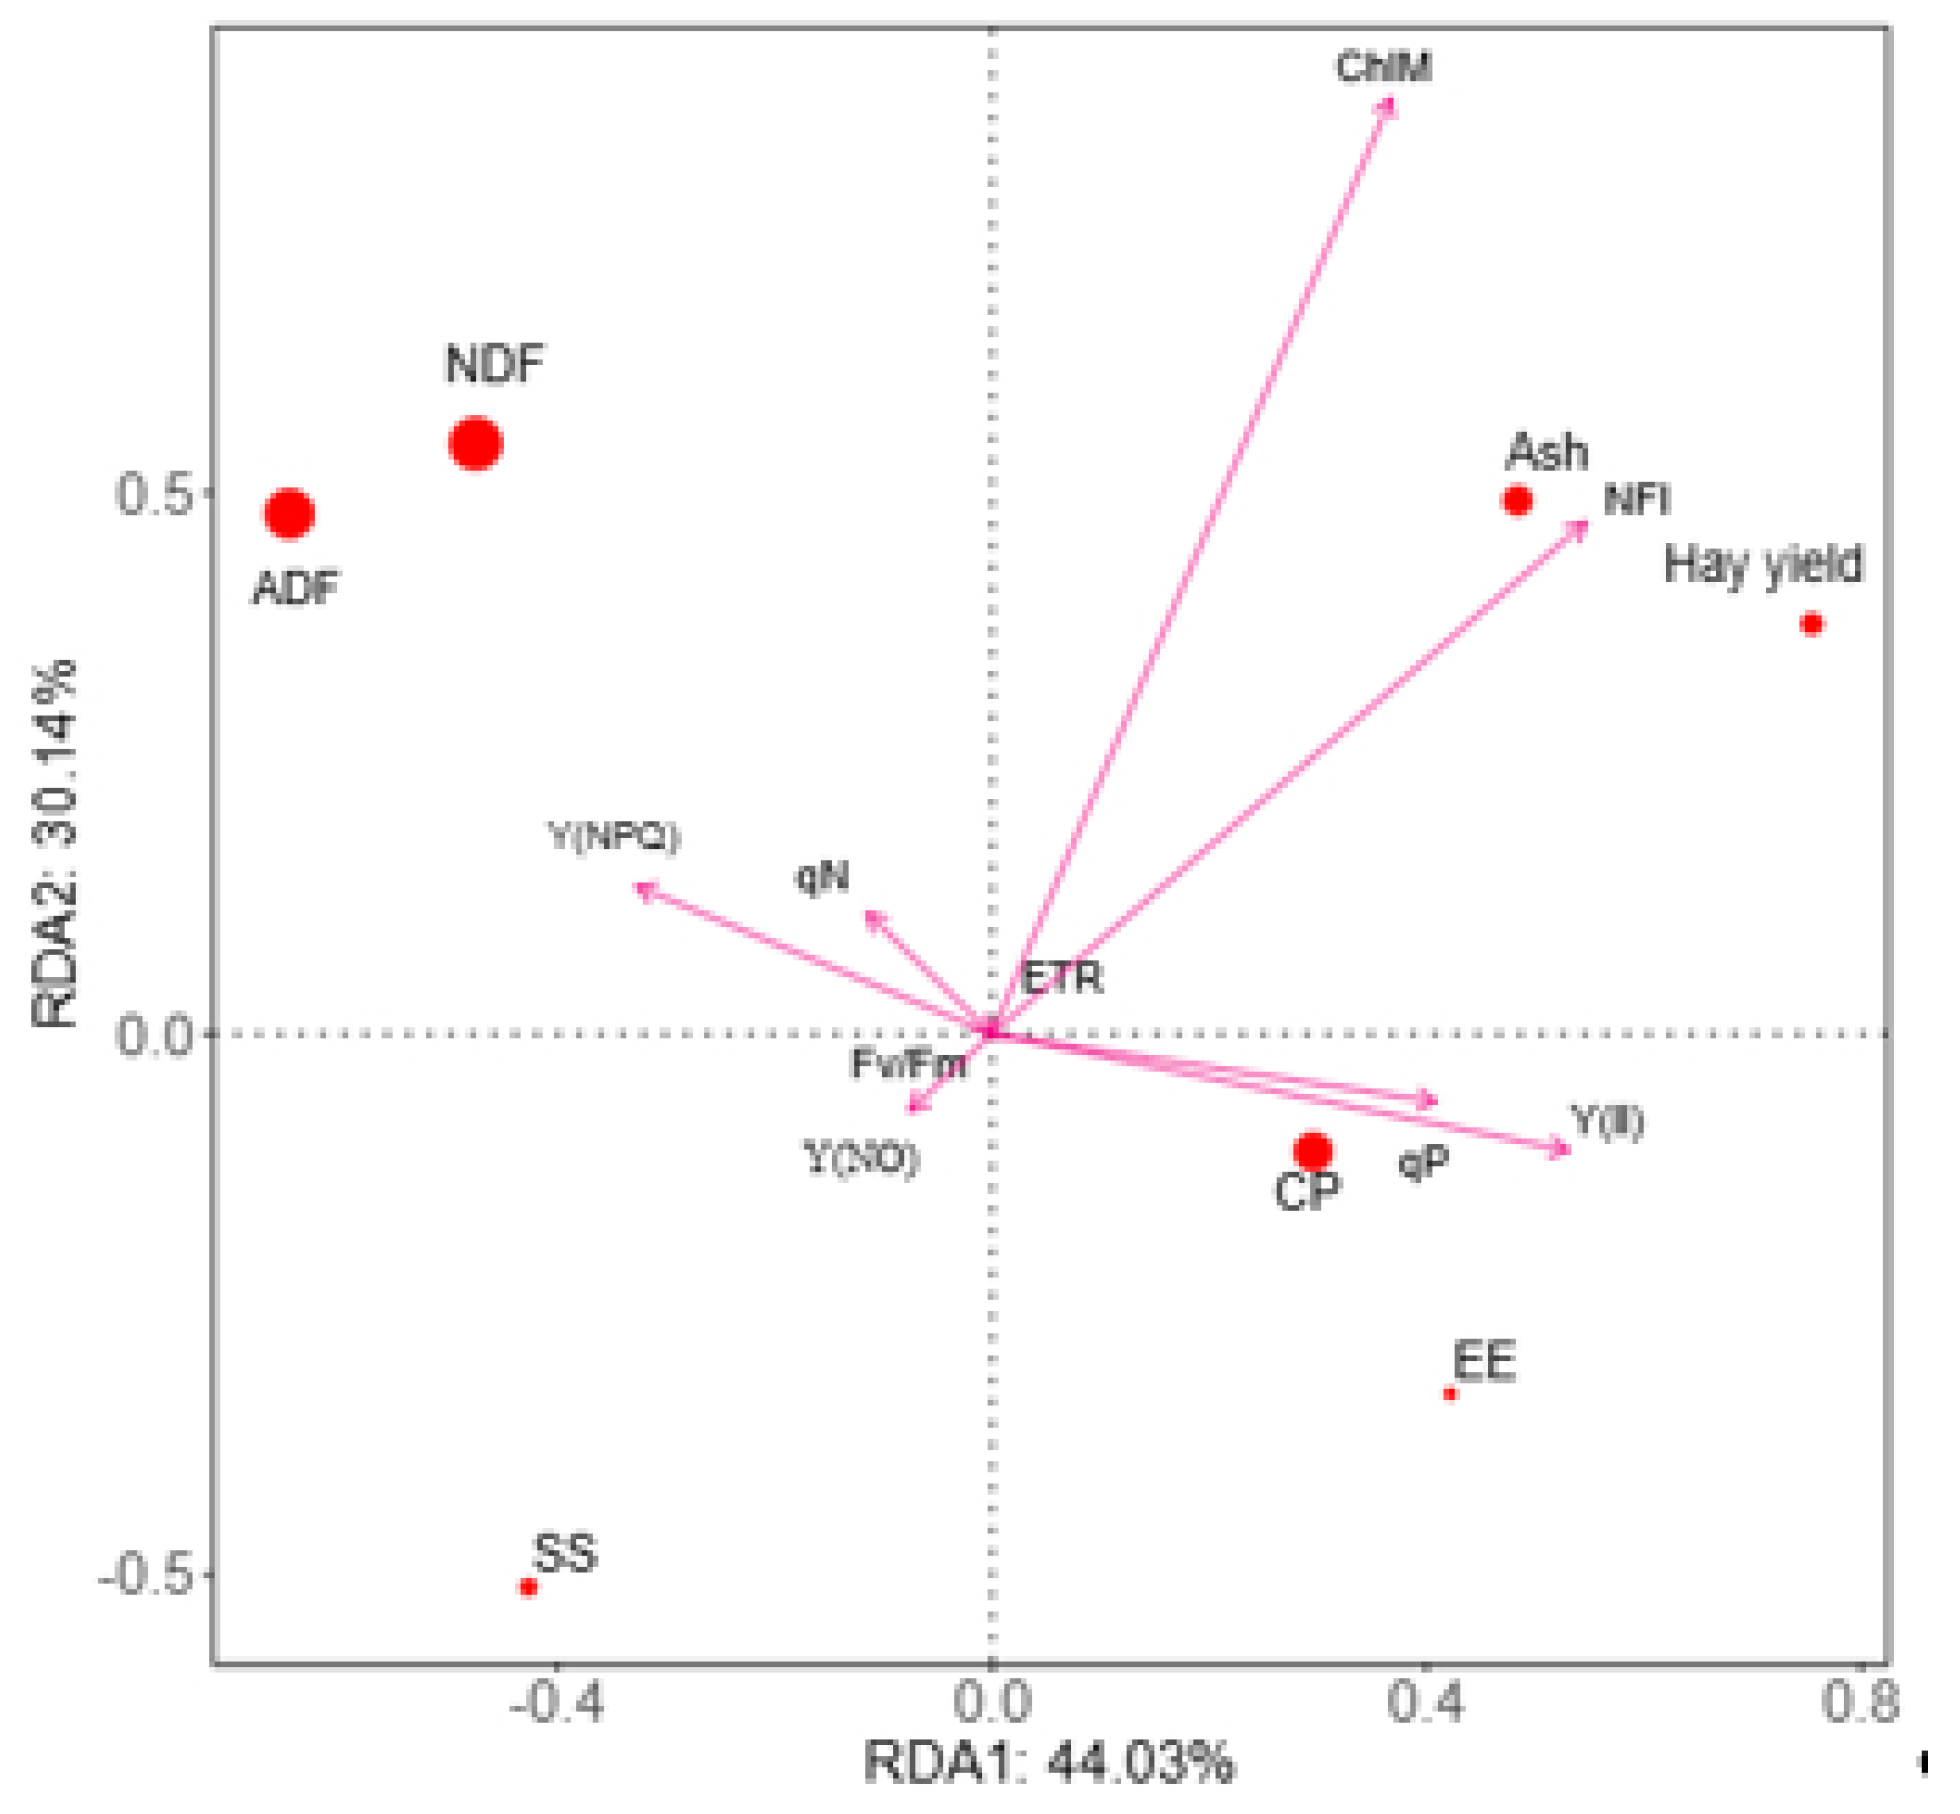
3.5. Relationships Between Chlorophyll Fluorescence Parameters, Yield, and Quality
4. Discussion
4.1. Yield Effects
4.2. Forage Quality Traits
4.3. Mechanisms of Photosynthetic Regulation
4.4. Implications and Limitations
5. Conclusions
Author Contributions
Funding
Data Availability Statement
Conflicts of Interest
References
- Jabborova, D.; Abdrakhmanov, T.; Jabbarov, Z.; Abdullaev, S.; Azimov, A.; Mohamed, I.; Alharbi, M.; Abu-Elsaoud, A.; Elkelish, A. Biochar Improves the Growth and Physiological Traits of Alfalfa, Amaranth and Maize Grown Under Salt Stress. PeerJ 2023, 11, e15684. [Google Scholar] [CrossRef]
- Mishra, U.N.; Chauhan, J.; Singhal, R.K.; Anuragi, H.; Dey, P.; Lal, D.; Pandey, S.; Gupta, N.K.; Nayak, J.K.; Tripathi, A.; et al. Abiotic Stress Responses in Forage Crops and Grasses: The Role of Secondary Metabolites and Biotechnological Interventions. Front. Plant Sci. 2025, 16, 1542519. [Google Scholar] [CrossRef]
- Suwignyo, B.; Mustika, A.; Kustantinah; Yusiati, L.M.; Suhartanto, B. Effect of Drying Method on Physical-chemical Characteristics and Amino Acid Contentof Tropical Alfalfa (Medicago sativa L.) Hay Forpoultry Feed. Am. J. Anim. Vet. Sci. 2020, 15, 118–122. [Google Scholar] [CrossRef]
- Sajimin. Medicago sativa L. (Alfalfa) Sebagai Tanaman Pakan Ternak Harapan Di Indonesia. Wartazoa 2011, 21, 91–98. [Google Scholar]
- Muhammad, A.; Feyissa, B.A.; Amyot, L.; Banyar, A.; Abdelali, H. MicroRNA156 Improves Drought Stress Tolerance in Alfalfa (Medicago sativa L.) by Silencing SPL13. Plant Sci. 2017, 258, 122–136. [Google Scholar]
- Elgharably, A.; Benes, S. Alfalfa Biomass Yield and Nitrogen Fixation in Response to Applied Mineral Nitrogen Under Saline Soil Conditions. J. Soil Sci. Plant Nutr. 2021, 21, 744–755. [Google Scholar] [CrossRef]
- Cornacchione, M.V.; Suarez, D.L. Emergence, Forage Production, and Ion Relations of Alfalfa in Response to Saline Waters. Crop Sci. 2015, 55, 444–457. [Google Scholar] [CrossRef]
- Bai, G.; He, F.; Shan, G.; Wang, Y.; Tong, Z.; Cao, Y.; Yuan, Q. Effect of Saline Irrigation Water on Alfalfa Growth and Development in Saline-Alkali Soils. Agronomy 2024, 14, 2790. [Google Scholar] [CrossRef]
- Liu, X.J. Reclamation and Utilization of Saline Soils in Water-scarce Regions of Bohai Sea. Chin. J. Eco Agric. 2018, 26, 1521–1527. [Google Scholar]
- Atumo, T.; Jones, C.S. Varietal Differences in Yield and Nutritional Quality of Alfalfa (Medicago sativa) Accessions During 20 Months after Planting in Ethiopia. Trop. Grassl.-Forrajes Trop. 2021, 9, 89–96. [Google Scholar] [CrossRef]
- Fen, Y.P.; Shi, Y.; Zhao, M.Y.; Shen, H.H.; Xu, L.C.; Luo, Y.K.; Liu, Y.Z.; Xing, A.J.; Kang, J.; Jing, H.C.; et al. Yield and Quality Properties of Alfalfa (Medicago sativa L.) and Their Influencing Factors in China. Eur. J. Agron. 2022, 141, 126637. [Google Scholar] [CrossRef]
- Baghdadi, A.; Halim, R.A.; Majidian, M.; Daud, W.N.W.; Ahmad, I. Forage Corn Yield and Physiological Indices Under Different Plant Densities and Tillage Systems. J. Food Agric. Environ. 2021, 10, 707–712. [Google Scholar]
- Yan, Y.Y.; Duan, F.Y.; Li, X.; Zhao, R.; Hou, P.; Zhao, M.; Li, S.K.; Wang, Y.H.; Dai, T.B.; Zhou, W.B. Photosynthetic Capacity and Assimilate Transport of The Lower Canopy Influence Maize Yield Under High Planting Density. Plant Physiol. 2024, 195, 2652–2667. [Google Scholar] [CrossRef]
- Collison, R.F.; Raven, E.C.; Pignon, C.P.; Stephen, P.L. Light, Not Age, Underlies the Maladaptation of Maize and Miscanthus Photosynthesis to Selfshading. Front. Plant Sci. 2020, 11, 783. [Google Scholar] [CrossRef] [PubMed]
- Zhang, Y.H.; Wang, R.; Wang, S.; Ning, F.; Wang, H.; Wen, P.F.; Li, A.; Dong, Z.Y.; Xu, Z.G.; Zhang, Y.J.; et al. Effect of Planting Density on Deep Soil Water and Maize Yield on The Loess Plateau of China. Agric. Water Manag. 2019, 223, 105655. [Google Scholar] [CrossRef]
- DeEll, J.R.; Toivonen, P.M.A. Practical Applications of Chlorophyll Fluorescence in Plant Biology; Springer Science and Business Media, LLC: Berlin/Heidelberg, Germany, 2003; pp. 1–2. [Google Scholar]
- Dou, H.J.; Niu, G.H.; Gu, M.M.; Masabni, J.G. Responses of Sweet Basil to Different Daily Light Integrals in Photosynthesis, Morphology, Yield, and Nutritional Quality. Hort Sci. 2018, 53, 496–503. [Google Scholar] [CrossRef]
- Shi, J.Q.; Zhou, F.; Wang, S.K.; Zhang, S.G.; Li, S.Y.; Xie, N.; Zhang, L.F.; Feng, W.; Zhi, J.F.; Li, J.X.; et al. Effects of Row Spacing and Sowing Rate on Photosynthetic Characteristics and Yield of Alfalfa in Coastal Saline-alkali Dry Land in Hebei Province. Acta Agrestia Sin. 2023, 31, 2554–2563. [Google Scholar]
- Hwang, J.S.; Choo, Y.S. Solute Patterns and Diurnal Variation of Photosynthesis and Chlorophyll Fluorescence in Korean Coastal Sand Dune Plants. Photosynthetica 2016, 55, 107–120. [Google Scholar] [CrossRef]
- Baker, N.R.; Rosenqvist, E. Applications of Chlorophyll Fluorescence Can Improve Crop Production Strategies: An Examination of Future Possibilities. J. Exp. Bot. 2004, 55, 1607–1621. [Google Scholar] [CrossRef]
- Sosnowski, J.; Truba, M. Photosynthetic Activity and Chlorophyll Pigment Concentration in Medicago x varia T. Martyn Leaves Treated with the Tytanit Growth Regulator. Saudi J. Biol. Sci. 2021, 28, 4039–4045. [Google Scholar] [CrossRef]
- Smethurst, C.F.; Garnett, T.; Shabala, S. Nutritional and Chlorophyll Fluorescence Responses of Lucerne (Medicago sativa) to Water Logging and Subsequent Recovery. Plant Soil 2005, 270, 31–45. [Google Scholar] [CrossRef]
- Yu, K.M.J.; McKinley, B.; Rooney, W.L.; Mullet, J.E. High Planting Density Induces the Expression of GA3-oxidase in Leaves and GA Mediated Stem Elongation in Bioenergy Sorghum. Sci. Rep. 2021, 11, 46. [Google Scholar] [CrossRef] [PubMed]
- Kalogeropoulos, G.; Elli, F.E.; Trifunovic, S.; Archontoulis, S.V. Historical Increases of Maize Leaf Area Index in the US Corn Belt Due Primarily to Plant Density Increases. Field Crops Res. 2024, 318, 109615. [Google Scholar] [CrossRef]
- Benyahia, F.; Bastos Campos, F.; Ben Abdelkader, A.; Basile, B.; Tagliavini, M.; Andreotti, C.; Zanotelli, D. Assessing Grapevine Water Status by Integrating Vine Transpiration, Leaf Gas Exchanges, Chlorophyll Fluorescence and Sap Flow Measurements. Agronomy 2023, 13, 464. [Google Scholar] [CrossRef]
- Sun, J.J.; A, L.M.S.; Bai, C.S. Manual for Quality Testing of Silage Feed; China Agricultural Science and Technology Press: Beijing, China, 2017; pp. 12–43. [Google Scholar]
- Walker, E.R.; Mengistu, A.; Bellaloui, N.; Koger, C.H.; Roberts, R.K.; Larson, J.A. Plant Population and Row-Spacing Effects on Maturity Group III Soybean. Agron. J. 2010, 102, 821–826. [Google Scholar] [CrossRef]
- Iqbal, A.; Iqbal, M.A.; Awad, M.F.; Nasir, M.; Sabagh, A.E.; Siddiqui, M.H. Spatial Arrangements and Seeding Rates Influence Biomass Productivity, Nutritional Value and Economic Viability of Maize (Zea mays L.). Pak. J. Bot. 2021, 53, 967–973. [Google Scholar] [CrossRef]
- Liu, J.; Lu, F.; Zhu, Y.; Wu, H.; Ahmad, I.; Dong, G.C.; Zhou, G.S.; Wu, Y.Q. The Effects of Planting Density and Nitrogen Application on the Growth Quality of Alfalfa Forage in Saline Soils. Agriculture 2024, 14, 302. [Google Scholar] [CrossRef]
- Gabira, M.M.; Girona, M.M.; DesRochers, A.; Kratz, D.; Da Silva, R.B.G.; Duarte, M.M.; Silva, R.B.G.; Manoela Mendes Duarte, M.M.; Aguiar, N.S.; Wendling, I. The Impact of planting Density on Forest Monospecific Plantations: An Overview. For. Ecol. Manag. 2023, 534, 120882. [Google Scholar] [CrossRef]
- Noland, R.; Dowdy, M.; Harris, G. Maize Row Spacing and Seeding Rate Informed by Space-per-Plant Geometry. Agronomy 2025, 15, 374. [Google Scholar] [CrossRef]
- Shaaban, A.; Mahfouz, H.; Megawer, E.A.; Saudy, H.S. Physiological Changes and Nutritional Value of Forage Clitoria Grown in Arid Agro-Ecosystem as Infuenced by Plant Density and Water Defcit. J. Soil Sci. Plant Nutr. 2023, 23, 3735–3750. [Google Scholar] [CrossRef]
- Millicent, R.S.; Idupulapati, M.R.; Andrew, M. Source-Sink Relationships in Crop Plants and Their Influence on Yield Development and Nutritional Quality. Front. Plant Sci. 2018, 9, 1889. [Google Scholar] [CrossRef]
- Zhang, L.X.; Lu, C.M.; Peng, L.W.; Ma, W.M.; Qian, W.Q. Progress in Improving Photosynthetic Efficiency by Synthetic Biology. Chin. J. Biotechnol. 2017, 33, 486–493. [Google Scholar]
- Pinto, P.; Cartoni-Casamitjana, S.; Cureton, C.; Stevens, A.W.; Stoltenberg, D.E.; Zimbric, J.; Picasso, V.D. Intercropping Legumes and Intermediate Wheatgrass Increases Forage Yield, Nutritive Value, and Profitability Without Reducing Grainyields. Front. Sustain. Food Syst. 2022, 6, 977841. [Google Scholar] [CrossRef]
- Umesh, M.R.; Angadi, S.; Begna, S.; Gowda, P. Planting Density and Geometry Effect on Canopy Development, Forage Yield and Nutritive Value of Sorghum and Annual Legumes Intercropping. Sustainability 2022, 14, 4517. [Google Scholar] [CrossRef]
- Bo, P.T.; Dong, Y.; Zhang, R.; Soe Htet, M.N.; Hai, J. Optimization of Alfalfa-Based Mixed Cropping with Winter Wheat and Ryegrass in Terms of Forage Yield and Quality Traits. Plants 2022, 11, 1752. [Google Scholar] [CrossRef]
- Wang, S.; Guo, K.; Ameen, A.; Fang, D.; Li, X.; Liu, X.; Han, L. Evaluation of Different Shallow Groundwater Tables and Alfalfa Cultivars for Forage Yield and Nutritional Value in Coastal Saline Soil of North China. Life 2022, 12, 217. [Google Scholar] [CrossRef]
- Lelis, D.L.L.; Paciullo, D.S.C.; Morenz, M.J.F.; Gomide, C.A.M.; Roseira, J.P.S.; Lopes, F.C.F.; Oliveira, J.S.; Pereira, O.G.; Silva, V.P.S.; Chizzotti, F.H.M. Biomass Production and Silage Quality of Ensiled BRS Capiacu Elephant Grass at Different Regrowth Ages and Residue Heights. Sci. Rep. 2025, 15, 4016. [Google Scholar] [CrossRef]
- Ozkurt, M.; Karadag, Y. Effects of Row Spacing and Sowing Rate on Quality Performance of Alfalfa (Medicago sativa L.) Under Tokat Ecological Conditions. J. Agric. Sci. 2022, 28, 732–739. [Google Scholar]
- Bouchard, A.; Vanasse, A.; Seguin, P.; Bélanger, G. Yield and Composition of Sweet Pearl Millet as Affected by Row Spacing and Seeding Rate. Agron. J. 2011, 103, 995–1001. [Google Scholar] [CrossRef]
- Baitelenova, A.; Kurbanbayev, A.; Stybayev, G.; Yancheva, H.; Serekpayev, N.; Mukhanov, N.; Amantaev, B. Photosynthetic Potential and Productivity of Annual Mixed Crops in Northern Kazakhstan. Bulg. J. Agric. Sci. 2021, 27, 85–94. [Google Scholar]
- JoséL, A.; Sanchez, B.R.; Rubén, V. Improving Crop Yield and Resilience Through Optimization of Photosynthesis: Panacea or Pipe Dream? J. Exp. Bot. 2021, 72, 3936–3955. [Google Scholar] [CrossRef]
- Zhang, L.S.; Sun, Y.G.; Ji, J.Q.; Zhao, W.D.; Guo, W.L.; Li, J.Q.; Bai, Y.; Wang, D.; Yan, Z.; Guo, C.H. Flavonol Synthase Gene MsFLS13 Regulates Saline-alkali Stress Tolerance in Alfalfa. Crop J. 2023, 11, 1218–1229. [Google Scholar] [CrossRef]
- Hernández, I.; Alegre, L.; Breusegem, F.V.; Munné-Bosch, S. How Relevant are Flavonoids as Antioxidants in Plants? Trends Plant Sci. 2009, 14, 125–132. [Google Scholar] [CrossRef]
- Boukrouh, S.; Noutfia, A.; Moula, N.; Avril, C.; Louvieaux, J.; Hornick, J.L.; Chentouf, M.; Cabaraux, J.F. Characterisation of Bitter Vetch (Vicia ervilia (L.) Willd) Ecotypes: An Ancient and Promising Legume. Exp. Agric. 2024, 60, e19. [Google Scholar] [CrossRef]
- Huang, G.J.; Peng, S.B.; Li, Y. Variation of Photosynthesis During Plant Evolution and Domestication: Implications for Improving Crop Photosynthesis. J. Exp. Bot. 2022, 73, 4886–4896. [Google Scholar] [CrossRef]
- Romdhane, A.B.; Dhane, S.; Boukef, S.; Boudabbous, K.; Karmous, C. Vetiver Forage Yield and Nutritive Value Afected By Water Irrigation Regimes and Plant Density Under Mediterranean Climate Conditions. Euro-Mediterr. J. Environ. Integr. 2025, 10, 1639–1655. [Google Scholar] [CrossRef]


| Point | SOM (g·kg−1) | AN (mg·kg−1) | AP (mg·kg−1) | AK (mg·kg−1) | pH | SSC (g kg−1) |
|---|---|---|---|---|---|---|
| 1 | 11.79 | 16.10 | 8.60 | 149.60 | 7.64 | 1.88 |
| 2 | 14.60 | 12.60 | 6.70 | 166.80 | 7.66 | 1.97 |
| 3 | 11.18 | 21.50 | 7.80 | 130.20 | 7.60 | 2.40 |
| 4 | 13.78 | 10.30 | 9.90 | 141.00 | 7.82 | 2.47 |
| 5 | 12.47 | 18.80 | 10.10 | 146.00 | 7.52 | 2.22 |
| 6 | 13.06 | 23.10 | 9.50 | 148.40 | 7.42 | 1.94 |
| 7 | 11.13 | 25.70 | 9.60 | 139.80 | 7.56 | 1.82 |
| 8 | 11.61 | 16.90 | 8.10 | 146.00 | 7.65 | 2.10 |
| 9 | 11.35 | 29.70 | 9.60 | 140.20 | 7.58 | 2.02 |
| 10 | 12.10 | 22.40 | 9.50 | 152.40 | 7.74 | 1.84 |
| Average | 12.31 ± 1.11 | 19.71 ± 5.64 | 8.94 ± 1.04 | 146.04 ± 9.16 | 7.62 ± 0.11 | 2.07 ± 0.22 |
| Treatment | ChlM | NFI | ADF | NDF | EE | Ash | SS | CP | Hay Yield |
|---|---|---|---|---|---|---|---|---|---|
| Row spacing | ** | ** | NS | NS | ** | ** | ** | NS | ** |
| Seeding rate | NS | NS | NS | * | NS | ** | ** | ** | NS |
| R × S | NS | ** | NS | NS | * | ** | NS | NS | ** |
| Row Spacing | Seeding Rate | Fv/Fm | Y(II) | ETR | qP | qN | Y(NPQ) | Y(NO) |
|---|---|---|---|---|---|---|---|---|
| R1 | S1 | 0.745 ± 0.008 Aab | 0.536 ± 0.009 Aa | 44.367 ± 0.758 Bb | 0.792 ± 0.019 Ba | 0.330 ± 0.038 Ab | 0.125 ± 0.016 Ab | 0.339 ± 0.015 Aa |
| S2 | 0.754 ± 0.026 Aab | 0.561 ± 0.014 Aa | 51.578 ± 1.604 Aa | 0.838 ± 0.041 Aa | 0.479 ± 0.053 Aa | 0.171 ± 0.015 Aa | 0.268 ± 0.024 Bb | |
| S3 | 0.724 ± 0.029 Ab | 0.548 ± 0.023 ABa | 45.333 ± 1.895 Bb | 0.864 ± 0.047 Aa | 0.410 ± 0.026 ABab | 0.154 ± 0.018 Bab | 0.298 ± 0.006 ABab | |
| S4 | 0.792 ± 0.004 Aa | 0.562 ± 0.007 Aa | 46.522 ± 0.560 ABb | 0.780 ± 0.009 Ba | 0.342 ± 0.017 Bb | 0.126 ± 0.008 Bb | 0.312 ± 0.002 Aa | |
| S5 | 0.736 ± 0.006 Aab | 0.556 ± 0.001 Aa | 46.033 ± 0.083 Ab | 0.835 ± 0.001 Aa | 0.338 ± 0.010 Bb | 0.121 ± 0.004 Cb | 0.323 ± 0.005 Aa | |
| R2 | S1 | 0.688 ± 0.043 Ab | 0.555 ± 0.017 Aab | 52.089 ± 4.246 Aa | 0.934 ± 0.031 Aa | 0.425 ± 0.022 Ab | 0.150 ± 0.010 Abc | 0.295 ± 0.010 Bbc |
| S2 | 0.730 ± 0.006 Aab | 0.529 ± 0.010 Ab | 43.756 ± 0.843 Ba | 0.749 ± 0.027 Ac | 0.268 ± 0.020 Bd | 0.103 ± 0.007 Bd | 0.368 ± 0.011 Aa | |
| S3 | 0.785 ± 0.005 Aa | 0.567 ± 0.004 Aa | 52.622 ± 2.783 Aa | 0.787 ± 0.007 Ac | 0.354 ± 0.008 Bc | 0.128 ± 0.004 Bcd | 0.305 ± 0.000 Ab | |
| S4 | 0.751 ± 0.004 Bab | 0.556 ± 0.014 Aab | 52.033 ± 3.861 Aa | 0.865 ± 0.029 Ab | 0.475 ± 0.034 Aab | 0.175 ± 0.015 ABb | 0.269 ± 0.013 Bc | |
| S5 | 0.762 ± 0.016 Aa | 0.473 ± 0.031 Cc | 48.589 ± 1.798 Aa | 0.723 ± 0.002 Cc | 0.494 ± 0.014 Aa | 0.216 ± 0.018 Aa | 0.311 ± 0.030 Ab | |
| R3 | S1 | 0.727 ± 0.044 Aa | 0.539 ± 0.006 Aa | 44.578 ± 0.534 Bab | 0.828 ± 0.030 Ba | 0.359 ± 0.036 Ab | 0.136 ± 0.017 Ab | 0.325 ± 0.013 ABa |
| S2 | 0.748 ± 0.014 Aa | 0.550 ± 0.032 Aa | 45.533 ± 2.620 Bab | 0.818 ± 0.042 Aa | 0.374 ± 0.039 ABb | 0.146 ± 0.027 ABab | 0.303 ± 0.005 Bab | |
| S3 | 0.755 ± 0.028 Aa | 0.490 ± 0.03 Ba | 49.011 ± 2.023 ABa | 0.78 ± 0.040 Aa | 0.513 ± 0.062 Aa | 0.230 ± 0.040 Aa | 0.280 ± 0.010 Bb | |
| S4 | 0.786 ± 0.000 Aa | 0.500 ± 0.020 Ba | 41.656 ± 2.069 Bb | 0.730 ± 0.020 Ba | 0.459 ± 0.053 Aab | 0.200 ± 0.030 Aab | 0.300 ± 0.010 Ab | |
| S5 | 0.754 ± 0.012 Aa | 0.532 ± 0.015 Ba | 47.356 ± 1.963 Aab | 0.782 ± 0.021 Ba | 0.372 ± 0.029 Bb | 0.146 ± 0.016 Bab | 0.323 ± 0.006 Aa | |
| Row spacing | P | NS | * | NS | NS | NS | * | NS |
| Seeding rate | P | * | ** | NS | ** | NS | * | ** |
| R × S | P | NS | ** | ** | ** | ** | ** | ** |
| Index | The 1st Sort Axis RDA | The 2nd Sort Axis RDA | R2 | p |
|---|---|---|---|---|
| ChlM | 0.391 | 0.920 | 0.294 | 0.001 ** |
| NFI | 0.756 | 0.654 | 0.226 | 0.005 ** |
| Y(II) | 0.980 | −0.200 | 0.169 | 0.013 * |
| qP | 0.988 | −0.152 | 0.129 | 0.047 * |
| Y(NPQ) | −0.923 | 0.385 | 0.111 | 0.083 |
| qN | −0.717 | 0.697 | 0.050 | 0.323 |
| Y(NO) | −0.730 | −0.684 | 0.032 | 0.498 |
| Fv/Fm | 0.741 | −0.672 | 0.000 | 0.999 |
| ETR | −0.874 | −0.485 | 0.002 | 0.954 |
| Cumulative explanation (%) | 44.03% | 30.14% | - | - |
Disclaimer/Publisher’s Note: The statements, opinions and data contained in all publications are solely those of the individual author(s) and contributor(s) and not of MDPI and/or the editor(s). MDPI and/or the editor(s) disclaim responsibility for any injury to people or property resulting from any ideas, methods, instructions or products referred to in the content. |
© 2025 by the authors. Licensee MDPI, Basel, Switzerland. This article is an open access article distributed under the terms and conditions of the Creative Commons Attribution (CC BY) license (https://creativecommons.org/licenses/by/4.0/).
Share and Cite
Shi, J.; Xie, N.; Zhang, L.; Pan, X.; Wang, Y.; Liu, Z.; Liu, Z.; Zhi, J.; Qin, W.; Feng, W.; et al. Optimizing Row Spacing and Seeding Rate for Yield and Quality of Alfalfa in Saline–Alkali Soils. Agronomy 2025, 15, 1828. https://doi.org/10.3390/agronomy15081828
Shi J, Xie N, Zhang L, Pan X, Wang Y, Liu Z, Liu Z, Zhi J, Qin W, Feng W, et al. Optimizing Row Spacing and Seeding Rate for Yield and Quality of Alfalfa in Saline–Alkali Soils. Agronomy. 2025; 15(8):1828. https://doi.org/10.3390/agronomy15081828
Chicago/Turabian StyleShi, Jiaqi, Nan Xie, Lifeng Zhang, Xuan Pan, Yanling Wang, Zhongkuan Liu, Zhenyu Liu, Jianfei Zhi, Wenli Qin, Wei Feng, and et al. 2025. "Optimizing Row Spacing and Seeding Rate for Yield and Quality of Alfalfa in Saline–Alkali Soils" Agronomy 15, no. 8: 1828. https://doi.org/10.3390/agronomy15081828
APA StyleShi, J., Xie, N., Zhang, L., Pan, X., Wang, Y., Liu, Z., Liu, Z., Zhi, J., Qin, W., Feng, W., Sun, G., & Yu, H. (2025). Optimizing Row Spacing and Seeding Rate for Yield and Quality of Alfalfa in Saline–Alkali Soils. Agronomy, 15(8), 1828. https://doi.org/10.3390/agronomy15081828