Article

Variable-Rate Nitrogen Application in Wheat Based on UAV-Derived Fertilizer Maps and Precision Agriculture Technologies

by
Alexandros Tsitouras
1,2,
Christos Noulas
1,*,
Vasilios Liakos
2,
Stamatis Stamatiadis
3,
Miltiadis Tziouvalekas
1,
Ruijun Qin
4 and
Eleftherios Evangelou
1
1
Institute of Industrial and Forage Crops, Hellenic Agricultural Organization—DIMITRA, 41335 Larissa, Greece
2
Laboratory of Precision Agriculture, Department of Agrotechnology, University of Thessaly, Gaiopolis, 41110 Larissa, Greece
3
Goulandris Natural History Museum, Soil Ecology and Biotechnology Laboratory, 13 Levidou Str., 14562 Kifissia, Greece
4
Hermiston Agricultural Research and Extension Center, Oregon State University, Hermiston, OR 97838, USA
*
Author to whom correspondence should be addressed.
Agronomy 2025, 15(7), 1714; https://doi.org/10.3390/agronomy15071714
Submission received: 12 June 2025 / Revised: 11 July 2025 / Accepted: 15 July 2025 / Published: 16 July 2025

Abstract

Variable-rate nitrogen (VR-N) application allows farmers to optimize nitrogen (N) input site-specifically within field boundaries, enhancing both economic efficiency and environmental sustainability. In this study, VR-N technology was applied to durum wheat in two small-scale commercial fields (3–4 ha each) located in distinct agro-climatic zones of Thessaly, central Greece. A real-time VR-N application algorithm was used to calculate N rates based on easily obtainable near-real-time data from unmanned aerial vehicle (UAV) imagery, tailored to the crop’s actual needs. VR-N implementation was carried out using conventional fertilizer spreaders equipped to read prescription maps. Results showed that VR-N reduced N input by up to 49.6% compared to the conventional uniform-rate N (UR-N) application, with no significant impact on wheat yield or grain quality. In one of the fields, the improved gain of VR-N when compared to UR-N was 7.2%, corresponding to an economic gain of EUR 163.8 ha−1, while in the second field—where growing conditions were less favorable—no considerable VR-N economic gain was observed. Environmental benefits were also notable. The carbon footprint (CF) of the wheat crop was reduced by 6.4% to 22.0%, and residual soil nitrate (NO3) levels at harvest were 13.6% to 36.1% lower in VR-N zones compared to UR-N zones. These findings suggest a decreased risk of NO3 leaching and ground water contamination. Overall, the study supports the viability of VR-N as a practical and scalable approach to improve N use efficiency (NUE) and reduce the environmental impact of wheat cultivation which could be readily adopted by farmers.

1. Introduction

Durum wheat (Triticum turgidum L. subsp. Durum) is one of the most important cereal species globally, a crucial staple crop in many arid and semi-arid regions around the world, and its cultivation is concentrated in the Mediterranean Basin and the Great Plains of North America as well as in West and Central Asia [1]. In terms of production, it is the 10th most cultivated cereal globally, and its annual production ranges from 35 to 40 million tons, accounting for about 7.0% of the total wheat production [2,3]. With an average durum wheat production of 1.07 million tonnes (0.37 million ha growing area) during the last decade, Greece is among the top ten world’s leading durum wheat producing countries [4,5].
Wheat growers strive to maximize crop yields and, at the same time, to increase the protein content by applying the least amount of N fertilizer by spreading well-adjusted in-season nitrogen (N) fertilization. Therefore, they are called upon to balance at that point on the curve of maximum economic return, where yield and protein are at the ideal ratio [6]. The ratio depends on the intended use of the wheat. For example, the bread wheat yield/protein ratio is 0.35–0.50, while the feed wheat should have a ratio between 0.6 and 1.0. However, N fertilizers are commonly distributed in a uniform way across fields without considering in-field spatial and temporal variability [7]. The dominant practice for farmers is to apply a fixed rate of N fertilizer onto the whole fields and even entire farms. This also represents the prevailing fertilization practice among wheat growers in Greece, resulting in irrational application of N-containing fertilizers, which could be the cause of significant environmental and health problems through N gas emissions (NH3, N2O, NO), nitrates leaching (NO3), surface runoff, and erosion. Over-application of certain N-forming fertilizers can contribute to soil acidification, weakening soil structure and harming microbes that bind particles. Moreover, it can deplete other essential nutrients, reducing plant health and ground cover. Plants weakened by nutrient toxicity or imbalance offer less erosion protection, especially during heavy rain or wind events. In addition, it affects air and water quality, with harmful consequences for the climate and human health [8,9,10,11].
Both over-fertilization and under-fertilization are quite damaging to crop production and product quality and require site-specific N management (SSNM). SSNM and precision agriculture can contribute to the sustainable management of crop production inputs by addressing the real needs of specific regions in the field rather than the average needs of whole fields [12]. Moreover, SSNM can increase the N use efficiency (NUE) at field scale [13,14,15], which has been confirmed for small- to medium-scale agriculture systems similar to Greek agriculture [6,16]. NUE in wheat production in Greece is around 30.0%, which is low and similar to Swiss agriculture [6], but lower compared to Danish agriculture, for instance, with a NUE of 41.0% [17]. Crop intensification has led to several environmental problems such as underground water pollution and soil degradation due to excessive amounts of N fertilizer application and the ability of plants to uptake only around 50.0% of the N applied [18,19]. Among the factors that contribute to relatively low NUE are the uniform fertilizer N application rates to spatially and/or temporarily variable landscapes. It appears that the application of precision agriculture technologies and methods to increase NUE in wheat production can significantly reduce the environmental impact of agricultural production. Variable-rate N application (VR-N) has been proven to have the potential to improve NUE in small- to large-scale agricultural cropping systems [20,21,22].
Even though studies have largely considered the heterogeneity of large size fields, until now, small-scale heterogeneity within fields (<1–2 ha) is typically neglected [6,23]. To achieve the goal of VR-N, fields should be treated on the basis of their smallest scale of significant variability. Small fields (<3 ha), representing the vast majority (87.0%) of the world’s agricultural land, show great variability in yield [24,25]. Therefore, finding precision farming solutions for small-scale farms is essential. Also, two-thirds of EU agricultural holdings in 2016 were smaller than 5 ha in size [26]. Such pilot fields are represented in Thessaly (Greece), and the results will be usable by farmers (and comparable to other small-scale systems in EU-27 countries).
Unmanned aerial vehicles (UAVs) are platforms suitable for monitoring fields of small to medium size and provide a number of possibilities and benefits for farmers. Among them are crop monitoring (high-resolution data on plant health), nutrient management (application of fertilizer according to the actual needs or even the individual needs of the plants) and yield mapping (data on the yield at different parts of the field) [27]. Higher-resolution UAV data may capture better within-field variability, enabling more precise fertilizer application, while coarser resolutions (i.e., 10 m) may smooth out spatial heterogeneity, potentially leading to suboptimal management decisions [28]. The purchase and operational knowledge costs and the time needed to acquire and process the remote sensing data are considered some of the major drawbacks of UAV technology [29]. Crop N-status quantification and fertilization support based on remote sensing imagery is still not fully standardized, even though precision fertilization methodologies and monitoring of the vegetation condition have advanced [30]. The reliability of image data provided by a UAV platform to non-destructively diagnose N status in wheat and to guide in-season VR-N has been provided by recent studies [6,31], but few studies are dealing with VR-N in small-scale farming systems and new sensing technologies in the literature. UAV crop monitoring and decision-making for further actions should be carried out by professional experts such as farm consultants that have the knowledge and the experience to increase the efficiency of each agricultural task.
Validated sensor-based algorithms for in-season N fertilization are presently being used in cereal production systems for improving yields and NUE [32]. Real-time VR-N, using the algorithm developed by Holland and Schepers [33], has been piloted in the region of Thessaly, Greece, demonstrating significant economic and environmental benefits. Reduced Ν inputs—without yield loss—led to improved NUE by the crops [22,34,35]. However, this practice typically requires advanced fertilizer spreaders capable of integrating specialized equipment, such as multispectral sensors and dedicated controllers. In the present study, VR-N application was implemented using the equipment already available to the farmer, by utilizing near-real-time data from UAVs, demonstrating a more accessible and scalable approach to precision fertilization.
The central hypothesis was that implementing SSNM through VR-N application would lower the average N input compared to conventional uniform fertilization, without compromising yield or grain quality—ultimately improving NUE and reducing the risk of N surplus. The novelty of this work relies on the fact that this is the first official VR-N application in wheat crop in Greece based on high-spatial-resolution data and UAV-derived fertilizer maps. The proposed strategy is user-friendly and can be turned to advantage for farmers by employing the necessary equipment and supported by experts and agricultural consultants. The objectives of the study were (i) to test the real-time VR-N Holland and Schepers [33] algorithm to calculate VR-N with near-real-time data and (ii) to increase knowledge on how data derived from a UAV platform representing temporal and spatial variability of crops can support VR-N application in durum wheat in small fields under Mediterranean conditions.

2. Materials and Methods

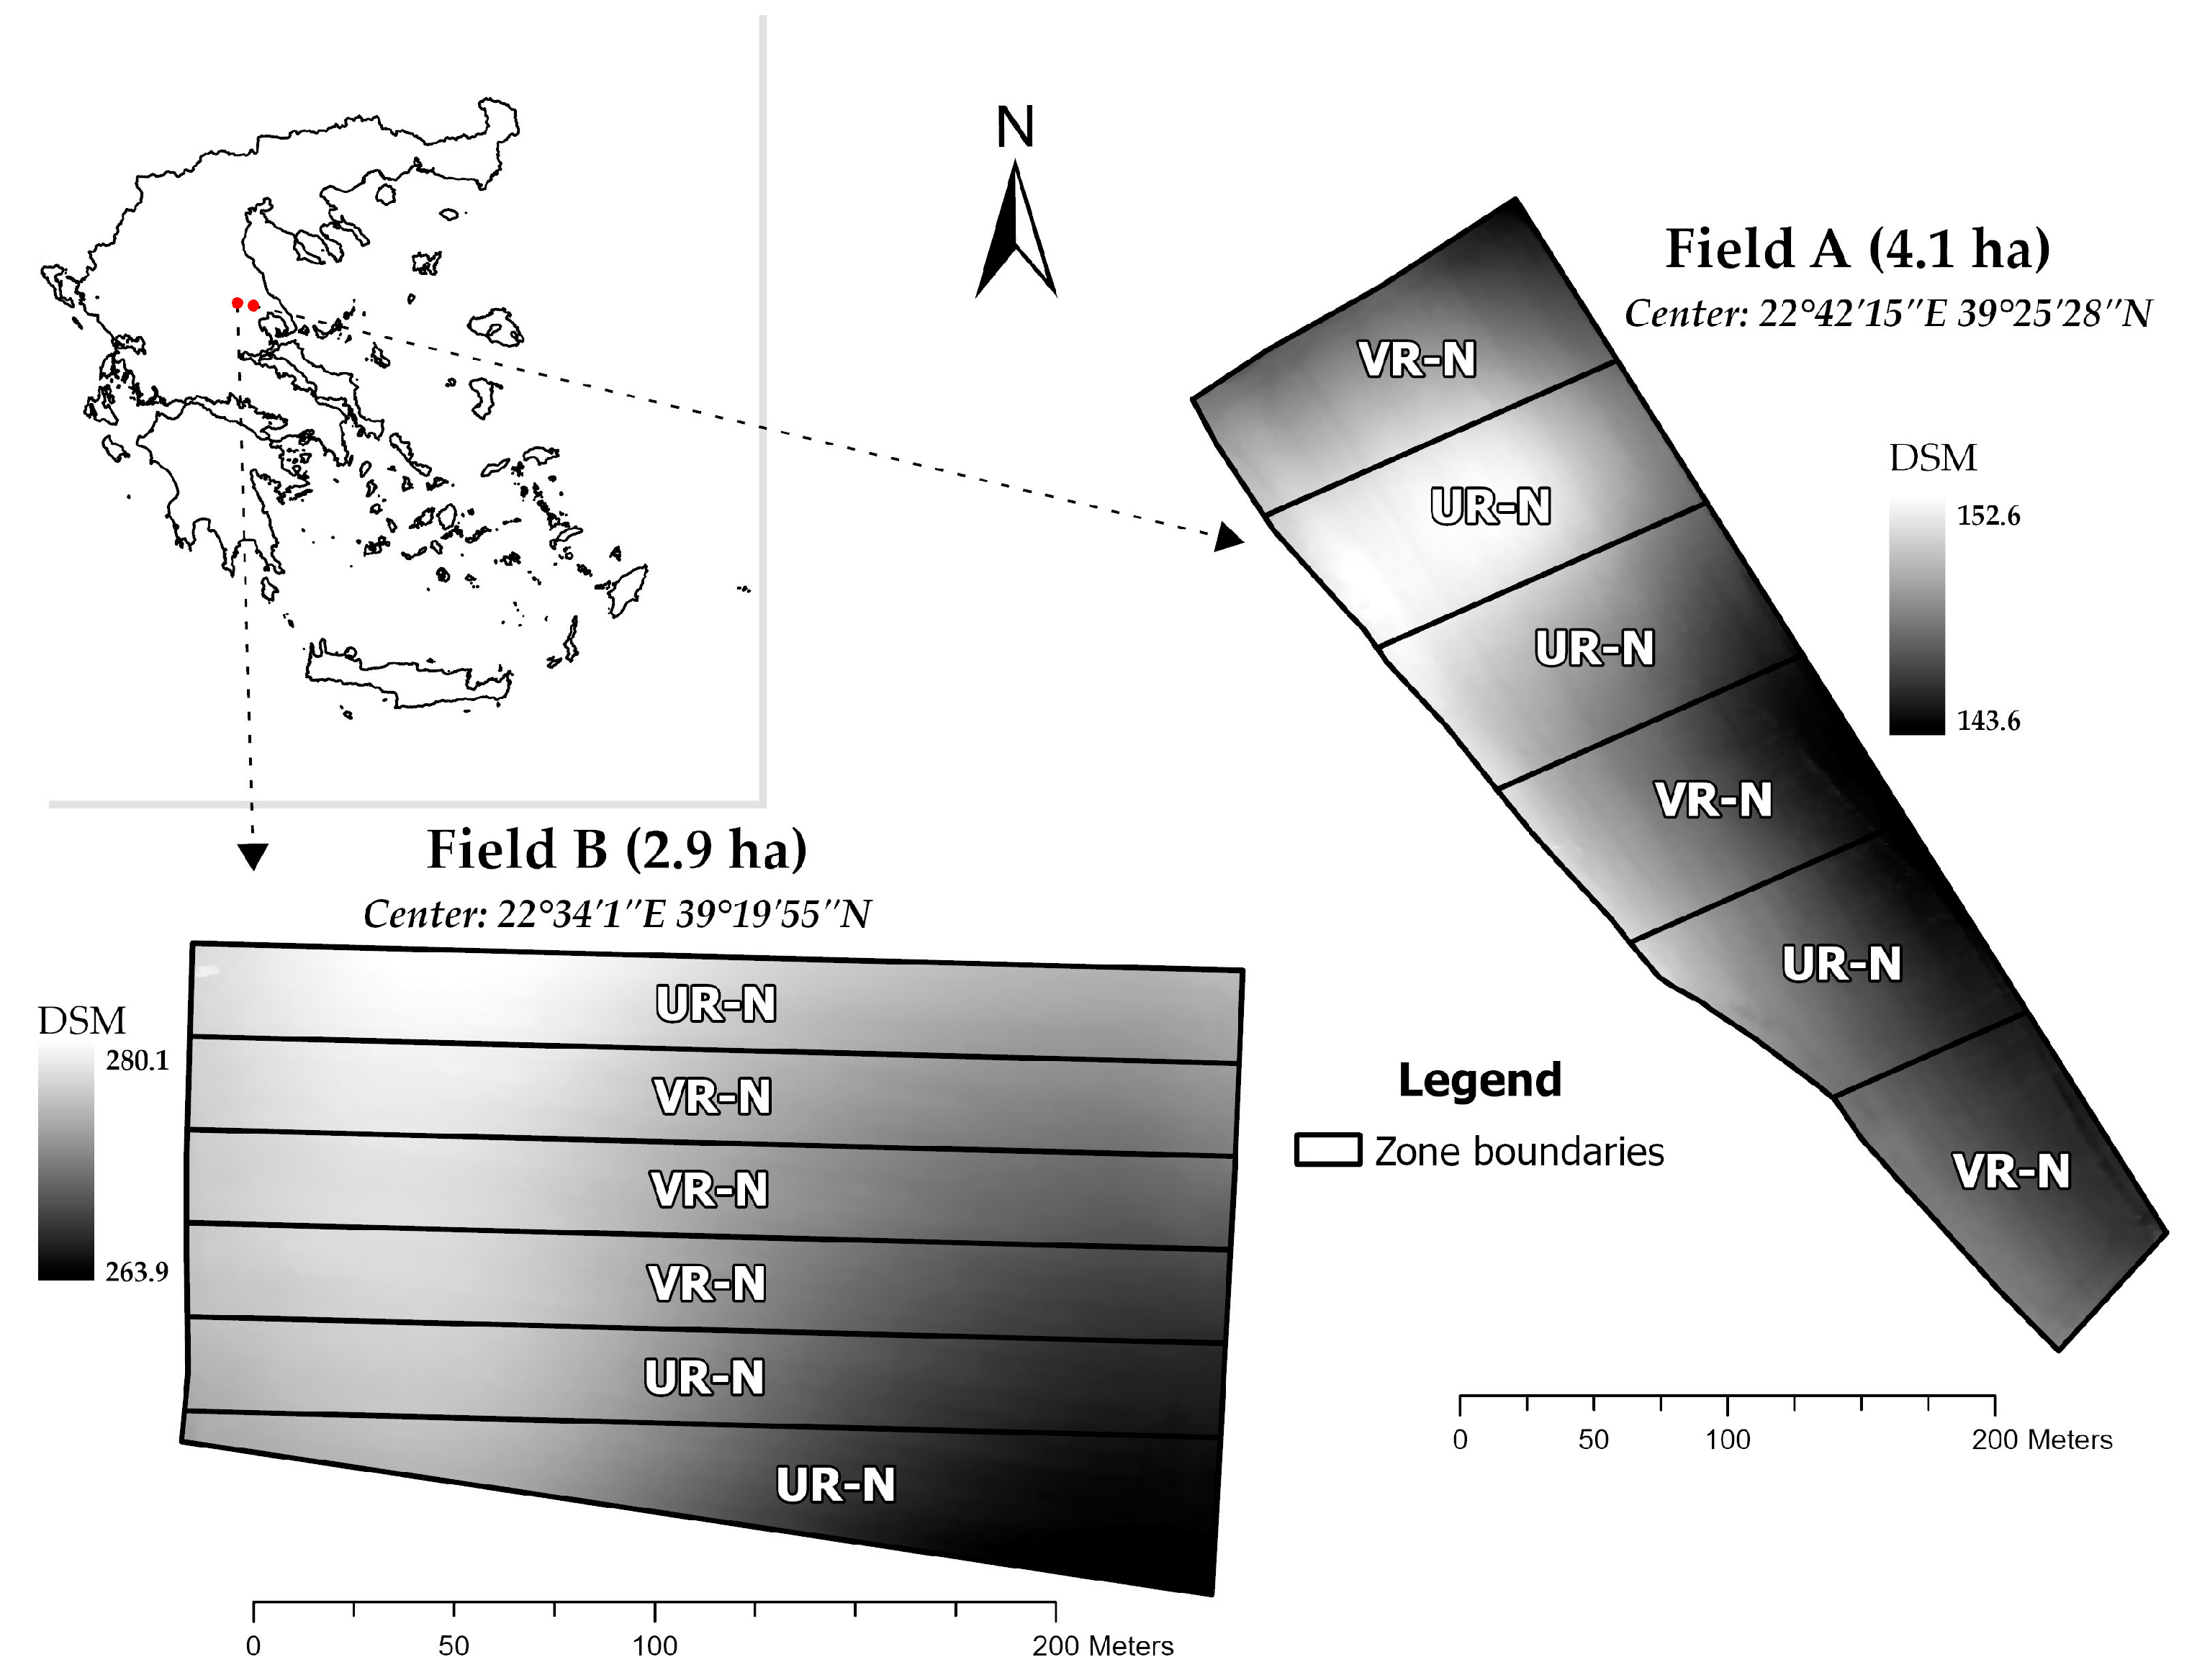
2.1. Locations and Experimental Management

Two commercial fields which are located in the southeast part of Larissa Prefecture (Region of Thessaly), central Greece, under different agroclimatic zones were selected for this study in the growing season 2022–2023 (Figure 1). Field A in Agrokipio (39°25′28″ N, 22°42′15″ E), occupies an area of 4.1 ha, and field B in Ano Vasilika (39°19′55″ N, 22°34′1″ E), occupies an area of 2.9 ha. The Köppen–Geiger climate type in the region of field A is a combination of cold semi-arid, with dry and hot summers (BSk/Csa), and in the region of field B, a Mediterranean climate with dry, hot summers (Csa) [36]. Topographic relief exhibits considerable heterogeneity between and within the two fields. Field A exhibits variable slopes, with the dominant category being from 0.1% to 5.0%, and its altitude varies from 143.6 m to 152.6 m above sea level. Field B exhibits greater slopes, which in many areas exceed 10.0%, and its altitude ranges from 263.9 m to 280.1 m above sea level (Figure 1).
The soil in field A is classified in the order of Cambisols, and in field B in the order of Calcisols [37]. Cambisols are moderately developed soils with weak horizon differentiation. They are found in level to mountainous terrain in all climates and under a wide range of vegetation types, and generally make good agricultural land and are used intensively. Calcisols are soils with a substantial secondary accumulation of lime. These soils are common in calcareous parent materials and found on level to hilly land widespread in arid and semi-arid environments. Based on soil mapping units, in terms of hydromorphy, soils in field A are well-drained (class B) and are characterized as very deep (depth > 150 cm), whereas in field B, the soils are very well-drained (class A), with a depth that does not exceed 1 m (60–100 cm).
Composite soil samples (0–0.3 m depth, n = 16 in field A and n = 20 in field B) were collected from each field prior to preplant fertilization. The samples were thoroughly mixed, air-dried, ground, and, after sieving, analyzed in the fine earth (<2 mm). Basic physicochemical soil properties of the two fields are compiled in Table 1. The soils of the fields were moderately fine-textured clay-loam (field A) or fine- textured clayey (field B) [38], with a slightly alkaline (pH1:1 = 8.0) or medium alkaline soil reaction (pH1:1 = 8.2) [39] and CaCO3 content of 11.8% and 27.1%, respectively [40]. The soil in field A was moderately sufficient (⁓10.0 mg P kg−1 soil), whereas field B was deficient (4.1 mg P kg−1 soil) in available phosphorous (P Olsen) [41]. Soil electrical conductivity (EC =< 1.00 mS cm−1, 25 °C) [42], soil organic matter (⁓1.5%) [43], and total soil N (TSN = 0.1–0.2%) were low in both fields. The method of ammonium acetate (1 N at pH = 7) was used for exchangeable cations [44]. Exchangeable potassium (K+) was found medium to low, and was determined in a flame-photometer, and magnesium (Mg++) was high in both fields, as measured with an atomic absorption spectro-photometer (Varian AA 400 plus, Varian, Sydney, Australia). The soil-extractable-by-DTPA [45] zinc (Zn), iron (Fe), and copper (Cu) were medium, and manganese (Mn) was high (>2.5 mg kg−1) in both fields. Boron (Β) in soils of both fields was found to be low (<0.5 mg kg−1) [46].
Wheat sowing was performed on 18 November 2022 in field A (cultivar “Simeto”) and on 21 November 2022 in field B (cultivar “Monastir”), adopting 300 kg ha−1 of seed sowing density and 1.3 cm sowing depth in both fields. “Simeto” is an early maturing cultivar with medium tillering ability and pest and lodging resistance and excellent protein content. “Monastir” is a medium early cultivar known for its high to medium resistance to lodging and diseases and its high yields and quality. Both cultivars respond well to N fertilization. Field A has been managed to oregano for the past 3 years under no tillage. In field A, tillage operations included conventional ploughing (0.25 m), field cultivating (heavy type), and disking, which were performed prior to wheat sowing. In field B, the preceding crops were wheat, lentils, and wheat in crop rotation under conventional tillage operations (ploughing, field cultivating—heavy type).
Based on the initial soil analyses, the farmer in field A applied preplant fertilizer uniformly (Nutriphos 16-20-0) at a rate of 200 kg ha−1 in mid-November (15 November 2022), and at field B applied preplant fertilizer uniformly (Slowtec 12-18-3) in 18 November 2022, at 220 kg ha−1 to provide adequate N supply during the early season under P and K sufficiency.
In each location and field, the daily mean air temperature and monthly precipitation during the growing seasons were recorded via an energy-autonomous integrated system for outdoor weather monitoring (Agenso AGIOT-0086 wireless weather station). In the 2022–2023 growing season, precipitation in field A (18 November 2022 to 22 June 2023) was 427.2 mm, and in field B (21 November 2022 to 30 June 2023), it was 417.7 mm. Accordingly, the seasonal mean temperature was 11.6 °C in field A and 10.8 °C in field B.
The growing season of 2023 was relatively dry, and at middle-heading (BBCH 55) [47], wheat in field A received 82 mm of irrigation through a ‘‘travelling gun’’ irrigation system on 27 March 2023. No irrigation was applied in field B. Post-emergence systemic herbicide Mustang was sprayed for controlling broadleaf weeds on 15 March 2023 in field A, and on 14 March 2023 in field B. Phytosanitary operations in field A included additionally Elatus Era fungicide which was sprayed on 19 March 2023. Both fields were managed without growth regulators.

2.2. Experimental Design, N Management, and Data Acquisition

Each field was divided into six equal-sized zones, and N fertilization treatments were randomly assigned to each zone on a completely randomized experimental design (CRD). In-season N fertilization with granular ammonium nitrate (NH4NO3-34.5–0–0, total N 34.5-ammoniacal N, 17.0% and nitrate N, 17.5%) took place on 24 February 2023 in field A and on 09 March 2023 in field B. From an agronomic point of view, NH4NO3 is an excellent fertilizer because it combines two different N forms even though its low N content compared to other sources makes the transportation, storage, and application more expensive per unit of N. In each field, half of the zones received a uniform (UR-N) top dressing of granular NH4NO3 at the rate of 343 kg ha−1, when plants were at the mid-tillering stage (BBCH 24–25). As a usual practice of local wheat producers, these are the recommended N fertilizer rates, which are based on the assumed yield and target quality [grain protein content and N harvest index (grain N/total N uptake ratio)], taking into account the N applied during basal fertilization. The rest of the zones received variable-rate nitrogen (VR-N), using a two-disc fertilizer spreader, with a controlled doser (Rauch Axis M/H 30.2).
At physiological maturity (on 22 June 2023 in field A and on 30 June 2023 in field B, BBCH 92–93), wheat plants were cut at ground level using hand sickles and oven dried at 65 °C, until constant weight. Total above-ground biomass (TBY), 1000-grain weight (TGW), grain yield (GY), grains m−2, harvest index (HI) (ratio between grain dry weight and total dry weight), grain protein content GPC (%), and N grain yield (NGY) (gm−2) were determined as the averages of 3 fixed subsamples (each of 1 m2 sampling area) within the center in each of the 6 aforementioned N fertilizer treatment zones in each field. GY was converted into t ha−1 at 13% humidity. Harvested wheat grain samples were dried, weighed, and ground into powder to measure the total N content using the Kjeldahl digestion method [48]. The determination of grain crude protein content (GPC%) was carried out in triplicate samples of 0.5 g. Composite triplicate soil samples within each N treatment zone from the two fields were collected after plant wheat harvest of a depth 0–30 cm to determine soil residual nitrate N [49].

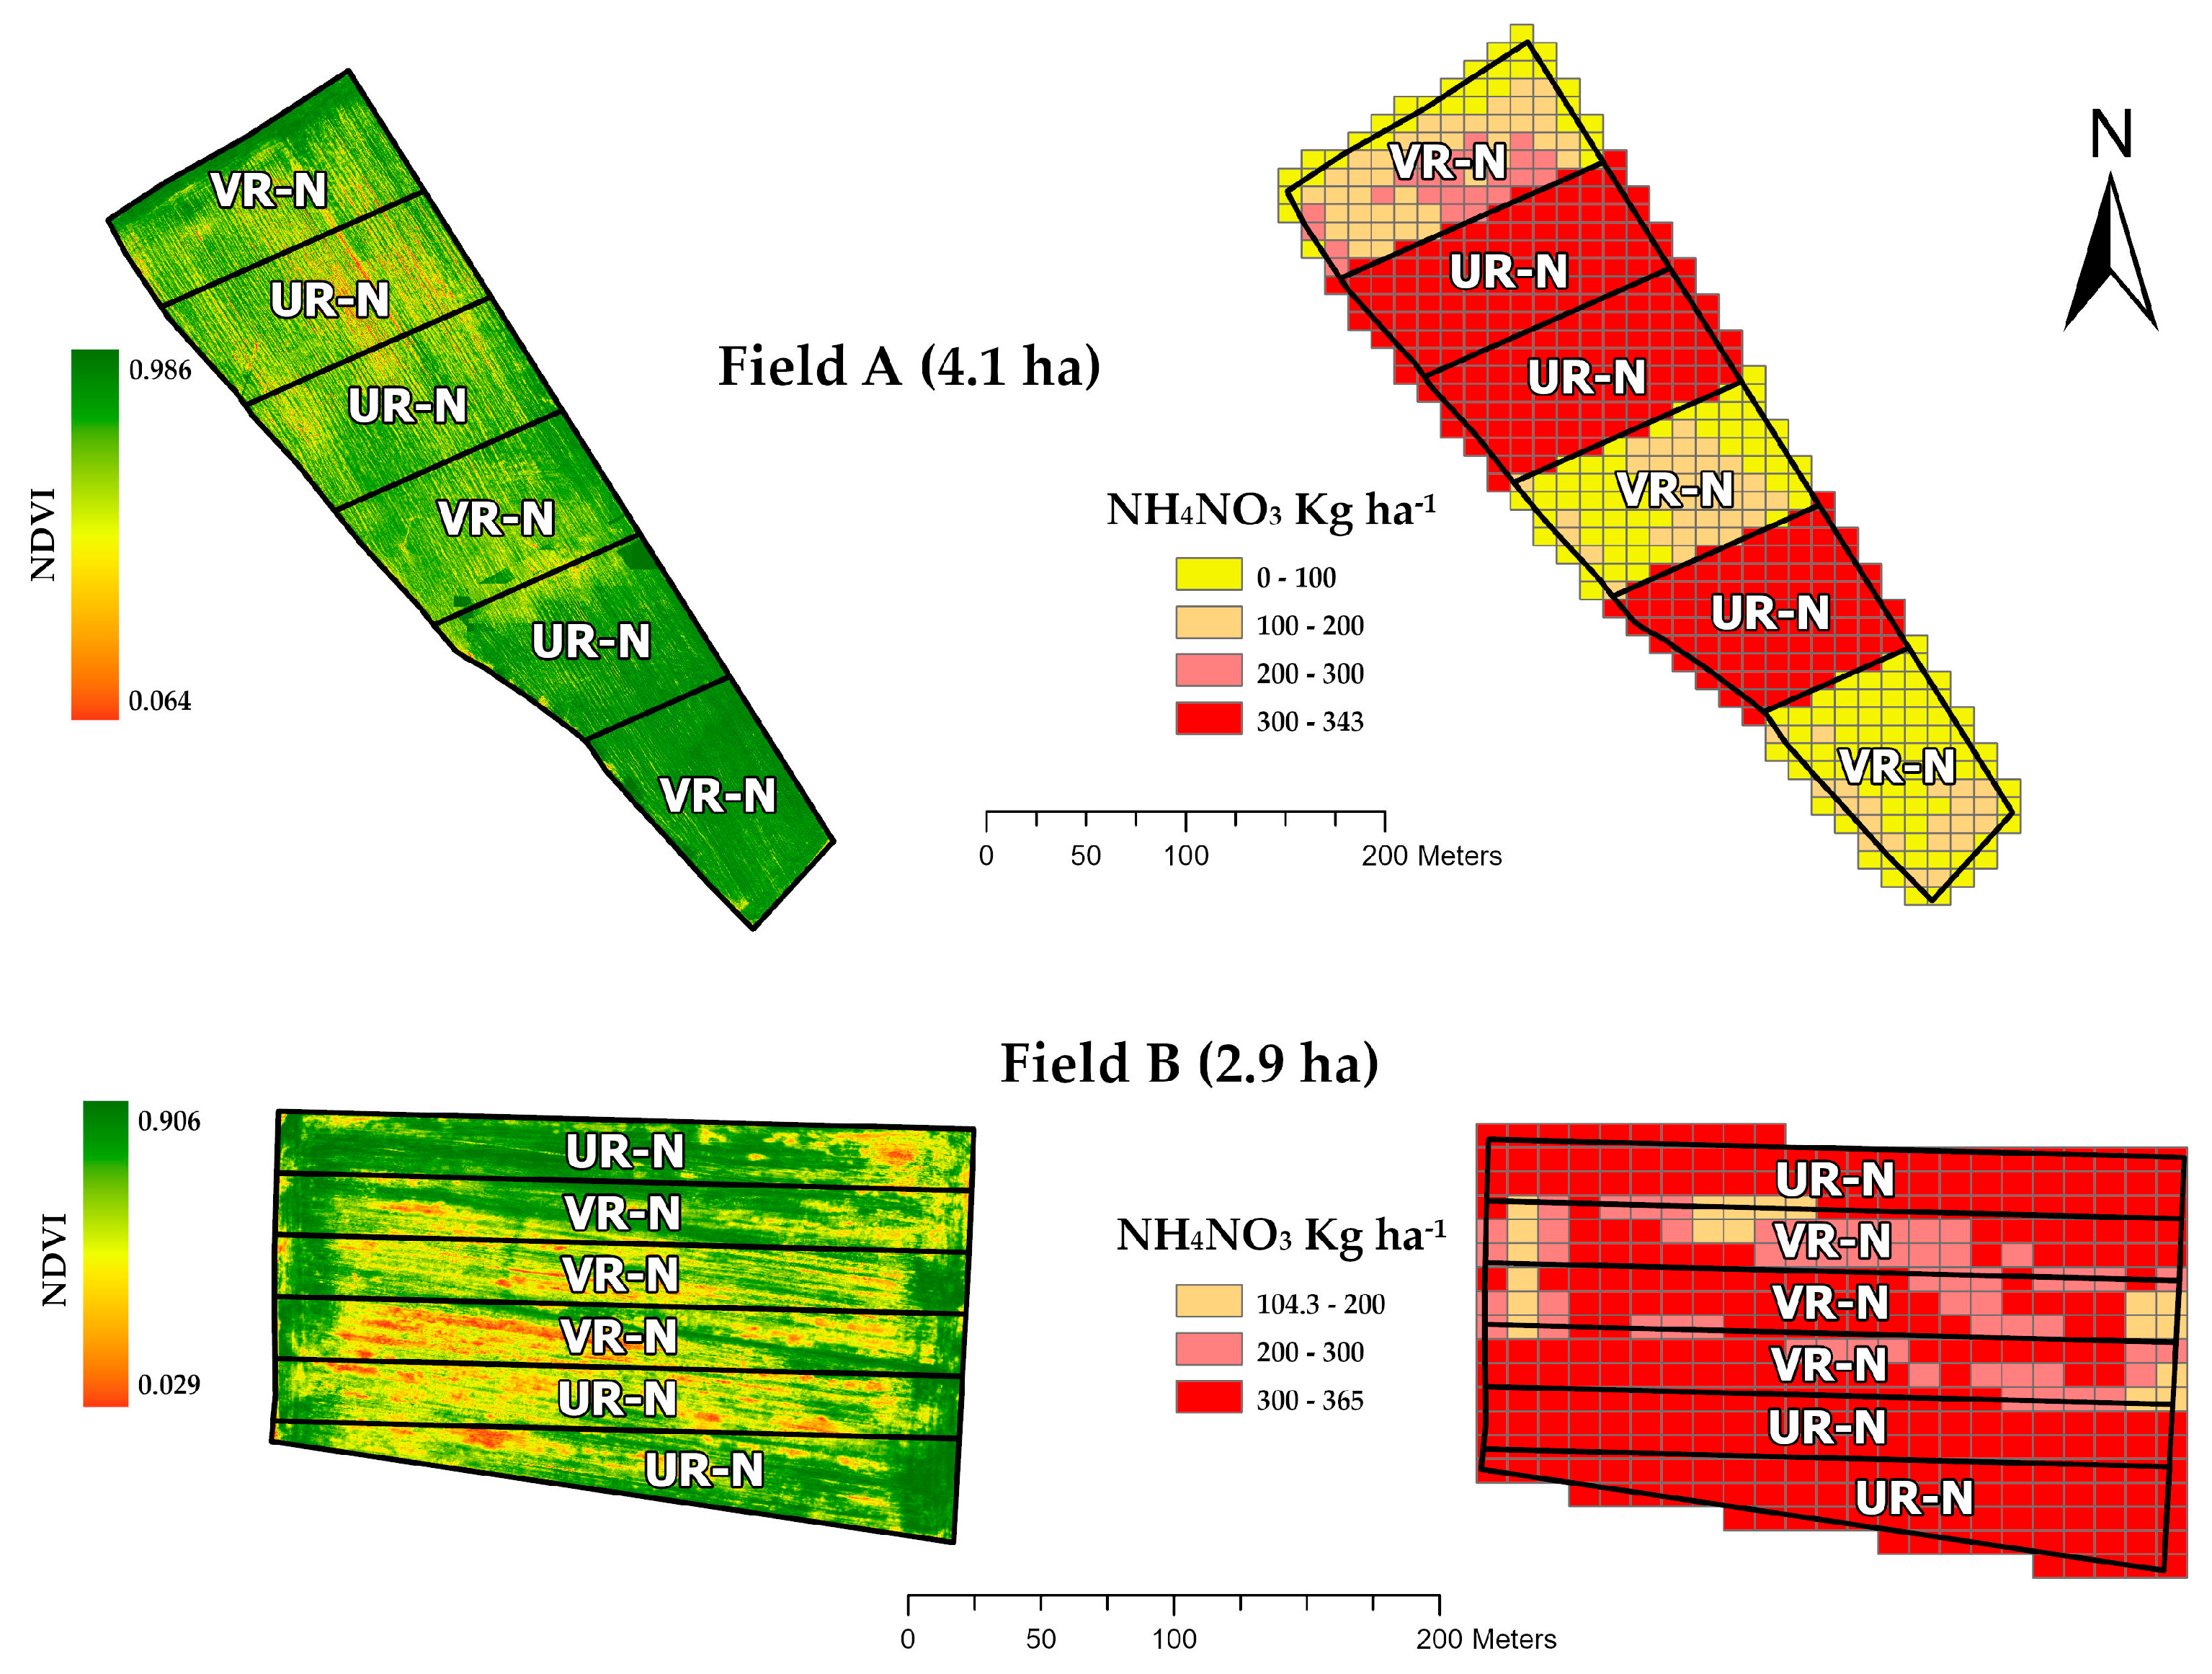
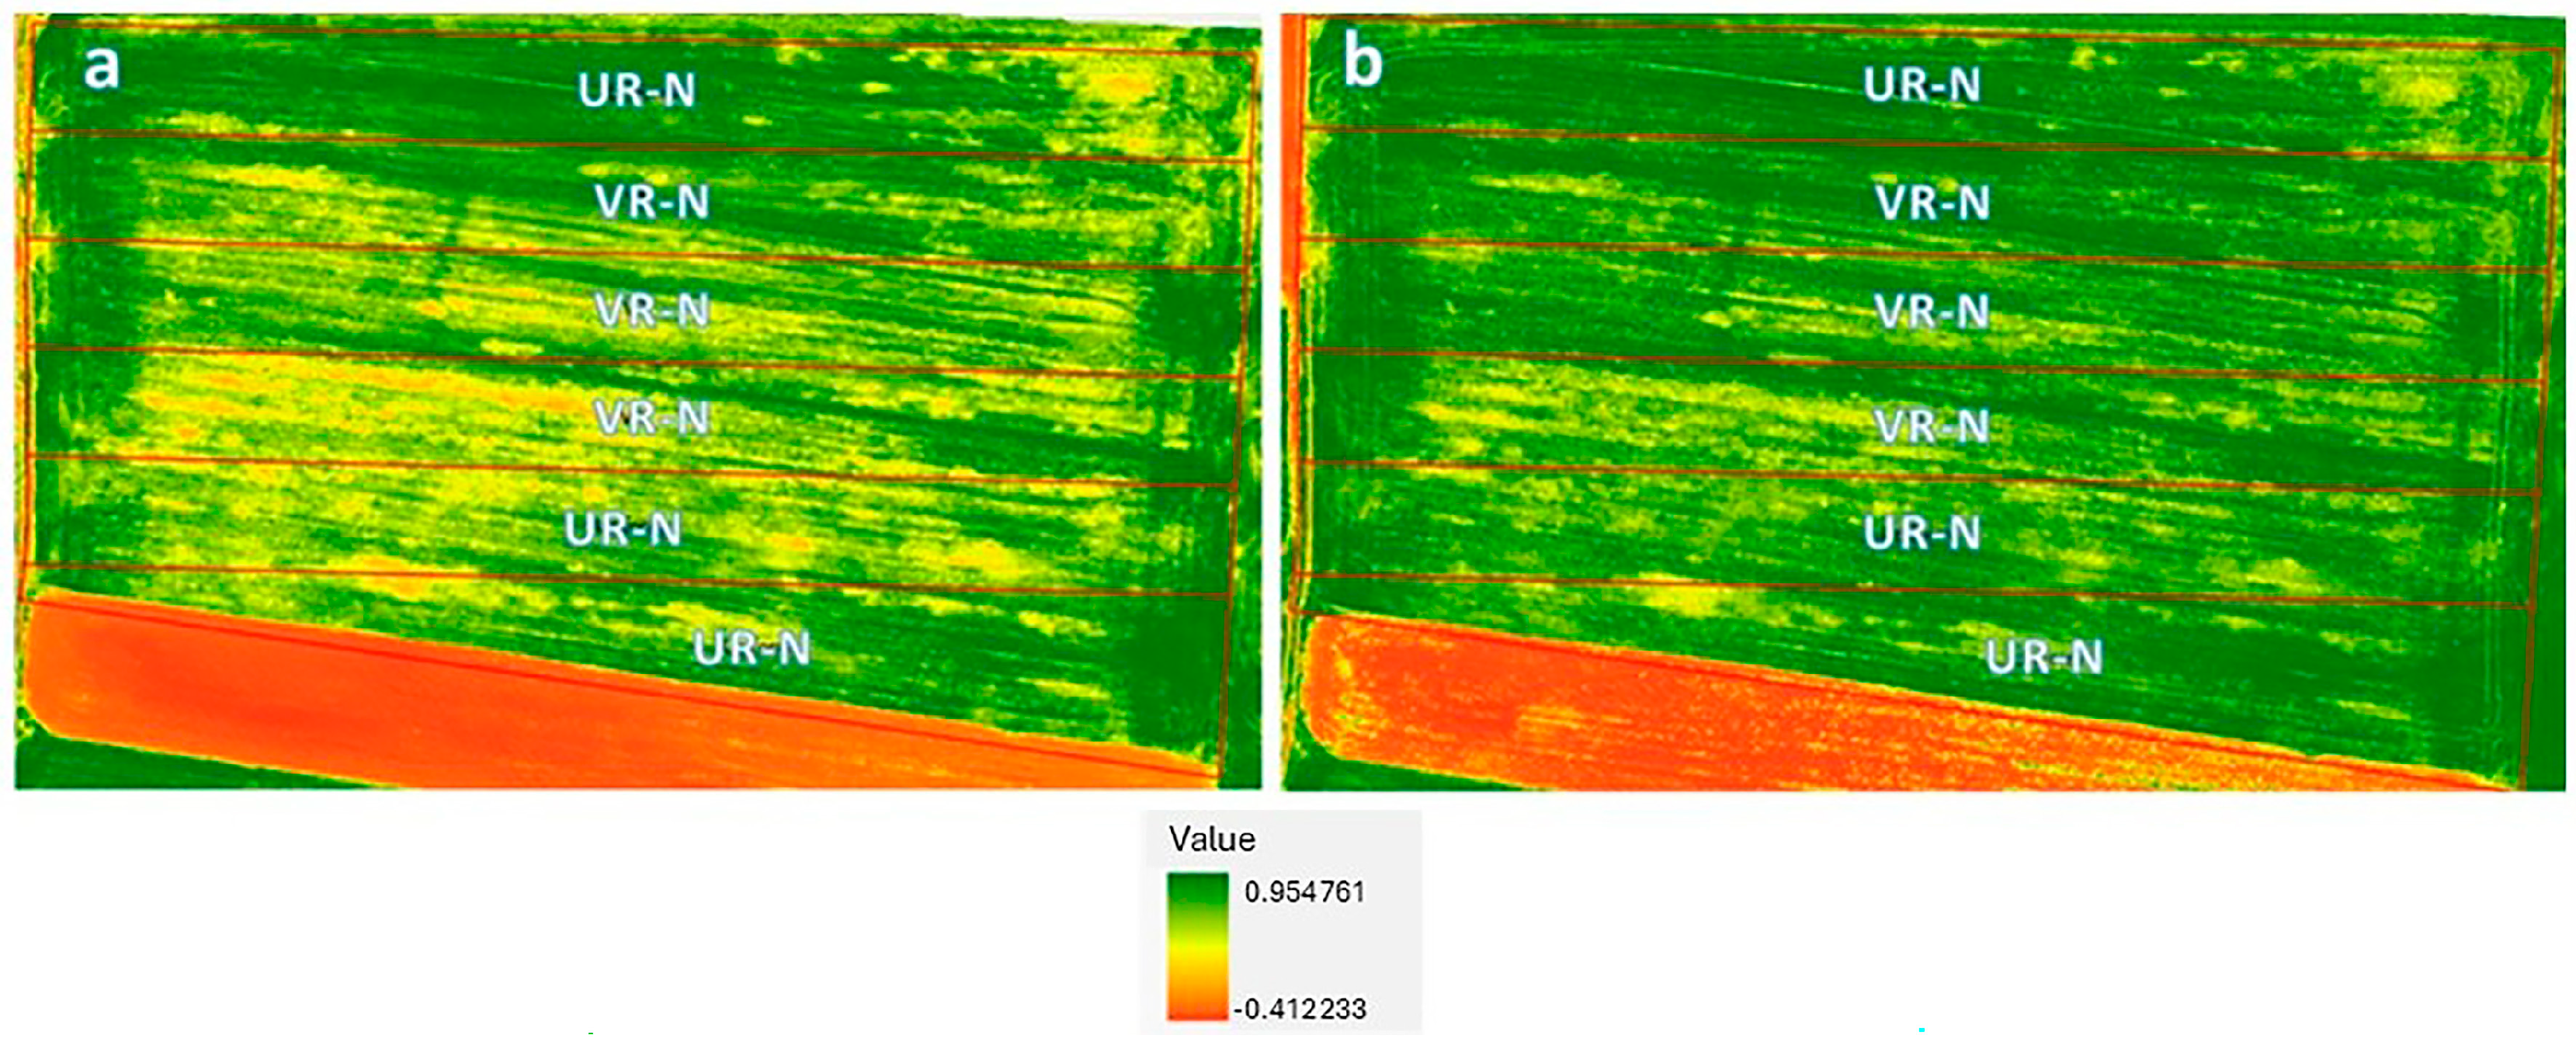
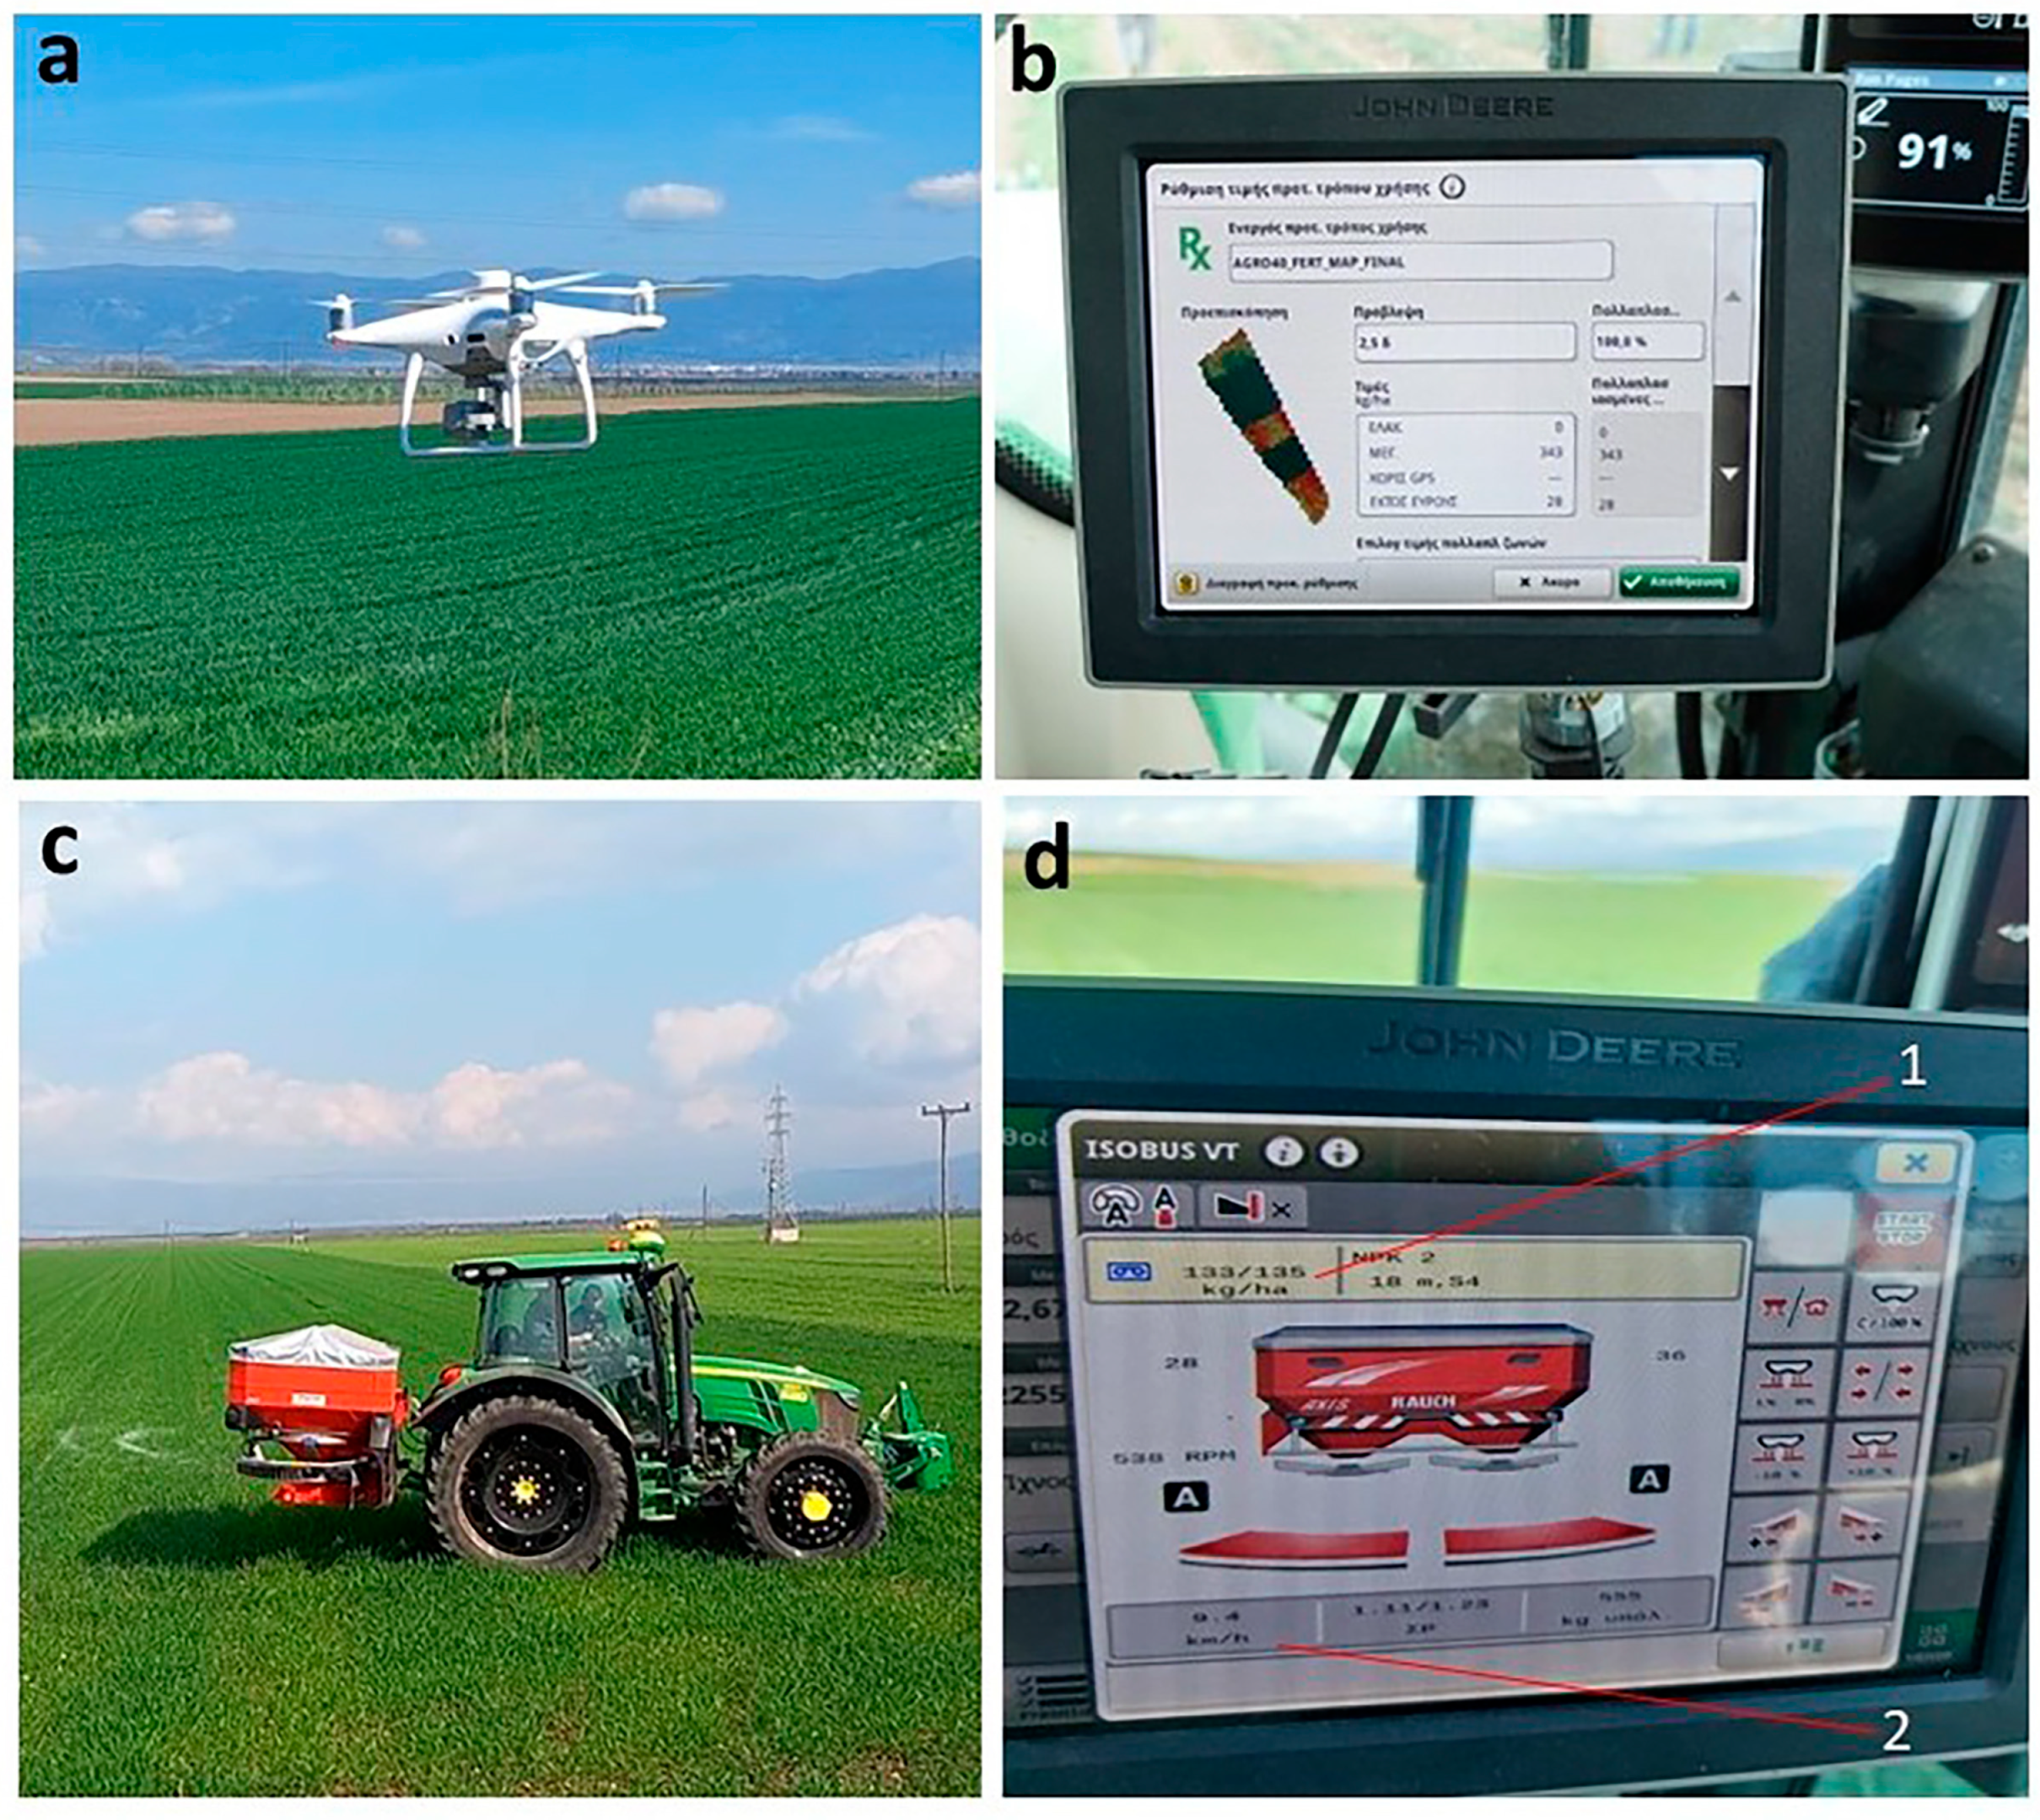
2.3. Low-Altitude Remote Sensing Data, VR-N Calculation, and Fertilizer Application Maps

A few days before in-season N application, when plants have reached the BBCH stage 24–25 (mid tillering), high-resolution multispectral image data were taken (near-real-time data) with the UAV DJI Phantom 4 Multispectral RTK. The UAV campaigns were conducted in clear, cloudless, and calm weather conditions between 10:00 a.m. and 12:00 p.m. local time. Using the software DJI GS Pro [version 2.0.18 (10674), flight routes were pre-planned, and aerial photography performance in real-time during the flight was examined. The flight altitude was set at 120 m. From this altitude, the spatial accuracy is 6.4 cm pixels, which is considered very detailed for N fertilization. Moreover, this altitude provides a balance between image resolution and coverage. Image overlap was determinate for 80% front and side, to ensure sufficient redundancy for accurate photogrammetric reconstruction. Flying speed was 5 m s−1 to minimize motion blur while maintaining efficient coverage.
UAV imagery was processed with DJI Terra software (version 4.5.0.) for each field to generate the Normalized Difference Vegetation Index (NDVI), which is based on differences in the red (670 nm) and near infrared (780 nm) spectrums for each entire field [NDVI = (NIR − red)/(NIR + red)] (Figure 2). We used the 95th percentile algorithm by Holland and Schepers [33] to calculate N application rates using a reference value of NDVI reflectance of the crop. The NDVI reference value was determined by the “virtual strip approach’’ for the use of multispectral sensors [50]. Based on this approach, a portion (one strip) of the existing crop that represented the range in crop vigor within the field was selected from the entire field NDVI values, and then plants were statistically identified that were deemed to be non-N limiting by selecting the 95-percentile cumulative value from the histogram of NDVI values. The virtual strip approach has been applied for VR-N applications in wheat, cotton, and corn cultivations, demonstrating significant reductions in N fertilization [21,22,35]. The algorithm by Holland and Schepers [33] calculates the N application rate at a specific field location and has two terms. The first term estimates the fertilizer N needed by the crop by means of mass balance. The second term provides a spatial adjustment of the mass balance by sensor readings of canopy reflectance. The algorithm makes use of a sufficiency index (SI = NDVI sensed/NDVI reference) and was applied for each pixel of the captured images to calculate the VR-N doses and to create fertilizer prescription maps. In our study, SI was calculated from the NDVI values of the entire field. Fertilizer field maps were created using ArcGIS software (ArcGIS Desktop: version 10.0 Redlands, CA, USA: Environmental Systems Research Institute) (Figure 2).
NDVI values were calculated for each pixel (6.4 cm) and subsequently used to estimate the SI, which formed the basis for calculating the VR-N dose. Figure 3 shows NVDI maps in field B few days before and 22 days after in-season N fertilizer application.
As specified by the manufacturer, to align with the capabilities of the VR spreader system (Rauch Axis M/H 30.2, RAUCH Landmaschinenfabrik GmbH, Victoria Boulevard, Germany), we created grid shapefiles (polygon) with dimensions of 9 m × 9 m. Finally, we applied a spatial join (mean method) between the calculated VR-N values and the grid cells. This allowed us to aggregate the VR-N dose recommendations into each grid cell, resulting in the creation of the prescription fertilization map. The tractor (John Deere 5125R, Augusta, GA, USA) speed during fertilizations was kept constant at ⁓10 km/h. The tractor was equipped with a GEN4 4240 Universal Smart Touch terminal. It’ AutoTrac™ and section control is capable and fully ISOBUS AEF-certified (Figure 4). An active JDLink™ Connect subscription the display supported wireless data exchange with the John Deere Operations Center.

2.4. NUE and Environmental and Economic Assessment

NUE is a complex term and can be defined based on different components and specific indices. In this study we did not include N control (0 N) plots; thus, N production efficiency (NPE) serves as the proper index of NUE, as it provides a measure of the total economic output as a result of N utilization from all sources of N, including fertilizer, and was calculated as follows [51].
NPE (kg kg−1) = GY/N fertilizer rate
where GY is the grain yield in kg ha−1, and fertilizer N rate is the amount of fertilizer N applied in kg ha−1.
The environmental evaluation of variable-rate nitrogen (VR-N) application was conducted by estimating the carbon footprint (CF) of the crop, based on the model by Hillier et al. [52]. The CF was calculated in terms of kg CO2 ha−1 and kg CO2 tn−1 of harvested product, taking into account all field operations from soil preparation to harvest (tillage/seedbed preparation, pre-plant fertilization, seeding, irrigation, phytosanitary operations, and final harvest). Additionally, residual inorganic N levels after harvest were assessed as an environmental indicator, as this N remains unused by the crop and poses a potential risk of N losses from the root zone through leaching or gaseous emissions.
A simplified estimate the economic income, defined as the marginal return of N fertilization (MR, EUR ha−1) was calculated in Equation (2) according to Wang et al. [53]. For the economic assessment (MR), we focused on the revenues from durum wheat production in EUR ha−1, here defined as the difference between gross revenues minus N fertilizer costs. The economic comparison between the VR-N and UR-N was based on the calculation of the differences in revenues, fertilizer N costs, and grain yields between VR-N and UR-N.
MR (EUR ha−1) = GY × PY − Napp × PN
where GY is the grain yield (kg ha−1), PY is the grain price (EUR kg−1), Napp is the N fertilizer applied (kg N ha−1), PN is the N fertilizer price (EUR kg−1). Prices of fertilizers and grains in the experiment year were based on local prices. Commercial grain prices of durum wheat without defects and impurities were 0.4 EUR kg−1 and 0.37 EUR kg−1 for field A and B in Greece in 2023, respectively, while prices for fertilizers were 0.775 EUR kg−1 and 0.848 EUR kg−1 for field A and B in 2023, respectively.
It must be highlighted that in field A in the southernmost zone (VR-N zone, Figure 2), during harvest, we observed large areas of weed infection, with wild oat (Avena sterilis L.) and wild mustard (Brassica arvensis L.) affecting wheat grain quality and commercial grain prices; therefore, we have not considered data of this zone only for calculating MR. This is considered a simplified economic balance between the cost of fertilizer and the gain from the sale of the grain to the mill, because other field management costs such as seed, labor for fertilization, irrigation, and mechanical sowing, aand the cost to obtain prescription maps or the costs for the technology and the machinery were not taken into account, following a similar approach as indicated by Argento et al. [6] for small size farms.

2.5. Statistical Analysis

Data were analyzed by means of one-way ANOVA using SPSS (IBM Corp. Released 2023. IBM SPSS Statistics for Windows, Version 29.0.2.0 Armonk, NY, USA: IBM Corp). Means for the examined parameters of the two fertilizer treatments were compared using the t-test with the p < 0.05 level of statistical significance [54].

3. Results

3.1. N Fertilizer Applied and Yield-Related Components

N fertilizer application rates were, on average, reduced in the VR-N treatments by 18.4% to 49.6%, depending on the field. On average, in field A, 170 kg ha−1 of fertilizer N was applied in VR-N zones, which was approximately half of the fertilizer N dose applied by the farmer in the UR-N treatment. In field B, 18.4% less fertilizer was applied in the VR-N zones (Table 2). Total dry biomass yield (TBY) in both fields showed no significant difference between the VR-N and the UR-N treatment and ranged from 13.9 t ha−1 (field B, VR-N) to 16.1 t ha−1 (field A, UR-N). In field B, GY showed significant difference between the two fertilizer treatments and was, on average, 17.4% lower in the VR-N compared to UR-N treatment, whereas in field A, GY showed no significant difference between the two fertilizer treatments. Correspondingly, TGW after harvest was significantly lower in the VR-N treatment compared to UR-N treatment in field B. Grains m−2 and HI (the ratio of grain to total shoot dry matter) showed no significant difference between the VR-N and the UR-N treatments in both fields. Grains m−2 and reproductive efficiency (HI) tended to be lower in the VR-N zones in both fields. The grain protein content (GPC) varied from 11.9% (field A) to 12.4% (field B) in the VR-N zones, while in the UR-N zones, from 13.8% (field A) to 11.6% (field B). NGY also showed no significant difference between the VR-N and the UR-N treatments in both fields (Table 2).

3.2. NUE and Economic Assessment

Compared to UR-N, the reduction of average applied N in the VR-N treatments resulted in significantly higher NPE (efficiency of grain production in relation to the N applied) in field A. NPE was relatively low and showed almost no different performance between VR-N and UR-N in field B (Table 3).
The marginal returns (MR) of VR-N also showed improved financial gain, when compared to the UR-N treatment in field A. The improved gain of VR-N was 7.2% as compared to UR-N, which corresponded to 163.8 EUR ha−1 (ΔMR) mainly due to the reduction of the applied N fertilizer. However, this difference was not statistically significant. In field A, we have not considered one of the three zones in MR calculation due to lower quality grain affecting commercial prices. Adopting VR-N technology showed no financial gain (MR) in field B (Table 3).

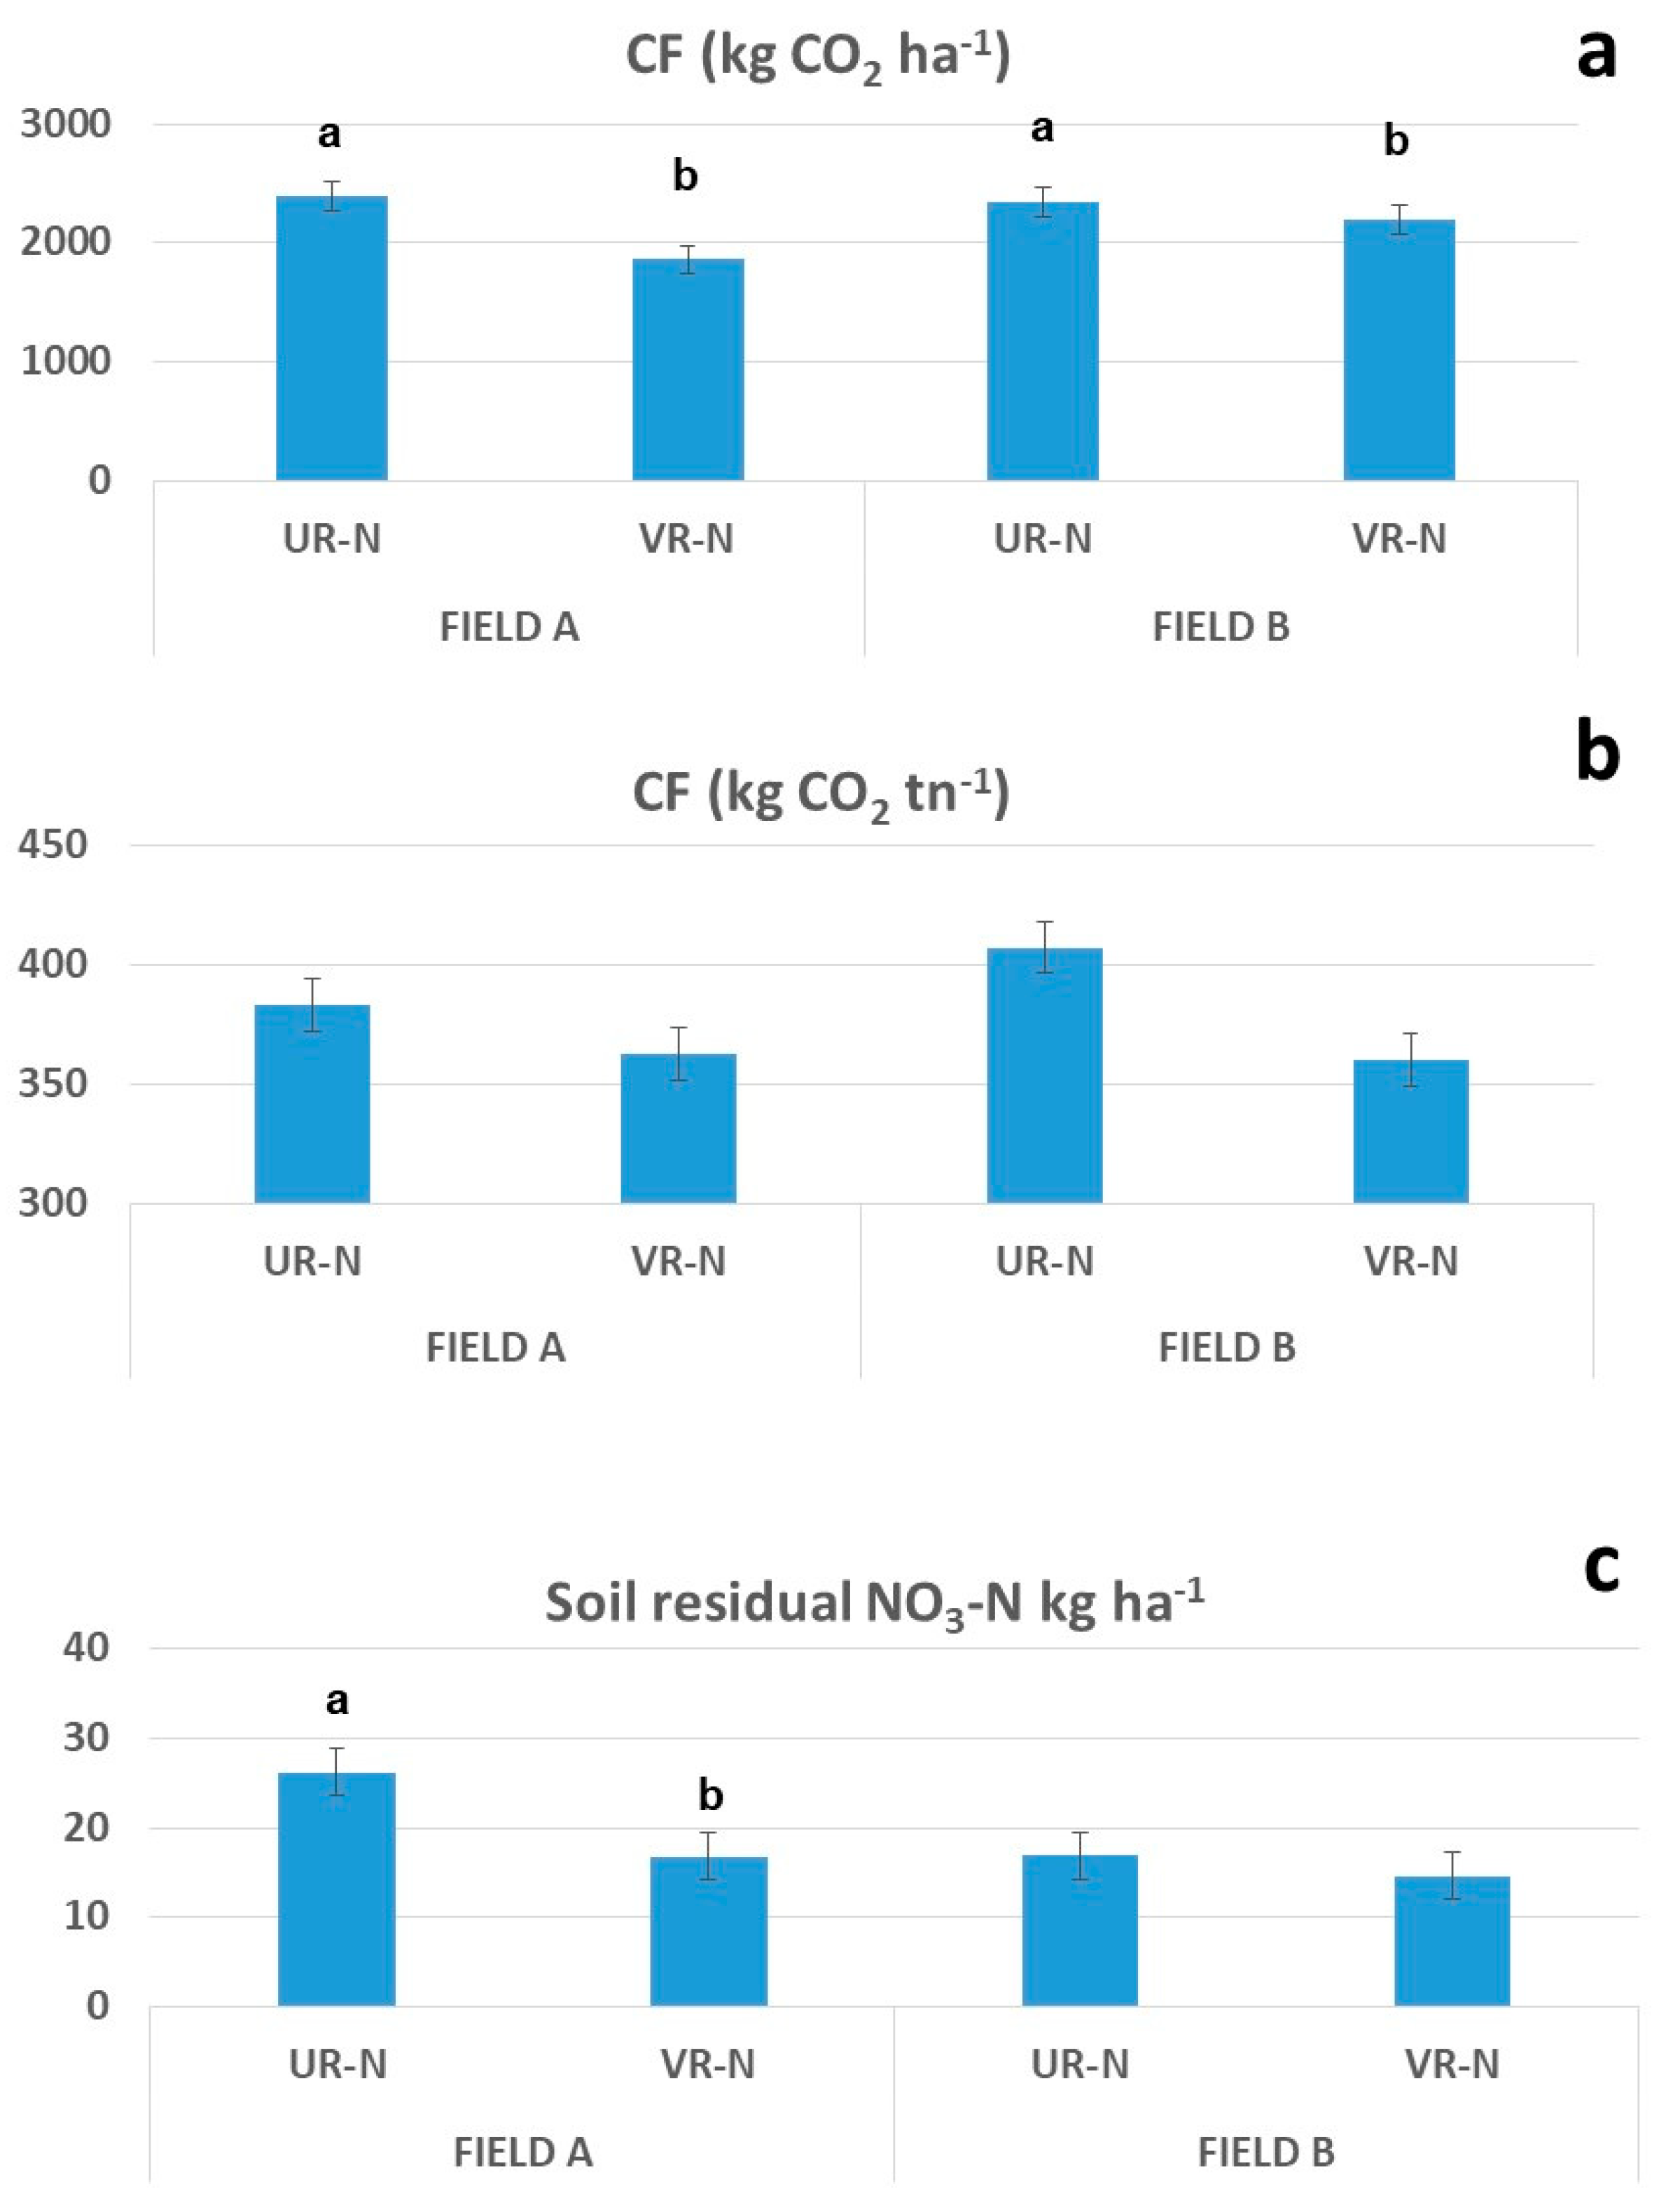
3.3. Environmental Assessment

The reduced N application rates achieved through variable-rate technology resulted in a lower CF (expressed as kg CO2 ha−1) in both fields. Specifically, in field A, the CF of VR-N (1859.3 kg CO2 ha−1) was reduced by 22.2% compared to the uniform N application (2389.7 kg CO2 ha−1). In field B, the respective reduction was smaller, reaching 6.4%. When expressed as kg CO2 per ton of yield (kg CO2 tn−1), the CF of the crop decreased by 5.3% in field A (VR-N = 362.5 kg CO2 tn−1; UR-N = 383.0 kg CO2 tn−1), while it increased by 13.0% in field B (VR-N = 407.0 kg CO2 tn−1; UR-N = 360.1 kg CO2 tn−1). This increase is primarily attributed to the lower yields observed in that field (Figure 5a,b).
Residual soil NO3-N was also significantly reduced under VR-N application. The reduction reached 36.1% in field A (VR-N = 16.8 kg ha−1; UR-N = 26.3 kg ha−1) and 13.6% in field B (VR-N = 14.6 kg ha−1; UR-N = 16.9 kg ha−1), indicating that UR-N leaves substantial amounts of unused N in the soil (Figure 5c).

4. Discussion

The current study deals with the performance comparison of VR-N with UR-N in durum wheat and introduces a method to determine the N application rates as well. For the latter, the 95th percentile algorithm by Holland and Schepers [33] was applied to NDVI images of the wheat canopy captured by UAV few days prior to fertilization. By this algorithm, the calculation of the amount of N fertilizer that has to be applied to a specific area in the field depends, in addition to the foliage reflectance vegetation indices, (i.e., NDVI), on the growth stage of the crop at a given time, the total amount of N required by the crop, and the amount of N that has already been applied. One of the benefits of using this algorithm is that information for estimating wheat N requirements is not based on soil or plant tissue analyses, but on the plant’s own response to incident radiation, which includes any variations both spatially within the boundaries of a field and temporally from year to year [32,33,35]. The integration of the proposed algorithm with high-resolution UAV imagery and commercially available smart fertilizer spreaders offers a practical and accessible solution for implementing VR fertilizer applications, facilitating adoption by farm managers and agricultural consultants. In SSNM, the primary step involves identifying variability within a field, and the choice of sensor technology significantly influences the effectiveness of fertilization strategies. Specifically, UAV-based spectral data collection with its high spatial resolution, as demonstrated in the study with 6.4 cm accuracy for NDVI calculations, allows for precise N application [55,56,57,58]. This level of detail is crucial for optimizing nutrient management decisions. High-resolution sensors may be beneficial for fields with high spatial heterogeneity, as demonstrated for the two fields in our study (differences in topographic relief, soil class, soil texture, % CaCO3 content, available P, etc.) (Figure 1, Table 1), whereas lower-resolution data might be sufficient for more uniform fields [28]. Moreover, the present study considered NDVI values of the entire field for calculating the sufficiency index [SI = VI(NDVI) sensed/VI(NDVI) reference] and ultimately VR-N doses, instead of using the SI of a portion (one strip) of the existing crop that represented the range in crop vigor within the field [59], a differentiation which may increase the robustness of the algorithm. Although the virtual strip approach by Holland and Schepers [50] has been applied with success for VR-N applications in wheat, cotton, and corn cultivations demonstrating significant reductions in N fertilization under more or less similar pedoclimatic conditions [21,22,35], to the best of our knowledge, this is the first ever study which applied the algorithm of Holland and Schepers [33] to high-spatial-resolution (accuracy of few cm) near-real-time data acquired by UAV to construct N fertilizer maps of wheat.
As far as the performance comparison between the two N treatments, the results proved that VR-N application reduced the total N application without any yield loss in one of the two pilot fields (field A) (Table 2), confirming results of other studies for small-to-medium-sized wheat agricultural systems [6,35,53]. TBYs were in the range of 13.9 t ha−1 to 16.1 t ha−1, and GYs were in the range of 5.42 t ha−1 to 6.56 t ha−1 and were comparable between the two fields. However, comparable GYs in the VR-N zones resulted from much higher, on average, N fertilizer application (additional 110 kg ha−1) in field B as compared to field A. High-resolution NDVI images captured few days before in-season N fertilization showed that in field A, plants were healthier (greener) compared to plants in field B. This, in turn, is mirrored to the amount of N fertilizer calculated by the algorithm of Holland and Schepers [33] for in-season N application (Figure 2).
In field A, underlying soil properties. but also pedoclimatic conditions plus irrigation. may have favored high soil N-mineralization rates during the vegetation period, which led to a good grain filling and higher TGW in the VR-N treatment (Table 2). Contrarily to field A, in field B, GY and TGW in the VR-N treatment were significantly lower compared to UR-N treatment. These results may be attributed to high fluctuations of the relief of the topography and the greater slopes (reaching ⁓15.0%) in field B, which affects water movement in soil, erosion of topsoil, and deposition. In steeper slopes, reduced water retention and higher erosion rates result in thinner and less fertile soils [60]. Moreover, soil in field B belongs in the order of Calcisols enriched with free calcium carbonate (CaCO3 = 27.1%, Table 1), which may be rather problematic under certain conditions for wheat crop production (i.e., limited availability of P and some of the trace elements such as Fe, Zn, and Cu [61]). The application method of N did not significantly affect the number of grains m−2, HI, and NGY in both fields (Table 2). GPC (11.6–13.8%) was relatively lower compared to GPC than that obtained by Stamatiadis et al. [35] in the same region, under three N treatments including VR-N, for the durum wheat “Simeto” cultivar, which has medium tillering ability and responds well to N fertilization.
Residual soil NO3-N in the VR-N zones was lower than in the UR-N zones (36.1% significantly lower in field A, Figure 5c), suggesting that VR-N technology can potentially reduce the risk for groundwater pollution in the spring, when precipitation exceeds crop water use, and therefore can protect environmental resources as described also by other researchers [62,63,64]. Substantial amounts of unused N in the soil in UR-N zones has both environmental and economic implications, as it can contribute to N leaching and increased input costs without corresponding yield benefits. Moreover, advanced-technology fertilizers (slow and controlled release fertilizers, nitrification and urease inhibitors, fertilizers with biostimulants, nanofertilizers, etc.) are ways to increase fertilizer use efficiency [65]; however, the increased fertilization cost and the limited available data on their efficacy under different pedoclimatic environments suggest that the use of variable fertilization rate can be promising and more profitable way to reduce the total amount of N applied.
Most of the definitions developed for NUE are based on grain yield, implying the input–output ratio of N fertilizers [66,67,68]. Basically, this is the ratio of biological yield (total aboveground plant dry matter or total plant N) or economic yield (grain yield or total grain N) and N supply (from soil, organic fertilizer or inorganic fertilizer), or soil plus fertilizer [69]. NUE indices have been basically denoted as agronomic efficiency (AE), physiological efficiency (PE), recovery efficiency (RE), N production efficiency (NPE) or partial factor productivity of applied N (PFP), and some other indices [66,70]. However, each index serves better in estimating NUE depending on the different cropping practices with the presence or not of no-N control plots [71]. As indicated previously, our study did not involve control (0 N) plots; thus, NPE [or the partial factor productivity of applied N (PFP)] serves as the proper index of NUE, since it is adjusted for the GY with the direct application of the N supply under each treatment [72]. The ability of the crop to efficiently use the applied N fertilizer to increase grain yield (NPE, the ratio of grain yield and amount of fertilizer N applied) was significantly higher in the VR-N treatment only in field A. In field B, there was almost no difference in NPE between VR-N and UR-N (Table 3). These results are attributed to the amount of the average N fertilizer applied in the VR-N zones in the two fields to achieve the respective comparable yields (5.49 kg ha−1 in field A vs. 5.42 kg ha−1 in field B). As stated previously, the average GY in the VR-N zones in field B resulted from additional, on average, 110 kg ha−1 fertilizer as compared to field A (Figure 2). The elevated N application rates which were, on average, observed in the VR-N zones of field B—ultimately contributing to reduced NPE relative to field A—can be attributed not only to the inherently low soil fertility conditions of the field, but also to suboptimal agronomic management practices, including inadequate crop establishment, inefficient irrigation scheduling, and phytosanitary interventions. These factors likely affected canopy reflectance, as captured by the UAV, which serves as a reference from which a sufficiency index (SI) is calculated and consequently influenced the calculated VR-N doses. As emphasized by Holland and Schepers [33], a fundamental prerequisite of their algorithm is that, in order to accurately determine the optimal N fertilizer rate, the crop must be free of any stressors other than N deficiency.
This is translated in a marginal return of N fertilization (MR, EUR ha−1) of 2436.7 EUR ha−1 in field A, whereas in field B, MR was 1825.8 EUR ha−1 (Table 3). It should be mentioned that in field A, the low quality of wheat grain in one of the three VR-N zones, due to large impurities observed during harvest, resulted in very low commercial grain prices; therefore, this zone was excluded from MR analyses. In this study, the MR offers an economic balance between the cost of fertilizer and the gain from the sale of the grain to the local market and could offer a better insight as to how VR-N technology could be adopted by farmers. The improved gain of VR-N when compared to UR-N is 7.2%, corresponding to 163.8 EUR ha−1 in field A (Table 3). These results are comparable with the financial gains obtained by Argento et al. [6] in small-sized wheat farms under temperate conditions in Switzerland. On the other hand, gains are higher compared to the total 4-year economic benefit (168.0 EUR ha−1) coming from the saved funds for fertilizers (including P and K) due to an application of a variable fertilizer rate of in a larger field in northern Lithuania [73]. Other researchers in Italy found no significant differences of the barley GY between fixed- and variable rate technologies under controlled lysimeter experimental conditions, and the variable rate fertilization method has been proven to be an alternative to traditional fertilization management (considering environmental impact), leading to a saving of 266 EUR ha−1 [74].
The EU requires a 30.0% reduction in greenhouse gas emissions by 2030, and the implementation of sustainable agricultural practices can greatly contribute towards this goal. In this respect, the environmental benefits of VR-N application are significant, both in terms of reducing the CF and minimizing the risk of pollution caused by residual inorganic Ν that remains unused by the crop after harvest, as found in the present study. N-based fertilizers account for approximately 5.0% of global GHG emissions, indicating that increasing NUE is considered among the most effective strategies to reduce emissions [75]. Previous research has acknowledged the environmental advantages of implementing more precise N management strategies at the farm level, particularly in terms of reducing N leaching and nitrous oxide (N2O) emissions [76,77,78]. VR-N application represents a promising approach to managing spatial variability in soil nutrient availability and crop performance. By enabling more precise SSNM, this technology offers both economic and environmental advantages. As such, it holds potential for broader implementation. Conducting a regional-scale evaluation of VR-N could yield valuable insights into its environmental and economic impacts across broader agricultural landscapes. Such data would be instrumental for policymakers seeking to promote site- and time-specific N management approaches that align with crop requirements.
Results of this study also revealed that under less favorable conditions (i.e., high slopes, low availability of P, like field B), there is no financial gain from adopting VR-N. The simplified private economic benefits for farmers suggested herein explains that there is little economic motivation to use VR-N application, which may also explain the so far low adoption of these technologies in small scale agriculture in Greece. It turns that the realization of in-season based N recommendations will rely on whether or not farmers can obtain a return on their investment, government support by incentives, and the complexity of using such systems as a whole. However, as stated in the previous section, this is a simplified measure for financial gain (marginal return) because the cost of UAV data collection, investment costs for prescription map generation, and the cost of equipment modification and technology were not taken into account. For small-scale agriculture like in the present study, even a higher marginal return per ha might not be fully sufficient to sustain the required investments. Government authorities and stable agricultural policy for the dissemination of similar technologies could consider measures to support the transition to VR technology for farmers. Other options are to encourage cooperation between farmers and increase trust in cooperative schemes for the common use of equipment and services. A similar approach was followed by Argento et al. [6] for small-scale farming in Switzerland. The future plans of this study are to develop a friendly user application that will apply the algorithm to aerial images that users will be allowed to upload and to export prescription maps for VR-N automatically.

5. Conclusions

This study demonstrated that implementing SSNM using a well-established VR-N algorithm [33], combined with near-real-time UAV-derived data and VR-N fertilizer spreaders, effectively reduced N application rates and improved NUE (as expressed by NPE) compared to conventional UR-N fertilization. N inputs in VR-N zones were reduced by 18.4% to 46.6%, depending on field heterogeneity and crop management practices, without considerable yield loss. The findings highlight that site-specific conditions—such as soil properties, pedoclimatic factors, and general field management—play a crucial role in determining the effectiveness of VR-N technology. In the present study, the N application method did not significantly affect most yield components, harvest index (HI), or grain protein content (GPC) in either field, except for thousand-grain weight (TGW) in Field B. A key strength of the proposed VR-N strategy is its practical applicability. It does not require specialized or expensive equipment—only a commercially available fertilizer spreader with variable-rate capabilities, which already represents the majority of new equipment purchased by farmers. The algorithm capitalizes on the spatial variability of crop indices, which inherently reflect soil and climatic factors influencing final yield. A significant advantage of the approach is that the plant’s spectral behavior integrates these factors, offering a robust indicator of crop performance. In addition to agronomic benefits, VR-N implementation may significantly reduce the CF of wheat cultivation and lower the risk of groundwater contamination. Residual soil nitrate (NO3-N) was consistently lower in VR-N plots compared to uniform rate (UR-N) zones, underscoring the environmental value of the approach. While the results are promising, they are based on a single season and two field trials, and further multi-year, multi-location studies are necessary to validate the findings under varying pedoclimatic and seasonal conditions. Future directions include the development of a user-friendly digital tool that applies the algorithm to UAV imagery uploaded by farmers and automatically generates prescription maps for VR-N application. Moreover, correlations of various UAV image indices from diverse fertilization treatments with physiological parameters (leaf area, leaf area index, chlorophyll SPAD, fluorescence parameters, stomatal conductance, photosynthetic rate, etc.) would greatly assist to identify the most sensitive digital image indices corresponding to these indices to monitor the growth status of wheat.

Author Contributions

Conceptualization, A.T., C.N., E.E. and V.L.; methodology, C.N., E.E. and S.S.; investigation, A.T., C.N. and V.L.; data curation, A.T., C.N., E.E. and V.L.; writing—original draft preparation, C.N.; writing—review and editing, A.T., V.L., E.E., S.S., M.T. and R.Q.; supervision, C.N.; project administration, C.N.; funding acquisition, A.T. and C.N. All authors have read and agreed to the published version of the manuscript.

Funding

This research was co-financed by National (Greek) budgets and the EU [European Agricultural Fund for Rural Development (EAFRD)] under the Rural Development Program, “Wheat precision farming in Thessaly”, (Μ16ΣΥΝ2-00330), Sub-measure 16.1–16.5—Cooperation on environmental projects, environmental practices, and actions on climate change and current environmental practices of Measure 16 “Cooperation”.

Data Availability Statement

The raw data supporting the conclusions of this article will be made available by the authors on request.

Acknowledgments

We would like to cordially thank Emeritus James Schepers (J.S.) (University of Nebraska–Lincoln) for the constructive discussions on the Holland–Schepers algorithm. We would also like to thank the technical staff of the Institute of Industrial and Forage Crops, Hellenic Agricultural Organization—DIMITRA for carrying out field and lab tasks.

Conflicts of Interest

The authors declare no conflicts of interest.

Abbreviations

The following abbreviations are used in this manuscript:
UAVUnmanned aerial vehicle
VR-NVariable-rate nitrogen
UR-NUniform rate nitrogen
NDVINormalized difference vegetation index
SSNMSite-specific N management
NUEN use efficiency
NPEN production efficiency
WRBWorld reference base soil classification system
DSMDigital surface model
CFCarbon footprint
GPCGrain protein content
TBYTotal above-ground biomass
TGWThousand-grain weight
GYGrain yield
HIHarvest index
NGYN grain yield
AEAgronomic efficiency
PEPhysiological efficiency
RERecovery efficiency
PFPPartial factor productivity of applied N
VIVegetation index

References

  1. Martínez-Moreno, F.; Ammar, K.; Solís, I. Global Changes in Cultivated Area and Breeding Activities of Durum Wheat from 1800 to Date: A Historical Review. Agronomy 2022, 12, 1135. [Google Scholar] [CrossRef]
  2. Grosse-Heilmann, M.; Cristiano, E.; Deidda, R.; Viola, F. Durum wheat productivity today and tomorrow: A review of influencing factors and climate change effects. Resour. Environ. Sustain. 2024, 17, 100170. [Google Scholar] [CrossRef]
  3. Broccanello, C.; Bellin, D.; Dalcorso, G.; Furini, A.; Taranto, F. Genetic approaches to exploit landraces for improvement of triticum turgidum ssp. Durum in the age of climate change. Front. Plant Sci. 2023, 14, 1101271. [Google Scholar] [CrossRef] [PubMed]
  4. Xynias, I.N.; Mylonas, I.; Korpetis, E.G.; Ninou, E.; Tsaballa, A.; Avdikos, I.D.; Mavromatis, A.G. Durum Wheat Breeding in the Mediterranean Region: Current Status and Future Prospects. Agronomy 2020, 10, 432. [Google Scholar] [CrossRef]
  5. EUROSTAT 2020. Available online: https://ec.europa.eu/eurostat/data/database (accessed on 15 November 2024).
  6. Argento, F.; Anken, T.; Abt, F.; Vogelsanger, Ε.; Walter, A.; Liebisch, F. Site-specific nitrogen management in winter wheat supported by low-altitude remote sensing and soil data. Precis. Agric. 2021, 22, 364–386. [Google Scholar] [CrossRef]
  7. Gobbo, S.; Morari, F.; Ferrise, R.; De Antoni Migliorati, M.; Furlan, L.; Sartori, L. Evaluation of different crop model-based approaches for variable rate nitrogen fertilization in winter wheat. Precis. Agric. 2022, 23, 1922–1948. [Google Scholar] [CrossRef]
  8. Lassaletta, L.; Billen, G.; Grizzetti, B.; Anglade, J.; Garnier, J. 50-year trends in nitrogen use efficiency of world cropping systems: The relationship between yield and nitrogen input to cropland. Environ. Res. Lett. 2014, 9, 105011. [Google Scholar] [CrossRef]
  9. Penuelas, J.; Coello, F.; Sardans, J. A better use of fertilizers is needed for global food security and environmental sustainability. Agric. Food Secur. 2023, 12, 5. [Google Scholar] [CrossRef]
  10. Samborski, S.M.; Tremblay, N.; Fallon, E. Strategies to make use of plant sensors-based diagnostic information for nitrogen recommendations. Agron. J. 2009, 101, 800–816. [Google Scholar] [CrossRef]
  11. Walter, A.; Finger, R.; Huber, R.; Buchmann, N. Opinion: Smart farming is key to developing sustainable agriculture. Proc. Natl. Acad. Sci. USA 2017, 114, 6148–6150. [Google Scholar] [CrossRef] [PubMed]
  12. Spiertz, J.H.J. Nitrogen, sustainable agriculture and food security: A review. Agron. Sustain. Dev. 2010, 30, 43–55. [Google Scholar] [CrossRef]
  13. Raun, W.R.; Solie, J.B.; Johnson, G.V.; Stone, M.L.; Mullen, R.W.; Freeman, K.W.; Thomason, W.E.; Lukina, E.V. Improving nitrogen use efficiency in cereal grain production with optical sensing and variable rate application. Agron. J. 2002, 94, 815–820. [Google Scholar] [CrossRef]
  14. Basso, B.; Fiorentino, C.; Cammarano, D.; Schulthess, U. Variable rate nitrogen fertilizer response in wheat using remote sensing. Precis. Agric. 2016, 17, 168–182. [Google Scholar] [CrossRef]
  15. Sharma, L.K.; Bali, S.K. A Review of Methods to Improve Nitrogen Use Efficiency in Agriculture. Sustainability 2018, 10, 51. [Google Scholar] [CrossRef]
  16. Van Loon, J.; Speratti, A.B.; Gabarra, L.; Govaerts, B. Precision for Smallholder Farmers: A Small-Scale-Tailored Variable Rate Fertilizer Application Kit. Agriculture 2018, 8, 48. [Google Scholar] [CrossRef]
  17. Hansen, B.; Thorling, L.; Schullehner, J.; Termansen, M.; Dalgaard, T. Groundwater nitrate response to sustainable nitrogen management. Sci. Rep. 2017, 7, 8566. [Google Scholar] [CrossRef] [PubMed]
  18. Gastal, F.; Lemaire, G.; Durand, J.; Louarn, G. Quantifying crop responses to nitrogen and avenues to improve nitrogen-use efficiency. In Crop Physiology: Applications for Genetic Improvement and Agronomy; Sadras, V.O., Calderini, D.F., Eds.; Academic Press: San Diego, CA, USA, 2015; pp. 161–206. [Google Scholar] [CrossRef]
  19. Tilman, D.; Cassman, K.G.; Matson, P.A.; Naylor, R.; Polasky, S. Agriculture sustainability and intensive production practices. Nature 2002, 418, 671–677. [Google Scholar] [CrossRef] [PubMed]
  20. Ravier, C.; Jeuffroy, M.H.; Gate, P.; Cohan, J.P.; Meynard, J.M. Combining user involvement with innovative design to develop a radical new method for managing N fertilization. Nutr. Cycl. Agroecosyst. 2018, 110, 117–134. [Google Scholar] [CrossRef]
  21. Stamatiadis, S.; Schepers, J.S.; Evangelou, E.; Glampedakis, A.; Glampedakis, M.; Dercas, N.; Tsadilas, C.; Tserlikakis, N.; Tsadila, E. Variable-rate application of high spatial resolution can improve cotton N-use efficiency and profitability. Precis. Agric. 2019, 21, 695–712. [Google Scholar] [CrossRef]
  22. Evangelou, E.; Stamatiadis, S.; Schepers, J.; Glambedakis, A.; Glambedakis, M.; Derkas, N.; Tsadilas, C.; Nikoli, T. Evaluation of sensor-based field-scale spatial application of granular N to maize. Precis. Agric. 2020, 21, 1008–1026. [Google Scholar] [CrossRef]
  23. Hausherr Lüder, R.-M.; Qin, R.; Richner, W.; Stamp, P.; Streit, B.; Herrera, J.M.; Noulas, C. Small-Scale Variation in Nitrogen Use Efficiency Parameters in Winter Wheat as Affected by N Fertilization and Tillage Intensity. Sustainability 2020, 12, 3621. [Google Scholar] [CrossRef]
  24. Lowder, S.K.; Skoet, J.; Raney, T. The Number, Size, and Distribution of Farms, Smallholder Farms, and Family Farms Worldwide. World Dev. 2016, 87, 16–29. [Google Scholar] [CrossRef]
  25. Ricciardi, V.; Ramankutty, N.; Mehrabi, Z.; Jarvis, L.; Chookolingo, B. How much of the world’s food do smallholders produce? Glob. Food Secur. 2018, 17, 64–72. [Google Scholar] [CrossRef]
  26. EUROSTAT 2018. Εurostat News Release 105/2018 28.06.2018. Available online: https://ec.europa.eu/eurostat/documents/2995521/9028470/5-28062018-AP-EN.pdf/8d97f49b-81c0-4f87-bdde-03fe8c3b8ec2 (accessed on 29 November 2024).
  27. Montgomery, K.; Henry, J.B.; Vann, M.C.; Whipker, B.E.; Huseth, A.S.; Mitasova, H. Measures of Canopy Structure from Low-Cost UAS for Monitoring Crop Nutrient Status. Drones 2020, 4, 36. [Google Scholar] [CrossRef]
  28. Argento, F.; Merz, Q.; Perich, G.; Anken, T.; Walter, A.; Liebisch, F. A comparison of proximal and remote optical sensor platforms for N status estimation in winter wheat. Comput. Electron. Agric. 2025, 232, 110110. [Google Scholar] [CrossRef]
  29. Hunt, E.R., Jr.; Daughtry, C.S. What good are unmanned aircraft systems for agricultural remote sensing and precision agriculture? Int. J. Remote Sens. 2017, 39, 5345–5376. [Google Scholar] [CrossRef]
  30. Bergera, K.; Machwitzc, M.; Kyckod, M.; Kefauvere, S.C.; Van Wittenberghea, S.; Damm, A.; Rascher, U.; Herrmann, I.; Sobejano Paz, V.; Fahrner, S.; et al. Multi-sensor spectral synergies for crop stress detection and monitoring in the optical domain: A review. Remote Sens. Environ. 2022, 280, 113198. [Google Scholar] [CrossRef] [PubMed]
  31. Zhang, J.; Wang, W.; Krienke, B.; Cao, Q.; Zhu, Y.; Cao, W.; Liu, X. In-season variable rate nitrogen recommendation for wheat precision production supported by fixed-wing UAV imagery. Precis. Agric. 2022, 23, 830–853. [Google Scholar] [CrossRef]
  32. Franzen, D.; Kitchen, N.; Holland, K.; Schepers, J.; Raun, W. Algorithms for In-Season Nutrient Management in Cereals. Agron. J. 2016, 108, 1775–1781. [Google Scholar] [CrossRef]
  33. Holland, K.H.; Schepers, J.S. Derivation of a Variable Rate Nitrogen Application Model for In-Season Fertilization of Corn. Agron. J. 2010, 102, 1415–1424. [Google Scholar] [CrossRef]
  34. Stamatiadis, S.; Tsadilas, C.; Samaras, V.; Eskridge, K.; Schepers, J.S. Nitrogen uptake and N-use efficiency of Mediterranean cotton under varied deficit irrigation and N fertilization. Eur. J. Agron. 2016, 73, 144–151. [Google Scholar] [CrossRef]
  35. Stamatiadis, S.; Schepers, J.S.; Evangelou, E.; Tsadilas, C.; Glampedakis, A.; Glampedakis, M.; Derkas, N.; Spyropoulos, N.; Dalezios, N.R.; Eskridge, K. Variable-rate nitrogen fertilization of winter wheat under high spatial resolution. Precis. Agric. 2018, 19, 570–587. [Google Scholar] [CrossRef]
  36. Beck, H.E.; Zimmermann, N.E.; McVicar, T.R.; Vergopolan, N.; Berg, A.; Wood, E.F. Present and future Köppen-Geiger climate classification maps at 1-km resolution. Sci. Data 2018, 5, 180214. [Google Scholar] [CrossRef]
  37. WRB (World Reference Base for Soil Resources). World Reference Base for Soil Resources 2014, Update 2015 International Soil Classification System for Naming Soils and Creating Legends for Soil Maps; World Soil Resources Reports No. 106; International Union of Soil Sciences; FAO: Rome, Italy, 2015. [Google Scholar]
  38. Gee, G.W.; Bauder, J.W. Particle-size analysis. In Methods of Soil Analysis: Part 1–Physical and Mineralogical Methods; Soil Society of America: Madison, WI, USA, 1986; pp. 383–411. [Google Scholar]
  39. McLean, E.O. Soil pH and lime requirement. In Methods of Soil Analysis: Part 2—Chemical and Microbiological Properties; American Society Agronomy: Madison, WI, USA, 1982; pp. 199–224. [Google Scholar]
  40. Allison, L.E.; Moodie, C.D. Carbonates. In Methods of Soil Analysis: Part 2—Chemical and Microbiological Properties; American Society Agronomy: Madison, WI, USA, 1965; pp. 1389–1396. [Google Scholar]
  41. Olsen, S.R.; Dean, L.A. Phosphorus. In Methods of Soil Chemical Analysis: Part 2—Chemical and Microbiological Properties; American Society Agronomy: Madison, WI, USA, 1965; pp. 1035–1049. [Google Scholar]
  42. Bower, C.A.; Wilcox, L.V. Soluble salts. In Methods of Soil Chemical Analysis: Part 2—Chemical and Microbiological Properties; American Society Agronomy: Madison, WI, USA, 1965; pp. 933–951. [Google Scholar]
  43. Nelson, D.W.; Sommers, L.E. Total carbon, organic carbon and organic matter. In Methods of Soil Analysis: Part 2—Chemical and Microbiological Properties; American Society Agronomy: Madison, WI, USA, 1982; pp. 539–579. [Google Scholar]
  44. Thomas, G. 1982: Exchangeable cations. In Methods of Soil Analysis: Part 2—Chemical and Microbiological Properties; American Society Agronomy: Madison, WI, USA, 1982; pp. 159–164. [Google Scholar]
  45. Lindsay, W.L.; Norvell, W.A. Development of a DTPA soil test for zinc, iron, manganese and copper. Soil Sci. Soc. Am. J. 1978, 42, 421–428. [Google Scholar] [CrossRef]
  46. Wear, J.I. Boron. In Methods of Soil Chemical Analysis, Part 2, Agronomy 9; Black, C.A., Ed.; ASA, Inc.: Madison, WI, USA, 1965; pp. 1059–1063. [Google Scholar]
  47. Meier, U.; Bleiholder, H.; Buhr, L.; Feller, C.; Hack, H.; Heß, M.; Lancashire, P.D.; Schnock, U.; Stauß, R.; Van Den Boom, T.; et al. The BBCH system to coding the phenological growth stages of plants–history and publications. J. Für Kult. 2009, 61, 41–52. [Google Scholar] [CrossRef]
  48. Nelson, D.W.; Sommers, L.E. Determination of Total Nitrogen in Plant Material1. Agron. J. 1973, 65, 109–112. [Google Scholar] [CrossRef]
  49. Keeney, D.R.; Nelson, D.W. Nitrogen-Inorganic Forms. In Methods of Soil Analysis, Part 2, 2nd ed.; Agronomy 9; ASA and SSSA: Madison, WI, USA, 1982; p. 643. [Google Scholar]
  50. Holland, K.H.; Schepers, J.S. Active-crop sensor calibration using the virtual reference concept. In Precision Agriculture’ 11, Proceedings of the 8th European Conference on Precision Agriculture, Prague, Czech Republic, 11–14 July 2011; Stafford, J.V., Ed.; Czech Centre for Science and Society: Prague, Czech Republic, 2011; pp. 469–479. [Google Scholar]
  51. Shu, X.; Wang, Y.; Wang, Y.; Ma, Y.; Men, M.; Zheng, Y.; Xue, C.; Peg, Z.; Noulas, C. Response of soil N2O emission and nitrogen utilization to organic matter in the wheat and maize rotation system. Sci. Rep. 2021, 11, 4396. [Google Scholar] [CrossRef] [PubMed]
  52. Hillier, J.; Walter, C.; Malin, D.; Garcia-Suarez, T.; Mila-i-Canals, L.; Smith, P. A farm-focused calculator for emissions from crop and livestock production. Environ. Model. Softw. 2011, 26, 1070–1078. [Google Scholar] [CrossRef]
  53. Wang, X.; Miao, Y.; Dong, R.; Guan, Y.; Mulla, D.J. Evaluating the potential benefits of field specific nitrogen management of spring maize in Northeast China. In Precision Agriculture’ 19, Proceedings of the 12th European Conference on Precision Agriculture, Montpellier, France, 8–11 July 2019; Wageningen Academic Publishers: Wageningen, The Netherlands, 2019; pp. 877–882. [Google Scholar]
  54. Stahle, L.; Wold, S. Analysis of variance (ANOVA). Chemom. Intell. Lab. Syst. 1989, 6, 259–272. [Google Scholar] [CrossRef]
  55. Candiago, S.; Remondino, F.; De Giglio, M.; Dubbini, M.; Gattelli, M. Evaluating multispectral images and vegetation indices for precision farming applications from UAV images. Remote Sens. 2015, 7, 4026–4047. [Google Scholar] [CrossRef]
  56. Gonzalez, F.; Mcfadyen, A.; Puig, E. Advances in unmanned aerial systems and payload technologies for precision agriculture. In Advances in Agricultural Machinery and Technologies; Chen, G., Ed.; CRC Press: Boca Raton, FL, USA, 2018; pp. 133–155. [Google Scholar] [CrossRef]
  57. Maes, W.H.; Steppe, K. Perspectives for remote sensing with unmanned aerial vehicles in precision agriculture. Trends Plant Sci. 2018, 24, 152–164. [Google Scholar] [CrossRef] [PubMed]
  58. Reger, M.; Bauerdick, J.; Bernhardt, H. Drones in agriculture: Current and future legal status in Germany, the EU, the USA and Japan. Landtechnik 2018, 73, 62–79. [Google Scholar] [CrossRef]
  59. Holland, K.H.; Schepers, J.S. Use of a virtual-reference concept to interpret active crop canopy sensor data. Precis. Agric. 2013, 14, 71–85. [Google Scholar] [CrossRef]
  60. Zhang, L.; Huang, Y.; Rong, L.; Duan, X.; Zhang, R.; Li, Y. Effect of soil erosion depth on crop yield based on topsoil removal method: A meta-analysis. Agron. Sustain. Dev. 2021, 41, 63. [Google Scholar] [CrossRef]
  61. Bolan, N.; Srivastava, P.; Rao, C.S.; Satyanaraya, P.V.; Anderson, G.C.; Bolan, S.; Nortjé, G.P.; Kronenberg, R.; Bardhan, S.; Abbott, L.K.; et al. Distribution, characteristics and management of calcareous soils. In Advances in Agron; Sparks, D.L., Ed.; Academic Press: Cambridge, MA, USA, 2023; Volume 182, pp. 81–130. ISBN 9780443192685. [Google Scholar] [CrossRef]
  62. Delgado, J.A.; Khosla, R.; Bausch, W.C.; Westfall, D.G.; Inman, D.J. Nitrogen fertilizer management based on site-specific management zones reduces potential for nitrate leaching. J. Soil Water Conserv. 2005, 60, 402–410. [Google Scholar] [CrossRef]
  63. Zhao, C.; Jiang, A.; Huang, W.; Liu, K.; Liu, L.; Wang, J. Evaluation of variable-rate nitrogen recommendation of winter wheat based on SPAD chlorophyll meter measurement. N. Z. J. Agric. Res. 2007, 50, 735–741. [Google Scholar] [CrossRef]
  64. Bohman, B.J.; Rosen, C.J.; Mulla, D.J. Impact of variable rate nitrogen and reduced irrigation management on nitrate leaching for potato. J. Environ. Qual. 2020, 49, 281–291. [Google Scholar] [CrossRef] [PubMed]
  65. Abalos, D.; Jeffery, S.; Sanz-Cobena, A.; Guardia, G.; Vallejo, A. Meta-analysis of the effect of urease and nitrification inhibitors on crop productivity and nitrogen use efficiency. Agric. Ecosyst. Environ. 2014, 189, 136–144. [Google Scholar] [CrossRef]
  66. Moll, R.H.; Kamprath, E.J.; Jackson, W.A. Analysis and interpretation of factors which contribute to efficiency of nitrogen utilization. Agron. J. 1982, 74, 562–564. [Google Scholar] [CrossRef]
  67. Good, A.G.; Shrawat, A.K.; Muench, D.G. Can less yield more? Is reducing nutrient input into the environment compatible with maintaining crop production? Trends Plant Sci. 2004, 9, 597–605. [Google Scholar] [CrossRef] [PubMed]
  68. Hawkesford, J.M. Genetic variation in traits for nitrogen use efficiency in wheat. J. Exp. Bot. 2017, 10, 2627–2632. [Google Scholar] [CrossRef] [PubMed]
  69. Crop Science Society of America. Glossary of Crop Science Terms; Crop Science Society of America: Madison, WI, USA, 1992. [Google Scholar]
  70. Huggins, D.R.; Pan, W.L. Nitrogen efficiency component analysis: An evaluation of cropping system differences in productivity. Agron. J. 1993, 85, 898–905. [Google Scholar] [CrossRef]
  71. Dobermann, A. Nutrient use efficiency–measurement and management. In Fertilizer Best Management Practices General Principles, Strategy for Their Adoption and Voluntary Initiatives vs. Regulations; International Fertilizer Industry Association: Paris, France, 2007; pp. 1–28. [Google Scholar]
  72. Wan, L.; Cen, H.; Zhu, J.; Zhang, J.; Zhu, Y.; Sun, D.; Du, X.; Zhai, L.; Weng, H.; Li, Y.; et al. Grain yield prediction of rice using multi-temporal UAV-based RGB and multispectral images and model transfer—A case study of small farmlands in the south of China. Agric. For. Meteorol. 2020, 10, 8096. [Google Scholar] [CrossRef]
  73. Kazlauskas, M.; Bručiene, I.; Jasinskas, A.; Šarauskis, E. Comparative Analysis of Energy and GHG Emissions Using Fixed and Variable Fertilization Rates. Agronomy 2021, 11, 138. [Google Scholar] [CrossRef]
  74. Fabbri, C.; Napoli, M.; Verdi, L.; Mancini, M.; Orlandini, S.; Dalla Marta, A. A Sustainability Assessment of the Greenseeker N Management Tool: A Lysimetric Experiment on Barley. Sustainability 2020, 12, 7303. [Google Scholar] [CrossRef]
  75. Gao, Y.; Cabrera Serrenho, A. Greenhouse gas emissions from nitrogen fertilizers could be reduced by up to one-fifth of current levels by 2050 with combined interventions. Nat. Food 2023, 4, 170–178. [Google Scholar] [CrossRef] [PubMed]
  76. Roberts, K.G.; Gloy, B.A.; Joseph, S.; Scott, N.R.; Lehmnann, J. Life Cycle Assessment of Biochar Systems: Estimating the Energetic, Economic, and Climate Change Potential. Environ. Sci. Technol. 2010, 44, 827–833. [Google Scholar] [CrossRef] [PubMed]
  77. Basso, B.; Dumont, B.; Cammarano, D.; Pezzuolo, A.; Marinello, F.; Sartori, L. Environmental and economic benefits of variable rate nitrogen fertilization in a nitrate vulnerable zone. Sci. Total Environ. 2016, 536, 730–740. [Google Scholar] [CrossRef] [PubMed]
  78. Sela, S.; Woodbury, P.B.; Marjerison, R.; Van Es, H.M. Towards applying N balance as a sustainability indicator for the US Corn Belt: Realistic achievable targets, spatio-temporal variability and policy implications. Environ. Res. Lett. 2019, 14, 064015. [Google Scholar] [CrossRef]
Figure 1. Location, size, dimension, and representation of elevation data (Digital Surface Model-DSM) of the experimental fields (field A, Agrokipio and field B, Ano Vasilika) in Larissa Prefecture (central Greece) with delineated zones of uniform (UR-N) and variable-rate in-season N application (VR-N).
Agronomy 15 01714 g001
Figure 2. NDVI (Normalized difference vegetation index) map and corresponding N fertilization map (grid 9 m × 9 m) of the two fields in Larissa Prefecture (central Greece).
Agronomy 15 01714 g002
Figure 3. NDVI maps showing wheat plant health, 2 days before in-season N fertilizer application (BBCH 25, GDD = 852.4) (a) and 22 days after in-season N fertilizer application BBCH 45–51 (late boot beginning of heading), GDD = 1104.5 (b) in field B.
Agronomy 15 01714 g003
Figure 4. Drone DJI Phantom 4 Multispectral RTK (a); Smart touch terminal showing prescription map (b); Fertilizer application machinery operating in the field (c); Tractor smart touch terminal showing 1-Current application rate from the fertilizer settings or the task controller; 2-Indication of tractor speed (d).
Agronomy 15 01714 g004
Figure 5. Carbon footprint (CF) expressed as kg CO2 ha−1 (a) and as kg CO2 per ton of yield (kg CO2 tn−1) (b) and residual nitrate N after harvest (NO3-N, kg ha−1) (c) for the two fields in Larissa, Thessaly (Central Greece) during the 2022–2023 growing season. VR-N, variable-rate nitrogen; UR-N, uniform rate N fertilizer. Within each field, means with different lower-case letters are significantly different at p < 0.05 according to the t-test. Means with no letters are not significantly different. Vertical lines represent standard error of the mean.
Agronomy 15 01714 g005
Table 1. Soil classification and soil physicochemical properties (0–30 cm) prior to preplant fertilizer application of the two experimental fields.
Soil Parameters and ClassificationField A
(Agrokipio)
Field B
(Ano Vasilika)
Soil order 1CambisolsCalcisols
Sand (%)36.6 ± 1.5928.5 ± 1.20
Silt (%)36.4 ± 1.0248.6 ± 1.73
Clay (%)27.0 ± 1.1322.9 ± 1.30
Soil TextureClay Loam (CL)Clay (C)
pH, (1:1)8.0 ± 0.058.2 ± 0.02
EC 20.62 ± 0.030.45 ± 0.02
SOM 3 (%)1.4 ± 0.111.5 ± 0.11
CaCO3%11.8 ± 2.1827.1 ± 1.83
POlsen mg kg−19.9 ± 1.834.1 ± 0.42
TSN 4 (%)0.10 ± 0.010.11 ± 0.01
K+ cmol kg−10.4 ± 0.030.6 ± 0.06
Mg+2 cmol kg−15.7 ± 0.186.2 ± 0.20
Cu 50.9 ± 0.050.9 ± 0.03
Fe 54.1 ± 0.313.6 ± 0.13
Mn 58.8 ± 0.883.0 ± 0.11
Zn 50.7 ± 0.040.6 ± 0.08
B mg kg−10.4 ± 0.040.4 ± 0.03
1 (WRB) [37], 2 EC = Electrical Conductivity (mS cm−1) (25 °C), 3 SOM = Soil Organic Matter, 4 Total Soil N, 5 DTPA extractable trace elements mg kg−1. For average values reported: n = 16 in field A and n = 20 in field B (± standard error of the mean).
Table 2. N fertilizer applied, yield, yield components, and N-related parameters for the two fields in Larissa Thessaly (Central Greece).
FieldN TreatmentNappΤΒYGYΤGWGrains m2HIGPCNGY
AVR-N17015.45.4956.311,51134.611.910.1
UR-N34316.16.3551.713,36139.313.813.9
BVR-N28013.95.42 b43.6 b13,51838.912.410.8
UR-N34315.56.56 a49.5 a14,54845.011.612.2
VR-N, variable-rate nitrogen; UR-N, uniform rate N fertilizer; Napp, avg level of NH4NO3 applied (kg ha−1); TBY, total biomass yield (t ha−1); GY, grain yield (t ha−1); TGW, thousand-grain weight (g); HI, harvest index = the ratio of grain to total shoot dry matter (%); GPC, grain protein content (%); NGY, N gain yield (gm−2); Means with different lower-case letters are significantly different at p < 0.05 according to the t-test. Means with no letters are not significantly different.
Table 3. NUE as N production efficiency (NPE) and marginal return of VR-N for the two fields in Larissa Thessaly (Central Greece) for the 2022–2023 growing season.
FieldN TreatmentNappNPEMRPYPNΔGVR-NΔMR
AVR-N17032.3 a2436.7 *0.400.7757.2163.8
UR-N34318.5 b2272.9
BVR-N28019.31825.8 b0.370.848No gainNo gain
UR-N34319.12136.7 a
VR-N, variable-rate nitrogen; UR-N, uniform rate N fertilizer; Napp, avg level of NH4NO3 applied (kg ha−1); NPE, N production efficiency (kg kg−1); MR, marginal return (financial gain) of N fertilization (EUR ha−1); PY, is the local grain price (EUR kg−1) in 2023; PN is the local N fertilizer price (EUR kg−1) in 2023; ΔGVR-N is the improved gain of VR-N of N fertilization (%); ΔMR is the difference in the marginal return of VR-N vs. UR-N, (EUR ha−1). Means with different lower-case letters are significantly different at p < 0.05 according to the t-test. Means with no letters are not significantly different. * Ιn field A, th average of MR for VR-N treatment was based on two out of three zones.
Disclaimer/Publisher’s Note: The statements, opinions and data contained in all publications are solely those of the individual author(s) and contributor(s) and not of MDPI and/or the editor(s). MDPI and/or the editor(s) disclaim responsibility for any injury to people or property resulting from any ideas, methods, instructions or products referred to in the content.

