Article

Study of Detection of Typical Pesticides in Paddy Water Based on Dielectric Properties

Key Laboratory of Modern Agricultural Equipment in Jiangxi Province, Jiangxi Agricultural University, Nanchang 330045, China
*
Authors to whom correspondence should be addressed.
Agronomy 2025, 15(7), 1666; https://doi.org/10.3390/agronomy15071666
Submission received: 30 April 2025 / Revised: 30 June 2025 / Accepted: 5 July 2025 / Published: 9 July 2025
(This article belongs to the Section Pest and Disease Management)

Abstract

Due to the dramatic increase in pesticide usage and improper application, large amounts of unused pesticides enter the environment through paddy water, causing severe pesticide pollution. To find a rapid method for identifying pesticide types and predicting their concentrations, the dielectric properties frequency response of pesticides was analyzed in paddy water. A rapid detection method for typical pesticides such as chlorpyrifos, isoprothiolane, imidacloprid and carbendazim was studied based on their dielectric properties. In this paper, amplitude and phase frequency response data for blank paddy water samples and 15 types of paddy water samples containing pesticides were collected at 10 different temperatures. Principal component analysis (PCA) and competitive adaptive reweighted sampling (CARS) were used to extract characteristic frequencies. A species identification model based on support vector machine (SVM) for rapid detection of pesticides in paddy water was established using amplitude and phase frequency response data separately. Frequency response data of 431 sets from nine types of paddy water samples were divided into training and prediction sets in a 3:1 ratio, and a content prediction model based on artificial neural networks (ANN) with multiple inputs and single output was established using amplitude and phase frequency response data after CARS feature extraction. The experimental results show that both PCA-SVM and CARS-SVM species identification models established using amplitude and phase frequency response data have excellent identification effects, reaching over 90%. The PCA-SVM model based on phase frequency response data has the best identification effect for typical pesticides in paddy water with a prediction recognition accuracy range of 97.5–100%. The ANN content prediction model established using phase frequency response data performs well, and the highest R2 prediction values of chlorpyrifos, isoprothiolane, imidacloprid and carbendazim in paddy water were 0.8249, 0.8639, 0.9113 and 0.8368 respectively. The research established a dielectric property detection method for the identification and content prediction of typical pesticides in paddy water, providing a theoretical basis for the hardware design of capacitive sensors based on dielectric property and the detection of pesticide residues in paddy water. This provides a new method and approach for pesticide residue detection, which is of great significance for scientific pesticide application and sustainable agricultural development.

1. Introduction

In agricultural production, pesticides play a positive role in preventing and controlling crop diseases, pests and grasses, and ensuring crop growth and yield increase, which cannot be ignored [1]. Although pesticides have contributed greatly to the development of agriculture, they can also have negative impacts, such as pesticide pollution. Pesticide residue contamination has been detected in various environmental media such as soil and groundwater [2]. Many key rivers and lakes streams in China such as the Yangtze River, the Yellow River, the Pearl River, the Liaohe River and other surface waters have been detected to varying degrees of pesticide residues, and groundwater sources in some areas have also been contaminated by pesticides to a certain extent [3,4]. The risk of pesticide residues in water bodies cannot be ignored [5,6]. Therefore, it is of practical significance to carry out pesticide detection in paddy water.
The methods currently used to determine pesticide residues include chromatography, biosensor methods, and spectral analysis [7]. Maciej optimized the extraction and cleaning parameters; the QuEChERS method was improved to reduce the use of solvents, and the detection limit range of pesticides was 5.6 µg·kg−1 to 15 µg·kg−1. The recovery rates of standardized pear samples at the quantification limit for each pesticide residue range from 90% to 107% [8]. The extraction of some pesticides from vegetable samples was analyzed by gas chromatography (GC), flame ionization detector (FID) and mass spectrometry. The influence of several parameters was investigated, such as the amount of vitamin B2, type of eluent, pH of the sample solution and the salt concentration [9]. Yu J et al. constructed a novel non-enzymatic biosensor using a bioluminescence resonance energy transfer strategy to realize the detection of methyl parathion and verified its accuracy [10]. Elmastas et al. studied and analyzed 222 pesticide active substances in 90 samples from 7 different vegetables and fruits obtained from producers by Liquid Chromatograph Mass Spectrometer (LC-MS)/Mass Spectrometer (MS) and GC-MS/MS techniques. The limit of detection (LOD), limit of quantitation (LOQ) values and recovery rates of 222 active substances were 3.00, 10.00 ng/g, 76.07–108.08% [11]. Although these methods can accurately identify pesticide species and predict pesticide concentrations in water, they require laborious sample preparation and chemical formulation, which are complex and costly. It is difficult to popularize these detection methods and realize rapid online detection. Therefore, it is of great economic and social value to explore new ideas and new methods for the detection of pesticide content in paddy water.
In exploring new methods for pesticide detection in water bodies, Dielectric Spectroscopy has attracted extensive attention from researchers and scholars at home and abroad. Dielectric Spectroscopy is a method to detect the properties and components of an object by detecting its dielectric properties [12]. It has been researched and applied to different degrees in the fields of material science, biomedicine, and so on [13]. Based on the electrical characteristics of agricultural materials, Guo Wenchuan [14] designed an instrument for detecting the protein content of fresh milk with simple operation, low cost and convenience for on-site detection. The machine has a sweep range of 1–100 MHz, thus allowing fast and effective detection of protein content in raw cow’s milk. Han [15] explored the relationship between water content and dielectric properties of rice husk in an isotopic fermentation bed and showed that it is feasible to use dielectric properties to detect the water content of rice husk. In order to realize rapid and accurate identification of a large number of elemental water-soluble fertilizers, Wu [16] designed a sensor according to the dielectric characteristics of water-soluble fertilizers. The identification accuracy rate was 98.3%, and the average identification time was 14.3 s, showing good rapidity and accuracy. Based on the dielectric characteristics of grains, Zhang Yue [17] designed a concentric circle planar capacitance moisture online measuring instrument and applied it to a corn grain harvester. The support vector machine was used to establish a regression prediction model for corn moisture content. The average relative error was 1.09% and the measurement time was less than 2.3 s.
The detection of pesticide residues in water has attracted considerable interest from many researchers. Samarghandi et al. [18] used Gas Chromatography-Mass methods to analyze pesticide residues in different water resources. Weng et al. [19] developed a rapid detection method for fonofos, phosmet and sulfoxaflor in paddy water through chemometric methods and SERS. Abedeen et al. [20] discussed the detection mechanisms of electrochemical sensors and their applications in quantifying pesticide residues in fruits, vegetables and water. Issaka et al. [21] mentioned that fluorometric (FL), colourimetric (CL) and enzyme-inhibition (EI) techniques have been used for detection of pesticide residues in environment water and emphasized the importance of developing more convenient and efficient methods for detecting pesticide residues. These methods are not suitable for online monitoring. Few studies have been reported on dielectric spectroscopy for the identification of pesticide species and prediction of pesticide levels in paddy water.
Based on this, to explore rapid detection methods for pesticides in paddy water, this paper used dielectric property detection technology to identify typical pesticides and predict their content in paddy water. By analyzing and comparing the difference between amplitude and phase frequency response characteristics between paddy water and paddy water samples containing different pesticides, combining PCA and CARS to extract characteristic frequencies, SVM was used to establish the identification model of typical pesticide species in paddy water. A content prediction model based on ANN with multiple inputs and single output was established using amplitude and phase frequency response data after CARS feature extraction.

2. Materials and Methods

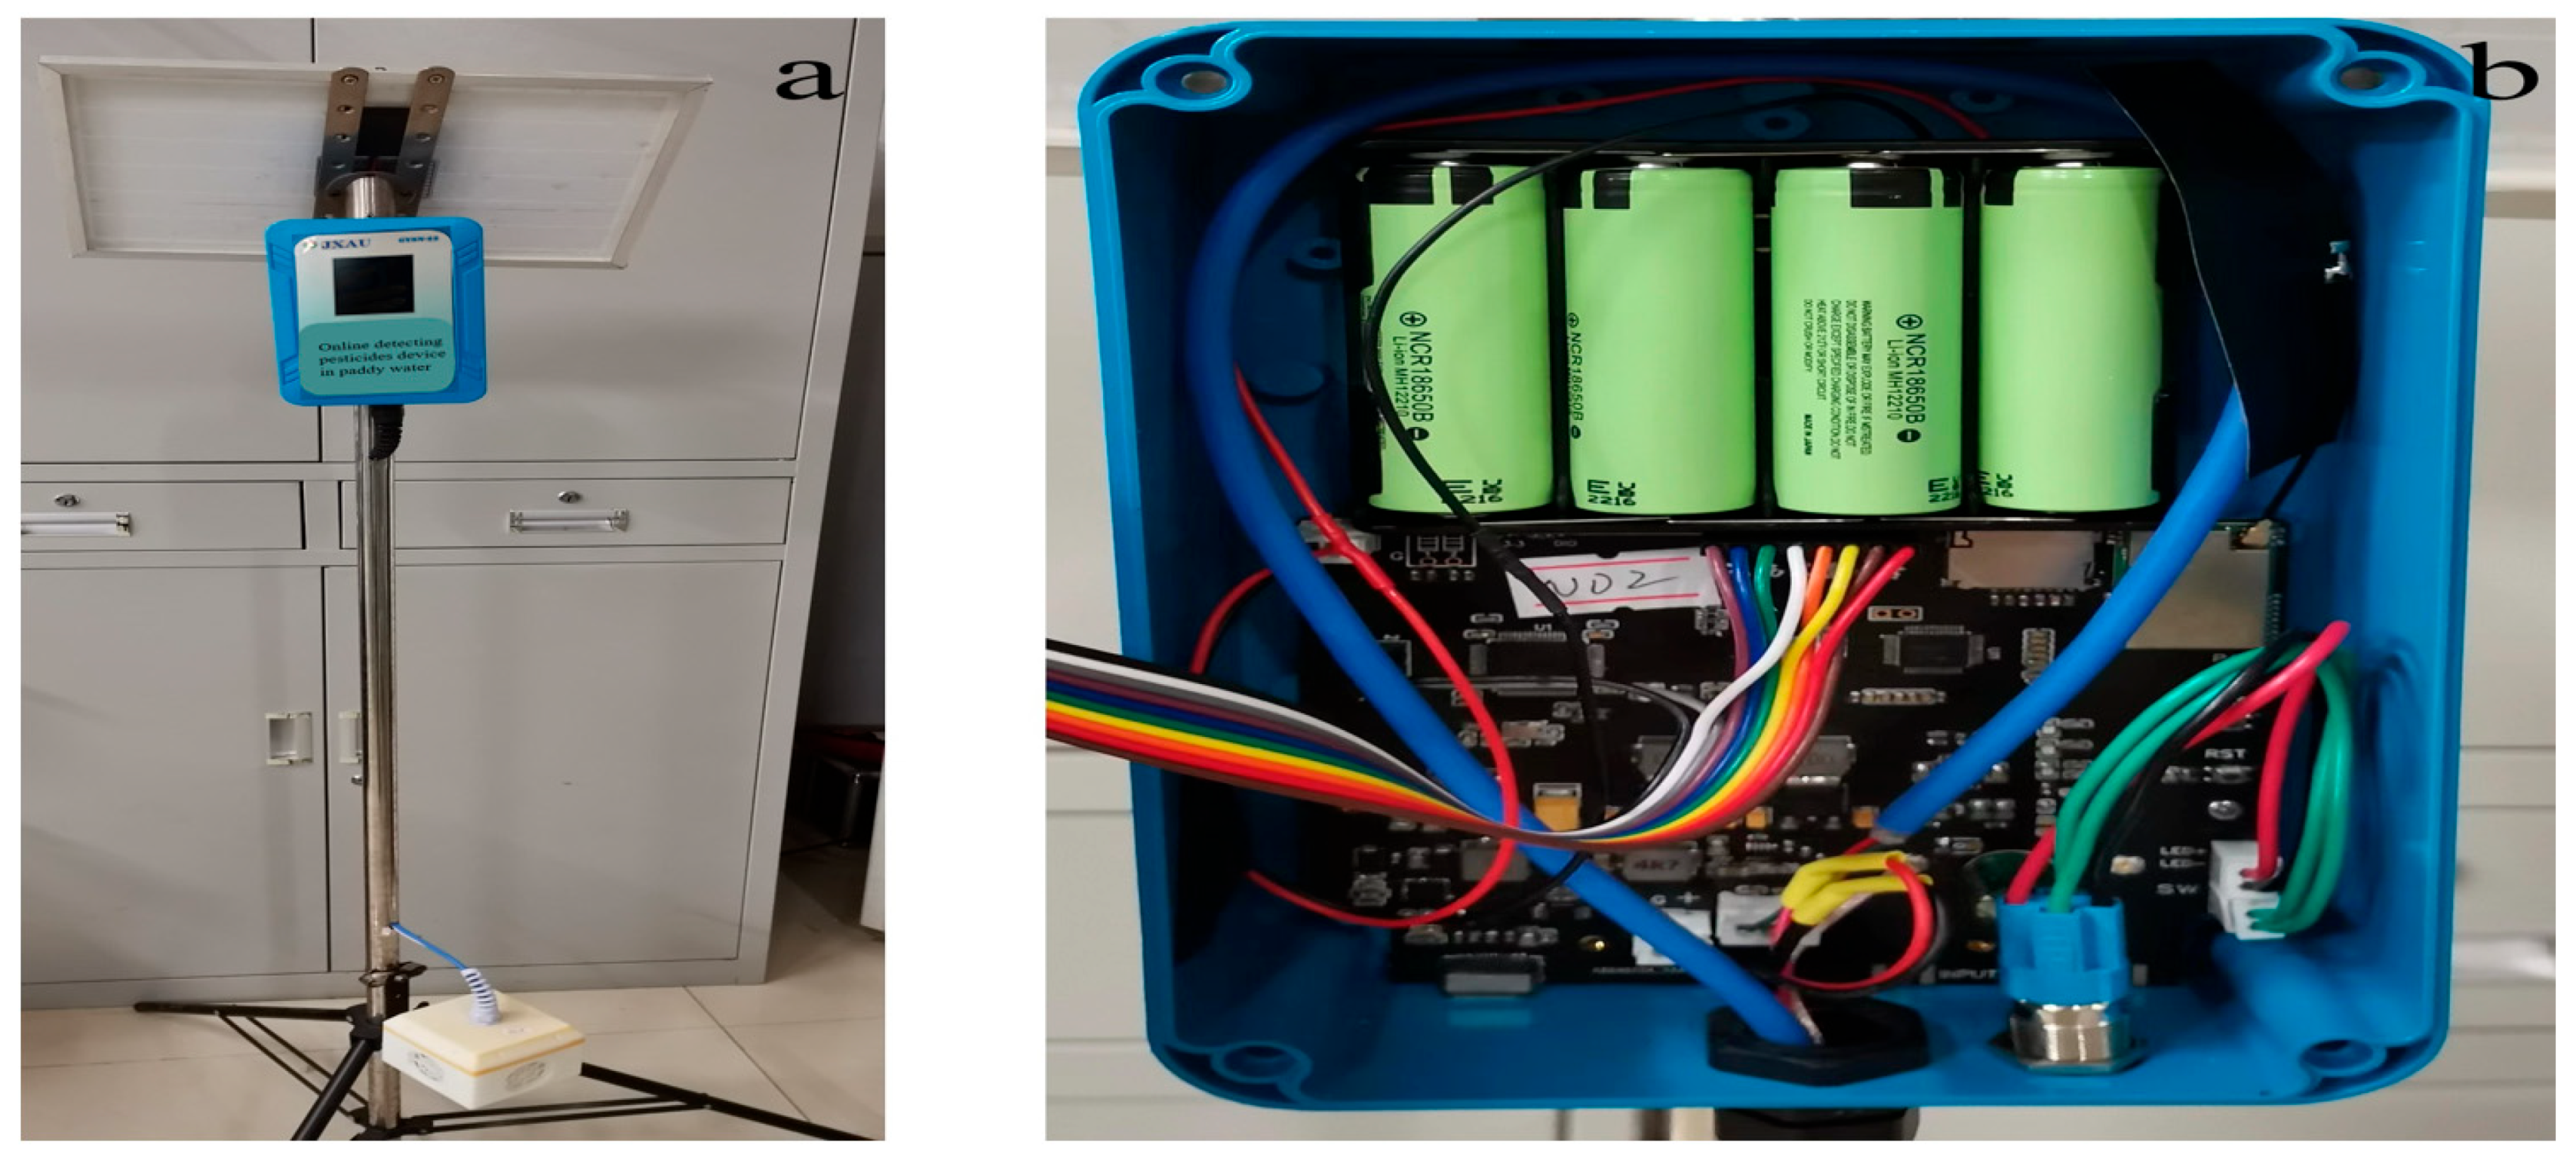
2.1. Test Apparatus and Reagents

Laboratory homemade paddy water pesticide dielectric properties detection sensor, low-temperature thermostatic water bath (Jiangsu Tianling Instrument Co., Ltd., DC-0506, China), ultrapure water machine (TeLedyne Water Quality, Inc., USA), Kylin-Bell vortex mixer (Kylin-Bell Instrument Manufacturing Co., Ltd., VORTEX-5, China), ultrasonic cleaner (Hefei Kinnick Machinery Manufacturing Co. JK-50B, China), electronic balance (Beijing Kewei Yongxing Instrument Co., Ltd., FA1004B, China), lithium battery rechargeable pump (Shanghai Xiannan Industry Co., Ltd., China).
Chlorpyrifos (Tongda Chemical Plant, Jining City, Shandong Province, 48% cream type, China); Isoprothiolane (Jiangsu Longdeng Chemical Co., Ltd., 40% wettable powder formulation, China); Imidacloprid (Bayer Cropscience (China) Co., Ltd., 70% water dispersion granule form, China); Carbendazim (Sichuan Runer Technology Co., Ltd., 50% wettable powder dosage form, China).

2.2. Sensors for Detecting the Dielectric Properties of Pesticides in Paddy Water Bodies

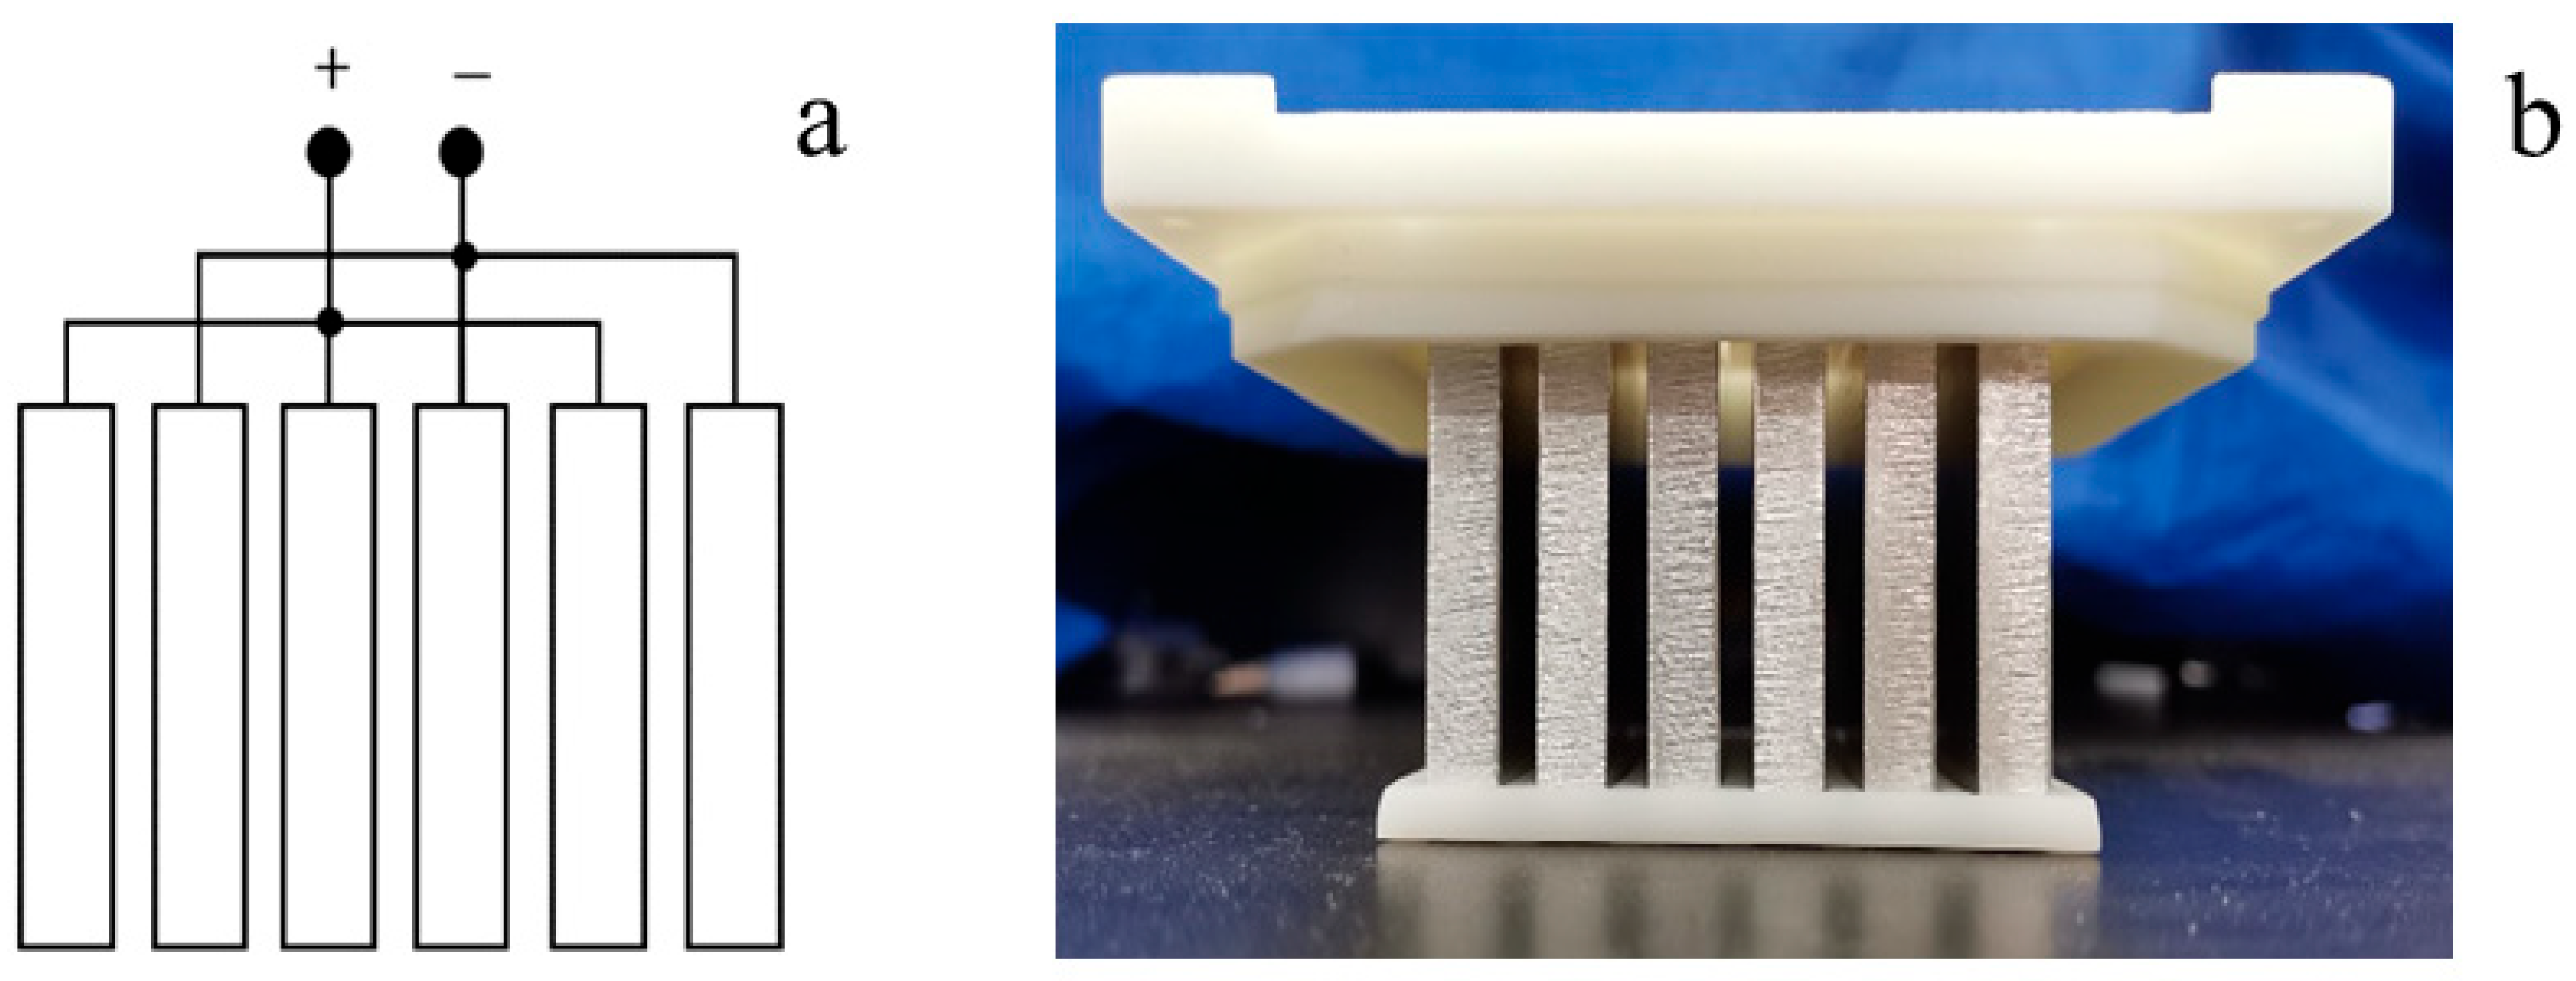
2.2.1. Theoretical Analysis of Dielectric Property Detection

Under the action of an electric field, the positive and negative carriers or dipoles inside the dielectric material are polarized and rearranged. If the applied electric field is constantly changing, the polarization inside the medium is also constantly changing. When the electric field changes very rapidly, polarization will lag behind, which is called relaxation [22]. It is the dielectric loss that causes energy loss in a varying electric field. Since the phase lag is a function of the frequency of the applied electric field, the dielectric constant and dielectric loss also change with frequency [23]. Both the real and imaginary parts of the relative permittivity can be expressed as a function of frequency. There is a relationship between the relative dielectric constant and the dielectric constant as follows:
ε r = ε ε 0
ε r ( ω ) = ε r ( ω ) j ε r ( ω )
ε —dielectric constant; ε 0 —dielectric constant in vacuum (8.85 × 10⁻¹² F/m); ε r —relative dielectric constant (complex dielectric constant); ε r —real part of relative dielectric constant (real dielectric constant); ε r —imaginary part of relative dielectric constant (imaginary dielectric constant).
When the type or content of pesticides contained in the paddy water is changed, it leads to a change in the dielectric properties of the paddy water. This leads to a change in the dielectric constant of the pesticides in the paddy water. The dielectric constant of pesticides in paddy water can reflect the change in pesticide type or content in paddy water. It is feasible to use dielectric spectroscopy to detect changes in pesticide species or content in paddy water.

2.2.2. Sensor for Detecting the Dielectric Properties of Pesticides in Paddy Water

As shown in Figure 1 is the physical diagram of the homemade sensor for detecting the dielectric properties of pesticides in paddy water. The sensor is mainly composed of a measurement probe, the main control box, solar panels and other components. The measurement probe is a six-electrode parallel plate dielectric detection probe. The circuit board of the main control box adopts a modular design, including the dielectric property measurement module, power supply module, screen display module, and so on.
The main measurement circuit of the main control box consists of the following three parts: (1) The microcontroller uses a 32-bit STM32F405RG microcontroller (STMicroelectronics, CH) with ARM Cortex-M4 core as the core controller. (2) The sweep excitation signal generation module consists of a Direct digital frequency synthesis (DDS) chip (ADI’s AD9859 model, USA) and a low-pass filter. (3) The signal detection and processing module mainly consists of three parts: the sensor measurement probe, the detection circuit, and the amplitude ratio and phase difference detection circuit. In order to enhance the capacitance measurement effect, the sensor detection probe adopts six aluminum alloy pole plates of the same size arranged equidistant from each other, and the positive and negative poles are arranged between each other. The schematic diagram shown in Figure 2a is equivalent to five bipolar capacitors in parallel, which increases the electrode area and provides a more compact structure. The detection probe is shown in Figure 2b.
The capacitance between the parallel pole plates is given by the following equation:
C = ε 0 ε S d
ε 0 —dielectric constant in vacuum (8.85 × 10⁻¹² F/m); ε —dielectric constant of the measurement medium; S—area of the metal pole plate (m2); d—distance between the pole plates (m).
The sensor probe is connected to the detection circuit via coaxial cable type RG178. A 50 Ω system is used for the signaling section. The input signal amplitude ratio and phase difference detection circuit is centered on ADI’s amplitude gain and phase measurement chip AD8302. Two analog signals from 0 to 3.3 V are output through the two output ports, and then the two signals are input into the ADC pins of the STM32 master control and converted into amplitude and phase according to the following two equations. The specific conversion formula is shown below:
A M P = A D C 1   r e a d i n g 2 12 × 3300 30 + 30 ( d B )
P H S = A D C 2   r e a d i n g 2 12 × 3300 10 180 ( ° )
AMP—amplitude; PHS—phase.

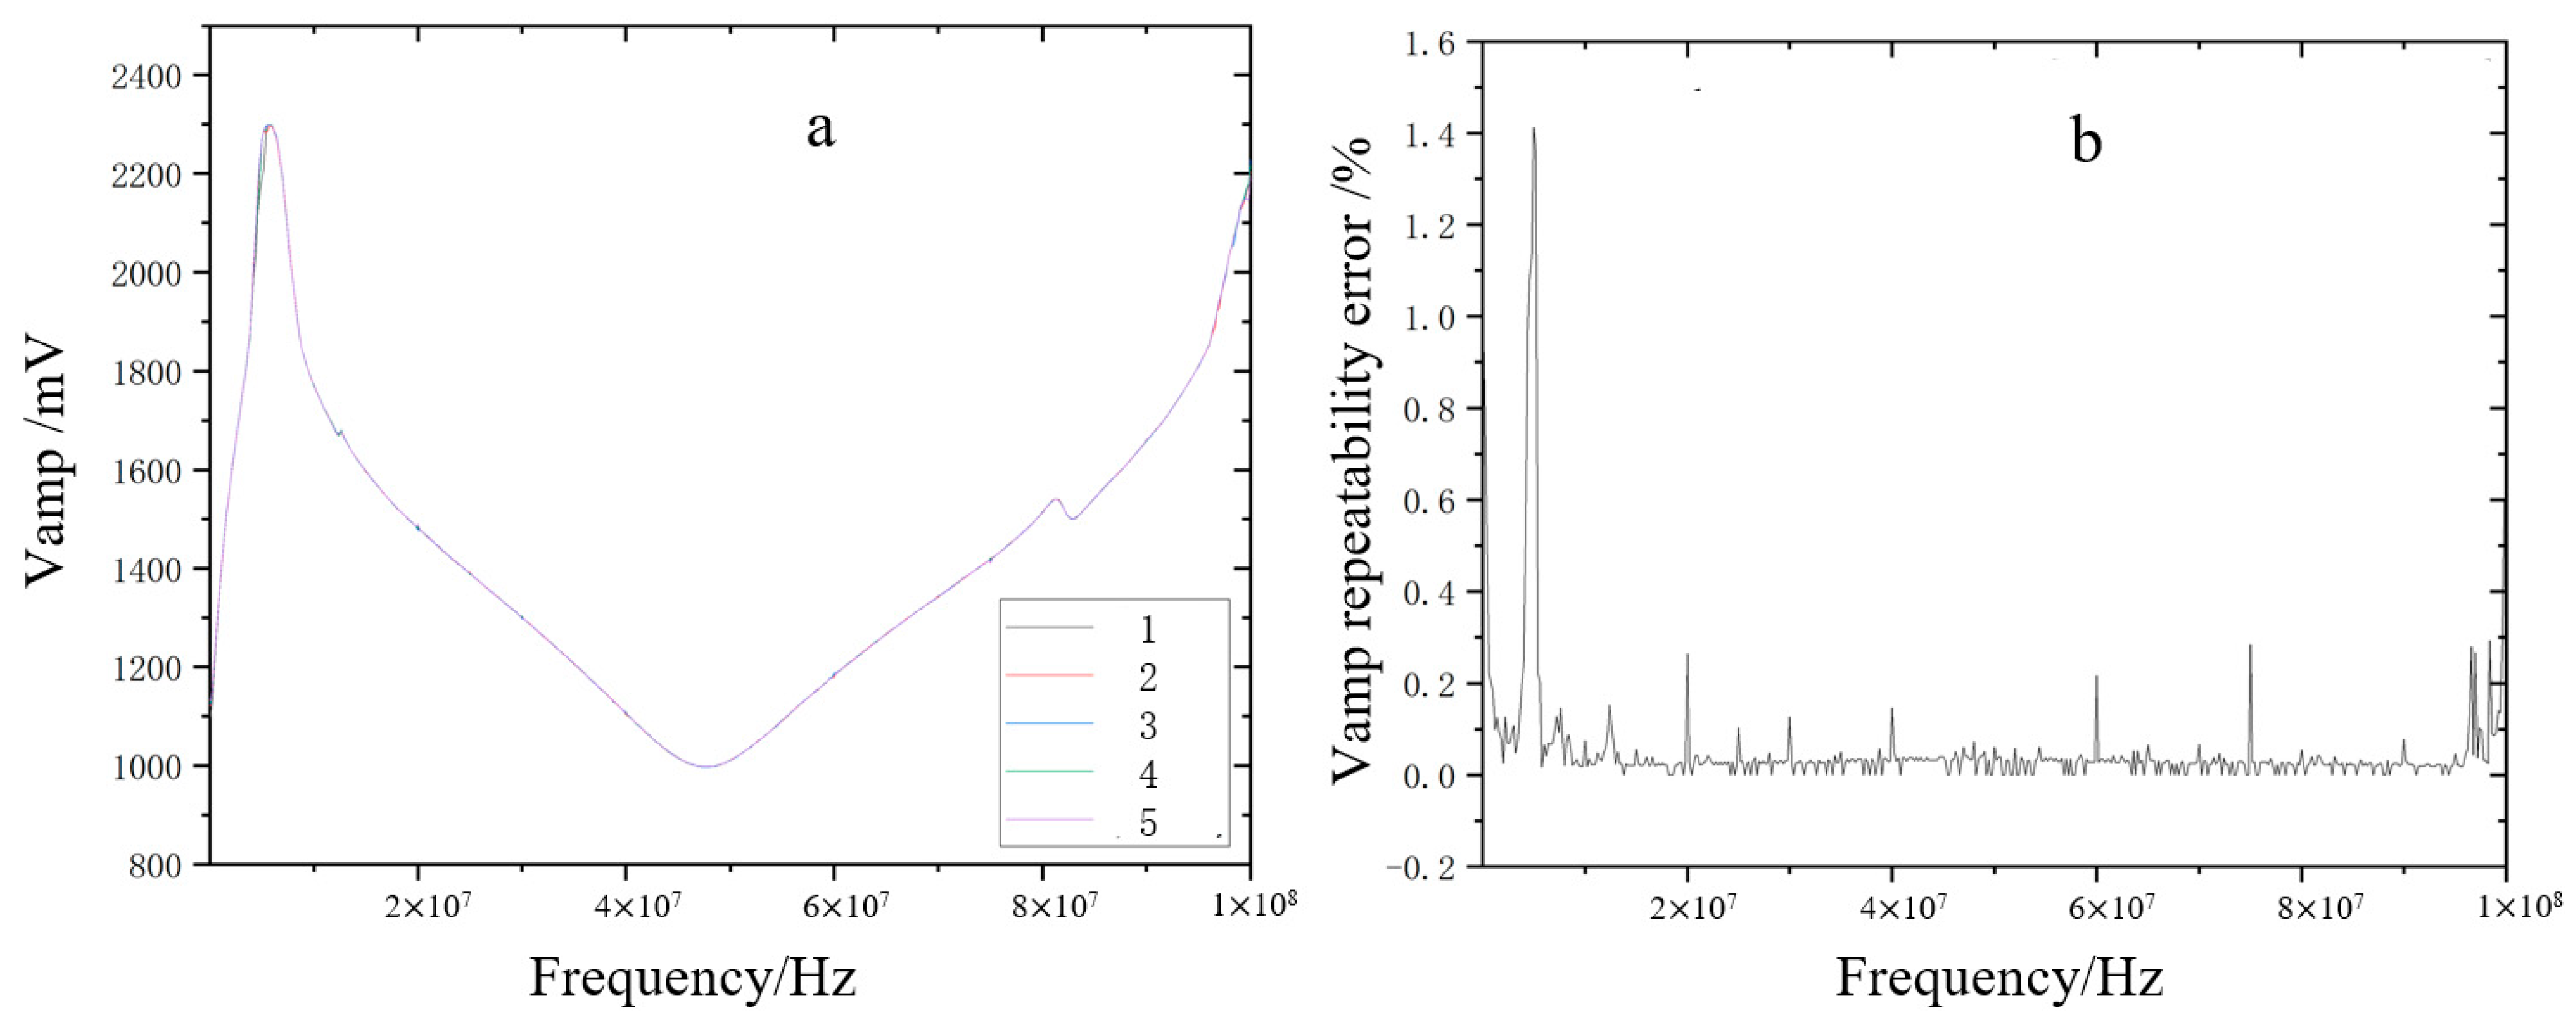
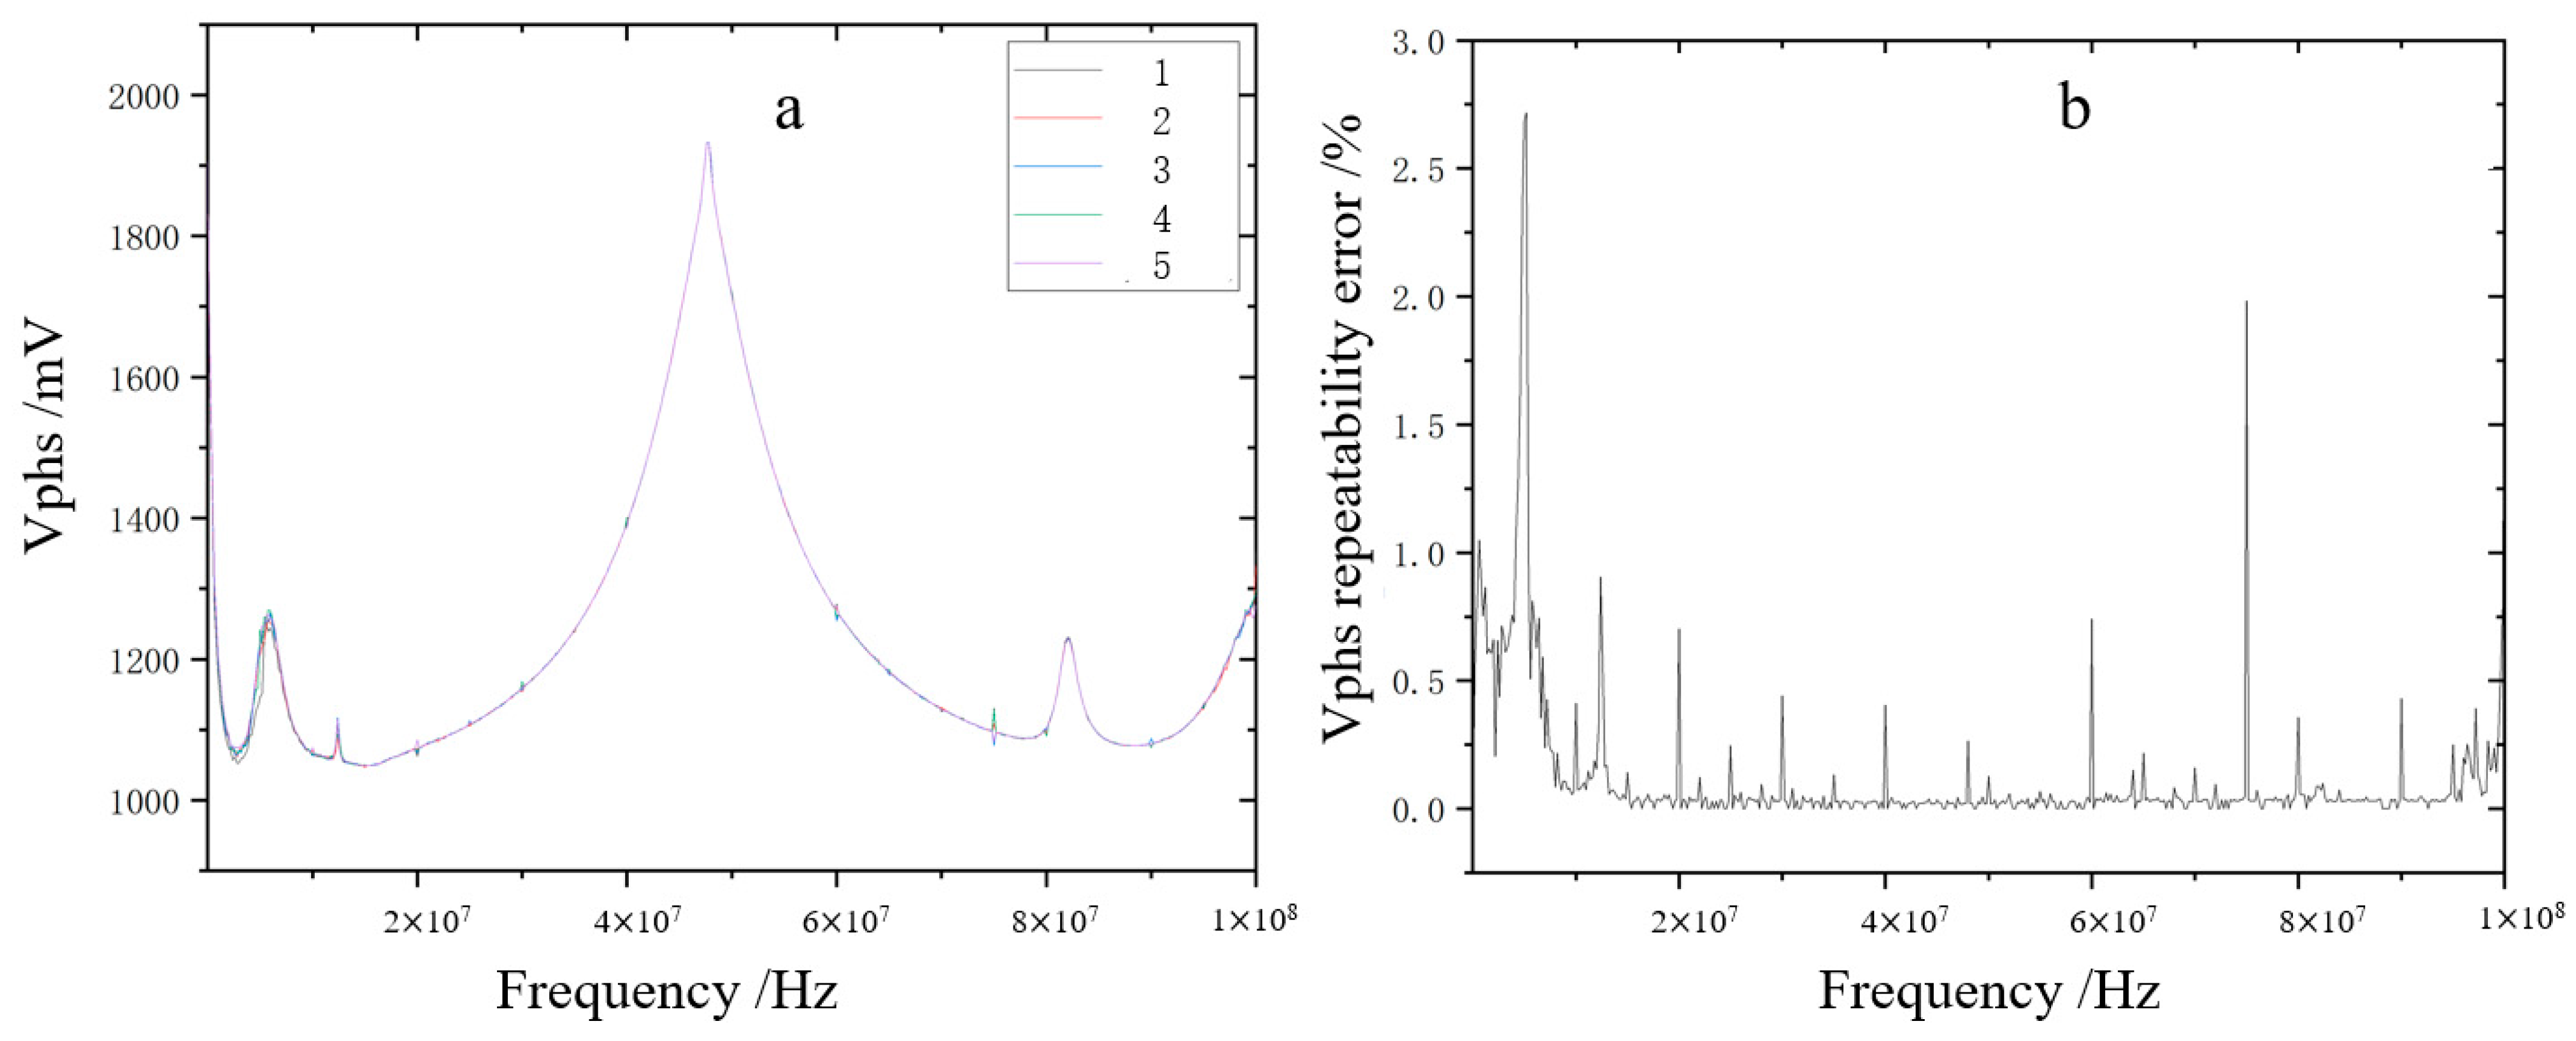
2.2.3. Repeatability Errors

Repeatability is an important indicator of how well the internal mechanism of the sensor is working. Repeatability error δ is the difference between the outputs measured in several consecutive trials under the same environmental conditions. It is a good reflection of the degree of fluctuation of the measured sample data. The formula for calculating the repeatability error δ is as follows:
σ = Σ ( x i x ¯ ) 2 n 1
δ = σ x ¯
σ —standard deviation; x i —single test result; x ¯ arithmetic mean of multiple tests; n—number of tests; δ—repeatability error.

2.3. Test Sample Preparation and Test Sample Profile

2.3.1. Preparation of Pesticide Stock Solutions in Paddy Water

The paddy water was collected from the experimental field of Jiangxi Agricultural University on 27 July 2023, when the maximum temperature was 35 °C and the minimum temperature was 26 °C. A liquid pump was used to extract farm irrigation water from the late rice field area for paddy water sample collection. The effective mass of the pesticide-provided solution was calculated according to the following formula:
a c t u a l   e f f e c t i v e   m a s s m g : M = m × P
M—actual effective mass (mg); m—weighed mass (mg); P—pesticide purity (0–100%). The relationship between the actual effective concentration (C) and the labeled active ingredient content (C1), the volume of the original drug (V), and the equipped volume (V1) of the emulsifiable pesticide can be obtained using the formula:
actual   effective   concentration ( m g / L ) : C = C 1 × V V 1
In the single pesticide test, the concentration of chlorpyrifos stock solution was determined to be 960 mg/L, the concentration of isoprothiolane stock solution was determined to be 1000 mg/L, the concentration of imidacloprid stock solution was determined to be 2000 mg/L and the concentration of carbendazim stock solution was determined to be 1000 mg/L. In the mixed pesticide test, the concentration of chlorpyrifos stock solution was determined to be 2400 mg/L, the concentration of isoprothiolane stock solution was determined to be 2500 mg/L, the concentration of imidacloprid stock solution was determined to be 5000 mg/L and the concentration of carbendazim stock solution was determined to be 2500 mg/L.

2.3.2. Preparation of Pesticide Test Samples in Paddy Water

Temperature is one of the important factors affecting the dielectric properties of the medium. The higher the dielectric constant, the stronger the polarization of the substance under an electric field, and thus its shielding effect on the electric field is also stronger. When the temperature of water increases, the speed of water molecule movement increases, weakening the intermolecular forces, which shortens the average interaction time between molecules and consequently affects the dielectric properties of water. Generally, the dielectric constant of water decreases with rising temperature [24,25]. According to the characteristics of rice seedling germination, early growth and tasseling period, 10 temperatures (5 °C, 10 °C, 15 °C, 20 °C, 25 °C, 27 °C, 29 °C, 31 °C, 33 °C, 35 °C) were set to carry out the detection of typical pesticides in paddy water. Twenty blank paddy water samples were set at the same temperature for detection, totaling 200 blank paddy water samples.
To investigate changes in frequency response characteristics containing one type of pesticide in paddy water, the single pesticide test was conducted for four pesticide samples of different concentrations with 1000 samples for each pesticide, totaling 4000 samples as shown in Table 1.
Mixed pesticide test was performed with random combinations of four pesticides. There were 4900 samples. The mixed pesticide test samples include combinations of two, three and four pesticides as shown in Table 2.
Sixteen types of samples (including blank, 4 types with single pesticides added and 11 types with mixed pesticides added) were used for species identification of typical pesticides in paddy water; there are 20 frequency response data for each type of paddy water sample at each temperature as shown in Table 3. A content prediction model for the typical pesticide was established using a multi-input single-output modeling approach with 9 types of paddy water samples at 10 temperatures. A total of 4310 frequency response data were used to establish a content prediction model for the typical pesticides in paddy water as shown in Table 4.

2.4. Frequency Response Data Acquisition

The container containing the paddy water sample to be tested was placed in a water bath so that the detection probe of the homemade sensor was completely submerged in the sample solution and then four pesticide dielectric property detection sensors for paddy water bodies were used. The acquisition frequency range was 200 Hz to 100 MHz, and the parameters were set as follows: probe transmission line length 100 cm, sampling interval 100 ms, 507 swept sampling points. In the 200 Hz to 1 KHz band, 5 frequency points were taken at equal intervals; in the 2 KHz to 1 MHz band, 7 frequency points were taken on a logarithmic scale with a base of 10; and in the 1 MHz to 100 MHz band, 495 frequency points were taken at a step frequency of 0.2 MHz, for a total of 507 frequency points. Frequency response data in both amplitude and phase are available for each sample.

2.5. Data Handling

Software such as MatlabR2021a, Python 3.12 and The Unscrambler X10.4 (64-bit) were used to analyze the data. The mapping software used was OriginPro2021 and MatlabR2021a. The PCA and CARS feature extraction algorithms were used to eliminate extraneous information contained in the frequency response data [26,27]. The identification model of typical pesticides in paddy water was established using support vector machine modeling method. CARS feature extraction algorithm was used to extract the frequency response data of water samples containing pesticides after classification [28,29]. A total of 431 sets of frequency response data from nine types of paddy water samples were divided into training and prediction sets in a 3:1 ratio. The content prediction model is constructed based on artificial neural network, and the constructed content prediction model is generated as an h5 format file under the Keras framework, which is then ported and written into the STM32 detection system, and the interpolation method algorithm is used to predict values at different temperatures based on the set 10 temperatures. At the same time, the model is compressed and deployed so that the algorithm can be called directly to realize the prediction function of the model. The recognition accuracy rate is used to evaluate the performance of the recognition model. The performance of the content prediction model was evaluated comprehensively using the coefficient of determination and the root mean square error (RMSEP) of prediction.

3. Results and Discussion

3.1. Repeatability Error Analysis

At room temperature, the ultra-pure water was tested five times in succession, and the amplitude output voltage signal Vamp and phase output voltage signal Vphs were collected in the 200 Hz to 100 MHz frequency band. As seen in Figure 3a, the trend of the change curves of the Vamp data for the five measurements is almost the same. The repeatability error versus frequency curve is shown in Figure 3b, which has a maximum repeatability error of 1.412% at 5 MHz and an average repeatability error of 0.069% for 5 measurements. As seen in Figure 4a, the trend of the change curves of the Vphs data for the five measurements is almost the same. The repeatability error versus frequency curve is shown in Figure 4b; there is a maximum repeatability error of 2.718% at 5.2 MHz, and the average repeatability error of 5 measurements is 0.120%. These results indicate that the test sensors used have very high repeatability and reliability.

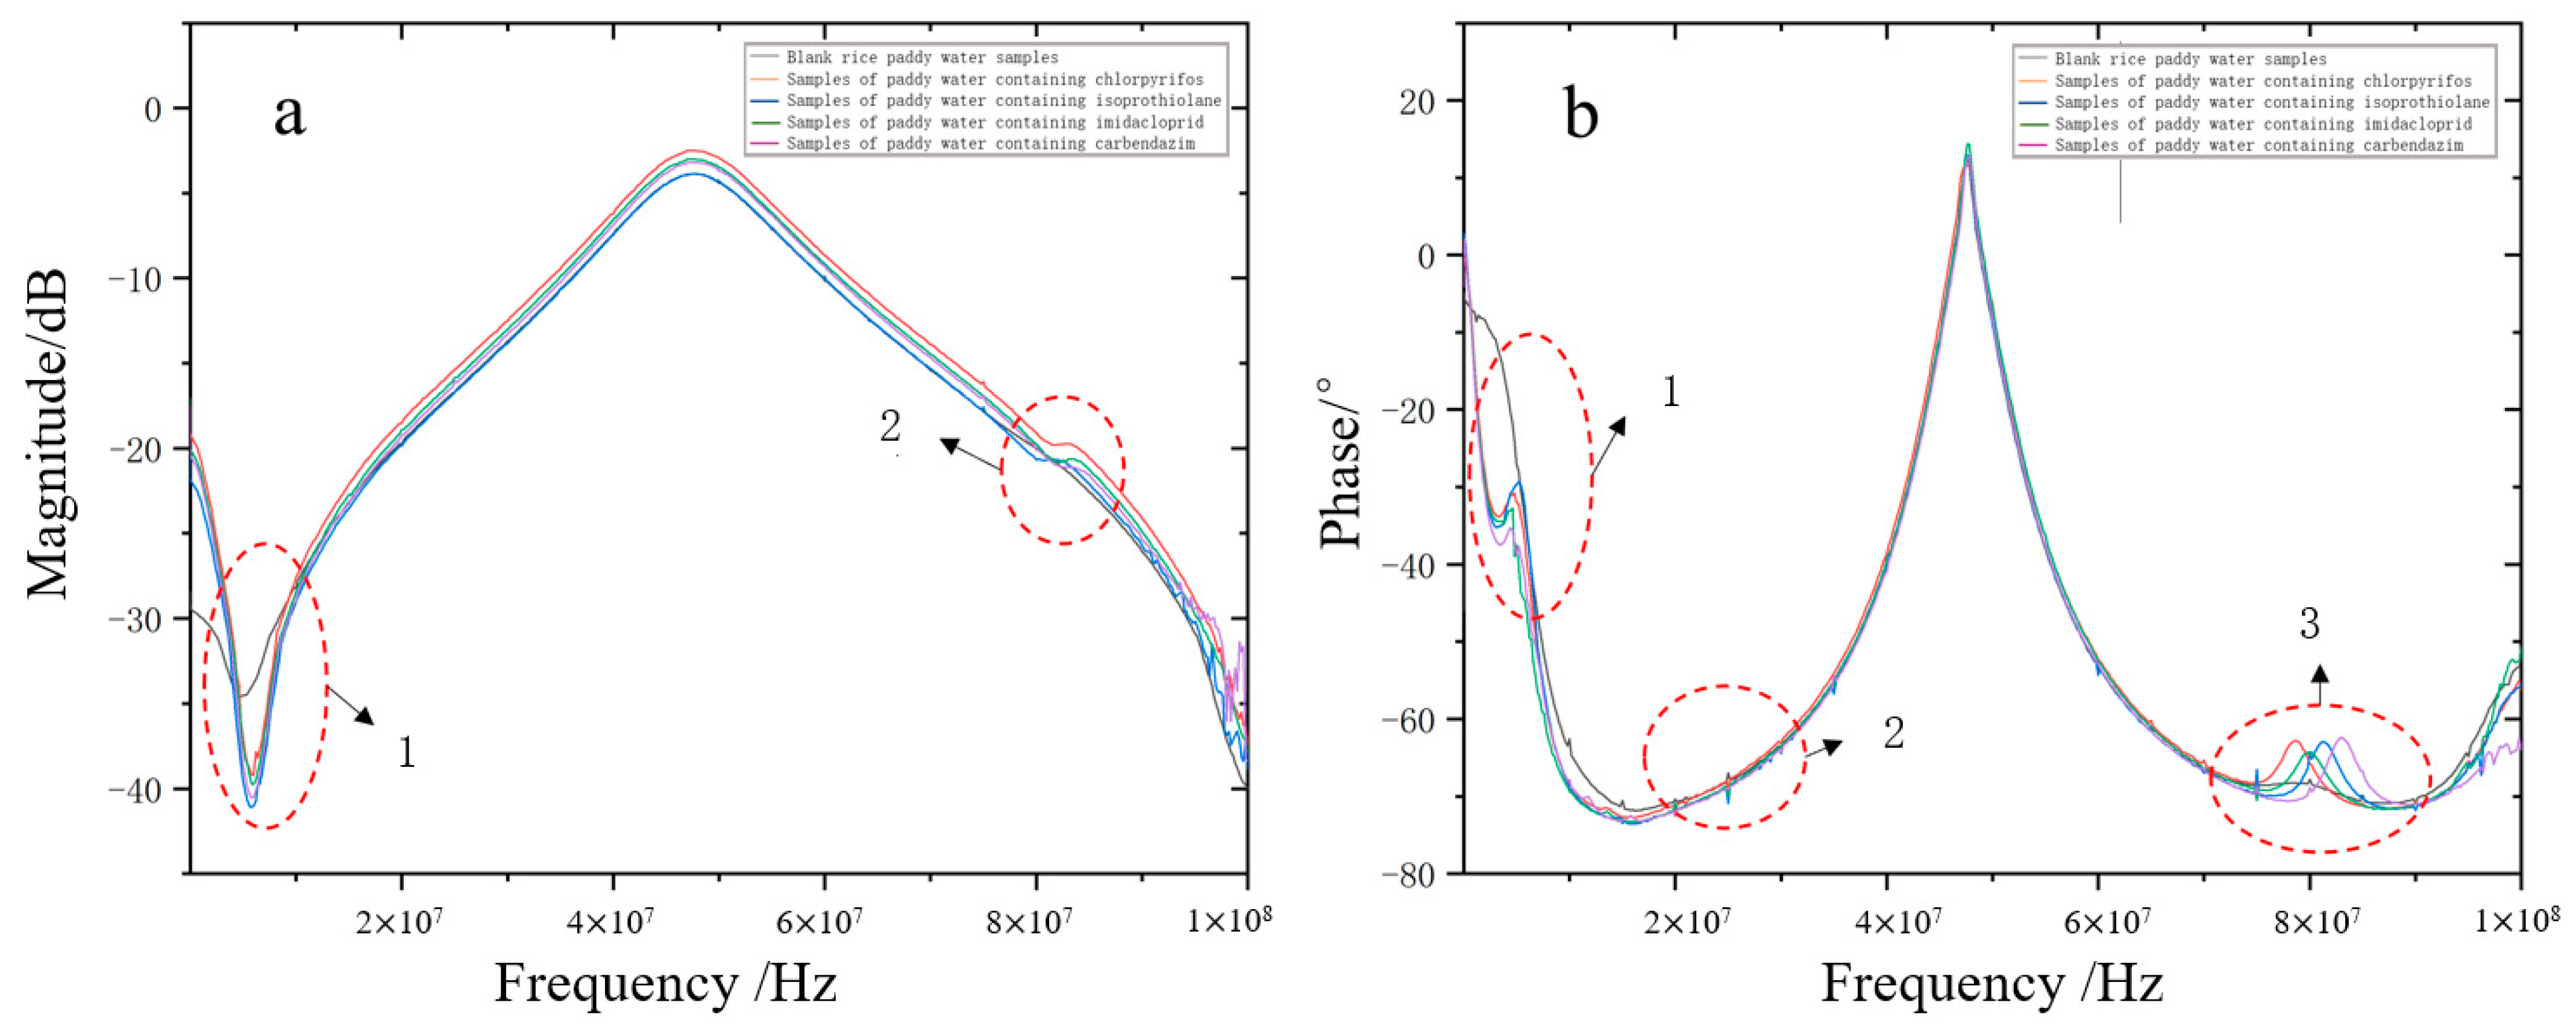
3.2. Frequency Response Analysis of Dielectric Properties of Pesticides in Paddy Water Bodies

The frequency response curves of blank paddy water samples as well as four paddy water samples containing a single pesticide at 25 °C are shown in Figure 5. In Figure 5a, it can be seen that as the frequency increases the trend of the amplitude of the blank paddy water samples and the pesticide-added paddy water samples is to first decline to the lowest peak and then rise to the highest peak and then begin to decay. The first difference is that when the water sample reaches the lowest peak value of 34.6 dB, the frequency is 4.8 MHz. The lowest peak value of the water samples added with different pesticides was 40.1 dB and the frequency was 5.8 MHz. The second difference is that at the beginning of the attenuation, except for the blank paddy water samples, samples with different pesticides added have different attenuation slowing down stages at 78 MHz to 86 MHz, which can be clearly seen in the five groups of amplitude signals. As can be seen from the phase frequency response curve in Figure 5b, with the increase of frequency, the phase change of the water sample in the blank rice field generally tends to decline first, then rise to the highest peak and then begin to decay, with a small upward trend and decay at 75 MHz to 87 MHz. With the increase in frequency, the phase change of water samples added with different pesticides showed a general trend of first decreasing, then rising and then decreasing, and then decreasing after reaching the highest peak value. At 75 MHz to 87 MHz, the paddy water samples with different pesticides had a large upward trend and attenuation after the rise. Five sets of phase signal peaks as well as offset changes can be clearly seen at location 3. These changes may be due to pesticides dissolving in the paddy water, which could alter the dielectric properties of the paddy water through mechanisms such as polar molecular interactions, changes in ionic conductivity and suspended particle effects, thereby affecting both the ε r and ε r of the relative dielectric constant. Analyzing changes in the dielectric properties of paddy field water can effectively help identify whether pesticides have been added to the water [30,31].

3.3. Characterization of Typical Pesticide Species in Paddy Water

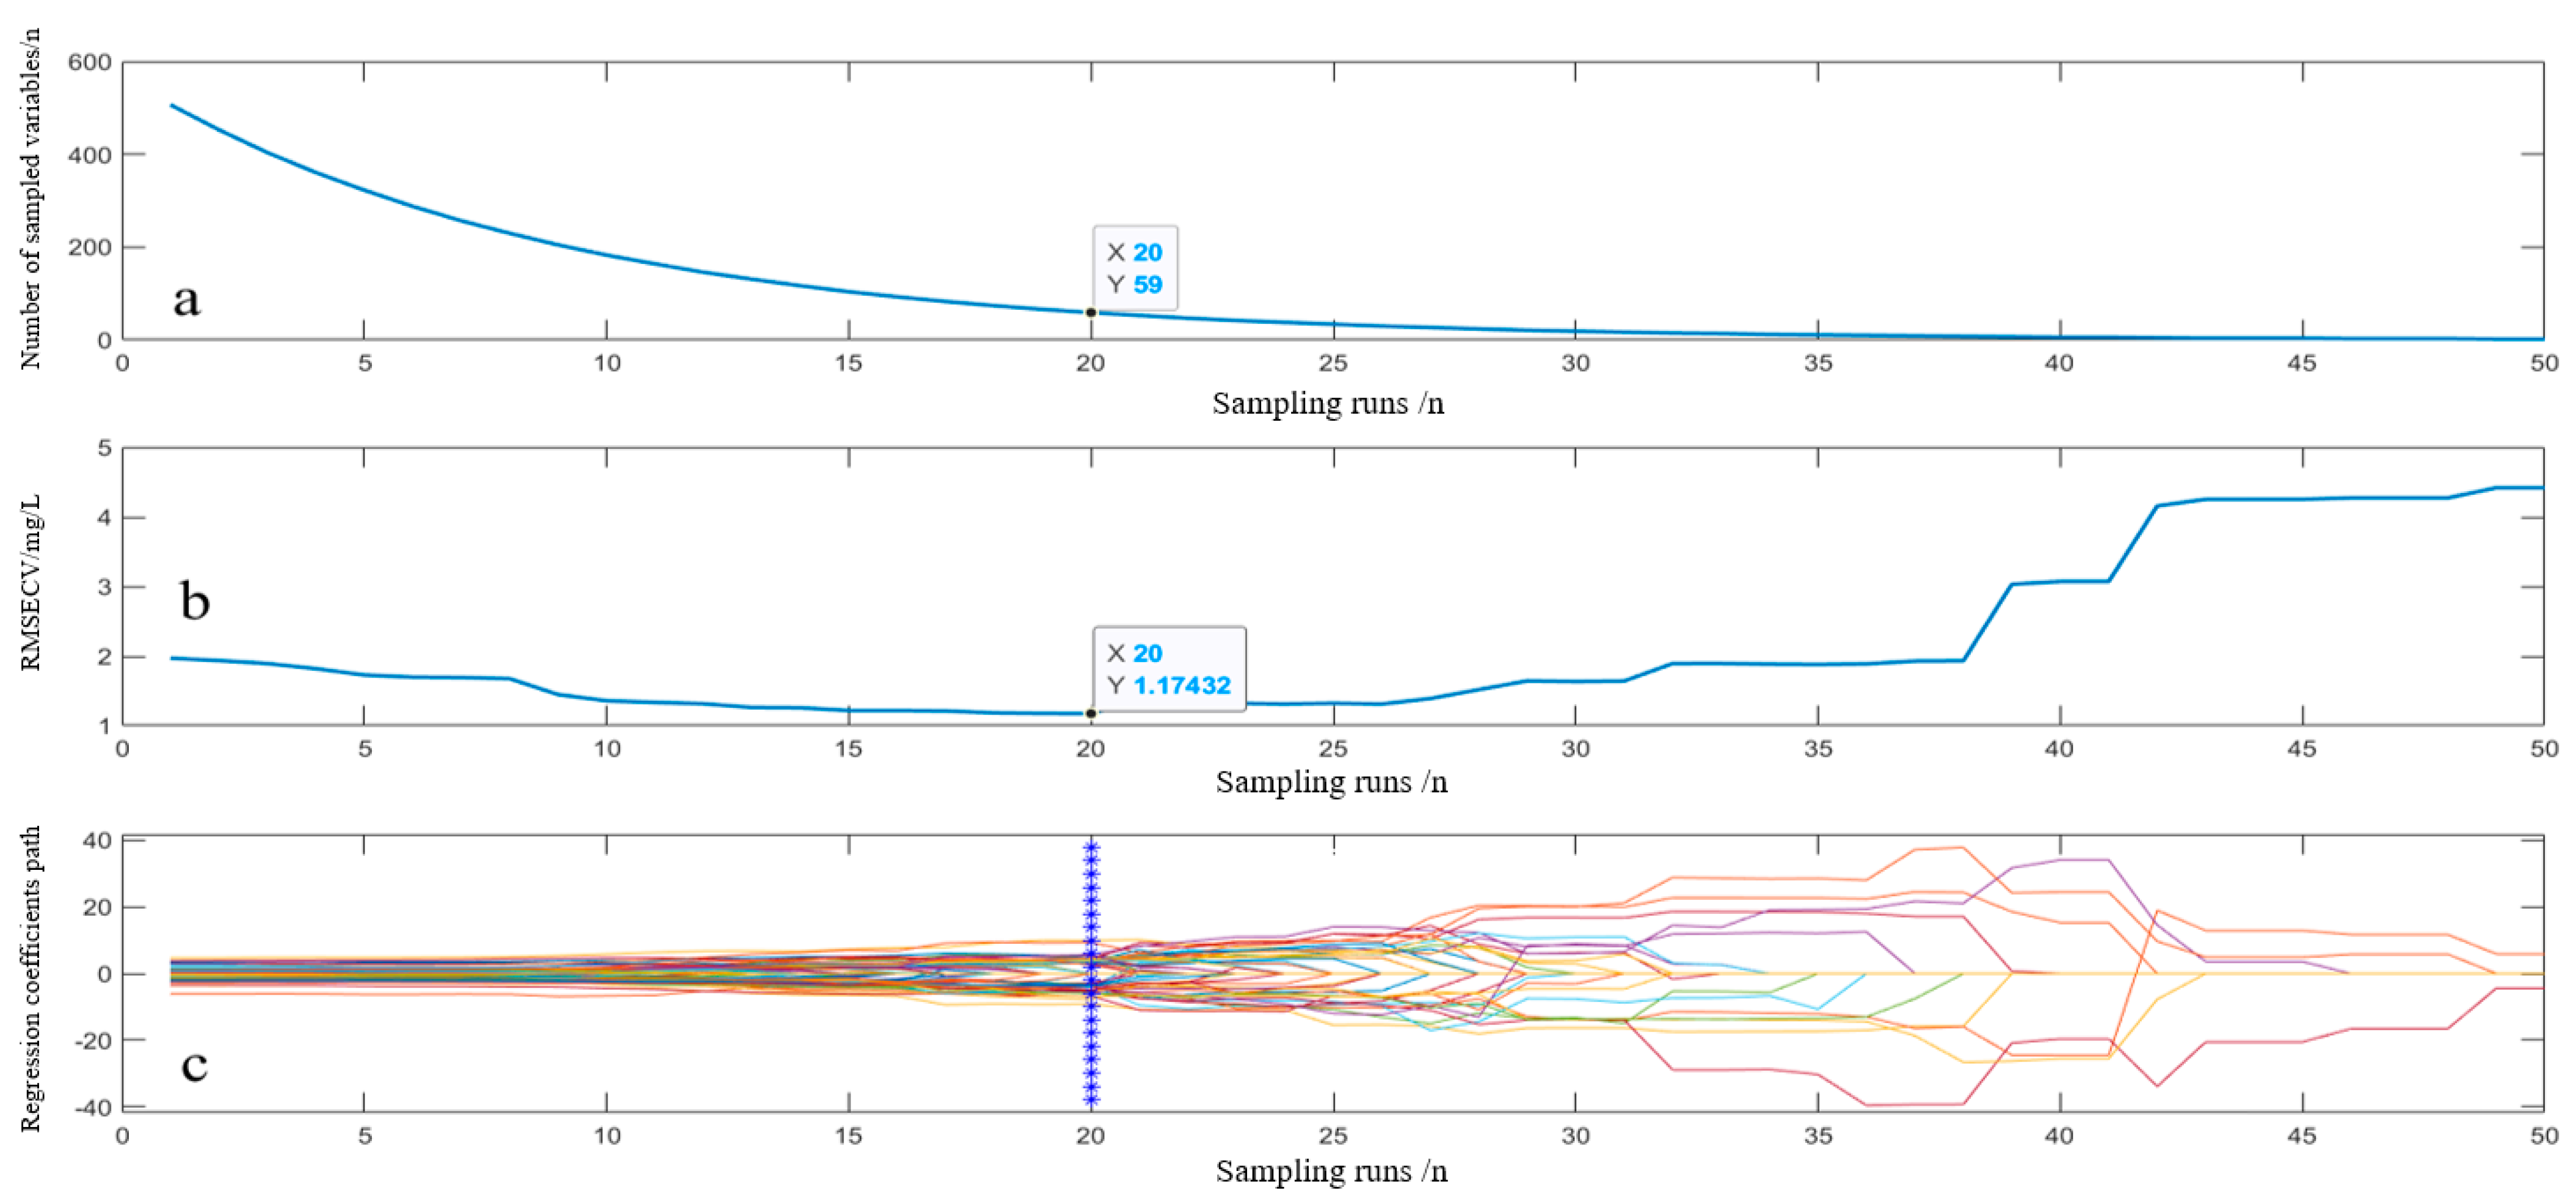
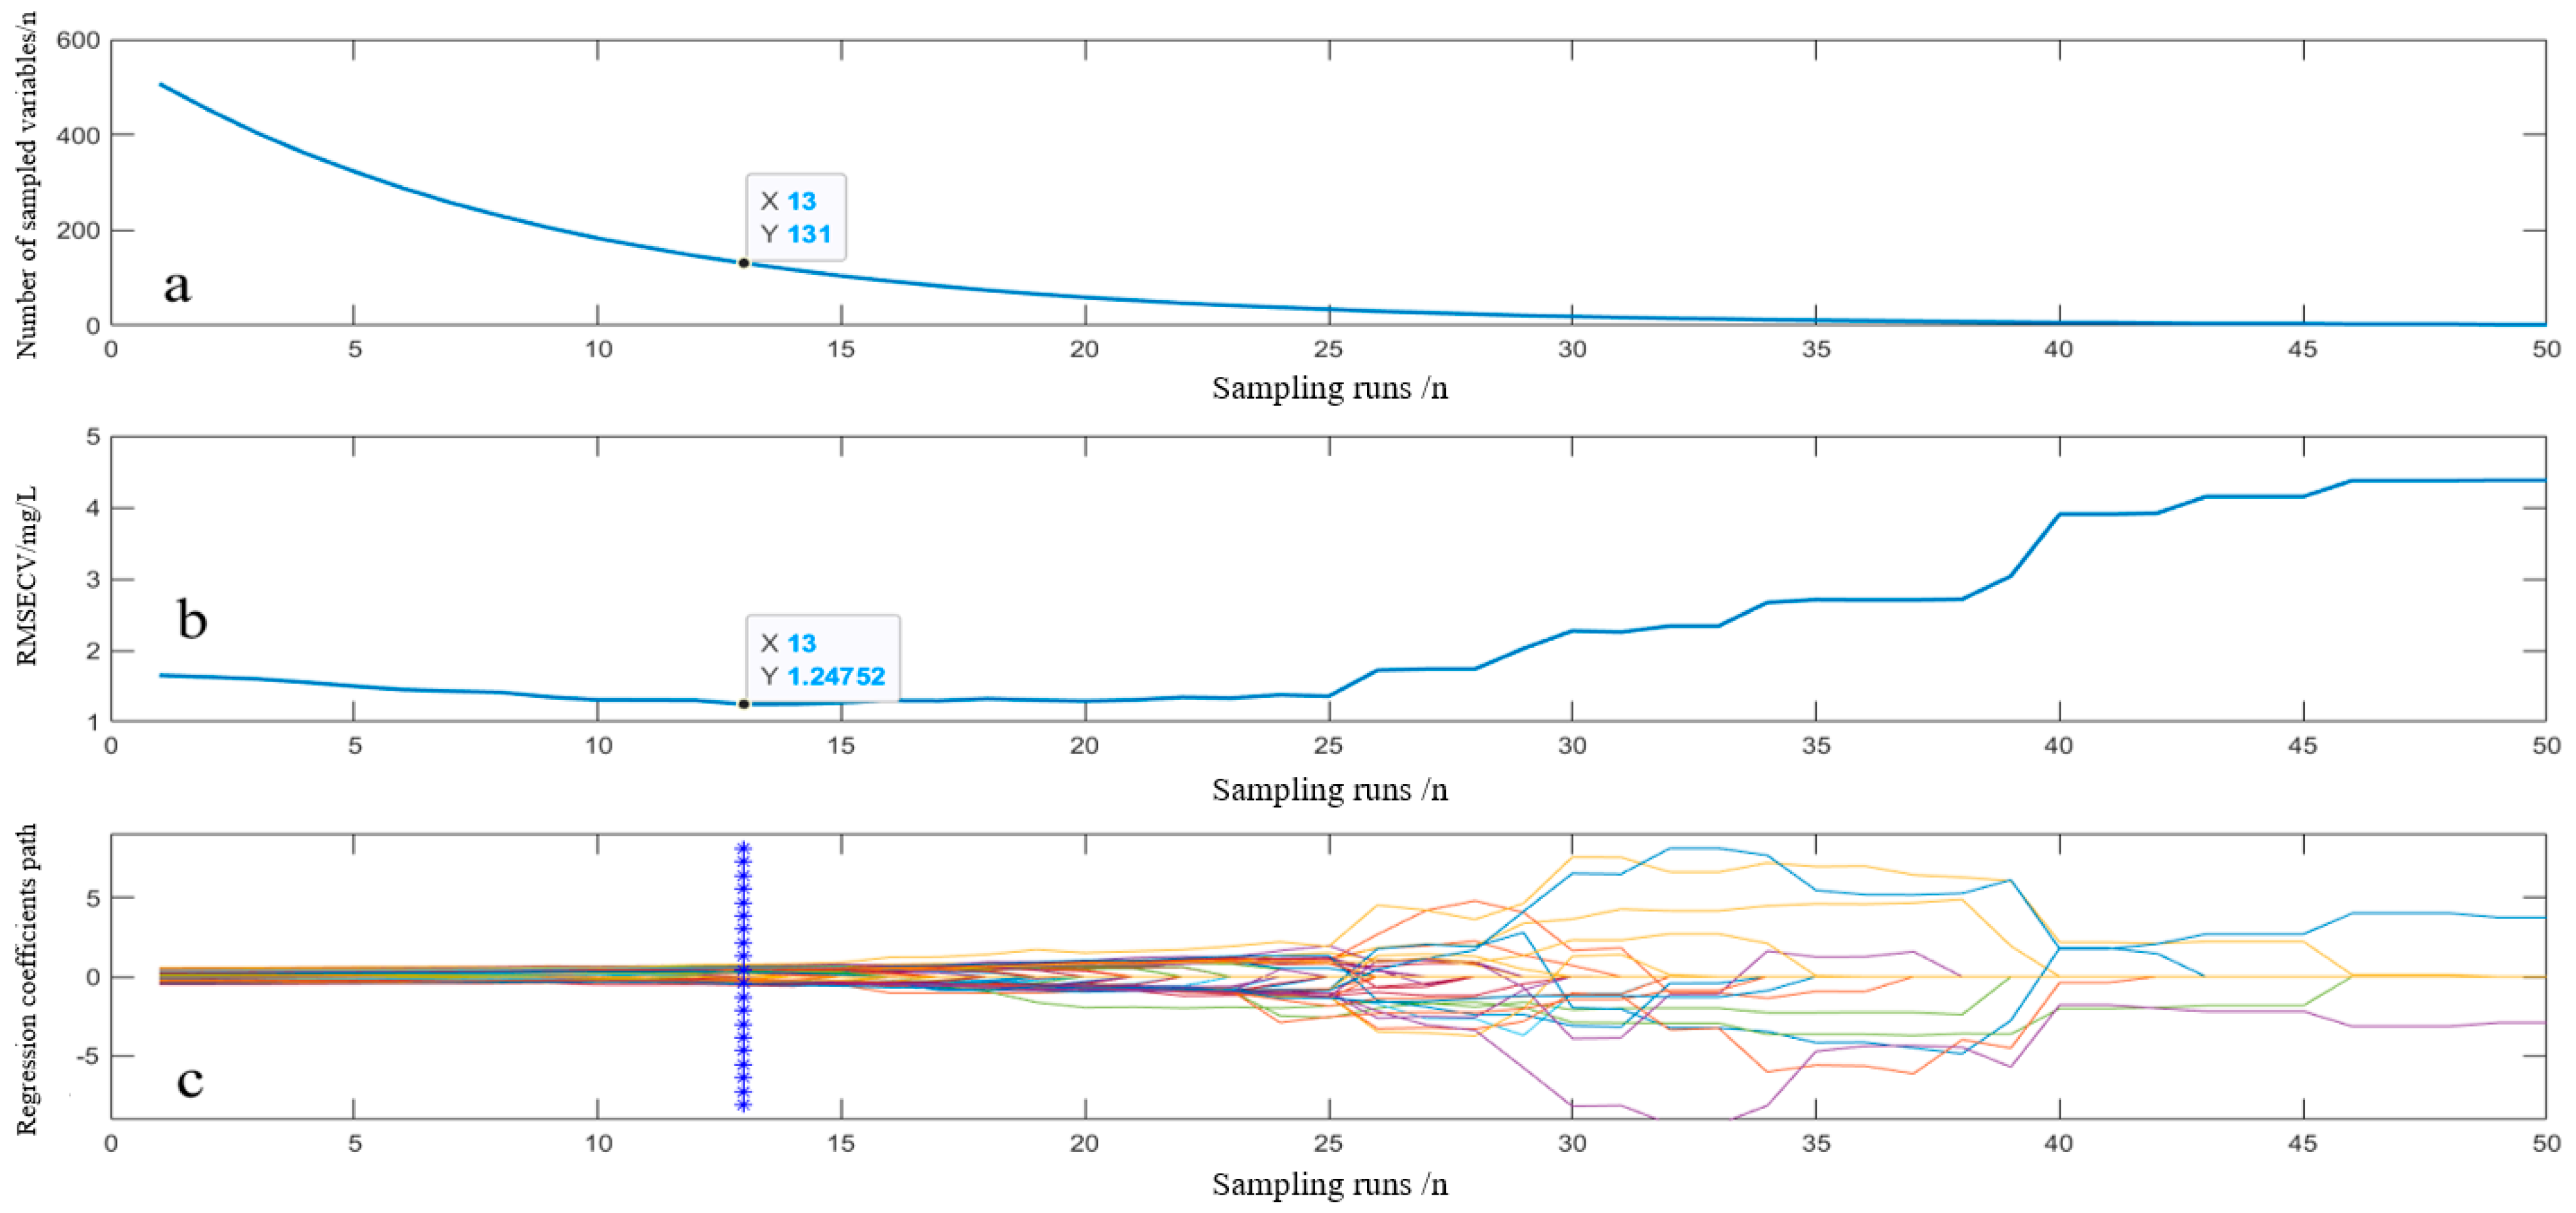
3.3.1. CARS Feature Extraction

The results of CARS feature extraction for the amplitude frequency response data at 20 °C are shown in Figure 6. Figure 6a shows that as the number of iterations increases, the number of selected variables continues to decrease, and the rate of decrease first accelerates and then slows down. In Figure 6b, the size of the RMSECV value is related to the predictive performance of the model. It can be observed that when the sampling runs range from 1 to 19, RMSECV shows a decreasing trend, indicating that the variables eliminated during this process are unrelated to the identification information, and the predictive ability of the model is increased. When the sampling runs exceed 20, RMSECV gradually increases, reflecting that the variables eliminated during this process contain relevant identification information. Figure 6c represents the trend of changes in the regression coefficients. The position marked in blue corresponds to where the RMSECV value is at its minimum, and when RMSECV is at its minimum, the variable is the optimal variable [32]. Therefore, it can be concluded that when the number of iterations is 20 and the number of eigenfrequencies is 59, the RMSECV has a minimum value. In the same scenario, Figure 7 shows the results of the phase frequency response for CARS feature extraction at 20 °C. When the number of iterations is 13 and the number of eigenfrequencies is 131, the RMSECV value is minimized to 1.24752.

3.3.2. PCA Feature Extraction

The purpose of principal component analysis is to reveal the global structure of data, extract the main features of data, and reduce the redundant information in data. The number of principal component factors that can represent the valid information of the original data should be selected, as long as the cumulative variance contribution rate is greater than 90%. PCA was applied to analyze the frequency response data (both amplitude and phase) of 16 types of paddy water samples. Taking 20 °C as an example, the analysis yielded variance contributions of 82.29% and 9.22% for the first 2 principal components of magnitude and a cumulative contribution of 91.51% for the first 2 principal components. The variance contributions of the first 5 principal components of the phase were 44.52%, 22.22%, 15.76%, 6.00%, and 3.34%, respectively, and the cumulative contribution of the first 5 principal components was 91.84%. To ensure the contribution rate and the complexity of the data, PC1 and PC2 for amplitude and PC1, PC2, PC3, PC4, and PC5 for phase are chosen to form the main information of characteristic quantities. PCA can effectively eliminate feature information with poor explanatory power from the spectral and texture features.

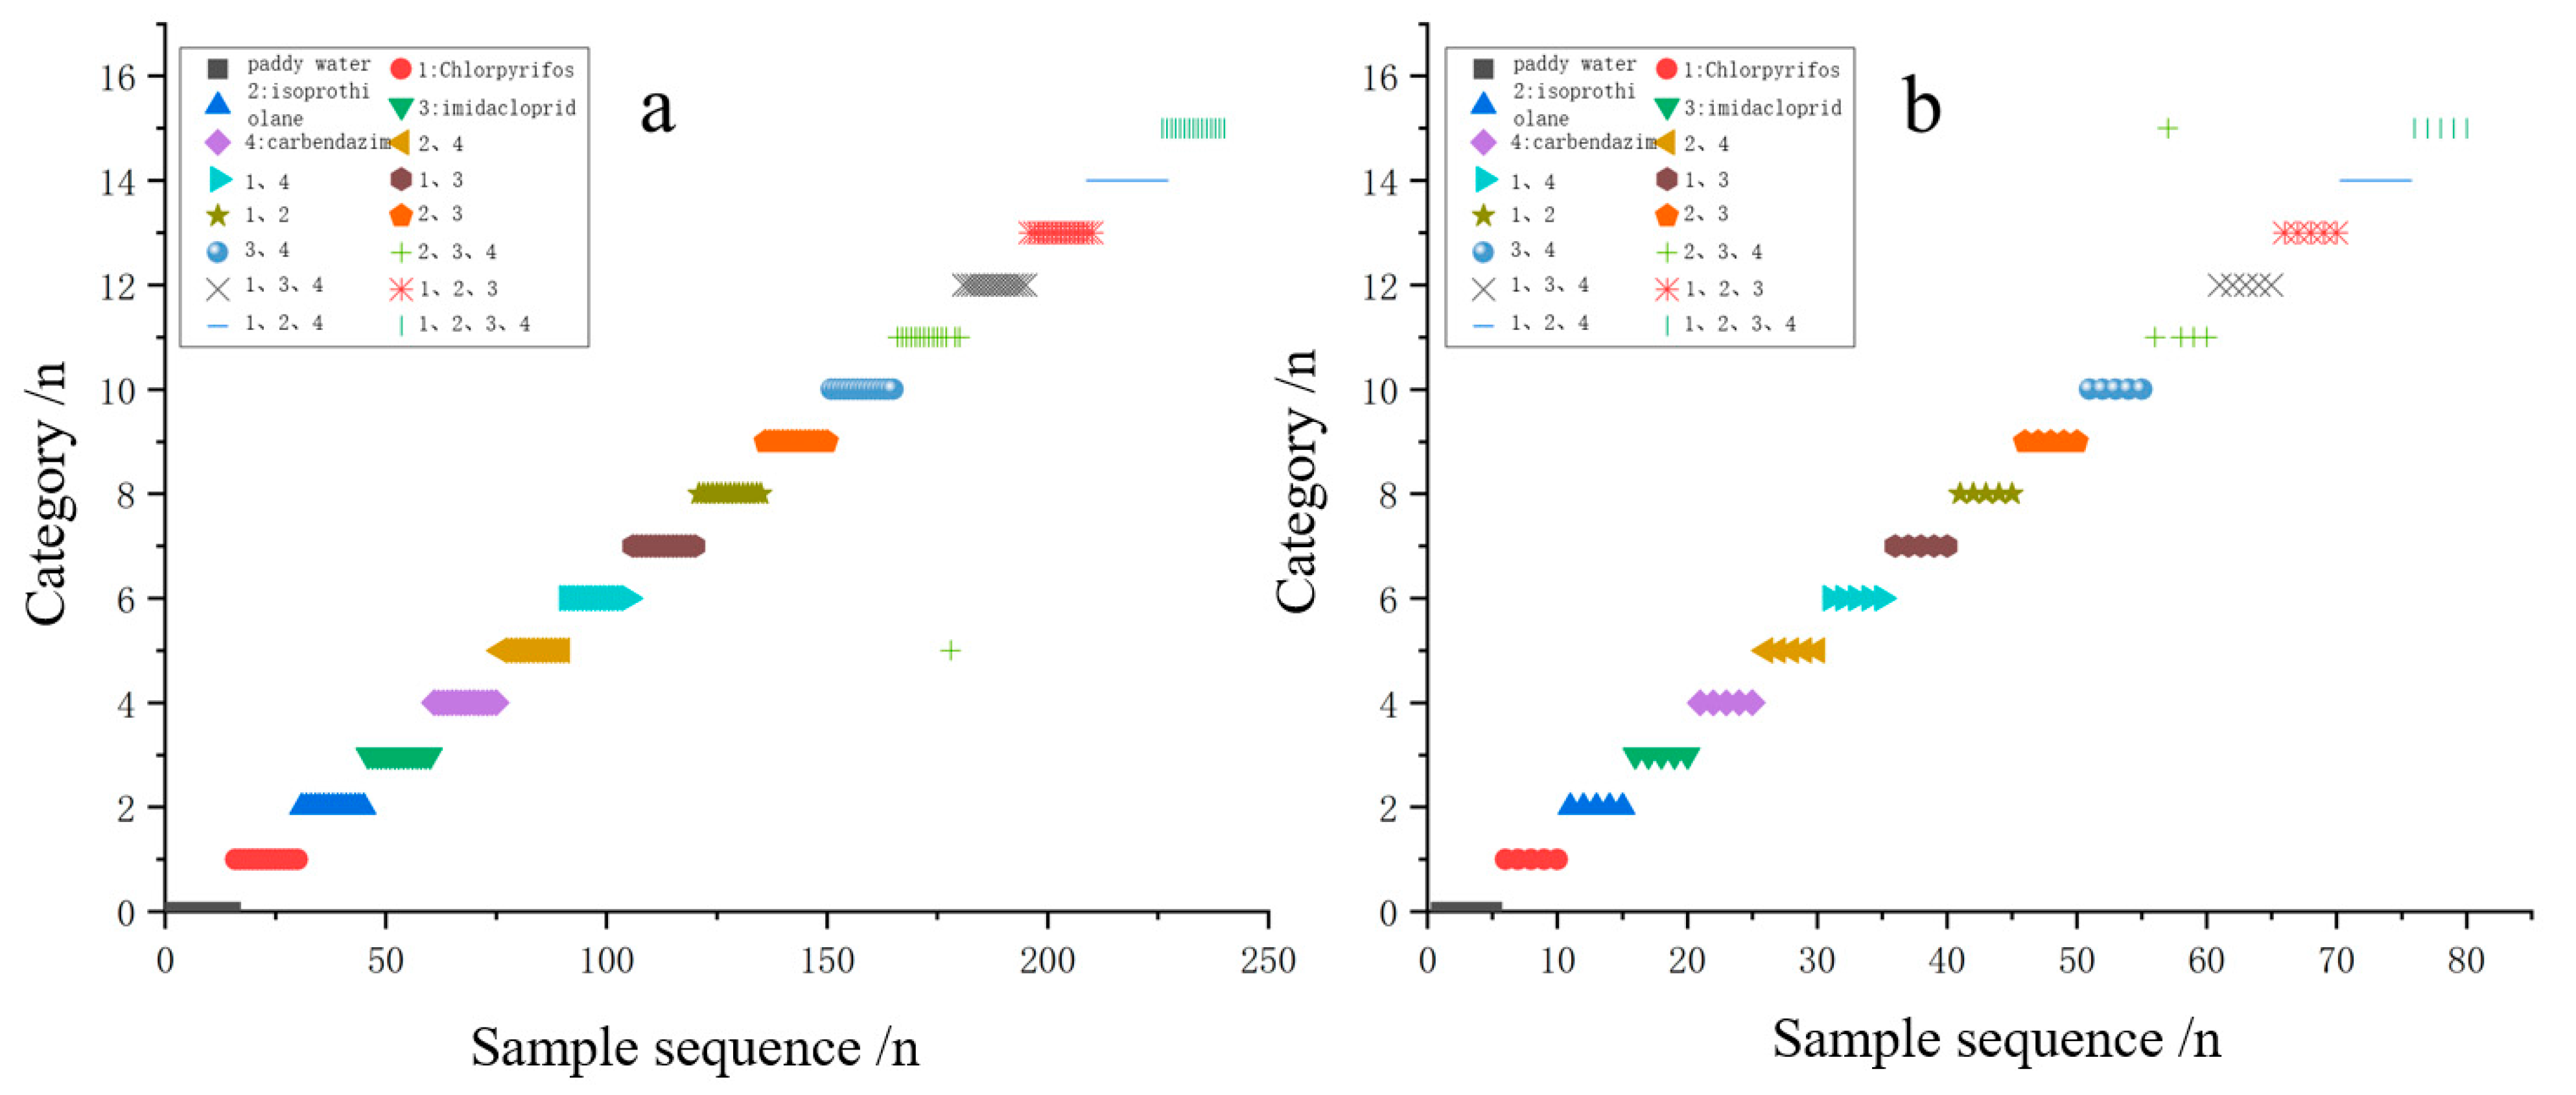
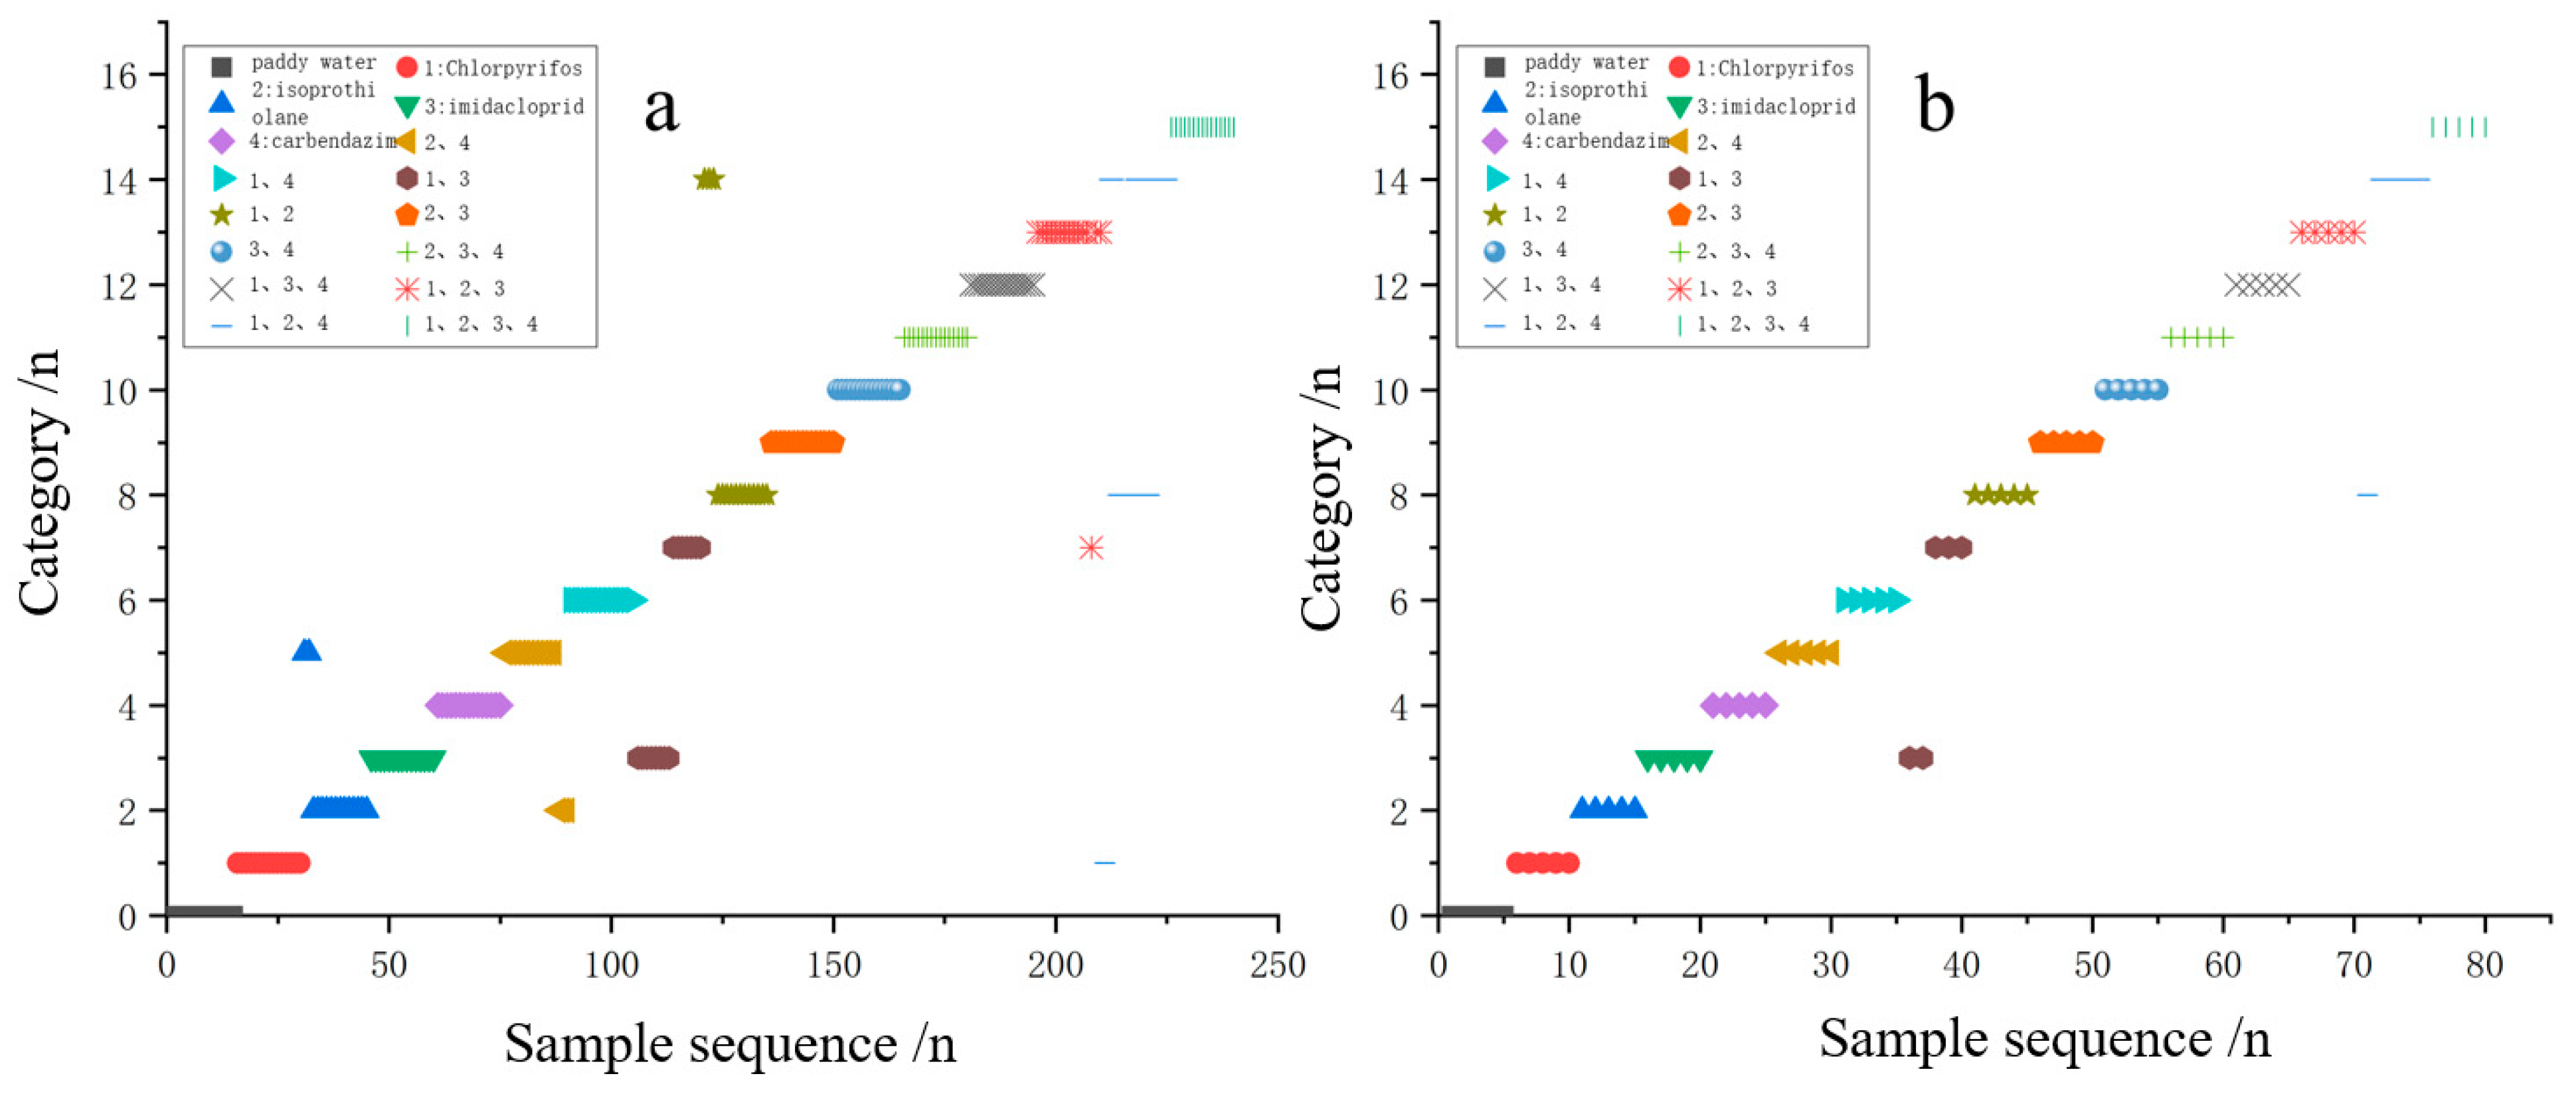
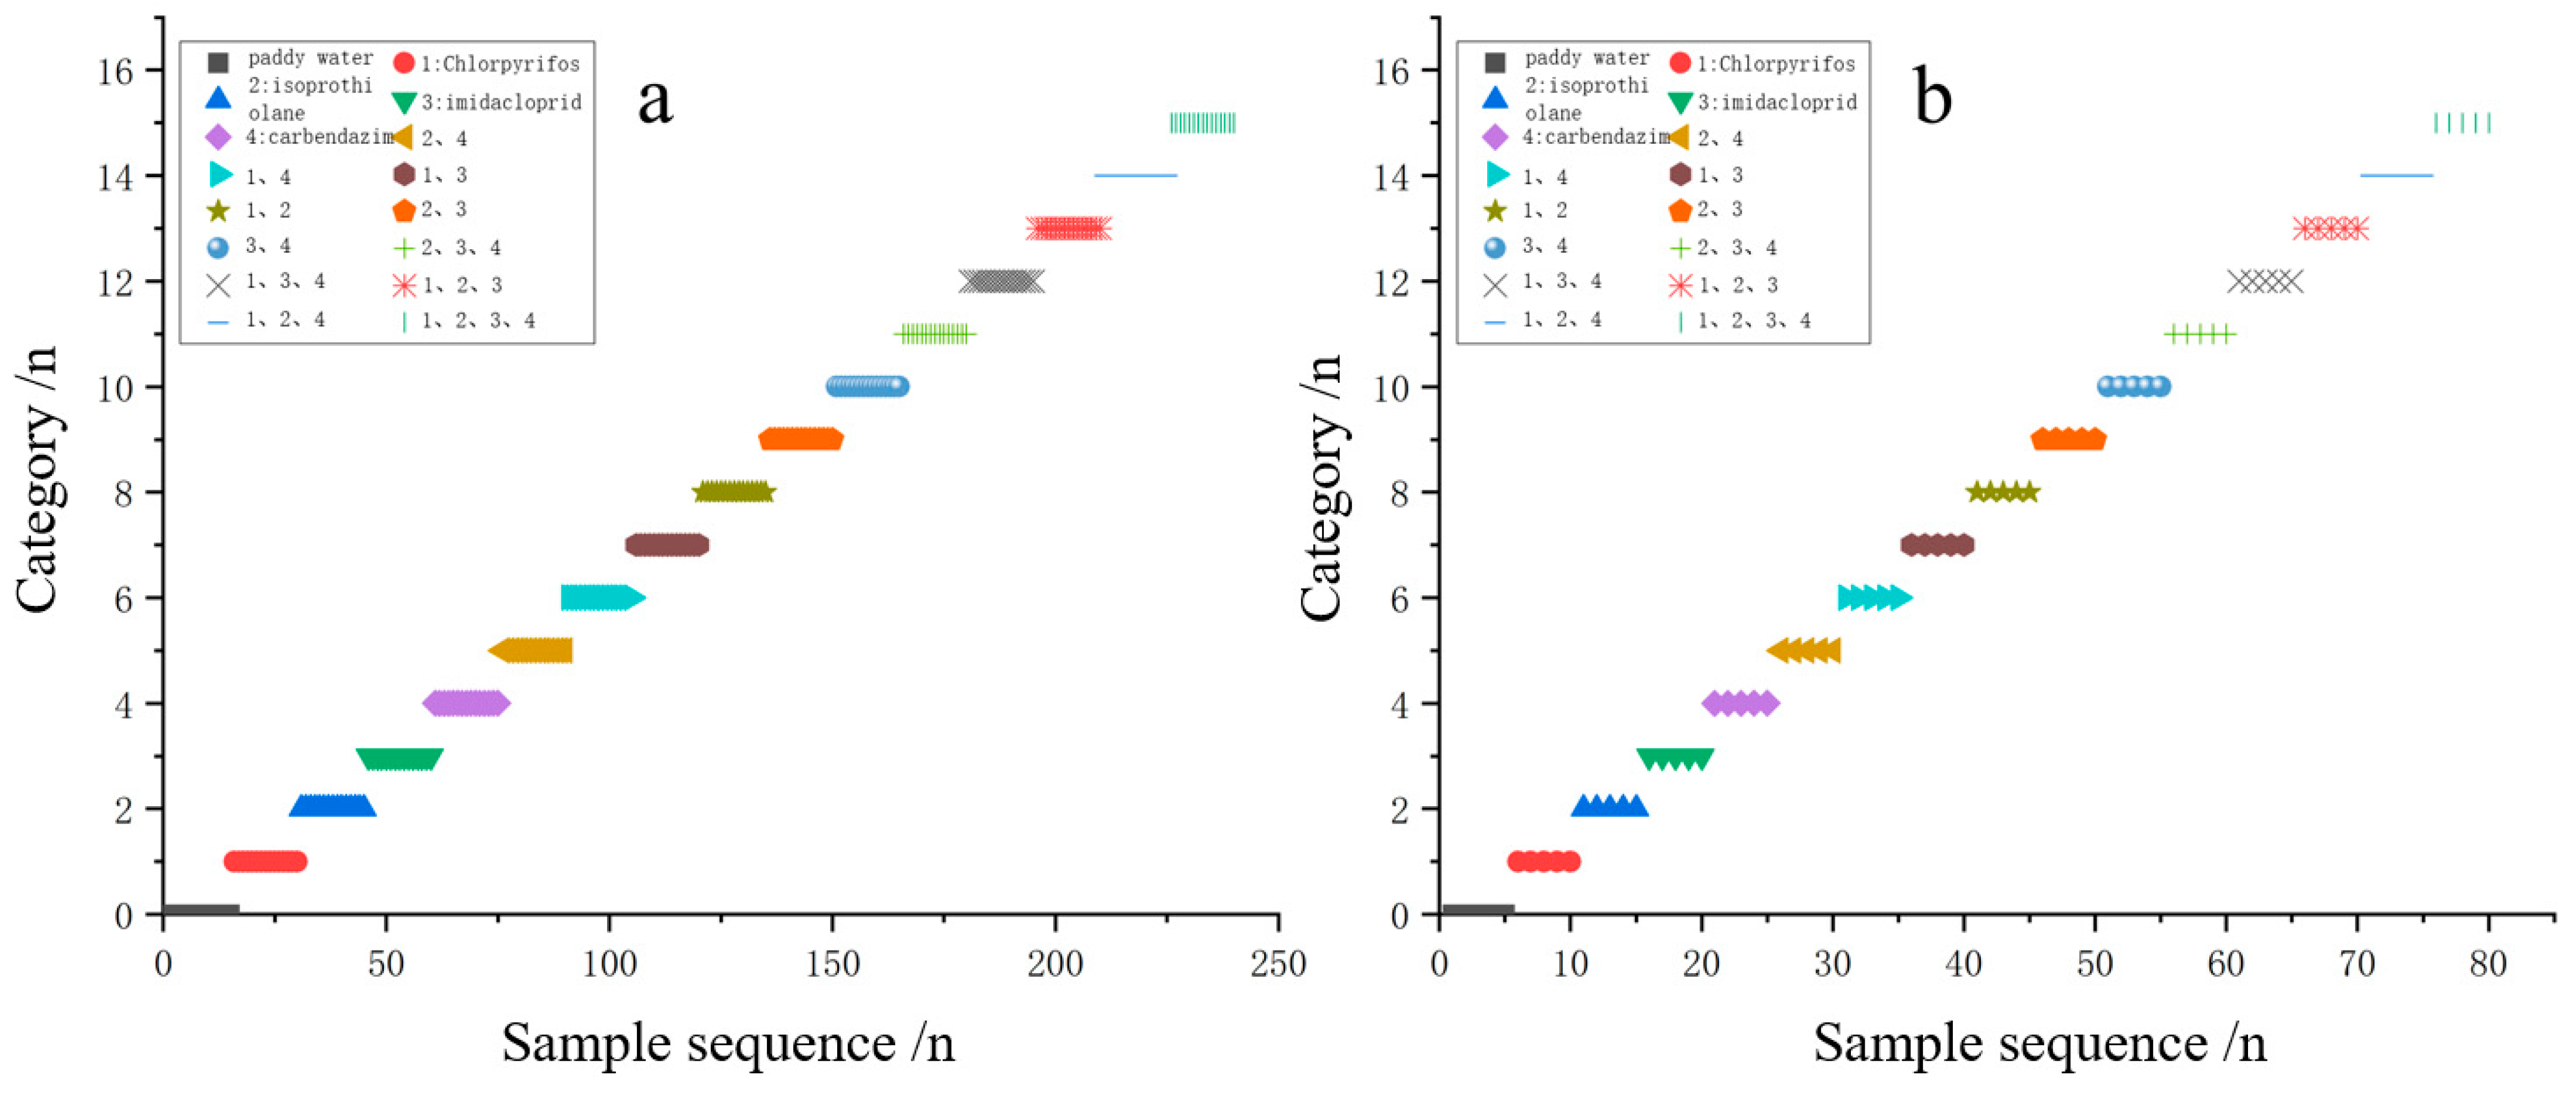
3.4. Modeling the Identification of Typical Pesticide Species in Paddy Water Bodies

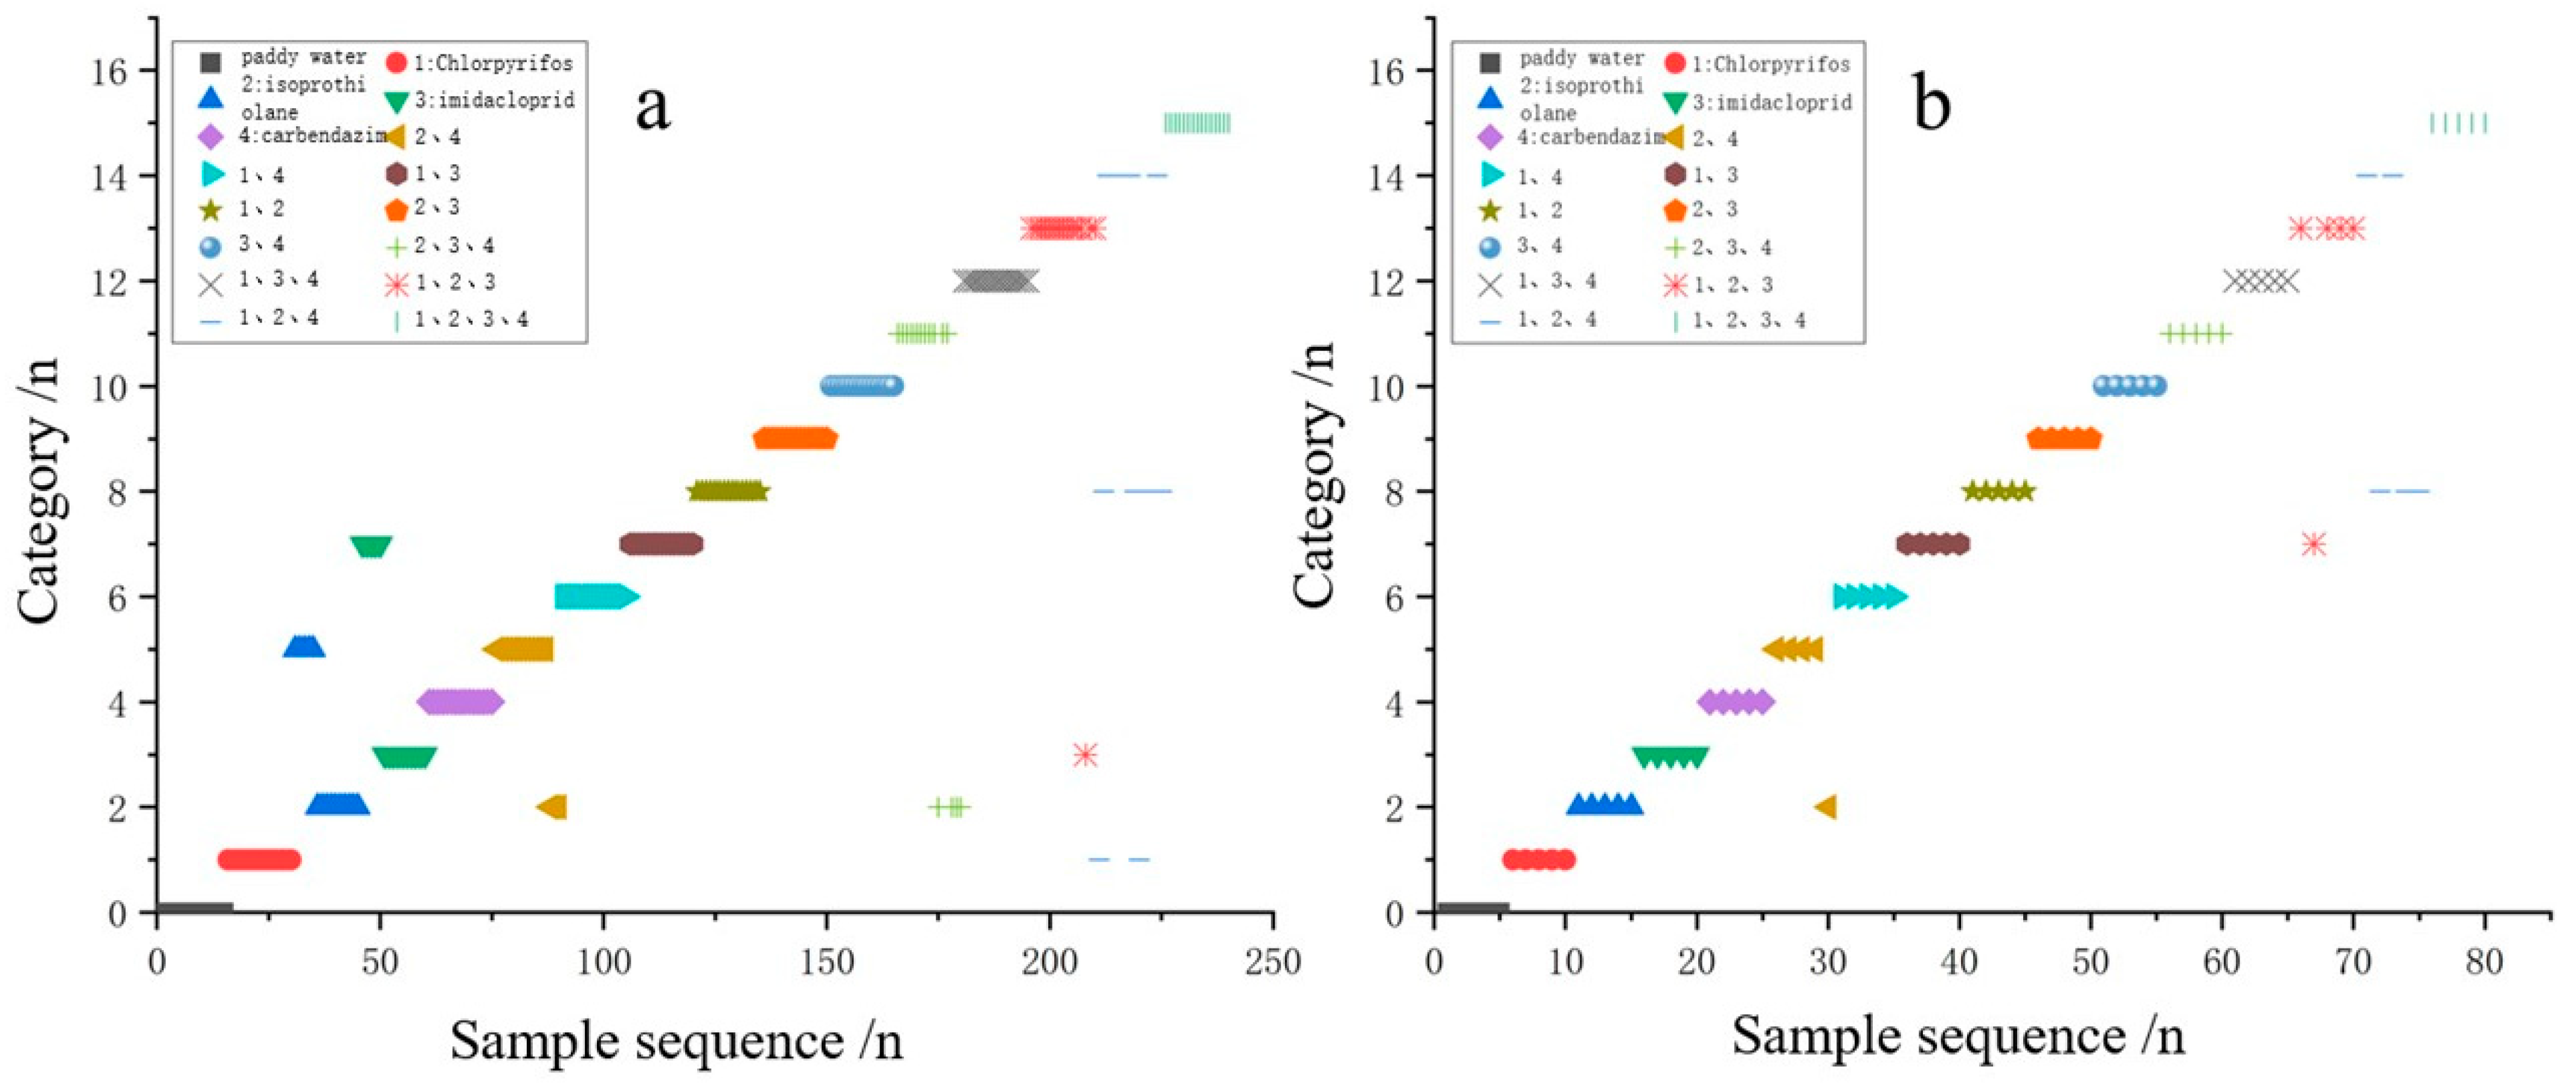
3.4.1. Identification Models for CARS-SVM

Taking the detection at 20 °C as an example, the feature frequencies extracted from the amplitude frequency response data and the 131 feature frequencies extracted from the phase frequency response data are used as the species identification input data. Each color represents a sample type, with 20 frequency response data for each color. A total of 320 data were divided into training and prediction sets in a 3:1 ratio. The training and prediction recognition results for all samples are shown in Figure 8 and Figure 9. During the training of the SVM recognition model with the feature frequencies extracted from the amplitude frequency response data as the input data, there were 26 training recognition errors, with a training correctness rate of 89.17%. In the prediction results, there were 5 recognition errors, and the recognition correct rate was 93.75%. During the training of the SVM recognition model using the eigenfrequencies extracted from the phase frequency response data as input data, only one sample containing isoprothiolane, imidacloprid and carbendazim was incorrectly recognized as containing only isoprothiolane and carbendazim. The correct training recognition accuracy was 99.58%. In the prediction results, there was 1 recognition error and the prediction recognition accuracy was 98.75%. The higher the accuracy, the higher the model’s precision. It can be found that the recognition correctness of the CARS-SVM-based pesticide species identification model for paddy water modeled with phase frequency response data is higher.

3.4.2. Identification Model for PCA-SVM

Taking the detection at 20 °C as an example, the first 2 principal components of the amplitude frequency response data and the first 5 principal components of the phase frequency response data are used as the species identification input data. The training and prediction recognition results for all samples are shown in Figure 10. During the training of the SVM recognition model with the principal components extracted from the magnitude frequency response data as input data, there were 24 recognition errors and the training recognition correctness was 90%. In the prediction results, there were 3 recognition errors, and the recognition correctness of the test was 96.25%. As shown in Figure 11, the SVM recognition model trained with the principal components extracted from the phase frequency response data as input data has no recognition errors and its training recognition correctness is 100%. In the prediction results, there were no recognition errors and the test recognition correct rate was 100%. The higher the accuracy, the higher the model’s precision. It can be found that the recognition accuracies based on PCA-SVM models are all higher, and the model built using phase frequency response data has better accuracy.

3.4.3. Comparison of Species Identification Models

From the previous two sections, it can be concluded that the pesticide species identification model in paddy water performs better when phase frequency response data are used as input compared to amplitude frequency response data. The training and prediction recognition accuracy of pesticide species identification models in paddy water using PCA-SVM and CARS-SVM are shown in Table 5 at 10 temperatures. The PCA-SVM model performs better; the prediction recognition accuracy ranges from 97.5% to 100%. SVM, LDA and PCA were used to discriminate and classify pesticides, such as Curathane, Numetrin and Nativo in water; the accuracy of the SVM method reached 93.1% [33]. The SVM model has the best discrimination effect with recognition accuracy of 92.86%, 94.29%, 91.43% and 92.86% for cypermethrin, chlorpyrifos, imidacloprid and water, respectively [34]. The results of this article further demonstrate the feasibility of applying SVM and PCA classification methods for identifying pesticide species. Due to its high accuracy, the PCA-SVM model was used for species identification of typical pesticides in paddy water with phase frequency response data.

3.5. Detection of Typical Pesticide Content in Paddy Water Based on Dielectric Properties

The results of the prediction model for chlorpyrifos, isoprothiolane, imidacloprid and carbendazim content in paddy water are shown in Table 6, Table 7, Table 8 and Table 9. Analyzing the prediction results in Table 6, Table 7, Table 8 and Table 9, it can be seen that the content prediction models of the artificial neural network established using the two frequency response data of amplitude and phase, respectively, have R2 values reaching more than 0.75; the prediction is good, and the results have high accuracy. The prediction results of pesticide residues in paddy water vary with changes in temperature. Higher R2 and lower RMSEP indicate better predictive performance of the model. When the temperature is 25 °C, the prediction effect of amplitude and phase is the best, and the prediction R2 values are the highest, which are 0.8163 and 0.8249, respectively; the prediction model based on phase frequency response data has the best effect, and its RMSEP is 22.5937 mg/L in Table 6. The best prediction of phase was obtained when the temperature was 31 °C, and it has the highest predicted R2 of 0.8639 in Table 7. The best prediction of phase was obtained when the temperature was 25 °C, and it has the highest predicted R2 of 0.9113 in Table 8. The best prediction of phase was obtained when the temperature was 5 °C. It has the highest predicted R2 of 0.8368, and its RMSEP is 28.9273 mg/L in Table 9. From the results in Table 6, Table 7, Table 8 and Table 9, it can be concluded that the CARS algorithm not only does not weaken the model’s predictive ability but also effectively screens key variables, simplifies the model, and enhances its robustness. These results indicate that the content prediction model based on CARS-ANN using a multi-input single-output approach has good performance for detecting the concentration of typical pesticides in paddy water, and the prediction model built with the phase frequency response data was more effective and could be used to predict the content of typical pesticides in paddy water.

4. Conclusions

Four typical pesticides—chlorpyrifos, diflubenzuron, imidacloprid and carbendazim—which are commonly used in paddy water were used in this study. Pesticides in paddy water were detected by a homemade sensor for detecting the dielectric properties of pesticides in paddy water, and identification of typical pesticide types and content prediction in paddy field water bodies were achieved. Two identification models PCA-SVM and CARS-SVM for typical pesticides in paddy water were developed, and the prediction identification effect based on the PCA-SVM model is the best with a range of 97.5–100%, which achieved species identification of 16 types of paddy water samples. An ANN content prediction model was built for both amplitude and phase frequency response data using multi-input single-output modeling with CARS feature extraction. The model using phase frequency response data performs better; the highest R2 prediction values of four typical pesticides such as chlorpyrifos, isoprothiolane, imidacloprid and carbendazim in paddy water reach 0.8249, 0.8639, 0.9113 and 0.8368 respectively, and achieved the prediction of typical pesticide contents in paddy water. The dielectric property detection technique can provide some data for achieving the detection of other pesticides in paddy water.

Author Contributions

Conceptualization, S.H. and M.Y.; methodology, J.Z.; software, S.H. and J.H.; validation, L.S. and Q.C.; formal analysis, F.P.; investigation, Y.W.; resources, M.L.; data curation, Y.W.; writing—original draft preparation, L.S.; writing—review and editing, S.H. and M.Y.; visualization, M.Y.; supervision, Y.W.; project administration, Y.W.; funding acquisition, M.L.; Y.W. and J.Z. are correspondence authors. All authors have read and agreed to the published version of the manuscript.

Funding

This research was financially supported by the National Key Research and Development Program Project (2022YFD1600601). The funders did not participate in the design of the study, the gathering and analysis of data, the choice to publish, or the drafting of the manuscript.

Data Availability Statement

In this study, we used the datasets obtained from the online monitoring device for pesticides in paddy water of Jiangxi Agricultural University, and some of the datasets are stored at the following URL: https://github.com/shuanggenhuang (accessed on 4 July 2025).

Conflicts of Interest

The authors declare no competing or financial interests.

References

  1. Shanthalakshmi, M.; Sandhiya, M.; Rajalakshmi, M.; Ratheesh, V. Paddy Disease Detection and Pesticide Recommender System for Farmers Using Multi SVM Technique. Int. J. Sci. Res. Comput. Sci. Eng. Inf. Technol. 2019, 5, 721–725. [Google Scholar] [CrossRef]
  2. Bapat, G.; Labade, C.; Chaudhari, A.; Zinjarde, S. Silica nanoparticle based techniques for extraction, detection, and degradation of pesticides. Adv. Colloid Interface Sci. 2016, 237, 1–14. [Google Scholar] [CrossRef]
  3. Chen, Y.; Lyu, J.; Zhang, L.; Ye, B.; Gao, S.; Jin, N. Distribution and health risk assessment of pesticide pollution in raw water and drinking water within key river basins in China in 2022. J. Hyg. Res. 2024, 53, 726–733. [Google Scholar]
  4. Ji, B.; Hao, Y.; Wang, C.h.; He, H.; Li, J.; Tian, G.; Wei, Y.; Ding, G.; Xu, B. Pollution characteristics and ecological risks ofpesticides in surface water and sediments of Suzhou Ecological Conservation Area. Environ. Pollut. Control 2022, 44, 1622–1627. [Google Scholar]
  5. Maciej, T.; Andrzej, B. Improvement of the QuEChERS method coupled with GC–MS/MS for the determination of pesticide residues in fresh fruit and vegetables. Microchem. J. 2022, 181, 107794. [Google Scholar]
  6. Niki C, M.; George, B. Determination of Ethephon in Pesticide Formulations by Ion Exchange Chromatography with Indirect Spectrophotometric Detection. Anal. Lett. 2020, 53, 795–806. [Google Scholar]
  7. Ilić, M.; Pastor, K.; Romanić, R.; Vujić, Đ.; Ačanski, M. A New Challenge in Food Authenticity: Application of a Novel Mathematical Model for Rapid Quantification of Vegetable Oil Blends by Gas Chromatography—Mass Spectrometry (GC-MS). Anal. Lett. 2022, 55, 2752–2763. [Google Scholar] [CrossRef]
  8. Maciej, T. Determination of Selected Priority Pesticides in High Water Fruits and Vegetables by Modified QuEChERS and GC-ECD with GC-MS/MS Confirmation. Molecules 2019, 24, 417. [Google Scholar]
  9. Abasalizadeh, A.; Sorouraddin, S.M.; Farajzadeh, M.A. Development of a green approach based on DµSPE combined with deep eutectic solvent-based DLLME for the extraction of some pesticides from vegetable samples prior to GC–FID and GC–MS. J. Iran. Chem. Soc. 2022, 19, 4699–4707. [Google Scholar] [CrossRef]
  10. Yu, J.; Zhao, K.; Zhang, Z. Development of a bioluminescence resonance energy transfer Quenchbody sensor for the detection of organophosphorus pesticides in water bodies. Water Res. 2024, 250, 121051. [Google Scholar] [CrossRef]
  11. Elmastas, A.; Umaz, A.; Pirinc, V.; Aydin, F. Quantitative determination and removal of pesticide residues in fresh vegetables and fruit products by LC–MS/MS and GC–MS/MS. Environ. Monit. Assess. 2023, 195, 277. [Google Scholar] [CrossRef] [PubMed]
  12. Shen, J.; Zhang, H.; Wu, L.; Li, Z.; He, X.; Li, H. LingWu long jujube soluble solids content predicting model research based on dielectric spectra. Trans. Chin. Soc. Agric. Eng. 2016, 32, 369–375. [Google Scholar]
  13. Guo, W.; Wang, D.; Kong, F.; Li, L. Solids Content Detection of Soybean Milk Based on Permittivities. Trans. Chin. Soc. Agric. Mach. 2016, 47, 239–245. [Google Scholar]
  14. Guo, W.; Liu, Z.; Zhu, X. Design of protein content detector for raw milk based on electrical properties. Trans. Chin. Soc. Agric. Mach. 2020, 51, 387–393. [Google Scholar]
  15. Han, Z.; Tao, Z.; Zeng, Y.; He, J. Moisture Content Prediction of Rice Husk in Ectopic Fermentation Bed Based on Dielectric Property. J. Henan Agric. Sci. 2021, 50, 173–180. [Google Scholar]
  16. Wu, H.; Li, J.; Zhang, J. Development of rapid identification device for variety of macronutrient water soluble fertilizers based on dielectric characteristic frequency. Trans. Chin. Soc. Agric. Eng. 2017, 06, 51–58. [Google Scholar]
  17. Zhang, Y.; Zhao, J.; Zhao, L.; Cheng, X. Design and experiment of on-line measuring instrument for grain moisture based on dielectric properties. J. Chin. Agric. Mech. 2020, 41, 105–111. [Google Scholar]
  18. Samarghandi, M.R.; Mohammadi, M.; Karami, A.; Tabandeh, L.; Dargahi, A.; Amirian, F. Residue Analysis of Pesticides, Herbicides, and Fungicides in Various Water Sources Using Gas Chromatography-Mass Detection. Pol. J. Environ. Stud. 2017, 26, 2189–2195. [Google Scholar] [CrossRef]
  19. Weng, S.; Zhu, W.; Dong, R.; Zheng, L.; Wang, F. Rapid Detection of Pesticide Residues in Paddy Water Using Surface-Enhanced Raman Spectroscopy. Sensors 2019, 19, 506. [Google Scholar] [CrossRef]
  20. Abedeen, M.Z.; Sharma, M.; Kushwaha, H.S.; Gupta, R. Sensitive enzyme-free electrochemical sensors for the detection of pesticide residues in food and water. TrAC Trends Anal. Chem. Regul. Ed. 2024, 176, 117729. [Google Scholar] [CrossRef]
  21. Issaka, E.; Wariboko, M.A.; Johnson, N.A.N.; Aniagyei, O.N. Advanced visual sensing techniques for on-site detection of pesticide residue in water environments. Heliyon 2023, 9, e13986. [Google Scholar] [CrossRef]
  22. Ma, G.; Lei, C.; Liu, T.; Liu, Y.; Li, W.; Zhang, H.; Zhao, Y. Improved dielectric and energy storage properties of polymer composites with BNNSs/AgNPs hybrid nanofiller. Mater. Technol. 2022, 37, 2158–2165. [Google Scholar] [CrossRef]
  23. Ata, S.; Bano, S.; Bibi, I.; Alwadai, N.; Mohsin, I.U.; Al Huwayz, M.; Iqbal, M.; Nazir, A. Cationic distributions and dielectric properties of magnesium ferrites fabricated by sol-gel route and photocatalytic activity evaluation. De Gruyter 2023, 1, 67–86. [Google Scholar] [CrossRef]
  24. Rahman, M.N.; Islam, M.T.; Samsuzzaman, M. Development of a microstrip based sensor aimed at salinity and sugar detection in water considering dielectric properties. Microw. Opt. Technol. Lett. 2018, 60, 667–672. [Google Scholar] [CrossRef]
  25. Onelsons. Dielectric spectroscopy in agriculture. J. Non-Cryst. Solids 2005, 351, 2940–2944. [Google Scholar] [CrossRef]
  26. Esfe, M.H.; Hajian, M.; Toghraie, D.; Khaje khabaz, M.; Rahmanian, A.; Pirmoradian, M.; Rostamian, H. Prediction the dynamic viscosity of MWCNT-Al2O3 (30,70)/ Oil 5W50 hybrid nano-lubricant using Principal Component Analysis (PCA) with Artificial Neural Network (ANN). Egypt. Inform. J. 2022, 23, 427–436. [Google Scholar] [CrossRef]
  27. Robert, B.; Gabriele, S. Robust PCA via Regularized Reaper with a Matrix-Free Proximal Algorithm. J. Math. Imaging Vis. 2021, 63, 626–649. [Google Scholar]
  28. Neshov, N.N.; Manolova, A.H.; Draganov, I.R.; Tonschev, K.T.; Boumbarov, O.L. Classification of Mental Tasks from EEG Signals Using Spectral Analysis, PCA and SVM. Cybern. Inf. Technol. 2018, 18, 81–92. [Google Scholar] [CrossRef]
  29. Liu, J.; Song, S.; Sun, G. Classification of ECG Arrhythmia Using CNN, SVM and LDA; Springer Nature: Cham, Switzerland, 2019; pp. 191–201. [Google Scholar]
  30. Jun Sun Yunnan Mo Chunxia Dai et, a.l. Detection of moisture content of tomato leaves based on dielectric properties and IRIV-GWO-SVR algorithm. Trans. Chin. Soc. Agric. Eng. 2018, 34, 188–195. [Google Scholar]
  31. Zhang, P.; Song, K.; Han, W.; Xu, J.-H.; Guo, W.-C. Dielectric properties of Lousoil andmoisture content detection affected by frequency and temperature. J. Drain. Irrig. Mach. Eng. 2013, 31, 713–718. [Google Scholar]
  32. Zhang, X.-H.; Zhang, K.-X.; Zhang, C. Coal and rock feature detection method based on CARS and PCA. J. Xi’an Univ. Sci. Technol. 2020, 40, 760–768. [Google Scholar]
  33. Gómez, J.K.C.; Puentes, Y.A.N.; Niño, D.D.C.; Acevedo, C.M.D. Detection of Pesticides in Water through an Electronic Tongue and Data Processing Methods. Water 2023, 15, 624. [Google Scholar] [CrossRef]
  34. Wang, D.; Luan, Y.; Tan, Z.; Wei, W. Pesticide Residue Detection in Broccoli Based on Hyperspectral Technology and Convolutional Neural Network. Sci. Technol. Food Ind. 2025, 46, 1–8. [Google Scholar]
Figure 1. Sensor for detecting the dielectric properties of pesticides in paddy water (a) Overall structure; (b) Internal structure of the main control box.
Agronomy 15 01666 g001
Figure 2. Schematic diagram (a) and physical diagram (b) of electrode detection probe (n = 6).
Agronomy 15 01666 g002
Figure 3. Comparison of amplitude output voltage signal Vamp (a) and amplitude output voltage signal Vamp repeatability error (b).
Agronomy 15 01666 g003
Figure 4. Comparison plot of phase output voltage signal Vphs (a) and repeatability error of phase output voltage signal Vphs (b).
Agronomy 15 01666 g004
Figure 5. Frequency response curves of blank paddy water samples versus four paddy water samples containing a single pesticide: (a) magnitude; (b) phase.
Agronomy 15 01666 g005
Figure 6. Results of CARS Preferred Characterization Variables (Magnitude): (a) plot of the relationship between the number of variables; (b) plot of the relationship between the changes in RMSECV; (c) plot of the relationship between the changes in regression coefficients.
Agronomy 15 01666 g006
Figure 7. Results of CARS preferred variable screening (phase): (a) plot of the relationship between the number of variables; (b) plot of the relationship between the changes in RMSECV; (c) plot of the relationship between the changes in regression coefficients.
Agronomy 15 01666 g007
Figure 8. Training and prediction results of CARS-SVM-based pesticide species identification model for paddy water (amplitude): (a) training results; (b) prediction results.
Agronomy 15 01666 g008
Figure 9. Training and prediction results of CARS-SVM-based pesticide species identification model for paddy water (phase): (a) training results; (b) prediction results.
Agronomy 15 01666 g009
Figure 10. Training and prediction results (amplitude) of PCA-SVM-based pesticide species identification model for paddy water: (a) training results; (b) prediction results.
Agronomy 15 01666 g010
Figure 11. Training and prediction results (phase) of PCA-SVM-based pesticide species identification model for paddy water: (a) training results; (b) prediction results.
Agronomy 15 01666 g011
Table 1. Overview of single pesticide test samples.
Sample OverviewChlorpyrifos IsoprothiolaneImidaclopridCarbendazim
Concentration range (mg/L)1~981~1251~1252~250
Samples at a temperature (n)100100100100
Temperature points (n)10
Total single pesticide test samples (n)4000
Table 2. Overview of mixed pesticide test samples.
Sample OverviewCombination of
Two Pesticides
Combination of Three PesticidesCombination of Four Pesticides
Types641
Per type sample at a temperature (n)404090
Total samples per type (n)24016090
Total samples at a temperature (n)490
Temperature points (n)10
Total mixed pesticide test samples (n)4900
Table 3. Overview of species identification test samples.
Species IdentificationBlank Paddy Water SampleAdded Single Pesticide SampleAdded Mixed Pesticide Sample
Types1411
Per-type sample (n)202020
Temperature points (n)101010
Total samples per type (n)2008002200
Total test samples (n)3200
Table 4. Overview of content prediction test samples.
Content PredictionBlank Paddy Water SampleAdded Single Pesticide SampleSample Containing a Certain Pesticide
Types117
Per-type sample number (n)1100330
Total samples at a temperature (n)431
Temperature points (n)10
Total test samples (n)4310
Table 5. Accuracy of pesticide species identification model for paddy water at remaining temperatures (phase).
TemperaturePCA-SVMCARS-SVM
Training
Recognition
Accuracy
Prediction
Recognition
Accuracy
Training
Recognition
Accuracy
Prediction
Recognition
Accuracy
5 °C100%100%100%100%
10 °C100%100%100%98.75%
15 °C100%100%100%100%
20 °C99.58%98.75%100%100%
25 °C100%100%100%98.75%
27 °C100%98.75%100%100%
29 °C100%100%100%100%
31 °C100%100%99.58%93.75%
33 °C99.58%97.5%100%96.25%
35 °C100%100%97.08%97.5%
Table 6. Statistical results of model prediction of chlorpyrifos content in paddy water.
TemperatureAmplitudePhase
R2RMSEP (mg/L)R2RMSEP (mg/L)
5 °C0.778326.28810.818623.3548
10 °C0.778325.94460.801126.0329
15 °C0.776125.68130.783724.9085
20 °C0.77627.11390.781125.3296
25 °C0.816324.19190.824922.5937
27 °C0.775925.96390.789424.7322
29 °C0.775826.01330.785124.8585
31 °C0.777925.24700.803224.3347
33 °C0.774825.51940.821823.6387
35 °C0.80123.9070.768726.8571
Table 7. Statistical results of model prediction of isoprothiolane content in paddy water.
TemperatureAmplitudePhase
R2RMSEP (mg/L)R2RMSEP (mg/L)
5 °C0.756832.85840.807329.875
10 °C0.75631.81540.824127.6818
15 °C0.756935.68230.805231.9389
20 °C0.752432.95480.847525.5785
25 °C0.794931.34520.852924.8319
27 °C0.758934.75170.818628.0793
29 °C0.761133.28080.854524.6119
31 °C0.7929.62030.863924.7423
33 °C0.769830.92080.837326.6229
35 °C0.788529.98850.853726.112
Table 8. Statistical results of model prediction of imidacloprid content in paddy water.
TemperatureAmplitudePhase
R2RMSEP (mg/L)R2RMSEP (mg/L)
5 °C0.806162.16910.857155.2072
10 °C0.812360.4430.902855.0894
15 °C0.801962.09950.84854.5977
20 °C0.79962.80360.86351.9813
25 °C0.813461.03510.911342.6253
27 °C0.831257.41980.861851.9028
29 °C0.806461.46150.866251.0998
31 °C0.807161.27930.885148.1317
33 °C0.814360.12700.845955.1611
35 °C0.810761.79790.839360.3401
Table 9. Statistical results of model prediction of carbendazim content in paddy water.
TemperatureAmplitudePhase
R2RMSEP (mg/L)R2RMSEP (mg/L)
5 °C0.792532.65810.836828.9273
10 °C0.790932.78450.808731.34
15 °C0.795632.38760.80331.8131
20 °C0.795632.47970.803431.6751
25 °C0.79532.41930.813731.1361
27 °C0.796932.27420.812732.2792
29 °C0.790732.83650.801331.9277
31 °C0.795332.40280.818430.6263
33 °C0.788433.19510.806331.5378
35 °C0.798632.81350.804733.9902
Disclaimer/Publisher’s Note: The statements, opinions and data contained in all publications are solely those of the individual author(s) and contributor(s) and not of MDPI and/or the editor(s). MDPI and/or the editor(s) disclaim responsibility for any injury to people or property resulting from any ideas, methods, instructions or products referred to in the content.

