Abstract
Soil moisture sensor-based drip irrigation enables efficient irrigation practices by delivering the required water to plants. However, efficiency must be accompanied by uniform water management and crop growth. This study examined the effect of different irrigation amounts (IAs) per application (5.5, 55, 110, and 165 mL) on the uniformity of substrate volumetric water content (VWC) within an irrigation plot, and the corresponding effect on sweet basil growth uniformity. Sixty-four frequency domain reflectometry sensors monitored the VWC of each 440 mL pot, and drip irrigation was automatically applied at 0.3 m3·m−3. The 5.5 mL IA showed the highest water use efficiency; however, it also resulted in considerable non-uniform VWC (coefficient of variation, CV = 0.404). In contrast, the 110 and 165 mL IAs provided better VWC uniformity (CV = 0.073 and 0.075, respectively), suggesting that less frequent, but larger IAs improved VWC uniformity. Despite the differences in VWC uniformity among treatments, the growth and physiological responses were quite similar across the treatments. It was found that supplying 110 mL irrigation water via the soil moisture sensor-based drip irrigation system to sweet basil plants in 440 mL pots is optimal for achieving both water use efficiency and VWC uniformity.
1. Introduction
Approximately 50% of the global population is experiencing severe water scarcity [1], and more than 70% of freshwater resources are used for agriculture, mostly for irrigation [2]. However, sufficient irrigation is crucial for crop growers to secure high-quality yields to meet consumer demand. Under-irrigation may lead to drought stress in plants, resulting in reduced photoassimilation, stunted plant growth, and poor crop quality [3,4]. In contrast, over-irrigation may increase the vulnerability of plants to diseases [5], induce hypoxia, and reduce photosynthesis and respiration rates, leading to inferior crop quality [6]. Over-irrigation also causes the leaching of fertilizers, leading to economic losses and environmental pollution [7]. Therefore, in consideration of the environmental effects of irrigation, stakeholders in the agri-food industry should implement efficient and effective irrigation [8].
Drip irrigation is considered one of the most efficient irrigation methods because it supplies water directly to plant roots, thereby minimizing evaporation and runoff [9]. To further enhance water use efficiency and maintain optimal moisture conditions in the root zone, soil moisture sensors, which provide quantitative data on moisture conditions, have been recommended [10]. Unlike traditional timer-based or empirical irrigation methods, soil moisture sensors provide accurate information on the amount of water and frequency of irrigation necessary for plants [11]. Among various types of soil moisture sensors, frequency domain reflectometry (FDR) sensors offer several advantages. They are reliable for taking measurements, affordable, and suitable for automated greenhouse crop irrigation systems [12,13]. Therefore, extensive research has been conducted using soil moisture sensors for plant water management in various crops under drip irrigation systems, focusing on determining the optimal irrigation amount, frequency, and thresholds [14,15,16,17].
Typically, only a few soil moisture sensors are utilized to monitor and control irrigation plots or replicates. Researchers and growers rely on this information for efficient irrigation decision-making, often adopting soil moisture sensor-based automated irrigation systems with the assumption that moisture level variability across replicates is negligible. However, this assumption warrants careful investigation because even accurate data on highly varied replicates may confuse agricultural researchers and growers. Furthermore, most crop growers prioritize production uniformity to maximize yield and secure profitability, as consistent crop growth and quality can reduce output variability and minimize losses [18]. Therefore, irrigation management practices should not only focus on water use efficiency but also on uniformity to minimize variability and ensure consistent crop production and profitability.
Most previous studies on drip irrigation uniformity have focused primarily on the uniform application of water within drip irrigation systems, aiming to deliver consistent amounts of water across the same irrigation plot. However, variations in the actual water content within individual pots across an irrigation plot have received little attention [19,20,21]. Although smaller amounts of water are used in drip irrigation to improve water use efficiency [22], this method can inadvertently increase variability in moisture content across a plot. Therefore, the objective of this study was to rigorously quantify the variability in substrate moisture contents among replicate pots within the same irrigation plot by continuously measuring the substrate water contents of each individual pot using soil moisture sensors. Our research focused on how different irrigation amounts affect both uniformity of substrate moisture and crop growth to identify the optimal irrigation amounts for achieving efficient and uniform irrigation practice and crop production using a drip irrigation system.
2. Materials and Methods
2.1. Plant Materials and Growth Environments
Sweet basil seeds (Ocimum basilicum L. ‘Genovese’, Asia Seed Co., Seoul, Republic of Korea) were planted in 128-cell trays containing a germinating medium (Sunshine Mix #5; Sun Gro Horticulture, Agawam, MA, USA) on 24 January 2022. After 4 weeks, the seedlings were transferred to 10 cm round pots (volume: 440 mL) filled with a growing medium (Sunshine Mix #4; Sun Gro Horticulture) mixed with controlled-release fertilizer (Multicote 6; NPK 14-14-14, Haifa Chemicals, Haifa, Israel) at a concentration of 4 g·L–1. During acclimation after transplanting, the plants were fully hand-irrigated daily until the third true-leaf stage to minimize biological and environmental variability. Eighty uniformly sized sweet basil plants were then selected to clearly assess irrigation effects. Of these, 16 were pre-harvested prior to the experiment to analyze their initial growth parameters, while the remaining 64 plants were organized into four replicates (blocks) with four sub-replicates in an irrigation plot (treatment × block) with four treatments.
The experiment was conducted in a greenhouse at Korea University in Seoul, Korea (at a latitude of 37° N and a longitude of 127° E). A temperature and humidity sensor (VP4; Meter Group, Pullman, WA, USA) and a quantum sensor (QS-Sun; Apogee Instruments, Logan, UT, USA) were used to monitor the growth environments in the greenhouse. The mean daily temperature, relative humidity, and light integral during the experiments were 22.8 ± 0.5 °C, 43.1 ± 9.6%, and 10.7 ± 4.2 mol·m−2·d−1, respectively (means ± standard deviations).
2.2. FDR Sensor-Based Drip Irrigation System
A total of 64 FDR-type soil moisture sensors (EC-5; Meter Group, Pullman, WA, USA) connected to a data logger (CR1000; Campbell Scientific, Logan, UT, USA) were used to measure the substrate volumetric water content (VWC) for each individual plant. The EC-5 sensors, which were powered at a 2500 mV excitation, were placed in the substrate at a 45° inclination toward the midpoint of the pot and connected to the data logger via multiplexers (AM 16/32B; Campbell Scientific, Logan, UT, USA). Prior to the experiment, substrate-specific sensor calibration coefficients were obtained, following the calibration procedure outlined in a previous study [23], to establish the following relationship with an R2 value of 0.98:
VWC (m3·m−3) = 0.001784 × sensor output (mV) − 0.5528
The hydraulic properties of the specific substrate used in the experiment were determined using a modular instrument (Hyprop; Meter Group). Irrigation events were monitored every 20 min, and if the average value of the four substrate VWCs in each irrigation plot dropped below 0.3 m3·m−3 (−10 kPa) (Figure 1), the data logger connected to a relay driver (SDM-CD16AC; Campbell Scientific, Logan, UT, USA) activated the solenoid valve (Bermad S-390T-2-R; Bermad, Kibbutz Evron, Israel) to irrigate tap water through a drip stake equipped with a pressure-compensated emitter (2 L·h−1) per plant. To verify uniform water emission among the drip stakes, the mean Christiansen uniformity coefficient was calculated to be 98.8% [24]. In order to ensure the same substrate VWC levels across all pots before initiating the treatments, the automated drip irrigation system was programmed to maintain irrigation thresholds and amounts at 0.5 m3·m−3 and 5.5 mL per application, respectively, for 3 days before initiating the treatments.
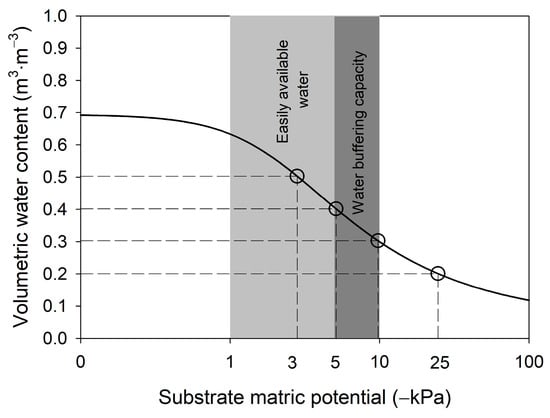
Figure 1.
The moisture release curve of the soilless substrate (Sunshine Mix #4; Sun Gro Horticulture) was determined using Hyprop (Meters Group). The point marked on the curve indicates the relationship between the established irrigation triggering threshold for volumetric water content and substrate matric potential.
2.3. Irrigation Amount per Application Treatment
Four irrigation amount (IA) treatments were applied to assess variability in VWC and plant growth across sub-replicates, depending on the IA per application. Each plant was irrigated at the 0.3 m3·m−3 VWC threshold with four different amounts of water per application: 5.5, 55, 110, and 165 mL, capable of increasing VWC by approximately 0.014, 0.14, 0.28, and 0.41 m3·m−3, respectively. The 5.5 mL IA treatment was selected to maintain the VWC at approximately 0.3 m3·m−3 within the water buffering capacity, while the 55, 110, and 165 mL IA treatments were selected to increase the VWC within the easily available water range (Figure 1).
2.4. Plant Harvest and Growth Measurement
To ensure clear physiological responses to the IA treatment, 64 sweet basil plants were harvested after two weeks of the experiment, prior to the onset of the reproductive phase. The photosynthetic parameters were assessed on the topmost, fully expanded leaves using a photosynthesis system (CIRAS-3; PP Systems, Amesbury, MA, USA) around noon, with a PPFD of 1000 μmol·s−1·m−2 and a CO2 concentration of 410 μmol·mol−1, considering the ambient greenhouse environment during the experiments. The maximum quantum yield of photosystem II (Fv/Fm) in the leaves was assessed using a chlorophyll fluorometer (Junior PAM; Heinz Walz GmbH, Effeltrich, Germany), following dark acclimation for 20 min, while the chlorophyll content of the other topmost fully expanded leaves was measured using a leaf chlorophyll meter (SPAD-502; Minolta, Osaka, Japan). Plant height, fresh weight, dry weight, and leaf area were measured to assess general plant growth. Leaf area was measured using a leaf area meter (LI-3100; LI-COR, Lincoln, NE, USA). Water use efficiency was determined by dividing the total dry weight of the plant by the total amount of irrigation applied throughout the experiment.
2.5. Quantifying the Variability of Substrate VWC and Plant Growth
The coefficient of variation (CV), calculated as the standard deviation divided by the mean or expressed as a percentage (standard deviation/mean or standard deviation/mean × 100), was employed to measure the extent of variability [25,26,27]. Variability in growth parameters within the irrigation plot was assessed across the treatments by determining the CVs of growth parameters among the sub-replicates at harvest.
2.6. Experimental Design and Statistical Analysis
A randomized complete block design with four blocks and four treatments was employed. Four plants from each irrigation plot were used as sub-replicates for the measurements. Statistical analysis was performed using Statistical Analysis Software (SAS 9.4, SAS Institute, Cary, NC, USA). Analysis of variance with a weighted fit was conducted to improve the accuracy and reliability of the analysis in cases of unequal variances across the treatments. Tukey’s honest significant difference test was performed to determine mean separation at α = 0.05 among the parameters of the treatments. To assess uniformity among the irrigation plots, 95% confidence intervals for the CV were obtained using the PROC MEANS procedure, and their differences at α = 0.05 were calculated through pairwise comparisons using the PROC TTEST procedure. Statistical software (SigmaPlot 14.5; Grafiti, Palo Alto, CA, USA) was used to generate graphs.
3. Results and Discussion
3.1. Effect of IA on the Variability of VWC
During the experiment, the changes in the VWC of the IA treatments displayed fluctuating patterns with various upsurges when irrigation occurred, depending on the IA treatments (Figure 2). The amplitude and frequency of the VWC fluctuations varied depending on the IA treatment, with higher IA treatments showing greater amplitude and lower frequency of VWC fluctuations. The VWC of the 5.5 mL IA treatment was maintained close to the 0.3 m3·m−3 threshold, and the 55 mL IA treatment showed VWC peaks around 0.4 m3·m−3, suggesting these two smaller IA treatments were insufficient to ensure that the substrate was fully drenched. Meanwhile, the VWC of both the 110 and 165 mL IA treatments reached similar VWC peaks, and the substrate was fully drenched, resulting in leaching. Throughout the experimental period, the average VWC values of the 5.5, 55, 110, and 165 mL IA treatments were 0.32, 0.37, 0.40, and 0.40 m3·m−3, respectively. These findings indicate that despite increased water application, IA exceeding 110 mL may result in the VWC peak reaching a plateau, leading to leaching.
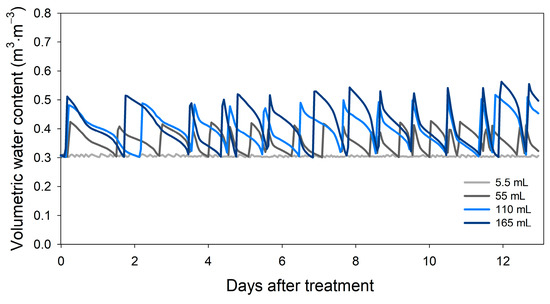
Figure 2.
Changes in the average substrate volumetric water content of sweet basil plants supplied with four different irrigation amounts per application (5.5, 55, 110, and 165 mL) using the frequency-domain reflectometry sensor-based drip irrigation system during a period of 14 days. Each line represents one of four replicates in this experiment due to different irrigation intervals across the replicates.
During the experimental period, the VWCs of the sub-replicate pots within the same irrigation plot were similar among the replicates in the 110 and 165 mL IA treatments, whereas the VWCs of the sub-replicate pots in the 5.5 and 55 mL IA treatments deviated over the experimental period (Figure 3), indicating increasing variability in VWC over time. When the variability was quantified as a CV value, the changes in VWC variability showed significant differences among the IA treatments as the plants grew (Figure 4). A comparison of the confidence intervals for CV of VWC revealed no significant differences in VWC variability among the IA treatments at the start of the experiment (p > 0.05) (Table 1). However, from 4 days after treatment (DAT), the 5.5 mL IA treatment exhibited significantly higher CV than the 110 and 165 mL IA treatments (p < 0.05). Subsequently, at 8 DAT, the VWC CV for the 5.5 mL IA treatment increased further (CV = 0.404), which was 5.5 and 5.4 times higher than that of the 110 mL (CV = 0.073) and 165 mL (CV = 0.075) IA treatments, respectively (p = 0.03 for both). At 12 DAT, the CV value for the 5.5 mL IA treatment reached 0.544, which was 4.8 and 5.7 times higher than that of the 110 mL (CV = 0.113) and 165 mL (CV = 0.095) IA treatments, respectively (p = 0.04 for both).
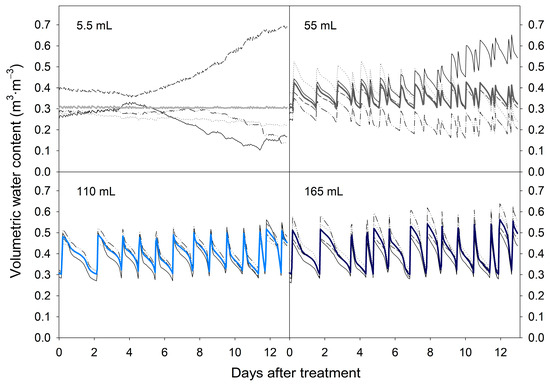
Figure 3.
Changes in substrate volumetric water content (VWC) were monitored over 14 days during the experiment using the frequency-domain reflectometry sensor-based drip irrigation system. Each graph shows the substrate VWC changes in an irrigation plot. The colored lines indicate the average VWC changes of the four sub-replicates, and the black lines indicate the VWC changes of each sub-replicate.
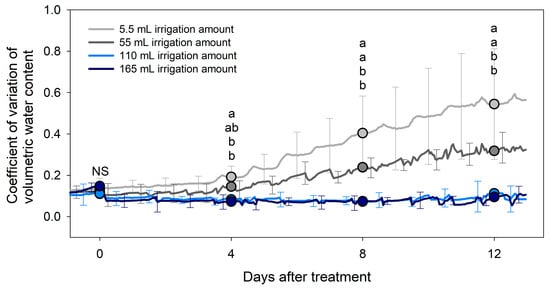
Figure 4.
Changes in the coefficient of variation of substrate volumetric water content (VWC) during the experiment using the frequency-domain reflectometry sensor-based drip irrigation system. Each line represents an average coefficient of variation value of VWC for each different irrigation amount treatment (5.5, 55, 110, and 165 mL per application). Mean separation was performed using pairwise t-tests comparing the confidence intervals of the coefficient of variation for VWC of each treatment at 0, 4, 8, and 12 days after treatment initiation, at α = 0.05. The same letter in the mean separation within the days after treatment is not significantly different. NS indicates no significant differences between treatments. Error bars represent standard deviation (n = 4).

Table 1.
Mean, standard deviation, and lower and upper bounds of the 95% confidence intervals for the coefficient of variation of volumetric water content (VWC) at 0, 4, 8, and 12 days after treatment (n = 4). Treatments consisted of four different irrigation amount treatments (5.5, 55, 110, and 165 mL per application). The coefficients of variation for VWC were calculated based on the VWC variation within each irrigation plot. Mean separation was performed using pairwise t-tests comparing the confidence intervals of the coefficient of variation for VWC of each treatment, at α = 0.05. The same letter in the mean separation within the days after treatment is not significantly different. NS indicates no significant differences between treatments.
Thus, the uniformity of the VWC of the sub-replicates within the same irrigation plot that received the 5.5 mL IA treatment was drastically lower than that of the sub-replicates in the 110 and 165 mL IA treatments. For example, in an irrigation plot with the 5.5 mL IA treatment, initial sub-replicate VWC values were 0.34, 0.31, 0.31, and 0.28 m3·m–3, respectively (average VWC = 0.31 m3·m−3, CV = 0.08). However, by 8 DAT, sub-replicate VWC values had shifted to 0.48, 0.36, 0.28, and 0.10 m3·m−3 (average VWC = 0.30 m3·m−3, CV = 0.40). Despite this, the 110 and 165 mL IA treatments maintained relatively uniform VWC levels at 8 DAT. This suggests that plants in the irrigation plot supplied with a sufficient amount but at a lower frequency were able to maintain uniform VWC throughout the experiment.
3.2. Effect of IA on the Variability of Sweet Basil Growth
Although higher IA treatment improved VWC uniformity among the sub-replicates in an irrigation plot, there were no significant differences in the uniformity of growth or physiological responses of the plants at the final harvest across the IA treatments (Table 2). Additionally, aside from root growth (p = 0.017 and 0.009 for fresh and dry root weight), other physiological responses did not differ significantly among the IA treatments. These findings suggest that maintaining a VWC threshold of 0.3 m3·m−3 resulted in comparable growth and physiological responses regardless of the IA treatment.
Table 2.
The general growth of sweet basil plants supplied with four different irrigation amounts (5.5, 55, 110, and 165 mL per application) was measured 13 days after treatment. Different letters indicate a significant difference between treatments using Tukey’s honest significant difference test at α = 0.05. The variability of sub-replicates for growth parameters was shown as the coefficient of variation values. The coefficients of variation for growth parameters were calculated based on the growth variation within each irrigation plot.
As mentioned earlier, the VWC values of the sub-replicates in the 5.5 mL IA treatment ranged from 0.10 to 0.48 m3·m–3 at 8 DAT, potentially leading to varied physiological responses due to differences in VWC across the sub-replicates. However, despite this variability in substrate VWC within the irrigation plot, there were no significant differences in plant growth or physiological responses, resulting in uniform crop growth across the IA treatments. This may be because the variations in VWC were balanced by corresponding differences in plant growth. For example, a replicate with larger plants would use more water, thus reducing its VWC more than other replicates. In turn, this lower VWC could slow plant growth, while higher VWC in other replicates with smaller plants would support better plant growth. As a result, plant growth appeared similar at the end of production, despite differences in VWC across the sub-replicates. Nevertheless, this outcome may be due to the relatively short duration of the experiment, and prolonged variability in moisture levels could lead to greater variability in plant growth over time. Therefore, to ensure uniform water management in drip irrigation systems, careful consideration must be given to factors such as appropriate IA per application.
Although the overall growth and physiological responses of sweet basil were uniform across the IA treatments (Table 2 and Table 3), the total amount of water applied varied significantly among them (Figure 5). The higher IA treatments used more water than the lower IA treatments; in particular, the 165 mL IA treatment used twice as much water as the 5.5 mL IA treatment. While the 110 and 165 mL IA treatments exhibited similar VWC fluctuations, the 165 mL IA treatment used 47% more water than the 110 mL IA treatment. Consequently, the lower IA treatments demonstrated higher water use efficiency, as they achieved comparable growth with reduced water consumption. Therefore, supplying 110 mL irrigation water to 440 mL pots is the most optimal IA for ensuring both water use efficiency and VWC uniformity.
Table 3.
Physiological responses of sweet basil plants supplied with four different irrigation amounts (5.5, 55, 110, and 165 mL per application) were measured 13 days after treatment. The variability of sub-replicates for physiological responses was shown as the coefficient of variation values. The coefficients of variation for physiological responses were calculated based on the variation within each irrigation plot.
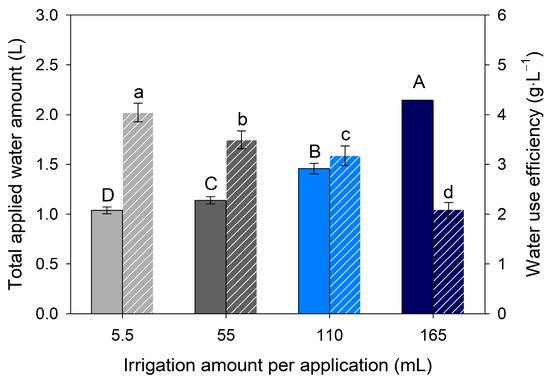
Figure 5.
Total applied water amount and water use efficiency over the 14-day experimental period using a frequency-domain reflectometry sensor-based drip irrigation system. Solid bars represent the total applied water amount, while slashed bars indicate water use efficiency for each irrigation amount treatment (5.5, 55, 110, and 165 mL). Different letters indicate significant differences among treatments using Tukey’s honest significant difference test at α = 0.05. Error bars indicate standard error (n = 4).
4. Conclusions
When using drip irrigation in potted plant production, small amounts of water applied at frequent intervals have been reported to save water while maintaining high quality, resulting in higher water use efficiency compared to larger amounts of water applied at less frequent intervals. However, our research found that this strategy can introduce significant variability in water management within the irrigation plot. Uniform water management allows all plants to receive equal access to the necessary water throughout their growth stages, protecting them from water stress and disease by avoiding both over- and under-irrigation in some areas. This study quantified the optimal IA for drip irrigation to achieve a balance between water use efficiency and uniformity. Implementing this approach can simplify the workload of growers, enhance yield predictability, and minimize financial losses, ultimately improving profitability. Further research involving an extended cultivation period and scaling up the experiment is necessary to validate the findings and facilitate their application to large-scale field conditions. Additionally, investigating the underlying factors affecting substrate moisture content uniformity is required for a deeper understanding.
Author Contributions
Conceptualization, S.L. and J.K.; methodology, S.L., L.S., and J.K.; software, S.L.; validation, L.S. and J.K.; formal analysis, S.L.; investigation, S.L.; resources, J.K.; data curation, S.L.; writing—original draft preparation, S.L.; writing—review and editing, L.S. and J.K.; visualization, S.L.; supervision, J.K.; project administration, J.K.; funding acquisition, J.K. All authors have read and agreed to the published version of the manuscript.
Funding
This research was funded by the Rural Development Administration in Korea, grant number PJ015643.
Data Availability Statement
The original contributions presented in this study are included in the article. Further inquiries can be directed to the corresponding author.
Conflicts of Interest
The authors declare no conflicts of interest.
References
- IPCC. Water in Climate Change 2022: Impacts, Adaptation and Vulnerability. 2022. Available online: https://www.ipcc.ch/report/ar6/wg2/chapter/chapter-4/ (accessed on 28 March 2024).
- FAO. The State of the World’s Land And Water Resources For Food and Agriculture–Systems at Breaking Point in Synthesis Report 2021. 2021. Available online: https://openknowledge.fao.org/items/55def12b-2a81-41e5-91dc-ac6c42f1cd0f (accessed on 28 March 2024).
- Farooq, M.; Wahid, A.; Kobayashi, N.; Fujita, D.; Basra, S.M.A. Plant drought stress: Effects, mechanisms and management. Agron. Sustain. Dev. 2009, 29, 185–212. [Google Scholar] [CrossRef]
- Hussain, M.; Malik, M.A.; Farooq, M.; Ashraf, M.Y.; Cheema, M.A. Improving drought tolerance by exogenous application of glycinebetaine and salicylic acid in sunflower. J. Agron. Crop Sci. 2008, 194, 193–199. [Google Scholar] [CrossRef]
- Nguyen, V.T.; Vuong, T.D.; Vantoai, T.; Lee, J.D.; Wu, X.; Mian, M.A.R.; Dorrance, A.E.; Shannon, J.G.; Nguyen, H.T. Mapping of quantitative trait loci associated with resistance to Phytophthora sojae and flooding tolerance in soybean. Crop Sci. 2012, 52, 2481–2493. [Google Scholar] [CrossRef]
- Perata, P. Ethylene signaling controls fast oxygen sensing in plants. Trends Plant Sci. 2020, 25, 3–6. [Google Scholar] [CrossRef] [PubMed]
- Warsaw, A.L.; Fernandez, R.T.; Cregg, B.M.; Andresen, J.A. Container-grown ornamental plant growth and water runoff nutrient content and volume under four irrigation treatments. HortScience 2009, 44, 1573–1580. [Google Scholar] [CrossRef]
- Knox, J.W.; Kay, M.G.; Weatherhead, E.K. Water regulation, crop production, and agricultural water management–Understanding farmer perspectives on irrigation efficiency. Agric. Water Manag. 2012, 108, 3–8. [Google Scholar] [CrossRef]
- Alcon, F.; Navarro, N.; de-Miguel, M.D.; Balbo, A.L. Drip irrigation technology: Analysis of adoption and diffusion processes. In Sustainable Solutions for Food; Sarkar, A., Sensarma, S., vanLoon, G., Eds.; Springer: Cham, Switzerland, 2019; pp. 269–285. [Google Scholar]
- Kumar, J.; Patel, N.; Rajput, T.B.S. Development and integration of soil moisture sensor with drip system for precise irrigation scheduling through mobile phone. J. Appl. Nat. Sci. 2016, 8, 1959–1965. [Google Scholar] [CrossRef]
- Lea-Cox, J.D. Using wireless sensor networks for precision irrigation scheduling. In Problems, perspectives and Challenges of Agricultural Water Management; Manish, K., Ed.; IntechOpen Press: Rijeka, Croatia, 2012; pp. 233–258. [Google Scholar]
- Jones, H.G. Irrigation scheduling: Advantages and pitfalls of plant-based methods. J. Exp. Bot. 2004, 55, 2427–2436. [Google Scholar] [CrossRef]
- van Iersel, M.W.; Chappell, M.; Lea-Cox, J.D. Sensors for improved efficiency of irrigation in greenhouse and nursery production. HortTechnology 2013, 23, 735–746. [Google Scholar] [CrossRef]
- Irmak, S.; Djaman, K.; Rudnick, D.R. Effect of full and limited irrigation amount and frequency on surface drip-irrigated maize evapotranspiration, yield, water use efficiency and yield response factors. Irrig. Sci. 2016, 34, 271–286. [Google Scholar] [CrossRef]
- Lee, G.; Kim, J. Sufficient light intensity is required for the drought responses in sweet basil (Ocimum basilicum L.). Agronomy 2024, 14, 2101. [Google Scholar] [CrossRef]
- Nam, S.; Hong, C.; An, S.K.; Kim, J. Low substrate water content is efficient for the performance of Ficus pumila ‘Variegata’ indoors. Hortic. Environ. Biotechnol. 2023, 64, 583–591. [Google Scholar] [CrossRef]
- Rock, R.R.; An, S.K.; Kim, J. Optimum moisture conditions for English lavender cuttings are drier for root development than shoot development. Horticulturae 2022, 8, 753. [Google Scholar] [CrossRef]
- Smith, O.M.; Cohen, A.L.; Rieser, C.J.; Davis, A.G.; Taylor, J.M.; Adesanya, A.W.; Jones, M.S.; Meier, A.R.; Reganold, J.P.; Orpet, R.J.; et al. Organic farming provides reliable environmental benefits but increases variability in crop yields: A global meta-analysis. Front. Sustain. Food Syst. 2019, 3, 82. [Google Scholar] [CrossRef]
- Guan, H.; Li, J.; Li, Y. Effects of drip system uniformity and irrigation amount on cotton yield and quality under arid conditions. Agric. Water Manag. 2013, 124, 37–51. [Google Scholar] [CrossRef]
- Jobbágy, J.; Dančanin, P.; Krištof, K.; Maga, J.; Slaný, V. Evaluation of the quality of irrigation machinery by monitoring changes in the coefficients of uniformity and non-uniformity of irrigation. Agronomy 2021, 11, 1499. [Google Scholar] [CrossRef]
- Xing, S.; Du, K.; Liu, N.; Li, M.; Li, W.; Zhang, J.; Yin, F.; Zhang, J.; Wang, Z. Effect of dynamic pressure and emitter type on irrigation and fertigation uniformity of drip irrigation systems. Agric. Water Manag. 2025, 312, 109418. [Google Scholar] [CrossRef]
- Nam, S.; Kang, S.; Kim, J. Maintaining a constant soil moisture level can enhance the growth and phenolic content of sweet basil better than fluctuating irrigation. Agric. Water Manag. 2020, 238, 106203. [Google Scholar] [CrossRef]
- Rhie, Y.H.; Kim, J. Changes in physical properties of various coir dust and perlite mixes and their capacitance sensor volumetric water content calibrations. HortScience 2017, 52, 162–166. [Google Scholar] [CrossRef]
- Christiansen, J.E. The uniformity of application of water by sprinkler systems. Agric. Eng. 1941, 22, 89–92. [Google Scholar]
- Li, M.; Li, J.; Xie, F.; Zhou, J.; Sun, Y.; Luo, Y.; Zhang, Y.; Chen, Q.; Wang, Y.; Lin, Y.; et al. Combined evaluation of agronomic and quality traits to explore heat germplasm in celery (Apium graveolens L.). Sci. Hortic. 2023, 317, 112039. [Google Scholar] [CrossRef]
- Li, Y.; Zhang, P.; Chachar, S.; Xu, J.; Yang, Y.; Guan, C. A comprehensive evaluation of genetic diversity in persimmon (Diospyros kaki Thunb.) germplasms based on large-scale morphological traits and SSR markers. Sci. Hortic. 2023, 313, 111866. [Google Scholar] [CrossRef]
- Ramjattan, R.; Umaharan, P. Interrelationships between yield and its components in hot pepper (Capsicum chinense Jacq.). Sci. Hortic. 2021, 287, 110254. [Google Scholar] [CrossRef]
Disclaimer/Publisher’s Note: The statements, opinions and data contained in all publications are solely those of the individual author(s) and contributor(s) and not of MDPI and/or the editor(s). MDPI and/or the editor(s) disclaim responsibility for any injury to people or property resulting from any ideas, methods, instructions or products referred to in the content. |
© 2025 by the authors. Licensee MDPI, Basel, Switzerland. This article is an open access article distributed under the terms and conditions of the Creative Commons Attribution (CC BY) license (https://creativecommons.org/licenses/by/4.0/).