Article

Laboratory Optimization of Poultry Feather Hydrolysate Application for Soil Fertility: Effects of Soil Texture and Hydrolysate State and Addition Rate

Biology Centre of the Czech Academy of Sciences, Institute of Soil Biology and Biogeochemistry, Na Sádkách 7, CZ-37005 České Budějovice, Czech Republic
*
Author to whom correspondence should be addressed.
Agronomy 2025, 15(7), 1638; https://doi.org/10.3390/agronomy15071638
Submission received: 27 May 2025 / Revised: 30 June 2025 / Accepted: 3 July 2025 / Published: 5 July 2025
(This article belongs to the Section Farming Sustainability)

Abstract

The application of soil organic amendments is a well-established approach to enhancing soil fertility; yet the effects of poultry feather hydrolysate (PFH) on temperate coarse-textured agricultural soils remain underexplored. A six-month microcosm experiment was conducted to determine the effects of PFH in different states (liquid or solid) and addition rates (none, low, or high; i.e., 0, 4, or 8 t dw ha−1, respectively) on microbial activity, nutrient availability and retention, and organic matter (OM) stabilization in two coarse-textured soils (loamy sand or sandy loam). Sandy loam soil exhibited a stronger response to PFH application, supporting 20% higher microbial activity, 35% higher nutrient retention, and 89% higher OM content in soil aggregates compared to loamy sand soil, reflecting enhanced OM stabilization. Moreover, PFH in the liquid state demonstrated more prolonged microbial activity and more sustained release of nutrients compared to the solid state. Finally, at the end of incubation, the high addition rate of PFH significantly increased soil nutrient content by 106%, while the low addition rate limited the increase to 39%, both compared to the no addition rate. Overall, the results suggest that PFH, particularly in the liquid state and at the high addition rate, serves as an effective soil organic amendment, enhancing microbial activity and soil fertility while emphasizing the importance of soil texture in optimizing its application.

1. Introduction

With the rising global population, ensuring high agricultural productivity while maintaining soil quality is crucial. Extensive dependence on synthetic fertilizers has led to soil degradation, causing loss of microbial diversity and depletion of nutrients and soil organic matter (SOM) [1]. These issues underscore the need for more sustainable soil management strategies that maintain soil quality and improve the long-term resilience of agricultural systems. SOM is vital for improving soil quality, water retention, and microbial activity, playing a key role in nutrient cycling and carbon (C) sequestration [2,3]. However, maintaining SOM is challenging in coarse-textured soils, which generally have low SOM content and poor water-holding capacity, making them prone to degradation [4]. To address these challenges, organic amendments have gained increasing attention as a means to improve SOM levels and overall soil quality [5]. Organic amendments, such as hydrolysates produced from organic materials, offer a promising solution due to their high bioavailability and nutrient-rich composition [6,7,8]. However, little is known about their application methods and consecutive effects on agricultural soils.
Hydrolysates are organic substances produced through enzymatic, chemical, or microbial hydrolysis of complex organic materials into bioavailable compounds like amino acids, peptides, sugars, and mineral nutrients [6,9,10]. Animal-based protein hydrolysates have been used in agriculture for over a decade due to their sustainability and soil-enriching properties [7,11,12]. Hydrolysate derived from poultry feather hydrolysis has emerged as a promising agricultural amendment due to its high keratin content (80–90%), which, when broken down by keratinolytic or proteolytic enzymes, releases bioactive amino acids that promote plant growth [11,13,14], enhance crop yield and biomass quality [15], and develop tolerance for a wide range of abiotic stresses [16]. Rich in organic C, nitrogen (N), and trace elements, poultry feather hydrolysate (PFH) has been reported to enhance microbial activity [15,17], ameliorating uptake and utilization of soil nutrients [18,19]. Additionally, PFH contributes to soil structural improvement, enhancing water retention, aeration, and resistance to erosion [20,21]. Due to its sticky nature, PFH can potentially help in SOM stabilization either by forming soil aggregates or by adsorbing onto mineral particles and thus may promote C sequestration [22]. However, these results mostly originate from tropical and subtropical fine-textured soils [6,8,11,14], whereas the effects on coarse-textured temperate soils remain largely unexplored.
The effect of PFH application on different soil types depends on their texture and thus retention capacity. In finer-textured soils like sandy loam, PFH application has been found to enhance microbial activity and nutrient availability more effectively than in coarser-textured soils like loamy sand [22]. This is attributed to the smaller size and relatively greater surface area of sandy loam soil particles, which promote stronger adsorption of PFH and prolong nutrient availability. Additionally, a study demonstrated that organic amendments significantly improved soil physical properties in sandy loam soils by increasing water retention through modifying the pore structure, which could be relevant to understanding the mechanisms by which PFH improves soil aggregation [23]. Given that fine-textured soils have a high capacity for adsorption and retention of organic amendments, PFH may be more prone to leaching in coarse-textured loamy sand soils due to their lower adsorption capacity, reducing its effectiveness over time. However, despite the recognized potential of PFH, studies on its effects across different soil types, particularly in coarse-textured soils, remain limited.
Moreover, the effectiveness of PFH in liquid and solid states, as well as their persistence in the soil environment, remains unexplored. Liquid PFH, being the original form of production, infiltrates the soil more rapidly, potentially enhancing immediate nutrient availability but with a shorter residence time. In contrast, solid PFH, produced by drying from the liquid state, may potentially persist longer in the soil due to lower nutrient mobility, providing sustained nutrient release over longer periods. Thus, understanding these differences is essential for optimizing the PFH application method based on soil properties and desired agronomic outcomes. The impact of PFH application on soil properties can also be influenced by its addition rate, with higher rates potentially enhancing long-term benefits [18,24]. While previous studies have examined the effects of hydrolysate addition rates on plant physiology and metabolism [16,18], the effects of different addition rates on soil are less known.
In the present study, a six-month laboratory microcosm incubation experiment was conducted using temperate coarser-textured (loamy sand) and finer-textured (sandy loam) soils with either no, low (4 t dw ha−1), or high (8 t dw ha−1) addition rates of PFH in either the liquid or solid state. The microbial activity of the soil and available nutrient content in the soil leachates were analyzed during the whole incubation period. In addition, soil physical, chemical, and microbial properties were analyzed at the end of incubation. The present study aimed to test three hypotheses: (1) the effect of PFH on the soil properties will be stronger in sandy loam than in loamy sand soil due to its finer texture which is prone to hydrolysate adsorption, (2) the effect of PFH in the solid state will be stronger and will last longer than in the liquid state due to generally lower availability, and (3) the effect at the high addition rate of PFH will be stronger and will last longer than the effect at the low addition rate due to higher availability. By addressing these hypotheses, the study sought to elucidate the mechanisms by which PFH contributes to soil health improvements in coarse-textured soils and to provide practical insights for optimizing its use in sustainable agricultural practices.

2. Materials and Methods

2.1. Collection and Preparation of Soils and Hydrolysate

Soils were collected from two fields under conventional farming near České Budějovice (Czech Republic; 49°01′38″ N, 14°27′51″ E and 49°02′13″ N, 14°27′46″ E, respectively) in March 2022. Soils (Fluvisols, WRB) were collected from a 0–10 cm depth at 10 locations in a 0.25 ha area. The collected soils were thoroughly mixed, passed through a 2 mm sieve, and stored at 4 °C before being used in the experiment. The hydrolysate was prepared from waste chicken feathers (directly from production without any treatment) with a water content of approximately 35 wt. % (Rabbit Trhový Štěpánov a.s., Czech Republic) in a batch stirred reactor. Exactly 2 kg of feathers was put into a 25 L reactor together with 100 g of malic acid and 15 L of water, and the batch was heated to a temperature of 115–125 °C. After five hours, the reactor was cooled down and the reaction product separated by filtration into liquid hydrolysate (min. 97% wt peptides) and solid residue (below 3% wt). Approximately 15–17 L of liquid hydrolysate was prepared from one batch and stored at 4 °C before use. A part of the hydrolysate was freeze-dried and stored as a solid in a dry and dark location before use.
The properties of the collected soils and hydrolysate are listed in Table 1. Organic matter (OM) content was determined based on loss on ignition at 450 °C for 5 h. For determination of the contents of total organic C (TOC), total N (TN), and total P (TP), air-dried samples were ball-milled and analyzed using a Flash Elemental Analyzer (Thermo Scientific) (TOC and TN) or inductively coupled plasma optical emission spectroscopy (ICP-OES) (TP). Dissolved organic C (DOC), dissolved N (DN), and dissolved P (DP) were extracted in deionized water (dH2O) (1:10 sample:dH2O ratio) and analyzed in leachates using a TOC-LCPH/CPN analyzer (Shimadzu, Kyoto, Japan) (DOC and DN) and spectrophotometry according to Murphy and Riley (1962) (DP) [25]. pH was assessed in a 1:10 sample:dH2O suspension using a glass electrode. Microbial biomass C and N (Cmic and Nmic) were extracted using the fumigation–extraction method [26] and measured using a TOC analyzer (model TOC-LCPH/CPN, Shimadzu). Water-holding capacity (WHC) was calculated as the difference between the weight of a sample saturated with water over 1 h and allowed to drain over 3 h and the weight of an oven-dried sample divided by the weight of the oven-dried sample. Soil texture was determined based on wet sieving and sedimentation according to Gee and Bauder (1986) [27]. The soils were characterized as loamy sand with 71 ± 1.4% sand (2000–63 µm), 23 ± 1.1% silt (63–2 µm), and 13 ± 0.3% clay (<2 µm) and sandy loam with 64 ± 1.2% sand (2000–63 µm), 26 ± 1.1% silt (63–2 µm), and 18 ± 0.5% clay (<2 µm) (USDA).

2.2. Microcosm Experiment

An experiment was conducted using microcosms that enabled respiration measurements and leachate collection in both the sandy loam and loamy sand soil types (S) in different states (ST; solid or liquid) and addition rates (AR; 0, 4, or 8 t dw ha−1) as described in Jílková et al. (2019) [28]. A 100 g quantity of fresh soil was packed into each microcosm chamber to a 1.0 g cm−3 dry bulk density, resulting in a soil profile height of 4 cm. The microcosm chambers were treated with 0, 1, or 2 g dry weight of hydrolysate applied onto the soil surface. These amounts corresponded to 66 mL of dH2O (0 g; no addition), 33 mL of liquid hydrolysate + 33 mL of dH2O (1 g; low addition rate), 66 mL of liquid hydrolysate (2 g; high addition rate), 1 g of solid hydrolysate + 66 mL of dH2O (low addition rate), and 2 g of solid hydrolysate + 66 mL of dH2O (high addition rate). The amount of hydrolysate resulted in an addition of 0 t dw ha−1, 4 t dw ha−1 (low addition rate), or 8 t dw ha−1 (high addition rate) [29,30]. Each treatment had four replicates, giving a total of 40 microcosms.
Microcosms were incubated at ~20 °C for 3 months (April–June 2022) and, during the incubation, microcosms were watered with 65 mL of dH2O every 2 weeks (corresponding to a mean annual precipitation of 676 mm, which is typical for the area where the soil was collected). Soil leachates were collected at the bottom of each microcosm on days 0, 16, 29, 43, 57, and 85 and were stored at –20 °C until they were analyzed for DOC, DN, and DP as described earlier. Soil respiration was determined on days 17, 30, 44, 58, and 86, which in each case was 1 day after the microcosms were watered. Gas samples were analyzed within 24 h with an HP 5890 gas chromatograph. Microcosms were destructively harvested at the end of the experiment (day 86). The soil was homogenized and used for the following physical, chemical, and microbial analyses.

2.3. Soil Analyses

Content of OM, DOC, DN, DP, pH, Cmic and Nmic, and WHC were analyzed in the harvested soil at the end of the experiment (day 86) as described earlier. In addition, physical fractionation was used to separate the soil samples into three organic and/or mineral fractions as described in Kellerová et al. (2024) [31]. In brief, 20 g of an air-dried soil sample was gently submerged in 100 mL of sodium polytungstate (SPT) solution (density = 1.6 g cm−3) and left overnight to separate the light fraction (<1.6 g cm−3; free particulate OM (fPOM) fraction) and the heavy fraction (>1.6 g cm−3). The heavy fraction was subjected to ultrasonication at 440 J mL−1 in SPT and was then centrifuged at 1370× g for 30 min. The light fraction represented POM occluded in aggregates (the oPOM fraction) and the heavy fraction represented mineral-associated OM (the MAOM fraction). All three fractions were washed thoroughly with dH2O until the conductivity decreased below 5 µS for the POM fractions and below 50 µS for the MAOM fraction. The fractions were dried at 40 °C to a constant weight, ball-milled, and analyzed for TOC using a TOC-LCPH/CPN model TOC analyzer coupled with an SSM-5000A solid sample module (Shimadzu).

2.4. Statistical Analysis

The effects of soil type, hydrolysate addition rate, and physical state (solid/liquid) on respiration and nutrient content in the leachates during incubation were tested using three-way repeated measures ANOVAs. All three factors (soil type, hydrolysate addition rate, and physical state) were treated as fixed effects. The effects of the same fixed factors on cumulative respiration, nutrient content in leachates, and soil properties at the end of incubation were assessed using three-way ANOVAs. When tests indicated significant differences, Tukey LSD post hoc tests were used to compare means. A Fisher LSD test was performed to compare means for TOC content in the soil fraction at the end of incubation. Dependent variables were log-transformed to satisfy the assumptions of normality and homoscedasticity where needed. Post hoc test assumptions including independence of observations, normality of data within each group, and homogeneity of variance across groups have been met. Statistica 13 (StatSoft Inc., Hamburg, Germany) was used for statistical analyses.

3. Results

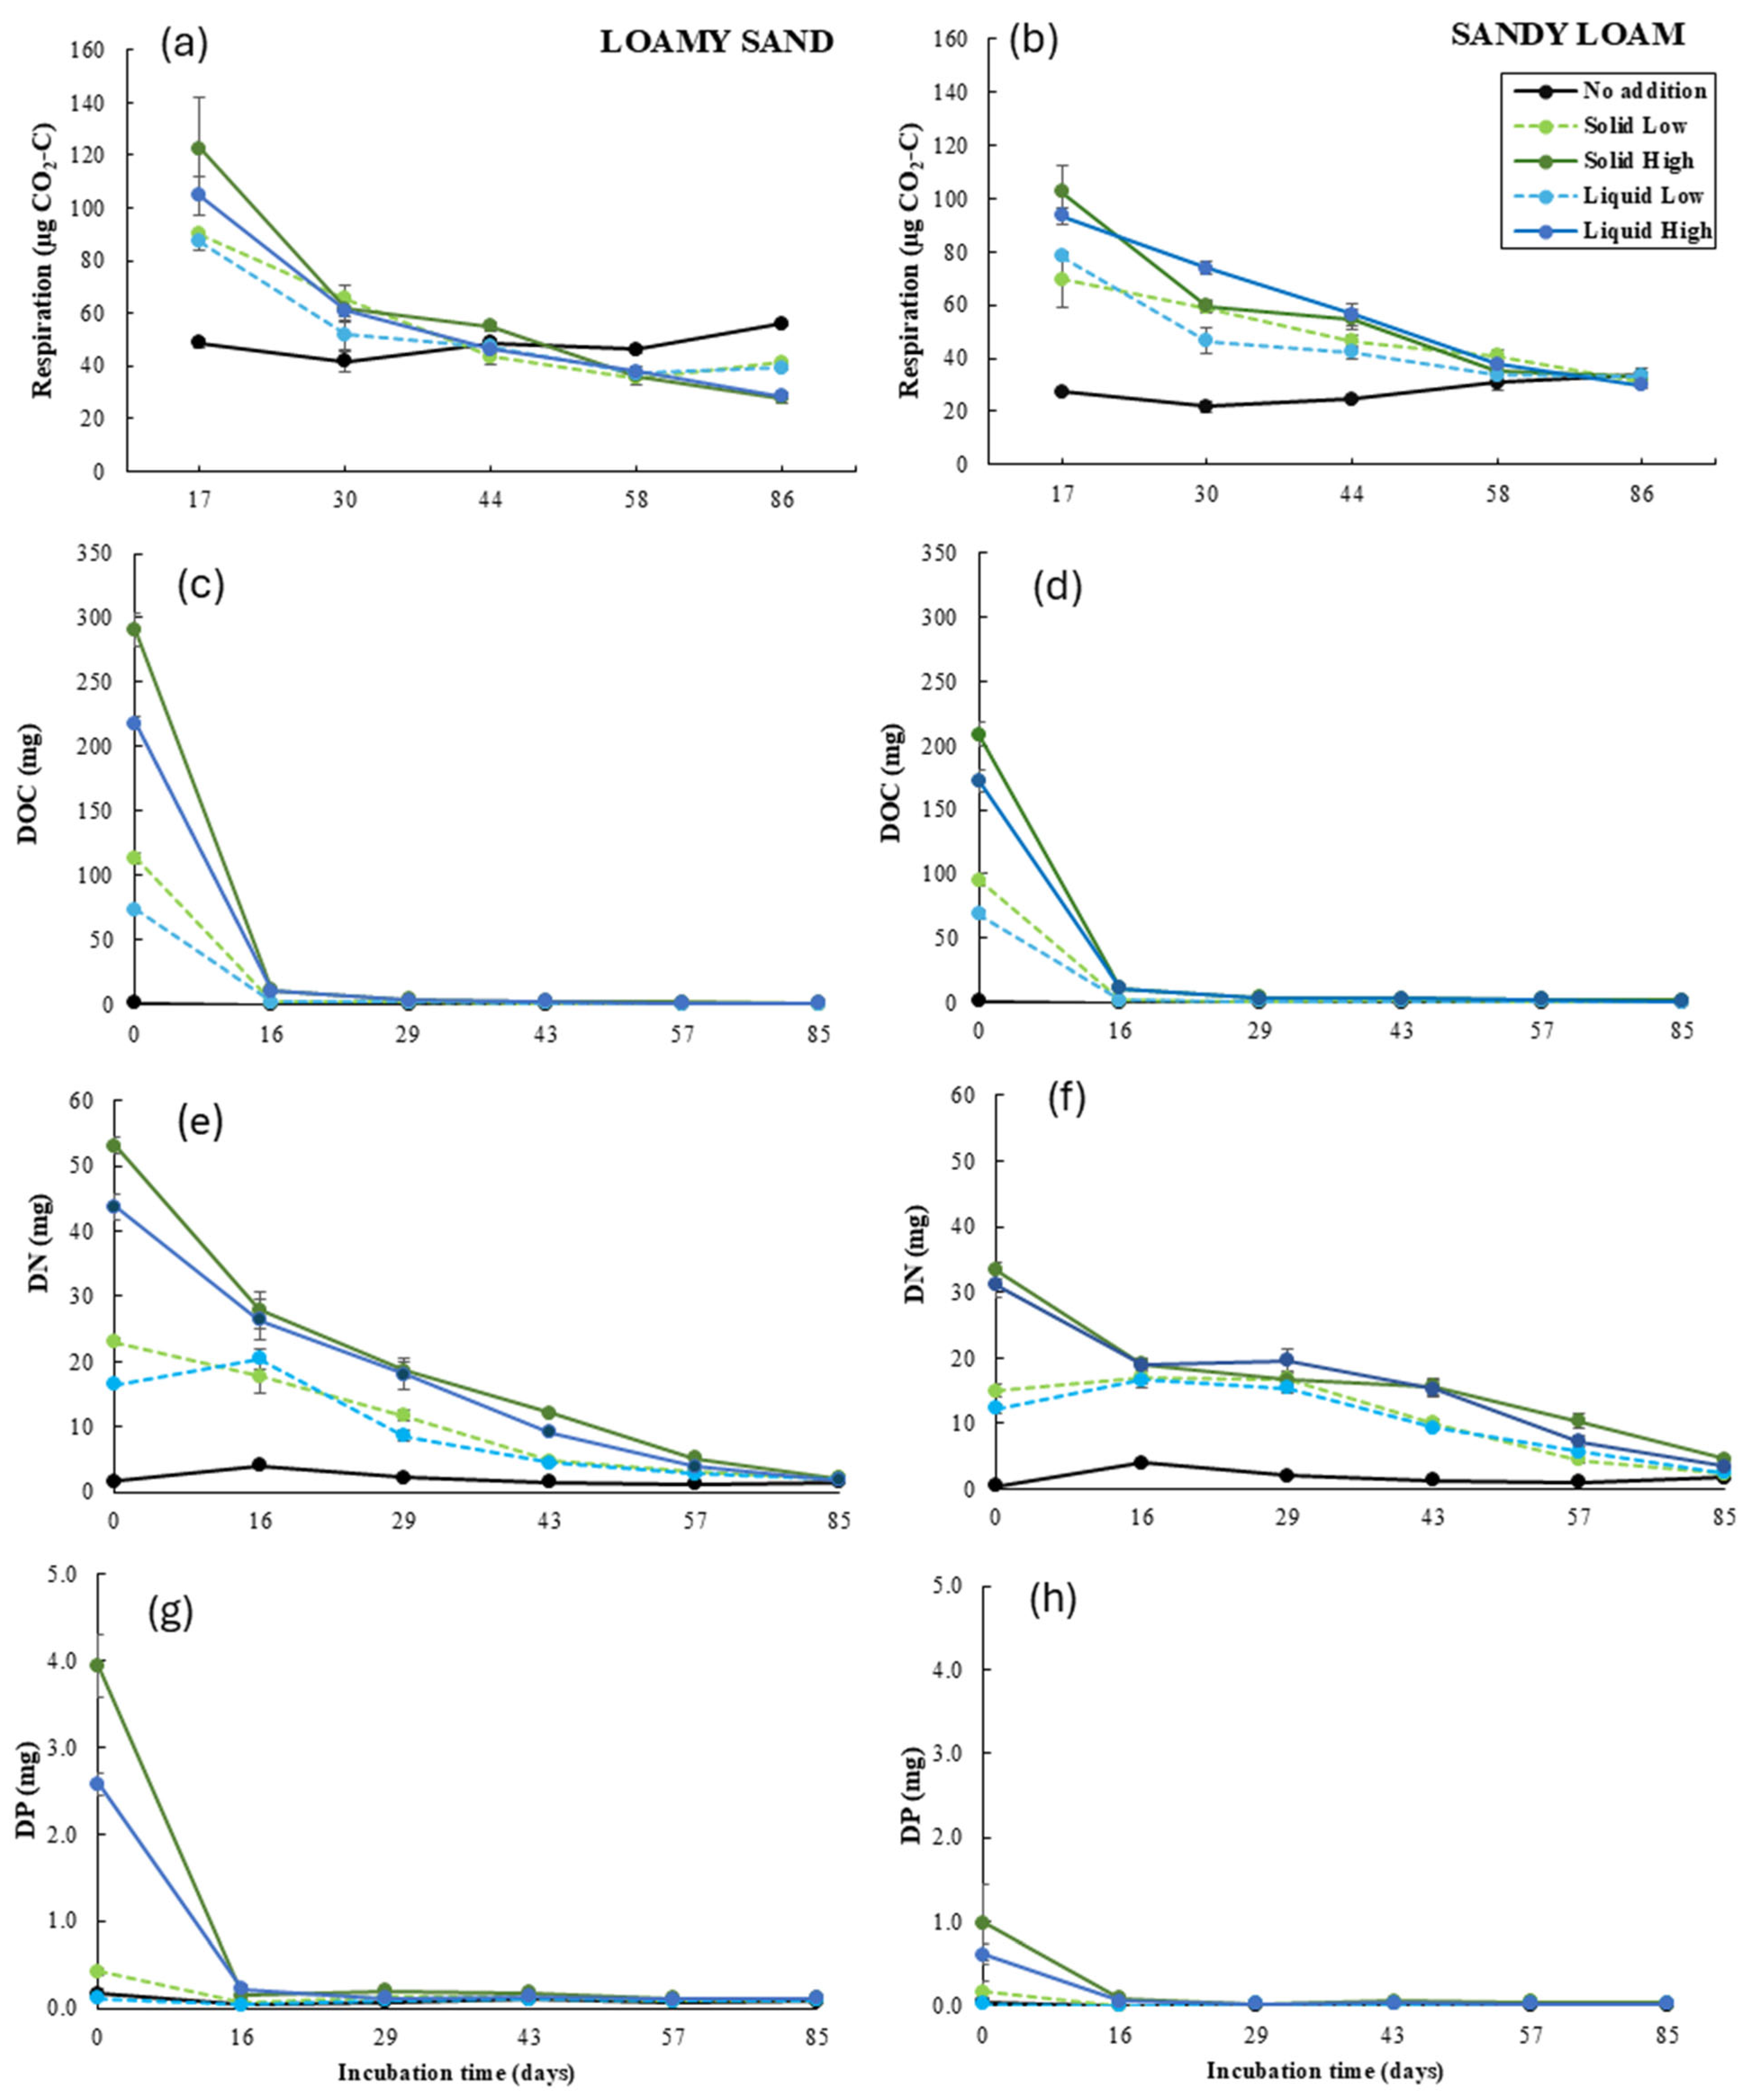
3.1. Soil Respiration and Nutrient Content in the Leachates During Incubation

Soil respiration during the incubation period was affected by the soil type (F1,36 = 60.8, p < 0.001) and the addition rate (F2,36 = 102.9, p < 0.001), but not by the state (F1,36 = 1.7, p > 0.05). Respiration in loamy sand soil was on average 78% higher than in sandy loam soil and respiration at the low and high addition rates was on average 38% and 55% higher than at the no addition rate, respectively (Figure 1a,b). The effect of the addition rate differed over the course of incubation (F8,144 = 68.0, p < 0.001), with the highest respiration at the beginning of incubation (day 17), followed by a steep decrease at both addition rates to the level of respiration at the no addition rate until day 58. However, respiration at the high addition rate decreased more steeply than at the low addition rate. At the end of incubation (day 86), respiration at both addition rates was on average 26% lower than at the no addition rate. Respiration during the incubation period was also affected by the interaction of the soil type and the addition rate (F2,36 = 27.8, p < 0.001). The effect of the addition rate was stronger in sandy loam soil than in loamy sand soil, with on average 74% and 109% (sandy loam) and 11% and 20% (loamy sand) higher values at the low and high addition rates, respectively, than at the no addition rate.
DOC content in the leachates during the incubation period was affected by the soil type (F1,36 = 49.6, p < 0.001), the addition rate (F2,36 = 1588.3, p < 0.001), and the state (F1,36 = 74.2, p < 0.001). DOC content in loamy sand soil was on average 24% higher than in sandy loam soil; DOC content at the low and high addition rates was on average 24 times (2352%) and 62 times (6236%) higher than at the no addition rate, respectively, and DOC content in the solid state was on average 31% higher than in the liquid state (Figure 1c,d). The effect of the addition rate differed over the course of incubation (F10,180 = 1363.6, p < 0.001), with the highest DOC content at the beginning of incubation (day 0), followed by a steep decrease in both addition rates to the level of DOC content at the no addition rate until day 29. However, DOC content at the high addition rate decreased more steeply than at the low addition rate. DOC content was also affected by the interaction of the soil type and the addition rate (F2,36 = 28.9, p < 0.001), with DOC content at the high addition rate 70 times (7039%) and 54 times (5433%) higher than at the no addition rate in loamy sand soil and sandy loam soil, respectively.
DN content in the leachates during the incubation period was significantly affected by the soil type (F1,36 = 7.3, p < 0.01), the addition rate (F2,36 = 1959.5, p < 0.001), and the state (F1,36 = 19.1, p < 0.001). DN content in loamy sand soil was on average 15% higher than in sandy loam soil; DN content at the low and high addition rates was on average 34% and 52% higher than at the no addition rate, respectively; the DN content in the solid state was 10% higher than in the liquid state (Figure 1e,f). The effect of the soil type differed over the course of incubation (F5,180 = 55.9, p < 0.001), with the highest DN content in loamy sand soil at the beginning of incubation (day 0), followed by a steep decrease in both soil types until day 85. However, at the end of incubation (day 85), the DN content in sandy loam soil was 51% higher than in loamy sand soil. The effect of the addition rate also differed over the course of incubation (F10,180 = 194.3, p < 0.001), with the highest DN content at the beginning of incubation (day 0), followed by a steeper decrease at the high addition rate than at the low addition rate until day 85. DN content was affected by the interaction of the soil type and the addition rate (F2,36 = 19.8, p < 0.001), with the DN content at the high addition rate 9 times (872%) and 8 times (755%) higher than at the no addition rate in loamy sand soil and sandy loam soil, respectively. The DN content was also affected by the interaction of the soil type and the state (F1,36 = 4.9, p < 0.05), with DN content in the solid state in loamy sand soil and in sandy loam soil being respectively 14% and 5% higher than in the liquid state.
DP content in the leachates during the incubation period was affected by the soil type (F1,36 = 151.1, p < 0.001), the addition rate (F2,36 = 171.6, p < 0.001), and the state (F1,36 = 14.5, p < 0.001). DP content in loamy sand soil was on average 3 times (314%) higher than in sandy loam soil; DP content at the high addition rate was on average 5 times (530%) higher than at the no and low addition rates; DP content was on average 47% higher in the solid state than in the liquid state (Figure 1g,h). The effect of the addition rate differed over the course of incubation (F10,180 = 133.5, p < 0.001), with the highest DP content at the high addition rate at the beginning of incubation (day 0), followed by a steep decrease to the level at the no and low addition rates until day 29. DP content during the incubation period was also affected by the interaction of the soil type and the addition rate (F2,36 = 60.3, p < 0.001), with DP content at the high addition rate in loamy sand soil and sandy loam soil being respectively 11 times (1142%) and 2 times (214%) higher than at the no addition rate.

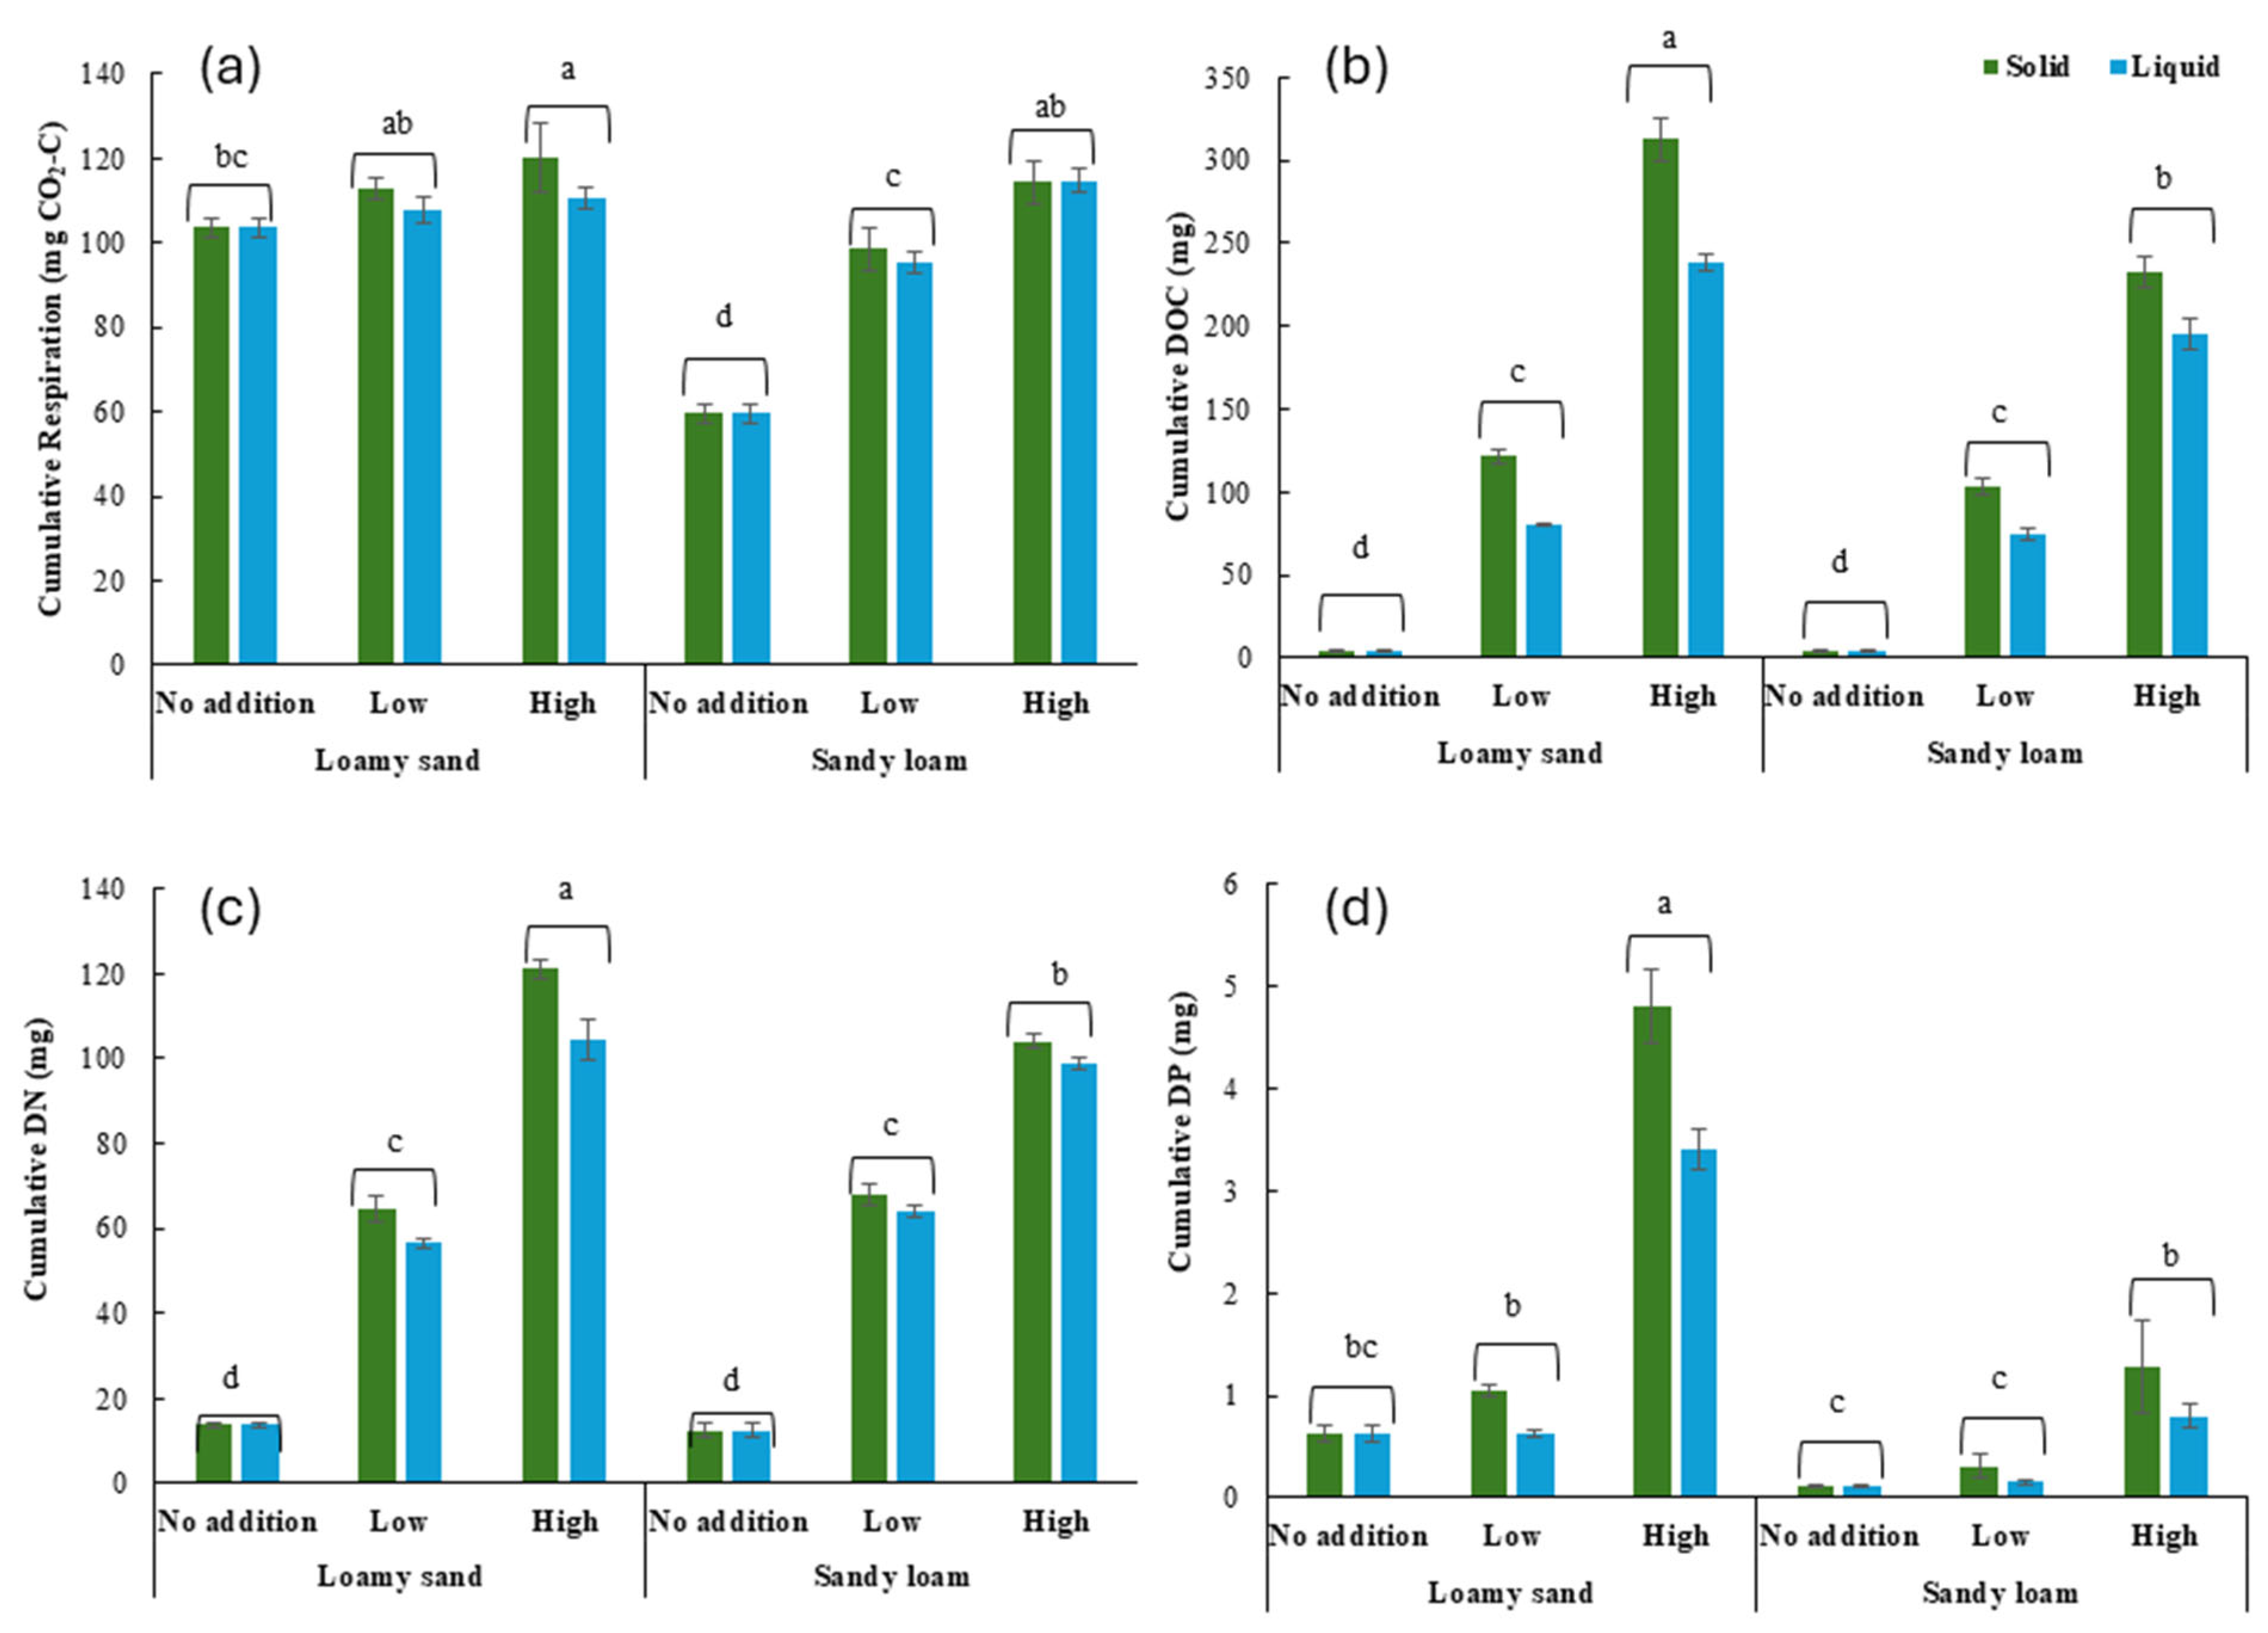
3.2. Cumulative Soil Respiration and Nutrient Content in the Leachates

Cumulative respiration and nutrient content in the leachates were generally affected by the soil type, the addition rate, the state, and their interactions (Table 2). Cumulative respiration was on average 21% higher in loamy sand soil than in sandy loam soil and 27% and 41% higher at the low and high addition rates, respectively, than at the no addition rate (Figure 2a). The effect of the addition rate was, however, stronger in sandy loam soil than in loamy sand soil with on average 62% and 92% (sandy loam) and 7% and 11% (loamy sand) higher values at the low and high addition rates, respectively, than at the no addition rate.
Cumulative DOC content was on average 24% higher in loamy sand soil than in sandy loam soil, 21 times (2066%) and 55 times (5485%) higher, respectively, at the low and high addition rates than at the no addition rate, and 31% higher in the solid state than in the liquid state (Figure 2b). The effect of the high addition rate was, however, stronger in loamy sand soil than in sandy loam soil, with on average 63 times (6273%) (loamy sand) and 47 times (4708%) (sandy loam) higher values at the high addition rate than at the no addition rate. The effect of the solid state was 29% stronger in loamy sand soil than in sandy loam soil.
Cumulative DN content was on average 4 times (386%) and 7 times (722%) higher at the low and high addition rates, respectively, than at the no addition rate and 10% higher in the solid state than in the liquid state (Figure 2c). The effect of the high addition rate was stronger in loamy sand soil than in sandy loam soil, with on average 8 times (765%) (loamy sand) and 7 times (679%) (sandy loam) higher values at the high addition rate than at the no addition rate. The effect of the solid state was 8% stronger in loamy sand soil than in sandy loam soil.
Cumulative DP content was on average 3 times (302%) higher in loamy sand soil than in sandy loam soil, 2 times (186%) higher at the high addition rate than at the no and low addition rates, and 43% higher in the solid state than in the liquid state (Figure 2d). The effect of the addition rate was, however, stronger in loamy sand soil than sandy loam soil, with DP content at the low and high addition rates being, respectively, 92% and 767% (loamy sand) and 35% and 561% (sandy loam) higher than at the no addition rate.

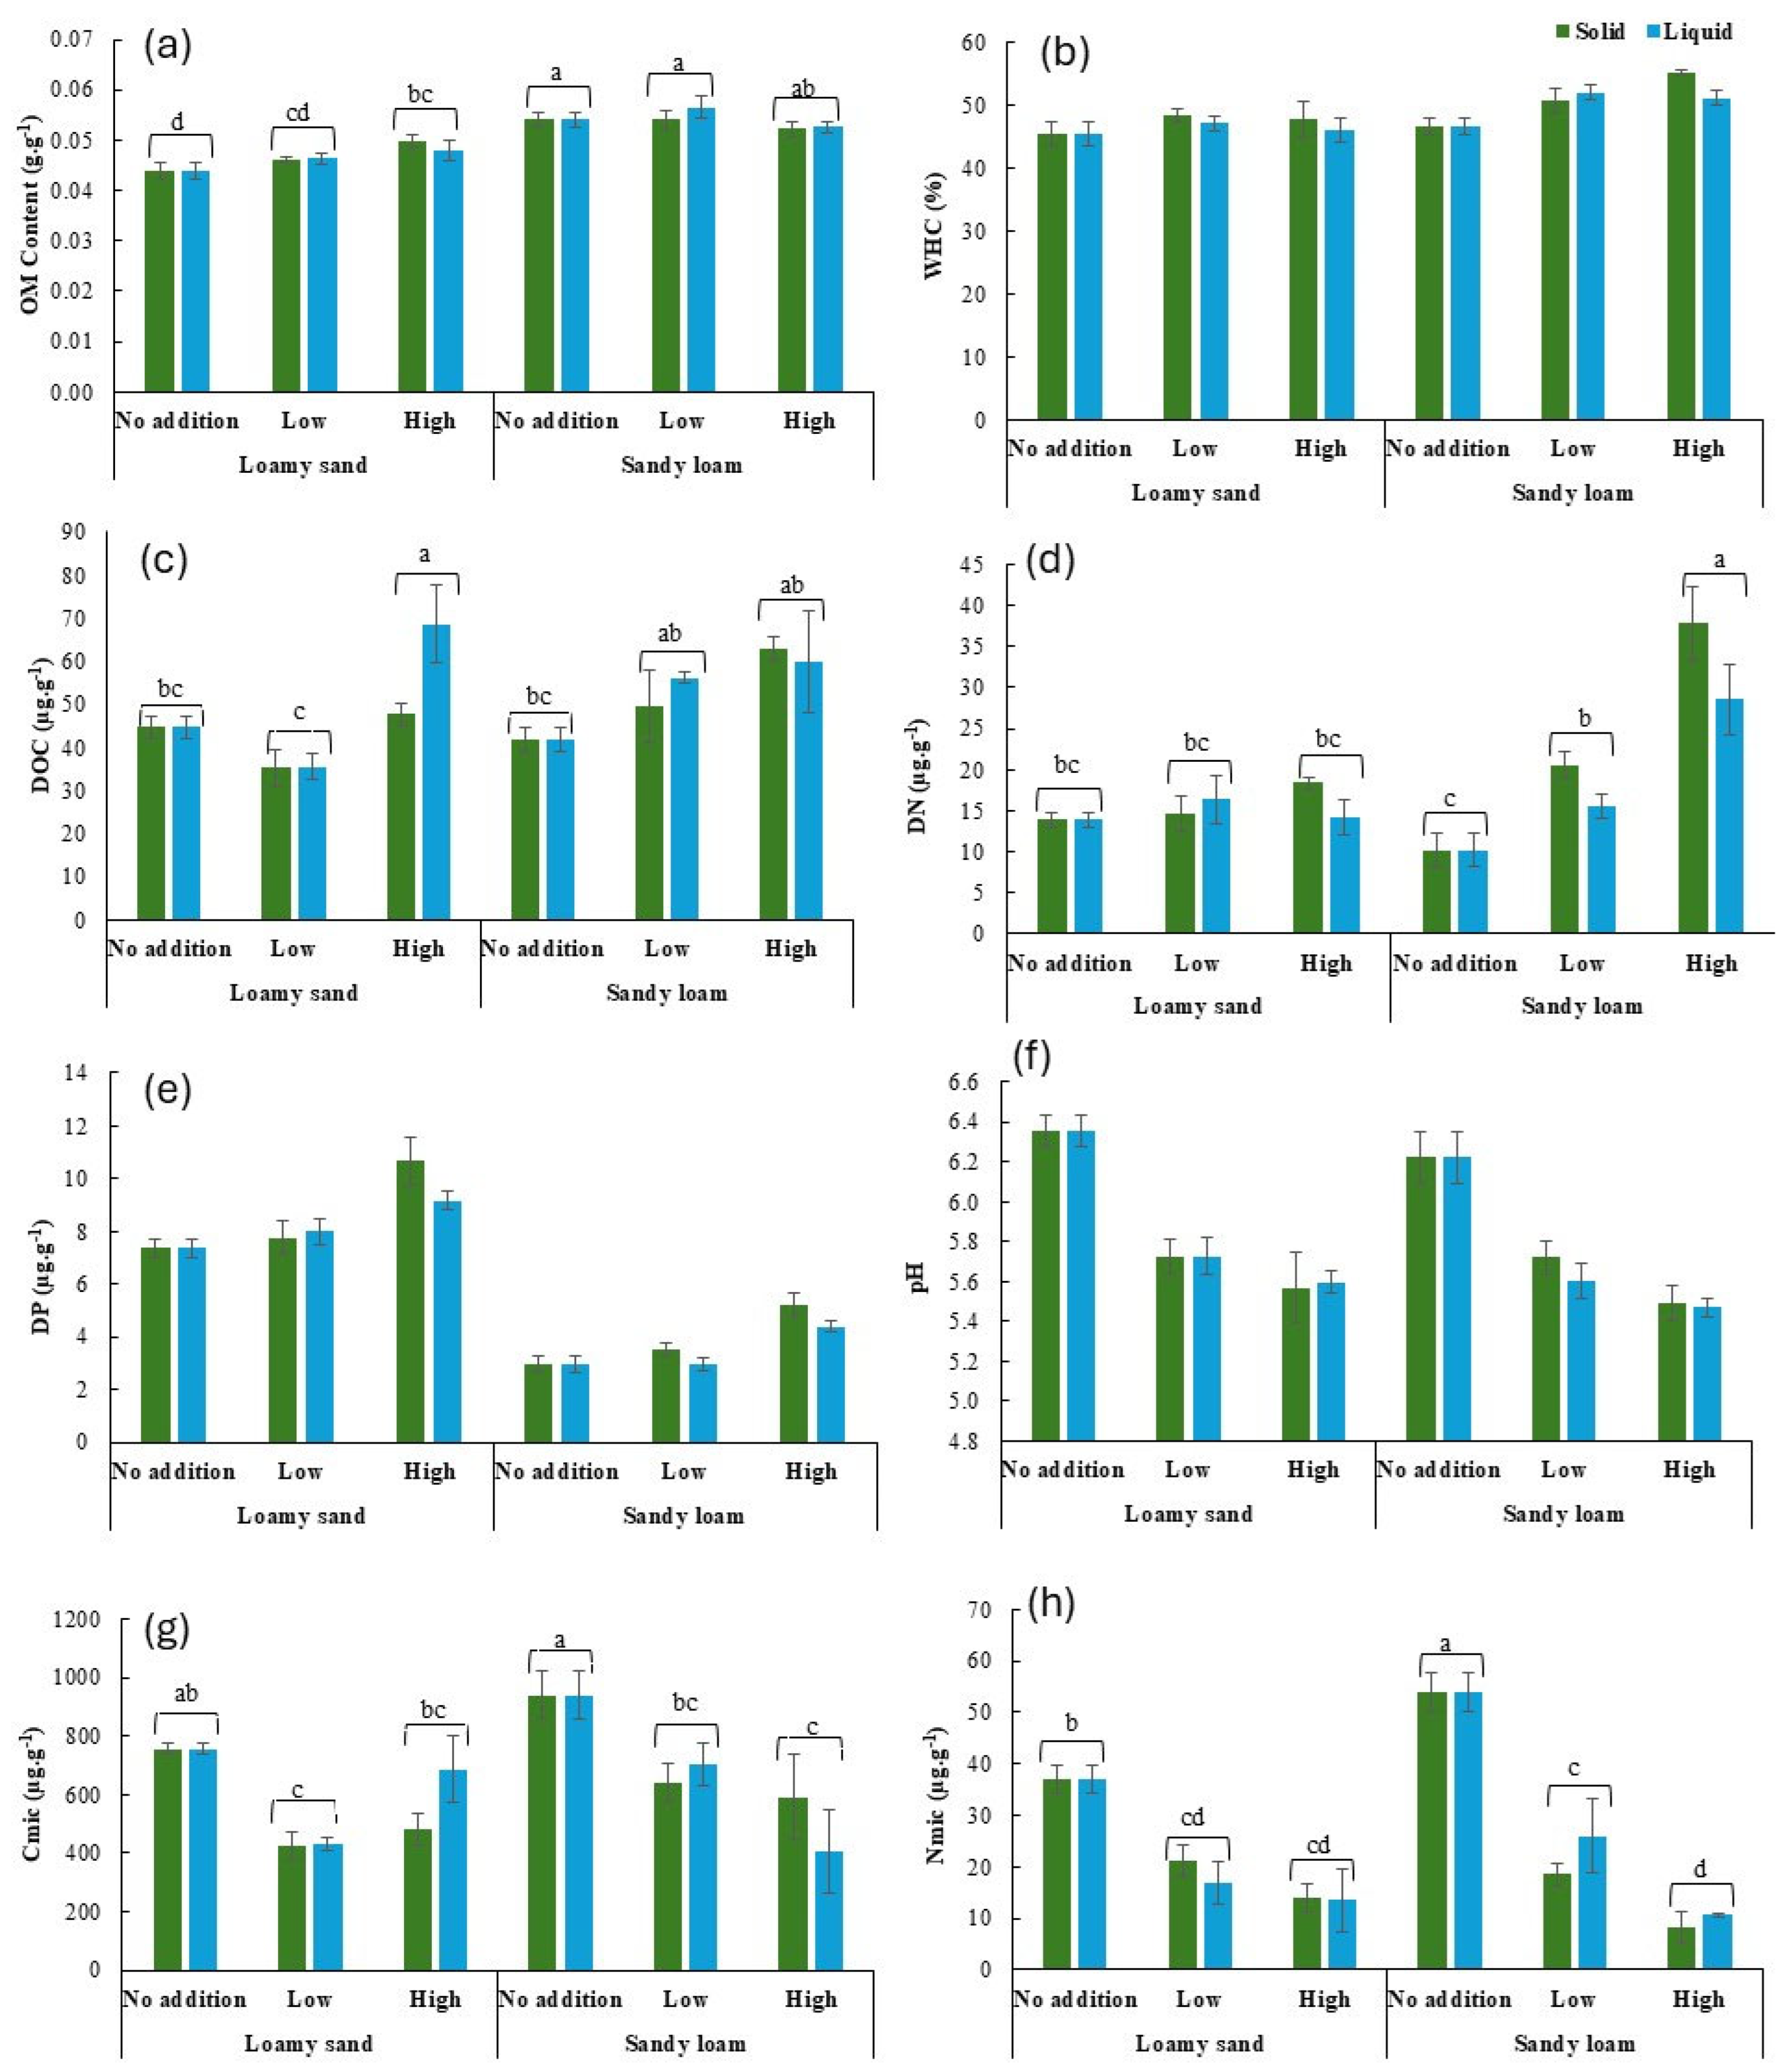
3.3. Soil Properties

Soil properties were generally affected by the soil type, the addition rate, and their interaction (Table 3). OM content was on average 17% higher in sandy loam soil than in loamy sand soil (Figure 3a). OM content at the low and high addition rates was 5% and 11% higher, respectively, than at the no addition rate, but only in loamy sand soil. WHC was on average 8% higher in sandy loam soil than in loamy sand soil and 8% higher at the low and high addition rates than at the no addition rate (Figure 3b).
DOC content was on average 8% higher at the high addition rate than at the low and no addition rates (Figure 3c). DN content was on average 35% higher in sandy loam soil than in loamy sand soil and 39% and 106% higher at the low and high addition rates, respectively, than at the no addition rate (Figure 3d). The effect of the high addition rate was, however, stronger in sandy loam soil than in loamy sand soil, with on average 135% (sandy loam) and 11% (loamy sand) higher values at the high addition rate than at the no addition rate. DP content was on average 128% higher in loamy sand soil than in sandy loam soil and 37% higher at the high addition rate than at the no and low addition rates (Figure 3e). Soil pH was on average 12% lower at the low and high addition rates than at the no addition rate (Figure 3f).
Cmic content was on average 20% higher in sandy loam soil than in loamy sand soil and 55% lower at the low and high addition rates than at the no addition rate (Figure 3g). Nmic content was on average 23% higher in sandy loam soil than in loamy sand soil and 121% and 289% lower at the low and high addition rates, respectively, than at the no addition rate (Figure 3h).
TOC content was highest in the MAOM fraction (88.7%), followed by the oPOM fraction (6.8%) and the fPOM fraction (4.5%) (Figure 4a–c). TOC content in fPOM was affected by the soil type (F1,24 = 31.8, p < 0.001), with TOC content on average 61% higher in loamy sand soil than in sandy loam soil (Figure 4a). TOC content in oPOM was affected by the interaction of the soil type and the addition rate (F2,24 = 5.9, p < 0.05). Although TOC content in oPOM was on average 89% higher in sandy loam soil than in loamy sand soil at the no addition rate, this difference decreased to 69% at the low addition rate and disappeared at the high addition rate (Figure 4b).

4. Discussion

The use of organic amendments has been widely advocated as a means to enhance SOM content and improve soil properties [6]. While the benefits of certain organic amendments, such as biochar, are well-documented, the potential of PFH in improving soil properties remains underexplored. PFH is rich in N, i.e., amino acids, soluble proteins and peptides, and other bioavailable compounds, which accentuates its possible use in organic farming by enhancing soil fertility [6,32]. This study thus presents the effects of PFH on microbial activity and physical and chemical properties in coarse-textured soils as part of the laboratory microcosm experiment. Additionally, the study is among the first to focus on the effects of PFH in different states and addition rates.
The effects of PFH on microbial activity and available nutrient content were stronger in sandy loam than loamy sand soil (Figure 1 and Figure 2), validating the first hypothesis. Microbial activity increased primarily during the initial incubation period due to the readily available nutrients (Table 1). However, these nutrients were rapidly consumed by microorganisms or leached away, leading to a rapid decline in microbial activity, consistent with previous studies [17,22]. In addition, a decrease in pH caused by the addition of PFH might have led to a decline in microbial activity [33]. Available nutrients depleted more rapidly in loamy sand soil than in sandy loam soil (Figure 1c,g), likely due to the lower retention capacity of loamy sand soil, which resulted in greater nutrient leaching. Sandy loam soil thus retained more nutrients (Figure 3d), supporting a higher OM content (Figure 3a), WHC (Figure 3b), Cmic (Figure 3g), and Nmic (Figure 3h) compared to loamy sand soil. This greater nutrient retention is likely due to the sandy loam’s finer texture, which offers a larger surface area for nutrient retention [34] and microbial cell adsorption [35]. Importantly, nutrient retention in sandy loam can also be attributed to the presence of clay minerals and humified organic matter that form the clay–humus complex, which significantly enhances the soil’s cation exchange capacity. The higher capacity of sandy loam contributes to its ability to hold nutrients more effectively, thereby creating more favorable conditions for microbial activity and biomass accumulation [36] than in loamy sand soil. The addition of PFH to sandy loam soil also led to higher oPOM content (Figure 4b), most probably because finer particles facilitated PFH-induced aggregate formation, enhancing OM stabilization. These findings align with the research by Plante et al. (2006) [37], who demonstrated that oPOM accumulates in soil with stronger aggregation and moisture retention, prolonging OM decomposition and nutrient availability. In contrast, loamy sand soil exhibited higher fPOM content (Figure 4a), suggesting that coarser-textured soils having larger pores and lower stabilization potential consist of loosely associated OM, causing higher unprotected fPOM accumulation than finer-textured soil [38]. In summary, PFH had a stronger effect in the finer-textured sandy loam soil, contributing to longer soil nutrient retention and microbial activity compared to the coarser-textured loamy sand soil.
The effect of PFH in the liquid state was stronger than in the solid state, contradicting the second hypothesis. While PFH in the solid state led to a higher content of nutrients in the leachates (Figure 2c,d), the liquid PFH facilitated better nutrient retention and higher microbial activity, making it a more effective form of application. The results also suggest that the liquid PFH releases nutrients at a slower rate, leading to a prolonged effect on soil nutrient availability and microbial activity as indicated by lower DOC (Figure 1c,d), DN (Figure 1e,f), and DP (Figure 1g,h) content in the leachates compared to the solid PFH. In contrast, the solid PFH, being apparently more mobile, was immediately available as evidenced by significantly higher nutrient leaching (DOC, DN, and DP) and a steep decline in the availability of these nutrients over the incubation period (Figure 1c–h). The higher respiration rates observed with the solid PFH (Figure 1a,b) indicate that its nutrients were quickly utilized or lost, making it less efficient for the long-term improvement of soil fertility. These findings align with the research by Jagadeesan et al. (2023) [21], who suggest that the liquid PFH provides a slow and sustainable release of N and other essential nutrients and thus improves the long-term soil fertility, likely due to its better adsorption on soil mineral surfaces. Soil properties at the end of the incubation, however, remained unaffected by the state of PFH (Figure 3), likely because the microbial community had either utilized the easily available nutrients from PFH or they were lost in the leachates by the end of incubation in both states. Overall, the liquid PFH promotes a more controlled and sustained release of nutrients, making the liquid PFH a more effective soil organic amendment for prolonged benefits than the solid PFH.
The effects of PFH on soil properties were stronger at the high addition rate than the low addition rate, corroborating the third hypothesis. At the high addition rate, PFH positively affected microbial activity and nutrient availability mainly at the beginning of incubation (Figure 1). Moreover, at the high addition rate, PFH led to a higher content of nutrients in the leachates, with a higher DOC (Figure 2b), DN (Figure 2c), and DP (Figure 2d) content, similar to our previous study [22]. Microbial activity (Figure 1a,b) and DN content in the leachates (Figure 1e,f) at the high addition rate were found to decrease gradually, indicating a prolonged effect of PFH which may be attributed to microbial N immobilization [39]. However, the prolonged effect was not observed for DOC (Figure 1c,d) and DP (Figure 1g,h) content due to their rapid leaching or lower microbial utilization rates [40]. Soil properties at the end of incubation were also influenced by the addition rate (Figure 3), having high DOC (Figure 3c), DN (Figure 3d), and DP (Figure 3e) content at the high addition rate, suggesting that a higher concentration of PFH can provide more nutrients to the soil [41], with a longer retention time. Thus, at the high addition rate, the easily available PFH had stronger and more prolonged effects on the soil properties than at the low addition rate.

5. Conclusions

The present study showcased the effects of PFH in the liquid and solid states and at different addition rates on finer-textured sandy loam and coarser-textured loamy sand soils for the first time. Results showed that PFH had a stronger and more sustained effect on the sandy loam soil, likely due to its finer texture, which promotes nutrient retention, microbial activity, and OM stabilization compared to the coarser-textured loamy sand soil. The liquid PFH consistently outperformed the solid state by providing a more prolonged release of nutrients, which may be beneficial for long-term soil fertility. In addition, these effects were generally stronger and more persistent at the high addition rate of PFH than at the low addition rate. However, the high addition rate of PFH also raises concerns about nutrient leaching and potential phytotoxicity, highlighting the need for careful management to balance benefits with environmental risks. From a practical perspective, several challenges must be overcome for widespread PFH use. These include economic considerations such as production, transportation, and storage costs, particularly for the liquid form, and operational difficulties related to large-scale handling and uniform field application. Additionally, given that PFH influences soil primarily through microbial processes, further research is needed to understand its impact on microbial community composition and function. Although this six-month microcosm study provides valuable controlled insights, field trials are necessary to validate these findings under real agricultural conditions. Overall, the study emphasizes PFH’s potential as a sustainable soil amendment, with soil texture playing a critical role in determining its effectiveness. Developing site-specific application strategies will be essential to maximize agronomic benefits while minimizing environmental impacts across diverse soil–plant systems.

Author Contributions

A.R.: Formal analysis, Software, Data curation, Visualization, Writing—original draft, Writing—review and editing; V.J.: Conceptualization, Funding Acquisition, Investigation, Methodology, Project administration, Supervision, Validation, Writing—review and editing. All authors have read and agreed to the published version of the manuscript.

Funding

This study was supported financially by the Technology Agency of the Czech Republic (program number SS06020267) and the Czech Academy of Sciences (Strategy AV21, programs Foods for the Future and Sustainable Food Production and Consumption).

Data Availability Statement

The measured data from soil analyses are deposited online on Zenodo, via https://doi.org/10.5281/zenodo.15115224.

Acknowledgments

The authors would like to thank Adam Jech, Jiří Petrásek, and Eva Špotová for help with field sampling and laboratory analyses and Olga Šolcová and Stanislav Šabata for preparation of the hydrolysate.

Conflicts of Interest

The authors declare no competing interests.

References

  1. Tripathi, S.; Srivastava, P.; Devi, R.S.; Bhadouria, R. Influence of synthetic fertilizers and pesticides on soil health and soil microbiology. In Agrochemicals Detection, Treatment and Remediation; Butterworth-Heinemann: Woburn, MA, USA, 2020; pp. 25–54. [Google Scholar] [CrossRef]
  2. Gerke, J. The central role of soil organic matter in soil fertility and carbon storage. Soil Syst. 2022, 6, 33. [Google Scholar] [CrossRef]
  3. Lal, R. Soil organic matter and water retention. Agron. J. 2020, 112, 3265–3277. [Google Scholar] [CrossRef]
  4. Li, H.; Van den Bulcke, J.; Mendoza, O.; Deroo, H.; Haesaert, G.; Dewitte, K.; De Neve, S.; Sleutel, S. Soil texture controls added organic matter mineralization by regulating soil moisture—Evidence from a field experiment in a maritime climate. Geoderma 2022, 410, 115690. [Google Scholar] [CrossRef]
  5. Martín-Lammerding, D.; Gabriel, J.L.; Zambrana, E.; Santín-Montanyá, I.; Tenorio, J.L. Organic amendment vs. Mineral fertilization under minimum tillage: Changes in soil nutrients, soil organic matter, biological properties and yield after 10 years. Agriculture 2021, 11, 700. [Google Scholar] [CrossRef]
  6. Bhari, R.; Kaur, M.; Sarup Singh, R. Chicken feather waste hydrolysate as a superior biofertilizer in agroindustry. Curr. Microbiol. 2021, 78, 2212–2230. [Google Scholar] [CrossRef] [PubMed]
  7. Kaur, M.; Bhari, R.; Singh, R.S. Chicken feather waste-derived protein hydrolysate as a potential biostimulant for cultivation of mung beans. Biologia 2021, 76, 1807–1815. [Google Scholar] [CrossRef]
  8. Sobucki, L.; Ramos, R.F.; Gubiani, E.; Brunetto, G.; Kaiser, D.R.; Daroit, D.J. Feather hydrolysate as a promising nitrogen-rich fertilizer for greenhouse lettuce cultivation. Int. J. Recycl. Org. Waste Agric. 2019, 8, 493–499. [Google Scholar] [CrossRef]
  9. Liya, S.M.; Umesh, M. Bioconversion of chicken feather waste into feather hydrolysate by multifaceted keratinolytic Bacillus tropicus LS27 and new insights into its antioxidant and plant growth-promoting properties. Biomass Convers. Biorefin. 2023, 1–11. [Google Scholar] [CrossRef]
  10. Šolcová, O.; Knapek, J.; Wimmerová, L.; Vavrová, K.; Králík, T.; Rousková, M.; Šabata, S.; Hanika, J. Environmental aspects and economic evaluation of new green hydrolysis method for waste feather processing. Clean Technol. Environ. Policy 2021, 23, 1863–1872. [Google Scholar] [CrossRef]
  11. Raguraj, S.; Kasim, S.; Md Jaafar, N.; Nazli, M.H. Growth of tea nursery plants as influenced by different rates of protein hydrolysate derived from chicken feathers. Agronomy 2022, 12, 299. [Google Scholar] [CrossRef]
  12. Rouphael, Y.; Carillo, P.; Cristofano, F.; Cardarelli, M.; Colla, G. Effects of vegetal-versus animal-derived protein hydrolysate on sweet basil morpho-physiological and metabolic traits. Sci. Hortic. 2021, 284, 110123. [Google Scholar] [CrossRef]
  13. Adelere, I.A.; Lateef, A. Application of bacterial feather hydrolysates as biofertilizers in growing leafy vegetables: Yield, nutritional, phytochemical, antioxidant and hepatoprotective profiles. Clean Technol. Environ. Policy 2023, 25, 2951–2969. [Google Scholar] [CrossRef]
  14. Gupta, S.; Sharma, S.; Aich, A.; Verma, A.K.; Bhuyar, P.; Nadda, A.K.; Mulla, S.; Kalia, S. Chicken feather waste hydrolysate as a potential biofertilizer for environmental sustainability in organic agriculture management. Waste Biomass Valorization 2023, 14, 2783–2799. [Google Scholar] [CrossRef]
  15. Colla, G.; Hoagland, L.; Ruzzi, M.; Cardarelli, M.; Bonini, P.; Canaguier, R.; Rouphael, Y. Biostimulant action of protein hydrolysates: Unraveling their effects on plant physiology and microbiome. Front. Plant Sci. 2017, 8, 2202. [Google Scholar] [CrossRef]
  16. Rouphael, Y.; Colla, G.; Giordano, M.; El-Nakhel, C.; Kyriacou, M.C.; De Pascale, S. Foliar applications of a legume-derived protein hydrolysate elicit dose-dependent increases of growth, leaf mineral composition, yield and fruit quality in two greenhouse tomato cultivars. Sci. Hortic. 2017, 226, 353–360. [Google Scholar] [CrossRef]
  17. Możejko, M.; Bohacz, J. Effect of keratin hydrolysates obtained from feather decomposition by Trichophyton ajelloi on plant germination, growth and biological activity of selected arable soils under model conditions. Agronomy 2023, 13, 187. [Google Scholar] [CrossRef]
  18. Raguraj, S.; Kasim, S.; Jaafar, N.M.; Nazli, M.H. Influence of chicken feather waste derived protein hydrolysate on the growth of tea plants under different application methods and fertilizer rates. Environ. Sci. Pollut. Res. 2023, 30, 37017–37028. [Google Scholar] [CrossRef]
  19. Tamreihao, K.; Mukherjee, S.; Khunjamayum, R.; Devi, L.J.; Asem, R.S.; Ningthoujam, D.S. Feather degradation by keratinolytic bacteria and biofertilizing potential for sustainable agricultural production. J. Basic Microbiol. 2019, 59, 4–13. [Google Scholar] [CrossRef]
  20. Dume, B.; Hanc, A.; Švehla, P.; Michal, P.; Šolcová, O.; Chane, A.D.; Nigussie, A. Nutrient recovery and changes in enzyme activity during vermicomposting of hydrolysed chicken feather residue. Environ. Technol. 2022, 1–15. [Google Scholar] [CrossRef]
  21. Jagadeesan, Y.; Meenakshisundaram, S.; Raja, K.; Balaiah, A. Sustainable and efficient-recycling approach of chicken feather waste into liquid protein hydrolysate with biostimulant efficacy on plant, soil fertility and soil microbial consortium: A perspective to promote the circular economy. Process Saf. Environ. Prot. 2023, 170, 573–583. [Google Scholar] [CrossRef]
  22. Kellerová, A.; Jílková, V. Short-term effects of microbial exopolysaccharides and chicken feather hydrolysate vs. long-term effects of plant-derived biochar on temperate, coarse-textured agricultural soils. Soil Use Manag. 2025, 41, e70029. [Google Scholar] [CrossRef]
  23. Bondì, C.; Castellini, M.; Iovino, M. Temporal variability of physical quality of a sandy loam soil amended with compost. Biologia 2025, 80, 1221–1232. [Google Scholar] [CrossRef]
  24. Chwil, S.; Matraszek, R.; Kozłowska-Strawska, J.; Chwil, M.; Zapalski, P. Effects of protein hydrolysate on soil fertility and heavy-metal accumulation in Sinapis alba L. Commun. Soil Sci. Plant Anal. 2016, 47, 298–304. [Google Scholar] [CrossRef]
  25. Murphy, J.A.M.E.S.; Riley, J.P. A modified single solution method for the determination of phosphate in natural waters. Anal. Chim. Acta 1962, 27, 31–36. [Google Scholar] [CrossRef]
  26. Vance, E.D.; Brookes, P.C.; Jenkinson, D.S. An extraction method for measuring soil microbial biomass C. Soil Biol. Biochem. 1987, 19, 703–707. [Google Scholar] [CrossRef]
  27. Gee, G.W.; Bauder, J.W. Particle-size analysis. In Methods of Soil Analysis: Part 1 Physical and Mineralogical Methods; American Society of Agronomy, Inc.: Madison, WI, USA, 1986; pp. 383–411. [Google Scholar] [CrossRef]
  28. Jílková, V.; Jandová, K.; Sim, A.; Thornton, B.; Paterson, E. Soil organic matter decomposition and carbon sequestration in temperate coniferous forest soils affected by soluble and insoluble spruce needle fractions. Soil Biol. Biochem. 2019, 138, 107595. [Google Scholar] [CrossRef]
  29. Major, J.; Rondon, M.; Molina, D.; Riha, S.J.; Lehmann, J. Maize yield and nutrition during 4 years after biochar application to a Colombian savanna oxisol. Plant Soil 2010, 333, 117–128. [Google Scholar] [CrossRef]
  30. Jain, R.; Jain, A.; Rawat, N.; Nair, M.; Gumashta, R. Feather hydrolysate from Streptomyces sampsonii GS 1322: A potential low cost soil amendment. J. Biosci. Bioeng. 2016, 121, 672–677. [Google Scholar] [CrossRef]
  31. Kellerová, A.; Angst, G.; Jílková, V. Earthworms facilitate stabilization of both more-available maize biomass and more-recalcitrant maize biochar on mineral particles in an agricultural soil. Soil Biol. Biochem. 2024, 189, 109278. [Google Scholar] [CrossRef]
  32. Goda, D.A.; El-Gamal, E.H.; Rashad, M.; Abdel-Fattah, Y.R. The optimization of calcareous soil cation exchange capacity via the feather hydrolysate and NP fertilizers integration. Sci. Rep. 2025, 15, 4676. [Google Scholar] [CrossRef]
  33. Mitsuta, A.; Lourenço, K.S.; de Oliveira, B.G.; de Assis Costa, O.Y.; Cantarella, H.; Kuramae, E.E. Soil pH determines the shift of key microbial energy metabolic pathways associated with soil nutrient cycle. Appl. Soil Ecol. 2025, 208, 105992. [Google Scholar] [CrossRef]
  34. Tahir, S.; Marschner, P. Clay addition to sandy soil reduces nutrient leaching—Effect of clay concentration and ped size. Commun. Soil Sci. Plant Anal. 2017, 48, 1813–1821. [Google Scholar] [CrossRef]
  35. Łyszczarz, S.; Lasota, J.; Szuszkiewicz, M.M.; Błońska, E. Soil texture as a key driver of polycyclic aromatic hydrocarbons (PAHs) distribution in forest topsoils. Sci. Rep. 2021, 11, 14708. [Google Scholar] [CrossRef] [PubMed]
  36. Zhou, J.; Sun, T.; Shi, L.; Kurganova, I.; de Gerenyu, V.L.; Kalinina, O.; Giani, L.; Kuzyakov, Y. Organic carbon accumulation and microbial activities in arable soils after abandonment: A chronosequence study. Geoderma 2023, 435, 116496. [Google Scholar] [CrossRef]
  37. Plante, A.F.; Conant, R.T.; Stewart, C.E.; Paustian, K.; Six, J. Impact of soil texture on the distribution of soil organic matter in physical and chemical fractions. Soil Sci. Soc. Am. J. 2006, 70, 287–296. [Google Scholar] [CrossRef]
  38. Witzgall, K.; Vidal, A.; Schubert, D.I.; Höschen, C.; Schweizer, S.A.; Buegger, F.; Pouteau, V.; Chenu, C.; Mueller, C.W. Particulate organic matter as a functional soil component for persistent soil organic carbon. Nat. Commun. 2021, 12, 4115. [Google Scholar] [CrossRef]
  39. Wang, X.; Song, L. Advances in the Study of NO3− Immobilization by Microbes in Agricultural Soils. Nitrogen 2024, 5, 927–940. [Google Scholar] [CrossRef]
  40. Kalbitz, K.; Solinger, S.; Park, J.H.; Michalzik, B.; Matzner, E. Controls on the dynamics of dissolved organic matter in soils: A review. Soil Sci. 2000, 165, 277–304. [Google Scholar] [CrossRef]
  41. Nurdiawati, A.; Suherman, C.; Maxiselly, Y.; Akbar, M.A.; Purwoko, B.A.; Prawisudha, P.; Yoshikawa, K. Liquid feather protein hydrolysate as a potential fertilizer to increase growth and yield of patchouli (Pogostemon cablin Benth) and mung bean (Vigna radiata). Int. J. Recycl. Org. Waste Agric. 2019, 8, 221–232. [Google Scholar] [CrossRef]
Figure 1. Soil respiration (a,b) and content of DOC (c,d), DN (e,f), and DP (g,h) in the leachates per microcosm during incubation as affected by the soil type, the addition rate, and the state. Values represent means ± SEM (n = 4). DOC: Dissolved Organic C, DN: Dissolved N, DP: Dissolved P.
Agronomy 15 01638 g001
Figure 2. Cumulative respiration (a) and DOC content (b), DN (c), and DP (d) in the leachates per microcosm at the end of incubation as affected by the soil type, the addition rate, and the state. Values represent mean ± SEM (n = 4). Different lowercase letters indicate significant differences between treatments. DOC: Dissolved Organic C, DN: Dissolved N, DP: Dissolved P.
Agronomy 15 01638 g002
Figure 3. OM content (a), WHC (b) DOC (c), DN (d), DP (e), pH (f), Cmic (g), and Nmic (h) at the end of incubation as affected by the soil type, the addition rate, and the state. Values represent mean ± SEM (n = 4). Different lowercase letters indicate significant differences between treatments. OM: Organic Matter, WHC: Water-Holding Capacity, TOC: Total Organic Carbon, TN: Total Nitrogen, TP: Total Phosphorus, DOC: Dissolved Organic C, DN: Dissolved N, DP: Dissolved P, Cmic: Microbial Biomass C and Nmic: Microbial Biomass N. Graphs with no letters do not show any significant differences among treatments.
Agronomy 15 01638 g003
Figure 4. Total organic carbon content in fPOM (a), oPOM (b), and MAOM (c) fractions at the end of incubation as affected by the soil type, the addition rate, and the state. Values represent mean ± SEM (n = 3). Different lowercase letters indicate significant differences between treatments. fPOM: Free Particulate OM; oPOM: Occluded POM; MAOM: Mineral-Associated OM. Graphs with no letters do not show any significant differences among treatments.
Agronomy 15 01638 g004
Table 1. Physical, chemical, and microbial properties of the soils and hydrolysate. Values represent means ± SEM (n = 3). Different lowercase letters in a column indicate significant differences among means for the soil types based on the t-test (OM: Organic Matter, WHC: Water-Holding Capacity, TOC: Total Organic Carbon, TN: Total Nitrogen, TP: Total Phosphorus, DOC: Dissolved Organic C, DN: Dissolved N, DP: Dissolved P, Cmic: Microbial Biomass C, and Nmic: Microbial Biomass N).
Soil/
Hydrolysate
OM
(g g−1)
WHC
(%)
TOC
(mg g−1)
TN
(mg g−1)
TP
(mg g−1)
DOC
(mg g−1)
DN
(mg g−1)
DP
(mg g−1)
pHCmic
(µg g−1)
Nmic
(µg g−1)
Loamy sand0.042 ± 0.001 b54.88 ± 3.35 a17.53 ± 0.28 a1.68 ± 0.05 a0.74 ± 0.03 a0.033 ± 0.007 a0.025 ± 0.001 a0.004 ± 0.000 a6.57 ± 0.07 a680.92 ± 43.61 a43.93 ± 0.174 a
Sandy loam0.047 ± 0.000 a52.13 ± 8.19 a17.01 ± 0.34 a1.77 ± 0.03 a0.88 ± 0.04 a0.030 ± 0.002 a0.014 ± 0.001 b0.002 ± 0.000 b6.60 ± 0.09 a587.95 ± 58.25 a38.28 ± 1.85 b
Hydrolysate0.879 ± 0.001384.54 ± 0.54109.81 ± 0.1912.43 ± 0.28310.34 ± 5.18100.10 ± 1.555.67 ± 0.0954.07 ± 0.01
Table 2. Results of factorial ANOVAs for effects of the soil (S), the state (ST), the addition rate (AR), and their interactions on the cumulative soil properties. F values are shown and *, **, and *** indicate significance at p < 0.05, <0.01, and <0.001, respectively; NS indicates p > 0.05.
Source of VariancedfCumulative
Respiration
Cumulative
DOC
Cumulative
DN
Cumulative
DP
S1, 3676.93
***
48.65
***
3.56
NS
165.53
***
ST1, 361.72
NS
74.11
***
19.89
***
14.45
***
AR2, 3678.13
***
1583.9
***
1915.6
***
171.42
***
S × ST1, 360.84
NS
5.37
*
4.43
*
3.33
NS
S × AR2, 3633.66
***
28.39
***
15.36
***
59.75
***
ST × AR2, 360.43
NS
21.56
***
6.26
*
6.70
**
S × ST × AR2, 360.44
NS
2.27
NS
1.82
NS
1.58
NS
Table 3. Results of factorial ANOVAs for effects of the soil (S), the state (ST), the addition rate (AR), and their interactions on final soil properties. F values are shown and *, **, and *** indicate significance at p < 0.05, <0.01, and <0.001, respectively; NS indicates p > 0.05.
Source of VariancedfOMWHCDOCDNDPpHCmicNmic
S1, 3675.97
***
15.71
***
3.48
NS
13.59
***
338.4
***
2.84
NS
5.77
*
5.56
*
ST1, 360.04
NS
1.04
NS
1.69
NS
3.81
NS
2.9
NS
0.10
NS
0.09
NS
0.15
NS
AR2, 361.76
NS
7.16
**
11.49
***
27.00
***
27.9
***
60.92
***
17.70
***
81.75
***
S × ST1, 360.67
NS
0.05
NS
0.90
NS
1.91
NS
0.0
NS
0.23
NS
1.33
NS
1.18
NS
S × AR2, 365.28
**
2.30
NS
3.67
*
18.22
***
0.7
NS
0.10
NS
4.37
*
7.72
**
ST × AR2, 360.50
NS
1.06
NS
0.67
NS
2.03
NS
2.0
NS
0.11
NS
0.05
NS
0.05
NS
S × ST × AR2, 360.17
NS
0.62
NS
2.13
NS
0.51
NS
0.7
NS
0.09
NS
2.12
NS
0.60
NS
Disclaimer/Publisher’s Note: The statements, opinions and data contained in all publications are solely those of the individual author(s) and contributor(s) and not of MDPI and/or the editor(s). MDPI and/or the editor(s) disclaim responsibility for any injury to people or property resulting from any ideas, methods, instructions or products referred to in the content.

