Article

Belowground Biomass Carbon Density in Xinjiang Grasslands: Spatiotemporal Variability and Dominant Drivers

1
College of Grassland Science, Xinjiang Agricultural University, Urumqi 830052, China
2
Key Laboratory of Grassland Resources and Ecology of Xinjiang Uygur Autonomous Region, Urumqi 830052, China
3
Key Laboratory of Grassland Resources and Ecology of Western Arid Desert Area, Ministry of Education, Urumqi 830052, China
*
Author to whom correspondence should be addressed.
Agronomy 2025, 15(7), 1597; https://doi.org/10.3390/agronomy15071597
Submission received: 30 May 2025 / Revised: 22 June 2025 / Accepted: 29 June 2025 / Published: 30 June 2025
(This article belongs to the Special Issue Utilization and Management of Grassland Ecosystems)

Abstract

Arid grasslands exhibit high proportions of belowground biomass (BGB), yet the climatic influence on BGB carbon density remains poorly understood. Accurately estimating BGB carbon density in arid grassland vegetation presents a significant challenge. Using extensive field sampling, multi-source remote sensing data, and machine learning methods, the spatial distribution of BGB carbon density across Xinjiang grasslands was estimated, and its environmental drivers across different geomorphological regions were revealed. The results show that BGB carbon density accounts for 93.8–97.2% of total carbon density in Xinjiang grassland, with notably high proportions exceeding 97% in the Junggar Basin, Kunlun Mountains, and Altun Mountains regions. From 2000 to 2023, BGB carbon density increased significantly (p < 0.01) from 1175.18 gC·m−2 to 1379.09 gC·m−2, with significant increases observed in the Junggar Basin, Tarim Basin, Kunlun Mountains, and Altun Mountains. In addition, environmental factor analysis revealed distinct soil moisture threshold effects governing BGB carbon density-precipitation relationships: carbon density increases linearly with precipitation when soil moisture remains below 0.2 m3·m−3, shows a parabolic relationship between 0.2 and 0.4 m3·m−3, and decreases with increasing precipitation when soil moisture exceeds 0.4 m3·m−3. Soil moisture and precipitation emerge as dominant factors influencing BGB carbon density changes, with regional variations in their relationships. These findings provide critical insights into carbon sequestration dynamics in arid grassland ecosystems and their response mechanisms under climate change.

1. Introduction

Occupying about 25% of the global land surface, grasslands serve as a fundamental component of terrestrial ecosystems and are especially important in regulating carbon dynamics within arid environments due to their high potential for carbon storage [1]. As a key indicator of ecosystems’ carbon sink function, grassland biomass carbon density is regulated by interactions between climate change and environmental conditions [2,3]. Notably, BGB carbon density, representing a crucial component of grassland carbon pools, directly influences ecosystems’ carbon balance and stability through its dynamic variations [4]. Regional heterogeneity in topography and climate across Xinjiang leads to diverse grassland types with a marked spatial variation in BGB. A detailed understanding of the spatiotemporal dynamics and controlling mechanisms of BGB carbon density across different geomorphic units in Xinjiang enables a more accurate quantification of the belowground carbon allocation in arid regions. It also provides new insights into how grassland ecosystems respond to climatic and environmental fluctuations, offering valuable guidance for carbon budget assessments and adaptive ecosystem management.
Carbon storage in grassland ecosystems represents a focal point in global ecological research, with scholars worldwide employing various methodologies across different spatial scales [5,6]. BGB is a crucial component of grassland carbon storage, playing a dominant role in arid regions [7]. However, current research on BGB carbon processes is remarkably limited. While remote sensing-based aboveground biomass (AGB) estimation has achieved a sub-kilometer resolution through the integration of multi-source satellite data and machine learning techniques, effectively reconstructing the spatiotemporal dynamics of aboveground vegetations’ carbon storage [8,9], the estimation of BGB remains far more challenging. BGB’s estimation faces two key constraints. First, root biomass exhibits a substantial vertical heterogeneity; most field sampling remains limited to surface soil layers (0–30 cm) [10], whereas substantial portions of BGB in arid grasslands have been shown to reside in the deeper layers (>30 cm) [11]. Second, satellite remote sensing technologies cannot directly detect BGB, forcing researchers to rely on limited point data for regional-scale extrapolation [12]. Consequently, accurately characterizing the spatial distribution of BGB carbon density remains a key scientific challenge in carbon storage research across arid regions.
Vegetation growth and biomass allocation patterns are regulated by the synergistic effects of climate, topography, and soil conditions, exhibiting pronounced differences in environmental adaptability at regional scales [13]. In alpine regions, temperature serves as the primary factor governing grassland’s biomass allocation, as plants enhance BGB storage to adapt to low-temperature conditions. To withstand cold environments, plants allocate a greater proportion of biomass to belowground structures, thereby improving their survival and adaptive capacity [14]. In desert and typical steppe ecosystems within arid regions, the proportion of BGB often exceeds 60%, markedly higher than in other ecological zones [15]. Meta-analyses have shown that experimental warming increases terrestrial plant biomass by an average of 12.3% [16]. In Qinghai–Tibet Plateau alpine meadows, temperature increases not only significantly enhance aboveground components but also promote adaptive changes in roots’ vertical distribution, characterized by an increased deep soil root biomass and decreased shallow root biomass [17]. In contrast, precipitation regulates the allocation ratio between aboveground and belowground productivity in arid regions by modifying soil moisture conditions, particularly influencing the shallow root distribution [18]. Furthermore, extreme rainfall events enhance both AGB and BGB in annual species in semi-arid regions, whereas extreme drought suppresses the accumulation of biomass [19]. Conversely, reduced precipitation can stimulate root growth [20], and plants often respond to drought stress by increasing their root to shoot ratios. These seemingly contradictory findings highlight the asynchronous responses of AGB and BGB to climate change in arid regions, underscoring the complexity of vegetation carbon allocation mechanisms. Grassland biomass responses to environmental change exhibit a marked regional variability, shaped by the complex interactions among climatic drivers, vegetation community traits, and geographical distribution patterns, which collectively govern biomass allocation strategies and the associated ecological functions [21].
The grasslands of Xinjiang are characterized by an extensive distribution and high diversity, with BGB constituting a critical component of regional carbon storage. While previous research has predominantly concentrated on AGB carbon density, investigations of root system carbon density contributions in arid grasslands remain comparatively limited. Understanding of the relationships between key environmental factors and carbon density at regional scales has progressed slowly, and the environmental drivers and interactive mechanisms governing the spatiotemporal heterogeneity of grassland BGB carbon density in Xinjiang’s arid regions remain poorly understood. In this study, comprehensive field-measured BGB data were integrated with regional remote sensing datasets, and multiple machine learning approaches were employed to develop biomass estimation models and elucidate the spatiotemporal dynamics and driving mechanisms of grassland vegetation BGB carbon density in Xinjiang. The specific research objectives are as follows: (1) to estimate grassland BGB carbon density based on the relationships between AGB and root to shoot ratios; (2) to quantify the dynamic characteristics of BGB carbon density across different geomorphological units; and (3) to reveal the relationships between BGB carbon density and key environmental factors.

2. Materials and Methods
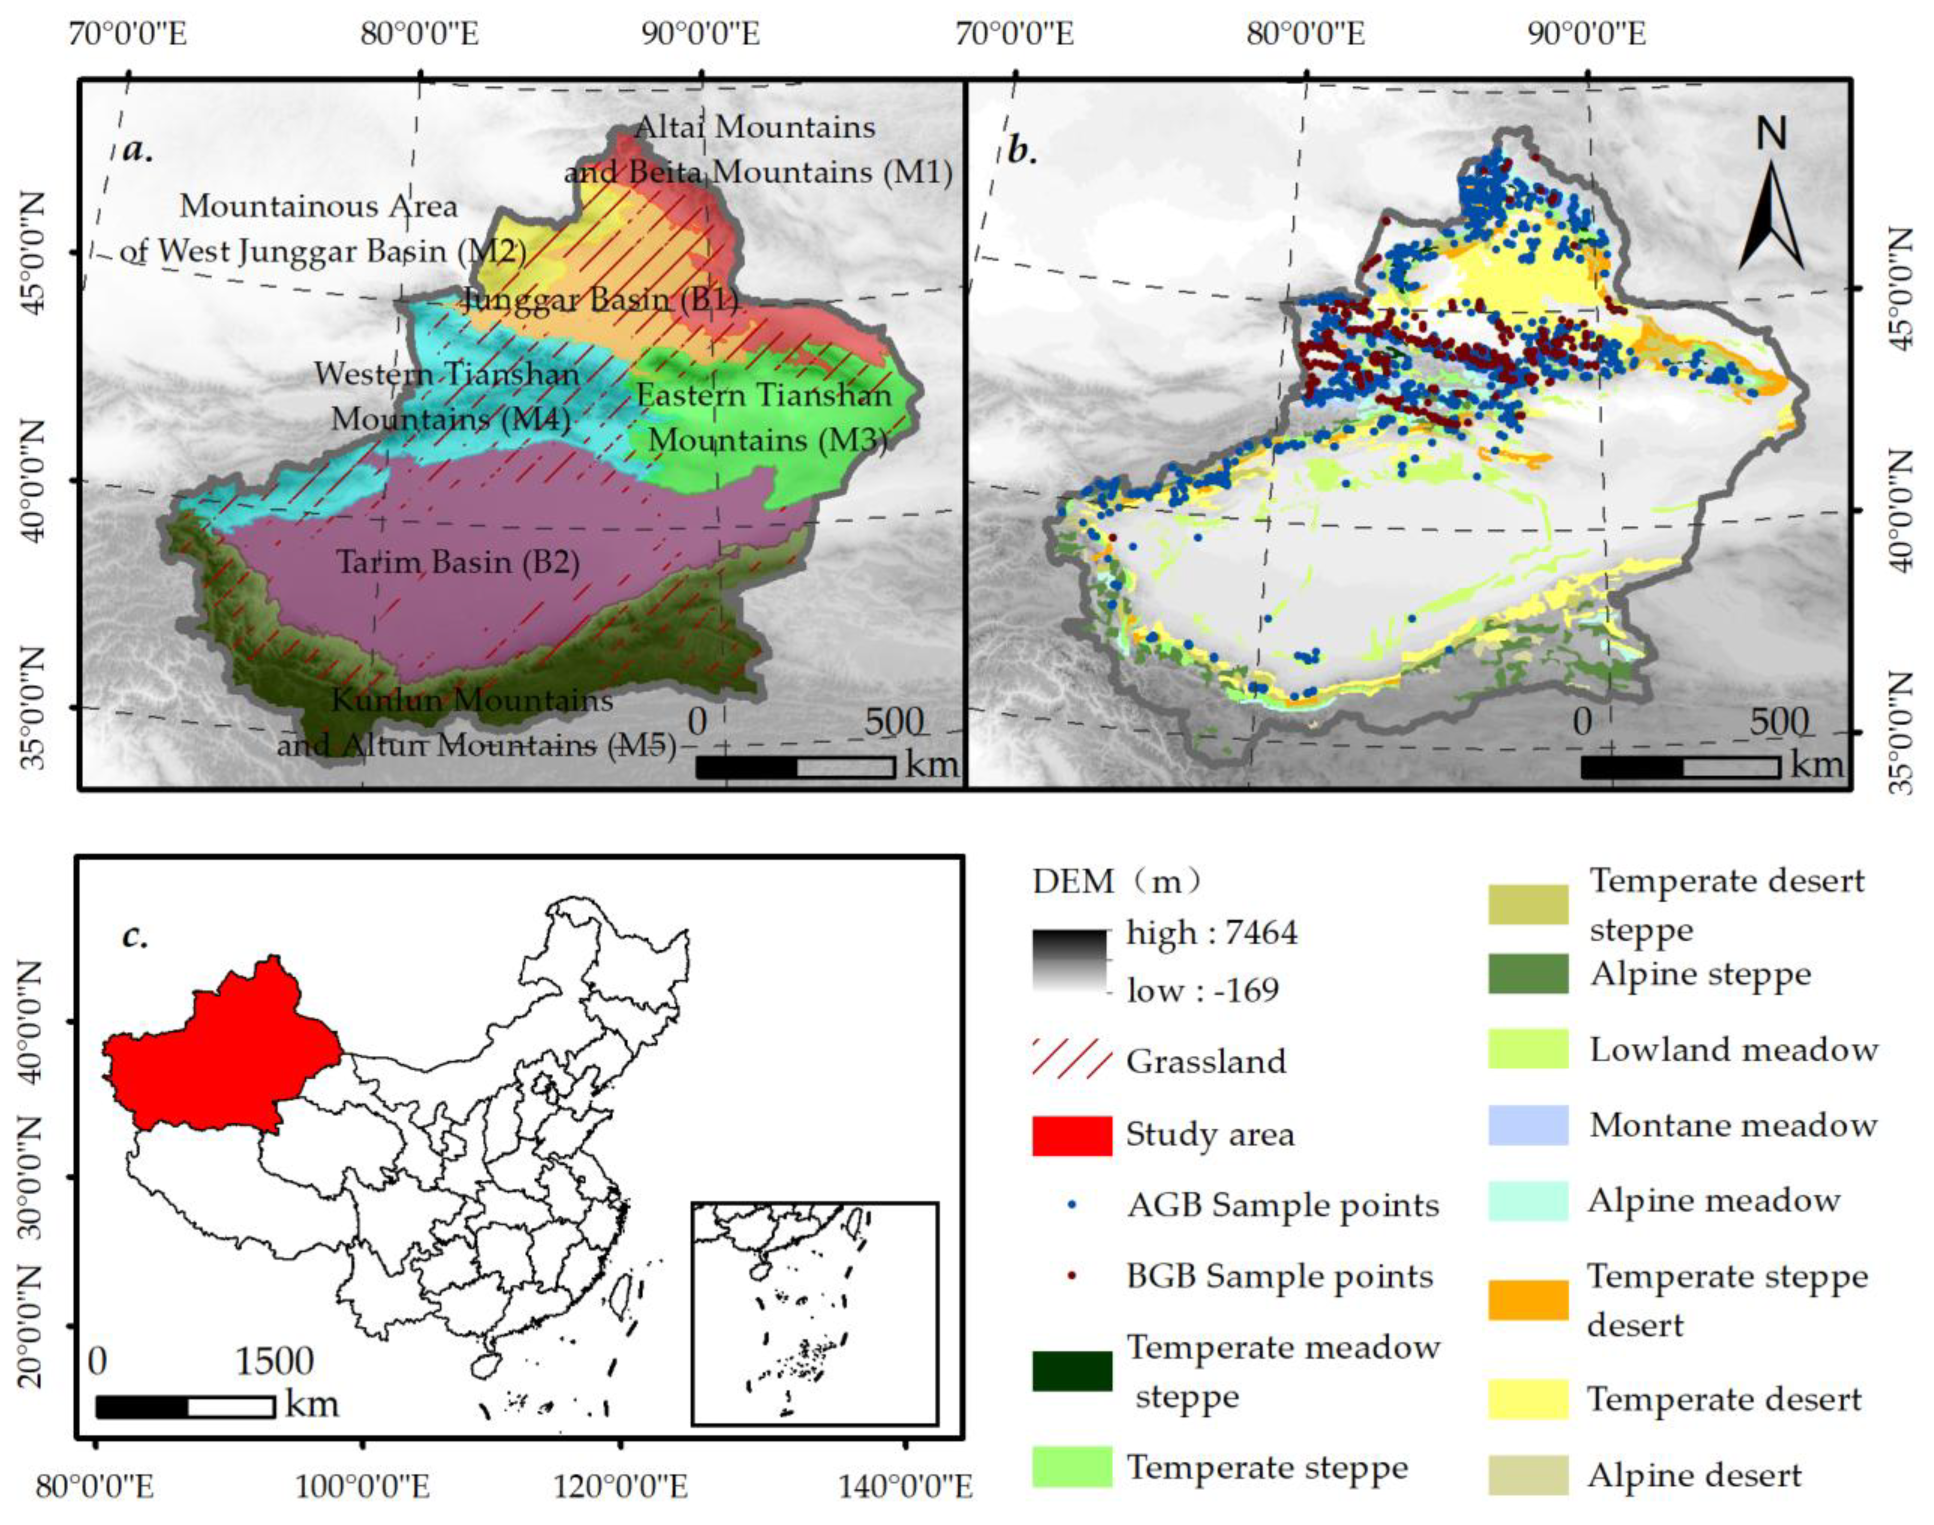
2.1. Study Area

Located in Northwestern China (73°22′–96°21′ E, 34°22′–49°33′ N), Xinjiang exhibits exceptional ecosystem heterogeneity shaped by diverse topographies and biogeographical characteristics (Figure 1). This region experiences a typical continental arid climate regime. Southern Xinjiang is marked by extreme aridity and high temperatures [22], whereas northern regions, particularly mountainous zones, receive comparatively higher precipitation, resulting in pronounced north–south climatic gradients. These complex hydrothermal patterns exert a strong control over vegetation growth and biomass allocation strategies in grassland ecosystems.
The region is characterized by three major mountain ranges and two basins, a topographic configuration that generates distinct elevation, temperature, and precipitation gradients while forming the foundation for the region’s exceptional geomorphological and ecological diversity. Such a spatial heterogeneity fundamentally shapes vegetation patterns, soil water regimes, and carbon cycling processes, resulting in strong regional contrasts in grassland biomass allocation and belowground carbon storage dynamics. The Western TianShan Mountains and Tarim Basin exhibit hyper-arid conditions, while the Junggar Basin and Kunlun Mountains are predominantly arid. The Western Tianshan Mountains show semi-arid characteristics, and the Altai Mountains display a transition from arid to semi-arid conditions. The topographic profile exhibits progressively increasing elevations across the three major mountain ranges, ascending from the Northern Altai Mountains (around 1500 m) through the central Tianshan Mountains (above 3000 m) to the Southern Kunlun Mountains (above 5000 m), while the intervening Junggar and Tarim Basins occupy substantially lower elevations, with the Junggar Basin (around 500 m) typically lower than the Tarim Basin (around 1000 m).
Based on the regional classification schemes proposed in previous studies [23,24], the Tianshan Mountains are divided into eastern and western sections, further delineating seven geomorphological zones (Figure 1a): the Altai Mountains and Beita Mountains (M1, 46,830.13 km2), the mountainous area of the West Junggar Basin (M2, 30,756.43 km2), Junggar Basin (B1, 104,485.33 km2), Eastern TianShan Mountains (M3, 41,476.69 km2), Western TianShan Mountains (M4, 134,678.48 km2), Tarim Basin (B2, 53,103.41 km2), Kunlun Mountains and Altun Mountains (M5, 107,562.51 km2). The total study area encompasses approximately 518,892.97 km2 of grassland ecosystems across these geomorphological regions.
This diverse landscape hosts ten distinct grassland ecosystem types (Figure 1b), each with characteristic spatial distributions and ecological features. Meadow grasslands constitute 23% of the total grassland area in the region, with lowland meadows (50.4%), montane meadows (23.4%), and alpine meadows (26.2%) being the dominant types. These meadow ecosystems are characterized by dense vegetation cover and a high productivity, serving as valuable natural pastures with considerable economic importance. Steppe grasslands comprise 34% of Xinjiang’s grassland area, dominated by temperate desert steppe (37.6%) and alpine steppe (31.9%), followed by temperate steppe (24.6%) and temperate meadow steppe (6.3%). These ecosystems exhibit shorter vegetation with moderate productivity and substantial economic value. Desert grasslands have the widest distribution, covering 43% of the total grassland area and consisting mainly of temperate desert (78.00%), temperate steppe desert (19.3%), and alpine desert (2.7%) types. Although these grasslands are characterized by low productivity and limited carrying capacity due to fragile environmental conditions, they play a crucial role in delivering key ecosystem services. This study investigates BGB carbon density across nine grassland types in Xinjiang to quantify their contributions to regional carbon storage and climate regulation.

2.2. Data Sources and Processing

Based on remote sensing imagery and grassland type distribution maps, preliminary sampling sites were identified across representative areas along elevation gradients within mountainous vertical zones. Field sampling was then conducted using these coordinates, with on-site adjustments made according to local conditions, such as whether a site was located within a nature reserve, fenced pasture, or tourist area, to determine the final observation points. To ensure phenological consistency and spatial representativeness, AGB and BGB data were collected during the peak growing season, when vegetation reaches its seasonal maximum. The sampling campaign covered all major grassland types across Xinjiang.
At each sampling site, a 100 m × 100 m plot was established, within which three 1 m × 1 m quadrats were positioned. Geographic coordinates (longitude, latitude, and elevation) were recorded using handheld GPS devices, along with species composition and biomass information. AGB samples were collected by clipping all vegetation at ground level within each quadrat. Multi-year field measurements were conducted, and BGB samples were collected to a depth of 1 m to facilitate an accurate estimation of root system properties and root to shoot ratios (R/S).
BGB sampling involved soil block excavation: soil blocks (10 cm × 20 cm) were extracted from one sub-quadrat within each quadrat and sampled across seven depth intervals (0–5 cm, 5–10 cm, 10–20 cm, 20–30 cm, 30–50 cm, 50–70 cm, and 70–100 cm). In the laboratory, the root samples were thoroughly washed with water until the runoff was clear, and all stones and dead roots were carefully removed. Both vegetation and root samples were oven-dried at 65 °C to a constant weight, and dry biomass was recorded. BGB was calculated as the sum of root biomass across all depth intervals (0–100 cm), and R/S was determined as the ratio of BGB to AGB. To ensure consistency in the spatial analysis, BGB values were converted to grams per square meter based on the quadrat area. After quality control and outlier removal, a total of 3819 AGB and 376 BGB records were retained for analysis (Figure 1b).
Geomorphological zonation data for Xinjiang were derived by vectorizing six primary geomorphic regions, following classification frameworks established by Chai et al. [23] and Li et al. [24]. Grassland type information was obtained from the 1:1,000,000 Grassland Type Map (1995), published by the National Earth System Science Data Center of China (accessed on 10 April 2024, https://www.geodata.cn/). This dataset was used to delineate grassland distribution and to classify vegetation sampling sites for biomass analysis. The digital elevation model (DEM) data was obtained from the National Tibetan Plateau Data Center (accessed on 5 April 2024, http://www.resdc.cn/), with a spatial resolution of 90 m. Vegetation indices including normalized difference vegetation index (NDVI), enhanced vegetation index (EVI), gross primary productivity (GPP), leaf Area Index (LAI), and evapotranspiration (ET) were derived from NASA MODIS Land Products. These remote sensing products (NDVI, EVI, GPP, LAI, ET) were utilized in their atmospherically corrected form using standard MODIS atmospheric correction algorithms, with the Maximum Value Composite (MVC) method applied to convert 8-day composites to monthly data, effectively reducing residual atmospheric contamination and cloud effects. Temperature and precipitation datasets used for grassland AGB modeling were obtained from the National Tibetan Plateau Data Center (NTPDC), with a spatial resolution of 1 km and a temporal coverage from 2000 to 2023. For the time series analysis during 2000–2023, all datasets were resampled to a uniform spatial resolution of 500 m and a monthly temporal resolution. These climate variables were incorporated as key input features for the machine learning models used to estimate AGB.
To investigate the influence of environmental factors on BGB carbon density, multiple environmental parameters from the Climatic Research Unit gridded Time Series (CRU) and Famine Early Warning Systems Network Land Data Assimilation System (FLDAS) monthly datasets were incorporated. Temperature (TEM), precipitation (PRE), and potential evapotranspiration (PET) data were sourced from the CRU dataset (spatial resolution: 0.5°). Soil moisture (SMC), rainfall flux (RF), surface radiative temperature (SRATE), surface air temperature (SAT), surface downward shortwave radiation (SDSR), sensible heat flux (SSHF), specific humidity (SH), soil heat flux (SHF), and soil temperature (ST) data were derived from the FLDAS dataset (spatial resolution: 0.1°). SMC and ST data were weight-averaged to 1 m depth. All datasets were reprojected to a common WGS84 coordinate system to ensure geometric consistency. Next, the study area of Xinjiang was extracted through spatial clipping. To focus the analysis on grassland areas, non-grassland pixels were removed using a grassland type mask. Finally, all datasets were resampled to a uniform spatial resolution of 500 m to facilitate AGB modeling and analysis. Data sources are detailed in Table 1.

2.3. Calculation of BGB Carbon Density

This study combines field-measured AGB data with remotely sensed vegetation indices and meteorological datasets to develop six machine learning models for estimating grassland AGB. These models included the following: Neural networks (NNs), which simulate interconnected neuronal structures to learn complex nonlinear relationships through multiple neuronal layers [25]. Gradient descent (GD), an optimization algorithm that iteratively adjusts parameters to minimize loss functions [26]. Random forest (RF), an ensemble learning method that generates predictions through voting or averaging across multiple decision trees, offering robust generalization capacity [27]. Decision tree regression (DT), a tree-structured supervised learning algorithm that predicts continuous target variables by progressively partitioning data space [28]. K-nearest neighbors regression (KNN), an instance-based learning approach that predicts target values by identifying K neighbors closest to the target sample [29]. Extreme gradient boosting regression (XGBoost), which enhances model performance by sequentially training weak classifiers and combining their predictions with a weighted aggregation [30]. These machine learning models were implemented to predict AGB across grassland ecosystems. Analyses were conducted in R 4.3.1.
To comprehensively evaluate the performance of AGB simulations, two statistical metrics were employed: the distance between indices of simulation and observation (DISO) and the Pearson correlation coefficient (R). DISO is a robust composite index specifically designed for the assessment of model performance [22], where lower DISO values indicate better model performance. The DISO index incorporates three normalized error components: the correlation coefficient (R), the normalized absolute error (NAE), and the normalized root mean square error (NRMSE), and it is calculated as follows:
D I S O i = r i r 0 2 + N A E i N A E 0 2 + N R M S E i N R M S E 0 2
The machine learning model with the highest accuracy was selected to generate high-resolution AGB estimates. Subsequently, a statistical analysis of the collected AGB and BGB was conducted to derive the R/S for each grassland type (Table 2). Given the temporal stability of AGB and BGB relationships across interannual scales, spatially explicit BGB estimates were derived by multiplying the modeled AGB values with the corresponding R/S for each pixel. This methodological framework inherently incorporates the influence of interannual meteorological variations, thereby effectively capturing both temporal variability and spatial heterogeneity in BGB distributions. The computational framework for deriving BGB carbon density is illustrated in Figure 2, with BGB values converted to carbon density (gC·m−2) using the internationally recognized coefficient of 0.45. DISO analysis was performed in R 4.3.1.

2.4. Methods of Data Analysis

2.4.1. Trend Analysis

To examine temporal trends in BGB carbon density, univariate linear regression analysis (θ) was conducted as follows:
θ = n × i = 1 n i × x i i = 1 n x i i = 1 n i n × i = 1 n i 2 i = 1 n i 2
where n represents the number of years; i refers to the i-th year within the study period. xi represents the value of BGB carbon density in the i-th year. The statistical significance of trends was evaluated using F-tests at the pixel level (α = 0.05). Analysis was conducted in MATLAB version 2022b.

2.4.2. Pettitt Test

The Pettitt test is applied to detect the change years of BGB carbon density. The Pettitt test is a non-parametric method that identifies change points in a time series based on changes in extreme value statistics, without requiring the data to follow a specific distribution. The calculation formula is as follows:
U t ,   N = U t 1 ,   N + i = 1 n s g n ( x t x i )
K t ,   N = m a x 1 t N | U t ,   N |
P = 2 e x p { 6 K t , N 2 N 3 + N 2 }
In the formula, Ut,N and P are the statistics; Kt,N is the maximum value in Ut,N. t represents the potential change point; xt and xi are time series data. If the p-value of the Pettitt test is less than the significance level (p < 0.05), it can be concluded that there is a change point in the time series. Analyses were conducted in R 4.3.1.
Finally, the coefficient of variation (CV) is calculated to measure the volatility of BGB carbon density, with the formula
C V = 1 n i = 1 n ( x i x ¯ ) 2 x ¯
where xi represents the BGB carbon density value for the i-th year; x ¯ represents the average BGB carbon density over the study period; and n represents the number of years. A higher coefficient of variation indicates greater variability in BGB carbon density and lower stability, and vice versa. The CV analyses were conducted in R 4.3.1.

2.4.3. Random Forest

The random forest algorithm was used to evaluate the relative contribution of environmental factors to BGB carbon density. Random forest is an ensemble learning method based on multiple decision trees that can handle complex nonlinear relationships [27] and has been widely applied in environmental factor impact assessments [21]. This study employed the random forest algorithm to rank the importance of drivers influencing grassland BGB carbon density. Twelve environmental factors were selected as independent variables, with BGB carbon density treated as the dependent variable. The “randomForest” and “rfPermute” packages in R software were used to rank variable importance and perform significance testing. Analyses were conducted in R 4.3.1.

2.4.4. Partial Correlation Analysis

To investigate the independent effects of individual environmental factors, partial correlation analysis was employed to exclude interference from other variables. The formula for calculating the partial correlation coefficient (Rxy,z) is as follows:
R x y , z = R x y R x z × R y z ( 1 R y z 2 ) × ( 1 R y z 2 )
where x represents the BGB carbon density, and y and z represent two different environmental factors. Rxy is the correlation coefficient between x and y. Rxz is the correlation coefficient between x and z, the coefficient between x and y while controlling for the influence of z. To assess the significance of the partial correlation coefficients, this study applied a t-test. Partial correlation analysis was performed in R 4.3.1.

3. Results

3.1. Estimation and Characterization of AGB and BGB Carbon Density

This study evaluated the accuracy and validation performance of multiple machine learning methods, including neural networks, gradient descent, decision tree regression, extreme gradient boosting, k-nearest neighbors, and random forest, in constructing remote sensing models for the estimation of grassland AGB. This study used DISO indices and a correlation coefficient (R) to evaluate model accuracy. The research found that the random forest method exhibited excellent performance in both accuracy and error control, with DISO and R values of 1.16 and 0.74, respectively (Figure 3), and it was therefore selected for biomass estimation. Based on this model, a time series dataset of AGB from 2000 to 2023 was developed [31]. Subsequently, by incorporating root to shoot ratios specific to different grassland types (Table 2) [32], a corresponding BGB dataset was generated, resulting in carbon density estimates for both AGB and BGB during the same period (Table 3).
The results indicated that the average AGB carbon density of Xinjiang grassland vegetation was 44.34 gC·m−2, while the BGB carbon density was 1229.65 gC·m−2. The highest AGB carbon density, 53.68 gC·m−2, was found in the well-watered grasslands of the Western Tianshan Mountains, whereas the highest BGB carbon density, 1499.66 gC·m−2, occurred in the desert-dominated vegetation of the Junggar Basin. The range of AGB carbon density across various geomorphological regions was from 35.54 gC·m−2 to 53.68 gC·m−2, while the BGB carbon density ranged from 639.00 gC·m−2·a−1 to 1499.66 gC·m−2·a−1. Notably, the BGB carbon density of Xinjiang grassland vegetation was significantly higher than the AGB carbon density, with a substantial variation in BGB carbon density across different geomorphological regions.

3.2. Temporal and Spatial Variations and Change Points of BGB Carbon Density

This study reveals the temporal variation characteristics of BGB carbon density in Xinjiang grassland vegetation from 2000 to 2023 (Figure 4). Overall, the BGB carbon density in Xinjiang grasslands showed a significant increasing trend (θ = 4.99 gC·m−2·a−1, p < 0.001). Additionally, the Pettitt test identified 2009 as a critical change point in BGB carbon density (Figure 4h), with only a slight increase before the change point (θ = 0.32 gC·m−2·a−1), while the rate of increase after the change point was 18.9 times greater (θ = 6.07 gC·m−2·a−1). Notably, significant differences in trends were observed across different geomorphological regions. Specifically, the Junggar Basin exhibited the fastest growth in BGB carbon density (θ = 9.09 gC·m−2·a−1), followed by the Kunlun Mountains and Altun Mountains (θ = 7.31 gC·m−2·a−1, p < 0.001), which transitioned from non-significant changes before the change point to rapid growth afterward. The Tarim Basin (θ = 6.05 gC·m−2·a−1, p < 0.001) showed an increase in growth rate after the 2010 change point that was more than double the rate before the change point. The timing of change points varied across regions, with the Junggar Basin experiencing the earliest change (2007), the Western Tianshan Mountains the latest (2015), and most other regions experiencing changes around 2010. In general, geomorphological regions south of the Tianshan Mountains (Tarim Basin, Kunlun Mountains, and Altun Mountains) showed highly significant increasing trends in grassland BGB carbon density. Basin-type landforms also exhibited overall increasing trends in BGB carbon density, with the Junggar Basin maintaining a higher BGB carbon density than the Tarim Basin.
This study conducted a pixel-by-pixel analysis of the spatial distribution characteristics of BGB carbon density in Xinjiang grassland vegetation (Figure 5). The Tarim Basin, dominated by lowland meadows, had a mean BGB carbon density of (<600 gC·m−2). In contrast, the Junggar Basin showed a mean BGB carbon density primarily concentrated between 1200 gC·m−2 and 1800 gC·m−2, significantly higher than the Tarim Basin, indicating its greater carbon storage capacity. The remaining geomorphological regions exhibited a strong spatial heterogeneity in BGB carbon density, particularly the Western Tianshan Mountains, where values primarily ranged from 600 gC·m−2 to 1800 gC·m−2, with a relatively high proportion of areas exceeding 1800 gC·m−2, indicating the presence of high BGB carbon density grasslands in this region (Figure 5a).
Additionally, the mean coefficient of variation for BGB carbon density ranged from 0.15 to 0.22 (Figure 5b), indicating relatively small variations in BGB carbon density between different regions and overall stable fluctuations, with the Junggar Basin showing the highest stability. Overall, from 2000 to 2023, BGB carbon density in Xinjiang grassland vegetation showed a continuous increasing trend (Figure 5c,d), with the Junggar Basin, Tarim Basin, and Kunlun and Altun Mountain regions experiencing the fastest growth rates, with areas of increase accounting for more than 75% of the total area. Of these, areas with significant increases accounted for over 40% in the Tarim Basin and over 20% in the Junggar Basin. Notably, the timing of abrupt changes and patterns of change in grassland BGB carbon density exhibited substantial spatial heterogeneity across Xinjiang. Most change points were concentrated between 2008–2011 and 2012–2015 (Figure 5e). Interestingly, in the Tarim Basin, the dominant trends were characterized by either a transition from “progressively decrease” or “increase to decrease” (Figure 5f).

3.3. Environmental Factors Influencing Spatial Differences in BGB Carbon Density

To elucidate the driving mechanisms underlying changes in BGB carbon density in grassland ecosystems, this study evaluated the effects of twelve environmental variables. Importance ranking results revealed that PRE and SMC were the most influential factors, with importance scores of 0.99 and 0.98, respectively (Figure 6a). These findings underscore the dominant role of water availability in regulating BGB carbon dynamics across the region.
Among these, soil moisture and precipitation emerged as the dominant controlling factors. Notably, the effect of precipitation varied with soil moisture levels. When soil moisture was below 0.2 m3·m−3, BGB carbon density increased with increasing precipitation. At intermediate soil moisture levels (0.2–0.4 m3·m−3), BGB carbon density exhibited a parabolic response to precipitation. Specifically, when precipitation exceeded 200–300 mm, BGB carbon density declined with further increases in precipitation. Furthermore, under high soil moisture conditions (SMC > 0.4 m3·m−3), BGB carbon density showed a negative association with precipitation, with a clear decline observed as rainfall increased (Figure 6b).
Since precipitation and soil moisture are strongly correlated, with areas of higher precipitation typically exhibiting higher soil moisture, BGB carbon density is jointly affected by both factors. To disentangle their individual contributions, partial correlation analyses were performed by controlling for either soil moisture or precipitation, thereby isolating the independent effect of each variable on BGB carbon density. The results revealed substantial spatial heterogeneity in the relationship between BGB carbon density and precipitation across Xinjiang grasslands (Figure 7c,d). In both the Junggar and Tarim Basins, areas where BGB carbon density was negatively correlated with precipitation accounted for over 75% of the total region (Figure 7c). In contrast, the influence of soil moisture on grassland BGB carbon density was more stable, showing an overall positive correlation. Positive correlations were observed in 63.4% of the study area, while areas with significant negative correlations accounted for only 2.8% (Figure 7d). Analysis across different geomorphological regions indicated that positive correlations between BGB carbon density and soil moisture were generally high (>58%) in all regions. Particularly in the Tarim Basin, areas with a positive correlation between grassland BGB carbon density and soil moisture reached 76.1%, with significantly positive correlation areas exceeding 30% (Figure 7d).

4. Discussion

4.1. High Proportion and Increasing Trend of BGB Carbon Density

The proportion of BGB in global plant biomass remains insufficiently studied, limiting the understanding of current and future ecosystem functions and carbon stocks. Compared to AGB, belowground plant traits exhibit greater variability, posing significant challenges for accurate quantification [33]. Furthermore, prior research has indicated that BGB constitutes approximately 78.4% of the total carbon density in Chinese grassland ecosystems [34]. These differences may be attributed to variations in regional water and thermal characteristics, the sampling depths of BGB, and calculation methods. For instance, Ma et al. [35] and Ma et al. [36] studied soil depths of 0–50 cm and 0–30 cm, respectively, while Ding et al. [37] examined a depth of 0–60 cm, yielding AGB and BGB carbon densities of 62.16 gC·m−2 and 531.35 gC·m−2, respectively. Common sampling depths typically range from 0.3 to 0.5 m [34,38]. In this study, the soil depth was extended to 0–100 cm, enabling a more comprehensive and accurate characterization of BGB carbon density in grassland vegetation. This study estimates the carbon densities of aboveground and belowground biomass in grassland ecosystems as 44.34 gC·m−2 and 1229.57 gC·m−2, respectively, with the proportion of BGB carbon density ranging from 93.8% to 97.2% across different sites and time scales, significantly higher than temperate grasslands (86%) [36]. The increase in sampling sites and the extension of sampling depth provide a more comprehensive understanding of carbon distribution characteristics in deep roots within arid regions.
Additionally, variations in BGB carbon storage serve as an indirect indicator of shifts in the resistance and resilience of grassland ecosystems’ productivity. Regional disparities in carbon accumulation dynamics underscore the critical need for long-term monitoring and tailored management approaches to effectively sustain grassland’s function. This study reveals a significant increasing trend in the BGB carbon density in Xinjiang grasslands, with an annual growth rate of 6.07 gC·m−2·a−1, notably higher than the growth rate of 1.06 gC·m−2·a−1 reported by Ding et al. [37]. Between 2000 and 2023, the BGB carbon density in Xinjiang grasslands increased by a total of 203.91 gC·m−2, showing a significant growth (p < 0.01). This trend suggests that the underground carbon storage of regional grassland ecosystems is continuously increasing, likely related to environmental factors such as climate change (e.g., changes in precipitation patterns or temperature rises) in Xinjiang. Notably, the abrupt shifts in BGB carbon density of Xinjiang’s grasslands were primarily concentrated during two periods: 2008–2011 and 2012–2015. Around 2010, peaks in the hydrothermal index and surface water availability created favorable moisture and thermal conditions for enhanced vegetation productivity [39]. Since the implementation of the Grassland Ecological Conservation Subsidy (GECS) policy in 2011, grazing management has undergone substantial changes [40]. Although an accelerated increase in BGB carbon density was observed during this period, this trend is likely driven by the combined effects of climate variability and grazing regulation. Changes in precipitation and soil moisture remain the primary climatic drivers of BGB carbon density dynamics. At the same time, GECS measures such as grazing exclusion, livestock balance, and rotational grazing may have alleviated grazing pressure, indirectly supporting BGB carbon density’s accumulation by facilitating aboveground vegetation recovery under improved hydroclimatic conditions. This marked increase in BGB carbon density underscores the pivotal role of Xinjiang’s grasslands as a carbon sink, offering valuable insights and empirical support for regional strategies aimed at achieving carbon peaking and neutrality targets.

4.2. Nonlinear Coupling Relationship Between BGB Carbon Density and Precipitation

Random forest importance analysis identified soil moisture and precipitation as the primary drivers of BGB carbon density across Xinjiang’s grasslands (Figure 6a), reflecting the fundamental water-limitation mechanisms characteristic of arid and semi-arid ecosystems. In water-constrained environments, moisture availability supersedes temperature, radiation, or nutrient variables as the ultimate constraint on vegetation growth. Xinjiang’s regional precipitation averages below 400 mm annually, coupled with intense evapotranspiration, creating persistent water deficits that position water resources as the critical determinant of vegetation’s productivity [41,42].
The relationship between soil moisture and precipitation revealed distinct threshold responses and nonlinear coupling dynamics (Figure 6b). Under low soil moisture conditions (SMC < 0.2 m3·m−3), precipitation increases significantly enhanced the BGB carbon accumulation, confirming water stress as the dominant constraint on belowground biomass’s development. Plants optimize water acquisition strategies through increased belowground allocation, consistent with optimal resource allocation theory [38]. This theory predicts that under resource-limiting conditions, plants prioritize photosynthate allocation to belowground organs to enhance their resource capture capacity, thereby minimizing environmental risks while maintaining essential physiological functions [38,43]. As soil moisture was elevated to intermediate levels (0.2–0.4 m3·m−3), precipitation effects on BGB gradually diminished and approached saturation, indicating ecosystems were approaching water-optimal conditions. Notably, under high soil moisture conditions (SMC > 0.4 m3·m−3), BGB carbon density declined markedly with further precipitation increases, exhibiting negative response patterns. This phenomenon likely reflects an excessive moisture-induced decline in soil aeration, triggering root hypoxia stress that constrains root growth and carbon input [44,45]. These findings reveal that BGB carbon accumulation may be suppressed under water-saturated conditions, demonstrating nonlinear threshold responses in arid ecosystem carbon cycling to moisture inputs.
These findings reinforce the general applicability of resource allocation theory across contrasting hydrological regimes. In the Tarim Basin, grassland BGB carbon density showed negative correlations with precipitation but positive correlations with soil moisture (Figure 7a,b). Despite low precipitation, extensive river networks and abundant groundwater sustained by the Tarim River system provide continuous moisture supply to the soil. As a result, soil moisture becomes a more direct and ecologically relevant indicator of water availability than precipitation [46]. This hydrological buffering mitigates vegetation water stress and shapes the spatial distribution of BGB carbon density [47]. By contrast, in the wetter Junggar Basin, higher precipitation and a denser vegetation increase trigger competition, prompting plants to allocate more resources to aboveground growth at the expense of root development [18,48]. This shift in allocation explains the observed negative relationship between BGB carbon density and precipitation. Such contrasting strategies reflect the adaptive responses of grassland vegetation to spatial gradients in water availability [49].
Therefore, spatiotemporal variations in BGB carbon density depend not only on precipitation inputs but are fundamentally constrained by soil moisture dynamics. Moisture-driven effects on carbon cycling processes exhibit pronounced threshold and nonlinear characteristics, emphasizing the complexity of water–carbon coupling mechanisms in arid and semi-arid ecosystems. Understanding these precipitation–soil moisture synergistic regulation mechanisms holds critical scientific significance for accurately assessing the carbon sink potential in arid ecosystems and predicting carbon cycle dynamics under climate change scenarios.

4.3. Limitations and Perspectives

This study integrates extensive field measurements of grassland parameters (e.g., root to shoot ratio), multi-source remote sensing data, and various machine learning algorithms to construct a high-precision, spatiotemporally continuous dataset of BGB carbon density in Xinjiang grasslands. This study reveals the spatiotemporal dynamics of BGB carbon density in Xinjiang grasslands from 2000 to 2023, and through environmental factor analysis, it identifies the driving mechanisms of key factors such as precipitation and soil moisture on the changes in BGB carbon density. This research provides valuable data support and scientific evidence for the precise assessment of carbon sinks in arid grassland ecosystems. However, due to limited field data on BGB, this study did not fully account for its interannual variability. Additionally, this study’s limitations include not considering the spatial–temporal variations in soil bulk density, which is one of the important factors for accurate belowground carbon assessment. The importance of BGB carbon density in grassland ecosystems cannot be overlooked, as its dynamic changes reflect trends in regional ecosystem carbon storage. Future research should focus more on the changes in the belowground component and its potential impacts when studying grassland carbon pools. Long-term field observations are needed to obtain more accurate BGB data, quantify the effects of environmental factors such as climate on root to shoot ratio, and improve the precision of BGB carbon density estimates. Furthermore, future studies need to consider soil bulk density variations and establish this as a priority direction for subsequent research, thereby providing a more reliable data foundation for studying the carbon sink capacity in arid regions.

5. Conclusions

This study provided a high-resolution (500 m, annual) dynamic assessment of BGB carbon density across Xinjiang’s grasslands from 2000 to 2023, overcoming the limitations of static or single-time assessments. The spatial distribution of BGB carbon density was quantified, accounting for 93.8–97.2% of total vegetation carbon storage, underscoring the dominant role of belowground carbon pools in these arid grassland ecosystems.
The analysis revealed a significant upward trend in BGB carbon density over the past two decades (θ = 4.99 gC·m−2·a−1, p < 0.001), with the most rapid gains observed in the arid regions of the Junggar and Tarim Basins. Abrupt points in BGB carbon density were concentrated around 2010. By establishing segmented response functions for soil moisture thresholds, this study identified a nonlinear, soil moisture threshold-based relationship between precipitation and BGB carbon density. Specifically, precipitation exerted a positive influence under low soil moisture conditions. However, this effect shifted to neutral or even negative under high soil moisture conditions—highlighting distinct moisture–carbon interaction mechanisms in arid and semi-arid ecosystems.
Together, these findings highlight the importance of soil moisture as a dominant control over belowground carbon dynamics and suggest that region-specific water availability thresholds mediate grassland carbon responses to climate change. The findings of this study provide a foundation for improving carbon cycle modeling in drylands and inform climate-resilient strategies for grassland management under shifting hydroclimatic conditions.

Author Contributions

Conceptualization, P.D. and C.J.; formal analysis, P.D. and C.J.; supervision, C.J.; project administration, C.J.; funding acquisition, C.J.; methodology, P.D. and G.W.; data curation, G.W. and Y.S.; software, G.W. and Y.S.; writing—original draft, P.D.; writing—review and editing, P.D., C.J. G.W., and Y.S. All authors have read and agreed to the published version of the manuscript.

Funding

This research was funded by the National Natural Science Foundation of China (Grant No. 42161024), the Central Financial Forestry and Grassland Science and Technology Extension Demonstration Project (2025) (Grant No. Xin [2025] TG 09), and the Xinjiang Agricultural University Graduate Research Innovation Project (Grant No. XJAUGRI2025001).

Data Availability Statement

Data will be made available on request.

Conflicts of Interest

The authors declare no conflicts of interest.

References

  1. Chen, Y.; Mu, S.; Sun, Z.; Gang, C.; Li, J.; Padarian, J.; Groisman, P.; Chen, J.; Li, S. Grassland carbon sequestration ability in China: A new perspective from terrestrial aridity zones. Rangel. Ecol. Manag. 2016, 69, 84–94. [Google Scholar] [CrossRef]
  2. Lin, M.; Hou, L.; Qi, Z.; Wan, L. Impacts of climate change and human activities on vegetation NDVI in China’s Mu Us Sandy Land during 2000–2019. Ecol. Indic. 2022, 142, 109164. [Google Scholar] [CrossRef]
  3. Zhang, J.; Zuo, X.; Zhao, X.; Ma, J.; Medina-Roldán, E. Effects of rainfall manipulation and nitrogen addition on plant biomass allocation in a semiarid sandy grassland. Sci. Rep. 2020, 10, 9026. [Google Scholar] [CrossRef]
  4. Li, H.; Yang, B.; Meng, Y.; Liu, K.; Wang, S.; Wang, D.; Zhang, H.; Huang, Y.; Liu, X.; Li, D. Relationship between carbon pool changes and environmental changes in arid and semi-arid steppe—A two decades study in Inner Mongolia, China. Sci. Total Environ. 2023, 893, 164930. [Google Scholar] [CrossRef]
  5. Anav, A.; Friedlingstein, P.; Beer, C.; Ciais, P.; Harper, A.; Jones, C.; Murray-Tortarolo, G.; Papale, D.; Parazoo, N.C.; Peylin, P. Spatiotemporal patterns of terrestrial gross primary production: A review. Rev. Geophys. 2015, 53, 785–818. [Google Scholar] [CrossRef]
  6. Peng, J.; Jiang, H.; Liu, Q.; Green, S.M.; Quine, T.A.; Liu, H.; Qiu, S.; Liu, Y.; Meersmans, J. Human activity vs. climate change: Distinguishing dominant drivers on LAI dynamics in karst region of southwest China. Sci. Total Environ. 2021, 769, 144297. [Google Scholar] [CrossRef] [PubMed]
  7. Robinson, D. Implications of a large global root biomass for carbon sink estimates and for soil carbon dynamics. Proc. R. Soc. B Biol. Sci. 2007, 274, 2753–2759. [Google Scholar] [CrossRef]
  8. Fokeng, R.M.; Fogwe, Z.N. Landsat NDVI-based vegetation degradation dynamics and its response to rainfall variability and anthropogenic stressors in Southern Bui Plateau, Cameroon. Geosyst. Geoenviron. 2022, 1, 100075. [Google Scholar] [CrossRef]
  9. Zeng, N.; Ren, X.; He, H.; Zhang, L.; Zhao, D.; Ge, R.; Li, P.; Niu, Z. Estimating grassland aboveground biomass on the Tibetan Plateau using a random forest algorithm. Ecol. Indic. 2019, 102, 479–487. [Google Scholar] [CrossRef]
  10. Jaman, M.S.; Wu, H.; Yu, Q.; Tan, Q.; Zhang, Y.; Dam, Q.K.; Muraina, T.O.; Xu, C.; Jing, M.; Jia, X. Contrasting responses of plant above and belowground biomass carbon pools to extreme drought in six grasslands spanning an aridity gradient. Plant Soil 2022, 473, 167–180. [Google Scholar] [CrossRef]
  11. Titlyanova, A.; Romanova, I.; Kosykh, N.; Mironycheva-Tokareva, N. Pattern and process in above-ground and below-ground components of grassland ecosystems. J. Veg. Sci. 1999, 10, 307–320. [Google Scholar] [CrossRef]
  12. Fan, J.; Zhong, H.; Harris, W.; Yu, G.; Wang, S.; Hu, Z.; Yue, Y. Carbon storage in the grasslands of China based on field measurements of above-and below-ground biomass. Clim. Change 2008, 86, 375–396. [Google Scholar] [CrossRef]
  13. Wang, Y.; Chen, X.; Gao, M.; Dong, J. The use of random forest to identify climate and human interference on vegetation coverage changes in southwest China. Ecol. Indic. 2022, 144, 109463. [Google Scholar] [CrossRef]
  14. Tariq, A.; Graciano, C.; Sardans, J.; Zeng, F.; Hughes, A.C.; Ahmed, Z.; Ullah, A.; Ali, S.; Gao, Y.; Peñuelas, J. Plant root mechanisms and their effects on carbon and nutrient accumulation in desert ecosystems under changes in land use and climate. New Phytol. 2024, 242, 916–934. [Google Scholar] [CrossRef] [PubMed]
  15. Zheng, H.; Yang, X.; Song, C.; Zhang, W.; Sun, W.; Wang, G. Distinct environmental controls on above-and below-ground net primary productivity in Northern China’s grasslands. Ecol. Indic. 2024, 167, 112717. [Google Scholar] [CrossRef]
  16. Lin, D.; Xia, J.; Wan, S. Climate warming and biomass accumulation of terrestrial plants: A meta-analysis. New Phytol. 2010, 188, 187–198. [Google Scholar] [CrossRef] [PubMed]
  17. Xu, M.; Liu, M.; Xue, X.; Zhai, D. Warming effects on plant biomass allocation and correlations with the soil environment in an alpine meadow, China. J. Arid Land 2016, 8, 773–786. [Google Scholar] [CrossRef]
  18. Jin, H.; Fan, C.; Zhu, H.; Zhang, Y.; Xiao, R.; Yang, Z. Responses of plant biomass allocation to changed precipitation timing in a semi-arid steppe. Plant Soil 2024, 510, 1–12. [Google Scholar] [CrossRef]
  19. Jaman, M.S.; Yu, Q.; Xu, C.; Jamil, M.; Ke, Y.; Yang, T.; Knapp, A.K.; Wilkins, K.; Collins, S.L.; Griffin-Nolan, R.J. Chronic drought decreased organic carbon content in topsoil greater than intense drought across grasslands in Northern China. Geoderma 2024, 443, 116832. [Google Scholar] [CrossRef]
  20. Fay, P.A.; Carlisle, J.D.; Knapp, A.K.; Blair, J.M.; Collins, S.L. Productivity responses to altered rainfall patterns in a C 4-dominated grassland. Oecologia 2003, 137, 245–251. [Google Scholar] [CrossRef]
  21. Liu, X.; Sun, G.; Fu, Z.; Ciais, P.; Feng, X.; Li, J.; Fu, B. Compound droughts slow down the greening of the Earth. Glob. Change Biol. 2023, 29, 3072–3084. [Google Scholar] [CrossRef] [PubMed]
  22. Wang, G.; Yuan, X.; Jing, C.; Hamdi, R.; Ochege, F.U.; Dong, P.; Shao, Y.; Qin, X. The decreased cloud cover dominated the rapid spring temperature rise in arid Central Asia over the period 1980–2014. Geophys. Res. Lett. 2024, 51, e2023GL107523. [Google Scholar] [CrossRef]
  23. Chai, H.; Ou, Y.; Chen, X.; Cheng, W.; Zhou, C. A new schema of Xinjiang geomorphologic regionalization. Arid. Land Geogr. 2009, 32, 95–106. [Google Scholar] [CrossRef]
  24. Li, H.; Liu, X.; Liu, J.; Zhao, X.; Zhang, W.; Li, F. Geomorphology-based classification of ground substrate texture in Xinjiang. Geoscience 2024, 38, 706–717. [Google Scholar] [CrossRef]
  25. Rumelhart, D.E.; Hinton, G.E.; Williams, R.J. Learning representations by back-propagating errors. Nature 1986, 323, 533–536. [Google Scholar] [CrossRef]
  26. Boyd, S.; Vandenberghe, L. Convex Optimization; Cambridge University Press: Cambridge, UK, 2004. [Google Scholar] [CrossRef]
  27. Breiman, L. Random forests. Mach. Learn. 2001, 45, 5–32. [Google Scholar] [CrossRef]
  28. Ziegel, E.R. The elements of statistical learning. Technometrics 2003, 45, 267–268. [Google Scholar] [CrossRef]
  29. Cover, T.; Hart, P. Nearest neighbor pattern classification. IEEE Trans. Inf. Theory 1967, 13, 21–27. [Google Scholar] [CrossRef]
  30. Chen, T.; Guestrin, C. Xgboost: A scalable tree boosting system. In Proceedings of the 22nd ACM Sigkdd International Conference on Knowledge Discovery and data Mining, San Francisco, CA, USA, 13–17 August 2016; pp. 785–794. [Google Scholar]
  31. Dong, P.; Jing, C.; Wang, G.; Shao, Y.; Gao, Y. The Estimation of Grassland Aboveground Biomass and Analysis of Its Response to Climatic Factors Using a Random Forest Algorithm in Xinjiang, China. Plants 2024, 13, 548. [Google Scholar] [CrossRef]
  32. Dong, P.; Jing, C.; Wang, G.; Shao, Y. Characteristics of biomass and root-shoot ratio of different grassland types in Xinjiang. J. Xinjiang Agric. Univ. 2023, 46, 352–358. [Google Scholar] [CrossRef]
  33. Iversen, C.M.; McCormack, M.L. Filling gaps in our understanding of belowground plant traits across the world: An introduction to a Virtual Issue. New Phytol. 2021, 231, 2097–2103. [Google Scholar] [CrossRef]
  34. Wang, L.; Li, L.; Chen, X.; Tian, X.; Wang, X.; Luo, G. Biomass allocation patterns across China’s terrestrial biomes. PLoS ONE 2014, 9, e93566. [Google Scholar] [CrossRef]
  35. Ma, W.; Yang, Y.; He, J.; Zeng, H.; Fang, J. Above-and belowground biomass in relation to environmental factors in temperate grasslands, Inner Mongolia. Sci. China Ser. C-Life Sci. 2008, 51, 263–270. [Google Scholar] [CrossRef] [PubMed]
  36. Ma, H.; Mo, L.; Crowther, T.W.; Maynard, D.S.; van den Hoogen, J.; Stocker, B.D.; Terrer, C.; Zohner, C.M. The global distribution and environmental drivers of aboveground versus belowground plant biomass. Nat. Ecol. Evol. 2021, 5, 1110–1122. [Google Scholar] [CrossRef]
  37. Ding, L.; Li, Z.; Shen, B.; Wang, X.; Xu, D.; Yan, R.; Yan, Y.; Xin, X.; Xiao, J.; Li, M. Spatial patterns and driving factors of aboveground and belowground biomass over the eastern Eurasian steppe. Sci. Total Environ. 2022, 803, 149700. [Google Scholar] [CrossRef]
  38. Luo, T.; Brown, S.; Pan, Y.; Shi, P.; Ouyang, H.; Yu, Z.; Zhu, H. Root biomass along subtropical to alpine gradients: Global implication from Tibetan transect studies. For. Ecol. Manag. 2005, 206, 349–363. [Google Scholar] [CrossRef]
  39. Wang, G.; Zhang, Q.; Woolway, R.I.; Xu, L.; Ma, H.; Yang, Z. Warm-wetting and/or warm-drying tendency over Xinjiang, China? J. Hydrol. 2025, 660, 133417. [Google Scholar] [CrossRef]
  40. Zhang, Y.; Wuriliga; Ding, Y.; Li, F.; Zhang, Y.; Su, M.; Li, S.; Liu, L. Effectiveness of grassland protection and pastoral area development under the grassland ecological conservation subsidy and reward policy. Agriculture 2022, 12, 1177. [Google Scholar] [CrossRef]
  41. Zhu, L.; Sun, S.; Li, Y.; Liu, X.; Hu, K. Effects of climate change and anthropogenic activity on the vegetation greening in the Liaohe River Basin of northeastern China. Ecol. Indic. 2023, 148, 110105. [Google Scholar] [CrossRef]
  42. Zhang, C.; Lu, D.; Chen, X.; Zhang, Y.; Maisupova, B.; Tao, Y. The spatiotemporal patterns of vegetation coverage and biomass of the temperate deserts in Central Asia and their relationships with climate controls. Remote Sens. Environ. 2016, 175, 271–281. [Google Scholar] [CrossRef]
  43. Wang, X.; Chen, X.; Xu, J.; Ji, Y.; Du, X.; Gao, J. Precipitation dominates the allocation strategy of above-and belowground biomass in plants on macro scales. Plants 2023, 12, 2843. [Google Scholar] [CrossRef] [PubMed]
  44. Chu, X.; Han, G.; Xing, Q.; Xia, J.; Sun, B.; Li, X.; Yu, J.; Li, D.; Song, W. Changes in plant biomass induced by soil moisture variability drive interannual variation in the net ecosystem CO2 exchange over a reclaimed coastal wetland. Agric. For. Meteorol. 2019, 264, 138–148. [Google Scholar] [CrossRef]
  45. Du, Y.; Wang, Y.; Su, F.; Jiang, J.; Wang, C.; Yu, M.; Yan, J. The response of soil respiration to precipitation change is asymmetric and differs between grasslands and forests. Glob. Change Biol. 2020, 26, 6015–6024. [Google Scholar] [CrossRef] [PubMed]
  46. Jiao, A.; Wang, Z.; Deng, X.; Ling, H.; Chen, F. Eco-hydrological response of water conveyance in the mainstream of the tarim river, China. Water 2022, 14, 2622. [Google Scholar] [CrossRef]
  47. Xu, J.; Jiao, A.; Deng, M.; Ling, H. Changes in ecosystem carbon sequestration and influencing factors from a’Past-Future’perspective: A case study of the Tarim River. Ecol. Indic. 2024, 169, 112861. [Google Scholar] [CrossRef]
  48. Zhang, B.; Cadotte, M.W.; Chen, S.; Tan, X.; You, C.; Ren, T.; Chen, M.; Wang, S.; Li, W.; Chu, C.; et al. Plants alter their vertical root distribution rather than biomass allocation in response to changing precipitation. Ecology 2019, 100, e02828. [Google Scholar] [CrossRef]
  49. Brouillette, L.C.; Mason, C.M.; Shirk, R.Y.; Donovan, L.A. Adaptive differentiation of traits related to resource use in a desert annual along a resource gradient. New Phytol. 2014, 201, 1316–1327. [Google Scholar] [CrossRef]
Figure 1. Overview of the study area. (a) Geomorphological zonation map. (b) Grassland types and sampling point distribution. (c) Geographic location within China. Abbreviations: DEM, digital elevation model; AGB, aboveground biomass; BGB, belowground biomass.
Agronomy 15 01597 g001
Figure 2. Flowchart for calculating BGB carbon density. NDVI, normalized difference vegetation index; EVI, enhanced vegetation index; GPP, gross primary productivity; LAI, leaf area index; ET, evapotranspiration; TEM, temperature; PRE, precipitation; DISO, distance between indices of simulation and observation; R, correlation coefficient; R/S, root to shoot ratio; AGB, aboveground biomass; BGB, belowground biomass.
Agronomy 15 01597 g002
Figure 3. Accuracy validation of machine learning models for aboveground biomass in Xinjiang grasslands. (a) Validation of model accuracy using DISO index. (b) Validation of model accuracy using correlation coefficient. DISO, distance between indices of simulation and observation; R, correlation coefficient; RF, random forest; XGBoost, extreme gradient boosting; GD, gradient descent; NN, neural network; DT, decision tree regression; KNN, k-nearest neighbors.
Agronomy 15 01597 g003
Figure 4. Temporal trends and abrupt change points of BGB carbon density in grassland vegetation across different geomorphological regions from 2000 to 2023 (ah). The entire period is shown in black, the period before the abrupt change point in coral red, and the period after the abrupt change point in navy blue. Red squares mark the years of abrupt change points, while dashed lines represent linear regression trend lines for each time period, with shaded areas indicating 95% confidence intervals. CI represents confidence interval. θ denotes the regression slope, p-values indicate significance levels. BGB, belowground biomass; M1, Altai Mountains and Beita Mountains; M2, mountainous area of the Western Junggar Basin; M3, Eastern Tianshan Mountains; M4, Western Tianshan Mountains; M5, Kunlun Mountains and Altun Mountains; B1, Junggar Basin; B2, Tarim Basin; XJ, Xinjiang area.
Agronomy 15 01597 g004
Figure 5. Spatial variation characteristics of BGB carbon density in grassland across different geomorphological regions from 2000 to 2023. (a) Mean BGB carbon density. (b) Coefficient of variation of BGB carbon density. (c) BGB carbon density trends. (d) Significance classification of BGB carbon density. (e) Abrupt change point year. (f) BGB carbon density trend patterns. The pie charts in the upper left corners of panels show the corresponding percentage of area coverage. BGB, belowground biomass; M1, Altai Mountains and Beita Mountains; M2, mountainous area of the Western Junggar Basin; M3, Eastern Tianshan Mountains; M4, Western Tianshan Mountains; M5, Kunlun Mountains and Altun Mountains; B1, Junggar Basin; B2, Tarim Basin; XJ, Xinjiang area.
Agronomy 15 01597 g005
Figure 6. Relationships between environmental variables and BGB carbon density. (a) Variable importance ranking of 12 environmental factors affecting BGB carbon density based on random forest. (b) Response of BGB carbon density to precipitation across three soil moisture levels. BGB, belowground biomass; PRE, precipitation; SMC, soil moisture; RF, rainfall flux; SSHF, sensible heat flux; SH, specific humidity; SRATE, surface radiative temperature; SDSR, surface downward shortwave radiation; SAT, surface air temperature; PET, potential evapotranspiration; TEM, temperature; SHF, soil heat flux; ST, soil temperature.
Agronomy 15 01597 g006
Figure 7. (a) Partial correlation between BGB carbon density and precipitation and (b) with soil moisture. (c) Significance classification of the relationship between BGB carbon density and precipitation and (d) with soil moisture. Pie charts show the percentage of area for each significance category. BGB, belowground biomass; M1, Altai Mountains and Beita Mountains; M2, mountainous area of the Western Junggar Basin; M3, Eastern Tianshan Mountains; M4, Western Tianshan Mountains; M5, Kunlun Mountains and Altun Mountains; B1, Junggar Basin; B2, Tarim Basin; XJ, Xinjiang area.
Agronomy 15 01597 g007
Table 1. Introduction and sources of data.
CategoriesDatasetsIndicatorsTemporal
Range
Spatial ScaleData Source
Modeling DataNTPDCTEM and PRE2000–20231000 mhttp://www.resdc.cn/
(accessed on 5 April 2024)
MODISNDVI, EVI, GPP, LAI, and ET2000–2023500 mhttps://search.earthdata.nasa.gov/
(accessed on 20 April 2023)
Driving Factors DataCRUTEM, PRE, and PET2000–20230.5°https://crudata.uea.ac.uk/
(accessed on 20 May 2024)
FLDASSMC, RF, SRATE, SAT, SDSR, SSHF, SH, SHF, and ST2000–20230.1°https://disc.gsfc.nasa.gov/
(accessed on 8 May 2024)
Note: NTPDC, National Tibetan Plateau Data Center; MODIS, Moderate Resolution Imaging Spectroradiometer; CRU, Climatic Research Unit gridded Time Series; FLDAS, Famine Early Warning Systems Network Land Data Assimilation System; TEM, temperature; PRE, precipitation; NDVI, normalized difference vegetation index; EVI, enhanced vegetation index; GPP, gross primary productivity; LAI, leaf area index; ET, evapotranspiration; PET, potential evapotranspiration; SMC, soil moisture; RF, rainfall flux; SRATE, surface radiative temperature; SAT, surface air temperature; SDSR, surface downward shortwave radiation; SSHF, sensible heat flux; SH, specific humidity; SHF, soil heat flux; ST, soil temperature.
Table 2. Root to shoot ratio characteristics of different grassland types in Xinjiang.
Grassland TypeR/SProportion of BGB to Total Biomass
Temperate Meadow Steppe20.5095.4%
Temperate Steppe23.1095.9%
Temperate Desert Steppe16.3694.3%
Alpine Steppe40.4097.6%
Temperate Steppe Desert35.3297.3%
Temperate Desert37.2197.4%
Lowland Meadow13.0092.9%
Montane Meadow10.5591.5%
Alpine Meadow30.5496.8%
Note: R/S and BGB refer to the root to shoot ratio and belowground biomass, respectively.
Table 3. AGB and BGB carbon density of grassland vegetation in different geomorphological regions of Xinjiang.
Geomorphological RegionalizationAGB Carbon Density (gC·m−2)BGB Carbon Density (gC·m−2)
Altai Mountains and Beita Mountains (M1)43.091083.96
Mountainous Area of West Junggar Basin (M2)47.231189.06
Eastern Tianshan Mountains (M3)39.02979.68
Western Tianshan Mountains (M4)53.681397.77
Kunlun Mountains and Altun Mountains (M5)35.541215.16
Junggar Basin (B1)44.051499.66
Tarim Basin (B2)42.55639.00
Xinjiang Area (XJ)44.341229.65
Note: AGB and BGB refer to the aboveground and belowground biomass, respectively.
Disclaimer/Publisher’s Note: The statements, opinions and data contained in all publications are solely those of the individual author(s) and contributor(s) and not of MDPI and/or the editor(s). MDPI and/or the editor(s) disclaim responsibility for any injury to people or property resulting from any ideas, methods, instructions or products referred to in the content.

