Article

Genome-Wide Identification of the bHLH Gene Family in Kiwifruit (Actinidia chinensis) and the Responses of AcbHLH84 and AcbHLH97 Under Drought Stress

1
College of Forestry, Southwest Forestry University, Kunming 650224, China
2
School of Chemical Biology and Environment, Yuxi Normal University, Yuxi 653100, China
3
Institute of Horticulture Crops, Yunnan Academy of Agricultural Sciences, Kunming 650205, China
4
Key Laboratory of Biodiversity Conservation in Southwest China, National Forest and Grassland Administration, Southwest Forestry University, Kunming 650224, China
*
Author to whom correspondence should be addressed.
These authors contributed equally to this work.
Agronomy 2025, 15(7), 1598; https://doi.org/10.3390/agronomy15071598
Submission received: 22 May 2025 / Revised: 23 June 2025 / Accepted: 27 June 2025 / Published: 30 June 2025
(This article belongs to the Section Crop Breeding and Genetics)

Abstract

Drought stress is one of the primary environmental factors affecting plant survival rates and productivity, and it is a key bottleneck restricting the development of the world kiwifruit industry. Therefore, studying the drought resistance-related genes and drought resistance mechanisms of kiwifruit is essential. The bHLH (basic helix-loop-helix) TF family plays a crucial role in the resistance of kiwifruit to abiotic stresses such as drought stress. In this study, we analyzed the response of the AcbHLH gene in kiwifruit under drought stress based on the kiwifruit genome database, transcriptome data, and metabolome data. One hundred eighty-seven AcbHLH genes were identified via bioinformatics and divided into eighteen subfamilies via phylogenetic analysis. The cis-acting elements of the AcbHLH gene are mainly hormone-related cis-acting elements. Under drought stress, 64 AcbHLH genes were significantly different, 5 AcbHLH genes whose expression significantly differed were randomly selected for qRT-PCR verification, and the correlation between the qRT-PCR results and the transcriptome data was high. The determination of plant hormone contents revealed that the contents of plant hormones, such as JA, changed markedly before and after drought stress. Through the combined analysis of transcriptome and metabolome data, it was speculated that AcbHLH84 and AcbHLH97 have functions similar to those of the MYC2 transcription factor and are the main downstream effectors in the JA signaling pathway; these functions could be activated and participate in the JA signaling pathway and that the activation of the JA signaling pathway would inhibit the production of reactive oxygen species. In turn, the drought resistance of kiwifruit is improved. The AcbHLH84 and AcbHLH97 genes could be candidate genes for breeding new transgenic drought-resistant kiwifruit varieties.

1. Introduction

Transcription factors (TFs) are a class of protein molecules with a distinctive structure that can regulate gene expression and activate or inhibit the transcription of a gene by binding to cis-acting elements in the promoter region of the gene of interest so that the gene of interest can be expressed in a specific time and space [1]. The bHLH (basic helix–loop–helix) TF family has been widely reported in plants, fungi, and animals; this family has pleiotropic regulatory functions and is one of the largest TF families in plants [2,3]. This family is characterized by basic helix-loop-helix structures [4], which play important roles in recognizing specific DNA sequences and performing biological functions [5,6].
bHLH transcription factors in plants were initially discovered in maize [7]. They are involved in the regulation of various abiotic stresses, including drought, cold, and salinity [8]. At present, genome-wide identifications and analyses have been performed on a variety of plants, such as Arabidopsis thaliana [6], rice (Oryza sativa L.) [9], potato (Solanum tuberosum L.) [10], soybean (Glycine max (L.) Merr.) [11], grape (Vitis vinifera L.) [12], apple (Malus x domestica) [13], Orange (Citrus reticulata) [14], and alfalfa (Medicago sativa L.) [8]. At present, most bHLH proteins that have been identified and functionally characterized in plants are Arabidopsis bHLH proteins, which are vital in ABA and JA hormone signal transduction and in response to various stresses, such as drought [15,16]. Ji et al. reported that the overexpression of ThbHLH1 in willow significantly improved tolerance to drought stress by reducing the accumulation of ROS [17]. MdSAT1 is an apple bHLHm1 TF, and the overexpression of MdSAT1 in A. thaliana improved drought tolerance by activating target genes in the ABA pathway [18]. Transcripts of the AtbHLH122 gene in A. thaliana are significantly upregulated under drought, high salinity, and osmotic stress [19]. More bHLH family genes have been identified in plants, and the understanding of bHLH transcription factors has gradually increased, while the biological functions of their genes have been progressively elucidated. However, the identification of their family members and their bioinformatics analysis in the field have not yet been reported, and there are also no studies on the response mechanism of kiwifruit bHLH family genes under drought stress.
Kiwifruit is a perennial deciduous vine of the genus Actinidia in the family Actinidiaceae [20]. Kiwifruit fruit has high nutritional and economic value. Kiwifruit fruit is considered one of the most nutrient-rich fruits among commonly consumed fruits and is often referred to as a “healthy fruit” [21]. The extract of kiwifruit fruit has been shown to support the growth of good microflora while inhibiting harmful microflora [22]. According to FAO data from 2022, the total output of kiwifruit worldwide is 4,539,400 tons, of which 2,380,300 tons are in China, mainly Actinidia chinensis and A. deliciosa [23]. In recent years, due to the impact of global warming, the number of drought events and their severity have increased in drought-prone areas, leading to decreases in kiwifruit yield and fruit quality [24]. The main environmental factors affecting the plant survival rate and productivity include moderate drought (40–45% field water holding capacity) and severe drought (25–30% field water holding capacity) [25,26]. Drought stress can significantly delay the germination of flowers and impact their development and appearance [27]. Long-term drought stress leads to insufficient water in plant tissues, resulting in leaf curling and folding [28] and reducing plant photosynthetic efficiency and chlorophyll content [29]. Kiwifruit usually evolves in areas with high humidity and is less resistant to drought stress; thus, water shortages during the growing season can negatively affect the growth and productivity of kiwifruit, becoming a key bottleneck in the development of the world kiwifruit industry [30]. Genetic engineering is considered one of the most reliable and effective methods for breeding new plant stress-resistant varieties [31], so it is crucial to study the drought resistance genes and drought resistance mechanisms of kiwifruit.
In recent years, transcriptome sequencing technology has been widely used in the study of all aspects of plants, including drought resistance, cold resistance, salt tolerance, disease resistance, insect resistance, and other types of stress resistance in higher plants; this approach provides an effective method for breeding resistant varieties and is convenient for the in-depth study of plant molecular mechanisms [32]. Metabolites are also indispensable for the regulation of plant development [33], and metabolomics studies the qualitative and quantitative determination and analysis of metabolites in organisms through high-throughput chemical analysis techniques to study the changes in metabolic pathways and the differences in metabolite levels [34,35]. Multiomics refers to the combined application of two or more types of analyses to large datasets, and one of the more common multiomics studies today is joint transcription-metabolism analysis [36]. By integrating multiomics data and analyzing them globally, it is possible to compensate for the shortcomings of traditional single-omics studies, which are not sufficiently comprehensive and better understand biological activities at the system level [37]. Yang et al. revealed the mechanism of chito-oligosaccharide alleviation of sugarcane drought stress through transcriptional metabolism [38], Chen et al. revealed that the starch and sucrose metabolism pathways are among the key pathways affecting the drought resistance of watermelon plants [39], and Yang et al. reported that H. ammodendron could respond to drought stress by altering the expression of genes associated with the auxin synthesis pathway and slowing its growth via transcriptome metabolism combined analysis [40]. The purpose of this study was to comprehensively study bHLH transcription factor family members in the whole genome of kiwifruit and to identify them via physicochemical property analysis, phylogenetic analysis, gene structure and conserved motif analysis, cis-acting element analysis, chromosome mapping, and GO and KEGG enrichment analysis. The expression pattern of kiwifruit under drought stress was analyzed via transcriptional-metabolic analysis, and the mechanism of bHLH transcription factors involved in JA signaling and drought resistance was explored. The focus of this study was to screen the drought resistance genes of the kiwifruit bHLH family via combined transcription-metabolism analysis and explore the drought resistance mechanism of kiwifruit bHLH genes to provide a theoretical basis for the further cultivation of new drought-resistant kiwifruit varieties in the future.

2. Materials and Methods

2.1. Gene Family Identification and Physicochemical Property Analysis

The kiwifruit genome data (Hong Yang v3) were downloaded from the Kiwifruit Genome Database (http://kiwifruitgenome.org/, accessed on 3 July 2024) [41]. The genomic data of rice and apple were downloaded from the JGI (https://riceome.hzau.edu.cn/, accessed on 4 July 2024) and the Rosaceae (https://www.rosaceae.org/, accessed on 4 July 2024) genome databases, respectively [42].
First, the HMM map of the bHLH domain (ID: PF00010) was downloaded from the Pfam database (http://pfam.xfam.org/, accessed on 5 July 2024) for HMMER (v3.3.2) to identify potential bHLH genes from the kiwifruit genome and screen out the e value < 1 × 10⁻⁵ family member sequences. Then, 158 members of the bHLH family were collected from TAIR (TAIR 11), and the members of the bHLH gene family were identified in the kiwifruit genome via BLAST (v2.14.0) to obtain e values < 1 × 10⁻⁵ [43]. The sequence intersections obtained via the two methods were extracted and submitted to CD-Search (https://www.ncbi.nlm.nih.gov/Structure/bwrpsb/bwrpsb.cgi, accessed on 1 September 2024) and, SMART (http://smart.embl-heidelberg.de/, accessed on 1 September 2024) of NCBI to screen the identified members for missing or incomplete sequences with conserved domains. The rest are members of the kiwifruit bHLH family [44]. It is named according to its position on the chromosome, and the name is AcbHLH + ordinal number [45]. Physicochemical property analysis was performed via the online software ProtParam (http://www.ExPASy.org/tools/protparam.html, accessed on 7 September 2024) [46]. Finally, subcellular localization was performed via the Plant-mPLoc (Plant-mPLoc server (sjtu.edu.cn), accessed on 8 September 2024) online tool [47].

2.2. Phylogenetic Analysis

First, 187 bHLH sequences from kiwifruit and 158 bHLH sequences from A. thaliana were merged and aligned via MEGA11.0 software and pruned via TBtools software (v2.154) [48]. Second, the phylogenetic tree was constructed via the maximum likelihood (ML) method with MEGA11.0 software and IQtree (v2.16.12)(IQtree used the best model JTT+F+R6). Finally, the phylogenetic tree beautification tool Chiplot (https://www.chiplot.online/, accessed on 25 August 2024) was used to establish a phylogenetic tree [49], and 187 kiwifruit bHLH genes were grouped according to the grouping of Arabidopsis bHLH genes.

2.3. Gene Structure and Conserved Motif Analysis

To further analyze the gene structure and composition of the conserved motif of the bHLH gene family in kiwifruit, the gene structure of each gene was analyzed according to the kiwifruit genome annotation file (GFF3) via TBtools software, and the conserved motif gene contained in the kiwifruit bHLH gene was predicted via the online motif prediction tool MEME (https://meme-suite.org/meme/, accessed on 3 September 2024). The MEME-related parameters were as follows: the minimum width was 6 bp, the maximum width was 50 bp, and the number of motifs was set to 10 [45]. Finally, TBtools software was used for visualization.

2.4. Analysis of Cis-Acting Elements

The nucleotide sequences 2000 bp upstream of each kiwifruit bHLH gene were extracted from the genome annotation file (GFF3) via TBtools software [20,49], and promoter cis-acting element analysis was subsequently performed via the online analysis software PlantCARE (https://bioinformatics.psb.ugent.be/webtools/plantcare/html/, accessed on 10 September 2024) [50].

2.5. Chromosome Localization and Collinearity Analysis

Chromosome position information was obtained from the genome annotation file (GFF3), and chromosome position mapping was performed via TBtools software. The chromosomal length, position, and density information of the AcbHLH genes were extracted via TBtools [51]. GFF gene sequence files of Arabidopsis, apple, and rice were downloaded from the TAIR Arabidopsis gene database, the GDR Rosaceae gene database, and the JGI rice gene database, respectively, and interspecific correlations were constructed via the One Step McscanX-Super Fast and Dual Systeny Plot for McscanX functions of TBtools software, with all parameters set to defaults [47].

2.6. GO Function and KEGG Pathway Enrichment Analysis

The protein sequences of the AcbHLH transcription factor family were extracted from the whole-genome protein sequence file of kiwifruit, and the proteins of 187 AcbHLH genes were functionally annotated via the EggNOG-MAPPER database (http://eggnog-mapper.embl.de/, accessed on 18 September 2024) [52]. TBtools was subsequently used to analyze the GO functional enrichment and KEGG pathway enrichment of the bHLH genes in kiwifruit, which were plotted and visualized via the online tool ChiPlot (https://www.chiplot.online/bar_plot_width_category, accessed on 20 September 2024) [51].

2.7. Drought Stress Treatment, Transcriptome Sequencing, and Hormone Expression Determination of Kiwifruit Leaves

The optimum humidity for the growth of kiwifruit is 80–85%, and kiwifruit is under moderate drought stress when the relative soil water content is 40–45% [25]. Leaves of ‘Hongyang’ kiwifruit harvested from Southwest Forestry University (25°04′ N, 102°45′ E) were selected as explants, and kiwifruit seedlings were obtained by histoculture technology [45]; the cultured seedlings were used as research material after 3 months of refining. The successfully refined seedlings were then transplanted into pots that were 9.8 cm wide at the top, 6.8 cm wide at the bottom, and 8.5 cm high. Eighteen kiwifruit seedlings of the same size were selected as experimental materials. First, the humidity of all the planted soils was maintained at 80–85%. Then, eighteen kiwifruit seedlings were divided into two groups of nine plants each, with one group used as the control group. Soil moisture was maintained at 80–85% for 72 h, and the plants were then divided into three groups: CK1, CK2, and CK3. The other nine plants were subjected to drought treatment in which the relative soil moisture content was lowered by stopping watering until it reached 40–45% and then timed, with measurements taken every 24 h, the plants were rehydrated when the relative soil moisture content fell below 40%, and the relative soil moisture content was maintained at 40–45% for the next 72 h. An insertion soil moisture meter (Suncota Intelligent Equipment Co., Ltd., Shenzhen, China) was used to determine relative soil moisture content. Plants from both treatment groups were placed in the greenhouse at 25 °C for incubation, with light conditions alternating between 12 h of natural light and 12 h of dark incubation. The treatment groups were randomized into three groups in order of position and numbered T1, T2, and T3. There were three samples in each numbered group, and the leaves of each sample were removed as experimental materials. RNA was extracted via the TRIzol® protocol (Invitrogen, Thermo Fisher Scientific, Darmstadt, Germany). The RNA concentration was determined via a NanoDrop Spectrophotometer (Peqlab, Erlangen, Germany), and RNA integrity was confirmed by denaturing agarose gel electrophoresis. The RNA was stored in liquid nitrogen, after which transcriptome and metabolome measurements were performed by an external company (Mindwell Metabolic Biology Co., Ltd., Wuhan, China). Transcriptome measurements were performed via Illumina sequencing, and the transcriptome data were normalized via the FPKM method. Metabolomic measurements were performed on twelve metabolites of the plants via inlet liquid chromatography-mass spectrometry tandem mass spectrometry (LC-MS/MS) targeting metabolomics. The twelve metabolites are listed below: gibberellin 20 (GA20), gibberellin 19 (GA19), jasmonic acid-valine (JA-Val), jasmonic acid-isoleucine (JA-ILE), jasmonic acid-phenylalanine (JA-Phe), jasmonic acid (JA), abscisic acid (ABA), abscisic acid glucosinolate (ABA-GE), abscisic aldehyde (ABA-ald), 1-aminocyclopropane carboxylic acid (ACC), 12-hydroxyjasmonic acid (12-OH-JA), and 12-oxo-phytodienoic acid (OPDA).

2.8. qRT-PCR Analysis

We then sought to verify the expression of five genes, AcbHLH44, AcbHLH84, AcbHLH89, AcbHLH97, and AcbHLH167, under drought stress. The leaves of kiwifruit grown at a soil moisture of 80–85% were used as the control group (CK1, CK2, and CK3), and the leaves of kiwifruit grown at a soil moisture of 40–45% for 72 h were used as the treatment group (T1, T2, and T3). Using the Plant RNA Extraction Kit (DP432) (Tiangen Biotech Co., Ltd., Beijing, China), total RNA from kiwifruit leaves was extracted and reverse transcribed into cDNA via the FastKing RT Kit (KR116). The reverse transcribed cDNA was mixed with a 10-fold dilution and mixed well for quantitative PCR experiments. β-Actin (Actin-related protein, id: Actinidia15122) was used as the reference gene [53], and qRT-PCR primers were designed via Primer 6.0 (Table A1). Standard qRT-PCR was performed via the SYBR Green qPCR Master Mix Kit in at least three replicates for each gene. Finally, Excel software (v16.0) was used for relative expression analysis and graphing.

2.9. Statistics

The above data were collected in aggregate to ensure that there were three replicates for each group of experiments. Finally, a t test and one-way analysis of variance were performed on the data via SPSS v21 software (International Business Machines Corporation, Armonk, NY, USA), and the normality of the transcriptome data was verified via featureCounts v2.0.3 software (default parameter) to ensure that the data conformed to a normal distribution and that the assumption of homogeneity was not involved in the data validation. Multiple hypothesis testing was used to correct for p values.

3. Results

3.1. Identification and Physicochemical Properties of the bHLH Gene Family in Kiwifruit

Based on the protein sequences of the Arabidopsis bHLH gene family, the protein data of the kiwifruit genome were searched via BLAST and hmmsearch, and the genes of the bHLH gene family of kiwifruit were subsequently predicted via CDD and Pfam to remove incomplete or nonexistent domains. A total of 187 bHLH genes were identified (Figure 1, Table A1). These genes are named AcbHLH1-AcbHLH187 from top to bottom according to their position on the chromosome. The protein length of the bHLH gene in kiwifruit varies greatly, ranging from 126 (AcbHLH36) to 862 (AcbHLH21) amino acids. The molecular weights ranged from 14.05 (AcbHLH36) to 94.44 (AcbHLH21) kDa, the pI ranged from 4.62 (AcbHLH168) to 10.53 (AcbHLH88), the instability index ranged from 12.81 (AcbHLH95) to 79.93 (AcbHLH68), and the aliphatic index ranged from 48.89 (AcbHLH36) to 106.63 (AcbHLH152). The prediction of subcellular localization via the Plant-mPLoc tool revealed that all the proteins were located within the nucleus (Table A1).

3.2. Phylogeny of the AcbHLH Gene Family in Kiwifruit

To understand the relationships among bHLH genes in different species, a phylogenetic tree was constructed using amino acid sequences encoded by 187 bHLH genes and 158 bHLH genes in A. thaliana. The clustering results (Figure 2A) revealed that the kiwifruit bHLH genes can be classified into 17 subfamilies and that A. thaliana genes can be classified into 18 subclades. Subfamily VI. did not have the kiwifruit bHLH gene; we hypothesize that the AcbHLH gene of this subclade may have been mutated during evolution. According to the data of each subfamily (Figure 2B), the number of genes in subfamily III. was the largest (51), including 22 in A. thaliana and 29 in kiwifruit. As regards orphans or subfamily XV., both subfamilies contain only one AcbHLH gene (AcbHLH88 and AcbHLH79, respectively). The XIV subfamily has the lowest number of genes, containing only six bHLH genes, including two AcbHLH genes and four AtbHLH genes. Except for a few genes, the clustering relationship of the phylogenetic tree showed good agreement with the classification of bHLH genes in kiwifruit, and the genes that were closely related in the identification process were usually classified into the same subfamily.

3.3. Gene Structure and Conserved Motif Analysis of the AcbHLH Gene

To study the amino acid sequence characteristics of the AcbHLH gene, the motif composition of the protein sequence was analyzed via the MEME online tool. The results (Figure 3B) revealed that conserved motifs 1 and 2 are highly conserved, but the same motif is present in different protein sequences, which may be related to the structure and function of the protein. Motif 2 is present in all AcbHLH genes except AcbHLH32, and Motif 1 is present in 69% of AcbHLH genes, indicating that these two motifs are highly-conserved. For example, AcbHLH2, 3, 23, 32, 34, 35, 39, 56, 101, and 135 all belong to the X.I. subfamily, but Motif 2 does not appear in AcbHLH32, which may be due to differences between bHLH transcription factor families under specific conditions. In addition, we identified motif 9, which is characterized by polyG motifs, in eight genes (AcbHLH20, 29, 48, 74, 130, 131, 143, and 150), suggesting that these genes may be involved in protein-protein or protein-RNA interactions and are important in the cell wall structure, stress response, and gene regulation [54].
The distribution of conserved motifs in the AcbHLH gene family may also be influenced by gene structure. The distribution of gene structure is the key to studying evolution within gene families, and gene structure analysis of 187 AcbHLH genes revealed that most of the 187 kiwifruit bHLH genes (185) were within 18 kb in length, and the remaining two genes were approximately 22 kb in length and 16 kb in length, respectively. The number of introns and exons of the bHLH gene in kiwifruit was quite different, with the number of introns ranging from 1 to 14 and the number of exons ranging from 1 to 15. Among them, AcbHLH115 and AcbHLH77 have only one exon, and AcbHLH23, 39, 58, 67, 77, 88, 100, 113, 114, 115, 116, 155, 163, 168, 178, and 185 have only one intron. The AcbHLH12 gene has the greatest number of introns and exons.

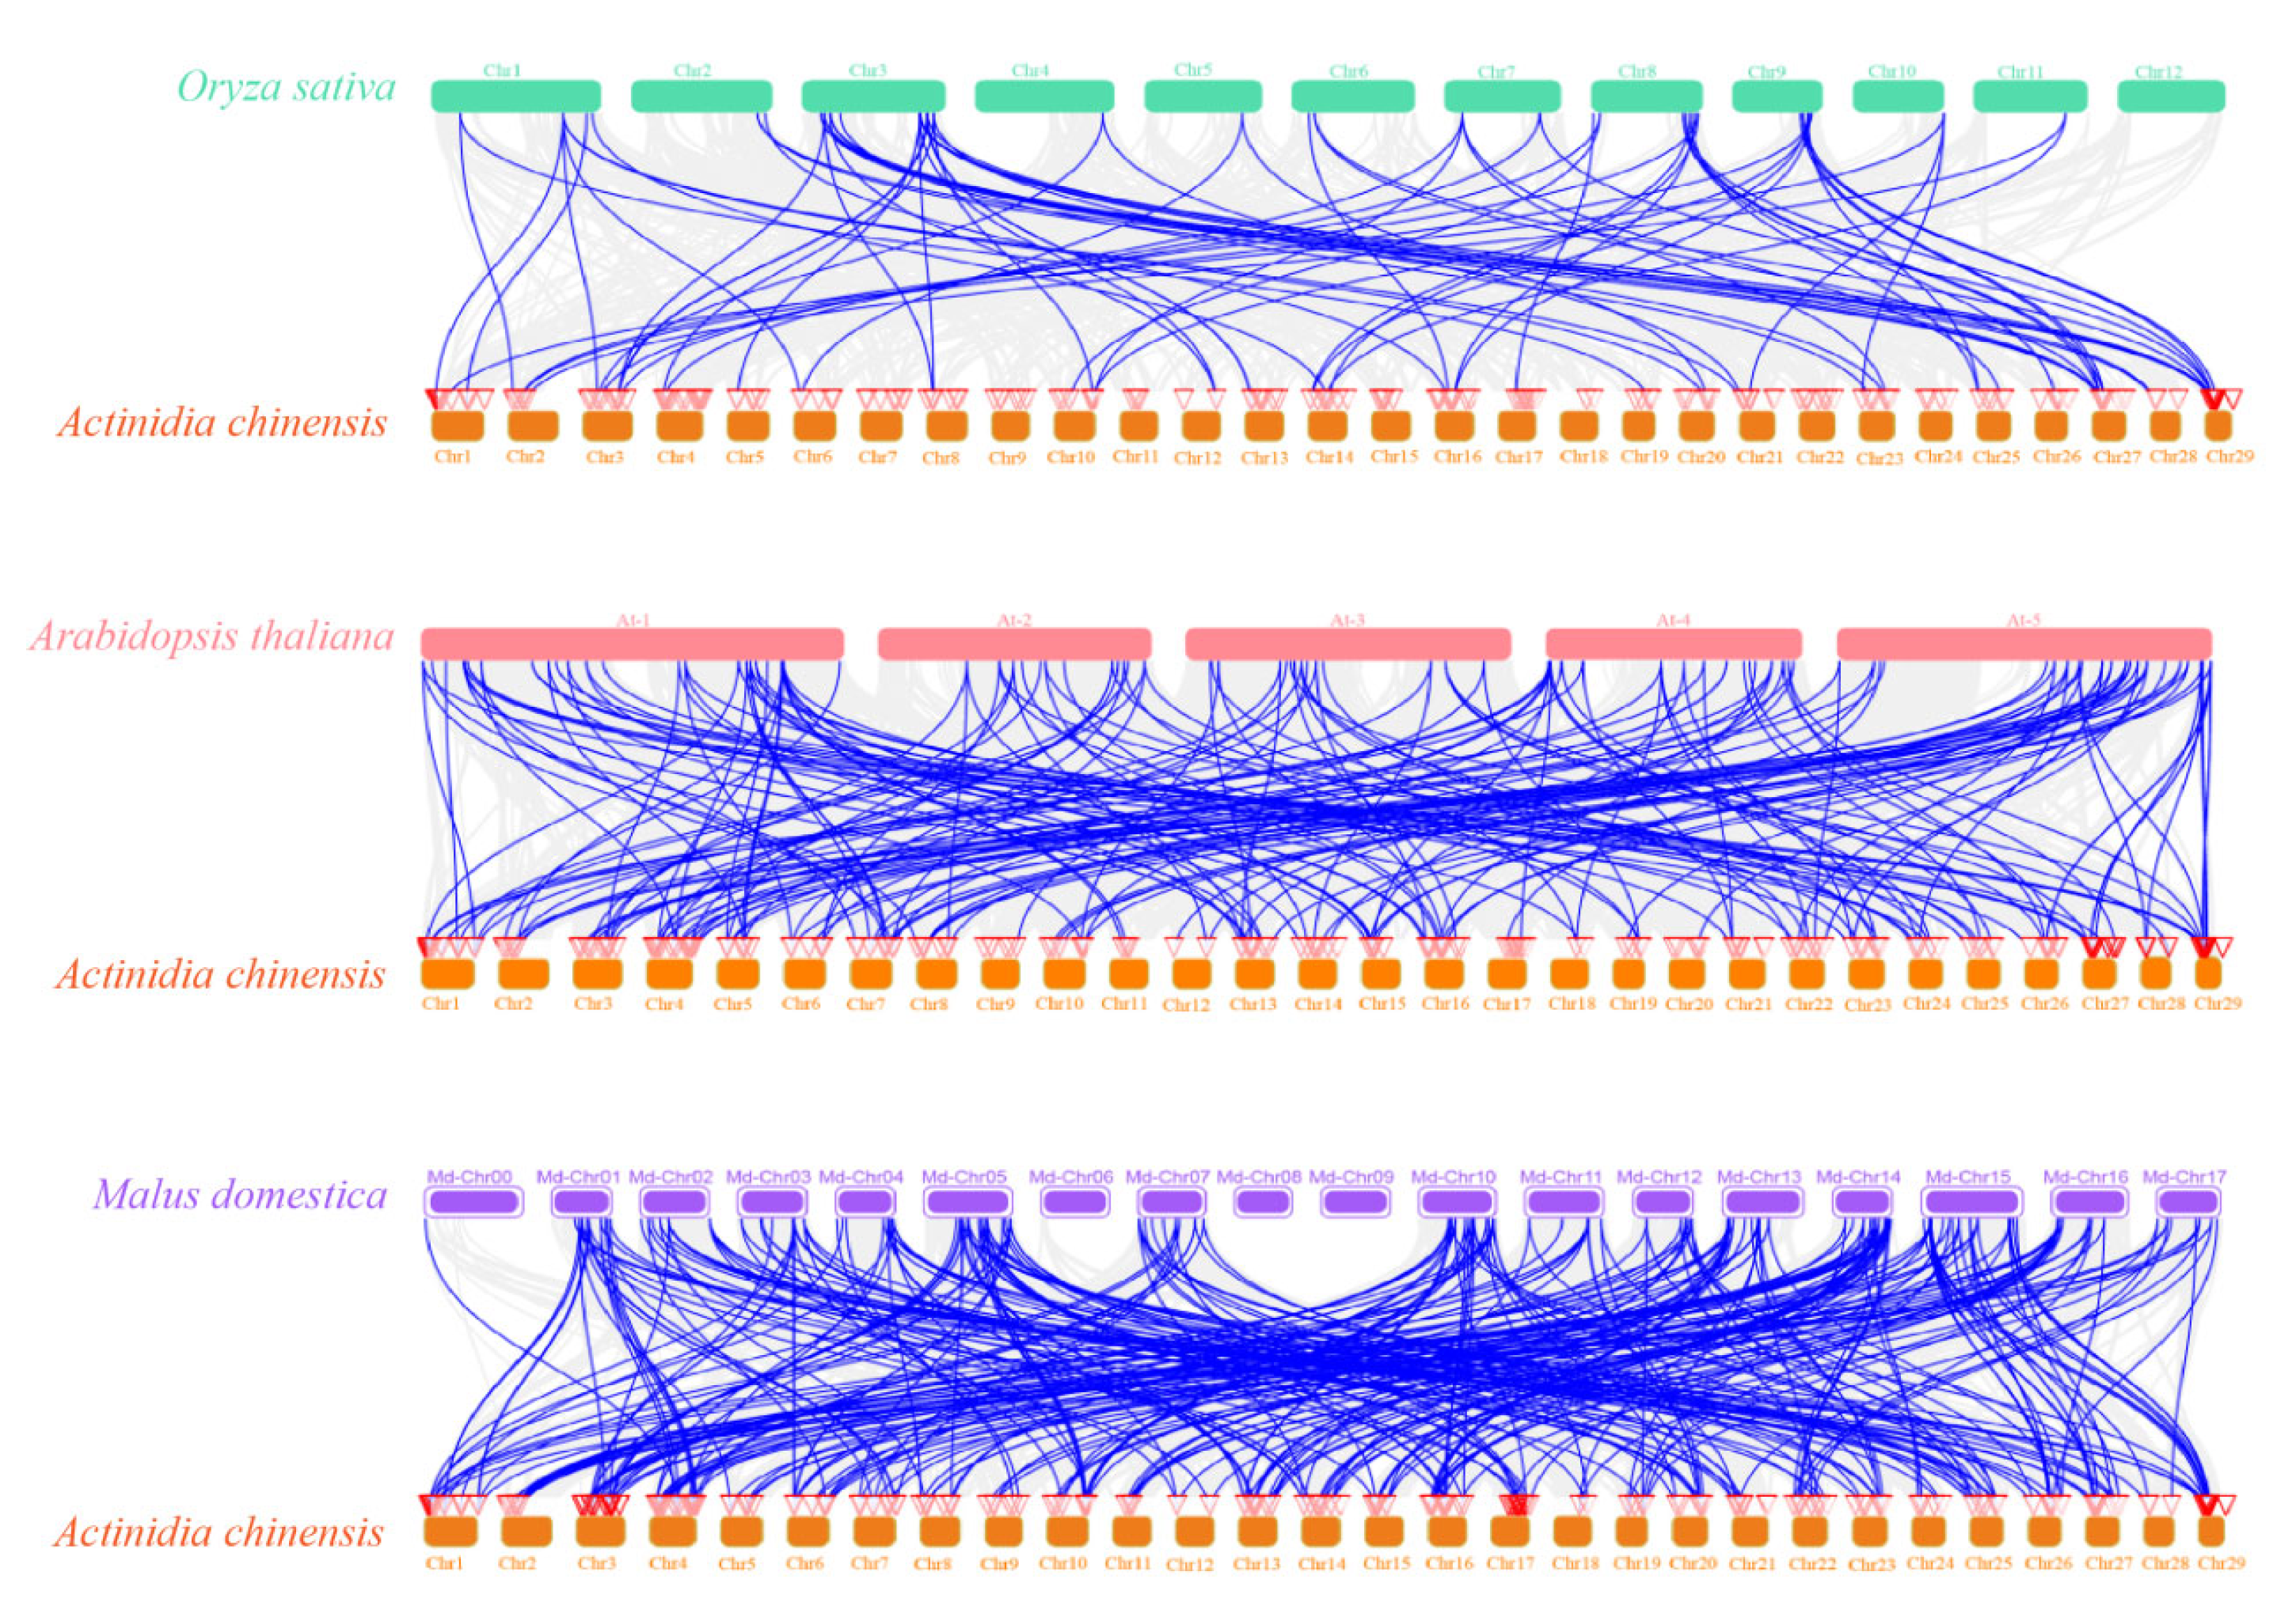
3.4. Chromosomal Mapping and Duplication Gene Analysis of AcbHLH Genes in Kiwifruit

The results of chromosome mapping (Figure 4) revealed that the 187 bHLH genes were unevenly distributed on 29 chromosomes, with the most genes mapped to chromosome 4 (13) and the fewest genes mapped to chromosome 12 (2). Gene duplication is an important means of gene family expansion in plants. In this study, 115 pairs of fragment repeat genes were found in 187 AcbHLH genes, and these fragment duplication genes were distributed on 27 chromosomes (excluding chromosomes 1 and 29), among which 17 pairs of fragment duplication gene pairs were found on chromosome 3, accounting for the largest proportion. These results suggest that fragment repeats are important in AcbHLH family expansion.
In addition, the bHLH collinearity between kiwifruit, rice, A. thaliana, and apple was analyzed, and the results (Figure 5) revealed that kiwifruit and apple presented the most homologous gene pairs and that kiwifruit and rice presented the fewest homologous gene pairs. These results suggest that kiwifruit is more closely evolutionarily related to apple than to rice.

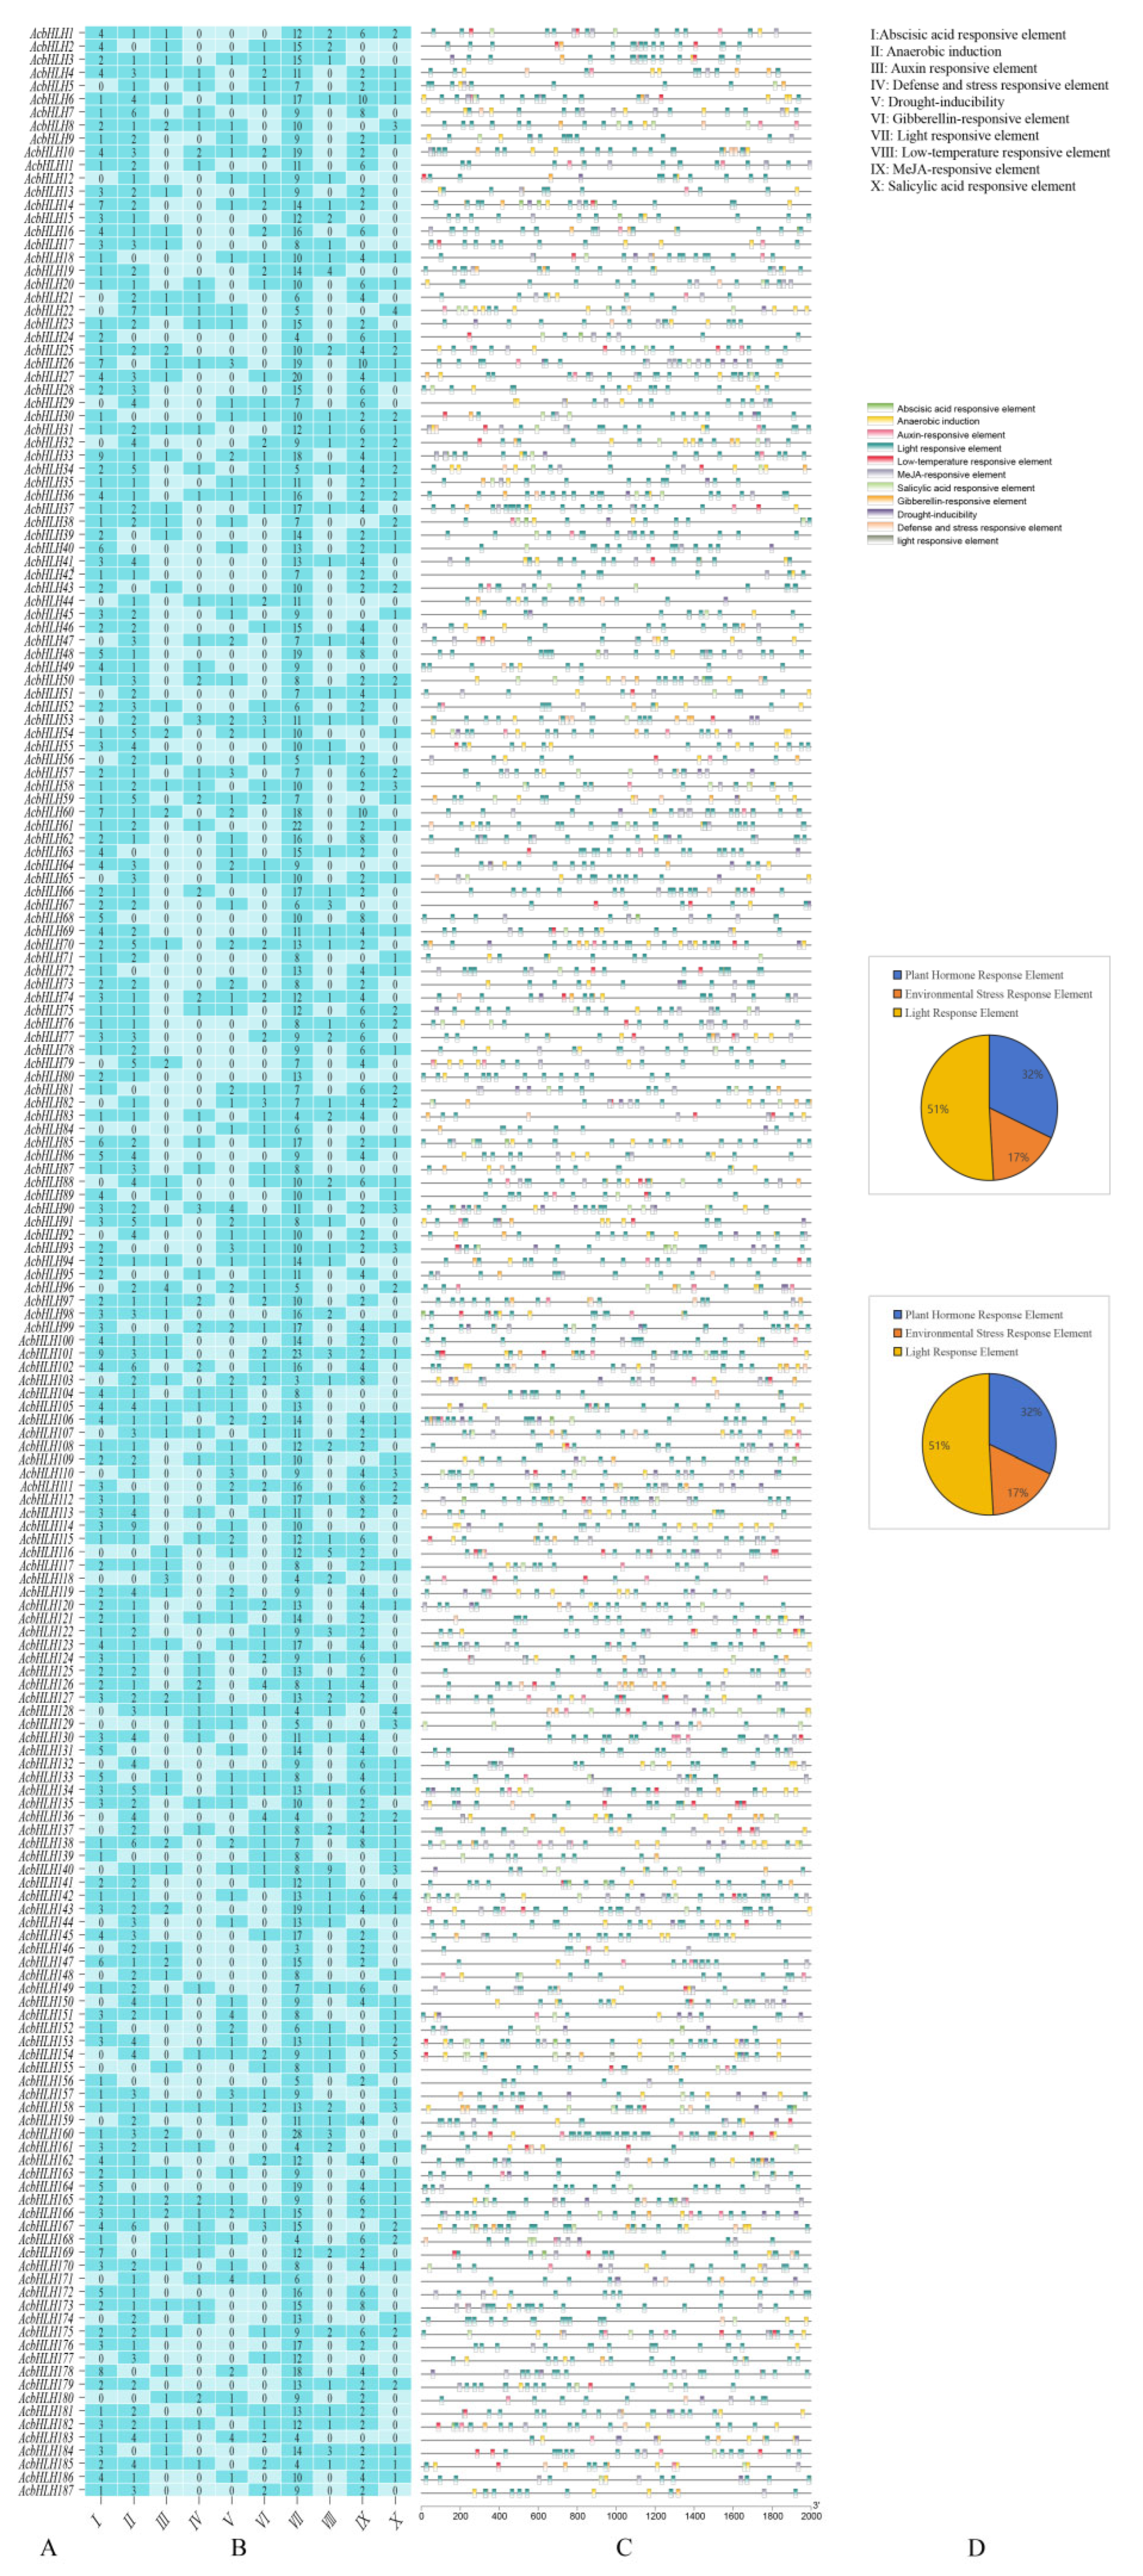
3.5. Analysis of Cis-Acting Elements of AcbHLH Gene Family Promoters in Kiwifruit

To understand the response mechanism of the kiwifruit bHLH gene, the online software PlantCARE was used to predict the cis-acting elements of 187 promoters upstream of 2000 bp of the AcbHLH gene. A total of 4024 promoter cis-acting elements were identified (Figure 6A–C), which can be divided into five categories: plant hormone response elements, environmental stress response elements, light response elements, plant-specific regulatory elements, and MYB binding sites. The percentages of light response elements (50.97%) > plant hormone response elements (31.81%) > environmental pressure response elements (17.22%) (Figure 6D). In summary, in addition to light-responsive elements, 49.03% of the promoter elements can regulate the expression of genes and the metabolism of substances in plants to increase their resistance and improve their adaptation to adverse environments. Among these promoter elements, phytohormone response elements accounted for the greatest proportion, suggesting that phytohormones may play a role in the plant response to external disturbances.

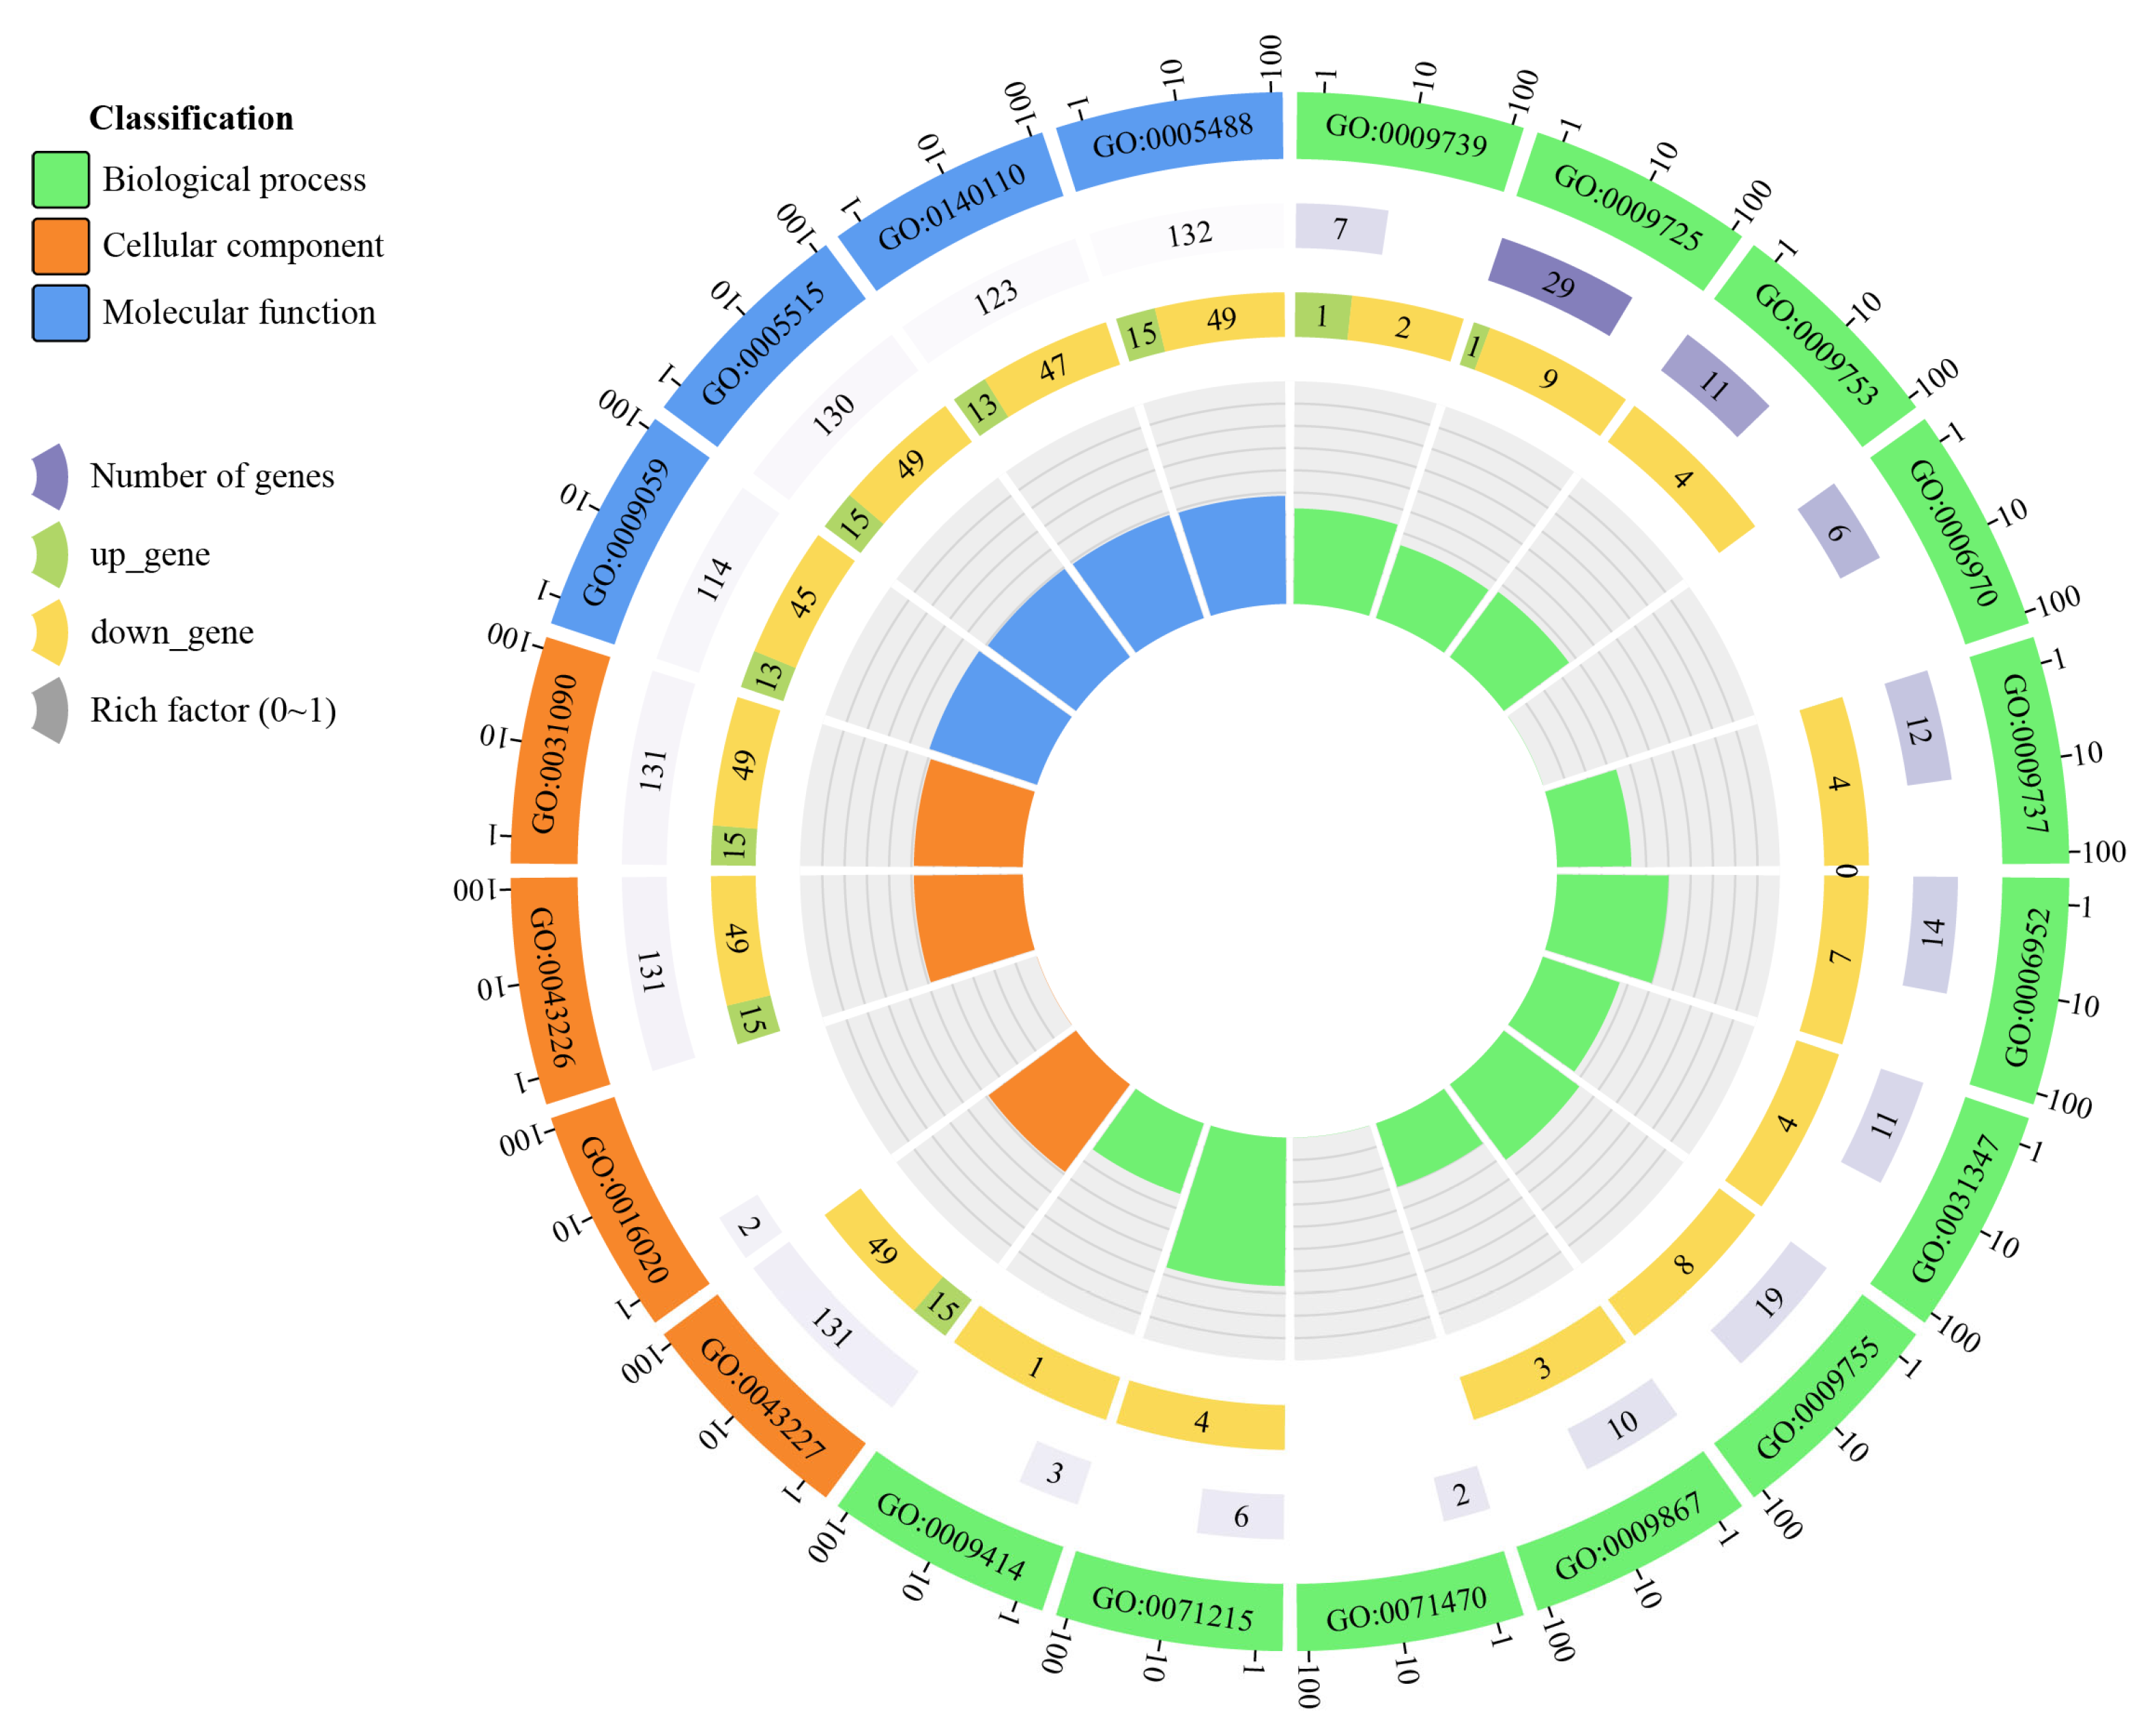
3.6. GO Functional Enrichment Analysis

GO functional enrichment analysis helps to understand the various potential molecular functions of genes encoding proteins and thus further elucidates the functions of genes. To understand the regulatory role of kiwifruit genes under drought stress, the EggNOG-MAPPERS database was used to annotate the gene functions of 187 AcbHLH genes. GO functional enrichment analysis was performed in combination with transcriptome data. The results revealed that the 187 AcbHLH genes were annotated into three categories: biological process, cellular component, and molecular function. The number of genes enriched in different GO terms of biological processes ranged from 2–29, with the greatest number of genes enriched in response to hormones (29), the hormone-mediated signaling pathway (19), and defense response (14), suggesting that the AcbHLH gene plays a role in hormone and plant stress. Different cellular component terms were enriched with between 2–131 genes, among which the most enriched genes were membrane-bound organelles (131), organelles (131), and organelle membranes (131), suggesting that AcbHLH genes are related to biofilms in some way. The genes enriched in GO terms with different molecular functions ranged from 114 to 132, among which the most enriched genes were binding (132), protein binding (130), and transcription regulator activity (123), suggesting that AcbHLH genes are related to transcription and binding processes related to transcription and binding processes. These findings indicate that the AcbHLH gene may enable plants to adapt to undesirable environments by regulating the levels of hormones, including JA, gibberellin (GA), ABA, etc., and regulating the osmotic potential in cells (Figure 7, Table A2).

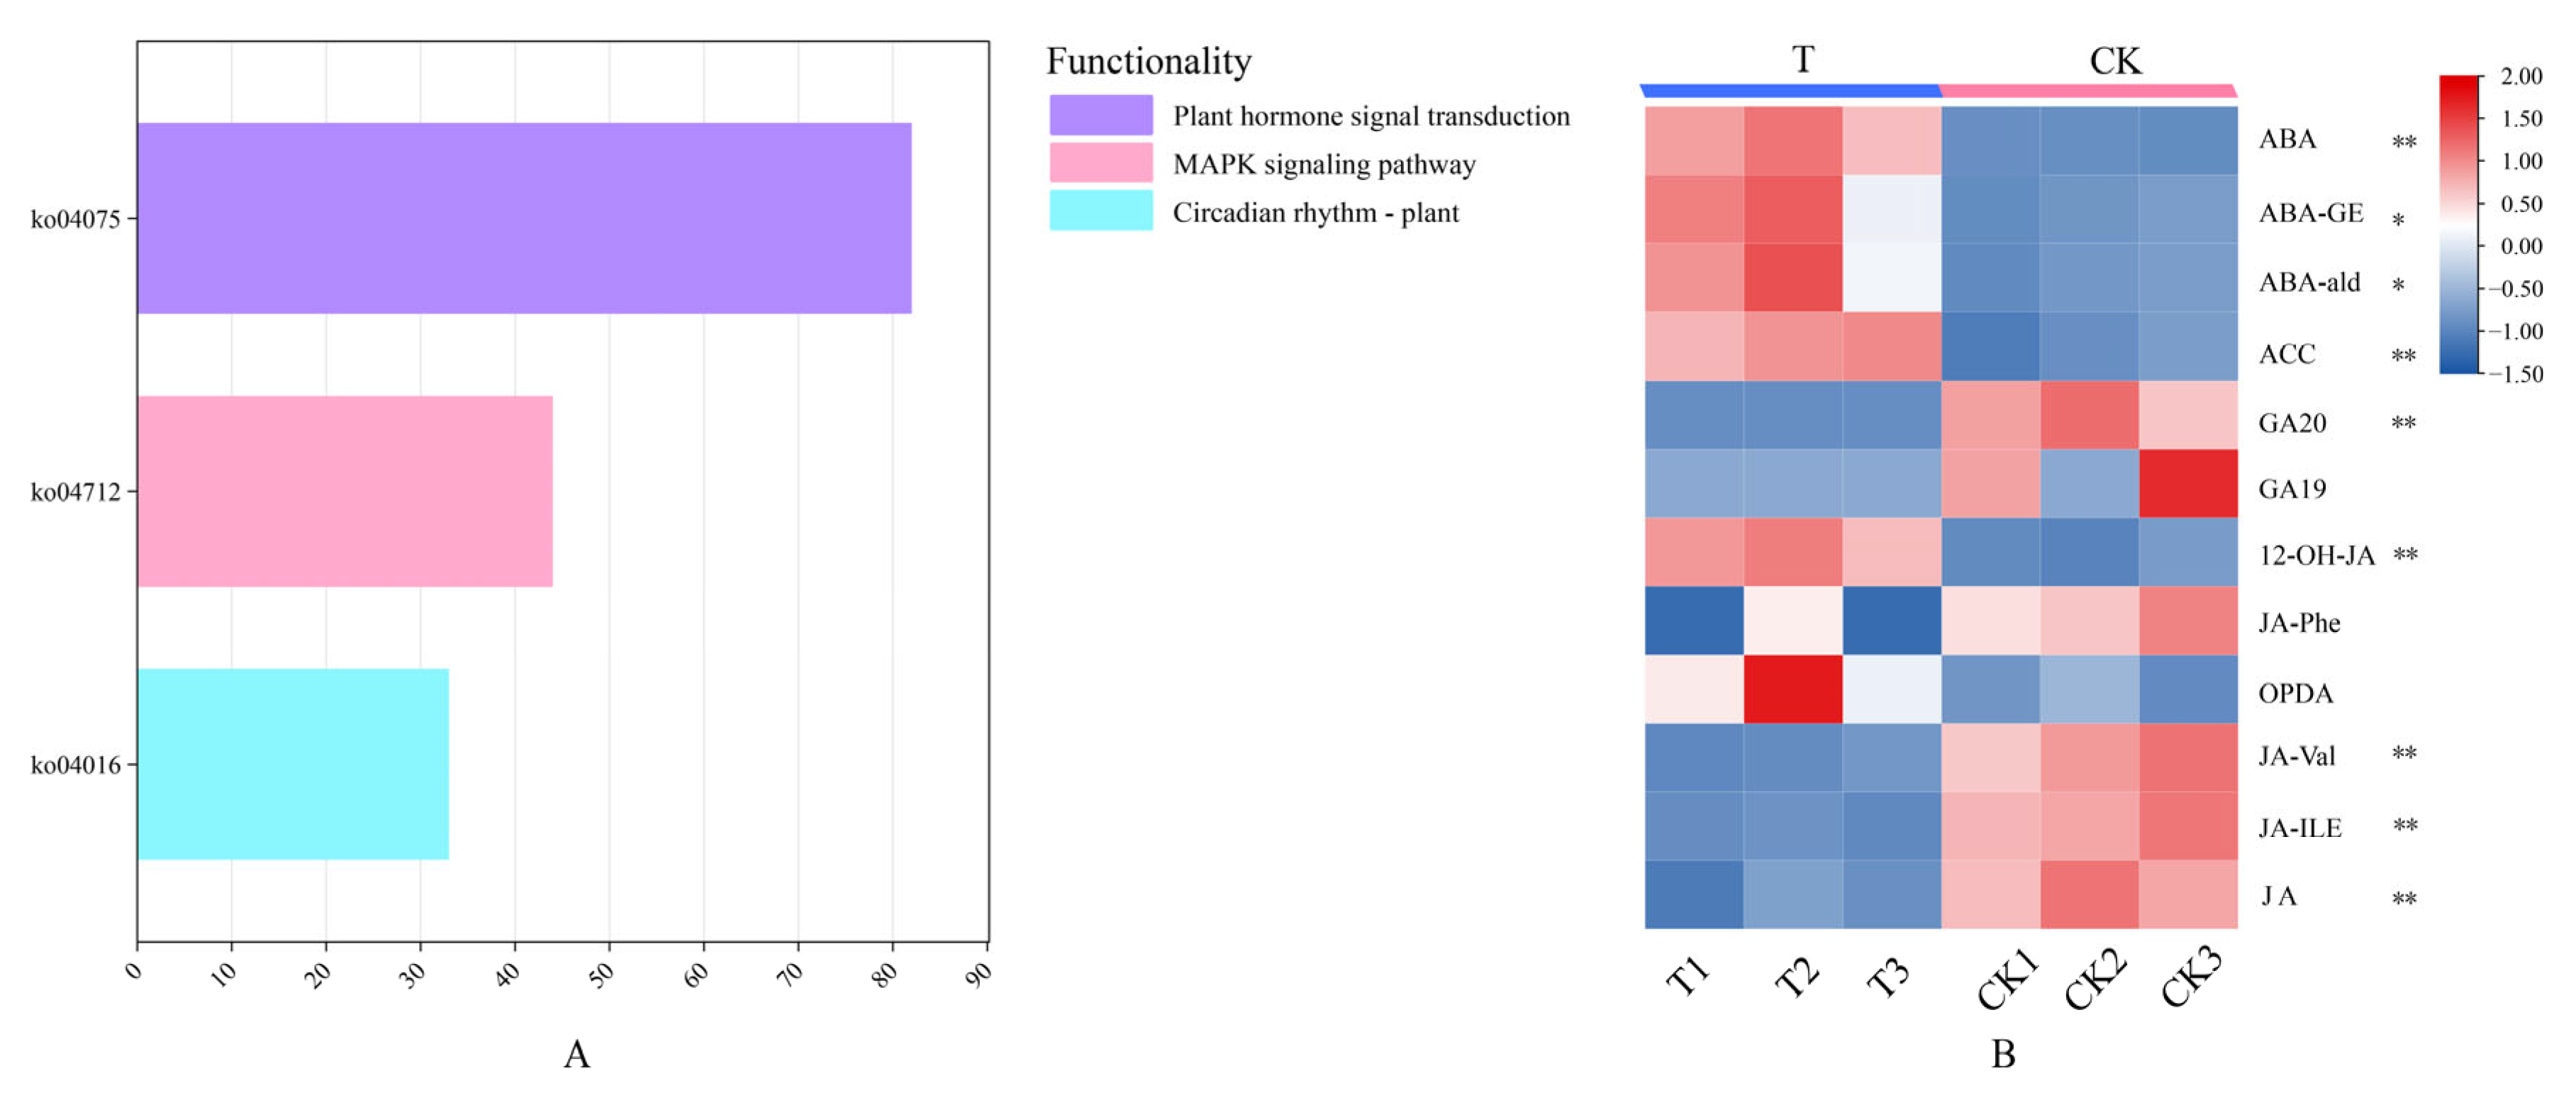
3.7. KEGG Enrichment of the AcbHLH Gene Family and Metabolite Analysis of Kiwifruit Under Drought Stress

To understand the biological function of the AcbHLH gene under drought stress, KEGG enrichment analysis was performed on the AcbHLH gene under drought stress. The results revealed that 82 AcbHLH genes were enriched in plant hormone signal transduction and that 33 AcbHLH genes were enriched in the MAPK signaling pathway in plants under drought stress (Figure 8A, Table A3). Combined with the transcriptome data (Figure 8A), the differentially expressed genes AcbHLH44, AcbHLH84, AcbHLH89, AcbHLH97, and AcbHLH167 were enriched for plant hormone transduction and the MAPK signaling pathway. Studies have shown that cells are able to respond to a range of stresses, including drought stress, by modulating the MAPK cascade and that hormones such as ABA and JA affect signaling through the MAPK cascade [55].
Plant hormones play a key role in helping plants adapt to arid environmental conditions [56,57]. To understand the regulatory effects of hormones on drought stress in kiwifruit, the contents of hormone metabolites under drought stress in kiwifruit were determined via secondary metabolomics. Compared with those in the control group (CK, 0 h drought), the contents of 12 hormones in kiwifruit under drought stress (72 h) changed (Figure 8B, Table A4), the values in the heatmap are ln count values, and the row scale is processed using the TBtools software, with Normalized selected for the scale method. The contents of gibberellin 20 (GA20), jasmonic acid-valine (JA-Val), jasmonic acid-isoleucine (JA-ILE), and jasmonic acid (JA) decreased significantly. In contrast, the contents of abscisic acid (ABA), abscisic acid glucosate (ABA-GE), abscisic aldehyde (ABA-ald), 1-aminocyclopropane carboxylic acid (ACC), and 12-hydroxyjasmonic acid (12-OH-JA) increased significantly. These hormone shifts, particularly ABA increases and JA decreases, align with the upregulation of drought-related bHLH genes, suggesting that hormonal regulation is a likely mechanism.

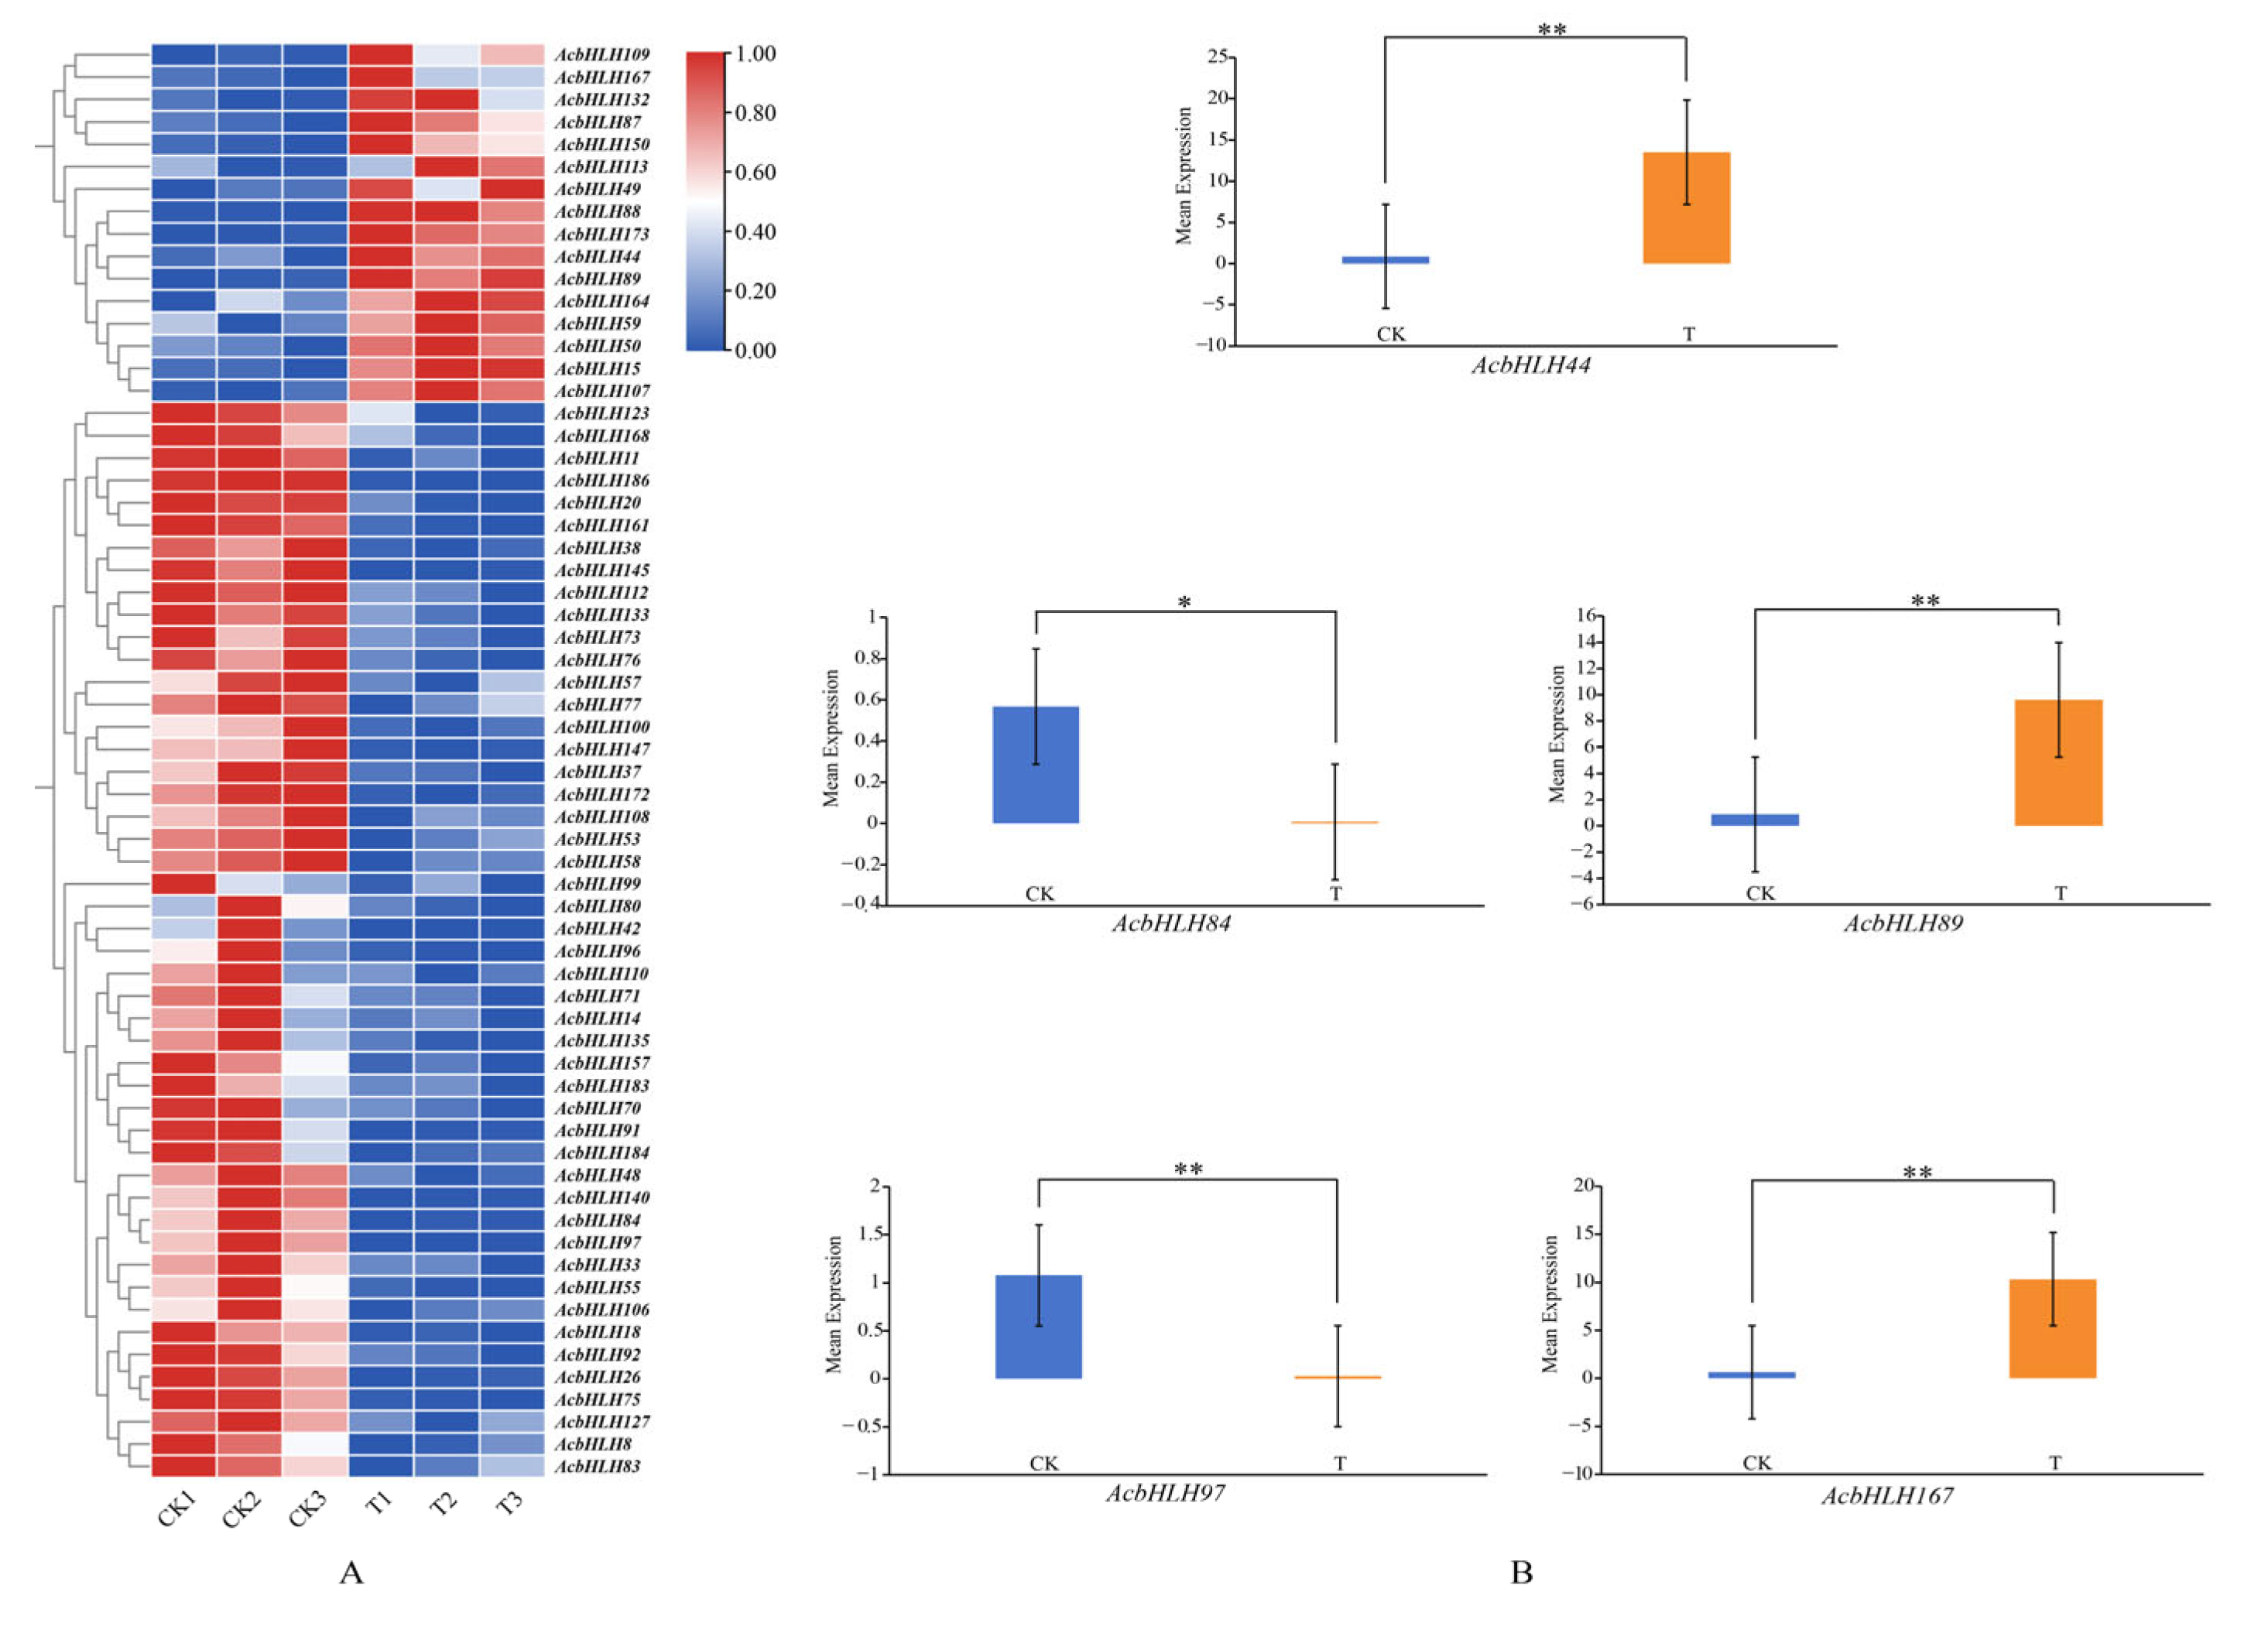
3.8. Expression Pattern and qRT-PCR Analysis of bHLH Genes in Kiwifruit Under Drought Stress
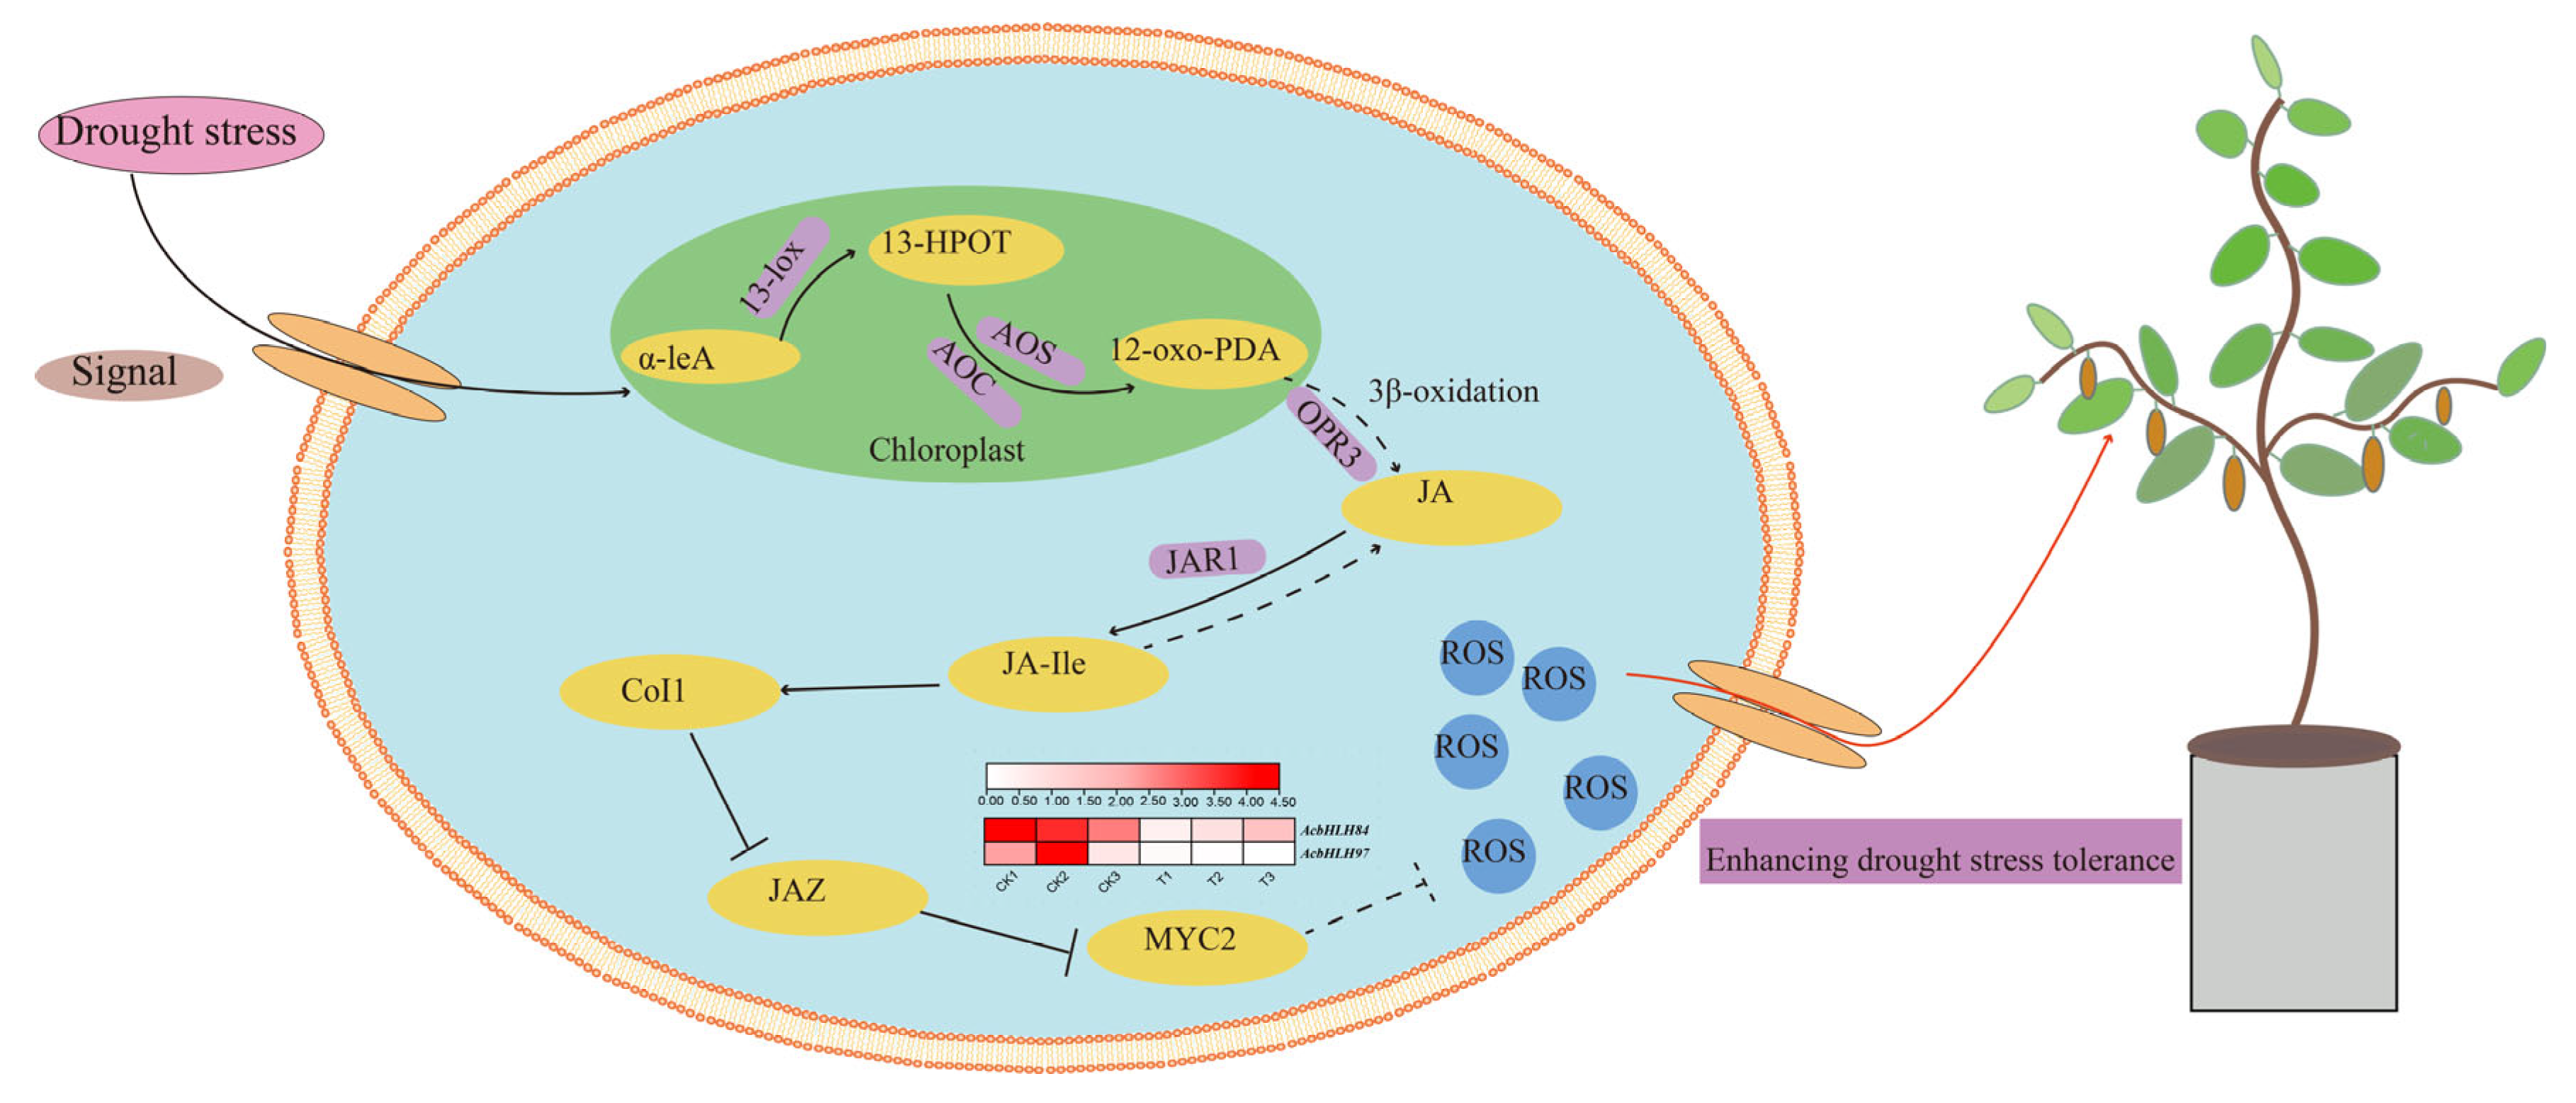
To investigate the expression patterns of AcbHLH genes under prolonged drought stress, RNA was extracted from leaves of kiwifruit seedlings subjected to drought stress for 72 h, followed by RNA sequencing (RNA-seq). Seedlings under non-stress conditions (0 h drought) served as the control group (CK). Comparative transcriptome analysis revealed that 64 out of the 187 identified AcbHLH genes exhibited distinctly differential expression (DEGs) under 72-h drought stress relative to the CK. Among these DEGs, only 16 genes were upregulated, while the expression of the remaining 48 genes was downregulated (Figure 9A). The predominance of downregulated DEGs suggests that the AcbHLH gene family may play a role in mitigating drought-induced damage in kiwifruit, potentially through a mechanism involving negative regulation to maintain cellular homeostasis under stress conditions.
Five genes (AcbHLH44, AcbHLH84, AcbHLH89, AcbHLH97, and AcbHLH167) located in both the phytohormone signaling pathway and the MAPK signaling pathway were selected from the 64 AcbHLH genes with significant differences for qRT-PCR validation. Compared with those in the control group (CK), the expression levels of AcbHLH44, AcbHLH87, and AcbHLH167 were upregulated, and the expression levels of AcbHLH84 and AcbHLH97 were downregulated under drought stress (72 h). The correlations between the FPKM values and the qRT-PCR results from the transcriptome data were analyzed via SPSS v21 software (Figure 9B), and the correlation coefficients were greater than 0.6, reaching moderate correlation [58], indicating that the accuracy of the transcriptome data was further confirmed via qRT-PCR and the transcriptome data were relatively accurate. The accuracy of the transcriptome data was proven, and the reliability of the differential genes in the transcriptome data was verified. Moreover, these genes are key genes involved in resistance to drought stress in kiwifruit.

4. Discussion

Kiwifruit has an extremely high yield, and for a long time, kiwifruit has been popular with consumers for its delicious taste and rich nutritional value [59]. In recent years, the climate of the main kiwifruit-producing areas has changed significantly, and extreme weather, such as drought, is becoming more common, which has had a serious impact on kiwifruit production activities [60,61]. Therefore, there is an urgent need to breed new kiwifruit varieties for drought tolerance, explore drought tolerance genes, and study the mechanisms of drought tolerance. Plant hormones are important signaling molecules that regulate different processes of plant growth and development under drought stress, and the interaction between hormone-dependent signaling pathways triggers the drought response by influencing osmotic pressure accumulation, stomatal closure, root growth, and the stabilization of photosynthetic processes; this is one of the more well-studied mechanisms of drought resistance [62,63]. bHLH genes can play a role in drought stress by participating in hormone signaling pathways in plants [64]. In this study, the bHLH gene family of kiwifruit was identified, the expression pattern of the AcbHLH gene under drought stress was analyzed, and the hormone content of kiwifruit seedlings under drought stress was analyzed to provide a reference for the cultivation of new drought-resistant kiwifruit varieties.
In this study, 187 bHLH genes were identified in kiwifruit (the genome file size is 653 MB) [41], compared with 162 in Arabidopsis thaliana [65] (135 MB) [66], 167 in Oryza sativa [9] (385 MB) [67], and 188 in apple (Malus × domestica) [68] (742 MB) [42]. The number of bHLH genes was greater in kiwifruit than in Arabidopsis thaliana and Oryza sativa and less than in Malus × domestica; this suggests that the number of bHLH genes correlates with genome size in different species.
Phylogenetic analysis divided the AcbHLH genes into 17 subfamilies, whereas the bHLH subfamily of Arabidopsis, the VI. Subfamily, did not have the AcbHLH gene, and the Orphans and XV subfamilies each had only one kiwifruit bHLH member (AcbHLH88 and AcbHLH79, respectively), suggesting that the two genes may have evolved independently.
Gene structure analysis revealed a large difference in the number of introns in the bHLH genes of kiwifruit, with the number of introns ranging from 1 to 14 and the number of exons ranging from 1 to 15. This pattern is similar to the bHLH family of genes in rye (Secale cereale) [69], chestnut (Castanea mollissima) [70], and jatropha nut (Jatropha physic) [71]. The number of introns in the bHLH genes of kiwifruit varies greatly, which may lead to the diversity of AcbHLH gene functions. The structural characteristics of genes and conserved motifs are highly similar. These findings further indicate that similar genes have similar functions during evolution, which is conducive to screening bHLH genes with similar functions. For example, rice OsbHLH148 regulates drought tolerance by mediating the jasmonate signaling pathway [72]; AtbHLH68 in A. thaliana responds to drought stress by controlling ABA homeostasis [73]; and AtbHLH122 in A. thaliana improves drought stress tolerance in Arabidopsis by decreasing ROS activity and increasing proline levels [19]. In summary, we can speculate that the AcbHLH gene plays an important role in the regulation of abiotic stresses, especially drought stress.
In this study, we revealed that the cis-acting element and phytohormone response elements of the promoter region of the AcbHLH gene family play vital roles. The main phytohormone response elements are abscisic acid (ABA)-responsive elements, gibberellic acid (GA)-responsive elements, methyl jasmonate (MeJA)-responsive elements, and salicylic acid (SA)-responsive elements (Figure 6), with greater numbers of ABA- and MeJa-responsive elements. Studies have shown that ABA and MeJa can interact with each other to affect plant response and adaptation to various abiotic stresses [74,75,76], reducing GA levels and signaling can increase plant drought resistance [77], and changing SA homeostasis can also affect plant adaptation to drought stress [78], indicating that bHLH genes in kiwifruit are crucial in regulating plant adaptation to stress. Moreover, GO enrichment analysis revealed hormonal stimulus responses, such as jasmonic acid, gibberellin, abscisic acid, and jasmonic acid-mediated signaling pathways, and environmental stimulus responses, such as salt stress responses, hypertonic salinity responses, and other stress responses (Figure 7, Table A2). The plant hormone signal transduction and MAPK signaling pathways (plant) were identified via KEGG enrichment analysis (Figure 8A, Table A3). These findings further suggest that the presence of cis-acting elements in the bHLH promoter may play a role in hormone-mediated stress responses, but experimental validation is needed.
Gene duplications contribute to the expansion of the bHLH gene family and play a vital role in genome evolution [79]. In this study, gene duplication events in the AcbHLH gene family were analyzed, and 115 fragment repeat pairs were found in 187 bHLH genes (Figure 3), indicating that gene duplication events are also a vital means of AcbHLH gene amplification. The greatest number of fragment repeat gene pairs occurred on chromosome 3, and the number of bHLH genes mapped to chromosome 3 was greater, indicating that kiwifruit chromosome 3 may contain this vital bHLH gene resource.
Changes in plant morphology, physiology, and biochemistry observed under drought stress are moderated by the expression of key genes, among which DEGs may be involved in corresponding response pathways [80,81]. Studying the expression patterns of related genes based on transcriptome data is a novel approach. In this study, the expression patterns of bHLH genes in kiwifruit under drought stress were analyzed. Among the 187 AcbHLH genes, 64 were significantly expressed under drought stress, of which 16 were upregulated and 48 were downregulated (Figure 9A). Five genes whose expression significantly differed were selected for qRT-PCR verification. The results of qRT-PCR were highly correlated with the transcriptome sequencing results, which confirmed the accuracy of the transcriptome data and verified the reliability of the transcriptome data and the DEGs (Figure 9B). These results indicated that these differentially expressed genes did respond to drought stress in kiwifruit.
Plant hormones can mediate environmental stresses, including drought stress, and thus regulate plant growth [82]. In this study, the hormone contents of kiwifruit tissue culture–generated seedlings under drought stress were determined. Compared with those in the control group, the contents of GA and JA were significantly lower, and the content of ABA was markedly greater. JA is a vital drought response signal, and the endogenous JA content increases briefly and rapidly under drought treatment conditions but decreases with increasing stress duration [74,83,84]. The observed decrease in JA at 72 h may indicate a shift in signaling dynamics under prolonged drought, possibly reflecting altered hormone homeostasis.
Plant hormones such as JA are regulators of plant development and are involved in plant perception and the emission of various environmental signals [85]. JA and its derivatives are a class of lipid derivative plant hormones widely involved in plant physiological processes such as secondary metabolism, response to pathogenic bacteria, plant growth and development, and light signal response [86]. Drought stress promotes the synthesis of α-linolenic acid (α-leA) in chloroplasts (Figure 9), and α-leA is converted to 12-oxophytodienic acid (12-oxo-PDA) by three enzymes: 13-lipoxyoxygenase (13-LOX), epoxyallylase (AOS), and propylene oxide cyclase (AOC). Finally, 12-oxo-PDA synthesizes JA through the reduction of 12-oxo-PDA reductase (OPR3) and three cycles of β-oxidation [87], JA is conjugated to isoleucine through jasmonic acid-aminosynthase (JAR1) to form jasmolol isoleucine (JA-Ile) [88,89], and the transcriptional repressor protein JASMONATE ZIM (JAZ) binds to the F-box protein COI1 in a hormone-dependent manner [90]. In the absence of hormone signaling, the JAZ protein inhibits the expression of the MYC2 transcription factor. JA can stimulate the specific binding of the JAZ protein to COI1 and promote the degradation of JAZ. JAZ degradation can relieve the inhibition of MYC2 transcription factors, thereby increasing the expression of JA response genes and increasing plant resilience to adverse conditions [91].
MYC2 is a member of the basic helical loop helix (bHLH) protein family, and its interactions with ABA, ethylene (ET), GA, and SA mediate various plant developmental processes and defense responses [92]. In this study, the combined analysis of the transcriptome and metabolome revealed that five differentially expressed genes, AcbHLH44, AcbHLH84, AcbHLH89, AcbHLH97, and AcbHLH167, were enriched in plant hormone transduction, the MAPK signaling pathway function and the MYC2 transcription factor pathway, and plant hormones affect signal transduction through the MAPK cascade, which plays a crucial role in the plant response to external stress. In this study, JA and JA-Ile levels in kiwifruit decreased with increasing experimental time, which was consistent with the expression trends of AcbHLH84 and AcbHLH97; therefore, we hypothesized that AcbHLH84 and AcbHLH97 may have functions similar to those of MYC2, but further experiments are needed to verify this hypothesis. The overexpression of the MYC2 gene has been shown to increase cold, drought, and salt tolerance in plants [93,94]. In summary, multiple lines of evidence suggest that the bHLH gene plays a vital role in the resistance of kiwifruit to abiotic stresses such as drought stress. These genes may serve as putative candidates for future functional validation as drought resistance genes in kiwifruit. These genes are the main downstream effectors in the JA signaling pathway, and increasing their expression levels can increase the drought tolerance of plants. Based on the above studies, we propose that the bHLH gene is involved in drought resistance in kiwifruit (Figure 10).

5. Conclusions

In this study, 187 AcbHLH genes, which were phylogenetically divided into 18 subfamilies, were identified from the kiwifruit genome. The growth of kiwifruit tissue culture-generated seedlings was severely inhibited by 40–45% drought stress for 72 h. Sixty-four AcbHLH genes were significantly different under drought stress, and qRT-PCR verified a significant correlation between the expression of the AcbHLH gene in kiwifruit and the response to drought stress. Phytohormones such as GA, ABA, and JA play vital roles in resistance to drought stress. It is speculated that AcbHLH84 and AcbHLH97 have functions similar to those of the MYC2 transcription factors and can be activated and participate in the JA signaling pathway. Activation of the JA signaling pathway inhibits the production of reactive oxygen species, thereby improving the drought resistance of kiwifruit, which is a crucial mechanism for the participation of kiwifruit bHLH genes in the regulation of drought resistance.

Author Contributions

Writing—original draft preparation, K.Z.; conceptualization, R.X.; software, T.Y.; investigation, X.C.; resources, T.Y.; writing—review and editing, X.L. and H.Z.; visualization, K.Z.; supervision, R.D.; project administration, H.Z.; funding acquisition, H.Z. All authors have read and agreed to the published version of the manuscript.

Funding

The project was supported by the Agricultural Joint Key Projects in Yunnan Province (202301BD070001-003) and the Yunnan Academician (expert) Workstation Project (202305AF150020). The funders had no role in the design of the study; the collection, analysis, or interpretation of the data; or the writing of the manuscript.

Data Availability Statement

The kiwifruit genome data (Hong Yang v3) were downloaded from the Kiwifruit Genome Database (KGD): Kiwifruit Genome Database (http://kiwifruitgenome.org/, accessed on 3 July 2024). RNA-Seq data under drought stress can be found. The login link is https://submit.ncbi.nlm.nih.gov/subs/sra/SUB14697397 (accessed on 30 August 2024). The other data presented in this study are available in Appendix A. All experimental studies and experimental materials involved in this research are in full compliance with relevant institutional, national, and international guidelines and legislation.

Acknowledgments

The authors thank Deqiang Zhang, Beijing Forestry University, for his critical reading of the manuscript. We thank Chaoying Chen, Ke Wen and Xulin Li of Southwest Forestry University for their contributions to the writing of this manuscript and the experiments.

Conflicts of Interest

The authors declare no conflicts of interest.

Appendix A

Table A1. Analysis of the physicochemical properties of AcbHLH genes.
Sequence IDGene NameNumber of Amino Acids (aa)Molecular Weight (kDa)Theoretical pIInstability IndexAliphatic IndexSubcellular Localization
Actinidia26970AcbHLH136640.635.3453.9361.26Nucleus
Actinidia01875AcbHLH217619.759.1029.0583.13Nucleus
Actinidia16554AcbHLH332536.208.9355.6077.45Nucleus
Actinidia23610AcbHLH430134.176.5654.4384.82Nucleus
Actinidia31749AcbHLH547152.235.5048.9576.56Nucleus
Actinidia10014AcbHLH662740.595.0646.5780.24Nucleus
Actinidia32939AcbHLH748051.219.3757.2265.40Nucleus
Actinidia37008AcbHLH819822.095.6776.98102.93Nucleus
Actinidia33194AcbHLH924227.338.3575.0677.73Nucleus
Actinidia07970AcbHLH1063370.756.5150.7677.63Nucleus
Actinidia07995AcbHLH1127730.605.6731.0884.73Nucleus
Actinidia21691AcbHLH1259266.397.9450.8278.09Nucleus
Actinidia25535AcbHLH1329733.106.1545.0583.64Nucleus
Actinidia04941AcbHLH1428230.975.9362.9767.09Nucleus
Actinidia04904AcbHLH1522725.736.0961.6283.30Nucleus
Actinidia04791AcbHLH1657362.896.7555.3266.02Nucleus
Actinidia08901AcbHLH1732236.276.4651.6869.88Nucleus
Actinidia35022AcbHLH1840844.696.6768.4456.72Nucleus
Actinidia35292AcbHLH1936240.507.0257.8456.57Nucleus
Actinidia35313AcbHLH2023065.268.9751.9475.57Nucleus
Actinidia35482AcbHLH2186294.446.4440.4480.08Nucleus
Actinidia02421AcbHLH2225528.418.8544.2492.08Nucleus
Actinidia12937AcbHLH2318319.579.6151.6953.83Nucleus
Actinidia17488AcbHLH2425428.348.7538.4872.99Nucleus
Actinidia34363AcbHLH2529232.355.1558.7171.78Nucleus
Actinidia34350AcbHLH2642356.975.5750.8669.22Nucleus
Actinidia33692AcbHLH2727431.035.3160.4977.96Nucleus
Actinidia04493AcbHLH2827129.135.3050.6884.98Nucleus
Actinidia04455AcbHLH2920322.628.7259.0684.24Nucleus
Actinidia02716AcbHLH3033437.518.8253.5382.28Nucleus
Actinidia26274AcbHLH3135640.256.2164.2965.17Nucleus
Actinidia38158AcbHLH3225529.306.5556.9087.96Nucleus
Actinidia33915AcbHLH3318120.545.3256.4467.90Nucleus
Actinidia13536AcbHLH3423426.427.6052.0389.53Nucleus
Actinidia13535AcbHLH3530233.896.5742.680.73Nucleus
Actinidia29085AcbHLH3612614.059.0847.9748.89Nucleus
Actinidia29185AcbHLH3732237.566.5650.6163.84Nucleus
Actinidia00959AcbHLH3837440.755.1353.2690.91Nucleus
Actinidia03094AcbHLH3920723.879.0656.3183.29Nucleus
Actinidia03158AcbHLH4033636.815.5270.777.74Nucleus
Actinidia36367AcbHLH4124527.468.4044.2669.67Nucleus
Actinidia36394AcbHLH4234338.405.4155.8775.54Nucleus
Actinidia36395AcbHLH4330433.675.4234.1782.11Nucleus
Actinidia16614AcbHLH4429232.325.8449.4686.85Nucleus
Actinidia07746AcbHLH4514115.915.9447.6964.40Nucleus
Actinidia04303AcbHLH4628230.776.6741.9860.60Nucleus
Actinidia09941AcbHLH4739143.475.7862.8751.43Nucleus
Actinidia09958AcbHLH4823525.747.6957.0177.23Nucleus
Actinidia05467AcbHLH4922726.549.6550.5171.81Nucleus
Actinidia09371AcbHLH5036640.675.3850.973.55Nucleus
Actinidia09432AcbHLH5135338.566.2261.4462.97Nucleus
Actinidia07680AcbHLH5226329.177.0462.6575.25Nucleus
Actinidia07635AcbHLH5326328.837.6554.6280.46Nucleus
Actinidia20908AcbHLH5462771.055.3546.5881Nucleus
Actinidia14565AcbHLH5561769.045.451.8882.43Nucleus
Actinidia14495AcbHLH5620423.397.9566.7675.39Nucleus
Actinidia20248AcbHLH5783591.846.7144.7278.23Nucleus
Actinidia20274AcbHLH5842846.655.3746.2281.03Nucleus
Actinidia01660AcbHLH5946951.126.1844.7869.25Nucleus
Actinidia38064AcbHLH6023426.096.674.978.29Nucleus
Actinidia38100AcbHLH6134338.665.1458.0567.14Nucleus
Actinidia29648AcbHLH6222425.975.5561.6788.26Nucleus
Actinidia29264AcbHLH6324427.865.5563.4179.18Nucleus
Actinidia04410AcbHLH6432636.587.7145.0587.33Nucleus
Actinidia04383AcbHLH6527230.155.1962.968.16Nucleus
Actinidia28828AcbHLH6623224.998.8359.4292.5Nucleus
Actinidia38451AcbHLH6717519.795.1441.9795.2Nucleus
Actinidia38499AcbHLH6834939.245.3279.9385.07Nucleus
Actinidia22793AcbHLH6927730.84745.0762.64Nucleus
Actinidia27112AcbHLH7013514.859.2751.2482.37Nucleus
Actinidia35869AcbHLH7130434.225.0857.7375.95Nucleus
Actinidia36836AcbHLH7232235.997.1148.1171.12Nucleus
Actinidia19012AcbHLH7337440.816.2465.3153.77Nucleus
Actinidia10704AcbHLH7423025.368.4550.9677.65Nucleus
Actinidia23778AcbHLH7556562.328.7847.8363.33Nucleus
Actinidia23742AcbHLH7651456.065.2168.1855.31Nucleus
Actinidia21175AcbHLH7749354.776.2739.9779.05Nucleus
Actinidia21152AcbHLH7829631.425.9139.0975.57Nucleus
Actinidia21104AcbHLH7925128.299.2555.1573.11Nucleus
Actinidia13678AcbHLH8034938.709.6570.3171.35Nucleus
Actinidia19903AcbHLH8131935.385.9455.0969.66Nucleus
Actinidia19843AcbHLH8227731.036.2544.3365.45Nucleus
Actinidia17442AcbHLH8330834.616.2744.6366.2Nucleus
Actinidia11941AcbHLH8431535.585.3355.978.89Nucleus
Actinidia00404AcbHLH8525327.456.7550.2167.15Nucleus
Actinidia00378AcbHLH8629231.975.0659.0962.81Nucleus
Actinidia17735AcbHLH8772177.416.9657.3161.96Nucleus
Actinidia16869AcbHLH8820523.1010.5369.6577.66Nucleus
Actinidia16799AcbHLH8926028.676.6157.0279.88Nucleus
Actinidia13413AcbHLH9054659.015.2352.1963.37Nucleus
Actinidia01170AcbHLH9128130.976.9848.9761.46Nucleus
Actinidia06881AcbHLH9244949.806.3250.4755.79Nucleus
Actinidia07184AcbHLH9321724.545.0540.8477.74Nucleus
Actinidia37637AcbHLH9418320.765.954.3591.58Nucleus
Actinidia33058AcbHLH9515517.736.0512.8193.55Nucleus
Actinidia18317AcbHLH9621323.779.2646.3475.49Nucleus
Actinidia18311AcbHLH9744147.964.9556.2872.97Nucleus
Actinidia10438AcbHLH9860866.788.2957.9164Nucleus
Actinidia20625AcbHLH9927630.926.2549.2568.19Nucleus
Actinidia14806AcbHLH10075083.056.6646.9666.84Nucleus
Actinidia27418AcbHLH10123726.816.2565.9194.85Nucleus
Actinidia27380AcbHLH10259968.238.6853.2885.69Nucleus
Actinidia27296AcbHLH10375583.455.3545.6577.09Nucleus
Actinidia27284AcbHLH10453359.828.6542.9581.43Nucleus
Actinidia14904AcbHLH10526029.445.9942.9261.15Nucleus
Actinidia38397AcbHLH10633036.995.765.5676.91Nucleus
Actinidia31927AcbHLH10732135.59650.1673.46Nucleus
Actinidia08197AcbHLH10824026.305.450.6569.92Nucleus
Actinidia38336AcbHLH10944646.075.9954.9174.06Nucleus
Actinidia09561AcbHLH11073682.815.9357.8278.52Nucleus
Actinidia09499AcbHLH11146750.406.0670.2755.05Nucleus
Actinidia09453AcbHLH11254258.766.7151.564.78Nucleus
Actinidia30501AcbHLH11331935.975.6560.3265.42Nucleus
Actinidia24957AcbHLH11445550.455.7243.374.07Nucleus
Actinidia06642AcbHLH11521825.166.658.7665.78Nucleus
Actinidia06533AcbHLH11618421.078.5569.865.16Nucleus
Actinidia21519AcbHLH11733737.128.746.5279.02Nucleus
Actinidia21564AcbHLH11840444.737.0850.4252.95Nucleus
Actinidia33486AcbHLH11941044.236.0960.6162.34Nucleus
Actinidia28094AcbHLH12039944.216.5750.1282.36Nucleus
Actinidia28011AcbHLH12133937.618.2739.6977.96Nucleus
Actinidia31235AcbHLH12231535.499.4957.1961.62Nucleus
Actinidia39893AcbHLH12320923.82554.9172.39Nucleus
Actinidia39559AcbHLH12426829.546.3963.3671.68Nucleus
Actinidia08446AcbHLH12523427.528.8454.6672.95Nucleus
Actinidia07548AcbHLH12624327.665.0860.388.31Nucleus
Actinidia20294AcbHLH12732035.285.8352.0875.59Nucleus
Actinidia20396AcbHLH12835038.326.4958.0163.8Nucleus
Actinidia10972AcbHLH12925428.498.7363.2684.13Nucleus
Actinidia12492AcbHLH13024026.465.8857.2867.88Nucleus
Actinidia05126AcbHLH13123625.986.7751.8578.6Nucleus
Actinidia05158AcbHLH13239243.366.1265.0951.99Nucleus
Actinidia00747AcbHLH13355561.346.1862.787.3Nucleus
Actinidia05553AcbHLH13439944.388.561.357.14Nucleus
Actinidia05642AcbHLH13515517.529.3339.477.48Nucleus
Actinidia05815AcbHLH13646551.775.5746.1577.14Nucleus
Actinidia31050AcbHLH13738041.828.5443.253.63Nucleus
Actinidia12888AcbHLH13871779.735.5851.4179.82Nucleus
Actinidia33765AcbHLH13941146.066.543.3874.45Nucleus
Actinidia37726AcbHLH14050054.885.0253.973.56Nucleus
Actinidia17543AcbHLH14124827.856.116782.54Nucleus
Actinidia17610AcbHLH14244550.125.9477.2465.93Nucleus
Actinidia11340AcbHLH14322025.205.2251.0674.55Nucleus
Actinidia11564AcbHLH14421023.698.1557.575.57Nucleus
Actinidia13834AcbHLH14543448.146.6248.4465.37Nucleus
Actinidia31866AcbHLH14631634.915.6972.1879.53Nucleus
Actinidia25964AcbHLH14760166.016.1243.571.48Nucleus
Actinidia29708AcbHLH14824427.428.5145.2476.35Nucleus
Actinidia02969AcbHLH14927530.598.345.7675.49Nucleus
Actinidia40062AcbHLH15022225.155.5153.0279.59Nucleus
Actinidia40097AcbHLH15134337.326.6460.0286.71Nucleus
Actinidia40189AcbHLH15219922.308.2872106.63Nucleus
Actinidia22194AcbHLH15352458.59652.4371.58Nucleus
Actinidia02003AcbHLH15464972.685.5448.5988.57Nucleus
Actinidia28511AcbHLH15531034.837.0249.5681.71Nucleus
Actinidia20683AcbHLH15641746.118.1659.6950.6Nucleus
Actinidia16303AcbHLH15746752.277.3263.6852.01Nucleus
Actinidia24146AcbHLH15831635.435.0742.0979.87Nucleus
Actinidia30102AcbHLH15949454.195.6670.1561.3Nucleus
Actinidia09094AcbHLH16028730.486.3248.1686.76Nucleus
Actinidia09144AcbHLH16169476.455.3364.1379.14Nucleus
Actinidia11692AcbHLH16268072.666.4857.7463.72Nucleus
Actinidia16479AcbHLH16323926.509.6756.7777.15Nucleus
Actinidia16476AcbHLH16444949.735.2866.9578.66Nucleus
Actinidia16406AcbHLH16539243.705.3749.9669.62Nucleus
Actinidia17228AcbHLH16623126.086.3247.4259.48Nucleus
Actinidia29906AcbHLH16747353.197.7160.2778.37Nucleus
Actinidia29957AcbHLH16818721.244.6268.1488.18Nucleus
Actinidia23288AcbHLH16931834.889.3747.8875.44Nucleus
Actinidia01096AcbHLH17033036.926.2659.2871.85Nucleus
Actinidia10226AcbHLH17140944.715.9259.5968.92Nucleus
Actinidia10353AcbHLH17228731.715.6258.7786.76Nucleus
Actinidia01558AcbHLH17325627.735.4157.8969.06Nucleus
Actinidia22852AcbHLH17478484.875.7448.4174.25Nucleus
Actinidia22974AcbHLH17530834.828.1950.4857.95Nucleus
Actinidia08250AcbHLH17634038.454.9947.3861.44Nucleus
Actinidia19604AcbHLH17729934.035.1661.6883.75Nucleus
Actinidia32124AcbHLH17836340.126.6452.6467.44Nucleus
Actinidia22518AcbHLH17937641.317.7755.7172.69Nucleus
Actinidia22640AcbHLH18027730.009.2648.6160.61Nucleus
Actinidia22645AcbHLH18118019.885.4450.778.06Nucleus
Actinidia22688AcbHLH18233637.415.2952.0852.32Nucleus
Actinidia19291AcbHLH18337240.575.9655.5363.71Nucleus
Actinidia19259AcbHLH18426229.834.9458.3775.5Nucleus
Actinidia30810AcbHLH18514816.128.347.3377.16Nucleus
Actinidia30799AcbHLH18629132.106.6757.2183.54Nucleus
Actinidia15954AcbHLH18725427.846.3658.5765.79Nucleus
Table A2. GO enrichment analysis of kiwifruit under drought stress.
IDClassificationGO TermsAll GeneUp_GeneDown_Gene
GO:0009739Biological processResponse to gibberellin712
GO:0009725Biological processResponse to hormone2919
GO:0009753Biological processResponse to jasmonic acid11 4
GO:0006970Biological processResponse to osmotic stress6 0
GO:0009737Biological processResponse to abscisic acid12 4
GO:0006952Biological processDefense response14 7
GO:0031347Biological processRegulation of defense response11 4
GO:0009755Biological processHormone-mediated signaling pathway19 8
GO:0009867Biological processJasmonic acid mediated signaling pathway10 3
GO:0071470Biological processCellular response to osmotic stress2 0
GO:0071215Biological processCellular response to abscisic acid stimulus6 4
GO:0009414Biological processResponse to water deprivation3 1
GO:0043227Cellular componentMembrane-bounded organelle1311549
GO:0016020Cellular componentMembrane2
GO:0043226Cellular componentOrganelle1311549
GO:0031090Cellular componentOrganelle membrane1311549
GO:0009059Molecular functionMacromolecule biosynthetic Process1141345
GO:0005515Molecular functionProtein binding1301549
GO:0140110Molecular functionTranscription regulator activity1231347
GO:0005488Molecular functionBinding1321549
Table A3. KEGG enrichment analysis of kiwifruit under drought stress.
IDCountDescription
ko0407582Plant hormone signal transduction
ko0401633MAPK signaling pathway
ko0471244Circadian rhythm—plant
Table A4. Expression of kiwifruit plant hormones under drought and control conditions.
IndexCompoundsT1T2T3CK1CK2CK3
ABAAbscisic acid1155.611322.691037.88100.1297.4780.19
ABA-GEABA-glucosyl ester33448.8235722.1023656.6313126.3914161.2514810.04
ABA-aldAbscisic acid283.66326.9766202.4093.87107.26111.77
ACCEthylene68.0872.8874.3328.5032.6235.84
GA20Gibberellin0.00.00.06.537.775.60
GA19Gibberellin0.00.00.02.450.03.76
12-OH-JAJasmonic acid3782.054012.923487.321378.491280.271596.73
JA-PheJasmonic acid0.00.260.00.270.300.37
OPDAJasmonic acid500.31883.45422.35162.25253.69132.85
JA-ValJasmonic acid0.971.051.263.924.494.98
JA-ILEJasmonic acid62.4066.1759.56166.79172.82192.75
JAJasmonic acid65.2298.0283.97215.15255.65228.16

References

  1. Pan, L.; Ma, J.; Li, J.; Yin, B.; Fu, C. Advancses of salt stress-responsive transcription factors in plants. Sheng Wu Gong Cheng Xue Bao 2022, 38, 50–65. (In Chinese) [Google Scholar] [CrossRef] [PubMed]
  2. Riechmann, L.; Muyldermans, S. Single domain antibodies: Comparison of camel VH and camelised human VH domains. J. Immunol. Methods 1999, 231, 25–38. [Google Scholar] [CrossRef]
  3. Carretero-Paulet, L.; Galstyan, A.; Roig-Villanova, I.; Martinez-Garcia, J.F.; Bilbao-Castro, J.R.; Robertson, D.L. Genome-wide classification and evolutionary analysis of the bHLH family of transcription factors in Arabidopsis, poplar, rice, moss, and algae. Plant Physiol. 2010, 153, 1398–1412. [Google Scholar] [CrossRef] [PubMed]
  4. Wang, J.; Yang, S.; Sun, Q.W.; Chen, H.Y.; Yang, T.; Huang, Y. Genome-wide identification and expression analysis of the bHLH transcription factor family in Dendrobium cinereum. Biotechnol. Bull. 2024, 40, 203–218. [Google Scholar]
  5. Ludwig, S.R.; Habera, L.F.; Dellaporta, S.L.; Wessler, S.R. Lc, a Member of the Maize R Gene Family Responsible for Tissue-Specific Anthocyanin Production, Encodes a Protein Similar to Transcriptional Activators and Contains the Myc-Homology Region. Proc. Natl. Acad. Sci. USA 1989, 86, 7092–7096. [Google Scholar] [CrossRef] [PubMed]
  6. Heim, M.A.; Jakoby, M.; Werber, M.; Martin, C.; Weisshaar, B.; Bailey, P.C. The Basic Helix-Loop-Helix Transcription Factor Family in Plants: A Genome-Wide Study of Protein Structure and Functional Diversity. Mol. Biol. Evol. 2003, 20, 735–747. [Google Scholar] [CrossRef]
  7. Murre, C.; McCaw, P.S.; Baltimore, D. A new DNA binding and dimerization motif in immunoglobulin enhancer binding, daughterless, MyoD, and myc proteins. Cell 1989, 56, 777–783. [Google Scholar] [CrossRef]
  8. Li, G.; Jin, L.; Sheng, S. Genome-wide identification of bHLH transcription factor in Medicago sativa in response to cold stress. Genes 2022, 13, 2371. [Google Scholar] [CrossRef]
  9. Li, X.; Duan, X.; Jiang, H.; Sun, Y.; Tang, Y.; Yuan, Z.; Guo, J.; Liang, W.; Chen, L.; Yin, J.; et al. Genome-wide analysis of basic/helix-loop-helix transcription factor family in rice and Arabidopsis. Plant Physiol. 2006, 141, 1167–1184. [Google Scholar] [CrossRef]
  10. Liu, Y.; Lin-Wang, K.; Espley, R.V.; Wang, L.; Li, Y.; Liu, Z.; Zhou, P.; Zeng, L.; Zhang, X.; Zhang, J.; et al. StMYB44 negatively regulates anthocyanin biosynthesis at high temperatures in tuber flesh of potato. J. Exp. Bot. 2019, 70, 3809–3824. [Google Scholar] [CrossRef]
  11. Kavas, M.; Baloglu, M.C.; Atabay, E.S.; Ziplar, U.T.; Dasgan, H.Y.; Ünver, T. Genome-wide characterization and expression analysis of common bean bHLH transcription factors in response to excess salt concentration. Mol. Genet. Genom. 2016, 291, 129–143. [Google Scholar] [CrossRef] [PubMed]
  12. Wang, F.; Zhu, H.; Chen, D.; Li, Z.; Peng, R.; Yao, Q. A grape bHLH transcription factor gene, VvbHLH1, increases the accumulation of flavonoids and enhances salt and drought tolerance in transgenic Arabidopsis thaliana. Plant Cell Tissue Organ Cult. 2016, 125, 387–398. [Google Scholar] [CrossRef]
  13. Yang, J.; Gao, M.; Huang, L.; Wang, Y.; van Nocker, S.; Wan, R.; Guo, C.; Wang, X.; Gao, H. Identification and expression analysis of the apple (Malus × domestica) basic helix-loop-helix transcription factor family. Sci. Rep. 2017, 7, 28. [Google Scholar] [CrossRef]
  14. Chen, C.; Li, X.; Wen, K.; Yin, T.; Tian, P.; Zhao, K.; Zhang, L.; Zhou, X.; Liu, X.; Zhang, H. Identification of the bHLH transcription factor family in Orah mandarin and the response of CrbHLH46 to low-temperature stress. Plants 2025, 14, 882. [Google Scholar] [CrossRef] [PubMed]
  15. Buck, M.J.; Atchley, W.R. Phylogenetic analysis of plant basic helix-loop-helix proteins. J. Mol. Evol. 2003, 56, 742–750. [Google Scholar] [CrossRef] [PubMed]
  16. Li, J.; Li, X.; Han, P.; Liu, H.; Gong, J.; Zhou, W.; Shi, B.; Liu, A.; Xu, L. Genome-wide investigation of bHLH genes and expression analysis under different biotic and abiotic stresses in Helianthus annuus L. Int. J. Biol. Macromol. 2021, 189, 72–83. [Google Scholar] [CrossRef]
  17. Ji, X.; Nie, X.; Liu, Y.; Zheng, L.; Zhao, H.; Zhang, B.; Huo, L.; Wang, Y. A bHLH gene from Tamarix hispida improves abiotic stress tolerance by enhancing osmotic potential and decreasing reactive oxygen species accumulation. Tree Physiol. 2016, 36, 193–207. [Google Scholar] [CrossRef]
  18. Yang, Y.-Y.; Zheng, P.-F.; Ren, Y.-R.; Yao, Y.-X.; You, C.-X.; Wang, X.-F.; Hao, Y.-J. Apple MdSAT1 encodes a bHLHm1 transcription factor involved in salinity and drought responses. Planta 2021, 253, 46. [Google Scholar] [CrossRef]
  19. Liu, W.; Tai, H.; Li, S.; Gao, W.; Zhao, M.; Xie, C.; Li, W. bHLH122 Is important for drought and osmotic stress resistance in Arabidopsis and in the repression of aba catabolism. New Phytol. 2014, 201, 1192–1204. [Google Scholar] [CrossRef]
  20. Zhu, L.; Yin, T.; Zhang, M.; Yang, X.; Wu, J.; Cai, H.; Yang, N.; Li, X.; Wen, K.; Chen, D.; et al. Genome-wide identification and expression pattern analysis of the kiwifruit GRAS transcription factor family in response to salt stress. BMC Genom. 2024, 25, 12. [Google Scholar] [CrossRef]
  21. Ferguson, A.R.; Ferguson, L.R. Are kiwifruit really good for you? Acta Hortic. 2003, 610, 131–138. [Google Scholar] [CrossRef]
  22. Lee, Y.K.; Low, K.Y.; Siah, K.; Drummond, L.M.; Gwee, K.A. Kiwifruit (Actinidia deliciosa) changes intestinal microbial profile. Microb. Ecol. Health Dis. 2012, 23, 18572. [Google Scholar] [CrossRef] [PubMed]
  23. FAOSTAT: The United Nations Food and Agriculture Organisation of the United Nations (FAO). Available online: https://www.fao.org/ (accessed on 26 September 2024).
  24. Xia, H.; Ni, Z.; Hu, R.; Lin, L.; Deng, H.; Wang, J.; Tang, Y.; Sun, G.; Wang, X.; Li, H.; et al. Melatonin alleviates drought stress by a non-enzymatic and enzymatic antioxidative system in kiwifruit seedlings. Int. J. Mol. Sci. 2020, 21, 852. [Google Scholar] [CrossRef]
  25. Bao, W.W.; Chen, X.; Li, R.N.; Li, M.; Xie, C.; Dou, M.; Zhang, K.; Wang, J.; Gao, Z.; Liu, Z.; et al. Comprehensive assessment of drought resistance and recovery in kiwifruit genotypes using multivariate analysis. Plant J. 2024, 119, 100–114. [Google Scholar] [CrossRef]
  26. Liu, X.; Quan, W.; Bartels, D. Stress memory responses and seed priming correlate with drought tolerance in plants: An overview. Planta 2022, 255, 45. [Google Scholar] [CrossRef]
  27. Ndlovu, E.; van Staden, J.; Maphosa, M. Morpho-physiological effects of moisture, heat and combined stresses on Sorghum bicolor [Moench (L.)] and its acclimation mechanisms. Plant Stress 2021, 2, 100018. [Google Scholar] [CrossRef]
  28. Hussain, H.A.; Hussain, S.; Khaliq, A.; Ashraf, U.; Anjum, S.A.; Men, S.; Wang, L. Chilling and drought stresses in crop plants: Implications, cross talk, and potential management opportunities. Front. Plant Sci. 2018, 9, 393. [Google Scholar] [CrossRef]
  29. Abreha, K.B.; Enyew, M.; Carlsson, A.S.; Vetukuri, R.R.; Feyissa, T.; Motlhaodi, T.; Ng’uni, D.; Geleta, M. Sorghum in dryland: Morphological, physiological, and molecular responses of sorghum under drought stress. Planta 2021, 255, 20. [Google Scholar] [CrossRef] [PubMed]
  30. Dichio, B.; Montanaro, G.; Sofo, A.; Xiloyannis, C. Stem and whole-plant hydraulics in olive (Olea europaea) and kiwifruit (Actinidia deliciosa). Trees 2013, 27, 183–191. [Google Scholar] [CrossRef]
  31. Hahne, G.; Tomlinson, L.; Nogué, F. Precision genetic engineering tools for next-generation plant breeding. Plant Cell Rep. 2019, 38, 435–436. [Google Scholar] [CrossRef]
  32. Lockhart, D.J.; Winzeler, E.A. Genomics, gene expression and DNA arrays. Nature 2000, 405, 827–836. [Google Scholar] [CrossRef] [PubMed]
  33. Pang, Z.; Chen, J.; Wang, T.; Gao, C.; Li, Z.; Guo, L.; Xu, J.; Cheng, Y. Linking plant secondary metabolites and plant microbiomes: A Review. Front. Plant Sci. 2021, 12, 621276. [Google Scholar] [CrossRef]
  34. Guijas, C.; Montenegro-Burke, J.R.; Warth, B.; Spilker, M.E.; Siuzdak, G. Metabolomics activity screening for identifying metabolites that modulate phenotype. Nat. Biotechnol. 2018, 36, 316–320. [Google Scholar] [CrossRef]
  35. Fiehn, O. Metabolomics by Gas Chromatography-Mass Spectrometry: Combined Targeted and Untargeted Profiling. Curr. Protoc. Mol. Biol. 2016, 114, 30–34. [Google Scholar] [CrossRef] [PubMed]
  36. Luo, F.; Yu, Z.; Zhou, Q.; Huang, A. Multi-omics-based discovery of plant signaling molecules. Metabolites 2022, 12, 76. [Google Scholar] [CrossRef] [PubMed]
  37. Meena, K.K.; Sorty, A.M.; Bitla, U.M.; Choudhary, K.; Gupta, P.; Pareek, A.; Singh, D.P.; Prabha, R.; Sahu, P.K.; Gupta, V.K.; et al. Abiotic stress responses and microbe-mediated mitigation in plants: The omics strategies. Front. Plant Sci. 2017, 8, 172. [Google Scholar] [CrossRef]
  38. Yang, S.; Chu, N.; Zhou, H.; Li, J.; Feng, N.; Su, J.; Deng, Z.; Shen, X.; Zheng, D. Integrated analysis of transcriptome and metabolome reveals the regulation of chitooligosaccharide on drought tolerance in sugarcane (Saccharum spp. hybrid) under drought stress. Int. J. Mol. Sci. 2022, 23, 9737. [Google Scholar] [CrossRef]
  39. Chen, S.; Zhong, K.; Li, Y.; Bai, C.; Xue, Z.; Wu, Y. Joint transcriptomic and metabolomic analysis provides new insights into drought resistance in watermelon (Citrullus lanatus). Front. Plant Sci. 2024, 15, 1364631. [Google Scholar] [CrossRef] [PubMed] [PubMed Central]
  40. Yang, F.; Lv, G. Combined analysis of transcriptome and metabolome reveals the molecular mechanism and candidate genes of Haloxylon drought tolerance. Front. Plant Sci. 2022, 13, 1020367. [Google Scholar] [CrossRef]
  41. Yue, J.; Liu, J.; Tang, W.; Wu, Y.Q.; Tang, X.; Li, W.; Yang, Y.; Wang, L.; Huang, S.; Fang, C.; et al. Kiwifruit genome database (kgd): A comprehensive resource for kiwifruit genomics. Hortic. Res. 2020, 7, 117. [Google Scholar] [CrossRef]
  42. Jung, S.; Lee, T.; Cheng, C.H.; Buble, K.; Zheng, P.; Yu, J.; Humann, J.; Ficklin, S.P.; Gasic, K.; Scott, K.; et al. 15 years of GDR: New data and functionality in the Genome Database for Rosaceae. Nucleic Acids Res. 2019, 47, D1137–D1145. [Google Scholar] [CrossRef] [PubMed]
  43. Zhang, M.; Zi, Y.; Yang, X.; Yang, X.; Zhu, L.; Cai, H.; Yin, T.; Liu, X.; Zhang, H. Genome-wide analysis of the CsAP2/ERF gene family of sweet orange (Citrus sinensis) and joint analysis of transcriptional metabolism under salt stress. Ann. Bot. 2025, mcaf006. [Google Scholar] [CrossRef]
  44. Marchler-Bauer, A.; Bo, Y.; Han, L.; He, J.; Lanczycki, C.J.; Lu, S.; Chitsaz, F. CDD/SPARCLE: Functional classification of proteins via subfamily domain architectures. Nucleic Acids Res. 2017, 45, D200–D203. [Google Scholar] [CrossRef]
  45. Zi, Y.; Zhang, Z.; Zhao, K.; Yang, X.; Zhu, L.; Yin, T.; Chen, C.; Wen, K.; Li, X.; Zhang, H.; et al. Genome-wide identification of kiwifruit K+ channel Shaker family members and their response to low-K+ stress. BMC Plant Biol. 2024, 24, 833. [Google Scholar] [CrossRef] [PubMed]
  46. Wilkins, M.R.; Gasteiger, E.; Bairoch, A.; Sanchez, J.C.; Williams, K.L.; Appel, R.D.; Hochstrasser, D.F. Protein identification and analysis tools in the ExPASy server. In 2-D Proteome Analysis Protocols; Humana Press: Totowa, NJ, USA, 1999; Volume 112, pp. 531–552. [Google Scholar] [CrossRef]
  47. Chou, K.C.; Shen, H.B. Plant-mPLoc: A top-down strategy to augment the power for predicting plant protein subcellular localization. PLoS ONE 2010, 5, e11335. [Google Scholar] [CrossRef] [PubMed]
  48. Chen, C.; Chen, H.; Zhang, Y.; Thomas, H.R.; Frank, M.H.; He, Y.; Xia, R. TBtools: An integrative toolkit developed for interactive analyses of big biological data. Mol. Plant 2020, 13, 1194–1202. [Google Scholar] [CrossRef]
  49. Xie, J.; Chen, Y.; Cai, G.; Cai, R.; Hu, Z.; Wang, H. Tree Visualization By One Table (tvBOT): A web application for visualizing, modifying and annotating phylogenetic trees. Nucleic Acids Res. 2023, 51, W587–W592. [Google Scholar] [CrossRef]
  50. Lescot, M.; Déhais, P.; Thijs, G.; Marchal, K.; Moreau, Y.; Van de Peer, Y.; Rouzé, P.; Rombauts, S. PlantCARE, a database of plant cis-acting regulatory elements and a portal to tools for in silico analysis of promoter sequences. Nucleic Acids Res. 2002, 30, 325–327. [Google Scholar] [CrossRef]
  51. Zi, Y.; Zhang, M.; Yang, X.; Zhao, K.; Yin, T.; Wen, K.; Li, X.; Liu, X.; Zhang, H. Identification of the sweet orange (Citrus sinensis) bHLH gene family and the role of CsbHLH55 and CsbHLH87 in regulating salt stress. Plant Genome. 2024, 17, e20502. [Google Scholar] [CrossRef]
  52. Cantalapiedra, C.P.; Hernández-Plaza, A.; Letunic, I.; Bork, P.; Huerta-Cepas, J. eggNOG-mapper v2: Functional annotation, orthology assignments, and domain prediction at the metagenomic scale. Mol. Biol. Evol. 2021, 38, 5825–5829. [Google Scholar] [CrossRef]
  53. Valmonte-Cortes, G.R.; Higgins, C.M.; MacDiarmid, R.M. Arabidopsis calcium dependent protein kinase 3, and its orthologues OsCPK1, OsCPK15, and AcCPK16, are involved in biotic and abiotic stresses. Plants 2025, 14, 294. [Google Scholar] [CrossRef] [PubMed]
  54. Tan, Z.; Lu, D.; Yu, Y.; Li, L.; Dong, W.; Xu, L.; Yang, Q.; Wan, X.; Liang, H. Genome-wide identification and characterization of the bHLH gene family and its response to abiotic stresses in Carthamus tinctorius. Plants 2023, 12, 3764. [Google Scholar] [CrossRef]
  55. Mahmood, T.; Khalid, S.; Abdullah, M.; Ahmed, Z.; Shah, M.K.N.; Ghafoor, A.; Du, X. Insights into drought stress signaling in plants and the molecular genetic basis of cotton drought tolerance. Cells 2019, 9, 105. [Google Scholar] [CrossRef] [PubMed]
  56. Ullah, A.; Manghwar, H.; Shaban, M.; Khan, A.H.; Akbar, A.; Ali, U.; Ali, E.; Fahad, S. Phytohormones enhanced drought tolerance in plants: A coping strategy. Environ. Sci. Pollut. Res. Int. 2018, 25, 33103–33118. [Google Scholar] [CrossRef] [PubMed]
  57. Jogawat, A.; Yadav, B.; Chhaya Lakra, N.; Singh, A.K.; Narayan, O.P. Crosstalk between phytohormones and secondary metabolites in the drought stress tolerance of crop plants: A review. Physiol. Plant. 2021, 172, 1106–1132. [Google Scholar] [CrossRef]
  58. Wang, S.; Qiu, Y.; Zhu, F. Kiwifruit (Actinidia spp.): A review of chemical diversity and biological activities. Food Chem. 2021, 350, 128469. [Google Scholar] [CrossRef]
  59. Mukaka, M.M. Statistics corner: A guide to appropriate use of correlation coefficient in medical research. Malawi Med. J. 2012, 24, 69–71. [Google Scholar]
  60. Cradock-Henry, N.A. New Zealand kiwifruit growers’ vulnerability to climate and other stressors. Reg. Environ. Change 2017, 17, 245–259. [Google Scholar] [CrossRef]
  61. Bardi, L. Early kiwifruit decline: A soil-borne disease syndrome or a climate change effect on plant–soil relations? Front. Agron. 2020, 2, 3. [Google Scholar] [CrossRef]
  62. Gupta, A.; Sinha, R.; Fernandes, J.L.; Abdelrahman, M.; Burritt, D.J.; Tran, L.P. Phytohormones regulate convergent and divergent responses between individual and combined drought and pathogen infection. Crit. Rev. Biotechnol. 2020, 40, 320–340. [Google Scholar] [CrossRef]
  63. Mubarik, M.S.; Khan, S.H.; Sajjad, M.; Raza, A.; Hafeez, M.B.; Yasmeen, T.; Rizwan, M.; Ali, S.; Arif, M.S. A manipulative interplay between positive and negative regulators of phytohormones: A way forward for improving drought tolerance in plants. Physiol. Plant. 2021, 172, 1269–1290. [Google Scholar] [CrossRef]
  64. Zuo, Z.F.; Lee, H.Y.; Kang, H.G. Basic helix-loop-helix transcription factors: Regulators for plant growth development and abiotic stress responses. Int. J. Mol. Sci. 2023, 24, 1419. [Google Scholar] [CrossRef] [PubMed]
  65. Bailey, P.C.; Martin, C.; Toledo-Ortiz, G.; Quail, P.H.; Huq, E.; Heim, M.A.; Jakoby, M.; Werber, M.; Weisshaar, B. Update on the basic helix-loop-helix transcription factor gene family in Arabidopsis thaliana. Plant Cell 2003, 15, 2497–2502. [Google Scholar] [CrossRef]
  66. Wang, B.; Yang, X.; Jia, Y.; Xu, Y.; Jia, P.; Dang, N.; Wang, S.; Xu, T.; Zhao, X.; Gao, S.; et al. High-quality Arabidopsis thaliana Genome Assembly with Nanopore and HiFi Long Reads. Genom. Proteom. Bioinform. 2022, 20, 4–13. [Google Scholar] [CrossRef] [PubMed]
  67. Yu, Z.; Chen, Y.; Zhou, Y.; Zhang, Y.; Li, M.; Ouyang, Y.; Chebotarov, D.; Mauleon, R.; Zhao, H.; Xie, W.; et al. Rice Gene Index: A comprehensive pan-genome database for comparative and functional genomics of Asian rice. Mol. Plant 2023, 16, 798–801. [Google Scholar] [CrossRef]
  68. Mao, K.; Dong, Q.; Li, C.; Liu, C.; Ma, F. Genome wide identification and characterization of apple bHLH transcription factors and expression analysis in response to drought and salt stress. Front. Plant Sci. 2017, 8, 480. [Google Scholar] [CrossRef]
  69. Chen, X.; Yao, C.; Liu, J.; Liu, J.; Fang, J.; Deng, H.; Yao, Q.; Kang, T.; Guo, X. Basic helix-loop-helix (bHLH) gene family in rye (Secale cereale L.): Genome-wide identification, phylogeny, evolutionary expansion and expression analyses. BMC Genom. 2024, 25, 67. [Google Scholar] [CrossRef] [PubMed]
  70. Zhang, L.; Chen, W.; Liu, R.; Shi, B.; Shu, Y.; Zhang, H. Genome-wide characterization and expression analysis of bHLH gene family in physic nut (Jatropha curcas L.). PeerJ 2022, 10, e13786. [Google Scholar] [CrossRef]
  71. Yu, L.; Fei, C.; Wang, D.; Huang, R.; Xuan, W.; Guo, C.; Jing, L.; Meng, W.; Yi, L.; Zhang, H.; et al. Genome-wide identification, evolution and expression profiles analysis of bHLH gene family in Castanea mollissima. Front. Genet. 2023, 14, 1193953. [Google Scholar] [CrossRef]
  72. Seo, J.S.; Joo, J.; Kim, M.J.; Kim, Y.K.; Nahm, B.H.; Song, S.I.; Cheong, J.J.; Lee, J.S.; Kim, J.K.; Choi, Y.D. OsbHLH148, a basic helix-loop-helix protein, interacts with OsJAZ proteins in a jasmonate signaling pathway leading to drought tolerance in rice. Plant J. 2011, 65, 907–921. [Google Scholar] [CrossRef]
  73. Le Hir, R.; Castelain, M.; Chakraborti, D.; Moritz, T.; Dinant, S.; Bellini, C. AtbHLH68 transcription factor contributes to the regulation of ABA homeostasis and drought stress tolerance in Arabidopsis thaliana. Physiol. Plant. 2017, 160, 312–327. [Google Scholar] [CrossRef] [PubMed]
  74. Wu, C.; Liu, B.; Zhang, X.; Wang, M.; Liang, H. Phytohormone response of drought-acclimated Illicium difengpi (Schisandraceae). Int. J. Mol. Sci. 2023, 24, 16443. [Google Scholar] [CrossRef] [PubMed]
  75. Guo, Y.; Yan, J.; Su, Z.; Chang, J.; Yang, J.; Wei, C.; Zhang, Y.; Ma, J.; Zhang, X.; Li, H. Abscisic acid mediates grafting-induced cold tolerance of watermelon via interaction with melatonin and methyl jasmonate. Front. Plant Sci. 2021, 12, 785317. [Google Scholar] [CrossRef]
  76. Fu, J.; Wu, H.; Ma, S.; Xiang, D.; Liu, R.; Xiong, L. OsJAZ1 Attenuates drought resistance by regulating ja and ABA signaling in rice. Front. Plant Sci. 2017, 8, 2108. [Google Scholar] [CrossRef]
  77. Liao, Z.; Zhang, Y.; Yu, Q.; Fang, W.; Chen, M.; Li, T.; Liu, Y.; Liu, Z.; Chen, L.; Yu, S.; et al. Coordination of growth and drought responses by GA-ABA signaling in rice. New Phytol. 2023, 240, 1149–1161. [Google Scholar] [CrossRef] [PubMed]
  78. Dong, Q.; Duan, D.; Zheng, W.; Huang, D.; Wang, Q.; Yang, J.; Liu, C.; Li, C.; Gong, X.; Li, C.; et al. Overexpression of MdVQ37 reduces drought tolerance by altering leaf anatomy and SA homeostasis in transgenic apple. Tree Physiol. 2022, 42, 160–174. [Google Scholar] [CrossRef]
  79. Zhang, H.; Cao, Y.; Shang, C.; Li, J.; Wang, J.; Wu, Z.; Ma, L.; Qi, T.; Fu, C.; Bai, Z.; et al. Genome-wide characterization of GRAS family genes in Medicago truncatula reveals their evolutionary dynamics and functional diversification. PLoS ONE 2017, 12, e0185439. [Google Scholar] [CrossRef]
  80. Singh, B.; Norvell, E.; Wijewardana, C.; Wallace, T.; Chastain, D.; Reddy, K.R. Assessing morphological characteristics of elite cotton lines from different breeding programmes for low temperature and drought tolerance. J. Agron. Crop. Sci. 2018, 204, 467–476. [Google Scholar] [CrossRef]
  81. Fan, G.; Xia, X.; Yao, W.; Cheng, Z.; Zhang, X.; Jiang, J.; Zhou, B.; Jiang, T. Genome-wide identification and expression patterns of the F-box family in poplar under salt stress. Int. J. Mol. Sci. 2022, 23, 10934. [Google Scholar] [CrossRef]
  82. Yu, Z.; Duan, X.; Luo, L.; Dai, S.; Ding, Z.; Xia, G. How plant hormones mediate salt stress responses. Trends Plant Sci. 2020, 25, 1117–1130. [Google Scholar] [CrossRef]
  83. Zhu, C.; Li, X.; Zhang, M.; Wang, S.; Jing, B.; Hu, C.; Thomas, H.R.; Zhou, Y.; Yu, J.; Hu, Z. ERF.D2 negatively controls drought tolerance through synergistic regulation of abscisic acid and jasmonic acid in tomato. Plant Biotechnol. J. 2025. [Google Scholar] [CrossRef] [PubMed]
  84. Chai, M.; Yang, F.; Cai, S.; Liu, T.; Xu, X.; Huang, Y.; Xi, X.; Yang, J.; Cao, Z.; Sun, L.; et al. Overexpression of the Transcription Factor GmbZIP60 Increases Salt and Drought Tolerance in Soybean (Glycine max). Int. J. Mol. Sci. 2025, 26, 3455. [Google Scholar] [CrossRef] [PubMed]
  85. Lymperopoulos, P.; Msanne, J.; Rabara, R. Phytochrome and phytohormones: Working in tandem for plant growth and development. Front. Plant Sci. 2018, 9, 1037. [Google Scholar] [CrossRef] [PubMed]
  86. Wasternack, C.; Hause, B. Jasmonates: Biosynthesis, perception, signal transduction and action in plant stress response, growth and development. An update to the 2007 review in Annals of Botany. Ann. Bot. 2013, 111, 1021–1058. [Google Scholar] [CrossRef]
  87. Vick, B.A.; Zimmerman, D.C. The biosynthesis of jasmonic acid: A physiological role for plant lipoxygenase. Biochem. Biophys. Res. Commun. 1983, 111, 470–477. [Google Scholar] [CrossRef] [PubMed]
  88. Staswick, P.E.; Tiryaki, I. The oxylipin signal jasmonic acid is activated by an enzyme that conjugates it to isoleucine in Arabidopsis. Plant Cell 2004, 16, 2117–2127. [Google Scholar] [CrossRef]
  89. Fonseca, S.; Chini, A.; Hamberg, M.; Adie, B.; Porzel, A.; Kramell, R.; Miersch, O.; Wasternack, C.; Solano, R. (+)-7-iso-Jasmonoyl-L-isoleucine is the endogenous bioactive jasmonate. Nat. Chem. Biol. 2009, 5, 344–350. [Google Scholar] [CrossRef]
  90. Liu, Y.; Du, M.; Deng, L.; Shen, J.; Fang, M.; Chen, Q.; Lu, Y.; Wang, Q.; Li, C.; Zhai, Q. MYC2 Regulates the termination of jasmonate signaling via an autoregulatory negative feedback loop. Plant Cell 2019, 31, 106–127. [Google Scholar] [CrossRef] [PubMed]
  91. Lorenzo, O.; Chico, J.M.; Sánchez-Serrano, J.J.; Solano, R. JASMONATE-INSENSITIVE1 encodes a MYC transcription factor essential to discriminate between different jasmonate-regulated defense responses in Arabidopsis. Plant Cell 2004, 16, 1938–1950. [Google Scholar] [CrossRef]
  92. Luo, L.; Wang, Y.; Qiu, L.; Han, X.; Zhu, Y.; Liu, L.; Man, M.; Li, F.; Ren, M.; Xing, Y. MYC2: A master switch for plant physiological processes and specialized metabolite synthesis. Int. J. Mol. Sci. 2023, 24, 3511. [Google Scholar] [CrossRef]
  93. Wang, R.; Yu, M.; Xia, J.; Xing, J.; Fan, X.; Xu, Q.; Cang, J.; Zhang, D. Overexpression of TaMYC2 confers freeze tolerance by ICE-CBF-COR module in Arabidopsis thaliana. Front. Plant Sci. 2022, 13, 1042889. [Google Scholar] [CrossRef] [PubMed]
  94. Wei, H.; Movahedi, A.; Xu, C.; Sun, W.; Li, L.; Wang, P.; Li, D.; Zhuge, Q. Overexpression of PtHMGR enhances drought and salt tolerance of poplar. Ann. Bot. 2020, 125, 785–803. [Google Scholar] [CrossRef] [PubMed]
Figure 1. Physicochemical properties of the AcbHLH gene. The numbers in the heatmap represent numerical values, and the higher the value is, the darker the color. The outermost circle represents the gene name, followed by the theoretical pi, aliphatic index, molecular weight (kDa), and instability index.
Agronomy 15 01598 g001
Figure 2. Phylogenetic tree of the bHLH gene family in A. thaliana and kiwifruit. (A): Phylogenetic tree diagram constructed via the maximum likelihood (ML) method, which uses 1000 repeat guide values, and different groupings are represented by different colors. The purple five-pointed star represents the AcbHLH gene, the blue triangle represents the AtbHLH gene, the gray circle indicates a self-exhibition value between 70–90%, and the black circle represents a self-exhibition value > 90%. (B): Diagram of the number of bHLH genes in A. thaliana and kiwifruit in each subfamily; blue represents kiwifruit, and pink–purple indicates Arabidopsis.
Agronomy 15 01598 g002
Figure 3. Conserved motif and gene structure of the AcbHLH gene family. (A): A member of the AcbHLH gene family. (B): Conserved motif distribution of AcbHLHs; the motif is represented by a colored box, and the black line indicates the relative length of the protein. (C): Exon-intron structure diagram of the AcbHLH gene; green indicates the UTR, yellow indicates the CDS, and the middle line segment represents introns.
Agronomy 15 01598 g003
Figure 4. Mapping and collinearity of AcbHLH genes. The gray line represents all the repeat genes in the kiwifruit genome, and the blue line represents the AcbHLH fragment repeat gene in kiwifruit. The heatmap and line map show the gene density, the line map density increases sequentially from blue to pink to red, the yellow rectangle represents the chromosome, and the chromosome name is displayed between each chromosome and the gene density.
Agronomy 15 01598 g004
Figure 5. Collinearity of kiwifruit. Colinearity between different species of kiwifruit, rice, Arabidopsis, and apple, with gray lines representing duplicate blocks and blue lines representing collinear bHLH gene pairs; green represents the chromosomes of rice, orange represents the chromosomes of kiwifruit, pink represents the chromosomes of Arabidopsis, and purple represents the chromosomes of apples.
Agronomy 15 01598 g005
Figure 6. Cis-acting elements of bHLH genes in kiwifruit. (A): A member of the AcbHLH gene family. (A,B): the number of cis-acting elements of each AcbHLH gene, and the number in the heatmap box indicates the number of different elements in these AcbHLHs; (A,C): the position of each cis-acting element; (D): the type, number, and proportion of cis-acting elements.
Agronomy 15 01598 g006
Figure 7. GO functional analysis of bHLH genes in kiwifruit under drought stress. From the inside to the outside, the first circle histogram represents the proportion of the number of bHLH DEGs enriched in the same GO term to the total number of bHLH genes. The second circle indicates the number of bHLH genes enriched in the difference between the upregulated and downregulated GO terms; green indicates upregulated genes and yellow indicates downregulated genes. The third heatmap represents the total number of genes enriched in the GO terms. The fourth circle represents the GO number, and different categories are indicated by different colors.
Agronomy 15 01598 g007
Figure 8. Heatmap of the KEGG pathways associated with AcbHLHs and changes in hormone content in kiwifruit under drought stress. (A): KEGG enrichment map of AcbHLH genes. The horizontal axis represents the number of enriched genes, the vertical axis represents the type of KEGG pathway, and different colors represent different p values. (B): Heatmap of hormone contents in kiwifruit under drought stress; CK represents the control group, T represents the treatment group, * represents a p value < 0.05, and ** represents a p value < 0.01.
Agronomy 15 01598 g008
Figure 9. Expression patterns of AcbHLHs under drought stress and qRT-PCR results. (A): Expression heatmap of differentially expressed genes in AcbHLHs under drought stress. CK represents the control group, and T represents the treatment group. (B): qRT-PCR results of five differentially expressed AcbHLH genes. The horizontal axis represents the treatment category, CK represents the control group, and T represents the treatment group. The vertical axis represents the average expression. * represents a p value < 0.05, and ** represents a p value < 0.01.
Agronomy 15 01598 g009
Figure 10. Drought resistance mechanism of kiwifruit with the participation of AcbHLH84 and AcbHLH97. α-leA: α-linolenic acid, 13-HPOT: 13-hydroperoxide linolenic acid, 12-oxo-PDA: 12-oxophytodienoic acid, JA: jasmonic acid, JA-Ile: jasmonol isoleucine; COI1: F-box CORONATINE INSENSITIVE 1, 13-LOX: 13-lipoxygenase, LOX: 13-Lipoxygenase, AOS: propylene oxidase, AOC: propylene oxide cyclase, OPR3: 12-oxo-PDA reductase, JAR1: jasmonic acid-aminosynthase.The solid arrows in the figure indicate synthetic paths, the dashed arrows indicate that the synthetic paths do not hold, the ‘T’ shape of the solid line indicates inhibition, and the dashed line indicates De-inhibition.
Agronomy 15 01598 g010
Disclaimer/Publisher’s Note: The statements, opinions and data contained in all publications are solely those of the individual author(s) and contributor(s) and not of MDPI and/or the editor(s). MDPI and/or the editor(s) disclaim responsibility for any injury to people or property resulting from any ideas, methods, instructions or products referred to in the content.

