1. Introduction
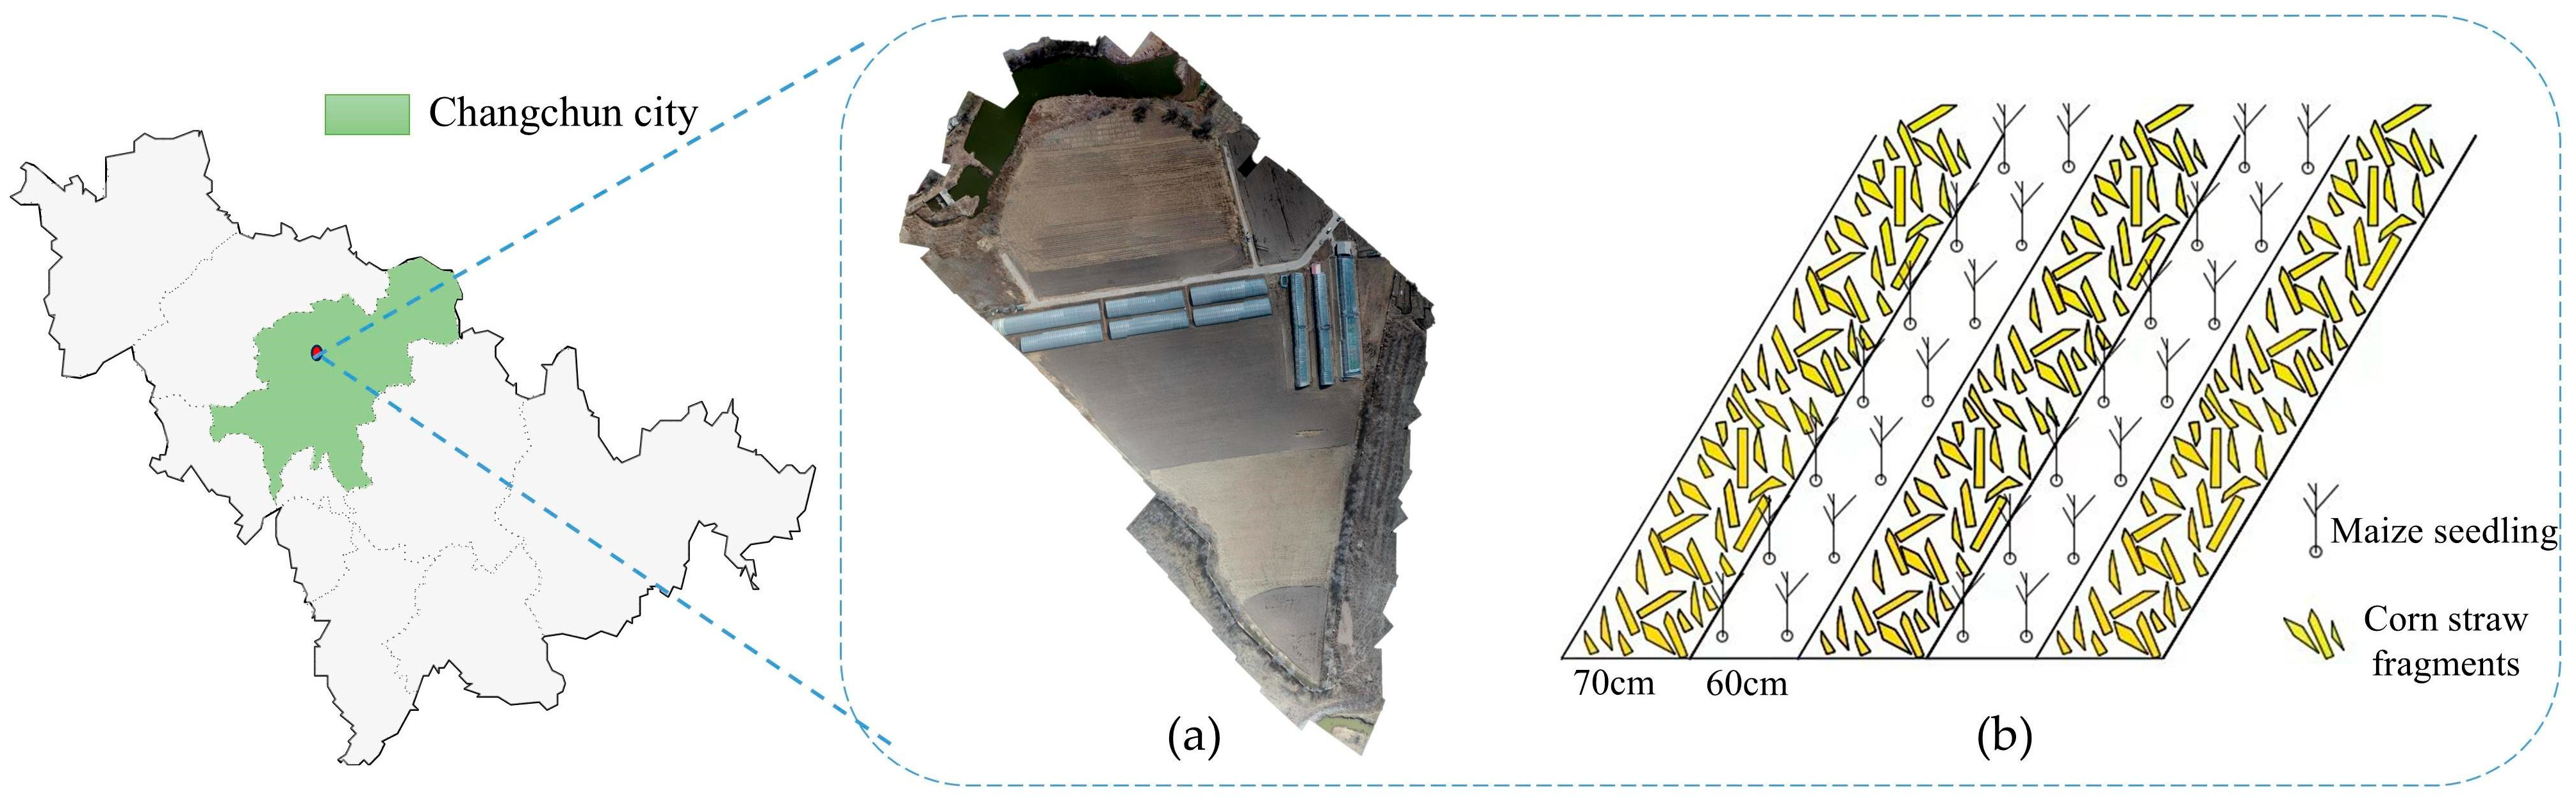
Conservation tillage has become a cornerstone of sustainable agriculture, offering significant benefits such as improved soil health, enhanced water retention, and increased carbon sequestration. By minimizing soil disturbance and preserving crop residues on the surface, conservation tillage helps mitigate soil erosion, retain nutrients, and address the growing challenges of climate change. In the black soil regions of Northeast China, the straw row grouping pattern—a tillage practice that alternates straw-covered strips with clean seedbeds—has emerged as a key technique for preserving soil fertility and improving crop quality [
1,
2].
Wang et al. [
3] mentioned this pattern to integrate mechanically aligned straw placement with a wide-narrow row no-tillage system, which effectively reduced soil compaction and enhanced seedbed conditions. However, Ahmad et al. [
4] pointed out that an uneven straw distribution can significantly reduce the effectiveness of chemical applications. Moreover, Jin et al. [
5] emphasized that accurate crop row detection is critical for improving the operational precision of agricultural sprayers. These findings collectively highlight the necessity of precisely detecting corn seedling band centerlines to support precision agricultural machinery operations. In this study, complex field conditions refer to a combination of environmental and visual challenges that significantly affect image acquisition and segmentation quality in straw row-grouped maize fields. These include variable lighting conditions, such as overexposure, shadows, and glare caused by weather and time-of-day differences; low contrast between soil and straw, especially in areas where straw is partially buried, degraded, or affected by soil moisture; irregular and non-uniform straw distribution, resulting from mechanical placement inconsistencies and wind displacement; visual interference from background noise, such as residual crop debris or stones; and topographical variability, including field undulations and slope-induced image distortion.
These factors introduce noise and ambiguity into the image data, making it difficult for traditional thresholding or segmentation algorithms to maintain high accuracy and robustness. Therefore, any segmentation method intended for use in such environments must demonstrate adaptability to these real-world complexities.
Agricultural robots are machines designed for agricultural production that can be controlled by various software programs. They are capable of adapting to changes in tasks and environments and are equipped with artificial intelligence enabling their fully autonomous operation. Cheng et al. [
6] pointed out through a large number of literature reviews that the development of agricultural robots can be divided into two stages. Before the end of the 20th century, agricultural automation equipment was predominantly based on electromechanical control technologies. With advancements in sensor and computer technologies, intelligent agricultural equipment began to emerge and has gradually become widespread in the 21st century. Agricultural robots now encompass a wide variety of types. For instance, fertilizing robots can apply fertilizer precisely based on soil conditions, thereby reducing costs and improving water quality [
7]. Field weeding robots integrate computer systems, GPS, and tractor technologies to apply herbicides accurately [
8]. Citrus-picking robots determine fruit maturity based on visual features and can rapidly harvest and sort fruit [
9]. Mushroom-picking robots use cameras and other sensors to identify and harvest mushrooms with high speed and efficiency [
10]. The development of agricultural spraying machinery has undergone significant transformation. From the mid-19th to the early 20th century, methods evolved from manual sprinkling using brooms and powder blowers to the emergence of motorized plant protection machinery [
11]. In the 1930s, China began developing “Gongnong” brand pesticide application equipment, such as the Gongnong-7 compression sprayer. After the founding of the People’s Republic of China, a variety of backpack-type manual, electric, and motorized sprayers became widely used, playing a central role in plant protection operations. In the 1950s and 1960s, industrialized countries entered the era of “machines carrying humans”, marked by the rise of large self-propelled boom sprayers and orchard air-blast mist sprayers. China subsequently imported and independently developed various large-scale boom sprayers [
12]. In recent years, low-altitude, low-volume pesticide application using unmanned aerial vehicles (UAVs) has seen comprehensive development. Although China entered the field of plant protection UAVs relatively late, this field has experienced rapid growth, with market deployment reaching a significant scale [
13]. With the advancement of digital information technologies, global agriculture is transitioning toward smart farming, leading to the emergence of spraying robots. China’s domestically developed orchard autonomous navigation spraying robots now enable unmanned and precise pesticide application. Li et al. [
14] designed and tested an automatic contour-following orchard sprayer featuring adjustable air volume and flow rate, which significantly enhances spray uniformity and operational accuracy in orchard environments. Zhu et al. [
15] proposed a maize pest and disease detection and precision variable-spraying system based on visual recognition, which enables targeted pesticide application and reduces chemical usage. These developments play a critical role in addressing low pesticide utilization rates and environmental pollution, while supporting food security and the sustainable development of agriculture.
The complex textures introduced by scattered straw complicate visual recognition tasks, hindering the performance of traditional image segmentation techniques. Conventional approaches, such as single-threshold Otsu segmentation, suffer from limited adaptability to changing field conditions, poor accuracy when segmenting overlapping regions, and insufficient real-time performance. These shortcomings lead to high error rates in seedling band centerline extraction. While deep learning methods have been increasingly adopted for navigation line detection in precision agriculture, offering high adaptability and accuracy, they typically require extensive annotated datasets and significant computational resources. For example, Zhou et al. [
16] proposed a deep learning-based method to extract visual navigation lines in orchards using a U-Net architecture, achieving robust performance in structured environments, but requiring substantial training data. Liu et al. [
17] developed a maize row detection method at the seedling stage using a multi-scale ERFNet model, which improved detection accuracy under varying field textures; however, it involved heavy computational costs unsuitable for lightweight deployment. Likewise, Diao et al. [
18] introduced an improved U-Net-based algorithm to enhance crop row recognition accuracy, especially in complex backgrounds, though their method depends on extensive pixel-level annotation. Shi et al. [
19] reviewed various row detection and navigation techniques for agricultural robots and autonomous vehicles, emphasizing the effectiveness of deep models but also highlighting issues such as generalization and real-time constraints. Furthermore, Diao et al. [
20] proposed an improved YOLOv8s-based navigation line extraction algorithm tailored for spraying robots, which showed excellent real-time detection capability but still necessitates a well-trained backbone and GPU acceleration. This limits their practical deployment, especially in resource-constrained agricultural environments.
To address these challenges, our research group has focused on threshold-based segmentation methods that require minimal data annotation and offer greater computational efficiency. Specifically, we developed a DE-GWO-based segmentation algorithm to optimize the Otsu thresholding method [
21]. The DE-GWO algorithm combines the global search capabilities of Differential Evolution (DE) [
22] with the local exploitation strengths of the Grey Wolf Optimizer (GWO) [
23], improving the segmentation precision of overlapping targets under straw-covered conditions. This hybrid approach enhances between-class variance optimization and yields results that are closer to the global optimum.
To further improve segmentation under complex field environments, we employed a modified semantic segmentation model, m-DeepLabV3+ [
24], to detect straw coverage with high accuracy, achieving a prediction rate of 93.96%. In related work, other researchers have also applied deep learning to this problem. For instance, a study utilizing UAV-acquired imagery and an improved U-Net architecture reported an accuracy of 93.87% in corn stover segmentation [
25]. Another methodology integrated the Sauvola and Otsu algorithms to enhance stover extraction by leveraging chromatic aberration features [
26]. While these methods have improved straw segmentation accuracy, they typically focus only on stover detection, neglecting the accurate distinction between soil and seedling bands—an essential step in identifying corn seedling rows.
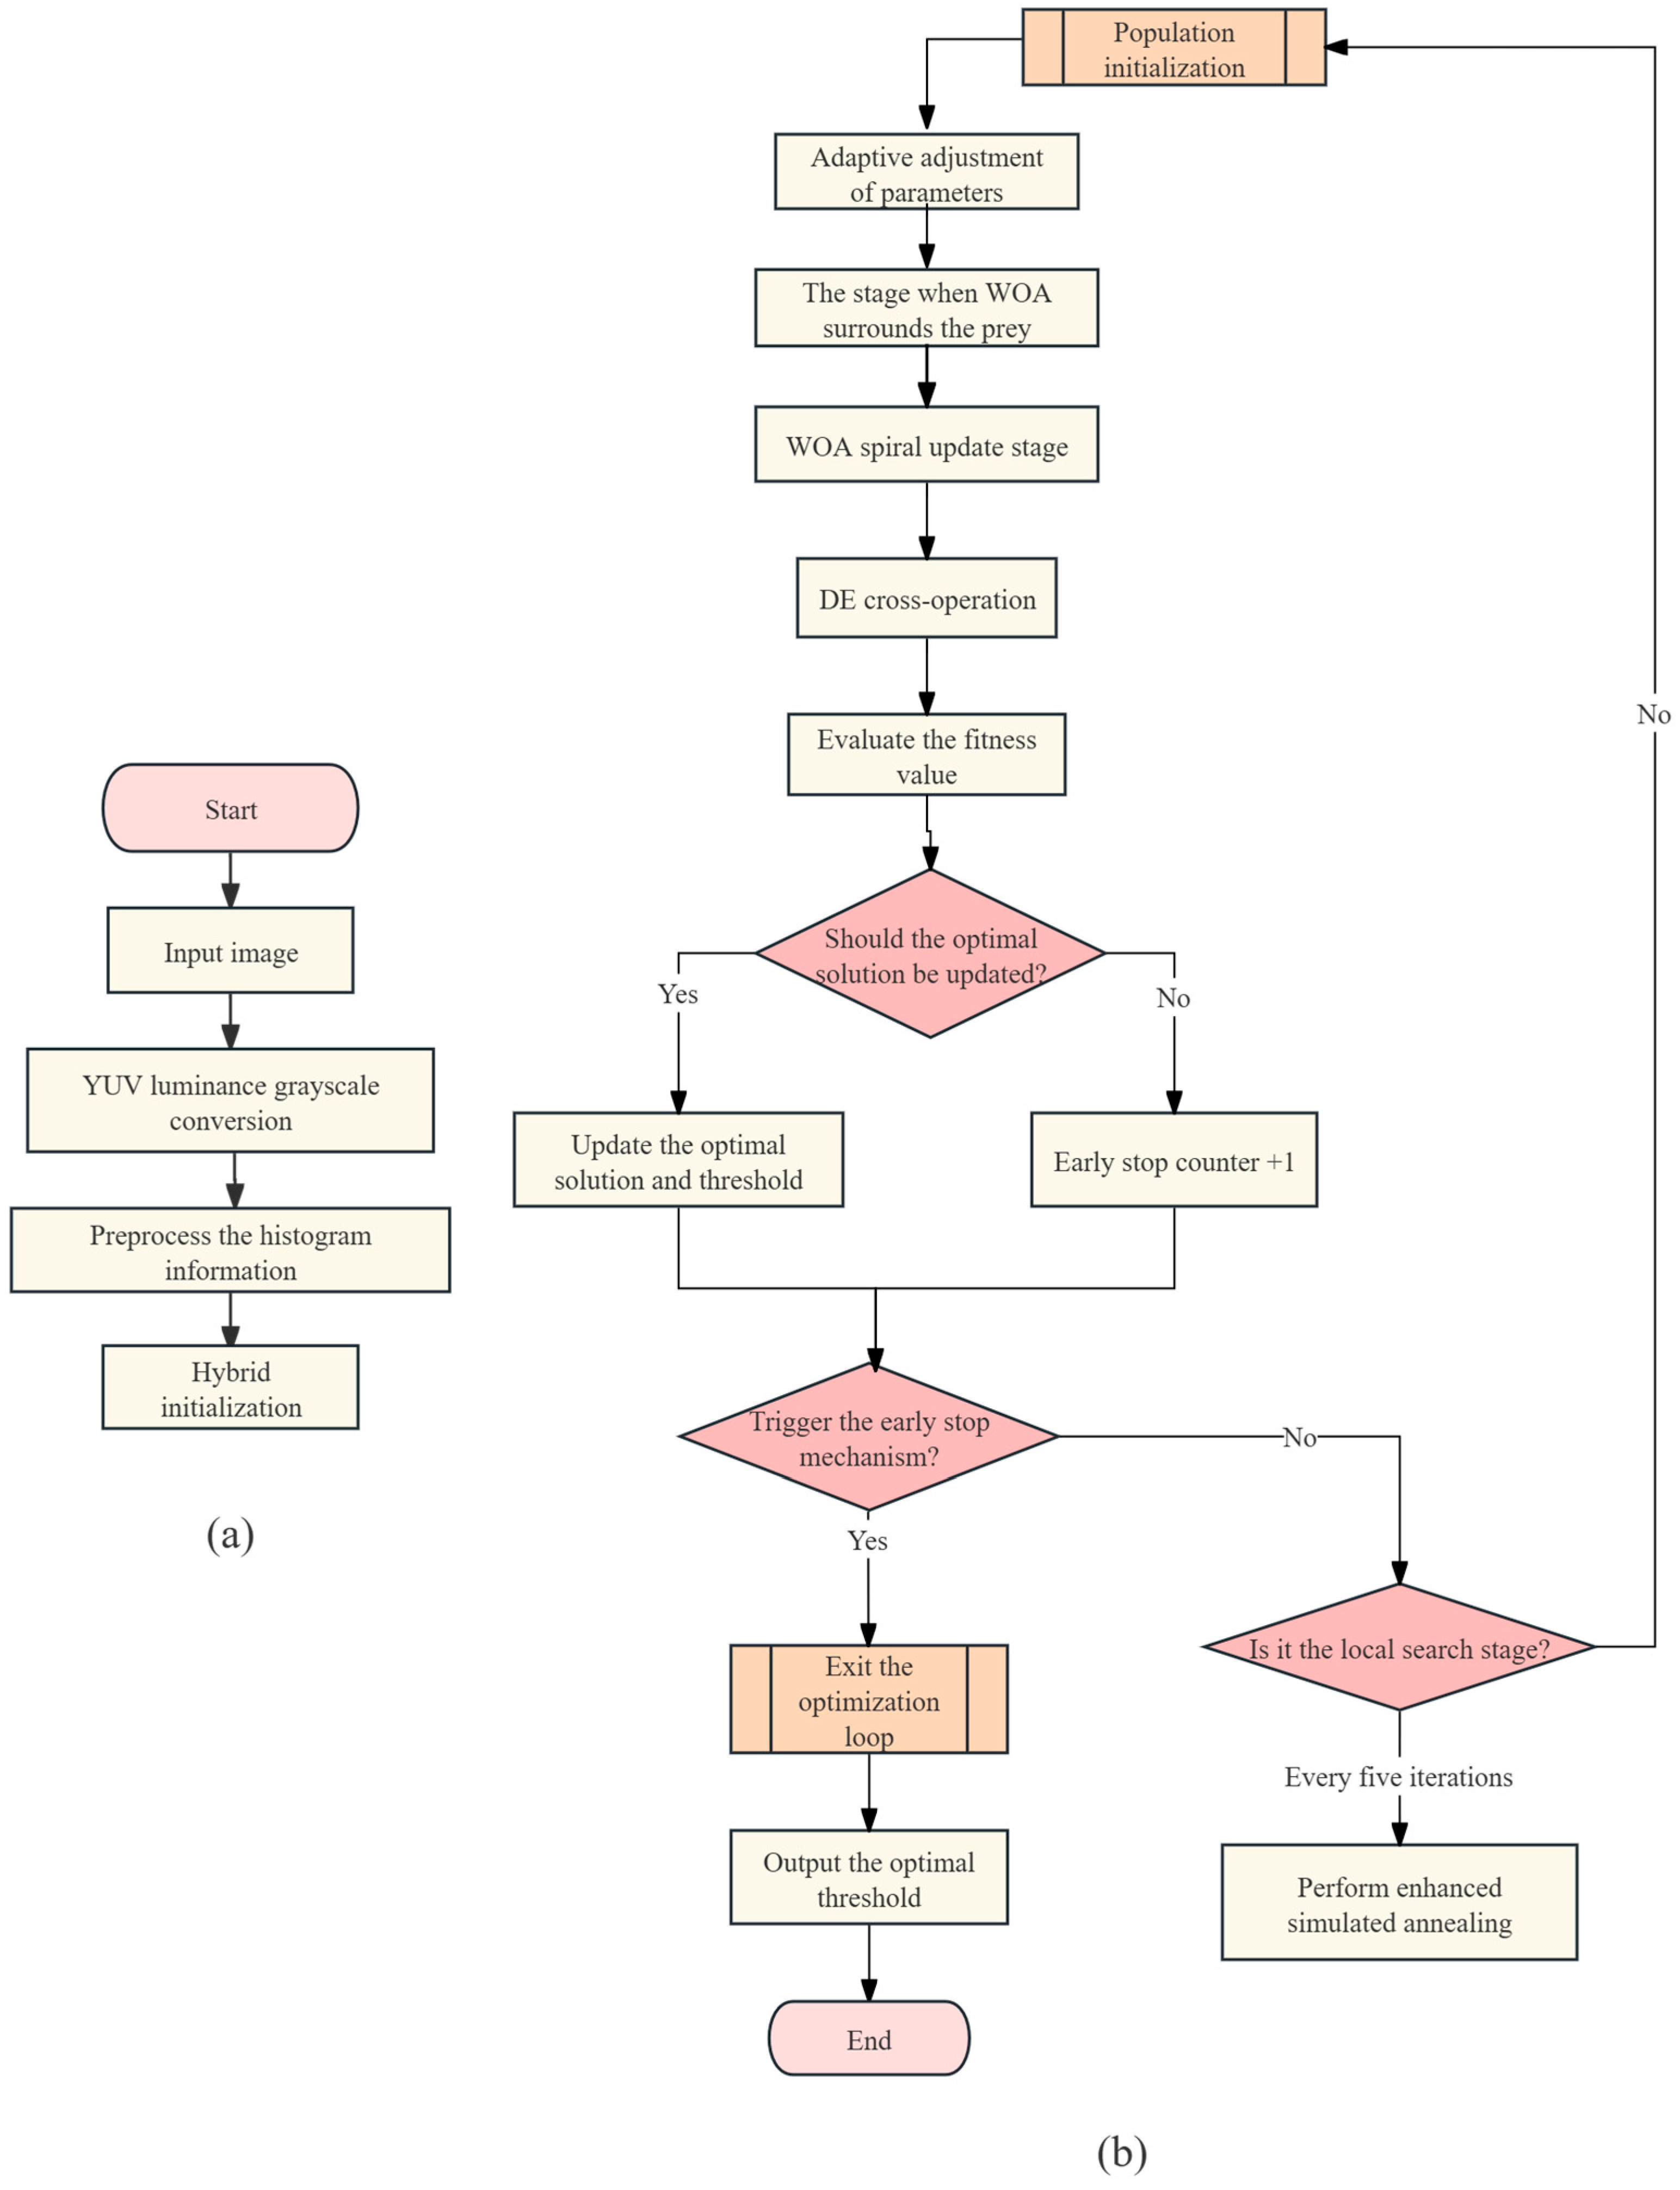
In addition, achieving high real-time performance remains a persistent challenge. To address this issue, we propose an improved optimization algorithm, SADE-WOA, aimed at enhancing segmentation accuracy and computational efficiency. Compared to the DE-GWO segmentation algorithm previously developed by our research group [
21], SADE-WOA incorporates a simulated annealing mechanism to strengthen the local search and help escape local optima. By combining the collaborative search strategies of differential evolution and whale optimization, SADE-WOA achieves a higher maximum between-class variance with the Otsu thresholding method during corn seedling image segmentation experiments, while the computation time is only one-sixth to one-seventh of that of DE-GWO. The SADE-WOA integrates three key innovations: (1) a quasi-oppositional initialization strategy to enhance population diversity and search space coverage; (2) a crossover mechanism from DE to improve global exploration while preserving WOA’s local search capability; (3) a simulated annealing-based perturbation mechanism to refine solutions during the later stages of convergence. These improvements collectively boost the algorithm’s real-time performance and segmentation accuracy in complex agricultural scenarios.
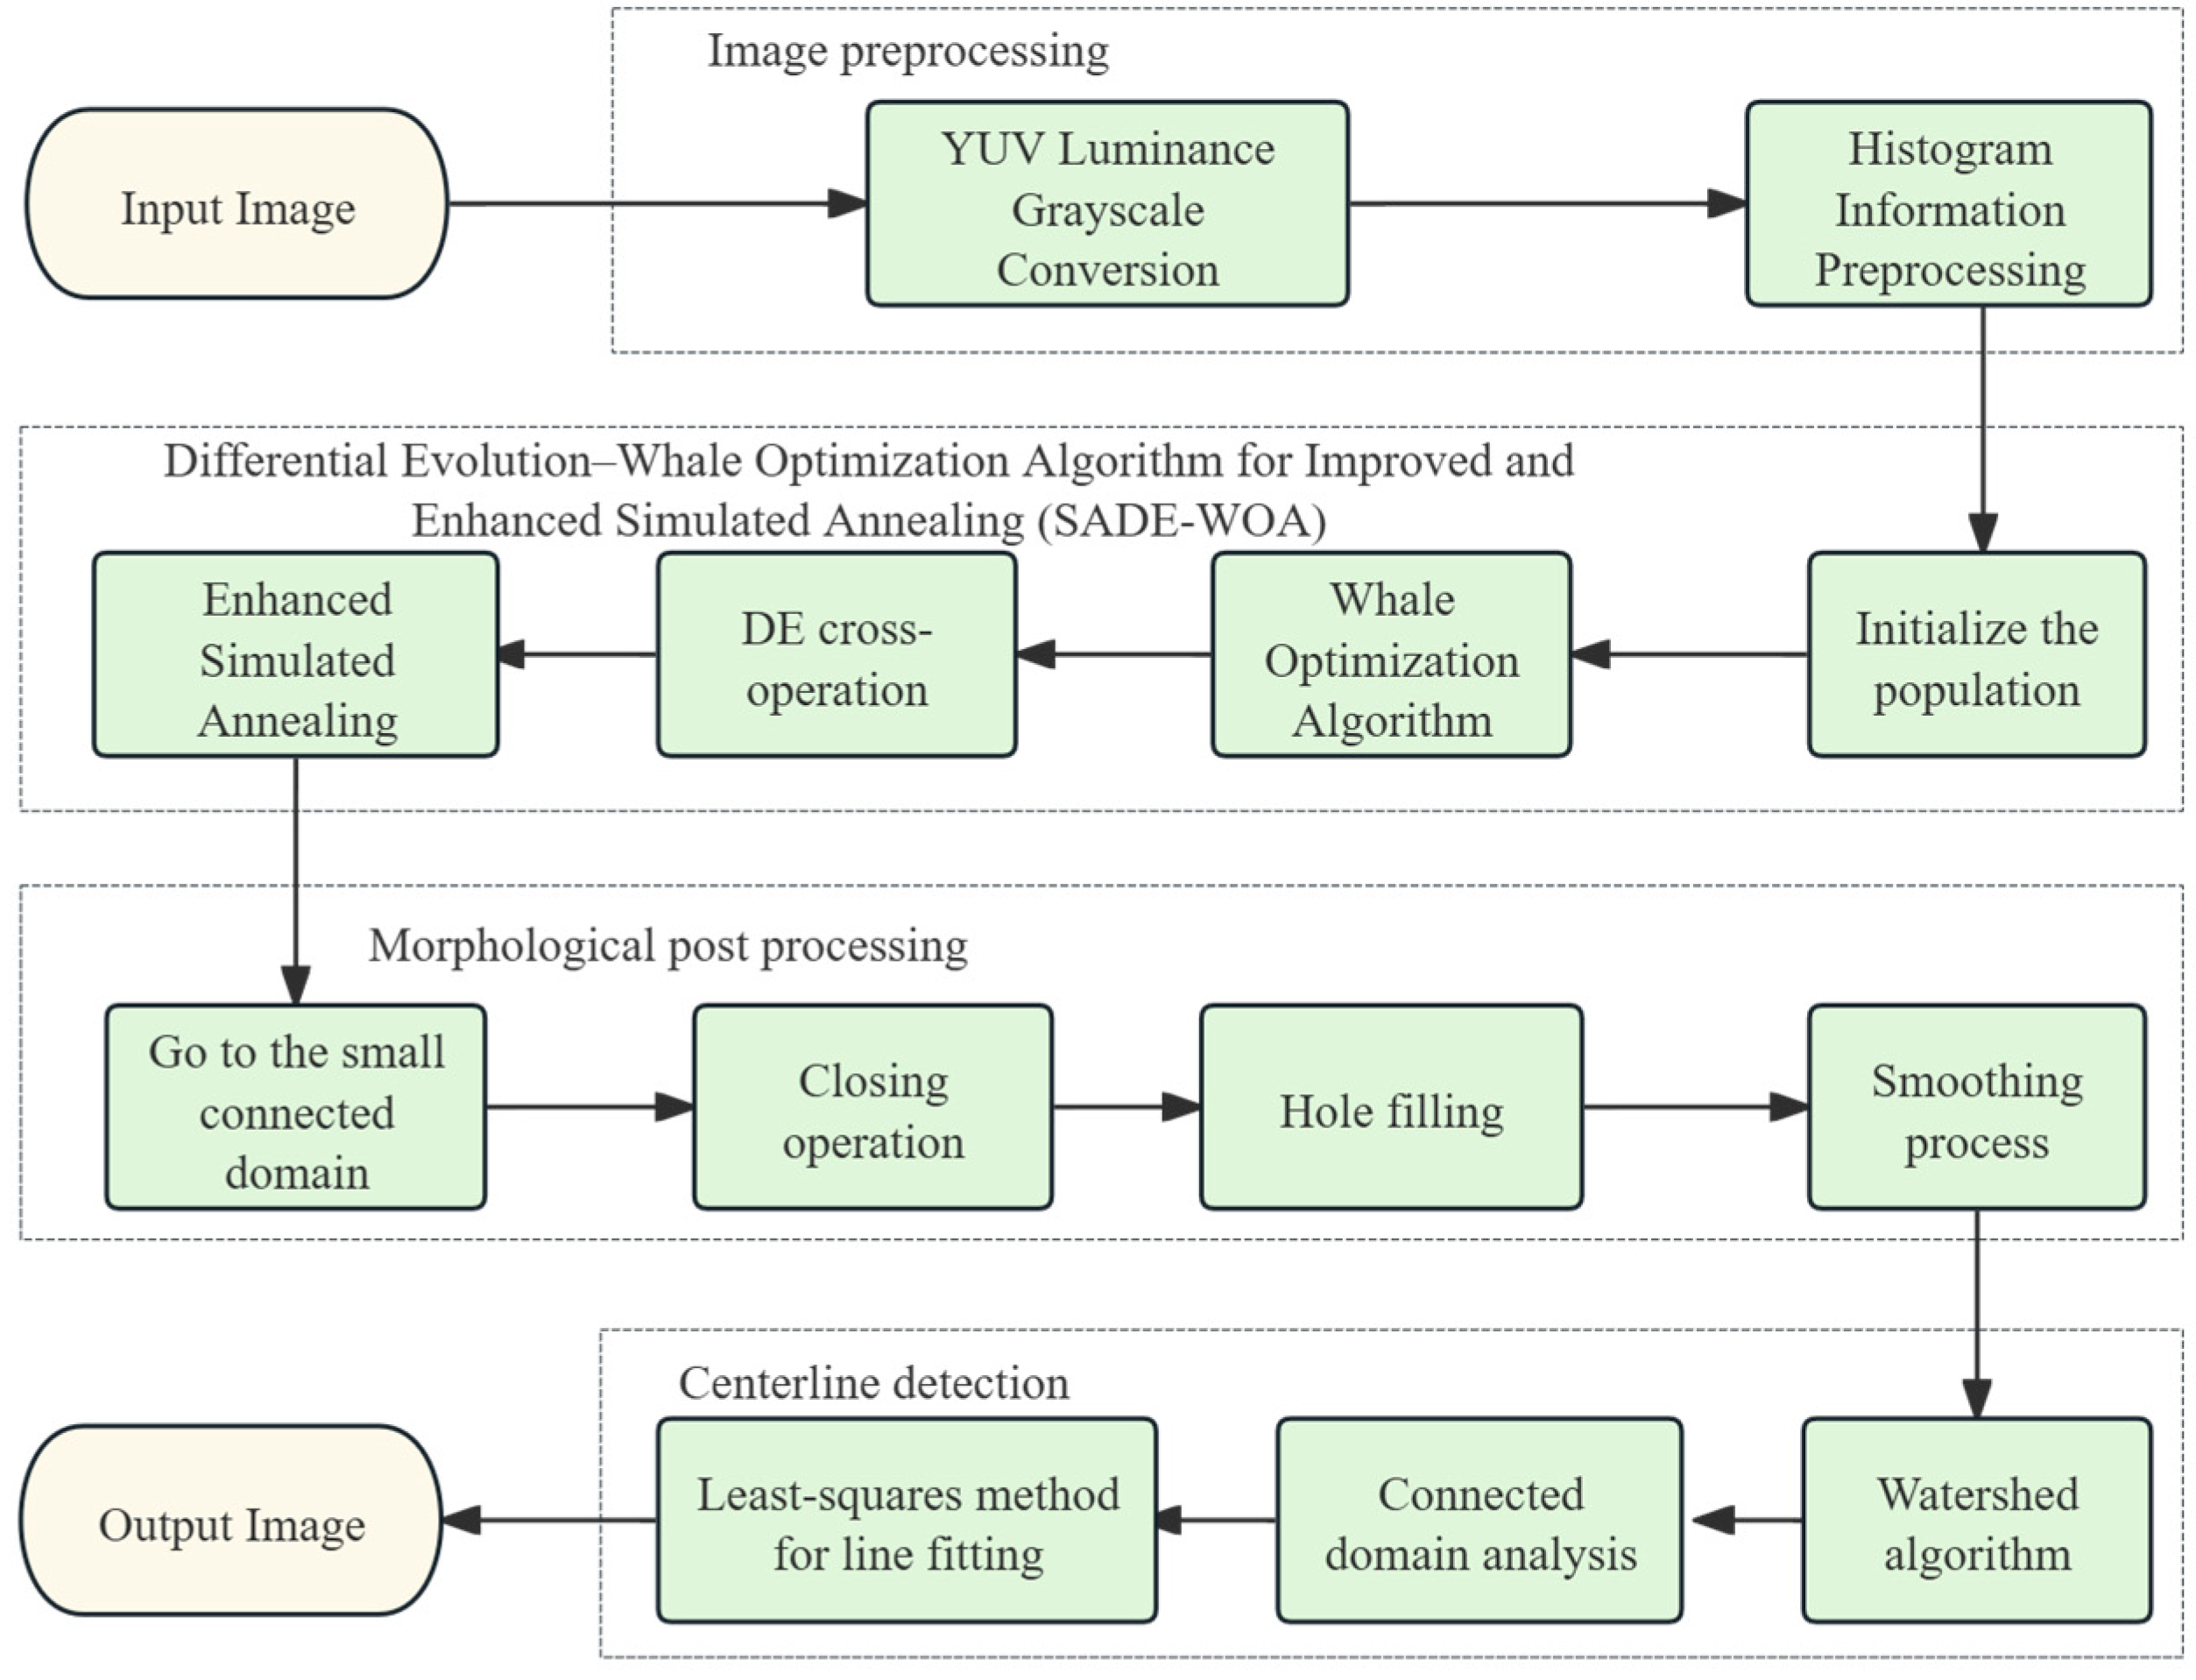
Following the segmentation of straw-covered regions, centerline detection is carried out. This involves morphological denoising, connected component analysis, and edge detection using the Canny operator, followed by centerline fitting via the least-squares method. This complete pipeline supports the accurate extraction of seedling band centerlines and lays a foundation for the intelligent adaptation of agricultural machinery.
3. Results
To evaluate the performance of the proposed algorithm, adaptive testing, real-time testing, and comparative performance analysis were conducted. The experimental computer system was configured with Windows 10, an Intel Core i5 CPU, an NVIDIA GeForce MX150 GPU, 8 GB of video memory, and Visual Studio Code 1.101.2 as the image processing platform.
3.1. Otsu Multi-Threshold Segmentation Results Based on the Improved Enhanced Simulated Annealing Differential Evolution–Whale Optimization Algorithm (SADE-WOA)
In the field of image segmentation, segmentation methods are widely used in image processing and computer vision tasks. To improve the accuracy and efficiency of segmentation results, this study proposes an Otsu thresholding method based on an improved enhanced SADE-WOA. Comparative experiments were conducted against several existing optimization algorithms. Specifically, we compared the proposed method with the traditional GWO, DE, DE-GWO, and the improved Whale Optimization Algorithm (WOA+) on the task of Otsu multi-threshold segmentation. For all algorithms, the initial population size was set to 30, the maximum number of iterations was 200, and each algorithm was independently run 10 times with segmentation thresholds set to 2, 3, and 4.
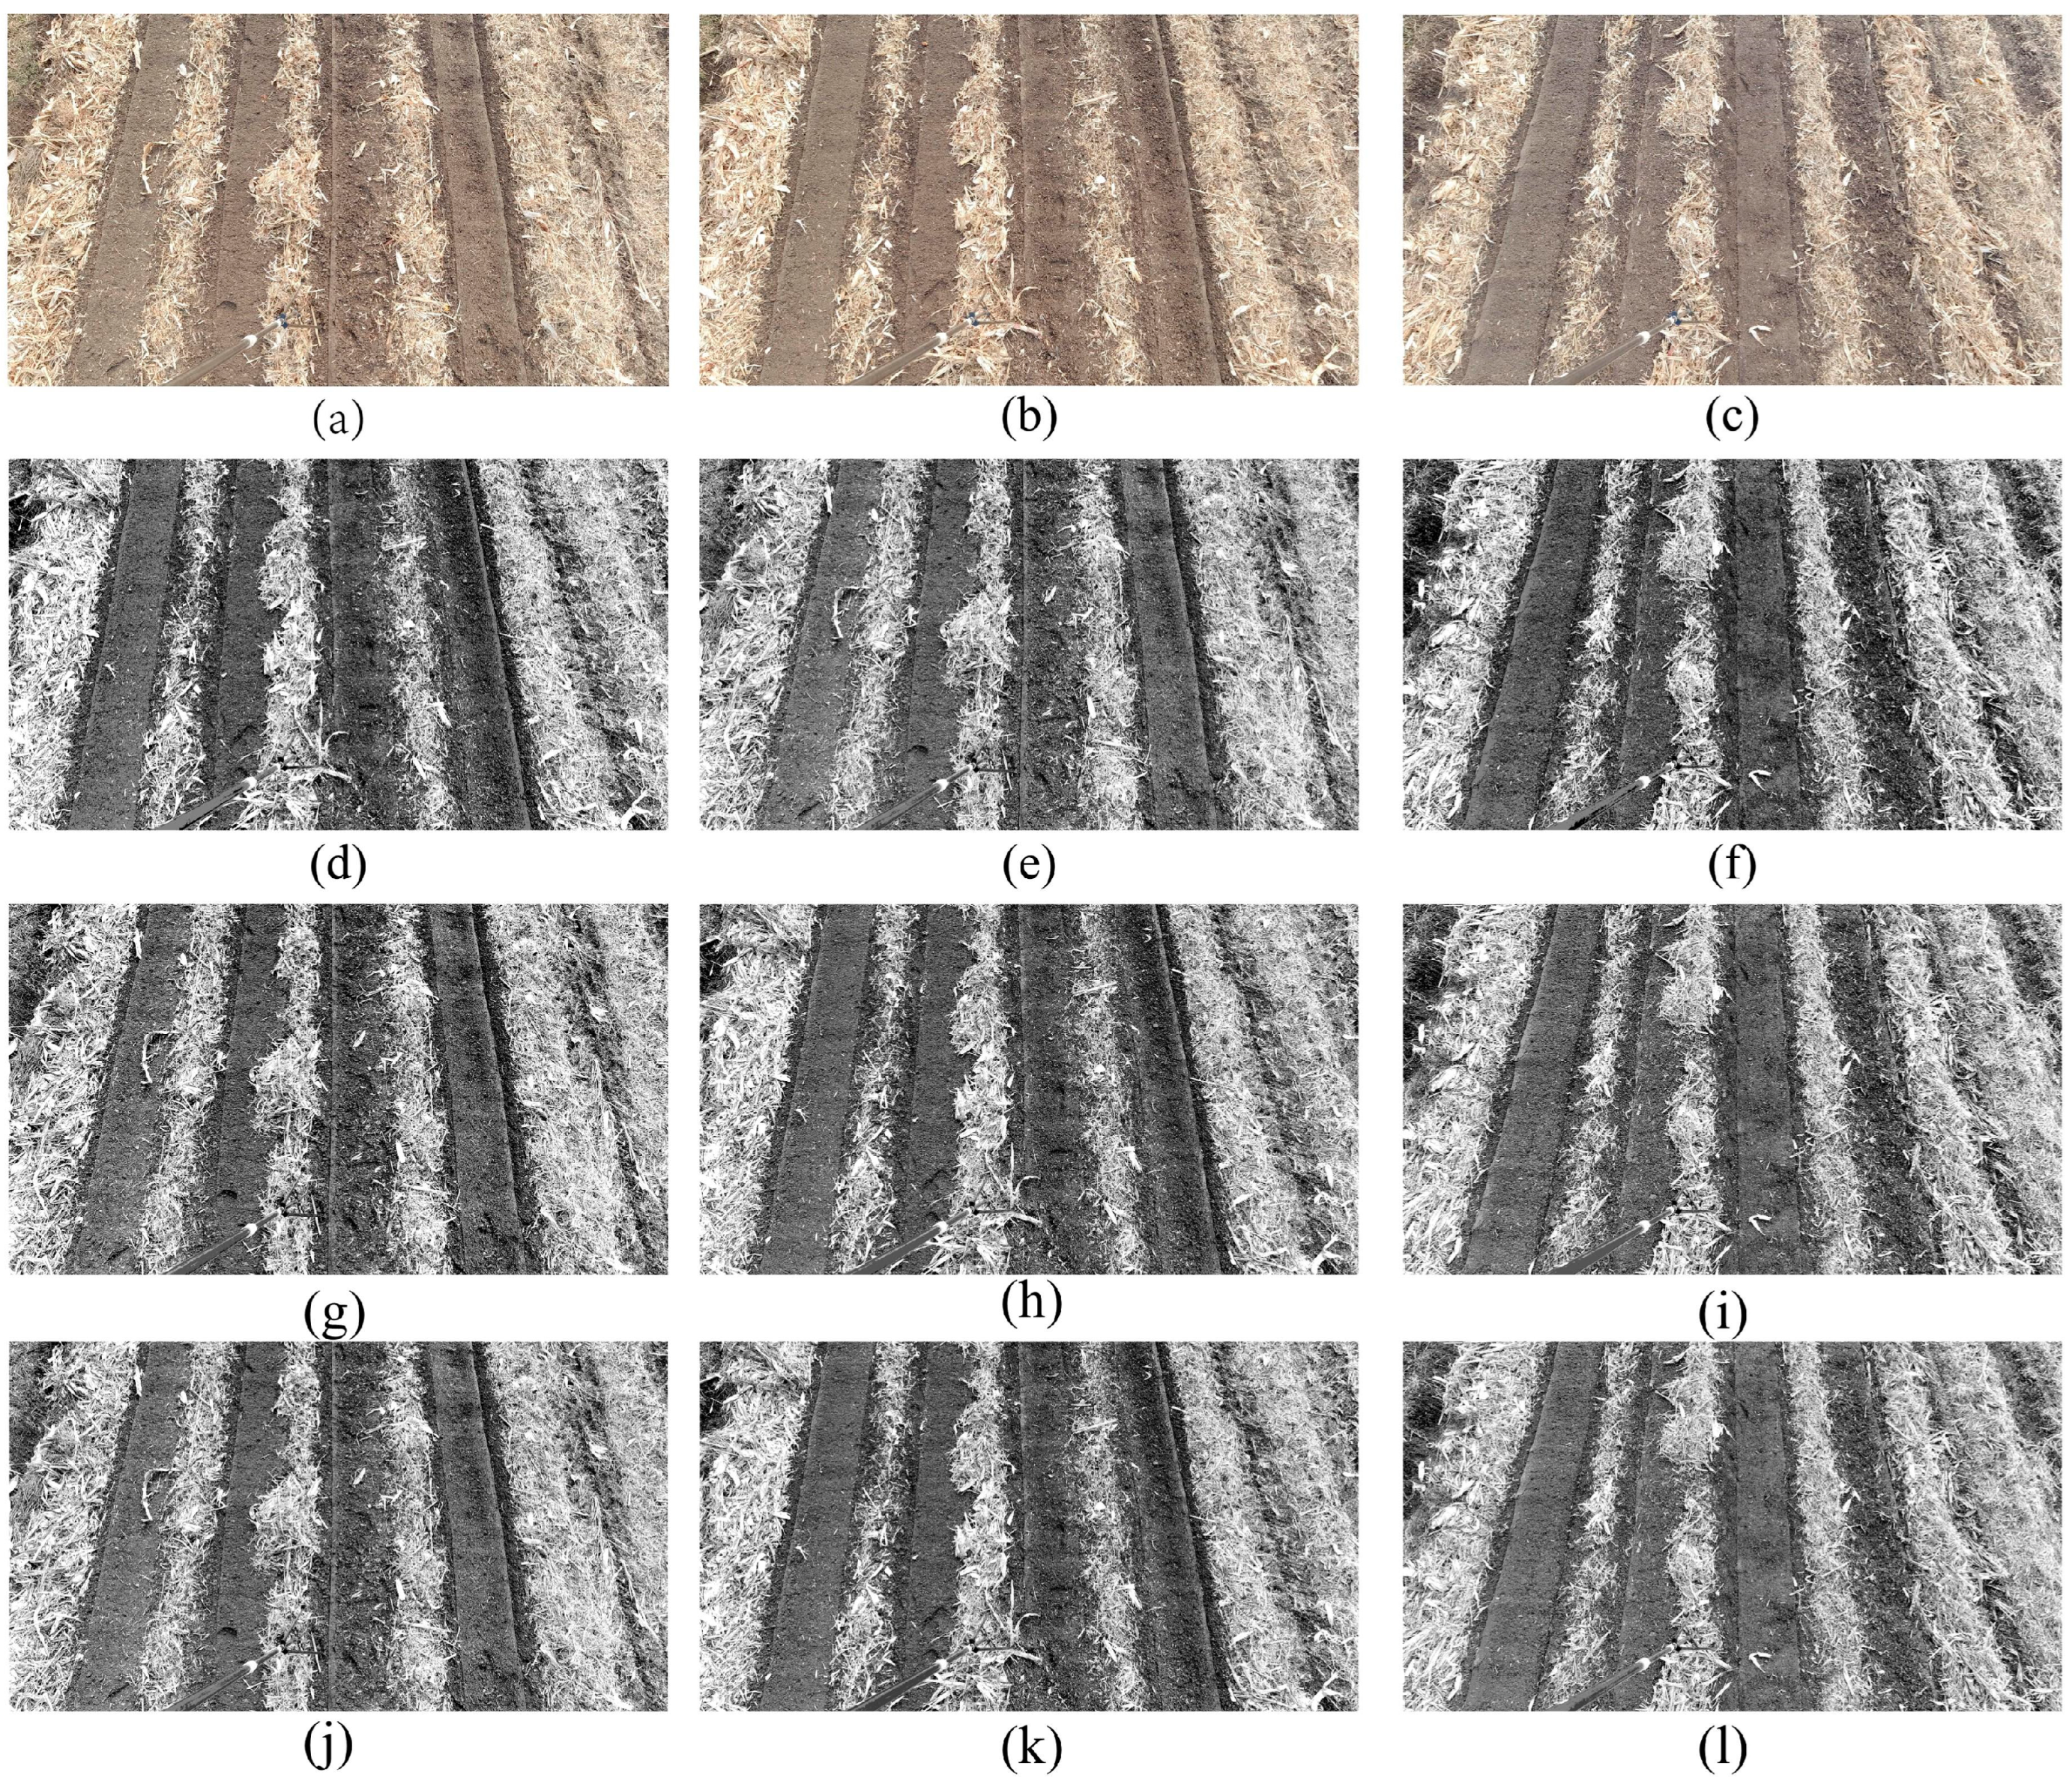
Multi-threshold segmentation experiments were conducted using the proposed algorithm and four other algorithms on three original images of maize fields, applying two-, three-, and four-level thresholding, as shown in
Figure 8.
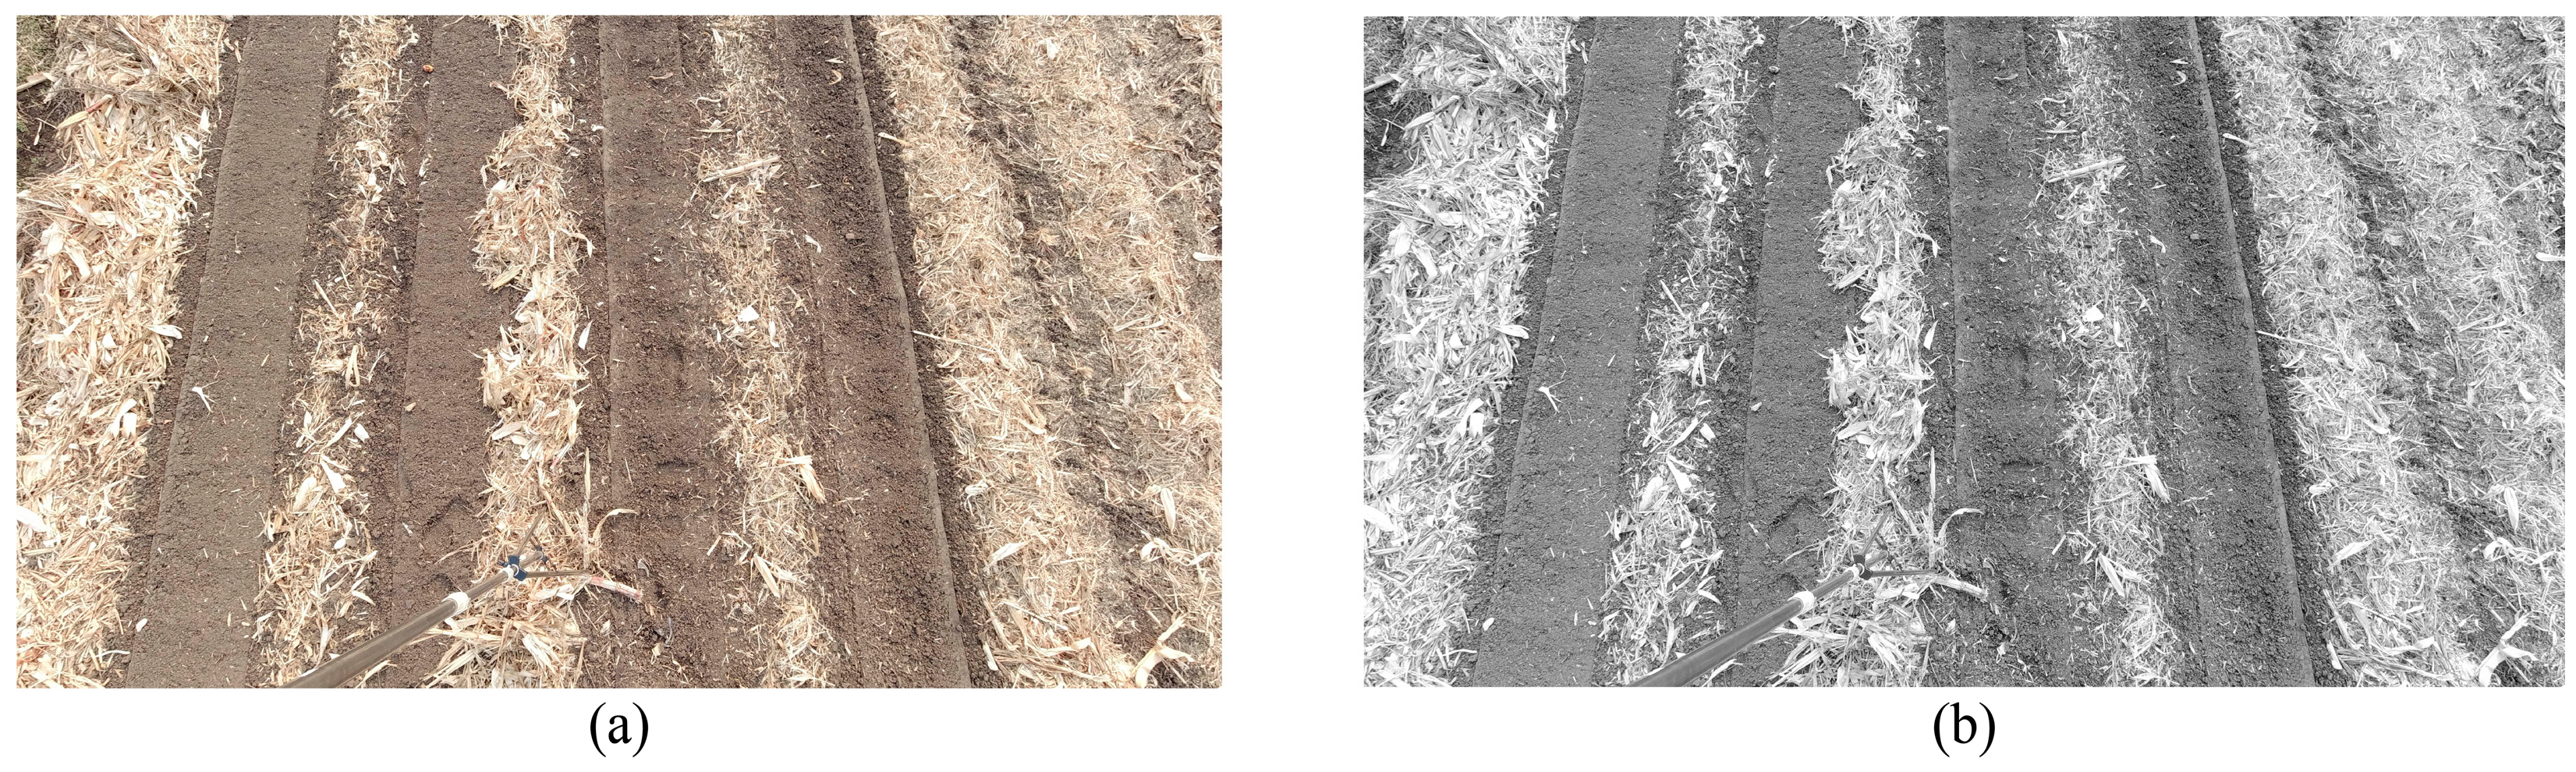
Figure 8a–c display the original images. In
Figure 8d–f, two-threshold segmentation effectively distinguishes between soil and straw, resulting in a simplified image structure and reduced computational complexity, which is suitable for fast processing tasks. However, due to the limited number of thresholds, this method struggled to capture subtle variations within the field, leading to blurred boundaries between straw and soil in some areas.
Figure 8g–i present the results of three-threshold segmentation. By introducing an additional threshold, the image was further divided into more distinct agricultural regions, such as dark soil, light soil, and straw. This enhanced the clarity of the straw regions and made the structure between rows more prominent. Nonetheless, this approach could still cause over-segmentation or detail loss in certain areas: for instance, in
Figure 8i, some straw boundaries remained imprecise.
Figure 8j–l show the results of four-threshold segmentation. With an increased number of thresholds, the hierarchical segmentation of the image was significantly improved, making the field structure more intuitive and the boundaries between straw and soil more distinct. This level of segmentation achieved the best balance among various regions. However, the computational cost is higher compared to that of the two- and three-threshold methods, and in some cases, small noisy regions may emerge—for example, localized background noise caused slight inaccuracies in
Figure 8l. In summary, the results of multi-threshold segmentation demonstrated that for complex images of maize fields during the seedling-absent stage under straw return patterns, the proposed SADE-WOA can effectively perform multi-threshold segmentation. Among the tested configurations, four-threshold segmentation performed best, enabling the precise delineation of soil areas while preserving straw texture information.
Table 1 presents the optimal thresholds and corresponding maximum between-class variance values obtained by the five different algorithms when segmenting cornfield images. As shown, when the number of thresholds was relatively small, the optimal thresholds selected by the various algorithms tended to be similar, making it difficult to distinguish segmentation accuracy clearly. However, as the number of thresholds increased, the number of segmented regions also rose, leading to a corresponding increase in the complexity of the image information to be processed. Under these circumstances, the demand for segmentation accuracy grew exponentially. In this study, the criterion for threshold selection was the maximization of between-class variance, which essentially determines the optimal threshold by maximizing the statistical separability between foreground and background. A higher between-class variance indicates a better threshold selection and thus greater segmentation accuracy. By comparing the threshold values and between-class variances across different numbers of thresholds and test image scenarios, it was evident that in multi-threshold segmentation—particularly when the number of thresholds was ≥3—the SADE-WOA effectively enhanced the between-class variance through optimized threshold combinations. For instance, under the three-threshold condition in
Figure 8a, the between-class variance exceeded that of GWO by 0.9972, and under the four-threshold condition in the same scenario, it exceeded that of GWO by 3.7195. This demonstrated an improved discriminability between image classes. In contrast, traditional algorithms such as GWO and DE showed limited improvement in between-class variance as the threshold number increased and were more affected by image complexity. In summary, these results validate the effectiveness of the SADE-WOA in image threshold segmentation tasks, particularly in addressing the precision demands of complex agricultural imagery. The results also confirm the effectiveness of integrating the differential evolution crossover mechanism into the whale optimization algorithm’s position updating process.
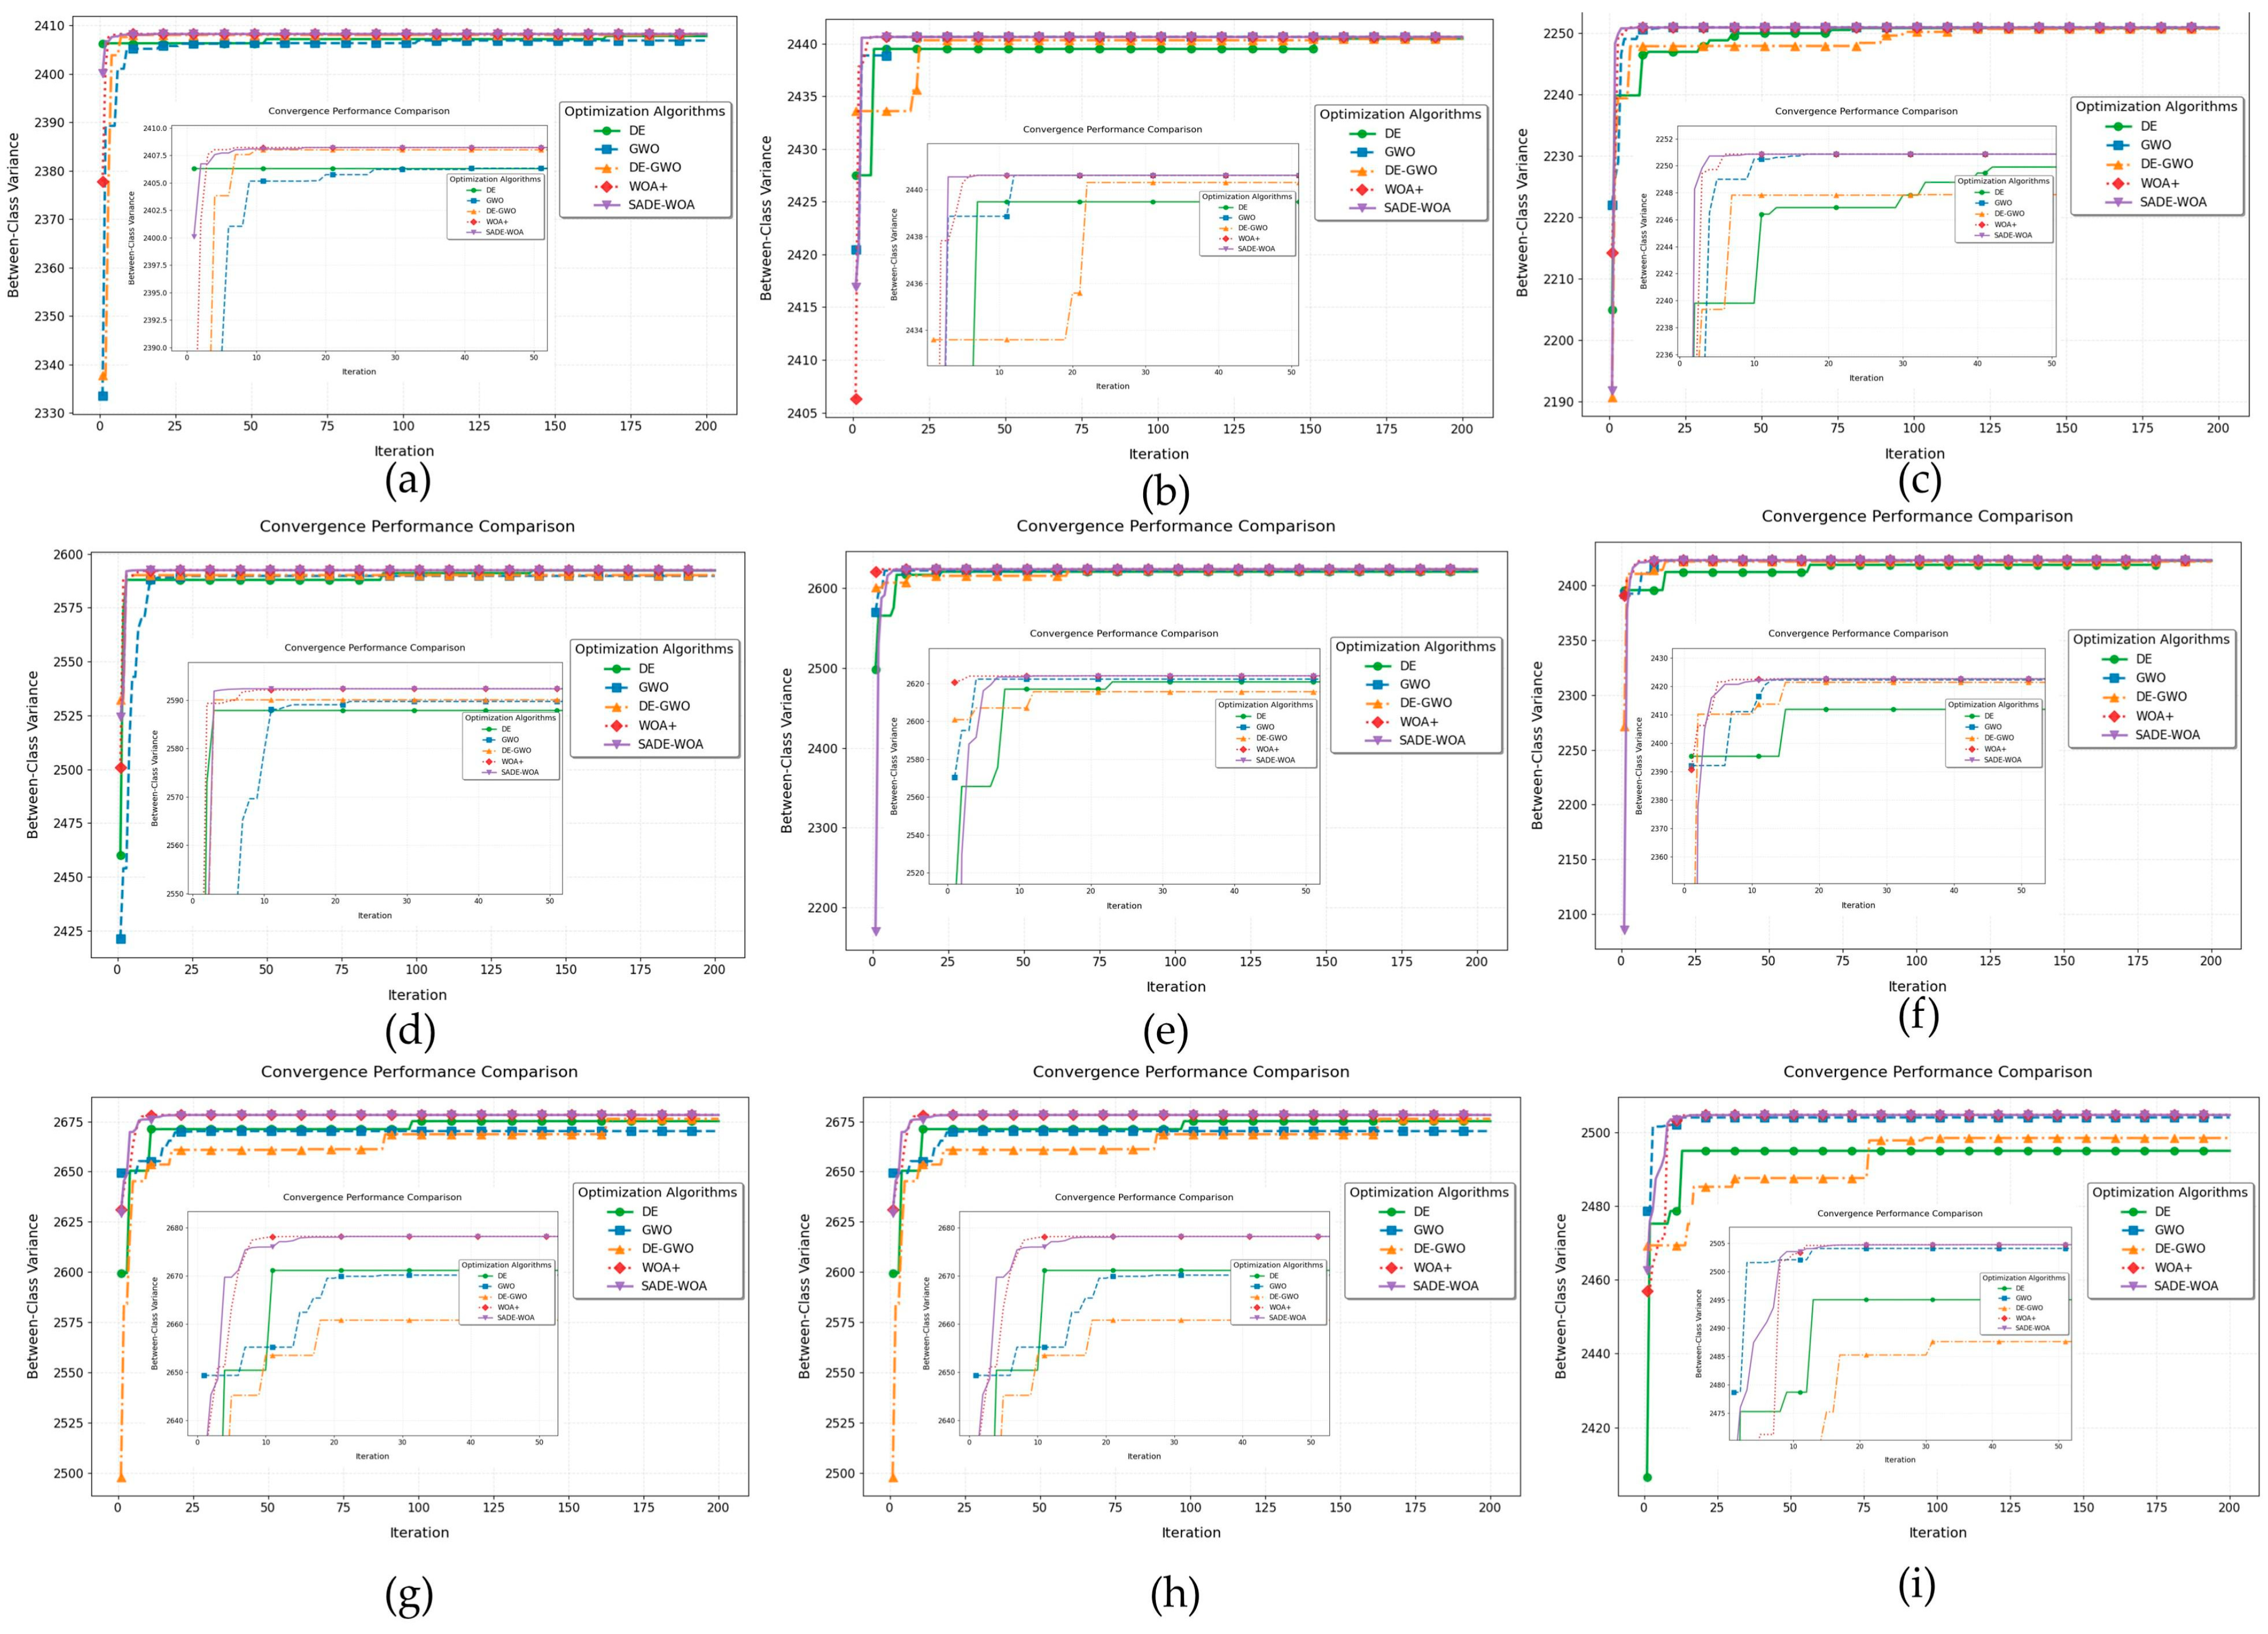
The convergence curves obtained from applying two-, three-, and four-level thresholding to the three groups of images (
Figure 8a–c) are shown in
Figure 9. The insets within each plot display a magnified view of the convergence behavior during the final 50 iterations for detailed observation. From the results, it is evident that for two-level thresholding (
Figure 9a–c), the curve rapidly ascends to a high between-class variance value, indicating that the proposed algorithm efficiently locates the optimal segmentation thresholds due to its improved design. As the number of thresholds increases, such as in the four-level segmentation scenarios (
Figure 9g–i), SADE-WOA consistently maintains stable convergence speed and accuracy, outperforming other algorithms in both precision and robustness. These results collectively demonstrate that SADE-WOA exhibits strong robustness and fast convergence when applied to multi-objective adaptive threshold optimization problems in complex field image segmentation tasks.
Table 2 summarizes the average runtime of the five algorithms during the multi-threshold segmentation process. The results indicate that the SADE-WOA achieved the shortest execution time in eight out of nine test cases. For example, in
Figure 8a, when the number of thresholds was two, SADE-WOA (0.0640 s) significantly outperformed GWO (0.6785 s) and DE (0.4969 s); when the threshold count increased to four, SADE-WOA (0.0922 s) still exhibited the fastest performance among all algorithms. Similarly, in
Figure 8b, for two thresholds, SADE-WOA (0.0491 s) was faster than GWO (0.8896 s) and DE (0.3786 s). In
Figure 8c, for two thresholds, SADE-WOA (0.0550 s) again surpassed GWO (0.5728 s) and DE (0.4319 s). Overall, the runtime of SADE-WOA was approximately one-tenth of that of GWO, one-ninth of that of DE, one-sixth to one-seventh of that of DE-GWO, and one-quarter of that of the improved WOA (WOA+), which demonstrates its outstanding computational efficiency. Moreover, SADE-WOA achieved the lowest standard deviation in runtime, indicating superior stability. These findings confirmed that the proposed method enables fast and stable performance under complex farmland conditions, fully satisfying the requirements for real-time processing.
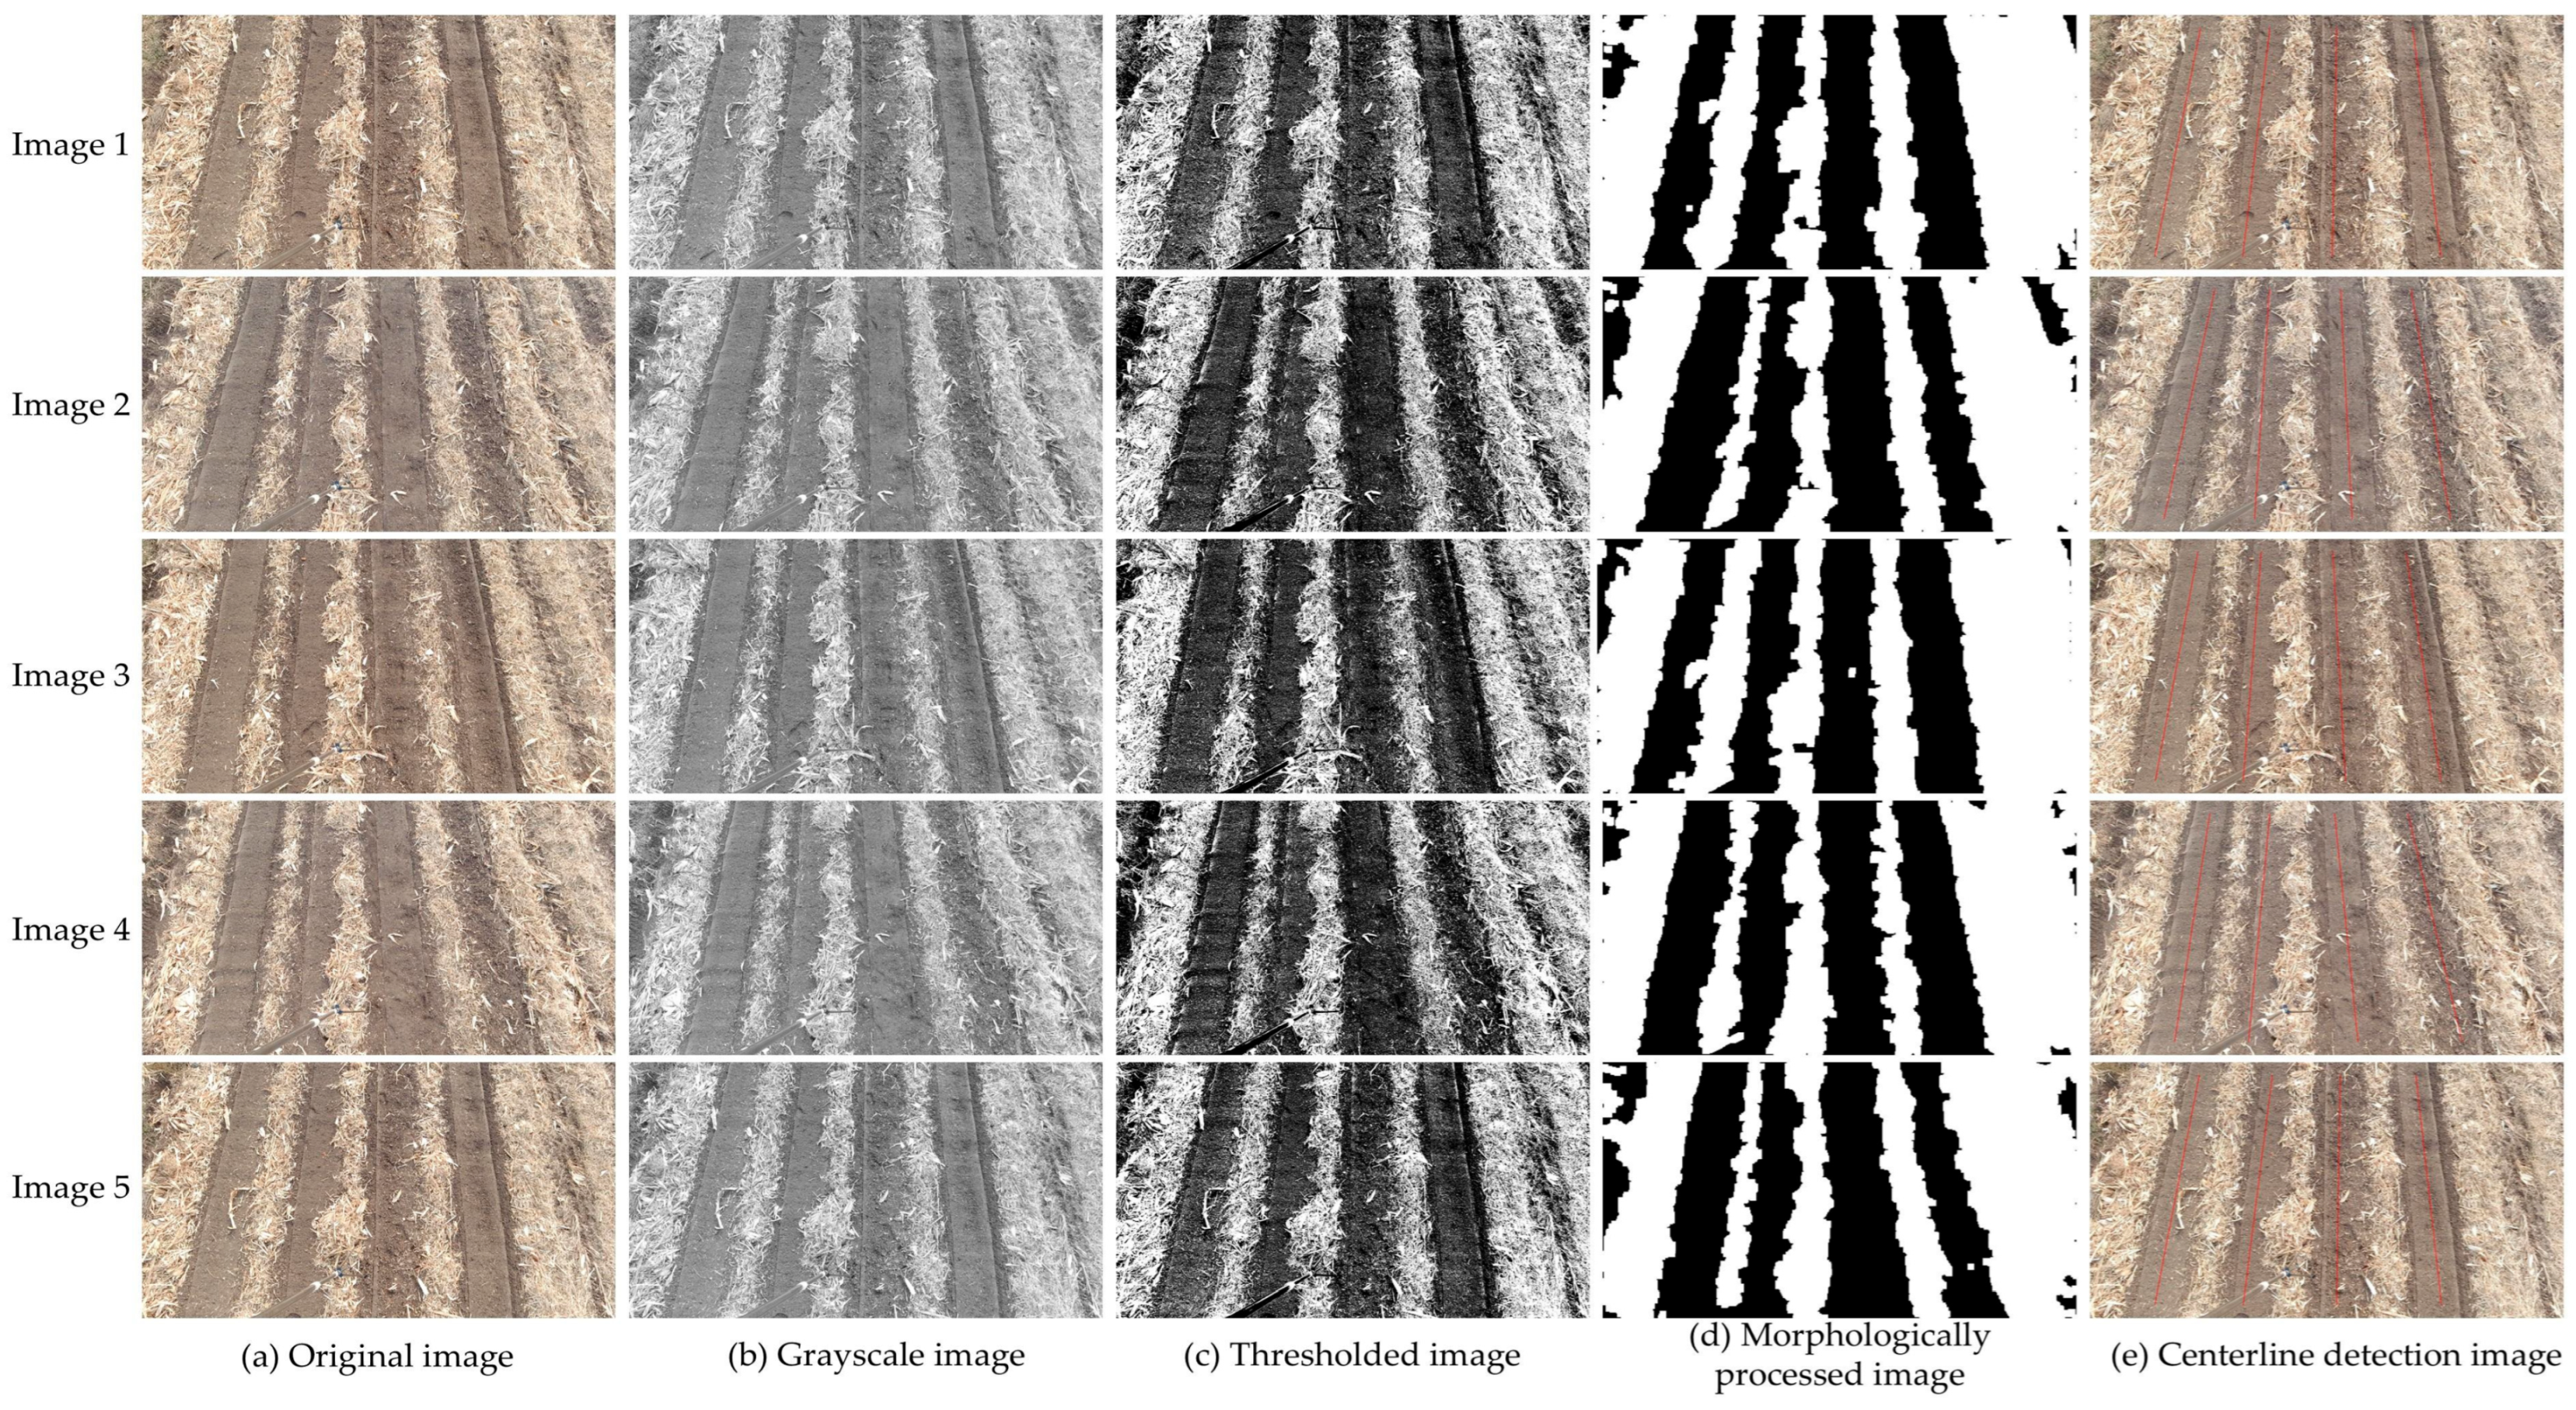
3.2. Centerline Detection Results for Corn Seedling Band Recognition
The purpose of detecting the centerlines of corn seedling bands during the seedling-free stage using the proposed algorithm is to enable precise row-based pesticide spraying by agricultural machinery. Since field operations require broad coverage, fast response times, and high precision, this algorithm was designed to detect multiple seedling band centerlines simultaneously.
To evaluate the accuracy of the proposed algorithm in detecting corn seedling band centerlines, manual annotations were conducted on seedling band images. These manually annotated centerlines served as the reference standard, created in strict accordance with agronomic requirements. According to the criteria for agricultural machinery navigation and pesticide spraying, the angular deviation between the manually annotated centerlines and those extracted by the algorithm must not exceed 5° [
38]. If this threshold is exceeded, the algorithm-detected centerline is considered invalid.
Field images captured in November 2024 at the research base of the Changchun Institute of Agricultural Machinery were used for evaluation. A total of 200 corn seedling band centerlines were identified across 50 selected images, and the detection results for five of them are illustrated in
Figure 10 as an example. The manually annotated reference centerline is displayed alongside the fitted centerline generated by the algorithm within the same image for direct comparison. The algorithm results, which included both least-squares and polynomial fitting methods, were evaluated against the reference by calculating the angular deviation between them. To assess the precision of the system, densely sampled interpolation points were taken along both the fitted and the reference centerlines. At each point, the tangent (heading) angle was computed using Equation (30) [
39], and the difference in heading direction across the continuous spatial domain was used to quantify the deviation in trajectory between the two lines.
In the above equation,
and
represent the gradients of the curve at the
-th point—calculated through numerical differentiation—and the angular difference between the manually annotated centerline and the algorithm-fitted centerline at each interpolated point is denoted as
. To strengthen the reliability of the evaluation, three mathematical metrics were employed to assess the angular deviations: mean error angle (MEA), root-mean-square error (RMSE), and mean relative error (MRE). These are defined as follows:
where
denotes the total number of interpolated points. All resulting angular measurements were converted from radians to degrees to ensure interpretability and consistency in the evaluation.
A smaller MEA (mean absolute error) indicates a lower overall angular deviation between the fitted line and the reference line. The RMSE (root-mean-square error) reflects both the magnitude and the distribution of the error; a lower RMSE suggests smaller fluctuations and higher stability across the dataset. The MRE (mean relative error) quantifies the angular error as a proportion of the reference line’s own angle, with lower values indicating better relative accuracy. However, the MRE may become unreliable when the reference angle approaches zero, as small denominators can exaggerate the relative error.
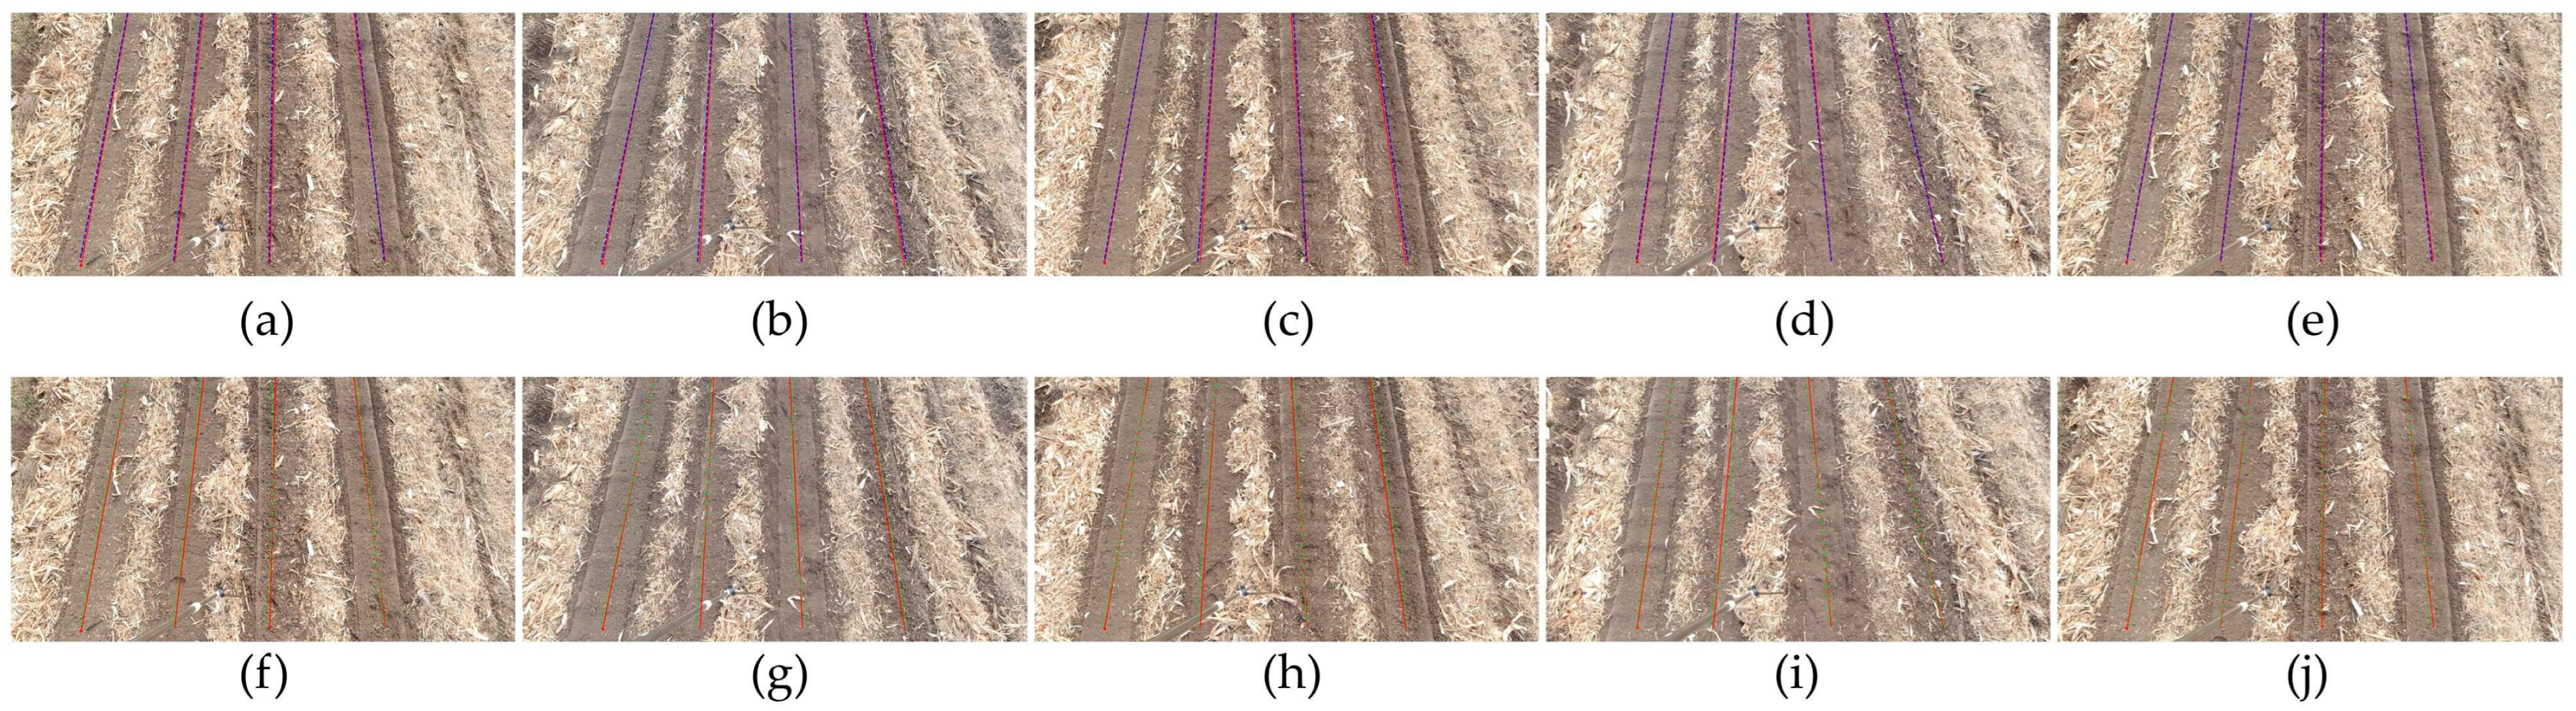
Based on the aforementioned angular deviation evaluation framework, a comparative assessment was conducted between two centerline fitting algorithms and the manually annotated reference lines for Images 1 through 5. The evaluation results are presented in
Figure 11.
Figure 11 illustrates the comparison between two centerline fitting algorithms and the manually annotated reference lines for corn seedling rows under straw alignment conditions during the seedling-absent growth stage. The first three subfigures (
Figure 11a–e) show results from the least-squares linear fitting method, which demonstrated high consistency in detecting centerlines, especially in relatively straight seedling row regions, indicating stable performance. In contrast, the last three subfigures (
Figure 11f–j) present results from the polynomial fitting method, which exhibited a stronger capacity to accommodate curved trajectories but also showed signs of overfitting fluctuations in complex terrain.
Table 3 compares the performance of the least-squares method (LSM) and polynomial fitting (PF) across five test images using the mean absolute error (MEA), root-mean-square error (RMSE), and mean relative error (MRE). For Image 1, the LSM demonstrated lower errors across all metrics (MEA: 0.52°, RMSE: 0.59°, MRE: 0.30%) compared to PF (MEA: 0.65°, RMSE: 0.73°, MRE: 0.37%). The 23.1% reduction in MEA and 19.2% lower RMSE highlight LSM’s superior consistency in bias control, as its linear optimization framework avoids the overfitting risk inherent in PF’s higher order term adjustments.
In Image 2, this advantage becomes even more pronounced: the LSM maintained stable performance (MEA: 0.52°, RMSE: 0.56°, MRE: 0.29%), while PF exhibited a significant degradation (MEA: 2.05°, RMSE: 2.36°, MRE: 1.17%). Here, PF’s error metrics surged by over 300% relative to those of LSM, likely due to overfitting or instability in handling complex data patterns—LSM’s simplicity in linear fitting proved more robust against noise or subtle nonlinearities that PF amplified.
For Image 3, the LSM continued to dominate with minimal errors (MEA: 0.34°, RMSE: 0.52°, MRE: 0.20%), whereas PF struggled with higher deviations (MEA: 1.06°, RMSE: 1.30°, MRE: 0.61%). The 212% increase in PF’s MEA and 150% higher RMSE further emphasize its susceptibility to nonlinear trends; LSM’s reliance on least-squares minimization effectively smoothed out irregularities, unlike PF’s tendency to overfit local data fluctuations.
In Image 4, the LSM achieved near-optimal RMSE (0.37°) and MRE (0.20%), outperforming PF (RMSE: 0.52°, MRE: 0.24%), despite a marginal MEA difference (LSM: 0.34° vs. PF: 0.41°). This suggests better error distribution control in LSM—its linear model balances bias—and a more effective variance tradeoff, whereas PF’s flexibility introduced uneven error contributions (e.g., larger residuals in edge cases).
Image 5 presents a unique case: for PF there was a marginal improvement in MEA (0.64°) and MRE (0.36%) compared to LSM (MEA: 0.67°, MRE: 0.38%), but its higher RMSE (0.75° vs. 0.73°) indicates inconsistent performance. This anomaly stemmed from PF’s localized fitting gains in certain data segments, which came at the cost of increased variance in others, reinforcing LSM’s reliability as a globally stable solution.
Overall, the least-squares method consistently delivered lower errors and greater stability across diverse scenarios, while polynomial fitting showed conditional effectiveness but remained prone to instability in complex or noisy environments.
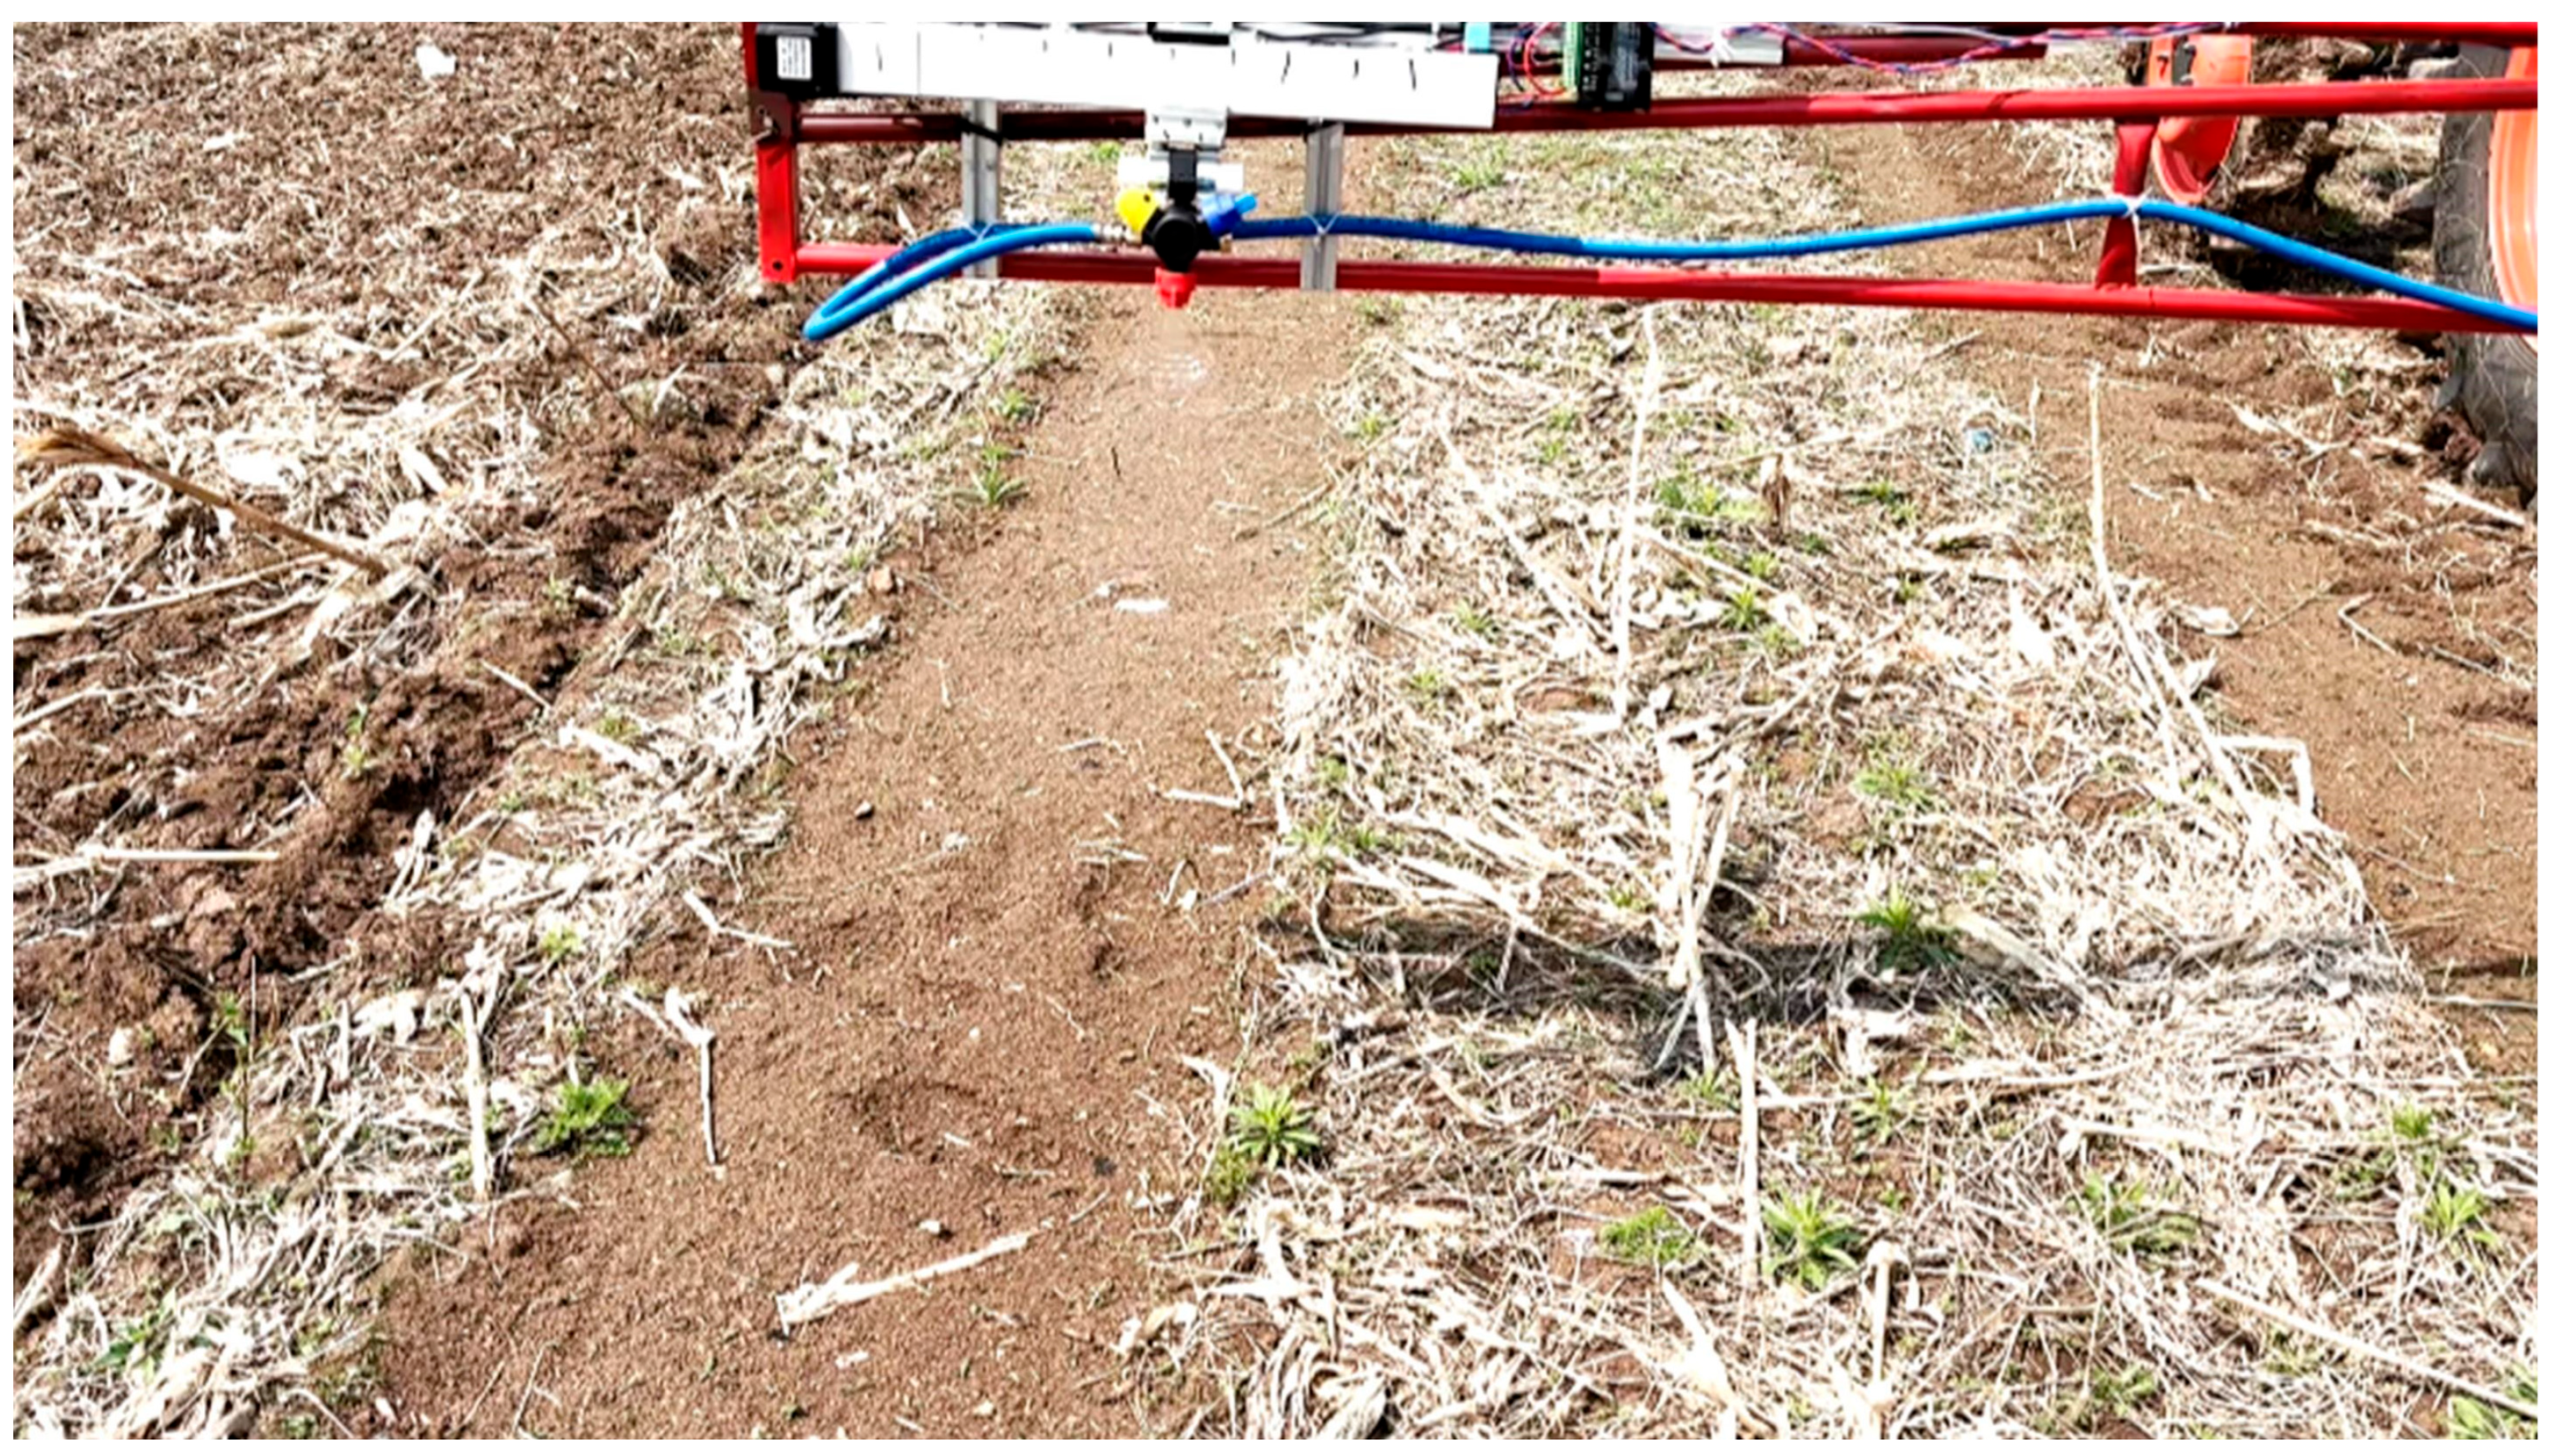
3.3. Field Spraying Results of Agricultural Machinery
The field spraying trial using agricultural machinery was conducted on 18 May 2025 in corn fields under straw-banding planting patterns. The spraying results are shown in
Figure 12. During the non-seedling period, the field operation achieved consistent coverage and effective droplet distribution along the anticipated corn seedling rows. The integration of automatic spray nozzles with real-time positioning based on centerline detection enabled uniform pesticide application while minimizing the overlap between adjacent seedling rows. Throughout the experiment, the spraying precision remained within acceptable agricultural standards, with minimal liquid waste, further confirming the high accuracy of the centerline detection method.
4. Discussion
4.1. Segmentation Result Analysis
In this study, the segmentation results were evaluated from multiple dimensions, including visual quality, quantitative metrics, and algorithmic efficiency. The proposed SADE-WOA-based Otsu multi-threshold segmentation algorithm was compared against several benchmark methods, such as GWO, DE, DE-GWO, and WOA+, under varying threshold levels (2, 3, and 4). The experimental results demonstrated that the proposed SADE-WOA-based multi-threshold segmentation algorithm achieved superior performance in both segmentation accuracy and computational efficiency. Visual analysis across three maize field images indicated that the two-threshold segmentation method effectively separated soil from straw, offering a simplified image structure and low computational cost. However, this simplicity came at the expense of finer detail, particularly at soil–straw boundaries. As the number of thresholds increased, segmentation granularity improved—three-threshold segmentation introduced an intermediate class, enhancing the clarity of inter-row structures and straw regions. Four-threshold segmentation achieved the most detailed and stratified results, clearly delineating different agricultural elements, albeit with a slight increase in processing time and occasional local noise. Quantitatively, the SADE-WOA consistently yielded the highest or near-highest between-class variance values across all threshold levels, particularly excelling under higher thresholds. This confirmed the algorithm’s ability to optimize the results in high-dimensional solution spaces. Furthermore, the convergence analysis revealed that SADE-WOA maintained a fast and stable convergence profile across all tests, outperforming comparative algorithms including GWO, DE, and DE-GWO. Runtime evaluations further validated the algorithm’s practicality, as it achieved the shortest execution time in eight out of nine cases and exhibited the lowest standard deviation, which underscores its robustness and suitability for real-time agricultural applications.
Compared with recent studies, the proposed SADE-WOA-based segmentation method demonstrates competitive performance in both segmentation accuracy and computational efficiency. For instance, Ning et al. (2022) [
40] employed a hybrid Whale Optimization Algorithm to enhance two-dimensional Otsu thresholding, reporting improved segmentation quality. However, their approach did not guarantee efficient runtime performance, particularly in processing large-scale images. Similarly, Liu et al. (2024) [
32] applied an optimized Otsu-based method for the segmentation of electrical equipment images, achieving segmentation accuracy comparable to that of conventional algorithms. The quality of segmentation was validated using the peak signal-to-noise ratio (PSNR) and structural similarity index (SSIM). Nevertheless, their method exhibited reduced accuracy when dealing with images containing multiple regions with similar grayscale intensities.
In another recent study, Zheng et al. (2022) [
41] utilized an improved particle swarm optimization (IPSO) algorithm to optimize Otsu multi-threshold segmentation. Their results indicated that IPSO outperformed other algorithms in terms of average value and standard deviation across most test functions. Moreover, the segmentation accuracy improved significantly with the increase in the number of thresholds. However, the computational load also increased substantially, rendering it less suitable for scenarios that require high real-time performance.
In contrast, our proposed SADE-WOA method integrates a self-adaptive mutation mechanism and an enhanced population diversity strategy, leading to more effective convergence and superior threshold optimization—especially in high-dimensional segmentation tasks. Across all tested scenarios, our algorithm consistently maintained the lowest standard deviation in runtime, which highlights its robustness and stability. These findings suggest that SADE-WOA offers a well-balanced tradeoff between segmentation precision and computational cost, making it particularly suitable for real-time segmentation applications in complex agricultural environments.
Despite the promising performance, the proposed SADE-WOA still has certain limitations. First, although the algorithm maintains high segmentation accuracy and fast convergence, the computational complexity slightly increases with the number of thresholds, which may affect efficiency in resource-constrained environments. Second, in scenarios with severe background noise or extreme lighting variations, the algorithm may produce small misclassifications or fragmented regions. Lastly, while the current approach effectively segments straw and soil, it lacks adaptive adjustment mechanisms for dynamically varying field conditions, which could impact its generalizability across different crop types or growth stages. Future work will focus on integrating contextual information and adaptive thresholding strategies to enhance robustness and scalability.
4.2. Analysis of the Corn Seedling Band Centerline Detection Results
After applying the improved SADE-WOA for multi-threshold segmentation, the resulting segmented images were further processed to detect the centerlines of the maize seedling bands. The centerline detection results for the maize seedling bands demonstrated that the proposed algorithm performed with high accuracy and robustness under complex field conditions. By comparing the algorithmically extracted centerlines with manually annotated reference lines, it was observed that the minimum deviation angles consistently remained within the agronomic threshold of 5°, confirming the validity of the method for guiding agricultural machinery operations such as row-based spraying. The least-squares fitting approach provided stable performance in relatively straight seedling bands, while the polynomial fitting method showed better adaptability in curved or irregular regions, albeit with occasional overfitting. A quantitative evaluation using MEA, RMSE, and MRE further validated the reliability of the proposed approach, with the least-squares method generally achieving lower error values.
Compared with recent studies, our centerline detection method demonstrated notable improvements in both accuracy and robustness to visual noise. For instance, Ronchetti et al. (2020) [
42] validated the feasibility of using UAV imagery for crop row detection, employing RGB sensors and simple algorithms such as Bayesian segmentation. While their approach achieved competitive accuracy and maintained low operational costs, it was sensitive to environmental changes, required substantial manual intervention, and exhibited relatively high computational latency. Similarly, Zhang et al. (2023) [
43] proposed an enhanced U-Net-based architecture for corn row detection, which delivered high precision in structured field environments. However, their method heavily relies on large-scale annotated datasets, involves a complex network structure, and demands high-end computational resources.
In contrast, our improved SADE-WOA-based pipeline achieved reliable detection accuracy and operational stability under varying field conditions without the need for extensive labeled data or GPU acceleration. Unlike deep learning-based approaches, our method is lightweight and computationally efficient, which makes it well suited for deployment on embedded platforms. Furthermore, the use of the least-squares fitting technique effectively smooths the centerlines and mitigates local distortions without requiring additional postprocessing. These characteristics underscore the practical advantages of our method for real-time applications in precision agriculture, particularly in scenarios where computing resources are limited.
Although the centerline detection was generally effective, certain limitations were observed. In areas where straw distribution was uneven or the contrast between soil and straw was relatively low, the extracted centerlines occasionally exhibited slight deviations or discontinuities. The proposed method also demonstrated sensitivity to external environmental factors. Specifically, the time of day had a significant impact on the detection results. Trials conducted during early morning or late afternoon, when ambient light is low, often lead to poor image quality due to insufficient illumination, which in turn affects the accuracy of centerline extraction. On the other hand, operations at noon under strong sunlight can introduce excessive shadows cast by agricultural machinery, also causing detection errors. Moreover, the weather conditions play a crucial role. For example, on cloudy days, the diffuse lighting softens the contrast between different field elements, potentially leading to less precise centerline detection. These findings indicate that the method’s performance is closely related to variations in field texture, illumination conditions, and weather circumstances.
4.3. Future Work
Future work will focus on addressing the identified limitations in both the segmentation and the centerline detection processes. To enhance segmentation performance in complex environments, especially under variable lighting and soil–stover contrast conditions, we plan to incorporate adaptive thresholding strategies and explore lightweight deep learning models that balance precision and efficiency. For centerline detection, efforts will be directed toward developing more robust fitting algorithms capable of maintaining continuity and accuracy in the presence of irregular textures and sparse features. Additionally, real-time deployment on embedded systems will be considered to support in-field agricultural operations with high responsiveness and reliability.
5. Conclusions
This study addressed the challenge of centerline detection in corn fields during the non-seedling stage under a straw row grouping pattern. An enhanced SADE-WOA is proposed and was employed for the adaptive multi-threshold Otsu segmentation of field images, serving as a key preprocessing step for subsequent seedling band centerline extraction.
Specifically designed for complex visual conditions in no-seedling-period cornfields with straw row grouping patterns, the SADE-WOA-optimized segmentation effectively separated soil regions while retaining straw texture details, demonstrating dual adaptability to heterogeneous image features. Quantitatively, the method consistently outperformed conventional algorithms in between-class variance, indicating superior class separability. It also achieved faster convergence and remarkable efficiency: the average computational time was reduced to 1/10th of that of GWO and 1/9th of that of DE, with low standard deviation, highlighting its stability.
When applied to centerline detection, the least-squares fitting method, used in combination with the preprocessed images, delivered reliable and accurate results. The mean absolute error (MAE) of the yaw angle remained within 0.34–0.67°, the root-mean-square error (RMSE) fell between 0.37 and 0.73°, and the maximum relative error (MRE) stayed below 0.2%. These metrics underscore the method’s strong error control and resistance to overfitting. Furthermore, the linear constraints imposed by the least-squares model helped eliminate noise and correct local deformations, thereby minimizing the cumulative error and ensuring accurate alignment with the seedling bands’ spatial structure.
Beyond its strong segmentation performance and improved centerline detection accuracy, the proposed SADE-WOA-based framework also exhibits excellent scalability and generalizability. Specifically, it is highly compatible with modular spraying systems, in which multiple nozzles can be independently controlled according to the detected seedling bands. This unit-based design allows for flexible adaptation to various field sizes and machinery configurations, enhancing the method’s applicability across a wide range of agricultural scenarios. Moreover, the method is computationally lightweight and does not rely on GPU acceleration or large-scale annotated datasets, which makes it well suited for deployment on embedded systems and low-power edge devices. These characteristics will enable real-time operation under resource-constrained field conditions, offering a practical and scalable solution for precision agriculture.
In conclusion, this study presents a targeted and effective solution for centerline detection in corn fields during the non-seedling stage under straw row grouping conditions. The proposed method demonstrated clear advantages in segmentation accuracy, computational efficiency, and detection precision within this specific agricultural context. Nonetheless, it should be noted that the validation of the method is currently limited to the non-seedling stage under a straw row pattern. Future research should aim to extend its applicability to other growth stages and different straw management practices, broadening the scope of its agricultural utility.


 ,
, 
