Article

Long-Term Conservation Tillage Increases Soil Organic Carbon Stability by Modulating Microbial Nutrient Limitations and Aggregate Protection

1
State Key Laboratory of Efficient Utilization of Arid and Semi-Arid Arable Land in Northern China, The Institute of Agricultural Resources and Regional Planning, Chinese Academy of Agricultural Sciences, Beijing 100081, China
2
Terra Research Center, Gembloux Agro-Bio Tech, University de Liège, 5030 Gembloux, Belgium
*
Author to whom correspondence should be addressed.
Agronomy 2025, 15(7), 1571; https://doi.org/10.3390/agronomy15071571 (registering DOI)
Submission received: 27 May 2025 / Revised: 19 June 2025 / Accepted: 25 June 2025 / Published: 27 June 2025
(This article belongs to the Section Soil and Plant Nutrition)

Abstract

Increasing soil organic carbon (SOC) storage is essential for improving soil fertility and mitigating climate change. The priming effect, which is regulated by physical, chemical and microbial interactions, plays a pivotal role in SOC turnover. However, the fate of both native and newly added carbon under different tillage regimes remains unclear. To address this gap, a 13C-glucose labelling incubation experiment was conducted to assess SOC mineralization and priming effects under long-term tillage practices, including subsoiling with straw mulching (ST), no tillage with straw mulching (NT), and conventional tillage with straw removal (CT). The results demonstrated that conservation tillage (NT and ST) significantly reduced total SOC mineralization and glucose-derived CO2 release compared to CT. Notably, the priming effect under CT was 19.5% and 24.7% higher than under NT and ST, respectively. In the early incubation stage, positive priming was primarily driven by microbial co-metabolism, while during days 1–31, microbial stoichiometric decomposition dominated the process. In addition, NT and ST treatments significantly increased the proportion of >250 μm aggregates and their associated carbon and nitrogen contents, thereby enhancing aggregate stability and physical protection of SOC. The priming effect observed under conservation tillage was strongly negatively related to aggregate stability and aggregate associated carbon content, whereas it was positively related to the β-glucosidase/Peroxidase ratio (BG/PER) and the subtraction value between carbon/nitrogen (RC:N) and the carbon–nitrogen imbalance of the available resources (TERC:N). Overall, our findings highlight that conservation tillage enhances SOC stability not only by improving soil physical structure but also by alleviating microbial stoichiometric constraints, offering a synergistic pathway for carbon retention and climate-resilient soil management.

1. Introduction

Soil organic carbon (SOC) plays a critical role in agricultural productivity and environmental sustainability [1]. However, as agricultural land use expands, the content of soil SOC has been increasingly depleted, particularly under conditions of global warming [2]. Therefore, mitigating SOC mineralization is a key strategy for combatting the greenhouse effect and maintaining agricultural productivity. Inputting unstable carbon components into the soil (i.e., leaching generated from rhizosphere sediments and straw residues) The filtrate and decomposition by-products can alter the microbial mineralization of natural organic carbon, a phenomenon known as the “priming effect” [3]. Tillage management influences SOC storage by regulating the mineralization and stabilization process through physical, chemical, and microbial processes [4]. Therefore, it is of great importance to understand the drivers and mechanisms that regulate SOC turnover under different long-term tillage practices to advance knowledge of the global carbon cycle.
Study have shown that adding exogenous unstable carbon to soil can stimulate the mineralization of soil organic carbon, thereby producing a positive stimulation effect [5]. Conservation tillage alters the priming effect and C retention following new C inputs [6]. Sauvadet et al. (2018) [4] found that reduced tillage and no tillage promoted SOC stability by reducing priming intensity compared to conventional ploughing. However, Bell et al. (2003) [7] discovered that a wheat-barley rotation combined with no tillage in Ritzville silt loam resulted in a greater priming effect than ploughing tillage. These discrepancies may be due to the physicochemical process in the soil. Under conservation tillage, the physical preservation and chemical manipulation of macroaggregates may reduce SOC mineralization and increase its conservation [8,9]. Furthermore, conservation tillage reduces soil disturbance, which promotes the formation and stability of macroaggregates by retaining organic matter and enhancing microbial activity, particularly fungal hyphae that aids in aggregate binding [10]. A long-term study has shown that no tillage significantly increases both macroaggregate proportions and their associated SOC contents [11]. Although conservation tillage enhances soil structure and physical protection of SOC, the specific mechanisms underlying SOC mineralization and stabilization remain insufficiently understood. In particular, the interactions among organic matter inputs, microbial dynamics, and aggregate turnover rates require further investigation to clarify how SOC is retained or lost over time.
The microbial decomposition and assimilation of plant-derived carbon are the most important precursors of SOC formation [12]. Microorganisms can use plant litter directly, or secrete enzymes to degrade it, thereby influencing the soil priming effect. Different tillage practices result in soil microbial communities regulating the expression of hydrolytic and oxidative enzymes to degrade complex organic molecules, including cellulose, hemicellulose, lignin and proteins [13,14]. Zheng et al. (2022) [15] conducted a study in dryland farming systems and found that no tillage significantly increased soil enzyme activity in different soil layers compared to conventional tillage. However, another study [16] suggested that the response of soil enzyme activity to tillage practices varies by region, although straw mulching was found to consistently increase the activity of all soil enzymes. Microbial activity and function are closely linked to soil physical structure, chemical properties and organic matter inputs [17]. High-intensity tillage often leads to soil compaction, reducing aeration, moisture retention and temperature stability, which in turn suppresses microbial growth [18]. Monitoring changes in enzyme activity can help to identify microbial responses at the genetic level to environmental changes in soil and provide insights into microbial ecological strategies for coping with environmental stress [19]. Therefore, elucidating the responses of enzymes involved in the transformation of carbon, nitrogen and phosphorus to different tillage and crop residue management practices will contribute to our understanding of variations in the microbial demands for carbon, nitrogen and phosphorus at the ecosystem level, which are closely linked to the stability and decomposition processes of SOC.
We conducted long-term conservation and conventional tillage practices to study the SOC stabilization and decomposition process. The objectives of this study were as follows: (1) to determine the effects of different tillage practices on SOC mineralization and the priming effect; (2) to quantify aggregate stability the proportional distribution of original and final SOC in different size fractions; and (3) to elucidate the interplay of physical, chemical, and microbial nutrient limitations in regulating SOC sequestration. We used laboratory incubations with 13C-glucose to analyze SOC and 13C-glucose-priming effects, and aggregate stability and temporal variation in enzyme activity. We hypothesize that a positive priming effect will occur after glucose addition due to co-metabolism. However, based on the physical protection and stoichiometric regulation of available elements and enzymes, conservation tillage promoted macroaggregate formation and reduced the enzymes required for energy consumption and substance secretion, thus reduce contact with carbon through co-metabolism mechanisms, thereby reducing priming effects and increasing carbon stability.

2. Materials and Methods
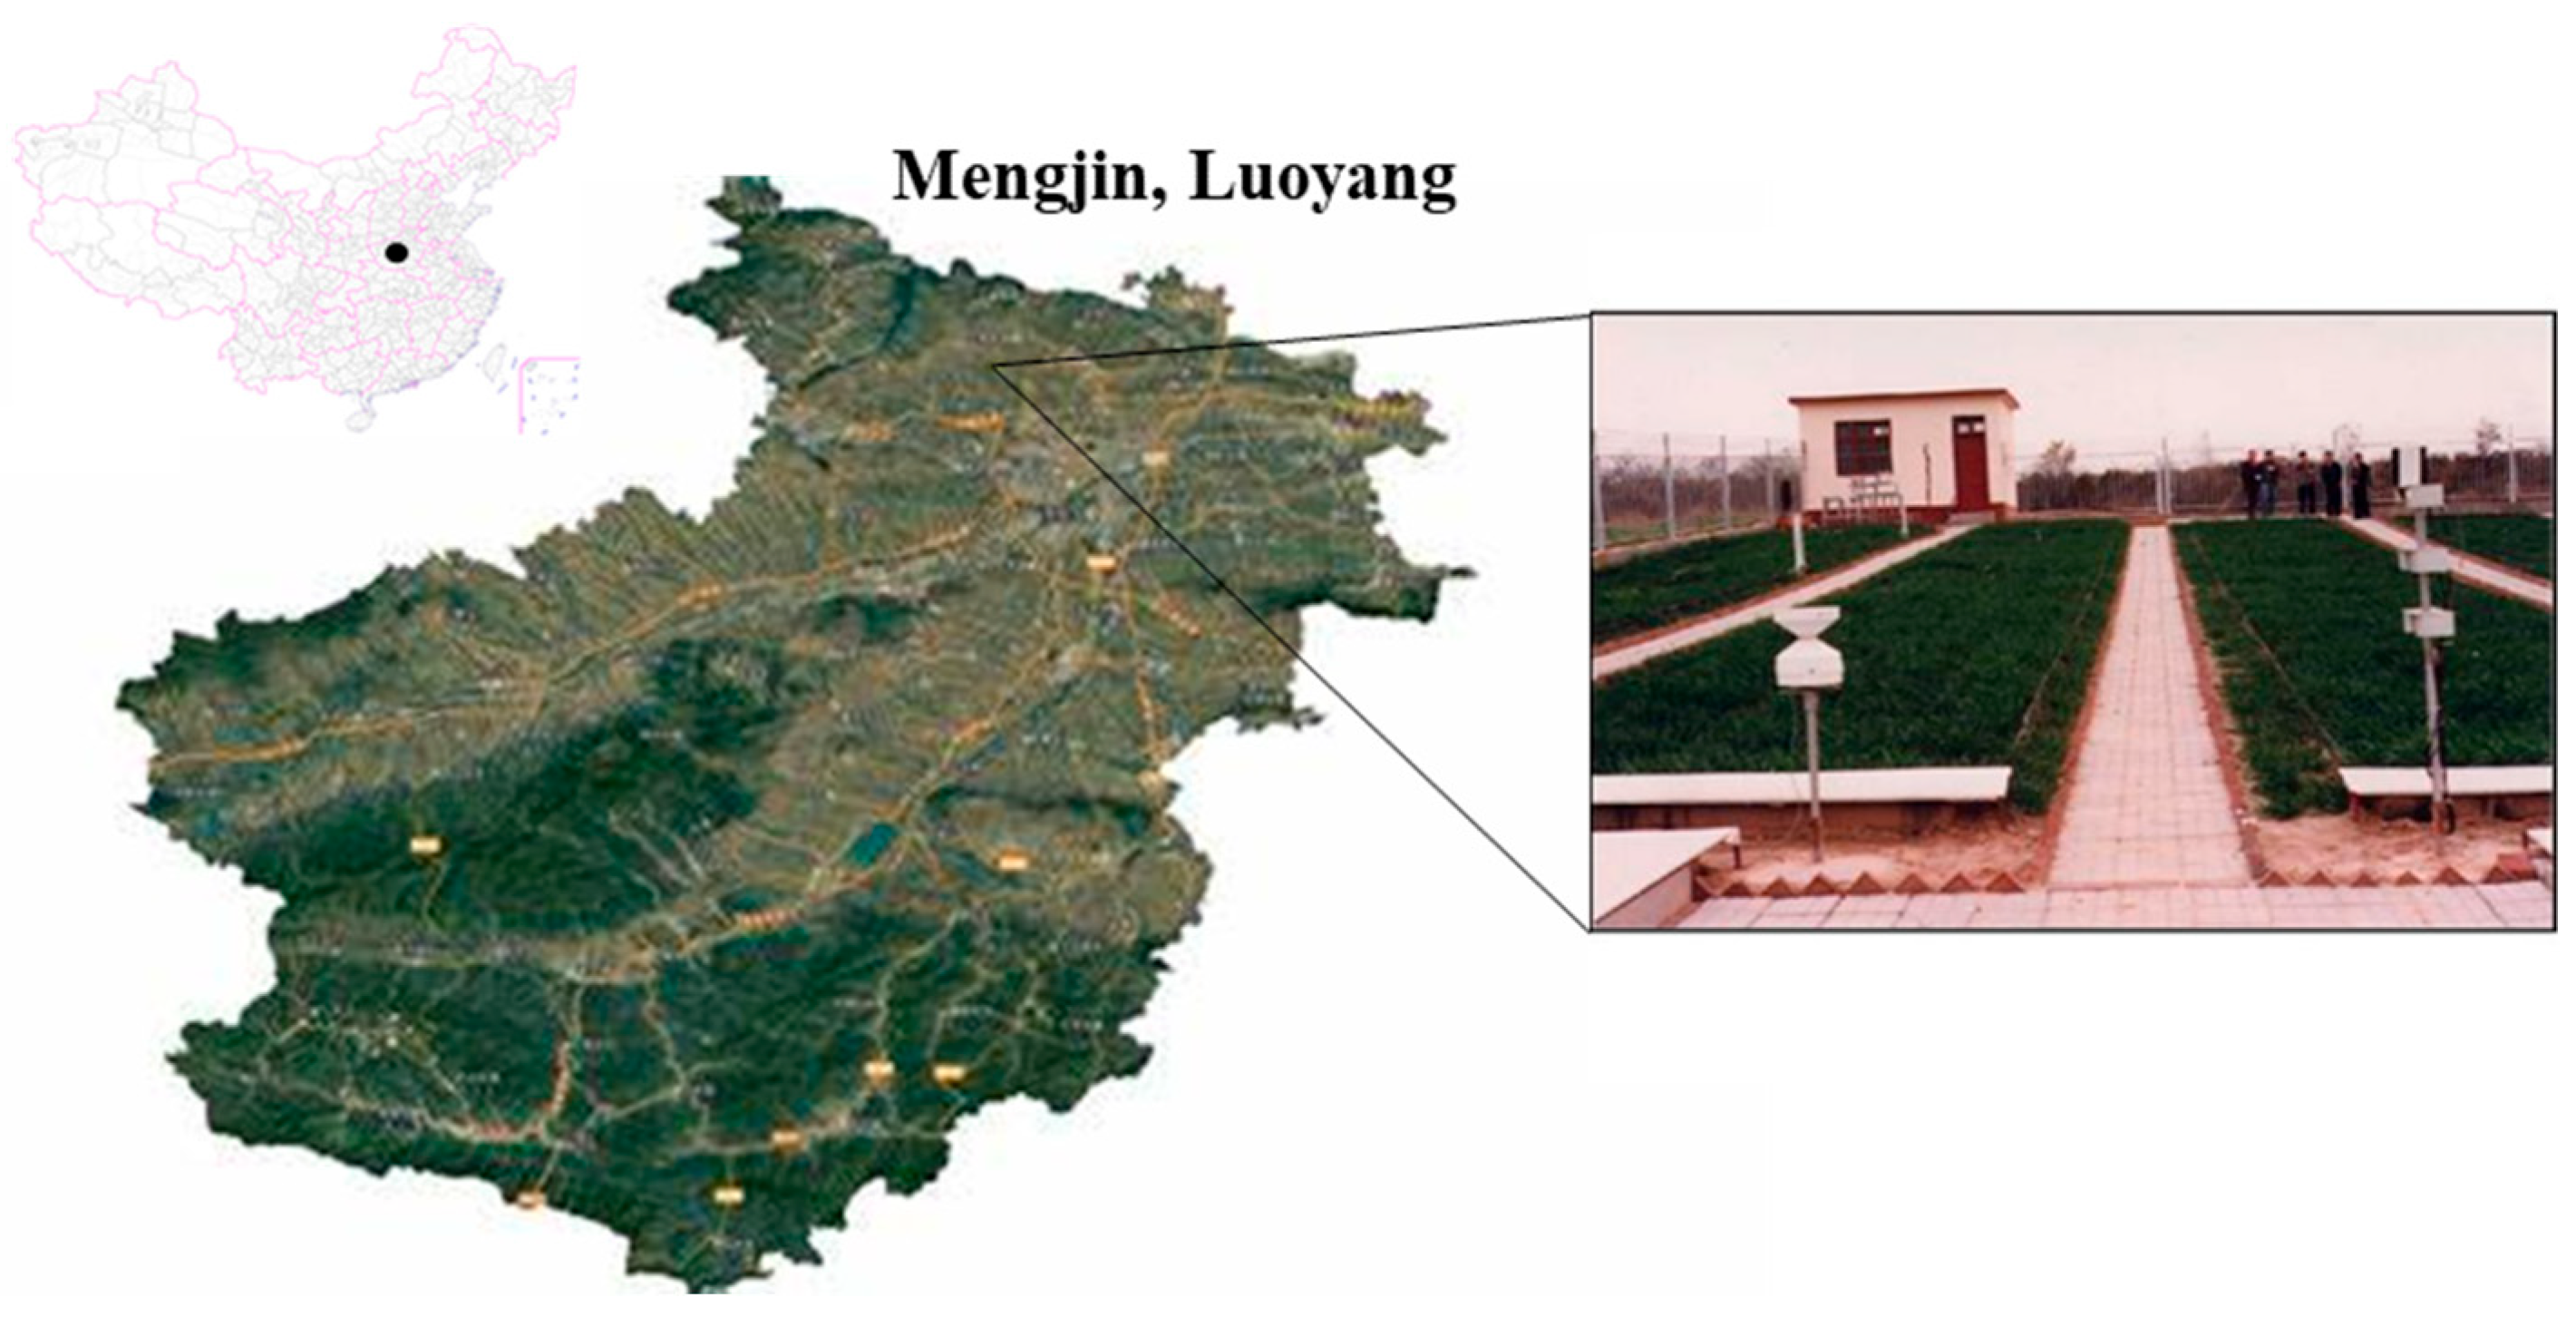
2.1. Study Site

A long-term field experiment was set up in Luoyang City (at an altitude of ~324 m, located at 34.80° N, 112.55° E) in the eastern part of the Loess Plateau, Henan Province, China, in 1999 (Figure 1). The region has a warm temperate continental climate, characterized by an average annual temperature of 13.8 °C, annual rainfall of 645 mm, total annual evaporation of 1905 mm, a 236-day frost-free period and an annual sunshine duration of 2295 h. The dominant cropping system is the mono-cultivation of winter wheat (Triticum aestivum L.) from early October to early June. The soil under study is classified as Calcaric Cambisols according to the Food and Agriculture Organization (World Reference Base for Soil Resources, 2014, 2015) and has a silt loam texture with 14.3% sand, 79.8% silt and 10.3% clay content. The SOC, total nitrogen, total phosphate (P) and total potassium (K) content at the initial year were 6.94 g kg−1, 1.12 g kg−1, 0.69 g kg−1 and 18.0 g kg−1 within the 0–20 cm soil depth.
The experiment was conducted using a completely randomized design with three replications. Each plot measured 10 m by 3 m, with rows spaced 0.65 m apart. Two conservation tillage practices were chosen: NT (no tillage with straw mulching and 30 cm tall stubble remaining in the field after threshing with no ploughing throughout the year) and ST (subsoiling with straw mulching). The control treatment was CT (conventional tillage with no straw return) involved leaving 5–6 cm of stubble with the straw and ears removed after harvest, with ploughing twice a year to a depth of about 20 cm in July and early October, just before sowing. Each plot received the same chemical fertilization (150 kg N ha−1 as urea, 105 kg P2O5 ha−1 as calcium superphosphate, and 45 kg K2O ha−1 as potassium sulphate) throughout the winter wheat growing season in different tillage systems. Other agronomic practices and pest and disease management were carried out according to local methods.

2.2. Soil Sampling and Laboratory Incubation

Soil samples were collected using a soil drill between September and October 2021. Visible rocks and plant litter were removed, and the soil was air-dried and sieved through a 2 mm mesh for further use. We selected three tillage methods (CT, ST, NT), every tillage treatment includes 9 soil samples, with each sample (equivalent to 640 g dry soil) was manually adjusted to 60% field capacity and pre-incubated for one week at 20 °C in the dark. Glucose was used to simulate labile carbon input, as it is a key component of root exudates and straw decomposition [20]. A glucose solution was added at 2 mg C g−1 soil—an amount known to promote microbial growth [21]. After pre-incubation, all processed soil was evenly divided into two parts: half of the soil samples were supplemented with 14 mL of glucose solution (1.658 atom% 13C), and the other half were supplemented with deionized water, the water content of all soil samples was adjusted to 70% field capacity by weight.
The experiment consisted of 4 batches of 144 sample culture bottles: 3 batches for destructive sampling and1 for CO2 collection. Each pre-incubated soil sample was divided into four portions (equivalent to 80 g dry soil each) and packed into PVC tubes (inner diameter: 46 mm, height: 60 mm, volume: 100 cm3) according to the soil’s bulk density. Each batch contains soil samples with added glucose and deionized water under the three cultivation methods, with three replicates per treatment. The bottom of each tube was wrapped with 400-mesh nylon cloth to allow water and air permeability while preventing soil loss. The tubes were supported by a PVC rack and placed inside 500 mL culture bottles. To maintain humidity, 5 mL of ultrapure water was added to the bottom of each bottle [22,23]. Three additional culture bottles without soil served as blank controls. The experimental processing method is shown in Figure S1.
All culture bottles were purged with CO2-free air (21% O2, 79% N2), sealed, and incubated for 31 days under controlled conditions (20 °C, 60% humidity, and complete darkness). Gas samples were collected one hour after the start of incubation and on days 1, 3, 5, 11, 23, and 31 for total CO2 concentration and 13C abundance analysis. Before sampling on these days, each culture bottle was flushed with CO2-free air for 10 min to standardize initial conditions [24]. The bottles were then incubated for 1 to 8 h, depending on the sampling stage. Gas samples were drawn using a 50 mL syringe and evenly distributed into two pre-evacuated gas cylinders. Total CO2 mineralization was measured using gas chromatography (7890A GC system, Agilent Technologies, Palo Alto, CA, USA), while 13C abundance was determined via isotope ratio mass spectrometry (Delta 12 Plus, Thermo Fisher Scientific, Weilburg, Germany).
After each gas collection, all culture bottles, including those designated for destructive soil sampling, were purged with CO2-free air for 10 min. The total carbon mineralization rate was calculated using the following formula [25,26]:
The SOC mineralization rate was calculated as the following equation:
F = C D × V × M × 273.15 22.4 × 273.15 + T × W × t × S O C
where F is the SOC mineralization rate (mg CO2–C g–1 SOC day–1); CD is the CO2 concentration (ppm) measured by Agilent 7890 A gas chromatography; V is the volume of the incubation glass bottles (0.05 L); M is the molecular mass of C (12 g mol–1); 22.4 (L) is the molar volume of an ideal gas at 1 atm and 273.15 K; T is the incubated temperature (25 °C); W is the gram dry weight of incubated soil (5 g); t is the duration of CO2 accumulation (1 day); and SOC represents the SOC concentration (g kg–1). Cumulative SOC mineralization (Rtotal) is the total CO2 released over 31 days.
The rate of glucose mineralization (Rglucose, mg CO2–C g−1 SOC) day−1) from glucose-amended soil was determined using the following equation:
R glucose = R total × ( a t o m % t o t a l a t o m % s o i l ) ( a t o m % g l u c o s e a t o m % s o i l )
The atomtotal and atom%soil refer to the 13C atom% of CO2 derived from the glucose-amended soil and the non-glucose-amended soil, respectively; atom%glucose refers to the 13C atom% of the glucose.
The priming effect (PE, mg CO2-C g−1 SOC) generated by native SOC after glucose addition was calculated using the following equation:
PE = ΣRtotal − ΣRglucose − ΣRcontrol − ΣRblank
Here, PE is the priming effect, and ΣRtotal, ΣRglucose, ΣRcontrol and ΣRblank refer to the cumulative CO2-C mineralization amounts from the glucose-amended soil, glucose, non-glucose-amended soil, and blank culture bottles, respectively.

2.3. Aggregate Distribution

Before and after the incubation experiment (at 0 days and the 31st day of the experiment), 50 g of dry soil was weighed and placed on a 2 mm sieve. Firstly, it was soaked in ultrapure water for 30 min and then moved up and down by 0.3 cm in deionized water at a speed of 40 times per minute for a total duration of two minutes. The particles on the sieve were then transferred to a glass container to obtain water-stable aggregates measuring >2 mm, 0.25–2 mm and 0.053–0.25 mm, <0.053 mm, respectively. The solution containing particles smaller than 0.053 mm was collected in a glass container and left to precipitate for 48 h. The supernatant was poured out and the precipitate (<0.053 mm) was placed in an oven at 60 °C with the other particle sizes to dry. The weight was then recorded. The dried precipitate of each particle size was selected, and the aggregates of different particle sizes were ground through a 0.15 mm sieve. The average weight diameter of the aggregates (MWD) is used to represent the stability of the aggregates and calculate using the following formula according to Zheng er al., 2023 [27]. The organic carbon and total nitrogen content of the aggregates of different particle sizes were determined using the high-temperature calcination method and analyzed using an elemental analyzer (Elementary, Frankfurt, Germany). The soil was acidified with 1 mol/L hydrochloric acid prior to analysis.

2.4. Soil Microbial Biomass Carbon and Nitrogen

At the beginning and end of the soil cultivation experiment, we measured the soil organic carbon (SOC) and total nitrogen content (TN), as well as the microbial biomass carbon (MBC) and nitrogen (MBN) content of the soil. As the soil contains carbonates, inorganic carbon was removed with 1 mol L−1 HCl solution, and soil organic carbon (SOC) and total nitrogen were determined by dry combustion at 960 °C using an elemental analyzer (Elementar, Analysensysteme, Elementary). The soil moisture content was adjusted to approximately 0.5 g/g (mass moisture content) and pre-cultivated for one week in a dark environment at 25 °C. Two 10 g portions of fresh soil, equal in weight to the dried soil, were placed into aluminium boxes. One box was placed in a vacuum dryer for chloroform fumigation and the other was left as a non-fumigated control. A total of 50 mL of ethanol-free chloroform along with distilled water were added to the fumigated dryer in sequence; 10 small glass beads were also added to prevent boiling. The dryer was sealed with Vaseline, and the dryer was evacuated until the chloroform boiled for two minutes; then, this was placed in a dark environment for 24 h. The soil samples from the control and fumigated groups were placed into triangular flasks. A total of 100 mL of the 0.5 mol L−1 K2SO4 solution was added and oscillated at 200 rpm on a shaker at 25 °C for 30 min. The filtrate was filtered and then transferred into a plastic flask. The MBC and MBN values were calculated as the differences in total extractable carbon and nitrogen between the fumigated and non-fumigated soils, divided by a correction factor of 0.45 for MBC and 0.54 for MBN, respectively [14,21].

2.5. Soil Enzyme Activity

The activities of hydrolases involving carbon, nitrogen, and phosphorus transformations-β-glucosidase (BG), N-acetylglucosaminidase (NAG), leucine aminopeptidase (LAP), and phosphatase (AP) were measured using a fluorescence-based method. A 10 μM 4-methylumbelliferone (MUB) solution (reference for BG, NAG, and AP; Sigma Aldrich NO. M1381, Burlington, MA, USA), a 10 μM 7-amino-4-methylcoumarin (AMC) solution (reference for LAP; Sigma Aldrich NO. A9891), and a 200 μM MUB substrate solution (for all enzymes) were prepared 24 h in advance and stored at 4 °C [28]. The pH of the 50 mM Tris buffer was adjusted to ~8.0 using HCl. Peroxidase (PER) activity was measured after 20 h of incubation at 25 °C in the dark, using L-3,4-dihydroxyphenylalanine (L-DOPA) as a substrate, with absorbance recorded at 450 nm [29]. Enzyme activity was expressed in nmol h−1 g−1 soil, calculated following DeForest’s (2009) [30] method.
Soil samples, previously stored at −20 °C, were reactivated at 4 °C for 24 h before enzyme activity analysis. To prepare the suspension soil, 1 g of soil was mixed with 125 mL of Tris buffer in a 500 mL polyethylene bowl at 1200 rpm for 2 min using a magnetic stirrer. The stirring speed was then reduced to 400 rpm, and the soil suspension, Tri’s buffer, reference solution, and MUB substrate were sequentially pipetted into a 96-well microplate following the protocol of [31]. Incubation began upon the addition of the MUB substrate, with the start time recorded. The microplate was wrapped in aluminium foil to prevent evaporation and light exposure and incubated at 25 °C in the dark for 3 h. Fluorescence was then measured using a multifunctional microplate reader (Scientific Fluoroskan Ascent FL, Thermo, Waltham, MA, USA) at excitation and emission wavelengths of 365 nm and 460 nm, respectively [32].
Absolute enzyme activity was calculated using DeForest’s (2009) [30] formula, with soil weight converted to dry weight by determining moisture content after drying at 105 °C for 8 h. Enzyme activity was expressed in nmol h−1 g−1 soil. Relative enzyme activity was determined by normalizing absolute enzyme activity to soil organic carbon content (nmol h−1 g−1 SOC).
In ecological enzyme stoichiometry, the threshold elemental ratio (TER) is defined as the elemental ratio corresponding to microbial balanced growth, where neither carbon nor nutrients are limiting [31]. When RC:N − TERC:N < 0, soil microbes are not nitrogen-limited, whereas when RC:N − TERC:N > 0, microbial growth is constrained by nitrogen availability [31].

2.6. Statistical Analysis

Analysis of variance (ANOVA) was performed to test the effects of different treatments with the least significant difference (LSD) at the p < 0.05 level using the general linear model procedures of SPSS software 27.0 (SPSS Inc., Chicago, IL, USA). A one-way ANOVA was then performed to evaluate the effects of different tillage practices on various parameters, including total carbon mineralization rate, glucose-derived carbon mineralization rate, cumulative total carbon emissions, cumulative glucose-derived carbon emissions, priming effect, microbial biomass carbon, and soil enzyme activity throughout the incubation period. Data visualization and plotting were carried out using Origin 2021. In addition, Spearman correlation analysis was conducted to explore the relationships among all variables of interest.

3. Results

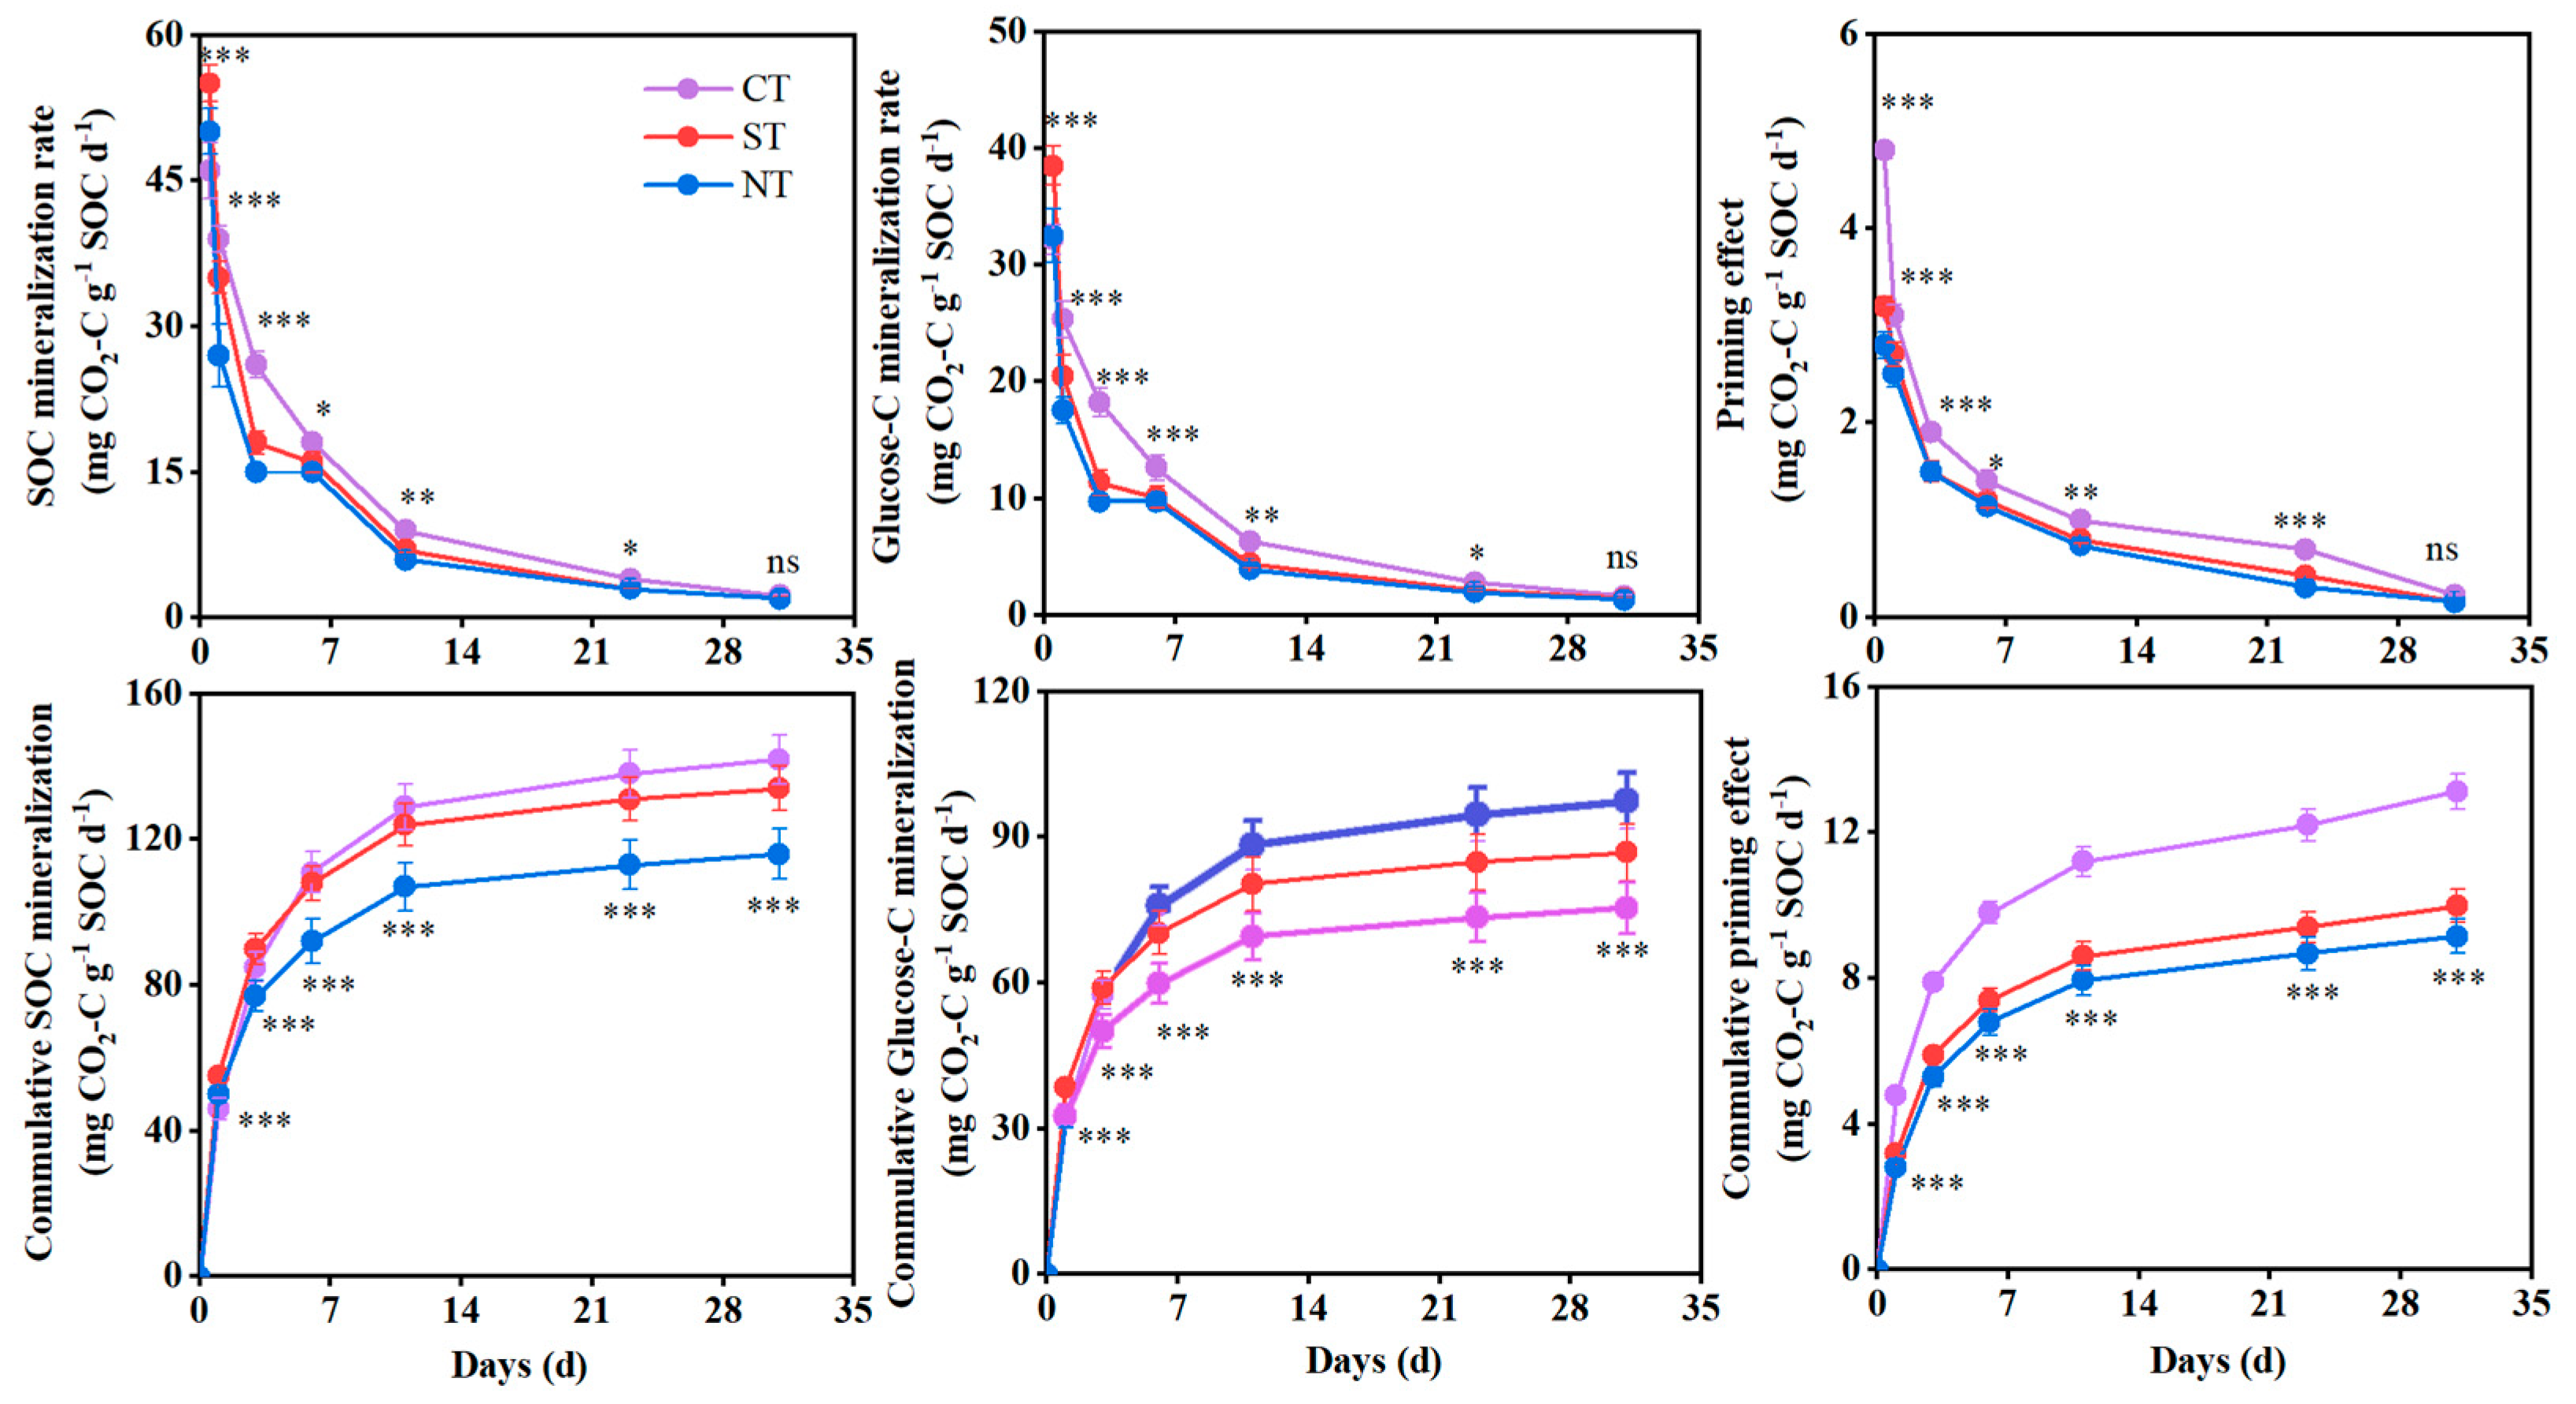
3.1. SOC Mineralization and Priming Effect

The SOC and glucose-C mineralization rates declined rapidly in the early stages of cultivation, then began to change more slowly from day 23 onwards (Figure 2). SOC and glucose-C mineralization exhibited different temporal patterns during the incubation period. On day 1, the order of SOC mineralization rates was ST > NT > CT; however, CT exhibited significantly higher SOCmineralization rates than both NT and ST for the remainder of the incubation period. By the end of the 31-day experiment, the cumulative SOC and glucose-C mineralization was 116.2–134.1 and 75.4–97.5 mg CO2-C g−1 SOC, respectively, across all treatments. Ultimately, CT increased cumulative SOC by 5.6–18.3% and decreased glucose-C mineralization by 10.8–22.6%, compared to ST and NT. Of the two conservation tillage practices, ST exhibited higher cumulative SOC mineralization (13.4%) and lower glucose-C mineralization (13.2%) than NT during the incubation period.
Adding 13C-glucose to all treatments significantly enhanced SOC mineralization, resulting in positive priming effects (Figure 2). After 31 days of cultivation, the priming effect intensity reached 9.15–13.13 mg CO2-C g−1 SOC across all treatments. The priming effect intensity followed the sequence CT > ST > NT during the cultivation period. Compared to NT and ST, the cumulative priming effect of CT increased significantly by 23.9% and 30.1%, respectively. Additionally, although ST exhibited a slightly higher priming effect than NT, there was no significant difference between the two tillage practices after 31 days.

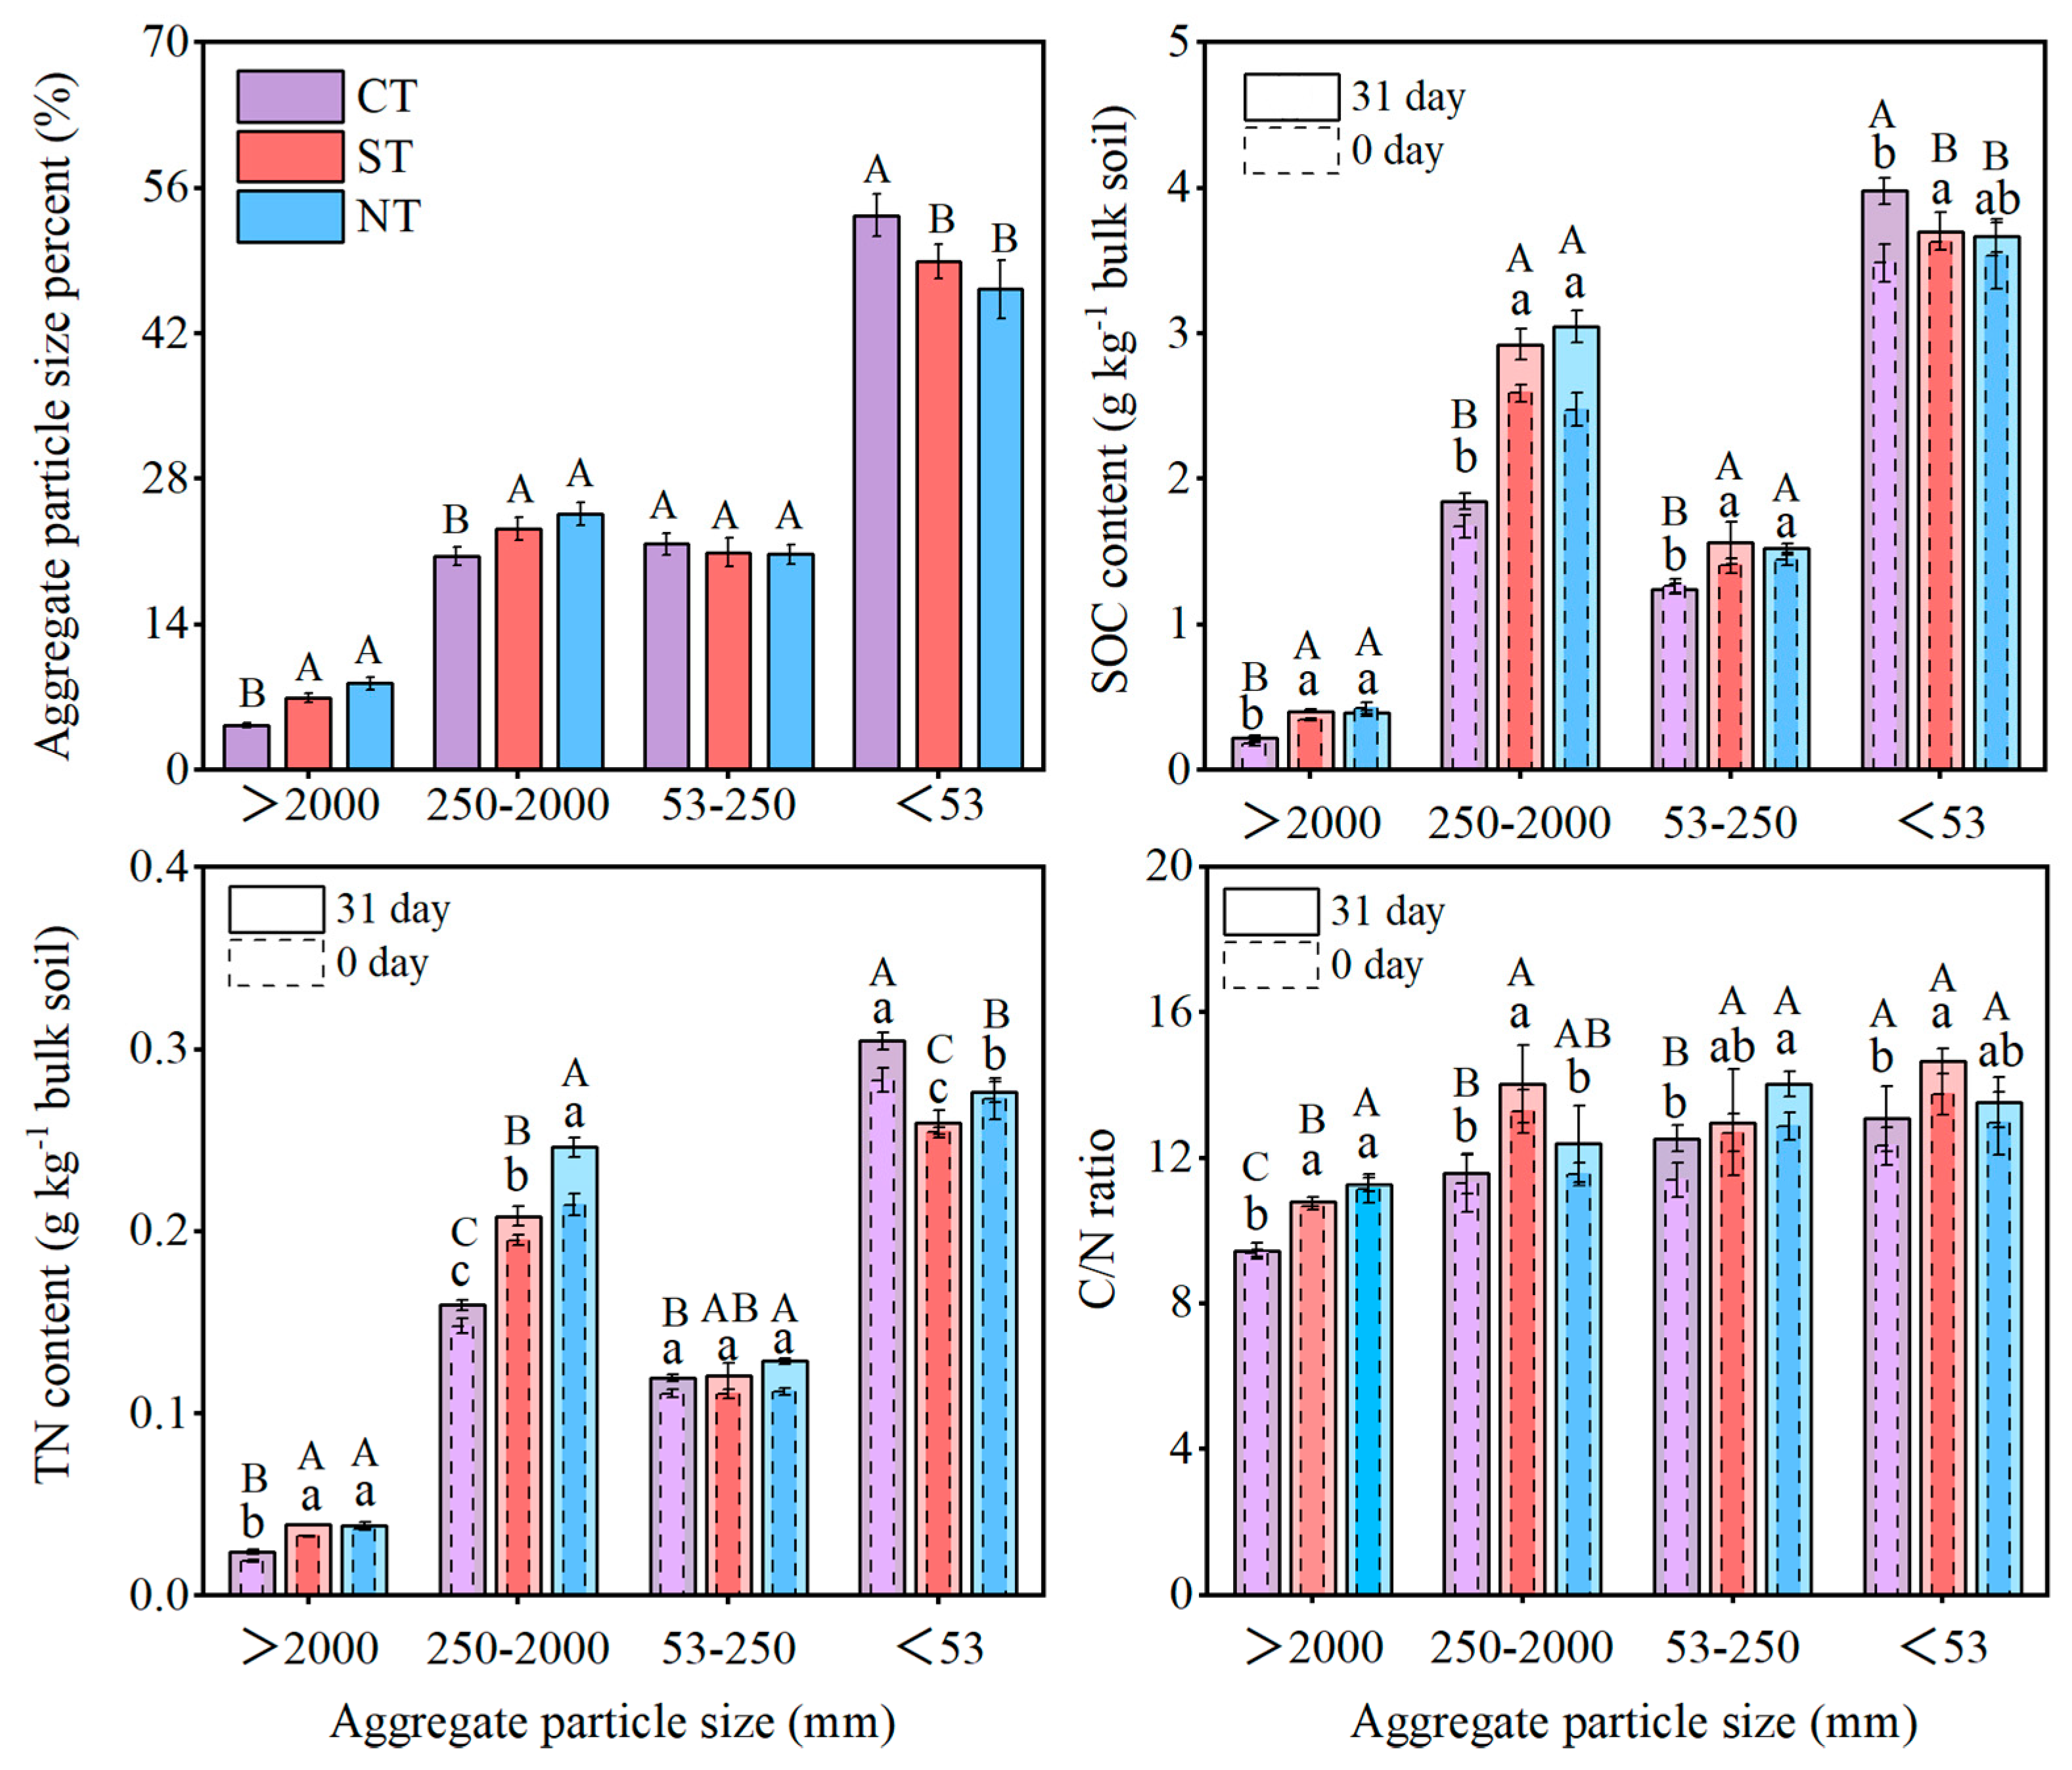
3.2. Aggregate Distribution and the Associated Carbon and Nitrogen Content

Evidently, conservation tillage promoted soil aggregation, aggregate-associated carbon, and nitrogen content compared to conventional tillage (Figure 3, p < 0.05). NT and ST both significantly increased the percentage of macroaggregates (250–2000 µm and >2000 µm) by 11.4–48.1%, while decreasing the percentage of the silt and clay (53 µm) fractions by 9.1–15.4%, respectively. This resulted in a significantly higher MWD value under ST and NT than under CT (Table 1).
In bulk soils (Table 1), both ST and TN significantly increased the contents of SOC, TN, MBC and MBN, as well as the MBC/MBN ratio, at the beginning (day 0) and end of the 31-day experiment. Additionally, we calculated the contribution of different aggregate fractions to the SOC and TN in the bulk soil (Figure 3). Compared to CT, the SOC and TN contents of the 250–2000 µm and >2000 µm size aggregates were significantly higher under ST and NT at the beginning and end of the 31-day experiment. Both NT and ST enhanced the 250–2000 µm aggregate-associated SOC content. However, NT and ST significantly reduced the <53 µm aggregate-associated SOC and TN contents by 7.8–17.3% compared to CT after 31 days. Examining the C/N ratio revealed that the values under CT were significantly lower than those under ST and NT within the >2000 µm aggregate fractions and lower than those under ST within the 250–2000 µm aggregate fractions on both days 0 and 31. Overall, by the end of the 31-day experiment, both NT and ST had significantly increased the organic carbon and nitrogen contents associated with aggregates >250 µm, as well as the C/N ratio within aggregates >53 µm, compared to CT.

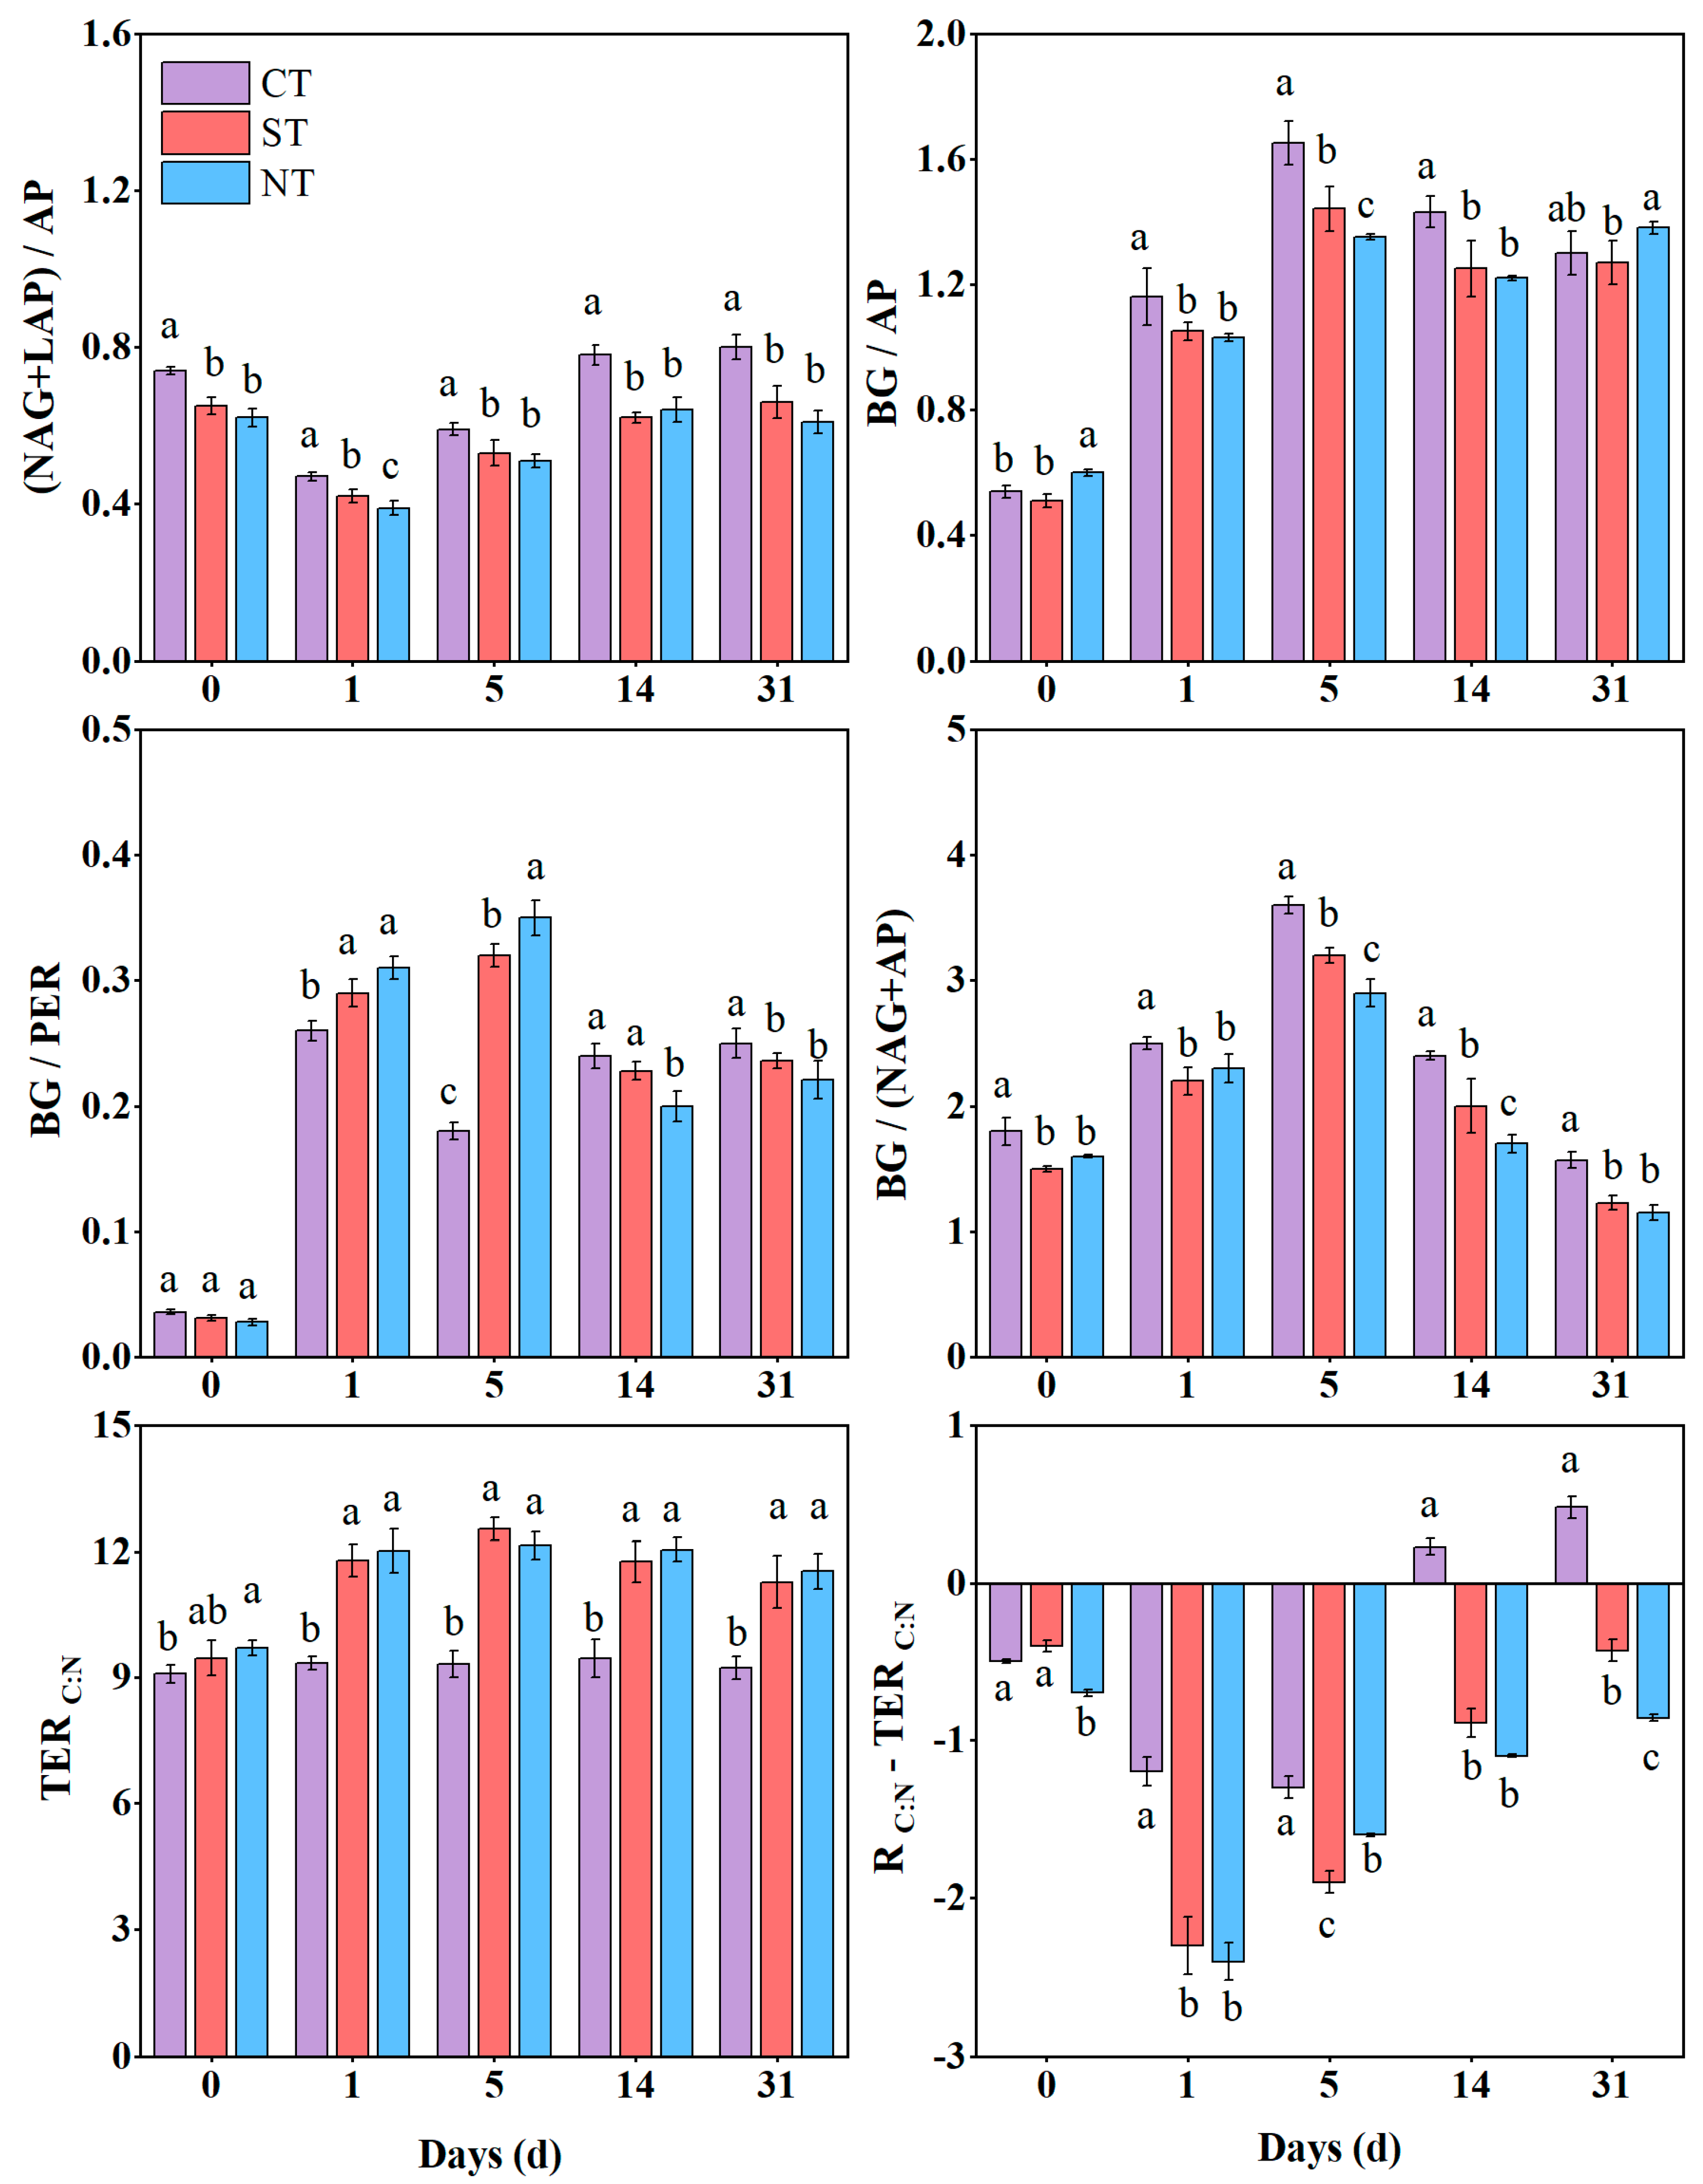
3.3. Soil Enzyme Stoichiometry

Tillage practices were found to have a significant influence on the stoichiometric ratios of enzymes related to the transformation of carbon, nitrogen and phosphorus in soil (Figure 4). After glucose was added to the soil, the study found that the stoichiometric ratio of enzymes related to carbon, nitrogen, and phosphorus transformations was BG: (NAG + LAP): AP = 1:0.9:1.2. Throughout the cultivation period, CT generally increased the (NAG + LAP)/AP ratio compared to NT and ST. Furthermore, during days 1–14 of cultivation, the BG/AP ratio was significantly lower in NT and ST than in CT. Regarding the BG/PER ratio, NT and ST significantly increased it by 8.7–13.6% during the early stage of cultivation (<5 days) in comparison with CT; however, it decreased during days 14–31. During the incubation period, compared to CT, conservation tillage significantly reduced the BG: (NAG + AP) ratio, indicating a reduction in the carbon to nitrogen ratio of soil extracellular enzymes. Overall, conservation tillage significantly increased the TERC:N compared to CT throughout the cultivation period. Additionally, CT always had the highest RC:N − TERC:N value compared to the other two conservation tillage treatments, meaning that CT is more nitrogen-limited for microorganisms.

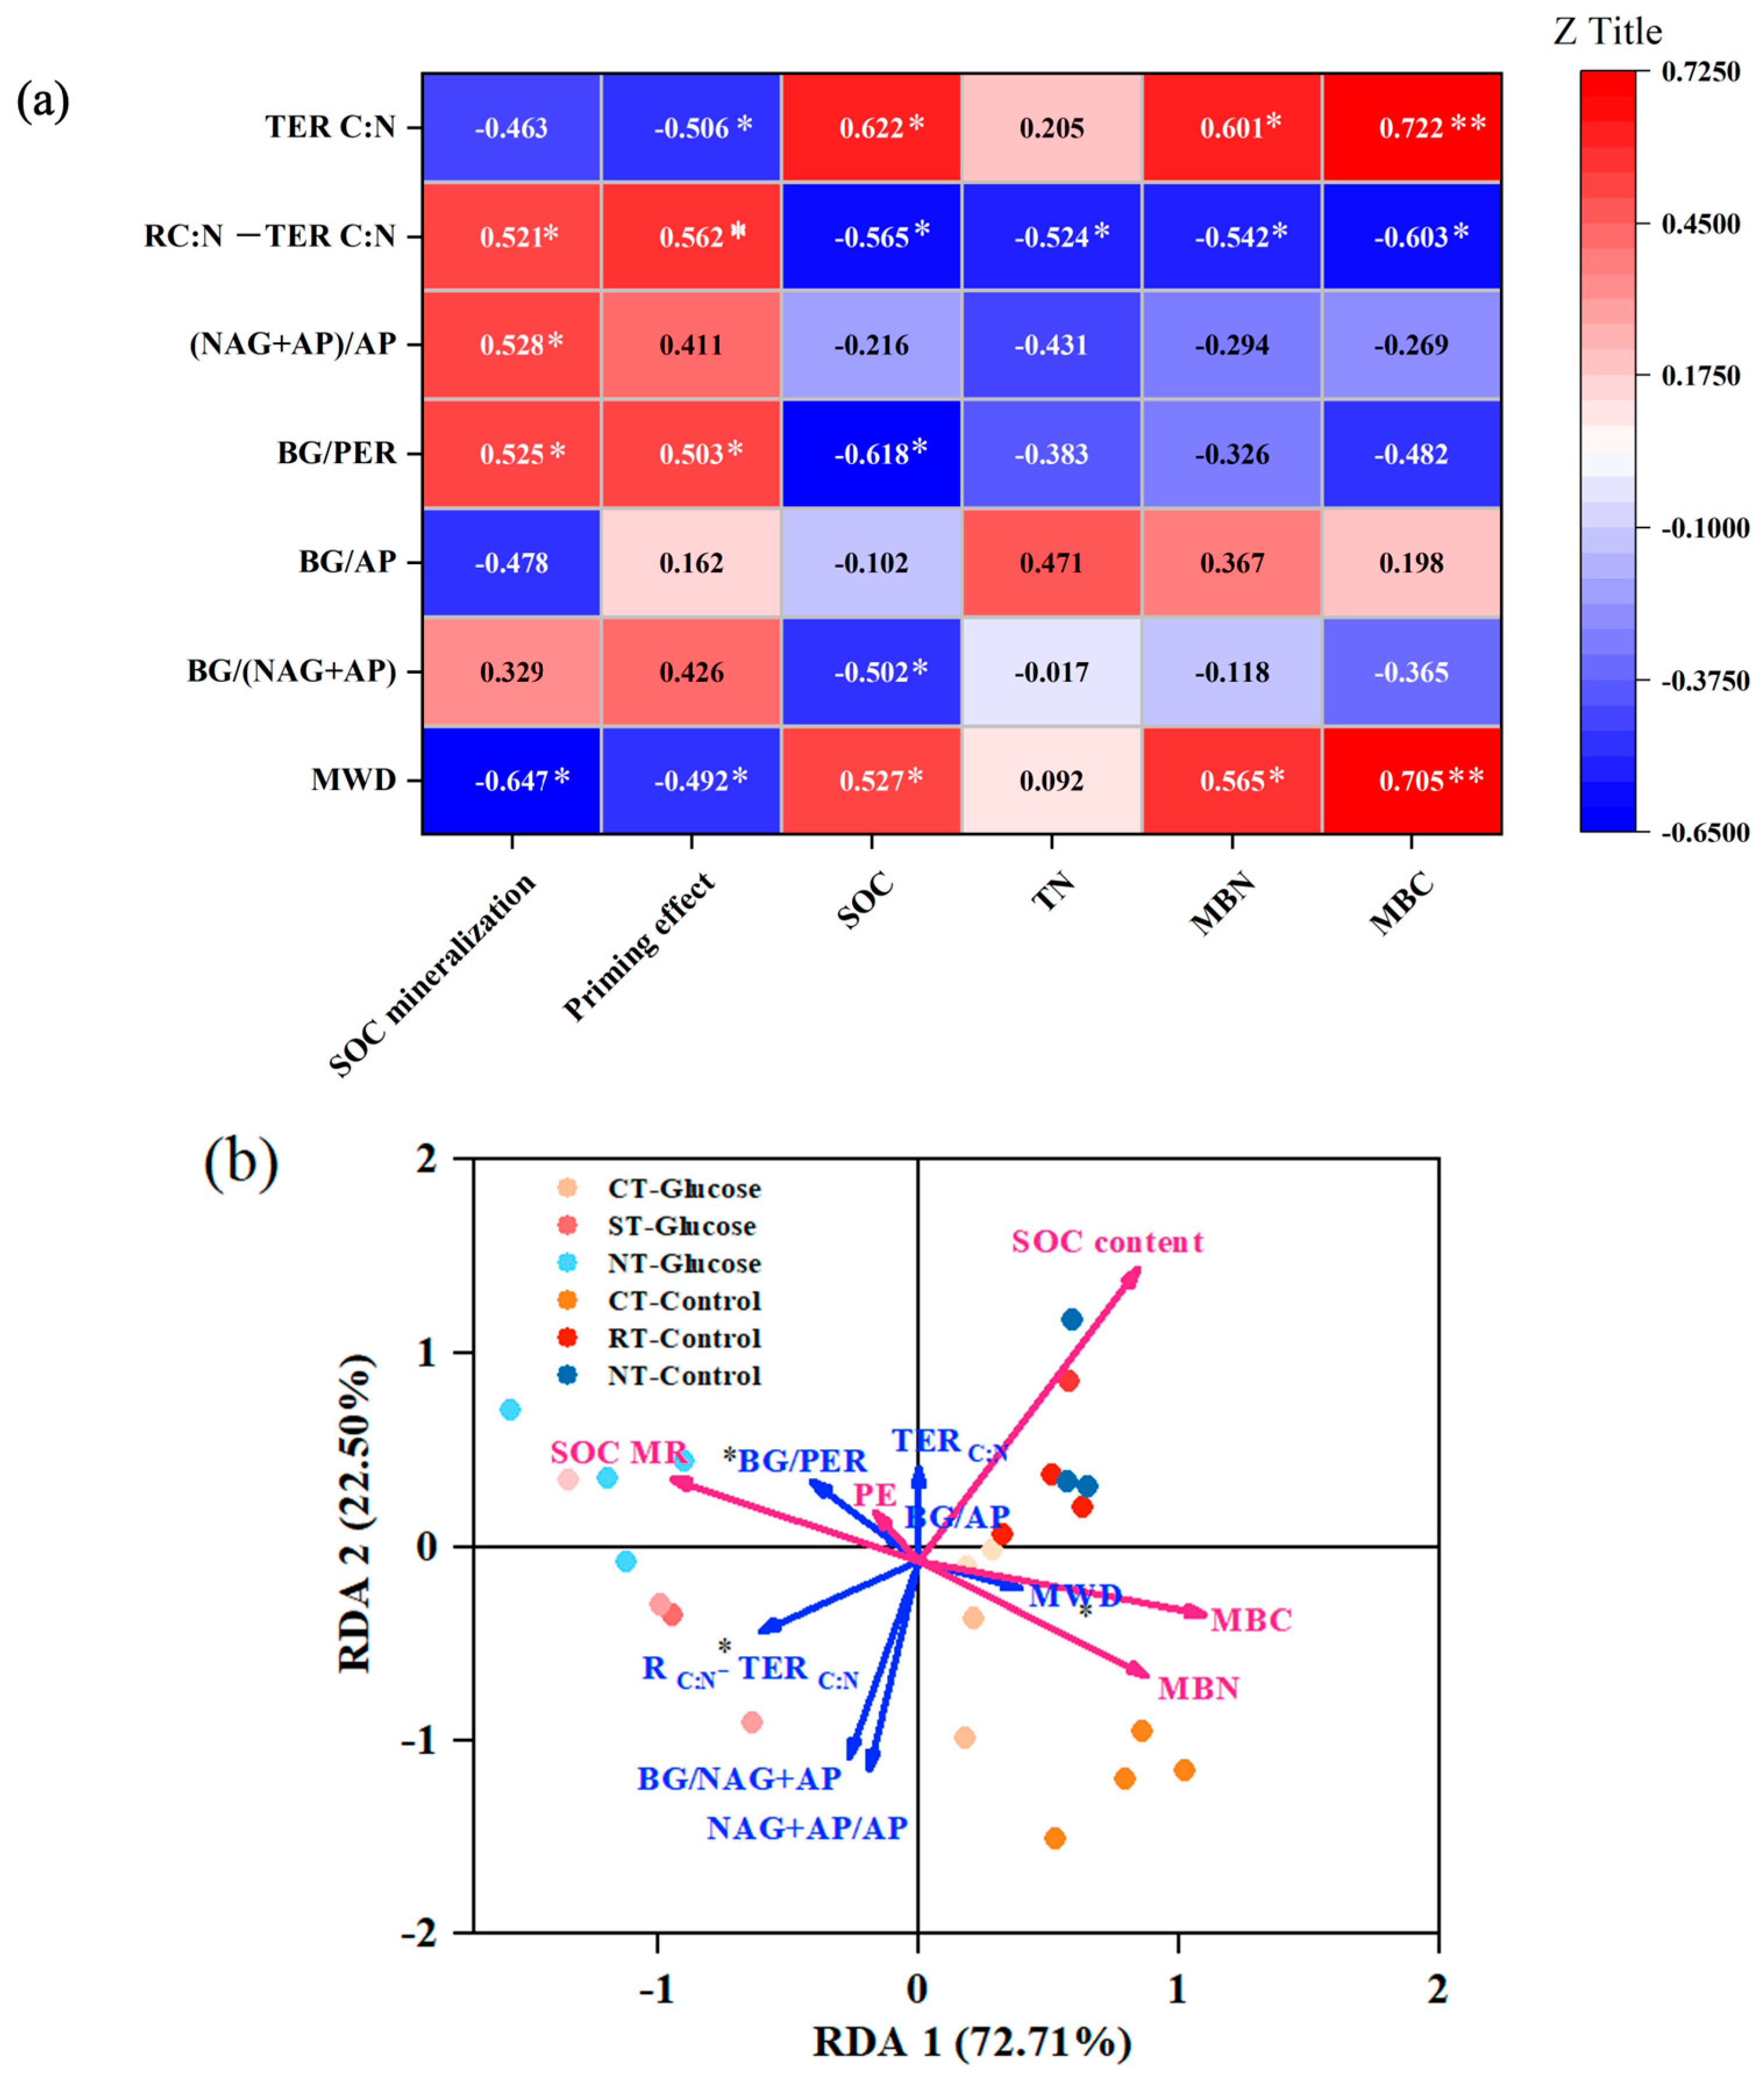
3.4. Key Factors Affecting SOC Sequestration and Decomposition

Correlation analysis revealed that cumulative SOC mineralization and priming effects were negatively correlated with MWD value and TERC:N, but significantly positively correlated with BG/PER and RC:N − TERC:N value (Figure 5a, p < 0.05). However, the total SOC, TN, MBN and MBC contents showed the opposite pattern compared to the above indicators. Furthermore, the SOC were significantly positively correlated with TERC:N and MWD value, and negatively correlated with BG/PER, BG/(NAG + AP) and RC:N − TERC:N. On the other hand, the MBN and MBC showed significant negative correlations with RC:N − TERC:N, and significant positive correlations with MWD value and TERC:N.
The redundancy analysis showed that the explanation rate of different stoichiometric ratio of extracellular enzymes explains 72.21% of the variation in SOC content and in SOC priming effect (Figure 5b). MWD and TERC:N positively contribute to the SOC, MBC and MBN content. In contrast, the RC:N − TERC:N and BG/PER mainly showed a positive relationship with SOC mineralization and a priming effect but a negative relationship with SOC content; these two indicators significantly contribute to the SOC priming effect. BG/(NAG + AP) and (NAG + AP)/AP showed a positive relationship with SOC mineralization but a negative relationship with SOC content, which indirectly contributed to the priming effect.

4. Discussion

4.1. Effects of Conservation Tillage on SOC Mineralization and Priming Response

The glucose-C mineralization rate increased rapidly on the first day of incubation, after which it declined, and the cumulative mineralization rate levelled off from day 11 onwards. This pattern may be attributed to several factors. In the early stage of incubation, glucose-C was a newly added and highly labile nutrient source that was readily available for microbial uptake and utilization. However, as incubation progressed, the microbes entered a co-metabolism phase, acquiring nutrients from both glucose-C and the decomposition of native soil organic matter [33]. Additionally, the physical protection provided by large aggregates may have limited direct contact between glucose and microorganisms [34]. Previous studies have suggested that microbial residues within macroaggregates are stabilized through cation bridging with soil mineral particles, thereby restricting microbial access to soil organic nutrients [35].
In this study, adding glucose to CT soils resulted in higher SOC mineralization rates than the NT and ST treatments (Figure 1). This could be partly due to the mechanical disruption of large aggregates under the intensive tillage regime of CT, which enhanced microbial respiration. Furthermore, the lower levels of dissolved carbon and nitrogen under CT may have caused an imbalance in the soil C:N ratio, intensifying microbial nitrogen limitation. This is supported by the lower C:N ratio (Table 1) and TERC:N (Figure 4) observed under CT. Consequently, microbes were more dependent on glucose as a nutrient source to support their growth. Additionally, lower pH levels are known to suppress microbial activity, potentially reducing glucose mineralization in NT and ST soils. Conservation tillage practices such as no till and straw mulching generally promote root growth and the release of organic acids, leading to a decrease in soil pH [36]. Therefore, compared to conventional tillage, conservation tillage reduces glucose mineralization.

4.2. The Regulation Mechanism of Priming Effect Under Conservation Tillage

We observed a significant positive priming effect following the addition of glucose, which was primarily attributed to the stimulation of microbial activity and the subsequent co-metabolism of native SOC (Figure 5). However, the mechanisms underlying this priming effect varied across the different stages of the incubation period. In the initial phase, within one hour of glucose application, the priming effect was predominantly driven by ‘microbial nitrogen mining’ [28,37]. During this process, microbes used the readily available glucose as an energy source to access nitrogen from the background organic matter, thereby accelerating SOC mineralization [14,38]. This interpretation is supported by the lower BG/(NAG + LAP) and BG/PER ratios observed in glucose-amended treatments compared to the control (Figure 4). These ratios reflect a shift in microbial investment towards oxidases and nitrogen-acquiring enzymes [39]. This enzymatic adjustment indicates that microbes were actively degrading more complex organic matter to satisfy their nitrogen requirements [3].
In the later stage of incubation (days 1 to 31), the persistence of the positive priming effect appeared to be governed by microbial stoichiometric decomposition theory (Figure 2). According to the principles of microbial stoichiometric homeostasis, ratios of extracellular enzymes such as BG/(NAG + LAP) and BG/AP rise in carbon-limited conditions, reflecting an imbalance between microbial carbon demand and nutrient availability [31]. As the synthesis of extracellular enzymes involves additional energy and nutrient costs, lower carbon use efficiency is often observed in such conditions [40]. In this study, CT treatments exhibited higher (NAG + LAP)/AP ratios than NT and ST treatments (Figure 4), indicating that under CT conditions, microbes experienced greater nitrogen limitation and consequently relied more heavily on the decomposition of native organic nitrogen pools to fulfil their requirements. This is further evidenced by a significant positive correlation between the RC:N ratio and the magnitude of the priming effect in glucose-amended soils (Figure 5), implying that increased microbial nitrogen demand stimulates SOM mineralization [2,41]. These findings are consistent with previous studies reporting that stronger C–N imbalances can intensify microbial self-regulation, leading to a more pronounced priming effect [4,19]. Overall, our results imply that conservation tillage (NT and ST) alleviates microbial nutrient stress, reducing the need to mine nitrogen from soil organic matter and mitigating the priming effect compared to conventional tillage.

4.3. Physical, Chemical and Microbial Nutrient Limitation Regulated SOC Stability Under Conservation Tillage

We found that at the end of cultivation, 54.7% of glucose was released from the soil in the form of CO2, 8.3% formed MBC, 4% was converted to DOC, and the remaining 33% SOC stabilized in the soil. This is consistent with the findings from previous study [41,42]. We found that compared to CT, conservation tillage retained more glucose in the soil, which may be due to higher microbial carbon utilization efficiency, allowing microorganisms to assimilate more glucose and ultimately sequester it in the soil [37]. Furthermore, under the regulation of microbial stoichiometric balance, the higher DOC/TDN, DOC/AVP, and TDN/AVP ratios in soil background inhibited the conversion of glucose to carbon dioxide [10,43]. According to stoichiometric homeostasis, microbes modulate extracellular enzyme production in response to carbon and nutrient imbalances [43]. Under carbon-limited or nutrient-imbalanced conditions, the synthesis of enzymes like NAG, LAP, and AP incurs high metabolic costs, leading to lower carbon use efficiency [44]. In addition, lower soil pH also inhibits the conversion of glucose to CO2, ultimately retaining more glucose in different forms in the soil [44]. The percentage of glucose mineralization to CO2 represents the intensity of microbial co metabolism [28,37], which explains the trend of stimulation effects caused by tillage practices in two different types of soils. The significant positive correlation between glucose carbon use efficiency and background organic carbon use efficiency supports this microbial co metabolism. The significant negative correlation between the proportion of glucose forming MBC and its retention in soil and the priming effect suggests that higher retention of exogenous unstable carbon helps alleviate the priming effect, which can be used as an indicator of long-term carbon retention trends [16,35].
Despite the increased microbial biomass under NT and ST, mineralization remained suppressed, supporting the hypothesis that conservation tillage improves aggregate stability and reduces substrate availability [41,45]. Previous research shows that macroaggregates (>2 mm and 0.25–2 mm) offer physical protection by limiting oxygen diffusion and creating spatial barriers that slow microbial access to SOC [40]. Over time, these aggregates accumulate microbial residues that form stable organo-mineral complexes, further reducing substrate decomposition potential [14,38]. Our findings align with this, showing that NT significantly increased the proportion of large aggregates and improved mean weight diameter (MWD), in agreement with studies from both Northeast and North China [45]. The resulting structural improvements promote the physical stabilization of SOC and limit the extent to which microbial communities can stimulate decomposition, even in the presence of added glucose [24,46]. The differences in microbial communities caused by long-term conservation tillage play an important role in regulating soil carbon cycling [47]. The function of microorganisms can cause organic carbon to tend to stabilize in soil or be more easily mineralized in soil, leading to decomposition [48]. Therefore, one limitation of our study is the lack of connection and discussion between microbial communities and the microbial mechanisms of triggering effects. However, our study found a significant correlation between excitation effect and glucose retention percentage, indicating that our conclusion is applicable and can complement the results reported in previous studies.
In summary, the observed reductions in both SOC and glucose-C mineralization under NT and ST can be attributed to a dual mechanism: (i) improved physical protection through stable aggregate formation, and (ii) reduced microbial nutrient stress and stoichiometric imbalance. These processes act in concert to suppress priming responses and limit carbon loss. Overall, our findings underscore the critical role of conservation tillage in enhancing soil structural integrity, decoupling microbial activity from SOC mineralization, and promoting long-term carbon sequestration. Such practices offer tangible benefits for soil health, climate mitigation, and sustainable agricultural productivity.

5. Conclusions

Long-term tillage practices fundamentally influence soil organic carbon (SOC) dynamics by modulating physical aggregation, chemical protection, and microbial nutrient availability. This study highlights that conservation tillage enhances SOC stabilization not only through improved aggregate formation and physical shielding of organic matter but also by alleviating microbial nitrogen limitation, thereby reducing excessive SOC mineralization. The glucose-induced priming effect revealed distinct microbial regulatory mechanisms: an initial phase driven by microbial nitrogen mining and a subsequent phase governed by microbial stoichiometric decomposition. Conventional tillage (CT), characterized by disrupted soil structure and greater microbial nutrient stress, consistently triggered a stronger priming response compared to conservation tillage. These findings underscore the critical role of microbial nutrient constraints and soil physical structure in controlling SOC turnover. Advancing our understanding of these microbial-mediated processes offers promising pathways to optimize conservation tillage management, maximize carbon sequestration, and foster resilient soil ecosystems that support sustainable agricultural productivity.

Supplementary Materials

The following supporting information can be downloaded at: https://www.mdpi.com/article/10.3390/agronomy15071571/s1, Figure S1: Experimental process of the soil incubation and testing indicators.

Author Contributions

Conceptualization, Z.H. and X.W.; methodology, A.J.; software, Q.G.; validation, Z.H., Q.G. and A.J.; formal analysis, Z.H.; investigation, H.G.; resources, X.W.; data curation, Z.H.; writing—original draft preparation, Z.H.; writing—review and editing, Z.H.; visualization, H.G.; supervision, X.W.; project administration, X.W.; funding acquisition, X.W. All authors have read and agreed to the published version of the manuscript.

Funding

This research was funded by National Key Research and Development Program of China (Grant No. 2023YFD1500301).

Data Availability Statement

All data are contained within this article. This and other relevant data will be provided upon request.

Acknowledgments

The authors thank Huijun Wu and workers at the Luoyang Field Scientific Observation and Experiment Station for their help maintaining the experiments.

Conflicts of Interest

The authors declare that they have no known competing financial interests or personal relationships that could have appeared to influence the work reported in this paper.

Abbreviations

The following abbreviations are used in this manuscript:
SOCSoil organic carbon
TNTotal nitrogen
CTConventional tillage with straw removed
STSubsoil tillage with straw mulching
NTNo tillage with straw mulching
BGβ-glucosidase
NAGN-acetyl-β-D-glucosidase
APPhosphatase
PERPeroxidase
TERC:NCarbon–nitrogen imbalance of available resources
MBCMicrobial biomass carbon
MBNMicrobial biomass nitrogen
MWDMean weight diameter

References

  1. Agnihotri, R.; Sharma, M.P.; Prakash, A.; Ramesh, A.; Bhattacharjya, S.; Patra, A.K.; Manna, M.C.; Kurganova, I.; Kuzyakov, Y. Glycoproteins of Arbuscular Mycorrhiza for Soil Carbon Sequestration: Review of Mechanisms and Controls. Sci. Total Environ. 2022, 806, 150571. [Google Scholar] [CrossRef] [PubMed]
  2. Tian, J.; Zong, N.; Hartley, I.P.; He, N.; Zhang, J.; Powlson, D.; Zhou, J.; Kuzyakov, Y.; Zhang, F.; Yu, G.; et al. Microbial Metabolic Response to Winter Warming Stabilizes Soil Carbon. Glob. Change Biol. 2021, 27, 2011–2028. [Google Scholar] [CrossRef] [PubMed]
  3. Dimassi, B.; Mary, B.; Fontaine, S.; Perveen, N.; Revaillot, S.; Cohan, J.P. Effect of Nutrients Availability and Long-Term Tillage on Priming Effect and Soil C Mineralization. Soil Biol. Biochem. 2014, 78, 332–339. [Google Scholar] [CrossRef]
  4. Sauvadet, M.; Lashermes, G.; Alavoine, G.; Recous, S.; Chauvat, M.; Maron, P.-A.; Bertrand, I. High Carbon Use Efficiency and Low Priming Effect Promote Soil C Stabilization under Reduced Tillage. Soil Biol. Biochem. 2018, 123, 64–73. [Google Scholar] [CrossRef]
  5. Xu, P.; Zhu, J.; Wang, H.; Shi, L.; Zhuang, Y.; Fu, Q.; Chen, J.; Hu, H.; Huang, Q. Regulation of Soil Aggregate Size under Different Fertilizations on Dissolved Organic Matter, Cellobiose Hydrolyzing Microbial Community and Their Roles in Organic Matter Mineralization. Sci. Total Environ. 2021, 755, 142595. [Google Scholar] [CrossRef]
  6. Moreno, F.; Murillo, J.M.; Pelegrín, F.; Girón, I.F. Long-Term Impact of Conservation Tillage on Stratification Ratio of Soil Organic Carbon and Loss of Total and Active CaCO3. Soil Tillage Res. 2006, 85, 86–93. [Google Scholar] [CrossRef]
  7. Bell, J.M.; Smith, J.L.; Bailey, V.L.; Bolton, H. Priming Effect and C Storage in Semi-Arid No-till Spring Crop Rotations. Biol. Fertil. Soils 2003, 37, 237–244. [Google Scholar] [CrossRef]
  8. Nandan, R.; Singh, V.; Singh, S.S.; Kumar, V.; Hazra, K.K.; Nath, C.P.; Poonia, S.P.; Malik, R.K.; Bhattacharyya, R.; McDonald, A. Impact of Conservation Tillage in Rice–Based Cropping Systems on Soil Aggregation, Carbon Pools and Nutrients. Geoderma 2019, 340, 104–114. [Google Scholar] [CrossRef]
  9. Plaza, C.; Courtier-Murias, D.; Fernández, J.M.; Polo, A.; Simpson, A.J. Physical, Chemical, and Biochemical Mechanisms of Soil Organic Matter Stabilization under Conservation Tillage Systems: A Central Role for Microbes and Microbial by-Products in C Sequestration. Soil Biol. Biochem. 2013, 57, 124–134. [Google Scholar] [CrossRef]
  10. Gao, L.; Becker, E.; Liang, G.; Houssou, A.A.; Wu, H.; Wu, X.; Cai, D.; Degré, A. Effect of Different Tillage Systems on Aggregate Structure and Inner Distribution of Organic Carbon. Geoderma 2017, 288, 97–104. [Google Scholar] [CrossRef]
  11. Kan, Z.R.; Ma, S.T.; Liu, Q.Y.; Liu, B.Y.; Virk, A.L.; Qi, J.Y.; Zhao, X.; Lal, R.; Zhang, H.L. Carbon Sequestration and Mineralization in Soil Aggregates under Long-Term Conservation Tillage in the North China Plain. CATENA 2020, 188, 104428. [Google Scholar] [CrossRef]
  12. Schlüter, S.; Leuther, F.; Albrecht, L.; Hoeschen, C.; Kilian, R.; Surey, R.; Mikutta, R.; Kaiser, K.; Mueller, C.W.; Vogel, H.J. Microscale Carbon Distribution around Pores and Particulate Organic Matter Varies with Soil Moisture Regime. Nat. Commun. 2022, 13, 2098. [Google Scholar] [CrossRef]
  13. Mangalassery, S.; Mooney, S.J.; Sparkes, D.L.; Fraser, W.T.; Sjögersten, S. Impacts of Zero Tillage on Soil Enzyme Activities, Microbial Characteristics and Organic Matter Functional Chemistry in Temperate Soils. Eur. J. Soil Biol. 2015, 68, 9–17. [Google Scholar] [CrossRef]
  14. Pandey, D.; Agrawal, M.; Bohra, J.S. Effects of Conventional Tillage and No Tillage Permutations on Extracellular Soil Enzyme Activities and Microbial Biomass under Rice Cultivation. Soil Tillage Res. 2014, 136, 51–60. [Google Scholar] [CrossRef]
  15. Zheng, F.; Wu, X.; Zhang, M.; Liu, X.; Song, X.; Lu, J.; Wang, B.; Jan van Groenigen, K.; Li, S. Linking Soil Microbial Community Traits and Organic Carbon Accumulation Rate under Long-Term Conservation Tillage Practices. Soil Tillage Res. 2022, 220, 105360. [Google Scholar] [CrossRef]
  16. Li, Q.; Chen, J.; Feng, J.; Wu, J.; Zhang, Q.; Jia, W.; Lin, Q.; Cheng, X. How Do Biotic and Abiotic Factors Regulate Soil Enzyme Activities at Plot and Microplot Scales Under Afforestation? Ecosystems 2020, 23, 1408–1422. [Google Scholar] [CrossRef]
  17. Wang, C.; Lu, X.; Mori, T.; Mao, Q.; Zhou, K.; Zhou, G.; Nie, Y.; Mo, J. Responses of Soil Microbial Community to Continuous Experimental Nitrogen Additions for 13 Years in a Nitrogen-Rich Tropical Forest. Soil Biol. Biochem. 2018, 121, 103–112. [Google Scholar] [CrossRef]
  18. Engell, I.; Linsler, D.; Sandor, M.; Joergensen, R.G.; Meinen, C.; Potthoff, M. The Effects of Conservation Tillage on Chemical and Microbial Soil Parameters at Four Sites across Europe. Plants 2022, 11, 1747. [Google Scholar] [CrossRef]
  19. Liang, Z.; Rasmussen, J.; Poeplau, C.; Elsgaard, L. Priming Effects Decrease with the Quantity of Cover Crop Residues—Potential Implications for Soil Carbon Sequestration. Soil Biol. Biochem. 2023, 184, 109110. [Google Scholar] [CrossRef]
  20. Olsson, P.A.; Bååth, E.; Jakobsen, I.; Söderström, B. The Use of Phospholipid and Neutral Lipid Fatty Acids to Estimate Biomass of Arbuscular Mycorrhizal Fungi in Soil. Mycol. Res. 1995, 99, 623–629. [Google Scholar] [CrossRef]
  21. Song, X.; Liu, X.; Liang, G.; Li, S.; Li, J.; Zhang, M.; Zheng, F.; Ding, W.; Wu, X.; Wu, H. Positive Priming Effect Explained by Microbial Nitrogen Mining and Stoichiometric Decomposition at Different Stages. Soil Biol. Biochem. 2022, 175, 108852. [Google Scholar] [CrossRef]
  22. Bayer, C.; Mielniczuk, J.; Giasson, E.; Martin-Neto, L.; Pavinato, A. Tillage Effects on Particulate and Mineral-Associated Organic Matter in Two Tropical Brazilian Soils. Commun. Soil Sci. Plant Anal. 2006, 37, 389–400. [Google Scholar] [CrossRef]
  23. Liu, X.; Li, Q.; Tan, S.; Wu, X.; Song, X.; Gao, H.; Han, Z.; Jia, A.; Liang, G.; Li, S. Evaluation of Carbon Mineralization and Its Temperature Sensitivity in Different Soil Aggregates and Moisture Regimes: A 21-Year Tillage Experiment. Sci. Total Environ. 2022, 837, 155566. [Google Scholar] [CrossRef]
  24. Chen, C.; Meile, C.; Wilmoth, J.; Barcellos, D.; Thompson, A. Influence of pO2 on Iron Redox Cycling and Anaerobic Organic Carbon Mineralization in a Humid Tropical Forest Soil. Environ. Sci. Technol. 2018, 52, 7709–7719. [Google Scholar] [CrossRef]
  25. Feng, S.; Huang, Y.; Ge, Y.; Su, Y.; Xu, X.; Wang, Y.; He, X. Variations in the Patterns of Soil Organic Carbon Mineralization and Microbial Communities in Response to Exogenous Application of Rice Straw and Calcium Carbonate. Sci. Total Environ. 2016, 571, 615–623. [Google Scholar] [CrossRef]
  26. Nyamadzawo, G.; Nyamangara, J.; Nyamugafata, P.; Muzulu, A. Soil Microbial Biomass and Mineralization of Aggregate Protected Carbon in Fallow-Maize Systems under Conventional and No-Tillage in Central Zimbabwe. Soil Tillage Res. 2009, 102, 151–157. [Google Scholar] [CrossRef]
  27. Zheng, F.; Liu, X.; Zhang, M.; Li, S.; Song, X.; Wang, B.; Wu, X.; Van Groenigen, K.J. Strong Links between Aggregate Stability, Soil Carbon Stocks and Microbial Community Composition across Management Practices in a Chinese Dryland Cropping System. CATENA 2023, 233, 107509. [Google Scholar] [CrossRef]
  28. Margenot, A.J.; Nakayama, Y.; Parikh, S.J. Methodological Recommendations for Optimizing Assays of Enzyme Activities in Soil Samples. Soil Biol. Biochem. 2018, 125, 350–360. [Google Scholar] [CrossRef]
  29. Deng, S.; Popova, I.E.; Dick, L.; Dick, R. Bench Scale and Microplate Format Assay of Soil Enzyme Activities Using Spectroscopic and Fluorometric Approaches. Appl. Soil Ecol. 2013, 64, 84–90. [Google Scholar] [CrossRef]
  30. DeForest, J.L. The Influence of Time, Storage Temperature, and Substrate Age on Potential Soil Enzyme Activity in Acidic Forest Soils Using MUB-Linked Substrates and l-DOPA. Soil Biol. Biochem. 2009, 41, 1180–1186. [Google Scholar] [CrossRef]
  31. Sinsabaugh, R.L.; Lauber, C.L.; Weintraub, M.N.; Ahmed, B.; Allison, S.D.; Crenshaw, C.; Contosta, A.R.; Cusack, D.; Frey, S.; Gallo, M.E.; et al. Stoichiometry of Soil Enzyme Activity at Global Scale. Ecol. Lett. 2008, 11, 1252–1264. [Google Scholar] [CrossRef]
  32. Nannipieri, P.; Smalla, K. Soil biology. In Nucleic Acids and Proteins in Soil: With 42 Figures, 2 in Color; Springer: Berlin/Heidelberg, Germany, 2006; ISBN 978-3-540-29448-1. [Google Scholar]
  33. Zimmerman, A.R.; Gao, B.; Ahn, M.-Y. Positive and Negative Carbon Mineralization Priming Effects among a Variety of Biochar-Amended Soils. Soil Biol. Biochem. 2011, 43, 1169–1179. [Google Scholar] [CrossRef]
  34. Andruschkewitsch, R.; Geisseler, D.; Koch, H.-J.; Ludwig, B. Effects of Tillage on Contents of Organic Carbon, Nitrogen, Water-Stable Aggregates and Light Fraction for Four Different Long-Term Trials. Geoderma 2013, 192, 368–377. [Google Scholar] [CrossRef]
  35. Mo, F.; Zhang, Y.-Y.; Liu, Y.; Liao, Y.-C. Microbial Carbon-Use Efficiency and Straw-Induced Priming Effect within Soil Aggregates Are Regulated by Tillage History and Balanced Nutrient Supply. Biol. Fertil. Soils 2021, 57, 409–420. [Google Scholar] [CrossRef]
  36. Kan, Z.R.; Liu, W.X.; Liu, W.S.; Lal, R.; Dang, Y.P.; Zhao, X.; Zhang, H.L. Mechanisms of Soil Organic Carbon Stability and Its Response to No-till: A Global Synthesis and Perspective. Glob. Change Biol. 2022, 28, 693–710. [Google Scholar] [CrossRef]
  37. Song, X.; Li, J.; Liu, X.; Liang, G.; Li, S.; Zhang, M.; Zheng, F.; Wang, B.; Wu, X.; Wu, H. Altered Microbial Resource Limitation Regulates Soil Organic Carbon Sequestration Based on Ecoenzyme Stoichiometry under Long-Term Tillage Systems. Land Degrad. Dev. 2022, 33, 2795–2808. [Google Scholar] [CrossRef]
  38. Zhang, B.; Li, Y.; Ren, T.; Tian, Z.; Wang, G.; He, X.; Tian, C. Short-Term Effect of Tillage and Crop Rotation on Microbial Community Structure and Enzyme Activities of a Clay Loam Soil. Biol. Fertil. Soils 2014, 50, 1077–1085. [Google Scholar] [CrossRef]
  39. Han, S.; Delgado-Baquerizo, M.; Luo, X.; Liu, Y.; Van Nostrand, J.D.; Chen, W.; Zhou, J.; Huang, Q. Soil Aggregate Size-Dependent Relationships between Microbial Functional Diversity and Multifunctionality. Soil Biol. Biochem. 2021, 154, 108143. [Google Scholar] [CrossRef]
  40. Cai, Y.; Ma, T.; Wang, Y.; Jia, J.; Jia, Y.; Liang, C.; Feng, X. Assessing the Accumulation Efficiency of Various Microbial Carbon Components in Soils of Different Minerals. Geoderma 2022, 407, 115562. [Google Scholar] [CrossRef]
  41. Raiesi, F.; Kabiri, V. Carbon and Nitrogen Mineralization Kinetics as Affected by Tillage Systems in a Calcareous Loam Soil. Ecol. Eng. 2017, 106, 24–34. [Google Scholar] [CrossRef]
  42. Pramanick, B.; Kumar, M.; Naik, B.M.; Singh, S.K.; Kumar, M.; Singh, S.V. Soil Carbon-Nutrient Cycling, Energetics, and Carbon Footprint in Calcareous Soils with Adoption of Long-Term Conservation Tillage Practices and Cropping Systems Diversification. Sci. Total Environ. 2024, 912, 169421. [Google Scholar] [CrossRef] [PubMed]
  43. Li, Z.; Duan, X.; Guo, X.; Gao, W.; Li, Y.; Zhou, P.; Zhu, Q.; O’Donnell, A.G.; Dai, K.; Wu, J. Microbial Metabolic Capacity Regulates the Accrual of Mineral-Associated Organic Carbon in Subtropical Paddy Soils. Soil Biol. Biochem. 2024, 195, 109457. [Google Scholar] [CrossRef]
  44. Han, Z.; Wu, X.; Liang, A.; Li, S.; Gao, H.; Song, X.; Liu, X.; Gao, H.; Degré, A. Conservation tillage enhances the sequestration and iron-mediated stabilization of aggregate-associated organic carbon in mollisols. Catena 2024, 243, 108197. [Google Scholar] [CrossRef]
  45. Zhang, Y.; Gao, Y.; Zhang, Y.; Huang, D.; Li, X.; Gregorich, E.; McLaughlin, N.; Zhang, X.; Chen, X.; Zhang, S.; et al. Effect of Long-Term Tillage and Cropping System on Portion of Fungal and Bacterial Necromass Carbon in Soil Organic Carbon. Soil Tillage Res. 2022, 218, 105307. [Google Scholar] [CrossRef]
  46. Chellappa, J.; Sagar, K.L.; Sekaran, U.; Kumar, S.; Sharma, P. Soil Organic Carbon, Aggregate Stability and Biochemical Activity under Tilled and No-Tilled Agroecosystems. J. Agric. Food Res. 2021, 4, 100139. [Google Scholar] [CrossRef]
  47. Jilling, A.; Keiluweit, M.; Gutknecht, J.L.M.; Grandy, A.S. Priming mechanisms providing plants and microbes access to mineral-associated organic matter. Soil Biol. Biochem. 2021, 158, 108265. [Google Scholar] [CrossRef]
  48. Qiu, H.; Ge, T.; Liu, J.; Chen, X.; Hu, Y.; Su, Y.; Wu, J.; Kuzyakov, Y. Effects of biotic and abiotic factors on soil organic matter mineralization: Experiments and structural modeling analysis. Eur. J. Soil Biol. 2018, 84, 27–34. [Google Scholar] [CrossRef]
Figure 1. Location of the study site and long-term tillage experimentation.
Agronomy 15 01571 g001
Figure 2. The total soil organic carbon (SOC) mineralization rate, glucose-C mineralization rate, cumulative SOC mineralization, cumulative glucose-derived C mineralization, priming effect rate and cumulative priming effect were measured in different long-term tillage systems over the incubation period. CT: conventional tillage with straw removed; ST: subsoil tillage with straw mulching; NT: no till with straw mulching. Coloured asterisks indicate statistically significant differences between different tillage practices (“*”, “**” and “***” represent “p < 0.05”, “p < 0.01” and “p < 0.001”, respectively) ns: not significant.
Agronomy 15 01571 g002
Figure 3. The aggregate particle size distribution, aggregate-associated organic carbon and nitrogen contents in bulk soils, and the C/N ratio at 0 day and 31 days in different long-term tillage systems over the incubation period. CT: conventional tillage with straw removed; ST: subsoil tillage with straw mulching; NT: no tillage with straw mulching. TN: total nitrogen content. Capital letters (31 day) and lowercase letters (0 day) are used to indicate statistically significant differences (p < 0.05) in carbon and nitrogen content between different tillage practices at the same aggregate particle size.
Agronomy 15 01571 g003
Figure 4. The stoichiometric ratio of extracellular enzymes over the incubation period. CT: conventional tillage with straw removed; ST: subsoil tillage with straw mulching; NT: no tillage with straw mulching. BG: β-glucosidase; NAG: N-acetyl-β-D-glucosidase; LAP: leucine aminopeptidase; AP: phosphatase; PER: Peroxidase; C: organic carbon; N: total nitrogen; TERC:N: carbon–nitrogen imbalance of available resources. The lowercase letters are used to indicate statistically significant differences (p < 0.05) between different tillage practices during the soil incubation period.
Agronomy 15 01571 g004
Figure 5. Correlation analysis (a) between aggregate stability, soil enzyme stoichiometric parameters and carbon stabilization and decomposition under different tillage practices. The redundancy analysis (b) for the relative contribution of different stoichiometric ratio of extracellular enzymes to SOC sequestration and priming effect properties. BG: β-glucosidase; NAG: N-acetyl-β-D-glucosidase; AP: phosphatase; PER: Peroxidase; C: organic carbon; N: total nitrogen; TERC:N: carbon–nitrogen imbalance of available resources; SOC: soil organic carbon; TN: total nitrogen; MBC/MBN: microbial biomass carbon and nitrogen; MWD: mean weight diameter; SOC MR: SOC mineralization; PE: priming effect. Asterisks indicate statistical significance: * p < 0.05, n = 6, ** p < 0.01.
Agronomy 15 01571 g005
Table 1. The mean weight diameter (MWD), soil organic carbon (SOC) and total nitrogen (TN) content, and the microbial biomass carbon (MBC) and nitrogen (MBN) content in bulk soils at 0 day and 31 days in different long-term tillage systems over the incubation period.
DateTillageMWDSOCTNSOC/TNMBCMBNMBC/MBN
0 dayCT0.431 c6.69 b0.78 b8.58 b172.5 b30.17 b5.72 b
ST0.548 b8.70 a0.96 a9.06 ab247.5 a33.26 a7.44 a
NT0.613 a8.92 a0.97 a9.19 a256.3 a35.85 a7.15 a
31 daysCT0.472 b8.24 b0.85 b9.74 b206.7 c24.52 c8.43 b
ST0.595 a11.12 a1.03 a10.85 a306.9 b30.31 b10.13 a
NT0.610 a11.67 a1.09 a10.67 a367.7 a36.36 a10.11 a
Notes: CT: conventional tillage with straw removed; ST: subsoil tillage with straw mulching; NT: no tillage with straw mulching. Lowercase letters are used to indicate statistically significant differences (p < 0.05) between different tillage practices on the same day.
Disclaimer/Publisher’s Note: The statements, opinions and data contained in all publications are solely those of the individual author(s) and contributor(s) and not of MDPI and/or the editor(s). MDPI and/or the editor(s) disclaim responsibility for any injury to people or property resulting from any ideas, methods, instructions or products referred to in the content.

