Article

‘Miyagawa’ New Bud Mutant Type: Enhances Resistance to Low-Temperature Stress

1
College of Horticulture, Hunan Agricultural University, Changsha 410128, China
2
Yuelushan Laboratory, Pomology Variety Innovation Center, Changsha 410128, China
3
Center for Integrated Pest Management, North Carolina State University, Raleigh, NC 27606, USA
*
Authors to whom correspondence should be addressed.
Agronomy 2025, 15(7), 1570; https://doi.org/10.3390/agronomy15071570
Submission received: 29 May 2025 / Revised: 26 June 2025 / Accepted: 26 June 2025 / Published: 27 June 2025
(This article belongs to the Section Plant-Crop Biology and Biochemistry)

Abstract

Global climate change is leading to more frequent extreme cold events, underscoring the need to study citrus cold tolerance to support breeding and enable potential northward expansion of citrus cultivation. In this study, the ‘Miyagawa’ wild type and its cold-tolerant mutant were selected for systematic comparison across cold-resistant phenotypes, leaf tissue structure, physiological and biochemical characteristics, and Cor8 gene expression. The mutant exhibited 50% lower relative conductivity and malondialdehyde (MDA) content under −6 °C stress compared to the wild type, indicating reduced membrane damage. Antioxidant enzyme activities were significantly higher in the mutant: superoxide dismutase (SOD) activity increased by 10–30%, peroxidase (POD) by 28%, and catalase (CAT) by up to 2-fold. Proline content was 57% higher in the mutant at peak levels, supporting stronger osmotic regulation. Moreover, Cor8 gene expression in the mutant was up to 2.98 times higher than in the wild type during natural overwintering. These findings confirm that the ‘Miyagawa’ mutant possesses distinct physiological, anatomical, and molecular advantages for low-temperature adaptation and provides valuable germplasm for breeding cold-tolerant citrus varieties.

1. Introduction

Citrus is an important fruit crop widely cultivated worldwide. Despite its extensive cultivation, extreme weather events and periodic frost-induced low-temperature stress significantly impact citrus growth and development, limiting its regional distribution and safe production, and posing a serious threat to the citrus industry [1,2]. In the 1980s, Florida suffered from a severe frost, which had a huge impact on 30% of the state’s citrus industry, causing some farms that had been operating for generations to go bankrupt. The cold wave in 1990 caused approximately USD 500 million in losses to the fresh citrus fruit industry in California, affecting about 450,000 hectares of citrus trees. The frost in 2010 caused EUR 142 million in losses to the citrus industry in Valencia [3]. In addition, the frost in Southern China in 2018 also brought huge economic losses to the citrus industry. To date, the issue of citrus frost damage worldwide remains unresolved.
Bud sport selection is an important way to breed new citrus varieties. Approximately 60% of the varieties worldwide are derived from bud sports [4]. Bud sport selection can improve individual traits without altering the desirable characteristics of the original variety, and it is currently considered a relatively fast and effective method for variety improvement [5,6]. According to previous studies of citrus, mandarin is the most cold-tolerant species, followed by sweet orange and grapefruit, while lemon and lime are the least cold-tolerant. Substantial research has indicated that satsuma mandarin (C. unshiu) is the most cold-hardy commercial cultivar [3]. Therefore, breeding cold-resistant varieties from existing relatively cold-tolerant cultivated varieties and systematically evaluating the cold tolerance level of new varieties have become effective strategies for addressing the global problem of citrus freeze damage.
Leaf anatomy is a critical indicator in assessing plant cold tolerance [7,8]. Studies have shown that cold-resistant varieties typically exhibit more stratified and tightly arranged palisade tissues [9]. The ratio of palisade to spongy tissue tends to remain relatively stable, and both this ratio and the compactness or looseness of the tissue structure form a multidimensional index system for evaluating cold hardiness [10,11]. Numerous studies have confirmed that the palisade-to-spongy-tissue ratio and tissue compactness are positively correlated with plant cold hardiness, while tissue looseness is negatively correlated with cold resistance [12,13].
From a physiological perspective, plants employ antioxidant defense mechanisms to mitigate oxidative stress and maintain redox homeostasis under adverse environmental conditions. Key antioxidant enzymes involved in this defense include superoxide dismutase (SOD), peroxidase (POD), and catalase (CAT) [14,15,16,17]. In parallel, the integrity of the cell membrane—an essential barrier against environmental stress—is critical for cold resistance in plants [18]. Under extreme cold conditions, membrane fluidity transitions from a liquid–crystalline state to a gel state, causing electrolyte imbalance, which ultimately leads to metabolic disorders and even cell death [19]. Consequently, researchers often use electrolyte leakage, measured via relative conductivity, as a reliable indicator of plant freezing tolerance. Conductivity is positively correlated with the extent of protoplasmic membrane damage [20,21]. Beyond physical membrane changes, low-temperature stress also induces biochemical disruptions at the molecular level. Specifically, cold stress stimulates the production of free radicals and enhances membrane lipid peroxidation. Malondialdehyde (MDA), a terminal product of lipid peroxidation, serves as a key indicator of cold stress severity—the higher the MDA level, the lower the cold tolerance [22]. Reactive oxygen species (ROS) play a dual role in plant stress adaptation, acting as both damaging agents and essential signaling molecules that interface with various regulatory pathways [23]. Among ROS, hydrogen peroxide (H2O2) is particularly central to the plant’s response to abiotic stress in crops such as soybean [24] and banana [25]. Previous studies [26] have shown that cold stress significantly elevates MDA levels and increases the concentrations of ROS such as superoxide anion (O2−.) and hydrogen peroxide (H2O2), intensifying membrane damage, increasing permeability, and resulting in substantial electrolyte efflux—a hallmark of cold injury. In response to extreme cold, plant cells have evolved sophisticated and coordinated defense strategies. Osmoregulation plays a pivotal role in this process, enhancing cold adaptation by promoting the accumulation of soluble proteins, sugars, and proline (Pro). These compounds increase cytosolic osmotic potential and lower the freezing point, thereby inhibiting the formation of lethal intracellular ice crystals [27]. This multifaceted, multi-pathway defense strategy reflects the complexity and efficiency of anti-stress mechanisms developed through long-term plant evolution.
Studies at the molecular level have provided valuable insights into the mechanisms of cold hardiness in plants. As a cumulative quantitative trait, cold hardiness involves two categories of key genes: regulatory and protective. Regulatory genes, such as CBF (CRT/DRE-Binding Factor), play roles in signaling and transcriptional regulation, whereas protective genes, such as COR (cold-regulated genes), are directly involved in the plant’s defense against cold stress [28]. It has been demonstrated that the expression products of COR genes are essential for cold tolerance; for instance, in Arabidopsis, COR47 expression is upregulated by low temperatures and contributes to increased cold resistance [29]. In tomato, overexpression of SlCOR413IM1 enhances cold tolerance, whereas its suppression leads to increased sensitivity to cold [30]. Activation of COR genes promotes the synthesis of various protective substances, including antioxidant enzymes (e.g., superoxide dismutase and peroxidase) and osmoregulatory compounds (e.g., proline and soluble proteins). These components work synergistically to stabilize cell membranes and reduce oxidative damage, ultimately enhancing plant cold tolerance [31].
Between late 2018 and early 2019, extreme low-temperature events severely damaged ‘Miyagawa’ citrus trees, from which cold-tolerant bud mutations were recovered by the research team. Although prior studies have examined cold tolerance in citrus, few have provided a comprehensive, multi-level analysis integrating cold-resistant phenotypes, anatomical traits, physiological and biochemical responses, and Cor8 gene expression in a naturally occurring bud mutants. This study is the first to systematically characterize a cold-tolerant ‘Miyagawa’ mutant using this integrated approach, providing novel insights into the mechanisms underlying enhanced cold hardiness and offering valuable germplasm for breeding programs.

2. Materials and Methods

2.1. Plant Materials

From late 2018 to early 2019, Hunan Province experienced extreme low-temperature weather conditions. In the Xiuping and Jiashan areas of Shimen County, Changde City, the minimum temperatures dropped to −8.6 °C and −9.6 °C, respectively. Referring to Shen Zhaomin’s “Comprehensive Guide to Citrus Technology in China,” the survey area was assessed for frost damage, confirming that the citrus trees in the area suffered from level III frost damage [32]. Even the perennial large branches of mature trees suffered frost injury. On 1 April 2019, during an inspection of severely frost-damaged ‘Miyagawa’ orchards, certain surviving branches were identified that maintained vigorous growth without defoliation and showed no apparent signs of frost injury. In contrast, other branches on the same trees—and on other trees in the same orchard—exhibited severe frost damage. These surviving branches are considered potential cold-tolerant bud mutations (Figure A1). In the spring of 2019, both the mutant and wild-type branches of ‘Miyagawa’ were top-grafted onto 3-year-old potted Citrus sinensis ‘Dahong Cheng’ trees (Citrus trifoliata L. as rootstocks). In the spring of 2023, mutant and wild-type branches were collected from these grafted trees and subsequently grafted onto 1-year-old trifoliate orange container seedlings to expand the experimental population. All plants were cultivated outdoors and maintained according to standard procedures for fertilization, irrigation, and pest control.

2.2. Observation of In Vivo Phenotypic Dynamics Under Low-Temperature Stress

Following natural overwintering, three potted plants each of the ‘Miyagawa’ wild type and mutant, with comparable growth vigor, were selected as experimental samples. The entire plants were placed in an artificial cultivation chamber for low-temperature treatment at −6 °C. To accurately simulate the root protection mechanism typical of field cultivation, the pots were wrapped with cotton padding (thickness: 1 cm ± 0.2 cm). Photographs of the whole plants (both wild type and mutant) were taken at 0 h, 2 h, 4 h, 6 h, 8 h, and 10 h during the cold treatment.

2.3. Leaf Tissue Structure Observation

Leaf anatomical structure was observed using paraffin sectioning, following the method described by Shuai et al. [33], with a modification to the staining procedure: samples were immersed in a 0.5% toluidine blue staining solution diluted 1:100 for 3 min.

2.4. Observation of Cold Domestication Process and In Vitro Phenotypic Dynamics Under Low-Temperature Stress

To simulate natural low-temperature stress, six potted plants each of ‘Miyagawa’ wild type and mutant, with similar growth potential, were selected as test samples. The entire plants were placed in an artificial incubator for cold acclimation, and the root systems were wrapped as described in Section 2.2. Cold acclimation treatments followed the methods of Hou et al. and Yang et al. [34,35]. The incubator temperature was initially set at 20 °C, with a photoperiod of 16 h/8 h (light/dark). A stepwise cooling protocol was applied: first lowering the temperature to 4 °C at a rate of 2 °C per 24 h and maintaining it for 7 days, and then further reducing it to −6 °C at a rate of 3 °C per 24 h. Leaf samples were collected after 0, 2, 4, 6, 8, and 10 h of exposure to −6 °C. For each time point, healthy spring leaves (free of pests and disease) were sampled, rapidly frozen in liquid nitrogen, and stored at −80 °C for subsequent physiological index determination. Simultaneously, spring leaves from the same positions on wild-type and mutant plants were photographed at each time point (0, 2, 4, 6, 8, and 10 h at −6 °C) to visually document the cold stress response.

2.5. Optimal Treatment Temperature Exploration and Relative Electrical Conductivity Determination

Following the method of Xu et al. [36], after low-temperature treatment, 3–5 spring leaves of similar size were collected from the base of each plant. Using a 6 mm diameter punch, 20 small leaf discs were prepared and placed into a 50 mL centrifuge tube containing 20 mL of deionized water for 24 h. The initial electrolyte exudate conductivity (V1) was measured using a precision conductivity meter (average of three measurements). The samples were then placed in a water bath at 100 ± 2 °C for 20 min to completely kill the plant tissues. After cooling to room temperature, the final electrolyte conductivity (V2) was measured (average of three measurements). Relative conductivity was calculated using the following formula:
R e l a t i v e   e l e c t r i c a l   c o n d u c t i v i t y ( % ) = V 1 V 2 × 100 %

2.6. Determination of Physiological and Biochemical Indices

SOD, POD, and CAT activity measurements were performed according to the method described by Li et al. [37]; MDA content measurements were performed according to the method described by He et al. [38]. Briefly, 0.5 g of sample tissue was homogenized in 5 mL of 50 mmol/L phosphate buffer (pH 7.8) to obtain an enzyme extract for analysis.
  • SOD activity was measured by mixing 1.5 mL of 50 mmol/L phosphate buffer (pH 7.8) with 0.3 mL each of methionine (130 mmol/L), nitroblue tetrazolium (750 μmol/L), EDTA-Na2 (100 μmol/L), and riboflavin (20 μmol/L). Absorbance was recorded at 560 nm.
  • POD activity was determined using a reaction mixture containing 200 mL of 0.2 mol/L phosphate buffer (pH 6.0), 0.076 mL of guaiacol, and 0.112 mL of 30% H2O2. Then, 30 μL of enzyme extract was added to 3 mL of the reaction solution, and absorbance was measured at 470 nm using a UV spectrophotometer.
  • CAT activity was analyzed using a reaction solution composed of 200 mL of 0.15 mol/L phosphate buffer (pH 7.0) and 0.3092 mL of 30% H2O2. A volume of 0.1 mL of enzyme extract was added to 3 mL of the reaction solution, and absorbance was measured at 240 nm.
  • MDA content was assessed by reacting 2 mL of enzyme extract with 2 mL of a thiobarbituric acid reaction solution, prepared by dissolving 0.5 g of thiobarbituric acid in 0.5% trichloroacetic acid. Absorbance was measured at 450 nm, 532 nm, and 600 nm.
  • H2O2 content was determined using a commercially available detection kit from Beijing Solarbio Science & Technology Co., Ltd., Beijing, China. In summary, weigh approximately 0.1 g of leaf samples, add 1 mL of reagent 1, homogenize in an ice bath, centrifuge at 8000 g for 10 min (4 °C), collect all supernatant, place on ice, and proceed with the measurement steps. Measure at a wavelength of 415 nm, using a 96-well plate [39].
Pro content was similarly determined using a proline content detection kit from Beijing Solarbio Science & Technology Co., Ltd., Beijing, China. In summary, weigh approximately 0.1 g of leaf samples, add 1 mL of extraction solution, and homogenize in an ice bath. Then, place in boiling water and shake for 10 min to extract, followed by centrifugation at 10,000 g at room temperature for 10 min. Remove the supernatant, cool, and proceed with the measurement steps. Measure using a spectrophotometer at a wavelength of 520 nm [40].

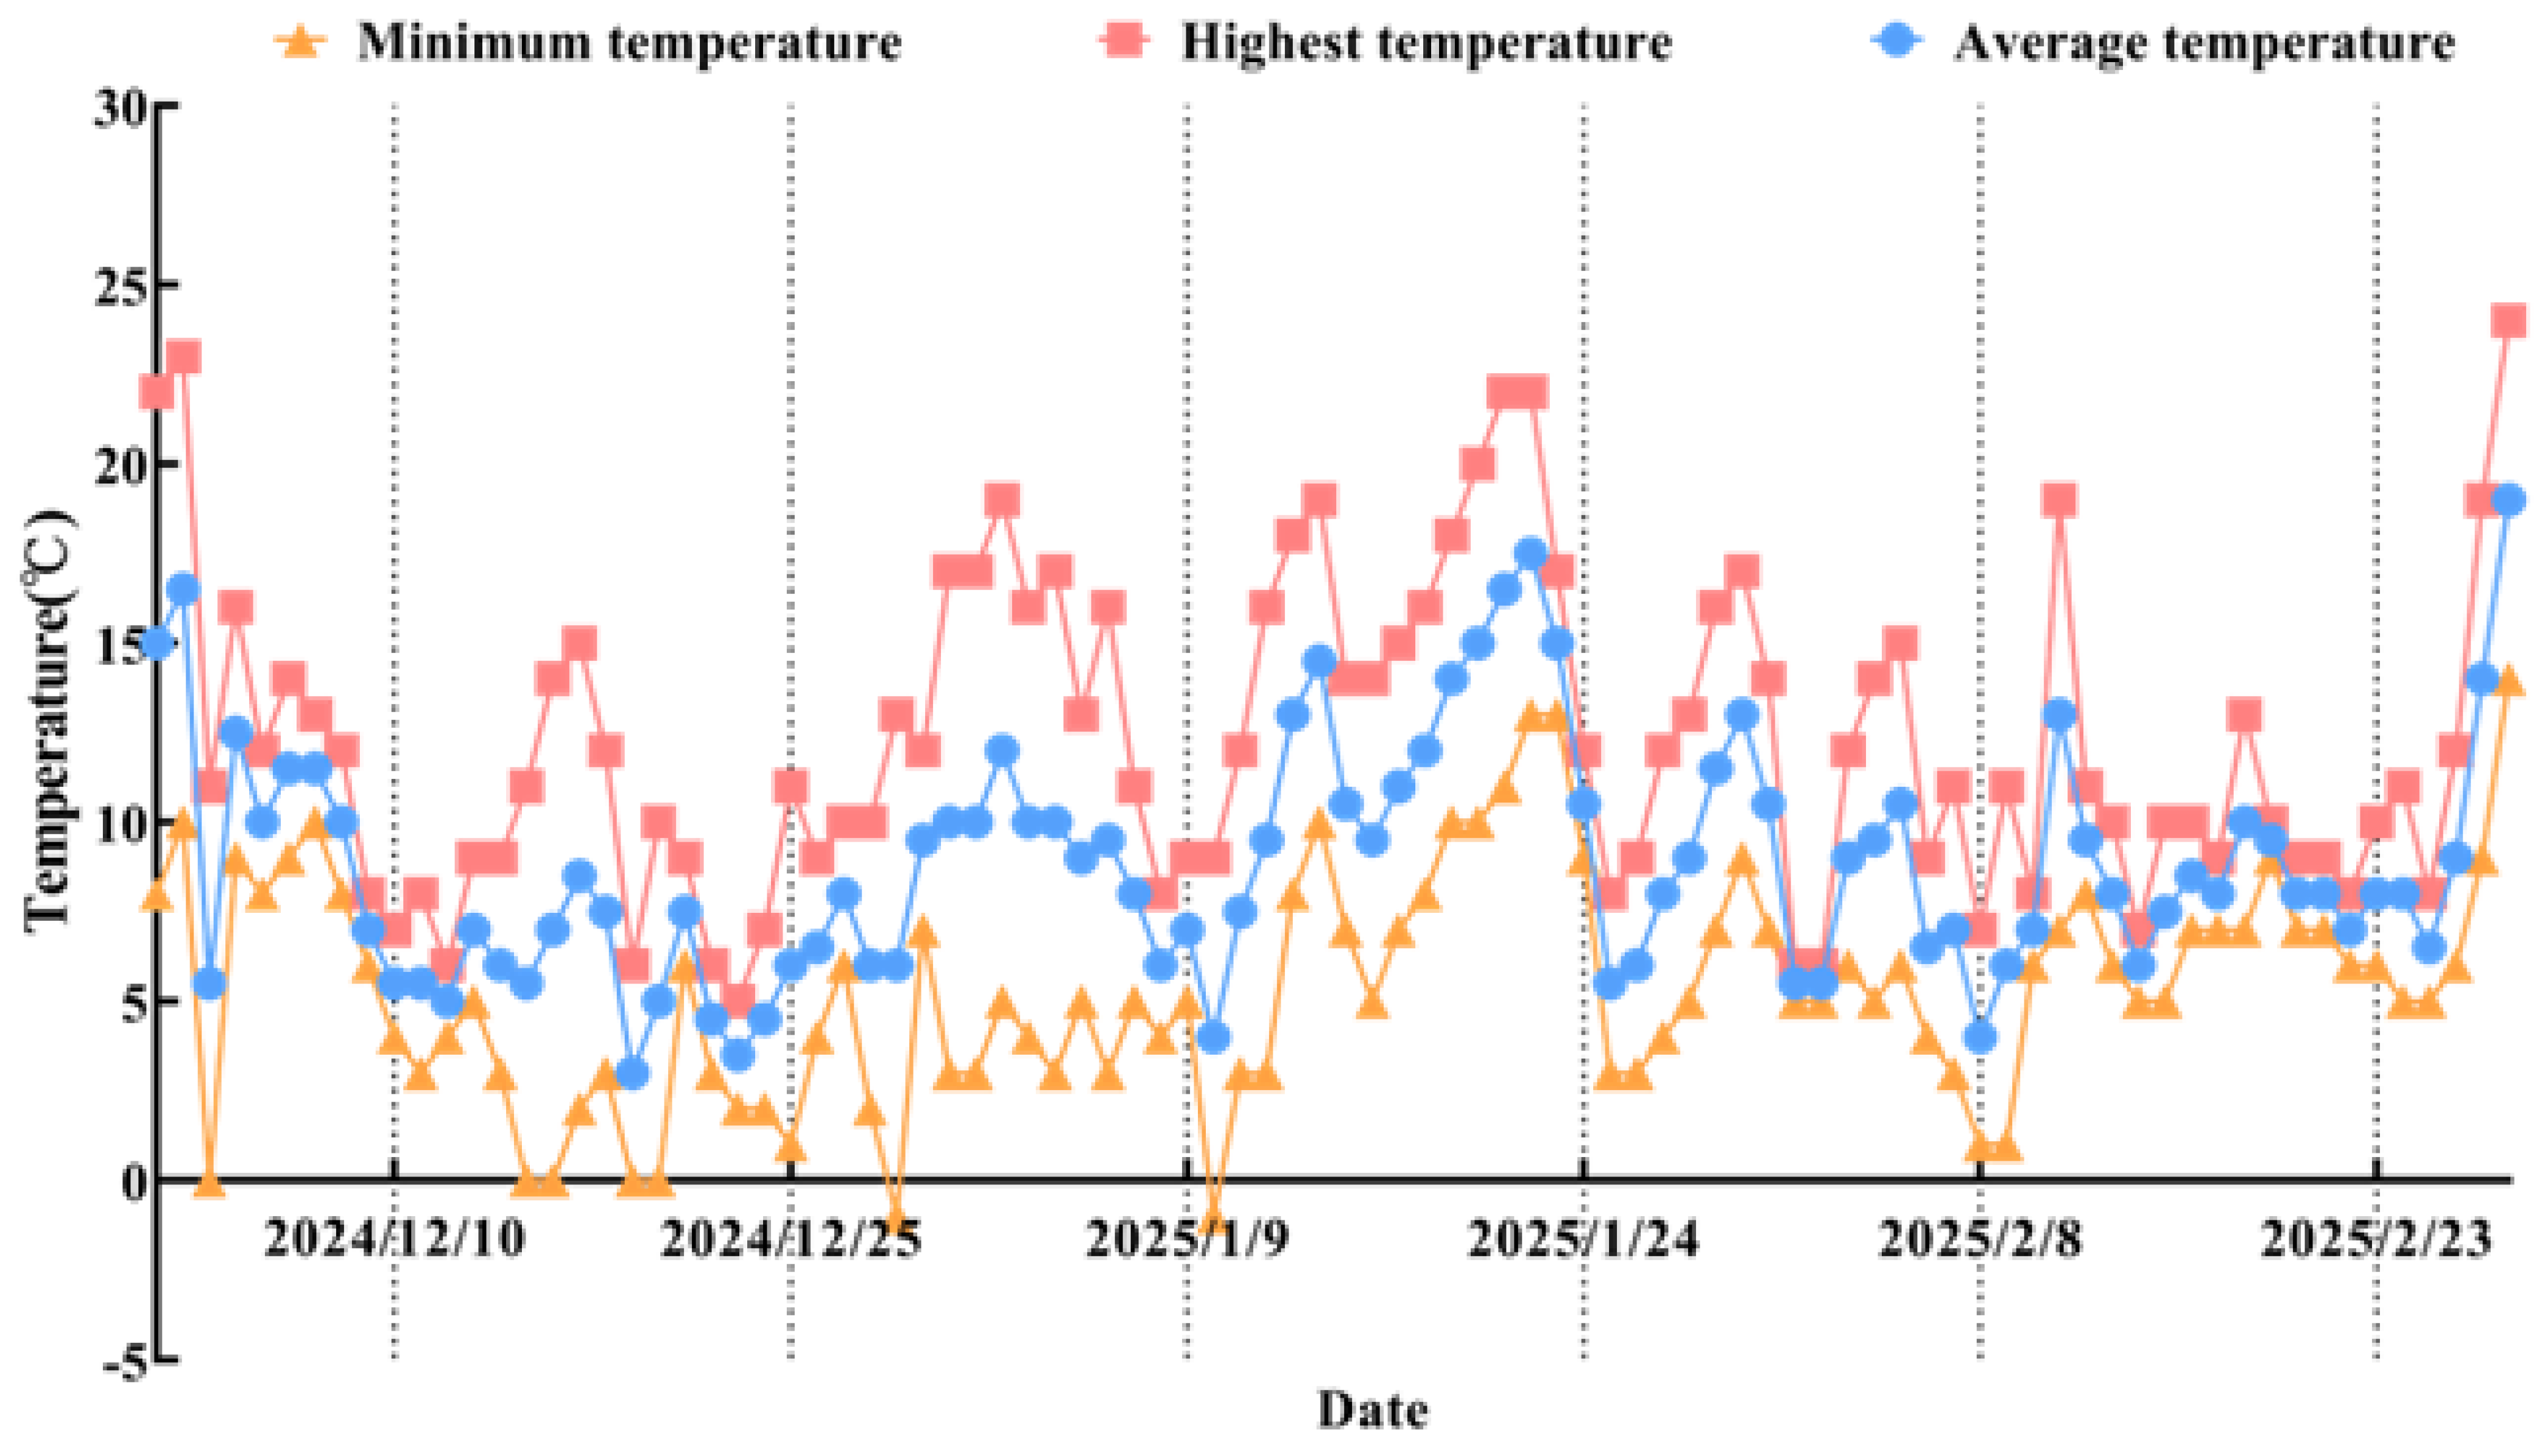
2.7. Temperature Changes During Natural Overwintering

During the period from 10 December 2024 to 23 February 2025, Cor8 gene expression was monitored in the leaves of wild-type and mutant ‘Miyagawa’ plants, which had been propagated annually and cultivated outdoors under natural environmental conditions. Leaf samples were collected at 15-day intervals. During the sampling period, temperatures fluctuated between −1 °C and 24 °C. On 25 December 2024 and 8 February 2025, we recorded the lowest average temperatures, with average daily temperatures of 10.5 °C and 4 °C, respectively.

2.8. Determination of qRT-PCR

Total RNA was extracted using an RNA extraction kit (Beijing ComWin Biotech Co., Ltd., Beijing, China), and reverse transcription was performed using a reverse transcription kit from the same supplier. The expression level of the Cor8 gene was determined by real-time fluorescence quantitative PCR (qRT-PCR). The reaction system and thermal cycling program were as follows (Table 1).
The PCR amplification program was as follows: initial pre-denaturation at 95 °C for 30 s, followed by 40 cycles of denaturation at 95 °C for 5 s and extension at 60 °C for 30 s. The quantitative primers for the Cor8 gene and the internal reference gene were designed by Zhang Chunmiao [41], a member of our research group. Relative expression levels were calculated using the 2−ΔΔCt method, with three biological replicates established for each treatment. The specific primer sequences are listed in Table 2.

2.9. Statistical Analyses

All data analyses were performed using SPSS (25.0, IBM, Armonk, NY, USA). Each treatment included three biological replicates, and results are presented as the mean ± standard deviation (SD). One-way analysis of variance (ANOVA) was conducted to assess differences among treatments, followed by Duncan’s multiple range test for post hoc comparisons. Correlation analyses between gene expression levels (e.g., Cor8) and temperature variables (mean, maximum, and minimum) across different weather windows were performed using Pearson’s correlation coefficients. Statistical significance was determined at p < 0.05, p < 0.01, and p < 0.001.

3. Results

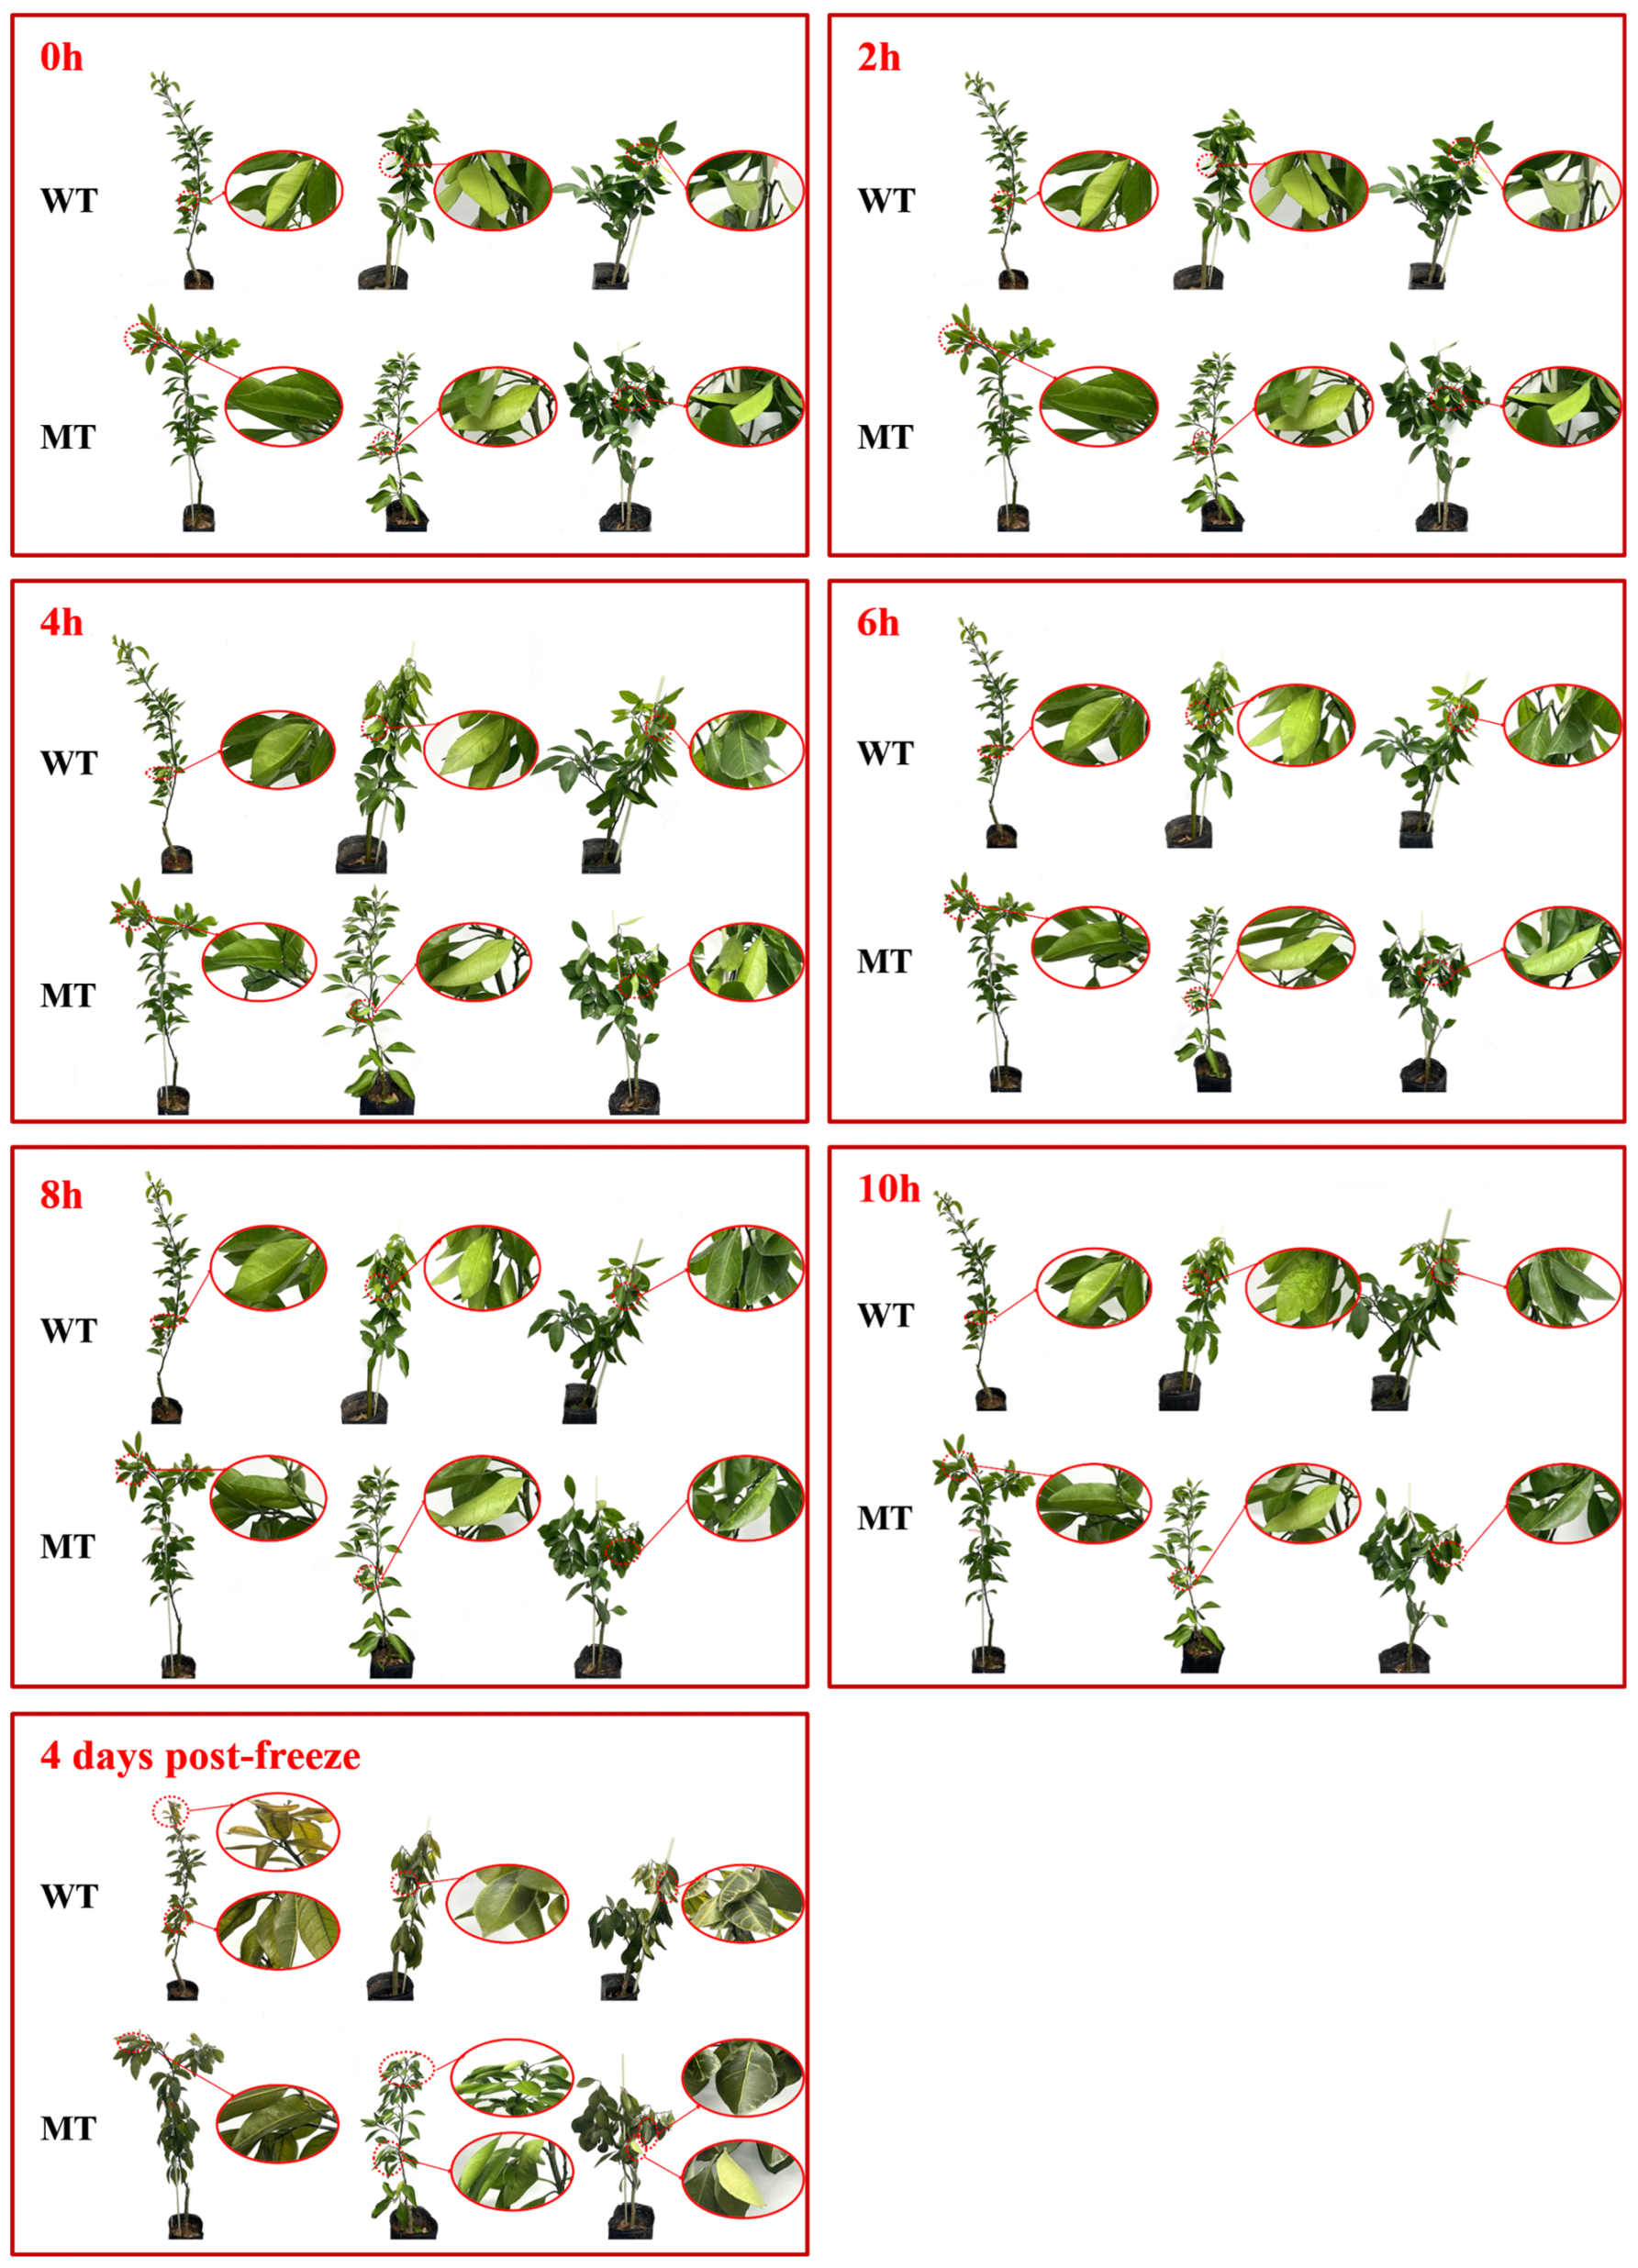
3.1. Dynamic Phenotypic Observation at Different Time Points Under Low-Temperature Treatment

As shown in Figure 1, when the entire ‘Miyagawa’ wild-type plant was treated at −6 °C for 2 h, the leaves began to exhibit mild freezing symptoms. After 4 h of low-temperature treatment, most of the leaves displayed severe freezing damage, and the plant had already started to show signs of wilting. In contrast, the mutant remained in a normal state after 2 h of treatment, showed only mild freezing symptoms after 4 h, and did not exhibit wilting until 8 h of exposure. Four days after freezing, some mutant plants still had green leaves with no visible symptoms of freezing damage; in contrast, all wild-type plants displayed pronounced leaf yellowing and chlorosis.

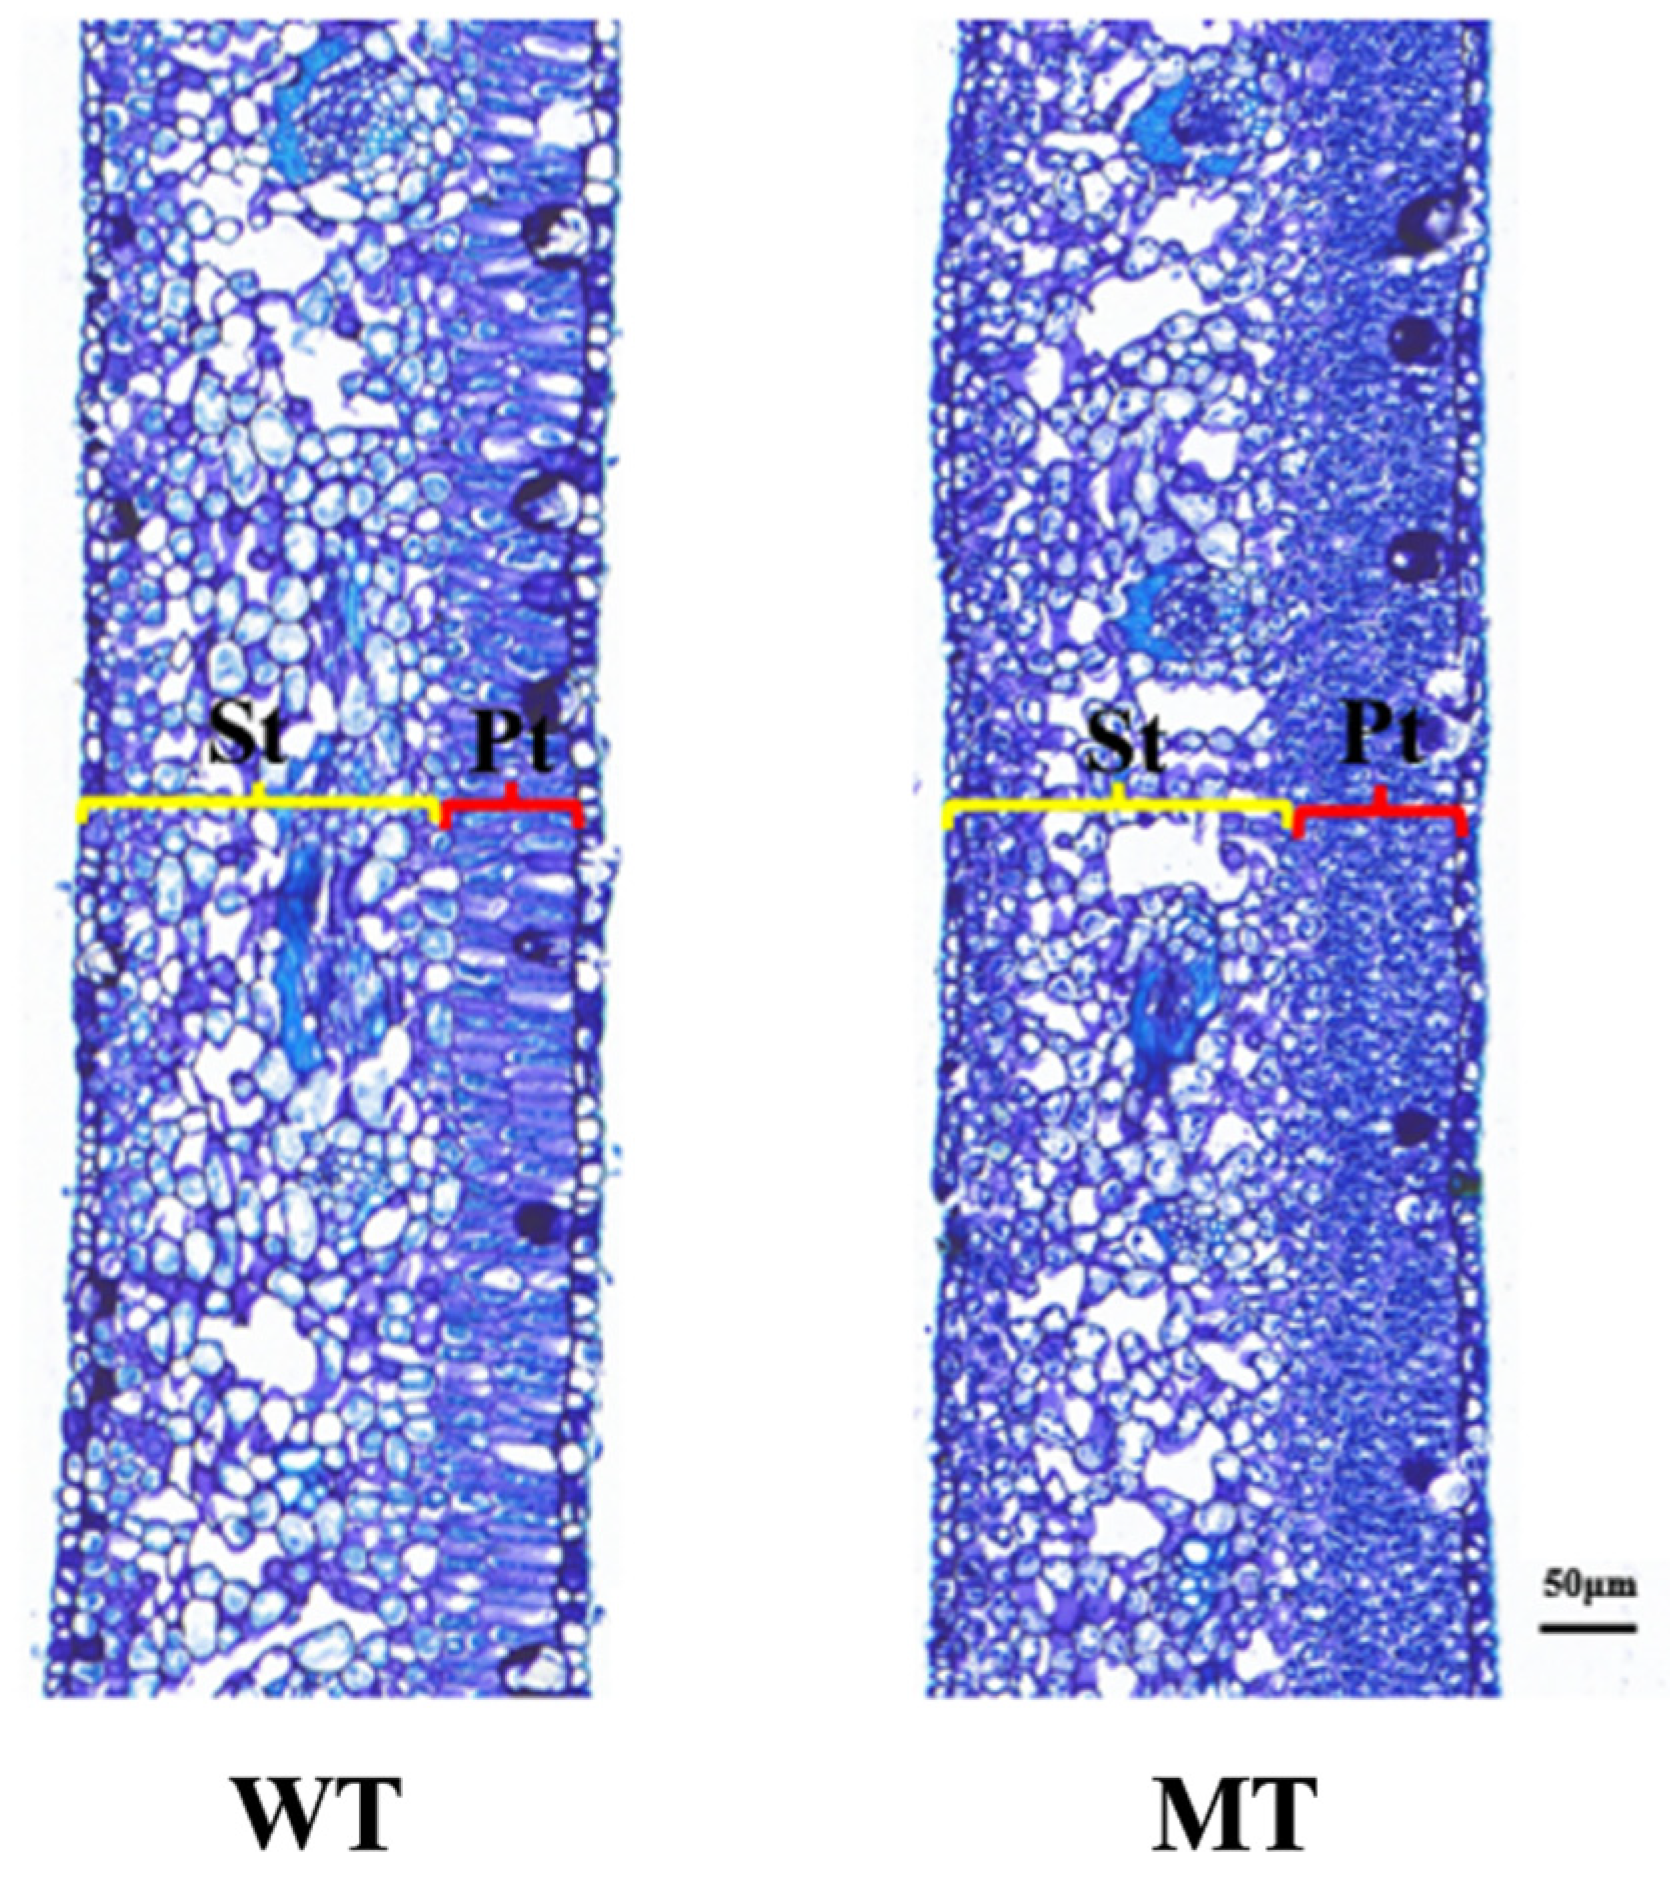
3.2. Comparison of Leaf Tissue Structure Between ‘Miyagawa’ Wild Type and Mutant Type

Microscopic observation revealed that both wild-type and mutant leaves consisted of three primary components: epidermal tissue, mesophyll tissue, and midrib tissue (Figure 2). Phenotypic differences were observed in the organization of the spongy tissue (St) and palisade tissue (Pt) within the mesophyll. Although both genotypes developed two layers of palisade tissue, the mutant exhibited a higher cell density and a more compact arrangement of palisade cells compared to the wild type.
As shown in Table 3, the palisade tissue thickness in the mutant was 94.1 ± 2.68 μm, significantly greater than that of the wild type (61.08 ± 2.96 μm), although no significant difference was found in the cross-sectional width of palisade tissue between the two genotypes. The cell structure looseness of the mutant was significantly lower than that of the wild type, while both cell structure compactness and the palisade-to-spongy-tissue ratio were significantly higher. These anatomical characteristics indicate that the mutant leaves possess a more compact mesophyll tissue structure.

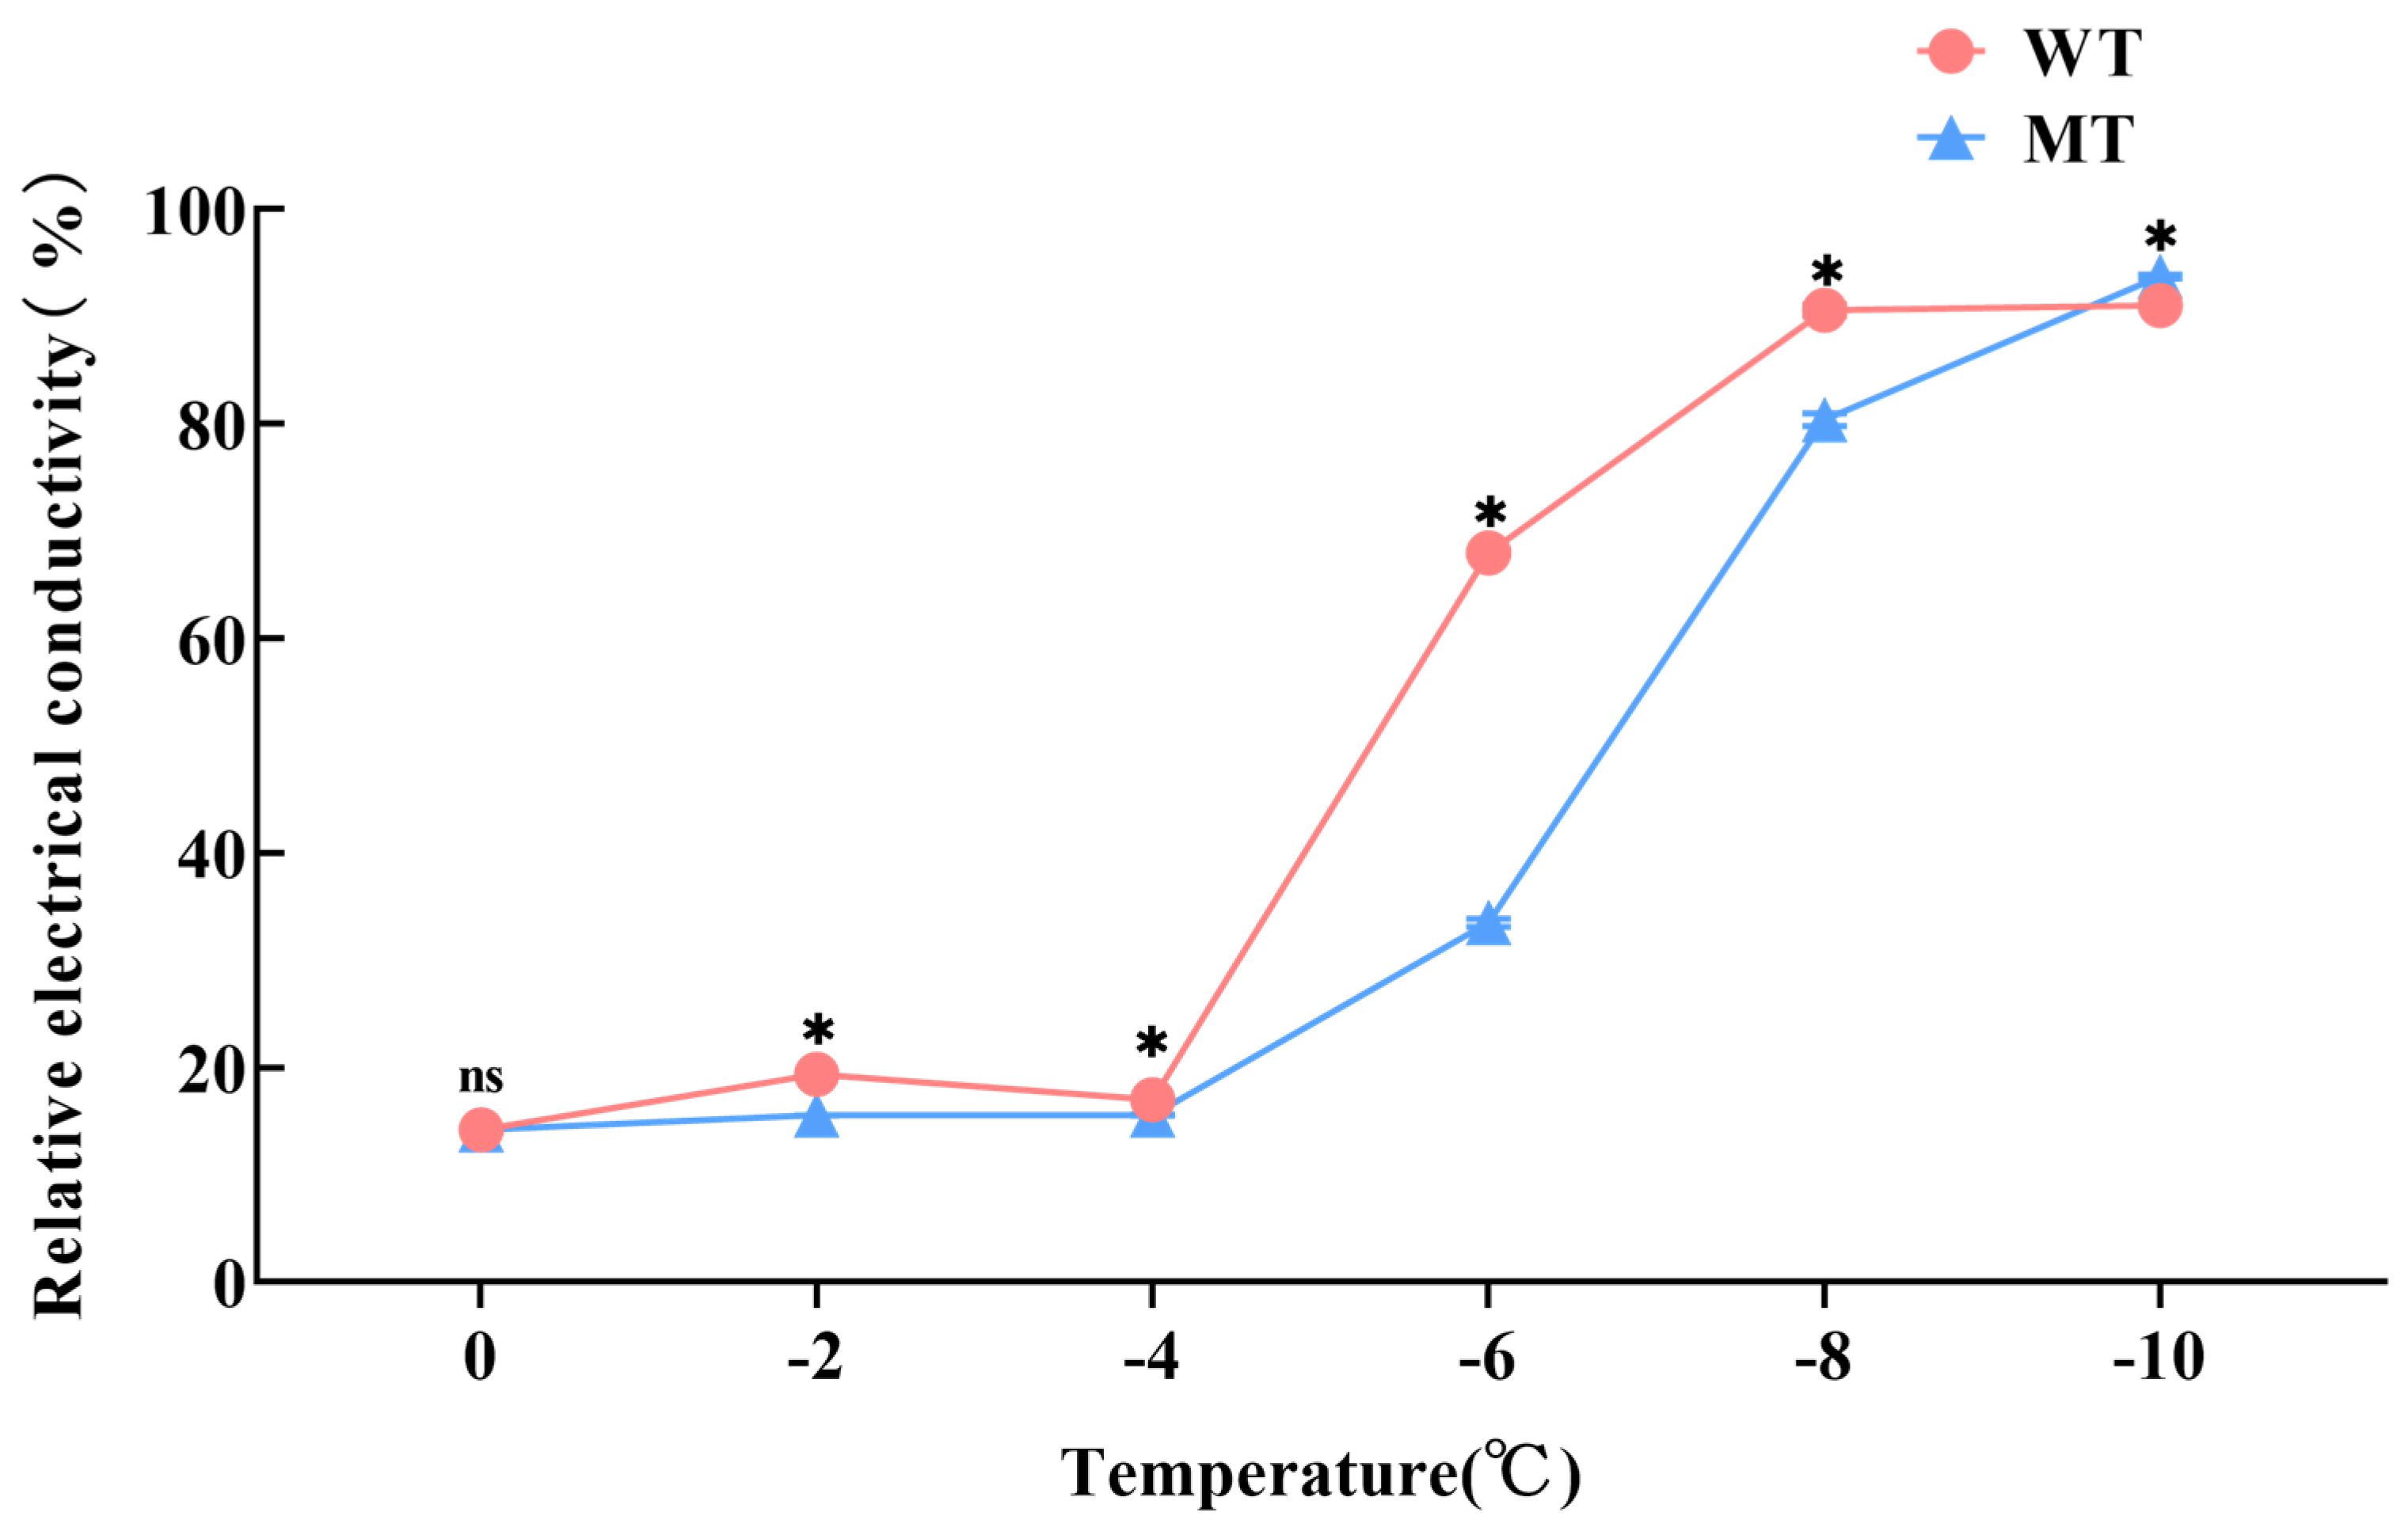
3.3. Changes in Relative Conductivity of ‘Miyagawa’ Mutant Under Different Low-Temperature Treatments and Determination of Optimum Temperature

As shown in Figure 3, the relative conductivity of the ‘Miyagawa’ mutant and wild type increased as the treatment temperature decreased; however, the rate and magnitude of increase differed significantly between them. In the temperature range of 0 °C to −4 °C, the relative conductivity of both the wild type and mutant remained low (approximately 14–20%), with no significant difference between them (p > 0.05). When the temperature dropped to −6 °C, the relative conductivity of the wild type rose sharply to 67.98 ± 0.26%, while that of the mutant increased only to 33.50 ± 0.37%, a significant difference (p < 0.01). With further cooling to −8 °C and −10 °C, the conductivity continued to rise in both genotypes, reaching 91.04 ± 0.24% for the wild type and 93.75 ± 0.18% for the mutant at −10 °C. Based on these results, −6 °C was selected as the optimal treatment temperature for subsequent physiological and biochemical experiments, as it maximized the difference in cold tolerance between the wild type and mutant and allowed for a more detailed analysis of cold-resistance mechanisms in the ‘Miyagawa’ mutant.
Phenotypic observations of isolated leaves (Figure A2) further supported these findings. After 2 h of low-temperature treatment, wild-type leaves exhibited early signs of freezing, primarily seen as water-soaked spots on the abaxial surface that darkened to green, accompanied by a softer, thinner leaf texture. At this point, mutant leaves remained unaffected. By 4 h, the wild type displayed extensive watery spots, whereas the mutant showed only slight freezing symptoms. After 6 h, all wild-type leaves showed severe water staining, indicating extensive tissue damage, while the mutant leaves exhibited milder symptoms. By 8 h, both genotypes displayed severe freezing symptoms, but the extent remained lower in the mutant. These dynamic observations further demonstrated the mutant’s superior cold tolerance under isolated low-temperature stress.

3.4. Physiological and Biochemical Responses of the ‘Miyagawa’ Mutant Under Cold Stress

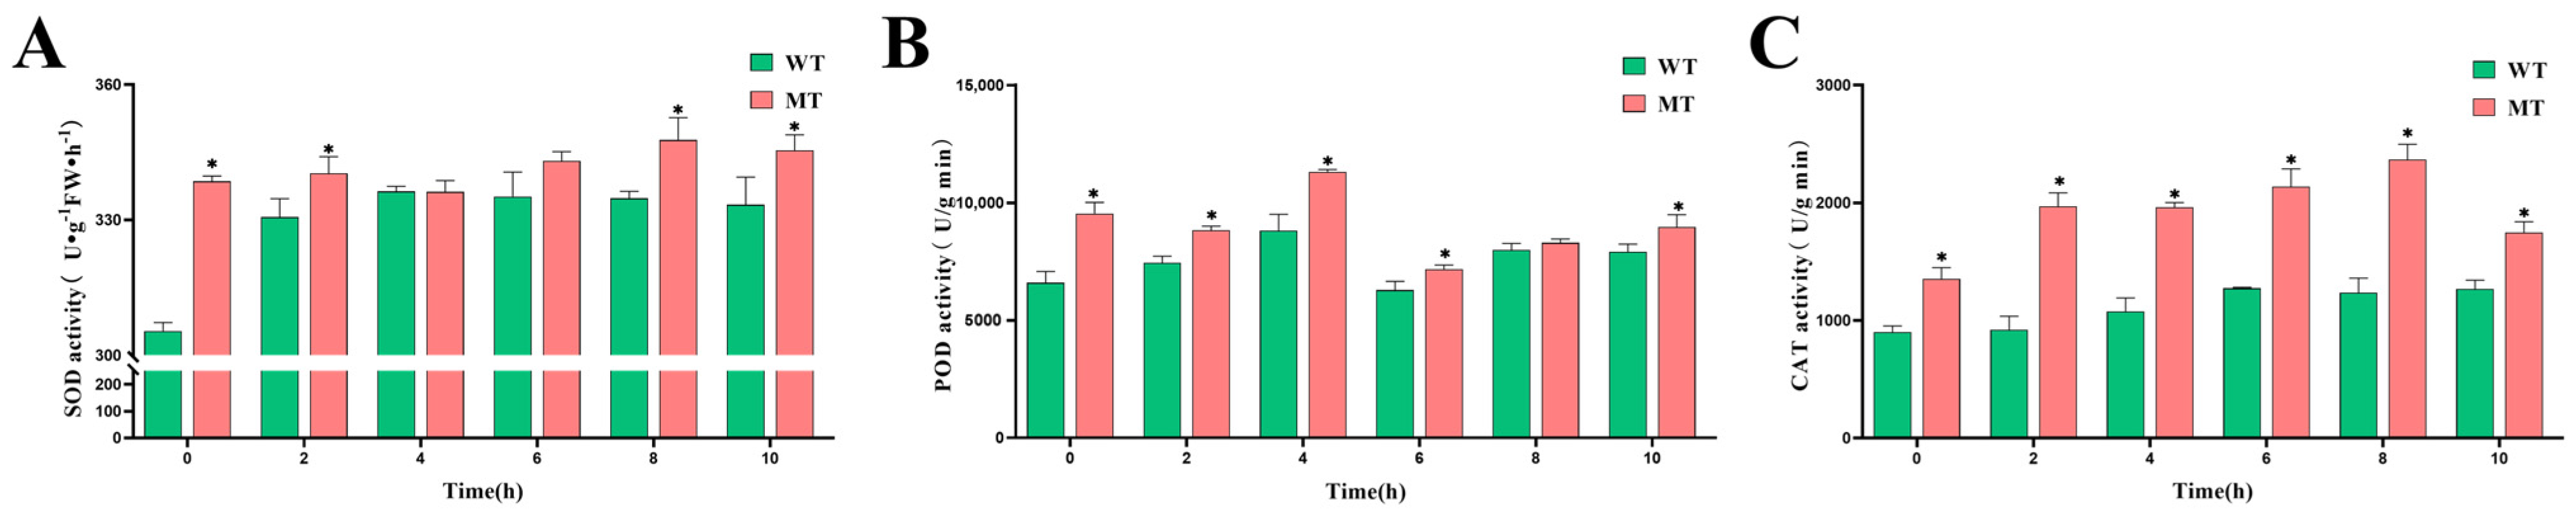
3.4.1. Changes in Antioxidant Enzyme Activities in the ‘Miyagawa’ Mutant Under Cold Stress

Under cold stress at −6 °C, the activities of antioxidant enzymes in both the ‘Miyagawa’ mutant and wild type showed dynamic changes; however, the mutant consistently exhibited higher enzyme activities, indicating enhanced cold tolerance.
Specifically, superoxide dismutase (SOD) activity in the mutant was significantly higher than that of the wild type at 0, 2, 8, and 10 h of treatment (p < 0.05). At 0 h, the SOD activity in the mutant reached 338.59 ± 1.17 U·g−1 FW·h−1, compared to 305.37 ± 1.92 U·g−1 FW·h−1 in the wild type, representing an increase of 10.87%, which was the largest difference observed between the two genotypes (Figure 4A).
Peroxidase (POD) activity also remained significantly higher in the mutant than in the wild type at 0, 2, 4, 6, and 10 h (p < 0.05; Figure 4B). Both genotypes reached peak POD activity at 4 h, with the mutant measuring 11,309.88 ± 97.63 U/g·min and the wild type 8811.42 ± 697.97 U/g·min—a 1.28-fold difference. The lowest POD activity was observed at 6 h, with the mutant recording 7168.32 ± 183.15 U/g·min and the wild type recording 6283.75 ± 366.25 U/g·min, indicating the mutant still maintained a 1.14-fold-higher activity at the minimum.
Similarly, catalase (CAT) activity in the mutant was significantly higher than in the wild type at all measured time points (p < 0.05; Figure 4C). The largest difference occurred at 2 h, where CAT activity reached 1970.03 ± 115.23 U/g·min in the mutant, 2.14 times higher than the wild type (920.96 ± 115.30 U/g·min). The mutant’s CAT activity peaked at 8 h (2367.66 ± 130.41 U/g·min), 91.58% greater than that of the wild type (1235.89 ± 124.39 U/g·min) at the same time point.

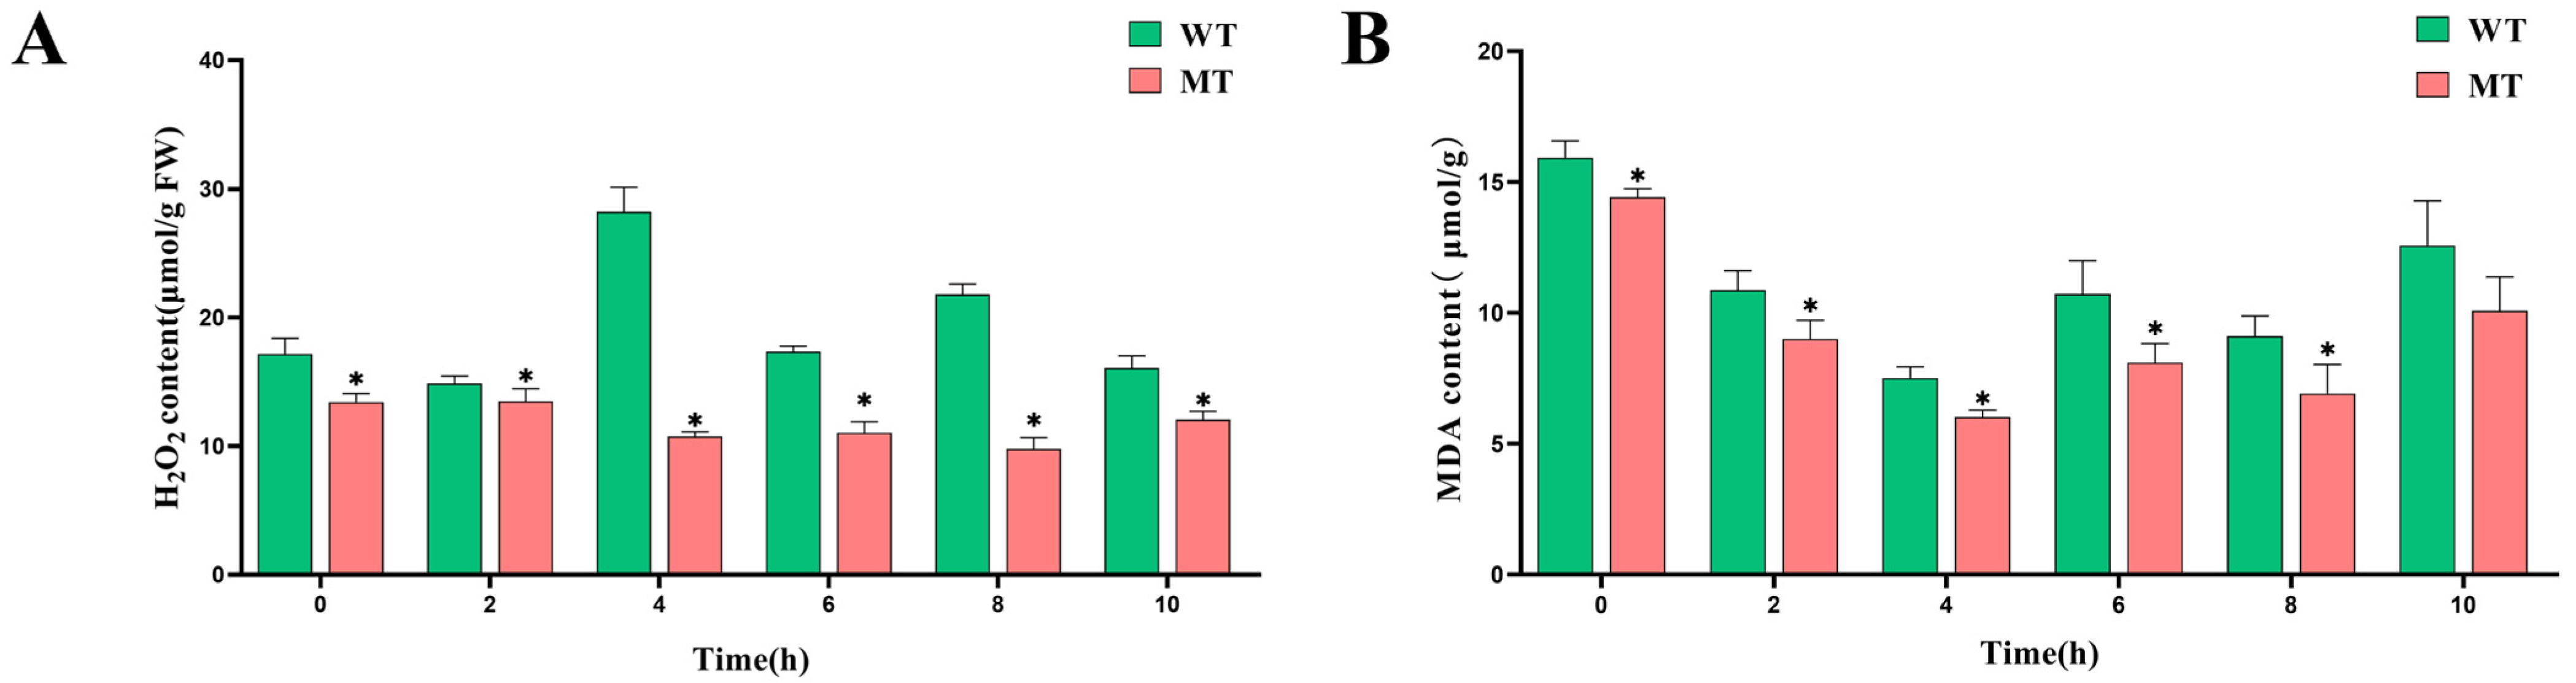
3.4.2. Changes in Cellular Damage Indicators in the ‘Miyagawa’ Mutant Under Cold Stress

Cold stress induces the accumulation of reactive oxygen species (ROS) in citrus cells, resulting in dynamic changes in hydrogen peroxide (H2O2) and malondialdehyde (MDA) levels—two key indicators of oxidative damage and cold stress adaptability. The results of this study showed that H2O2 content in the mutant was significantly lower than that in the wild type throughout the entire cold treatment period (p < 0.05; Figure 5A). Moreover, the fluctuations in H2O2 levels in the mutant were relatively mild, indicating more stable ROS homeostasis under stress conditions. At 4 h of cold treatment, the wild type exhibited the highest H2O2 accumulation, reaching 28.22 ± 1.92 μmol/g FW, which was 2.62 times higher than that of the mutant (10.76 ± 0.36 μmol/g FW). The lowest H2O2 content in the mutant occurred at 8 h (9.79 ± 0.86 μmol/g FW), while the wild type maintained a relatively high level (21.79 ± 0.82 μmol/g FW), representing a 2.23-fold difference. By the end of the treatment (10 h), the H2O2 content in the wild type remained 33.25% higher than that of the mutant, measuring 16.07 ± 0.94 μmol/g FW and 12.06 ± 0.65 μmol/g FW, respectively.
Regarding malondialdehyde (MDA) content, the mutant consistently exhibited significantly lower levels than the wild type during the 0–8 h period of low-temperature treatment (p < 0.05; Figure 5B). Both genotypes displayed a similar temporal trend: a gradual decline in MDA levels from 0 to 4 h, followed by a temporary increase and subsequent decline between 6 and 10 h. MDA content peaked at 0 h and reached its minimum at 4 h in both genotypes, suggesting a potentially shared regulatory mechanism in response to cold stress. The most pronounced differences between the wild type and mutant were observed at 6 and 8 h, during which the wild type consistently exhibited MDA levels 1.32 times higher than those of the mutant. These findings indicate that the mutant has greater membrane lipid stability under cold stress conditions.

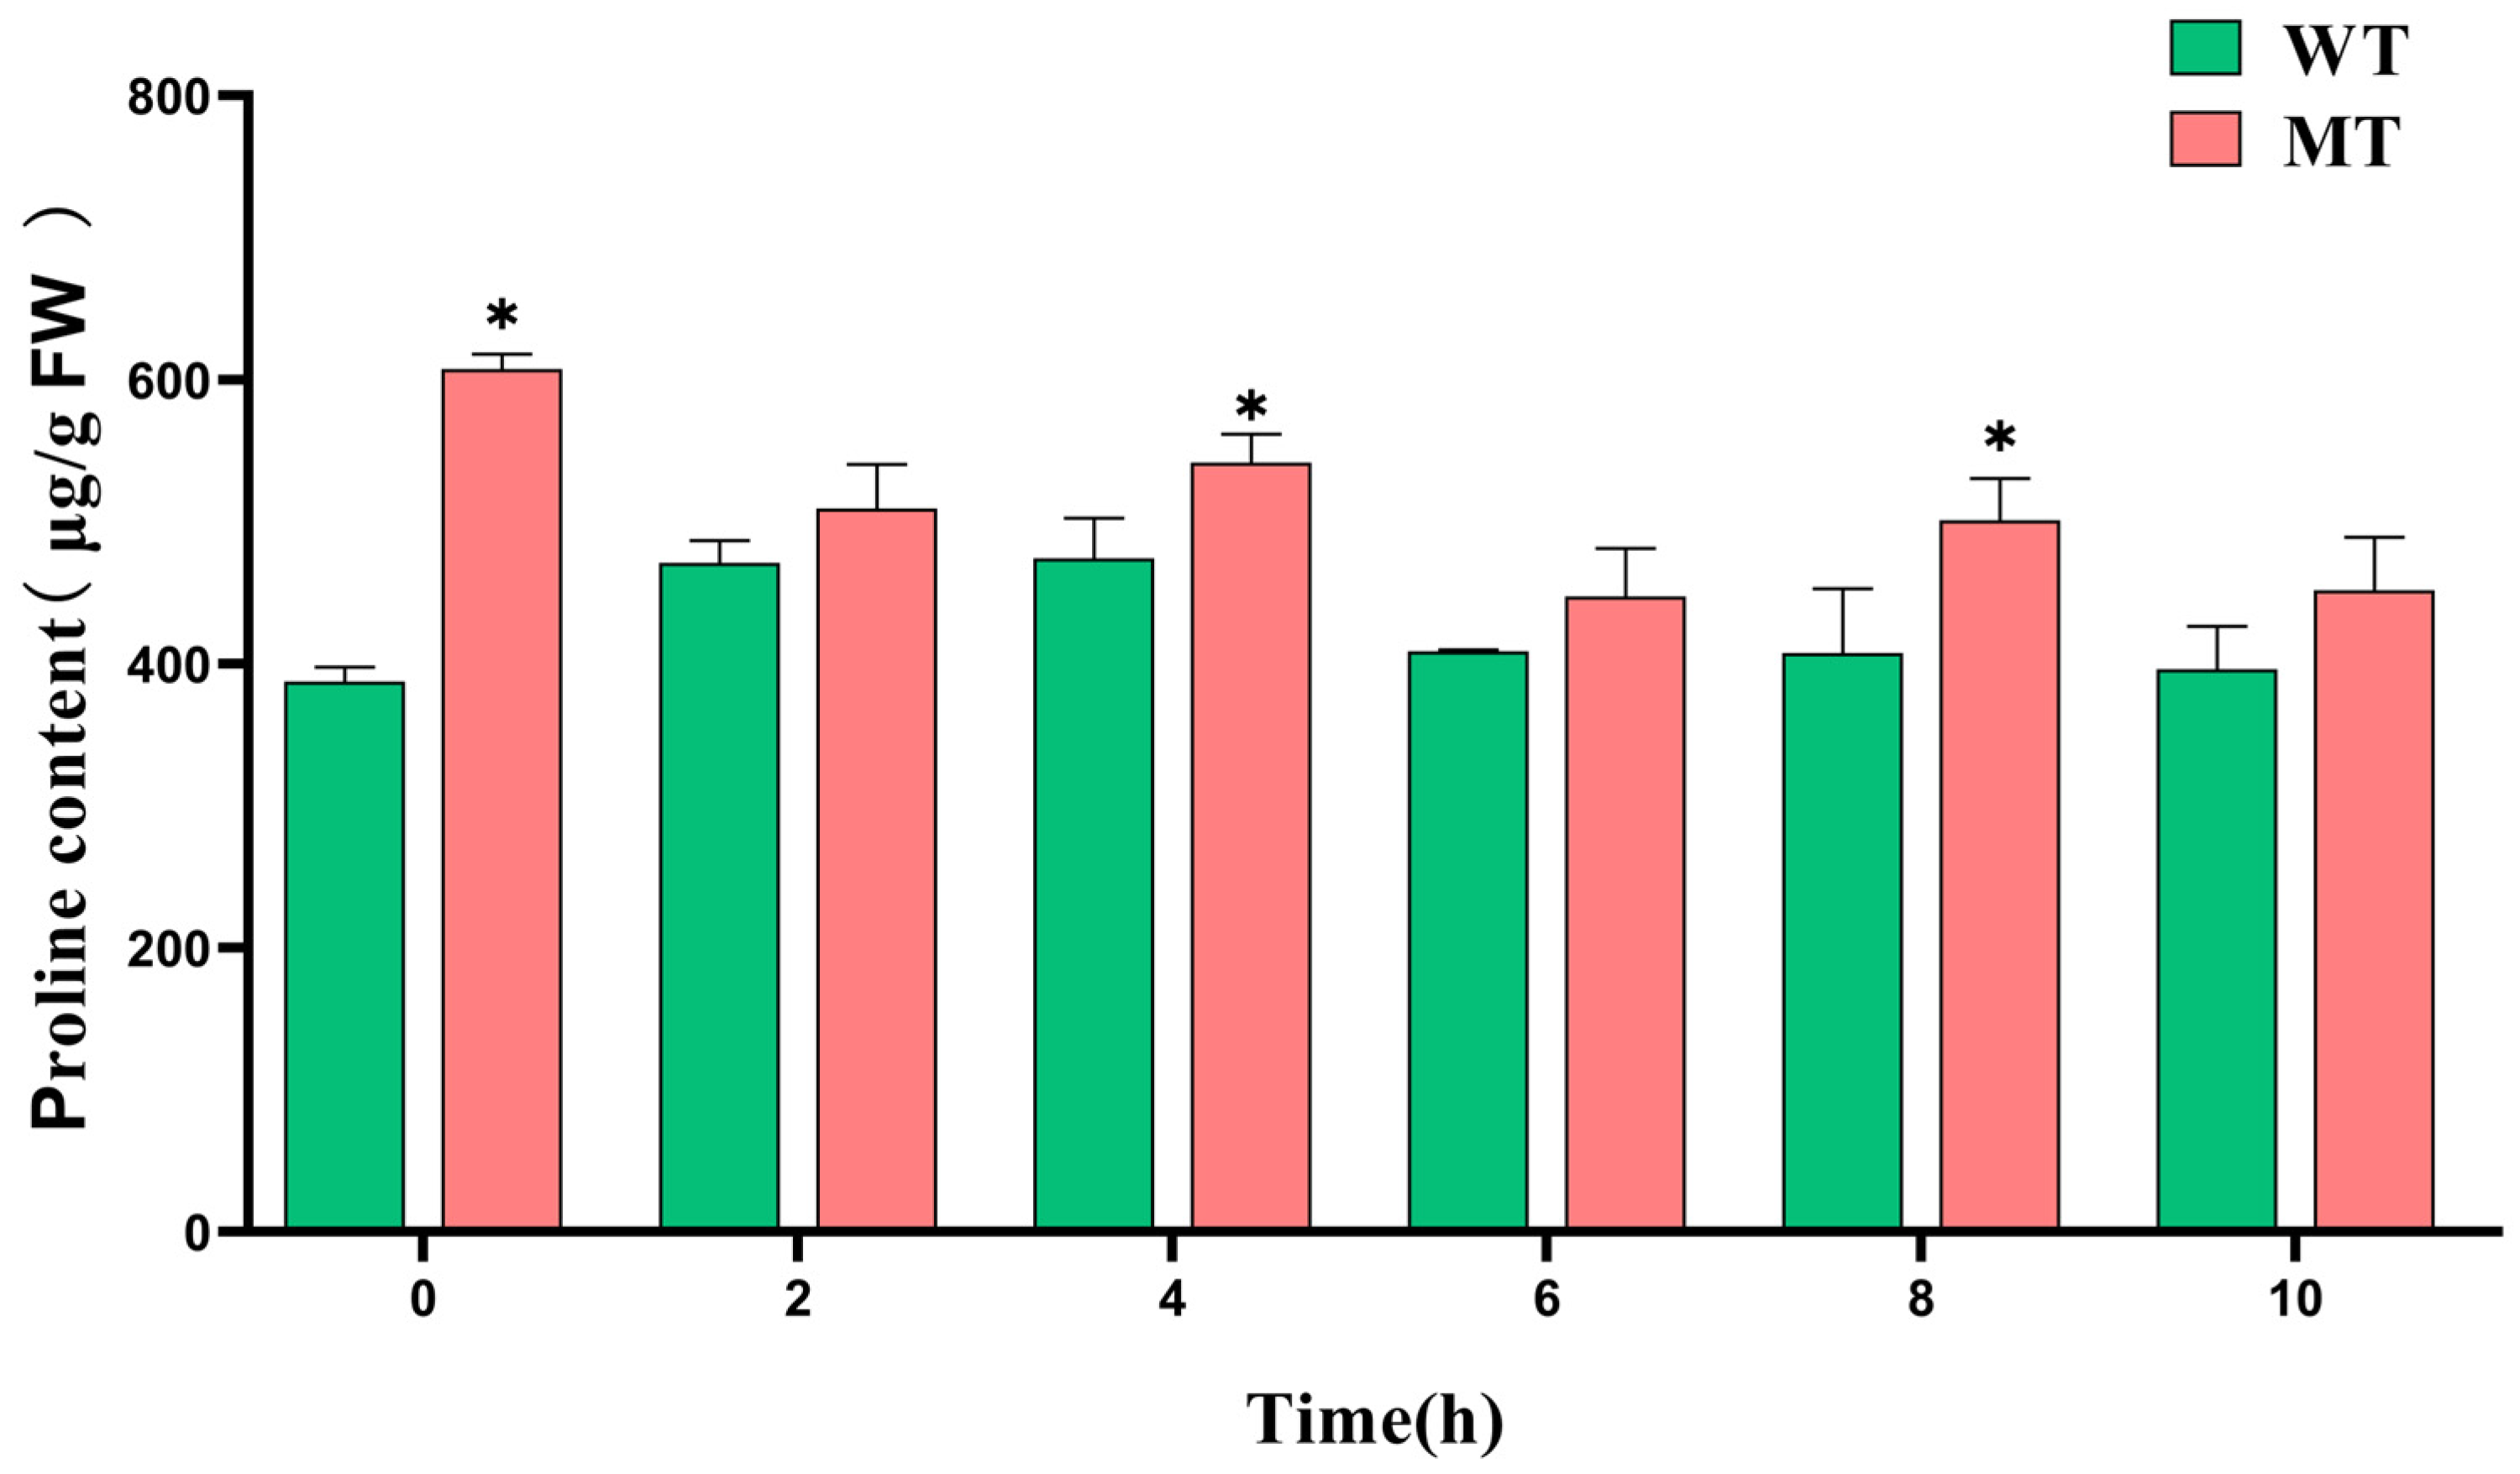
3.4.3. Changes in Proline Content in the ‘Miyagawa’ Mutant Under Cold Stress

Under cold stress conditions, the ‘Miyagawa’ mutant exhibited a stronger osmotic adjustment capacity compared to the wild type. At 0 h of low-temperature treatment, the proline content in mutant leaves reached a peak value of 607.49 ± 10.60 μg/g FW, significantly higher than that of the wild type (387.41 ± 10.10 μg/g FW), representing a 56.81% increase (p < 0.05). As the duration of cold treatment increased, proline content in both genotypes displayed fluctuating trends; however, the mutant consistently maintained higher levels. At 4 h, the mutant’s proline content was 541.52 ± 20.22 μg/g FW, significantly exceeding that of the wild type (474.20 ± 28.31 μg/g FW) by 14.20% (p < 0.05). Similarly, at 8 h, the mutant again showed significantly greater proline accumulation (501.05 ± 29.49 μg/g FW) compared to the wild type (407.66 ± 45.23 μg/g FW), representing a 22.91% difference (p < 0.05; Figure 6).

3.5. Correlation Analysis Between Temperature Changes and Cor8 Gene Expression Level

In citrus, the Cor8 gene is known to enhance cellular cold tolerance by regulating the accumulation of osmoprotectants such as proline and soluble sugars. Throughout the natural overwintering period, Cor8 expression levels in the ‘Miyagawa’ mutant were consistently and significantly higher than those in the wild type. The most pronounced difference was observed on 10 December 2024, when the mutant exhibited a Cor8 expression level 2.98 times that of the wild type (Figure 7).
Across all weather windows (1–10 days), the average minimum temperature showed the strongest and most significant negative correlation with Cor8 gene expression in the wild type (WT). This suggests that WT plants respond to accumulated cold stress, particularly to prolonged exposure to low nighttime temperatures. As the weather window narrows, the strength of this correlation weakens, indicating that Cor8 expression in WT responds gradually and integrates cold exposure over time.
In contrast, the mutant (MT) exhibited weaker overall correlations with temperature over longer weather windows but showed significant responses in shorter windows, particularly in relation to minimum temperature. This pattern suggests that Cor8 expression in the mutant is more immediately responsive to short-term drops in temperature, indicating a faster and more sensitive cold-response mechanism compared to the wild type (Table 4).

4. Discussion

Low-temperature stress significantly affects plant growth, development, and geographical distribution [42,43,44]. Therefore, alterations in leaf anatomical structure can serve as reliable indicators of plant adaptability to environmental stresses [9]. Previous studies have demonstrated a positive correlation between cold tolerance in citrus and the palisade-to-spongy-tissue ratio [45]. Similarly, in banana cultivars, both cuticle thickness and palisade tissue thickness positively correlate with cold resistance, whereas the ratio of spongy mesophyll thickness to total leaf thickness (SR) shows a negative correlation with cold tolerance [46].
In the present study, the ‘Miyagawa’ mutant exhibited thicker and more densely arranged palisade tissue compared to the wild type. Moreover, the mutant showed a significantly higher CTR (palisade-tissue-to-total-leaf-thickness ratio), indicating a greater proportion of palisade tissue. This anatomical feature suggests that the mutant may possess enhanced photosynthetic capacity and energy storage potential, which are advantageous for coping with adverse environmental conditions [47]. Additionally, the mutant displayed a notably lower SR value, reflecting a reduced proportion of spongy mesophyll tissue, which is generally more sensitive to low temperatures—thereby contributing to improved overall cold tolerance. These structural characteristics are consistent with those commonly observed in cold-tolerant plant species, further confirming the enhanced cold resistance potential of the ‘Miyagawa’ mutant.
In the plant antioxidant defense system, superoxide dismutase (SOD), peroxidase (POD), and catalase (CAT) are essential antioxidant enzymes [48]. These enzymes play distinct roles in the defense mechanism: SOD acts as the primary defense enzyme by catalyzing the conversion of O2−. to H2O2, while POD and CAT further catalyze the decomposition of H2O2, thereby preventing oxidative damage [49]. Under low-temperature stress, plant antioxidant enzyme activities exhibit characteristic dynamic changes. Several studies have confirmed that plants such as cucumber [50], maize [51], citrus [3], and rice [52] display a pattern of antioxidant enzyme activity that initially increases and then decreases under low-temperature conditions. The early rise in enzyme activity reflects the plant’s active initiation of defense mechanisms, whereas the subsequent decline under prolonged stress indicates a weakening of the defense system, promoting lipid peroxidation.
In this study, both the wild type and mutant displayed a similar trend of initially increasing antioxidant enzyme activities followed by a decline during low-temperature treatment, confirming that the antioxidant defense systems of both genotypes respond to cold stress. However, the mutant consistently exhibited significantly higher activities of SOD, POD, and CAT throughout the entire treatment period compared to the wild type. This result aligns with the findings of Jing et al. [53], who reported that cold-tolerant varieties possess higher levels of SOD and POD activity, strongly supporting the conclusion that the mutant has enhanced cold-resistance potential relative to the wild type.
The cell membrane, as the interface between the plant and its external environment, plays a critical role in mediating responses to low-temperature stress by maintaining structural integrity and functional stability [54]. Studies have shown that the primary difference in cold tolerance between plant species is reflected in the membrane system’s response to low temperatures [35,55]. Cold-tolerant plants tend to experience less membrane damage, exhibit slower increases in membrane permeability, and demonstrate stronger recovery capabilities. In contrast, cold-sensitive plants show a rapid rise in membrane permeability, difficulty recovering, and a significant increase in conductivity. The results of this study show that, under the same low-temperature treatment conditions, wild-type leaves consistently displayed higher relative conductivity, indicating more severe membrane damage and relatively weaker cold tolerance.
Under low-temperature stress, the excessive accumulation of reactive oxygen species (ROS) is a major cause of oxidative damage to plant cells [56]. The ROS produced during plant metabolism primarily include hydrogen peroxide (H2O2), hydroxyl radicals (OH/OH), and superoxide anions (O2−.) [57]. In this study, during the 4–10 h period of low-temperature treatment, the difference in H2O2 content between wild-type and mutant leaves gradually increased, with wild-type leaves consistently exhibiting higher H2O2 levels. This suggests that the mutant possesses a more efficient ROS scavenging system, enabling it to maintain ROS homeostasis under cold conditions and mitigate oxidative damage to cellular membranes.
Malondialdehyde (MDA), a terminal product of lipid peroxidation, is an important indicator of oxidative damage to biological membranes [58,59]. Chen et al. [60] confirmed that elevated MDA accumulation progressively damages membrane structure, increases permeability, and disrupts ionic balance between the cell interior and exterior—ultimately leading to electrolyte leakage, increased conductivity, and irreversible membrane damage. In our study, the MDA content in mutant leaves was consistently lower than that in the wild type throughout the low-temperature treatment, suggesting that the mutant has a more effective lipid protection mechanism. This enables it to suppress lipid peroxidation in cold environments, thereby maintaining membrane structural and functional integrity and enhancing cold resistance. These findings are consistent with those of Shi et al. [61], who reported similar results in cold-resistant poplar seedlings.
Proline (Pro), a multifunctional protective molecule in plant cells, plays several critical roles in the cold stress response [62]. It helps plants cope with temperature-induced physiological dehydration by regulating osmotic potential, and it also contributes to ROS scavenging [63]. This study found that the mutant consistently maintained higher levels of proline accumulation compared to the wild type throughout the cold treatment. This elevated proline content likely enables the mutant to more effectively maintain intracellular homeostasis, reduce cold-induced cellular damage, and enhance overall cold tolerance. These findings are consistent with the work of Du et al. [64], highlighting the role of proline in plant responses to cold stress.
The regulation of COR gene expression plays a central role in cold acclimation and low-temperature response mechanisms [65,66]. Zhang et al. [41] systematically measured dynamic Cor8 gene expression in various citrus cultivars during autumn and winter and found that cold-tolerant cultivars exhibited significantly higher Cor8 expression levels than cold-sensitive ones. This pattern indicates that Cor8 expression could serve as a useful molecular marker for evaluating cold tolerance in citrus.
This study focused on the expression differences of the Cor8 gene between the mutant and wild type during natural overwintering. Dynamic monitoring revealed that the mutant consistently exhibited higher Cor8 expression than the wild type throughout the overwintering period, reaching a peak level 2.98 times greater than that of the wild type. This pronounced difference provides strong molecular evidence supporting the enhanced cold tolerance of the mutant.

5. Conclusions

The mutant exhibited significantly lower relative conductivity under low-temperature stress compared to the wild type, indicating the greater integrity and stability of its cell membrane structure. This advantage was directly reflected in its phenotype, as the mutant showed markedly less freeze damage under the same low-temperature treatment conditions. Anatomically, the mutant’s leaves featured thicker palisade tissue, a higher CTR value (palisade-tissue-to-total-leaf-thickness ratio), and a lower SR value (spongy-mesophyll-to-total-leaf-thickness ratio). These structural characteristics are consistent with those observed in known cold-tolerant plant species, providing a histological foundation for the mutant’s enhanced cold tolerance. Physiologically and biochemically, the mutant displayed significantly higher activities of antioxidant enzymes such as SOD, POD, and CAT, along with elevated levels of osmotic regulators like proline. These traits not only enhance its ability to scavenge reactive oxygen species (ROS) but also improve its resistance to cellular frost damage and its capacity for osmotic regulation. More importantly, at the molecular level, the mutant exhibited higher expression of the cold-tolerance “star gene” Cor8, providing a robust molecular basis for its enhanced cold resistance. This study systematically characterized the cold tolerance of both wild-type and mutant strains of ‘Miyagawa,’ highlighting key physiological, anatomical, and molecular differences and providing a valuable reference for citrus cold-tolerance research. However, our work focused mainly on Cor8 gene expression and selected physiological traits. Future studies should further explore the regulatory networks and screen additional cold-tolerance-related genes to better understand the genetic basis of the mutant’s enhanced cold hardiness and support breeding of cold-resistant citrus varieties.

Author Contributions

Conceptualization, N.L., Y.Z. and D.L.; methodology, S.W.; software, S.W. and W.L.; validation, S.W., X.L. and B.Z.; formal analysis, S.W. and W.L.; investigation, S.W. and B.Z.; resources, D.L., N.L., S.D. and Y.Z.; data curation, S.W.; writing—original draft preparation, S.W.; writing—review and editing, S.W., N.L. and W.L.; visualization, S.W., N.L. and Y.Z.; supervision, D.L., S.D., Y.Z. and N.L.; project administration, N.L.; funding acquisition, N.L. and D.L. All authors have read and agreed to the published version of the manuscript.

Funding

This work was supported by the Hunan Provincial Natural Science Foundation of China (2024JJ7226), China Agriculture Research System (CARS-26), and Hunan Agriculture Research System (HARS-09).

Data Availability Statement

The datasets generated and analyzed during the current study are available from the corresponding authors upon reasonable request.

Conflicts of Interest

The authors declare no conflicts of interest.

Abbreviations

The following abbreviations are used in this manuscript:
CATCatalase (enzyme)
CTRCellular structural tightness
H2O2Hydrogen peroxide
MDAMalondialdehyde
MTMutant type
PODPeroxidase
ProProline
ROSReactive oxygen species
SRCellular structural relaxation
SODSuperoxide dismutase
WTWild type

Appendix A

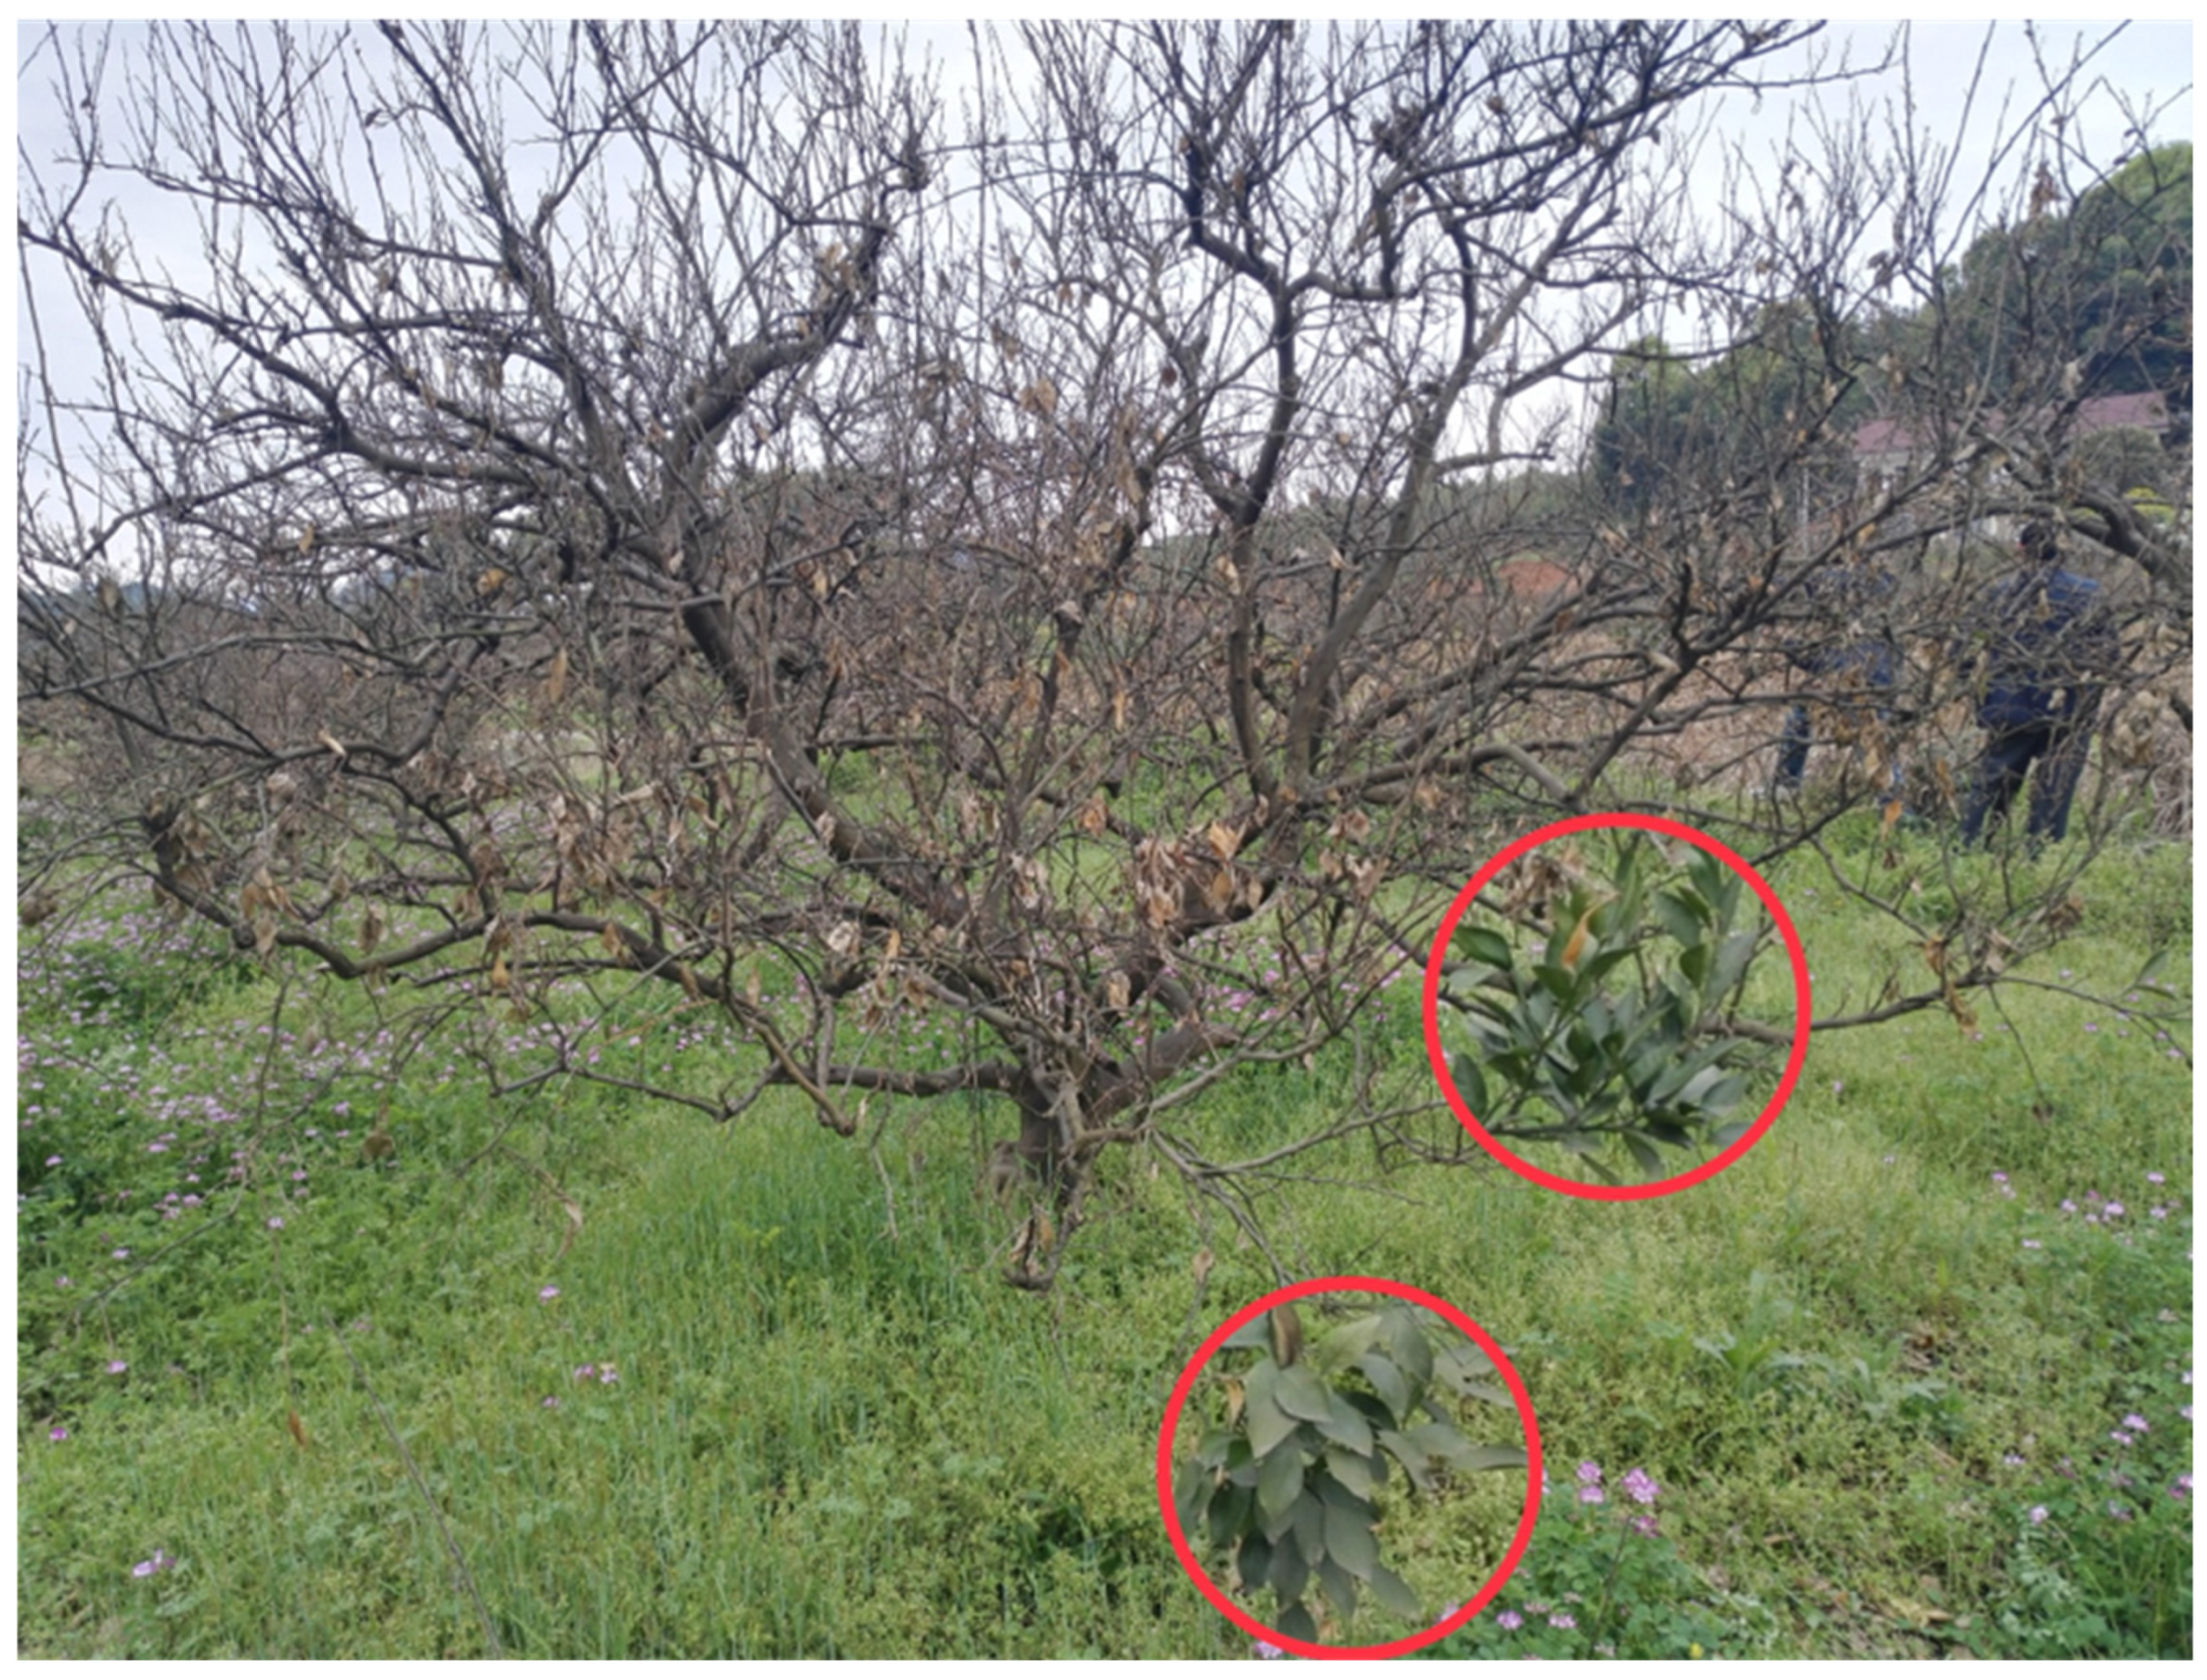
Appendix A.1. ‘Miyagawa’ Mutant Female Parent

Figure A1. Branches of ‘Miyagawa’ cold-tolerant mutant type. Cold-tolerant mutant branches of ‘Miyagawa’ are circled in red.
Agronomy 15 01570 g0a1

Appendix A.2. Phenotypic Dynamics of Isolated Leaves of ‘Miyagawa’ Mutant at Different Time Points Under Low-Temperature Treatment

Figure A2. Phenotypic dynamics of ‘Miyagawa’ wild-type and mutant-type isolated spring leaves at different low-temperature treatment times. The red frames mark the spring leaves with significant differences in performance.
Agronomy 15 01570 g0a2

Appendix A.3. Dynamic Expression of the ‘Miyagawa’ Mutant Cor8 Gene During Natural Overwintering

Figure A3. Temperature changes and Cor8 gene expression during natural overwintering temperature variation during natural overwintering.
Agronomy 15 01570 g0a3

References

  1. Vives-Peris, V.; Pérez-Clemente, R.M.; Gómez-Cadenas, A.; López-Climent, M.F. Involvement of citrus shoots in response and tolerance to abiotic stress. Hortic. Adv. 2024, 2, 3. [Google Scholar] [CrossRef]
  2. Khan, M.; Dahro, B.; Wang, Y.; Wang, M.; Xiao, W.; Qu, J.; Zeng, Y.; Fang, T.; Xiao, P.; Xu, X.; et al. The transcription factor ERF110 promotes cold tolerance by directly regulating sugar and sterol biosynthesis in citrus. Plant J. 2024, 119, 2385–2401. [Google Scholar] [CrossRef]
  3. Xiao, C.; He, L.; Qiu, W.; Wang, Z.; He, X.; Xiao, Y.; Sun, Z.; Tong, Z.; Jiang, Y. Guijing2501 (Citrus unshiu) has stronger cold tolerance due to higher photoprotective capacity as revealed by comparative transcriptomic and physiological analysis and overexpression of early light-induced protein. Int. J. Mol. Sci. 2023, 24, 15956. [Google Scholar] [CrossRef] [PubMed]
  4. Zhang, F.; Wang, Q.; Luo, J.; Gentile, A.; Long, G.; Deng, Z.; Li, D.; Li, N. ‘Juxiangyuan’ seedless orange: A new mutant with male and female sterility. Horticulturae 2024, 10, 350. [Google Scholar] [CrossRef]
  5. Liu, S.; Xu, Y.; Yang, K.; Huang, Y.; Lu, Z.; Chen, S.; Gao, X.; Xiao, G.; Chen, P.; Zeng, X.; et al. Origin and de novo domestication of sweet orange. Nat. Genet. 2025, 57, 754–762. [Google Scholar] [CrossRef] [PubMed]
  6. Yin, P.; Ding, W.; Zhang, H.; Liu, X.; Zhang, H.; Zeng, J.; Xu, J. Morphological, physiological and molecular characteristics of the seedless ‘Hongjiangcheng’ sweet orange. Hortic. Plant J. 2023, 9, 437–449. [Google Scholar] [CrossRef]
  7. Kaur, R.; Kaur, N.; Singh, H. Pericarp and pedicel anatomy in relation to fruit cracking in lemon (Citrus limon L. Burm.). Sci. Hortic. 2019, 246, 462–468. [Google Scholar] [CrossRef]
  8. Schreiber, S.G.; Hamann, A.; Hacke, U.G.; Thomas, B.R. Sixteen years of winter stress: An assessment of cold hardiness, growth performance and survival of hybrid poplar clones at a boreal planting site. Plant Cell Environ. 2013, 36, 419–428. [Google Scholar] [CrossRef]
  9. Meng, S.Y.; Lǚ, G.Y.; Zhang, M.Z.; Zhang, Z.H.; Wei, Y.; Wang, H.T. Liu, X.M. Physiological response to cold stress and evaluation of cold resistance for five species of Euonymus linn. Acta Bot. Boreal.-Occident. Sin. 2020, 40, 11. [Google Scholar]
  10. Gu, K.; Hou, S.; Chen, J.; Guo, J.; Wang, F.; He, C.; Zou, C.; Xie, X. The physiological response of different tobacco varieties to chilling stress during the vigorous growing period. Sci. Rep. 2021, 11, 22136. [Google Scholar] [CrossRef]
  11. Zhang, F.; Lu, K.; Gu, Y.; Zhang, L.; Li, W.; Li, Z. Effects of low-temperature stress and brassinolide application on the photosynthesis and leaf structure of tung tree seedlings. Front. Plant Sci. 2020, 10, 1767. [Google Scholar] [CrossRef] [PubMed]
  12. Zeng, J.L.; Deng, Q.E.; Li, J.A.; Cheng, J.Y.; Deng, X.Z.; Jiang, D.Z. Relationship between leaf anatomic structure and cold tolerancein six Camellia oleifera cultivars. Non-Wood For. Res. 2020, 38, 8. [Google Scholar]
  13. Tan, Y.Y.; Jin, X.L.; Yu, Q.X.; Sun, L.X. Screening of leaf cold-resistant structural indexes and cold-resistance evaluation of five Michelia species. Guihaia 2021, 41, 1296–1305. [Google Scholar]
  14. Jiang, J.; Zhang, N.; Srivastava, A.K.; He, G.; Tai, Z.; Wang, Z.; Yang, S.; Xie, X.; Li, X. Superoxide dismutase positively regulates Cu/Zn toxicity tolerance in Sorghum bicolor by interacting with Cu chaperone for superoxide dismutase. J. Hazard. Mater. 2024, 480, 135828. [Google Scholar] [CrossRef]
  15. Rao, M.J.; Ahmed, U.; Ahmed, M.H.; Duan, M.; Wang, J.; Wang, Y.; Wang, L. Comparison and quantification of metabolites and their antioxidant activities in young and mature leaves of sugarcane. ACS Food Sci. Technol. 2021, 1, 362–373. [Google Scholar] [CrossRef]
  16. Rao, M.J.; Tahir ul Qamar, M.; Wang, D.; Ali, Q.; Ma, L.; Han, S.; Duan, M.; Hu, L.; Wang, L. A high-throughput lipidomics and transcriptomic approach reveals novel compounds from sugarcane linked with promising therapeutic potential against COVID-19. Front. Nutr. 2022, 9, 988249. [Google Scholar] [CrossRef] [PubMed]
  17. Rao, M.J.; Wu, S.; Duan, M.; Wang, L. Antioxidant metabolites in primitive, wild, and cultivated citrus and their role in stress tolerance. Molecules 2021, 26, 5801. [Google Scholar] [CrossRef]
  18. Gubanova, T.B.; Paliy, A.E. Physiological and biochemical aspects of frost resistance in Olea europaea L. Russ. J. Plant Physiol. 2020, 67, 671–679. [Google Scholar]
  19. Herrera, C.M.; Voss, B.J.; Trent, M.S. Homeoviscous adaptation of the acinetobacter baumannii outer membrane: Alteration of lipooligosaccharide structure during cold stress. mBio 2021, 12, e0129521. [Google Scholar] [CrossRef]
  20. Manchanda, P.; Chaudhary, P.; Deswal, R. Photosynthesis regulation, cell membrane stabilization and methylglyoxal detoxification seems major altered pathways under cold stress as revealed by integrated multi-omics meta-analysis. Physiol. Mol. Biol. Plants 2023, 29, 1395–1407. [Google Scholar] [CrossRef]
  21. Mishra, G.; Mohapatra, S.K.; Rout, G.R. Plant membrane transporters function under abiotic stresses: A review. Planta 2024, 260, 125. [Google Scholar] [CrossRef] [PubMed]
  22. Li, D.; Bodjrenou, D.M.; Zhang, S.; Wang, B.; Pan, H.; Yeh, K.-W.; Lai, Z.; Cheng, C. The endophytic fungus piriformospora indica reprograms banana to cold resistance. Int. J. Mol. Sci. 2021, 22, 4973. [Google Scholar] [CrossRef]
  23. Choudhury, F.K.; Rivero, R.M.; Blumwald, E.; Mittler, R. Reactive oxygen species, abiotic stress and stress combination. Plant J. 2017, 90, 856–867. [Google Scholar] [CrossRef]
  24. Basal, O.; Zargar, T.B.; Veres, S. Elevated tolerance of both short-term and continuous drought stress during reproductive stages by exogenous application of hydrogen peroxide on soybean. Sci. Rep. 2024, 14, 2200. [Google Scholar] [CrossRef]
  25. Zhang, S.; Shan, Y.; Li, Y.; He, J.; Jiang, Y. Hydrogen peroxide receptors regulate chilling injury of banana fruit during low-temperature storage. Postharvest Biol. Technol. 2024, 214, 112985. [Google Scholar] [CrossRef]
  26. Liu, J.; Wu, H.; Wang, B.; Zhang, Y.; Wang, J.; Cheng, C.; Huang, Y. Exogenous melatonin enhances cold resistance by improving antioxidant defense and cold-responsive genes’ expression in banana. Horticulturae 2022, 8, 260. [Google Scholar] [CrossRef]
  27. Li, M.; Yue, T.; Han, J.; Wang, J.; Xiao, H.; Shang, F. Exogenous glucose irrigation alleviates cold stress by regulating soluble sugars, ABA and photosynthesis in melon seedlings. Plant Physiol. Biochem. 2024, 217, 109214. [Google Scholar] [CrossRef] [PubMed]
  28. Cherry, J.H.; Locy, R.D.; Rychter, A. Plant Tolerance to Abiotic Stresses in Agriculture: Role of Genetic Engineering; Springer: Dordrecht, The Netherlands, 2000. [Google Scholar] [CrossRef]
  29. Zalunskaitė, I.; Rugienius, R.; Gelvonauskienė, D.; Bendokas, V.; Vinskienė, J.; Stanys, V. Cloning properties of cold induced COR47 gene and investigation of its homologs. Sodinink. Ir Darzinink. 2006, 25, 25–31. [Google Scholar]
  30. Ma, X.; Chen, C.; Yang, M.; Dong, X.; Lv, W.; Meng, Q. Cold-regulated protein (SlCOR413IM1) confers chilling stress tolerance in tomato plants. Plant Physiol. Biochem. 2018, 124, 29–39. [Google Scholar] [CrossRef]
  31. Tang, K.; Zhao, L.; Ren, Y.; Yang, S.; Zhu, J.K.; Zhao, C. The transcription factor ICE1 functions in cold stress response by binding to the promoters of CBF and COR genes. J. Integr. Plant Biol. 2020, 62, 258–263. [Google Scholar] [CrossRef]
  32. Zhang, X.C.; Wang, L.H.; Ni, H.Z. 2016 spring citrus freeze damage survey in Huangyan district. Zhejiang Citrus 2016, 33, 17–18. [Google Scholar]
  33. Shuai, H.L.; Yang, T.X.; Wei, A.Z.; Wang, J.; Li, X.; Zhang, Y. A modified technique of paraffin section for apricot flower buds. J. Fruit Sci. 2011, 28, 536–539+552. [Google Scholar]
  34. Hou, R.P.; Jiang, J.L.; Yang, N.; Li, L.; Deng, J.R.; Ding, D.K.; Sun, W.; Dong, Y.X. Physiological response and cold resistance evaluation of eight species ofcitrus under low temperature stress. Mol. Plant Breed. 2021, 19, 2013–2022. [Google Scholar]
  35. Yang, N.; Jiang, J.L.; Li, L.; Hou, R.P.; Ding, D.K.; Deng, J.R. Physiological response and evaluation of cold resistance of three citrus varieties citrus under low temperature stress. China Fruits 2020, 5, 32–39+143. [Google Scholar]
  36. Xu, G.; Li, L.; Zhou, J.; Lyu, D.; Zhao, D.; Qin, S. Comparison of transcriptome and metabolome analysis revealed differences in cold resistant metabolic pathways in different apple cultivars under low temperature stress. Hortic. Plant J. 2023, 9, 183–198. [Google Scholar] [CrossRef]
  37. Li, L.; Yang, B.; Zhao, X.; Wang, P.; Lyu, D.; Qin, S. Auxin participates in the regulation of the antioxidant system in malus baccata borkh. roots under sub-low temperature by exogenous sucrose application. Horticulturae 2023, 9, 297. [Google Scholar] [CrossRef]
  38. He, J.; Li, H.; Ma, C.; Zhang, Y.; Polle, A.; Rennenberg, H.; Cheng, X.; Luo, Z.B. Overexpression of bacterial g-glutamylcysteine synthetase mediates changes in cadmium influx, allocation and detoxification in poplar. New Phytol. 2015, 205, 240–245. [Google Scholar] [CrossRef]
  39. Zhou, J.; Wan, H.; He, J.; Lyu, D.; Li, H. Integration of cadmium accumulation, subcellular distribution, and physiological responses to understand cadmium tolerance in apple rootstocks. Front. Plant Sci. 2017, 8, 966. [Google Scholar]
  40. Xu, G.; He, M.; Zhao, D.; Lyu, D.; Qin, S. Physiological and structural changes in apple tree branches of different varieties during dormancy. Horticulturae 2023, 9, 947. [Google Scholar] [CrossRef]
  41. Zhang, C.M. Structure and Expression Analysis of Gene Cor8 in Different Citrus Genotypes with Different Cold Tolerance Subjected to Cold Acclimation. Master’s Thesis, Hunan Agricultural University, Changsha, China, 2021. [Google Scholar]
  42. Saijo, Y.; Loo, E.P.-i. Plant immunity in signal integration between biotic and abiotic stress responses. New Phytol. 2020, 225, 87–104. [Google Scholar] [CrossRef]
  43. Sharma, A.; Kapoor, D.; Gautam, S.; Landi, M.; Kandhol, N.; Araniti, F.; Ramakrishnan, M.; Satish, L.; Singh, V.P.; Sharma, P.; et al. Heavy metal induced regulation of plant biology: Recent insights. Physiol. Plant. 2022, 174, e13688. [Google Scholar] [CrossRef] [PubMed]
  44. Zhang, H.; Zhu, J.; Gong, Z.; Zhu, J.-K. Abiotic stress responses in plants. Nat. Rev. Genet. 2022, 23, 104–119. [Google Scholar] [CrossRef] [PubMed]
  45. Zou, J.L.; Li, N.; Yan, Y.Y.; Gou, J.; Wang, C.; Huang, W.; Gong, L.; Long, G.Y. Preliminary identification and evaluation of putative cold- resistant mutant in Newhall Navel orange. J. Fruit Sci. 2022, 39, 1183–1190. [Google Scholar]
  46. Liu, X.H.; Wang, H.H. Relationship between cellular structure and physiological characteristics of banana leaf tissues and cold hardiness. J. Fujian Agric. Coll. 1990, 19, 5. [Google Scholar]
  47. Kang, Z.; Cai, H.; Guo, G.; Zeng, H.; Wang, W.; Tu, X. Physiological response of macadamia (Macadamia integrifolia) seedlings to drought stress. Horticulturae 2025, 11, 347. [Google Scholar] [CrossRef]
  48. Khanna, K.; Bhardwaj, R.; Alam, P.; Reiter, R.J.; Ahmad, P. Phytomelatonin: A master regulator for plant oxidative stress management. Plant Physiol. Biochem. 2023, 196, 260–269. [Google Scholar] [CrossRef]
  49. Zeng, L.; Wang, Y.-H.; Ai, C.-X.; Zhang, H.; Huang, Y.-C.; Zou, W.-G. Different cold tolerances among three strains of large yellow croaker: Related to antioxidant defense and energy metabolism. Fish Physiol. Biochem. 2023, 49, 471–486. [Google Scholar] [CrossRef]
  50. Marta, B.; Szafrańska, K.; Posmyk, M.M. Exogenous melatonin improves antioxidant defense in cucumber seeds (Cucumis sativus L.) germinated under chilling stress. Front. Plant Sci. 2016, 7, 575. [Google Scholar] [CrossRef]
  51. Wu, Z.-X.; Xu, N.-W.; Yang, M.; Li, X.-L.; Han, J.-L.; Lin, X.-H.; Yang, Q.; Lv, G.-H.; Wang, J. Responses of photosynthesis, antioxidant enzymes, and related gene expression to nicosulfuron stress in sweet maize (Zea mays L.). Environ. Sci. Pollut. Res. 2022, 29, 37248–37265. [Google Scholar] [CrossRef]
  52. Sodhi, G.K.; Saxena, S. Plant growth-promoting endophyte Nigrospora oryzae mitigates abiotic stress in rice (Oryza sativa L.). FEMS Microbiol. Ecol. 2023, 99, fiad094. [Google Scholar] [CrossRef]
  53. Jing, J.; Liu, M.; Yin, B.; Liang, B.; Li, Z.; Zhang, X.; Xu, J.; Zhou, S. Effects of 10 dwarfing interstocks on cold resistance of ‘tianhong 2’ apple. Horticulturae 2023, 9, 827. [Google Scholar] [CrossRef]
  54. Agurla, S.; Gahir, S.; Munemasa, S.; Murata, Y.; Raghavendra, A.S. Mechanism of stomatal closure in plants exposed to drought and cold stress. Adv. Exp. Med. Biol. 2018, 1081, 215–232. [Google Scholar]
  55. Wang, R.; Liu, J.P.; Zhao, H.Q. Evaluation of cold resistance of Piper spp. in Hainan. J. Trop. Biol. 2013, 4, 119–123. [Google Scholar]
  56. Devireddy, A.R.; Tschaplinski, T.J.; Tuskan, G.A.; Muchero, W.; Chen, J.G. Role of reactive oxygen species and hormones in plant responses to temperature changes. Int. J. Mol. Sci. 2021, 22, 8843. [Google Scholar] [CrossRef]
  57. Mittler, R.; Zandalinas, S.I.; Fichman, Y.; Van Breusegem, F. Reactive oxygen species signalling in plant stress responses. Nat. Rev. Mol. Cell Biol. 2022, 23, 663–679. [Google Scholar] [CrossRef]
  58. Wang, J.-W.; Ma, L.-Y.; Gómez-del-Campo, M.; Zhang, D.-S.; Deng, Y.; Jia, Z.-K. Youth tree behavior of olive (Olea europaea L.) cultivars in Wudu, China: Cold and drought resistance, growth, fruit production, and oil quality. Sci. Hortic. 2018, 236, 106–122. [Google Scholar] [CrossRef]
  59. Zhang, Y.; Li, Y.; Yang, J.; Yang, X.; Chen, S.; Xie, Z.; Zhang, M.; Huang, Y.; Zhang, J.; Huang, X. Genome-wide analysis and expression of cyclic nucleotide–gated ion channel (cngc) family genes under cold stress in mango (Mangifera indica). Plants 2023, 12, 592. [Google Scholar] [CrossRef] [PubMed]
  60. Chen, B.; Shi, J.C.; Li, Y.C. Cold resistance of Zelkova sinica under low temperature stress. J. West China For. Sci. 2019, 48, 6. [Google Scholar]
  61. Shi, Q.H.; Gao, J.S.; Wang, J.; Fu, Y.Q. Determination and evaluation of cold resistance of 5 poplar clones. Acta Bot. Boreal.-Occident. Sin. 2003, 23, 5. [Google Scholar]
  62. Yu, M.; Luobu, Z.; Zhuoga, D.; Wei, X.; Tang, Y. Advances in plant response to low-temperature stress. Plant Growth Regul. 2025, 105, 167–185. [Google Scholar] [CrossRef]
  63. Renzetti, M.; Funck, D.; Trovato, M. Proline and ROS: A unified mechanism in plant development and stress response? Plants 2025, 14, 2. [Google Scholar] [CrossRef] [PubMed]
  64. Du, W.H.; Zhang, C.Z. Evaluation of physiological and biochemical indicators of cold resistance in forage-type small rye varieties (lines). Acta Agric. Boreali-Occident. Sin. 2024, 33, 2231–2243. [Google Scholar]
  65. Zhao, G.L.; Tang, J.Q.; Li, R.T.; Bu, Q.Y.; Lǔ, Z.Q. Molecular mechanism of ICE-CBF-COR-mediated cold tolerance regulationin plants under cold stress: A review. Chin. Agric. Sci. Bull. 2025, 41, 132–139. [Google Scholar]
  66. Aslam, M.; Fakher, B.; Ashraf, M.A.; Cheng, Y.; Wang, B.; Qin, Y. Plant low-temperature stress: Signaling and response. Agronomy 2022, 12, 702. [Google Scholar] [CrossRef]
Figure 1. Phenotypic dynamics of ‘Miyagawa’ wild type and mutant type at different low-temperature treatment times.
Agronomy 15 01570 g001
Figure 2. Organizational structure of ‘Miyagawa’ wild type and mutant leaves. Pt, palisade tissue; St, spongy tissue.
Agronomy 15 01570 g002
Figure 3. Relative electrical conductivity of wild type and mutant type; * indicates significant differences (p < 0.05); ns indicates no significant difference (p > 0.05).
Agronomy 15 01570 g003
Figure 4. Changes in antioxidant enzyme activities in ‘Miyagawa’ wild type and mutant type: (A) changes in superoxide dismutase activity (SOD), (B) changes in peroxidase activity (POD), and (C) changes in catalase activity (CAT); * indicates significant differences (p < 0.05).
Agronomy 15 01570 g004
Figure 5. Changes in the content of cell damage indicators in ‘Miyagawa’ wild type and mutant type: (A) changes in hydrogen peroxide content (H2O2) and (B) changes in malondialdehyde content (MDA); * indicates significant differences (p < 0.05).
Agronomy 15 01570 g005
Figure 6. The proline content in wild type and mutant type; * indicates significant differences (p < 0.05).
Agronomy 15 01570 g006
Figure 7. Dynamic expression of the Cor8 gene in ‘Miyagawa’ wild type (WT) and mutant type (MT) citrus during natural overwintering. Bar heights represent mean expression levels ± SD across six sampling dates from December 2024 to February 2025. Asterisks indicate statistically significant differences between WT and MT at each time point (* p < 0.05, ** p < 0.01, and *** p < 0.001). Minimum daily temperatures corresponding to each sampling date are shown below the x-axis.
Agronomy 15 01570 g007
Table 1. PCR reaction system.
ComponentsVolume (μL)
2 × Universal SYBR qPCR Master Mix5
cDNA1
Upstream primer0.2
Downstream primer0.2
Sterilized water3.6
Table 2. Cor8 gene quantitative PCR primers.
Primer NamePrimer Sequence
Actin-FCACACTGGAGTGATGGTTGG
Actin-RATTGGCCTTGGGGTTAAGAG
Cor8-q-FTGGTTGCTCCCAGTTT
Cor8-q-RGCCCAGGCAGGATAGA
Table 3. Comparison of ‘Miyagawa’ wild-type and mutant leaf tissue structure.
GenotypesFence Tissue Thickness (μm)Spongy Tissue Thickness (μm)Blade Thickness (μm)Cellular Structural TightnessCell Structure RelaxationRatio of Fenestrated to Spongy Tissue
WT61.08 ± 2.96176.44 ± 6.81264.2 ± 7.010.23 ± 0.010.67 ± 0.020.35 ± 0.01
MT94.1 ± 2.68 ***195.12 ± 8.12 **321.05 ± 6.74 ***0.3 ± 0.01 ***0.61 ± 0.01 ***0.48 ± 0.03 ***
Note: Asterisks indicate significant differences (** p < 0.01, and *** p < 0.001); cellular structural tightness (CTR) is the ratio of fenestrated tissue to leaf thickness; cellular structural relaxation (SR) is the ratio of spongy tissue to leaf thickness; WT stands for ‘Miyagawa’ wild type; MT stands for ‘Miyagawa’ mutant type.
Table 4. Correlation coefficients between Cor8 gene expression levels and average temperature conditions (mean, maximum, and minimum) across varying weather windows in ‘Miyagawa’ wild type (WT) and mutant type (MT) citrus.
TypeWeather_Window_DaysMean_TempMax_TempMin_Temp
WT10−0.89 *−0.66−0.96 **
9−0.86 *−0.67−0.94 **
8−0.81 *−0.64−0.91 *
7−0.86 *−0.71−0.94 **
6−0.83 *−0.67−0.91 *
5−0.81 *−0.69−0.88 *
4−0.8 *−0.67−0.88 *
3−0.75−0.64−0.81 *
2−0.64−0.4−0.76
1−0.410.11−0.67
MT10−0.74−0.64−0.71
9−0.77−0.68−0.75
8−0.76−0.68−0.76
7−0.74−0.65−0.77
6−0.68−0.55−0.76
5−0.66−0.51−0.77
4−0.66−0.52−0.77
3−0.67−0.51−0.8 *
2−0.61−0.28−0.8 *
1−0.68−0.18−0.88 *
1−0.68−0.18−0.88 *
Note: A weather window of 1 day reflects only the temperature on the day of gene expression measurement, while a window of 10 days includes the current day and the preceding 9 days. Asterisks indicate statistical significance of the correlation coefficients (* p < 0.05, ** p < 0.01).
Disclaimer/Publisher’s Note: The statements, opinions and data contained in all publications are solely those of the individual author(s) and contributor(s) and not of MDPI and/or the editor(s). MDPI and/or the editor(s) disclaim responsibility for any injury to people or property resulting from any ideas, methods, instructions or products referred to in the content.

