Article

Grade Indicators and Distribution Characteristics of Heat Damage to Summer Maize in the Huang–Huai–Hai Plain

1
Collaborative Innovation Center on Forecast and Evaluation of Meteorological Disasters, School of Atmospheric Sciences, Nanjing University of Information Science and Technology, Nanjing 210044, China
2
State Key Laboratory of Severe Weather Meteorological Science and Technology, Shenyang Institute of Agricultural and Ecological Meteorology, Chinese Academy of Meteorological Sciences, Beijing 100081, China
3
Center of Ecology and Agricultural Meteorology of Inner Mongolia, Hohhot 010051, China
*
Author to whom correspondence should be addressed.
Agronomy 2025, 15(7), 1545; https://doi.org/10.3390/agronomy15071545
Submission received: 20 May 2025 / Revised: 9 June 2025 / Accepted: 20 June 2025 / Published: 25 June 2025

Abstract

Heat damage is a major abiotic stress that affects maize yield and quality. Although the differential impacts of heat damage during various growth stages have been widely documented, the grade levels of heat damage at different growth stages remain insufficiently quantified. In this study, based on daily maximum temperature data and historical disaster records of heat damage from 1980 to 2023, we quantified the grade indicators for heat damage at different growth stages, using disaster inversion and the K-means clustering method. The results identified that the duration thresholds of mild, moderate, and severe heat damage at different growth stages of summer maize are 3–5 days, 6–8 days, and more than 8 days, respectively. Further analysis revealed that the total station ratio of heat damage of summer maize showed a fluctuating upward trend from 1980 to 2023, and the station ratio at different growth stages reached the highest value in 1988, 2002, 2019, 2022, 2013, and 1999, respectively. Additionally, mild heat damage during sowing to maturity stages was found to be more widely distributed spatially and mainly exhibited a slight increasing trend. This study can provide support for enhancing disaster prevention and mitigation capabilities against different levels of heat damage.

1. Introduction

The Sixth Assessment Report of the Intergovernmental Panel on Climate Change (IPCC) states that the global surface temperature from 2001 to 2020 increased by 0.84–1.10 °C compared to the 1850–1990 period [1,2]. Rising temperatures due to global climate change have become one of the major environmental issues of public concern [3,4], posing significant challenges to global ecosystems and human survival [5]. A recent study highlights that global temperatures may rise by more than 1.5 °C within the next decade, which not only jeopardizes the goals of the Paris Agreement but also poses serious threats to global agricultural productivity. As one of the most widely cultivated staple crops worldwide, maize serves as a vital food source in global production and supply systems, and its growth and development are highly susceptible to extreme climate events [6,7].
China’s maize production is the second highest globally, surpassed only by that of the United States. In 2023, China’s maize production accounted for approximately 23.8% of the global total [8]. The Huang–Huai–Hai (HHH) Plain, a traditional grain production region in China, contributes 30–40% of the nation’s total maize yield [9,10]. However, in recent years, persistent high temperatures exceeding the critical temperature thresholds for maize growth have frequently triggered heat damage, thereby inhibiting normal growth and developmental processes [11,12,13,14]. Furthermore, different levels of heat damage can cause varying degrees of damage to the morphology and yield of maize plants: mild heat damage causes leaf curling and wilting with less than 10% yield reduction; moderate heat damage leads to prolonged whole-plant wilting followed by withering, delayed silk emergence of ears, and reduced tassel branching and flowering, resulting in 10–30% yield loss; severe heat damage may cause plant withering, failed silk emergence, diminished tassel vitality with limited flowering, and significant reductions in kernel number per ear and 1000-grain weight, ultimately leading to a decline in yield of over 30% [15,16,17,18,19].
The intensity and duration of heat damage jointly determine the severity of heat damage to summer maize [16,20]. The intensity of heat damage is typically assessed based on specific temperature thresholds, which are mainly derived from controlled experiments and field studies. For instance, Sheng et al. [21] demonstrated through field experiments that when the daily maximum temperature ( T m a x d ) reached 34.8 °C, the net photosynthetic rate of maize leaves during the silking stage and the proportion of ear dry matter both decreased significantly, indicating that this temperature can serve as a critical threshold for adverse effects of high temperature on maize’s physiological characteristics. However, in practical studies where experimental conditions are absent or controlled experiments are challenging to implement, historical disaster records can provide an effective alternative data source for quantitatively identifying the optimal trigger thresholds for heat damage [20,22,23,24]. Currently, relevant studies defining heat damage levels in summer maize are mostly based on the optimal temperature threshold, which is further combined with the duration of heat damage to make a comprehensive classification. Li et al. [25,26] and Wang et al. [27] analyzed the frequency and spatiotemporal distribution characteristics of heat damage during the flowering period of summer maize in Henan Province, based on the criterion of T m a x d ≥ 35 °C and its cumulative duration. Dai et al. [28] classified disaster levels and conducted quantitative monitoring of summer maize risk in Hebei Province by considering the accumulated occurrence time and heat accumulation at T m a x d ≥ 32 °C. Zhang [29] quantified the impacts of different levels of heat damage on maize growth and development at various growth stages in Hebei Province, using T m a x d ≥ 35 °C and its duration as indicators. Zhang et al. [30] and Zhang [15] analyzed the risk probability of heat damage during the flowering period of summer maize in the North China Plain, based on criteria of T m a x d ≥ 35 °C and ≥34 °C, respectively, along with the duration of such conditions. Nevertheless, current research still lacks clear quantitative criteria for the duration of heat damage when defining different classes of heat damage. Specifically, how to accurately classify heat damage according to different temperature thresholds and corresponding durations remains an urgent issue. This not only affects the accuracy of the early warning system for heat damage but also limits the effectiveness of agricultural management measures.
The objectives of this research were as follows: (1) to construct heat damage samples for different growth stages of summer maize using meteorological data and historical disaster records from 1980 to 2023; (2) to determine the grade indicators of heat damage at different growth stages using K-means clustering; (3) to validate the accuracy of heat damage indicators at different levels; and (4) to identify the station ratios, frequency of occurrence, and trends of different grade levels of heat damage in summer maize. This research aims to reveal the spatiotemporal distribution characteristics of different levels of heat damage affecting summer maize, thereby providing scientific support to enhance disaster prevention and mitigation capabilities for summer maize production in the HHH Plain.

2. Materials and Methods
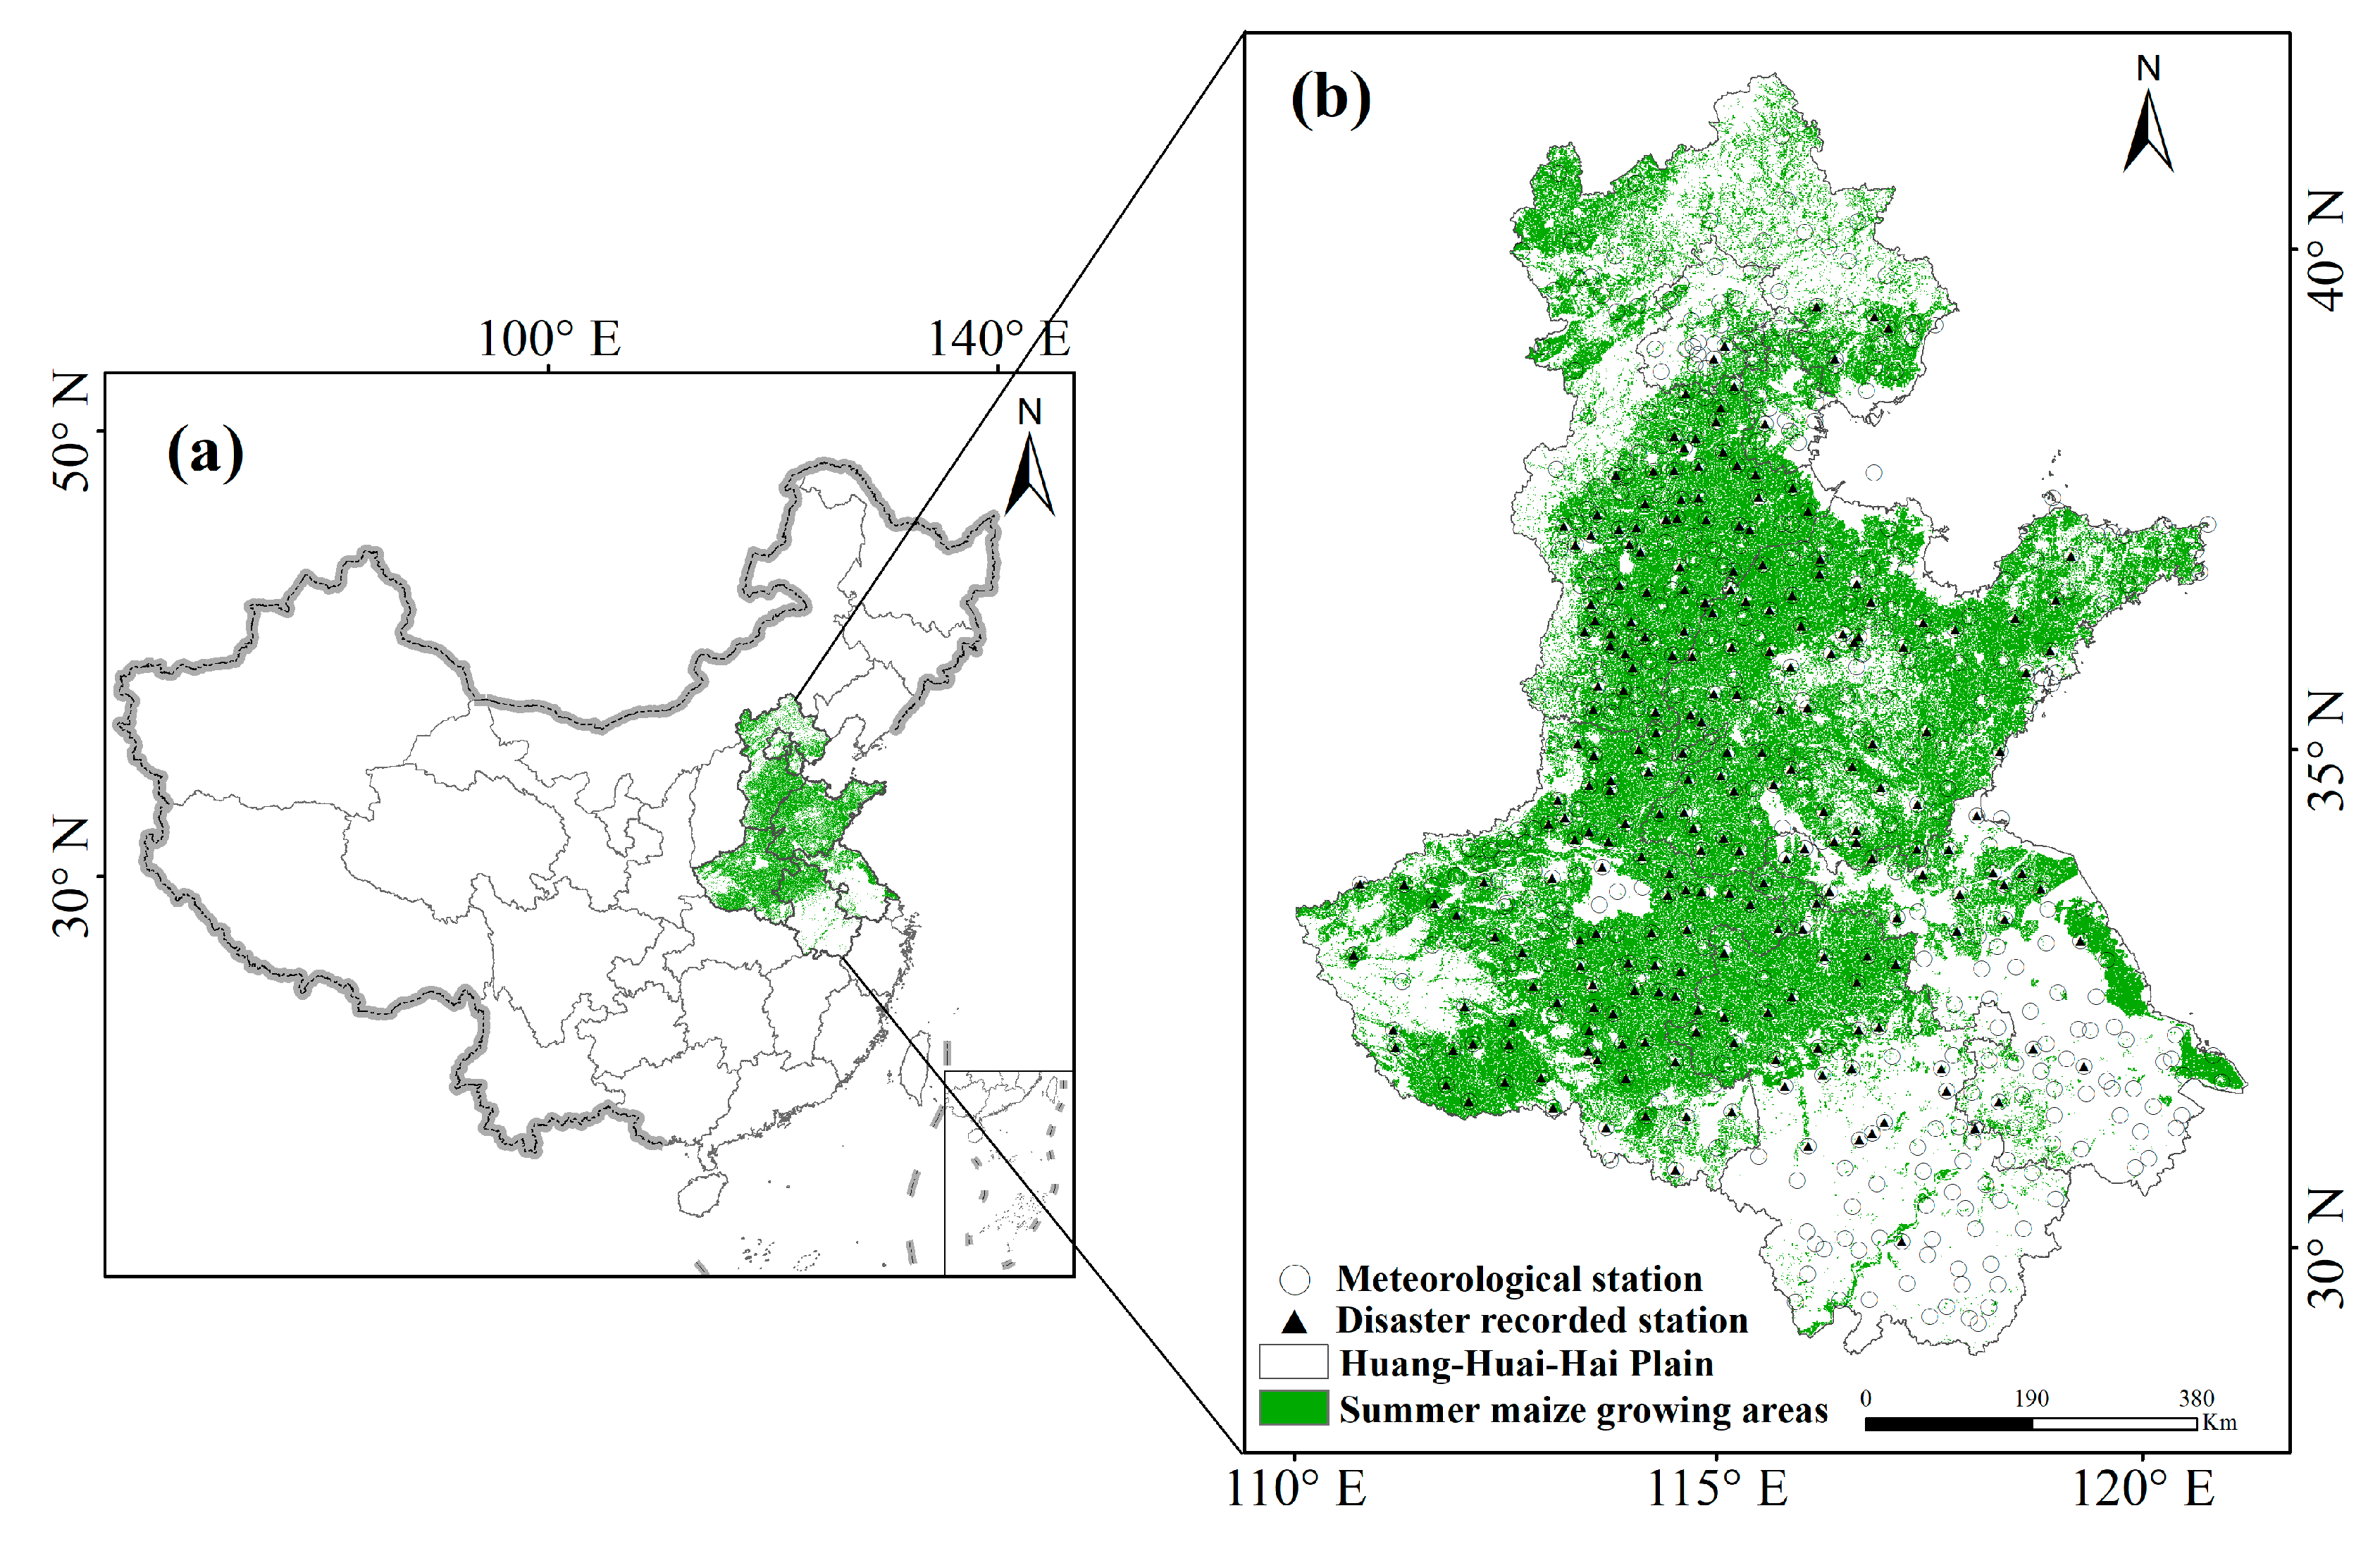
2.1. Study Area

The study area is the HHH Plain (29° N–43° N, 110° E–123° E), covering an area of 1.445 million km2 [10], which encompasses Beijing, Tianjin, Hebei, Shandong, Henan, Jiangsu, and Anhui (Figure 1). This is the second largest plain in China, covering an area of more than 300,000 km2. The region is one of the primary grain-producing areas in China and is commonly referred to as the “granary of China” due to its significant contribution to national food security [31,32]. This region is characterized by a warm-temperate semi-humid climate zone, featuring sufficient solar radiation and accumulated thermal resources [9,10,11,31]. Annual precipitation ranges between 500 and 1000 mm, while mean annual temperatures exhibit a latitudinal gradient, increasing from 2 °C in northern areas to 14.3 °C in southern areas [33,34]. The dominant soil type in the study area is fluvo-aquic soil, classified as Calcaric Cambisol according to the World Reference Base for Soil Resources [31,35].

2.2. Data Sources

2.2.1. Meteorological Data

This study uses daily observations data from 569 meteorological stations from 1980 to 2023, including daily maximum temperature (typically recorded between 14:00 and 15:00 local time), daily minimum temperature, relative humidity, precipitation, wind speed at 10 m height, and sunshine hours, etc. The meteorological datasets were obtained from the National Meteorological Information Centre (https://data.cma.cn/, accessed on 24 March 2024) and have undergone rigorous quality control.

2.2.2. Summer Maize Growing Area Data

The summer maize growing area data were extracted from the land use type dataset, which originated from the China Multi-period Land Use/Land Cover Change Dataset (CNLUCC) provided by the Resource and Environment Science and Data Center of the Chinese Academy of Sciences (https://www.resdc.cn/, last accessed on 20 May 2024). Using ArcMap 10.8, it was identified that summer maize is predominantly cultivated on dryland within the cultivated land category. To minimize the effects of land cover changes, analyses were conducted using imagery from three periods: 2010, 2015, and 2020. By extracting pixel points where the dryland type remained consistent across these three periods [9,10], a comprehensive raster map of dryland was generated, delineating the main growing areas of summer maize in the HHH region (Figure 1a).

2.2.3. Disaster Data

The disaster data for heat damage were collected from the China Meteorological Disaster Yearbook, China Meteorological Disasters Dictionary, the Meteorological Disaster Management System, and the related literature [23,36]. A total of 256 county-level records of summer maize heat damage events from 1980 to 2023 were collected, including information on the time and location of the events. Among these, 72 disaster records contain detailed information on summer maize yield impacts (growth inhibition and yield loss rates), which is useful for validating the heat damage severity levels. The remaining 184 records were used to construct the graded severity indicators for heat damage.

2.3. Methods

2.3.1. Construction of Heat Damage Indicators for Different Grades

Duration and intensity are comprehensive indicators for evaluating heat damage in summer maize [2,36]. Previous studies have identified different growth stages of summer maize and their corresponding heat stress thresholds: the sowing-to-emergence stage (early to mid-June), emergence-to-jointing stage (late June to mid-July), jointing-to-tasseling stage (mid to late July), tasseling-to-flowering stage (early August), flowering-to-milk-ripening stage (mid to late August), and milk-ripening-to-physiological-maturity stage (early to late September). The heat damage thresholds for these respective growth stages were determined as T m a x d ≥ 34 °C, 34.1 °C, 34.6 °C, 34.8 °C, 33.7 °C, and 32.7 °C [9,37]. To determine the comprehensive heat damage indicators, this study reconstructs the consecutive days with T m a x d exceeding the heat damage threshold based on the summer maize heat damage threshold and establishes a sample set of heat damage indicators of different grades.

2.3.2. K-Means Clustering Algorithm

The K-means clustering algorithm, as an unsupervised learning method, partitions data into distinct clusters based on feature similarity, thereby revealing underlying distribution patterns more clearly [38,39]. Due to its simplicity, computational efficiency, and effectiveness in handling large datasets with numerical attributes, K-means has been widely applied in the classification of precipitation regimes and in constructing disaster severity indicators across multiple studies [36,40,41,42]. In this study, we focused on heat damage events lasting two days or more, which were temporally aggregated according to different growth stages (V0, VE, V6, VT, R1, R3, and R6). Based on the duration of heat damage, one-dimensional clustering was performed, using K-means clustering with k = 3 to classify all samples into three initial categories, including mild, moderate, and severe. These advantages made K-means a suitable choice for identifying heat damage severity grades from continuous meteorological variables in our analysis.

2.3.3. Validation of Heat Damage Indicators for Different Grades

Heat damage samples were further derived based on 72 disaster records detailing the damage to summer maize. The duration of heat damage events within the scope of these records was statistically calculated, and the events were classified into mild, moderate, and severe categories by referencing the descriptions of heat damage effects on summer maize, as outlined in Table 1. For example, from 5 August to 16 September 2022, T m a x d ≥ 37 °C, setting a record for the highest number of high-temperature days during the same period in history. The prolonged heat not only affected ear differentiation of maize but also led to male sterility and poor pollen viability, ultimately leading to increased kernel tip abortion, decreased grain-filling rates, and significant yield losses in 2022. By aligning this disaster record with the descriptions in Table 1, this event was classified as a severe heat damage event. Based on the defined heat damage threshold, the actual disaster duration was determined to be 21 days. Thus, a validated sample of severe heat damage in summer maize was established: “2022-8-5-Jiangsu Taixing-21d”. The consistency between the heat damage grade derived from the validation sample set and the disaster description was evaluated. If the two grades were identical, the classification was considered fully consistent; if they differed by no more than one grade, it was deemed generally consistent; and if they differed by two grades, it was considered inconsistent with the actual disaster situation [36,42].

2.3.4. Temporal and Spatial Distribution of Heat Damage

The heat damage station ratio is a statistical ratio of the number of stations with different levels of heat damage to the total number of stations in the study area from 1980 to 2023, which is used to represent the spatial extent of heat damage at different severity levels [36], denoted as N i , and calculated by the following formula:
N i = n N × 100
where n is the number of stations where heat damage occurred, N is the total number of stations in the HHH Plain, and i is the year.
The frequency of heat damage events is used to reflect how often different levels of heat damage occur at a specific station within the study area [15,36]. A higher frequency indicates more frequent occurrences of heat damage in summer maize. It is denoted as N i and is calculated using the following formula:
M i = m M × 100
where m is the number of years in which heat damage occurred at a station, M represents the total number of years for which heat damage was recorded at that station, and i indicates the station in question.
The Mann–Kendall (MK) test is a non-parametric statistical method effective for analyzing trends in time series data [43,44]. It is particularly useful when dealing with data with non-normal or skewed distributions or when dealing with outliers. The following mathematical expression helps to calculate the MK test statistic (S):
S = i = 1 n 1 j = i + 1 n s i g n ( x j x i )
θ = x j x i
s i g n θ = 1         θ > 0 0         θ = 0 1     θ < 0
E ( S ) = 0
V a r ( S ) = n ( n + 1 ) ( 2 n + 5 ) 18
Z = S 1 V a r ( S )         S > 0 0                                       S = 0 S + 1 V a r ( S )       S < 0
The climate tendency rate can be used to indicate the trend of heat damage from 1980 to 2023 [45,46]. In this study, we use a one-dimensional linear regression to fit the temporal trend of heat damage, with the formula expressed as follows:
y = a x + b
where y represents the different grades of heat damage, x is the time series, a is the regression coefficient, and b is the intercept. Significance was tested using the F-test, which establishes an 8-level classification system based on the sign of the regression coefficients and the p-value intervals: when a > 0, it is defined as a very significant increase (4), a significant increase (3), a slight significant increase (2), or a non-significant increase (1), according to p < 0.01, 0.01 ≤ p < 0.05, 0.05 ≤ p < 0.1, and p ≥ 0.1, respectively; when a < 0, the corresponding p-value intervals were defined as a very significant decrease (−4), a significant decrease (−3), a slight significant decrease (−2), or a non-significant decrease (−1) [47,48]. The spatial distribution of heat damage was mapped using ArcGIS 10.8.

3. Results

3.1. Construction and Validation of Heat Damage Grade Indicators

3.1.1. Constructing Grade Indicators for Heat Damage

A modeling dataset of heat damage on summer maize was constructed based on 184 disaster records. K-means clustering was used to classify the duration of heat damage events occurring during different growth stages of summer maize in the HHH Plain. The analysis revealed three distinct clusters, reflecting different levels of heat damage severity, which are defined as mild, moderate, and severe (Table 2). The thresholds for these categories were determined as follows: 3–5 days for mild heat damage, 5–8 days for moderate heat damage, and more than 8 days for severe heat damage.

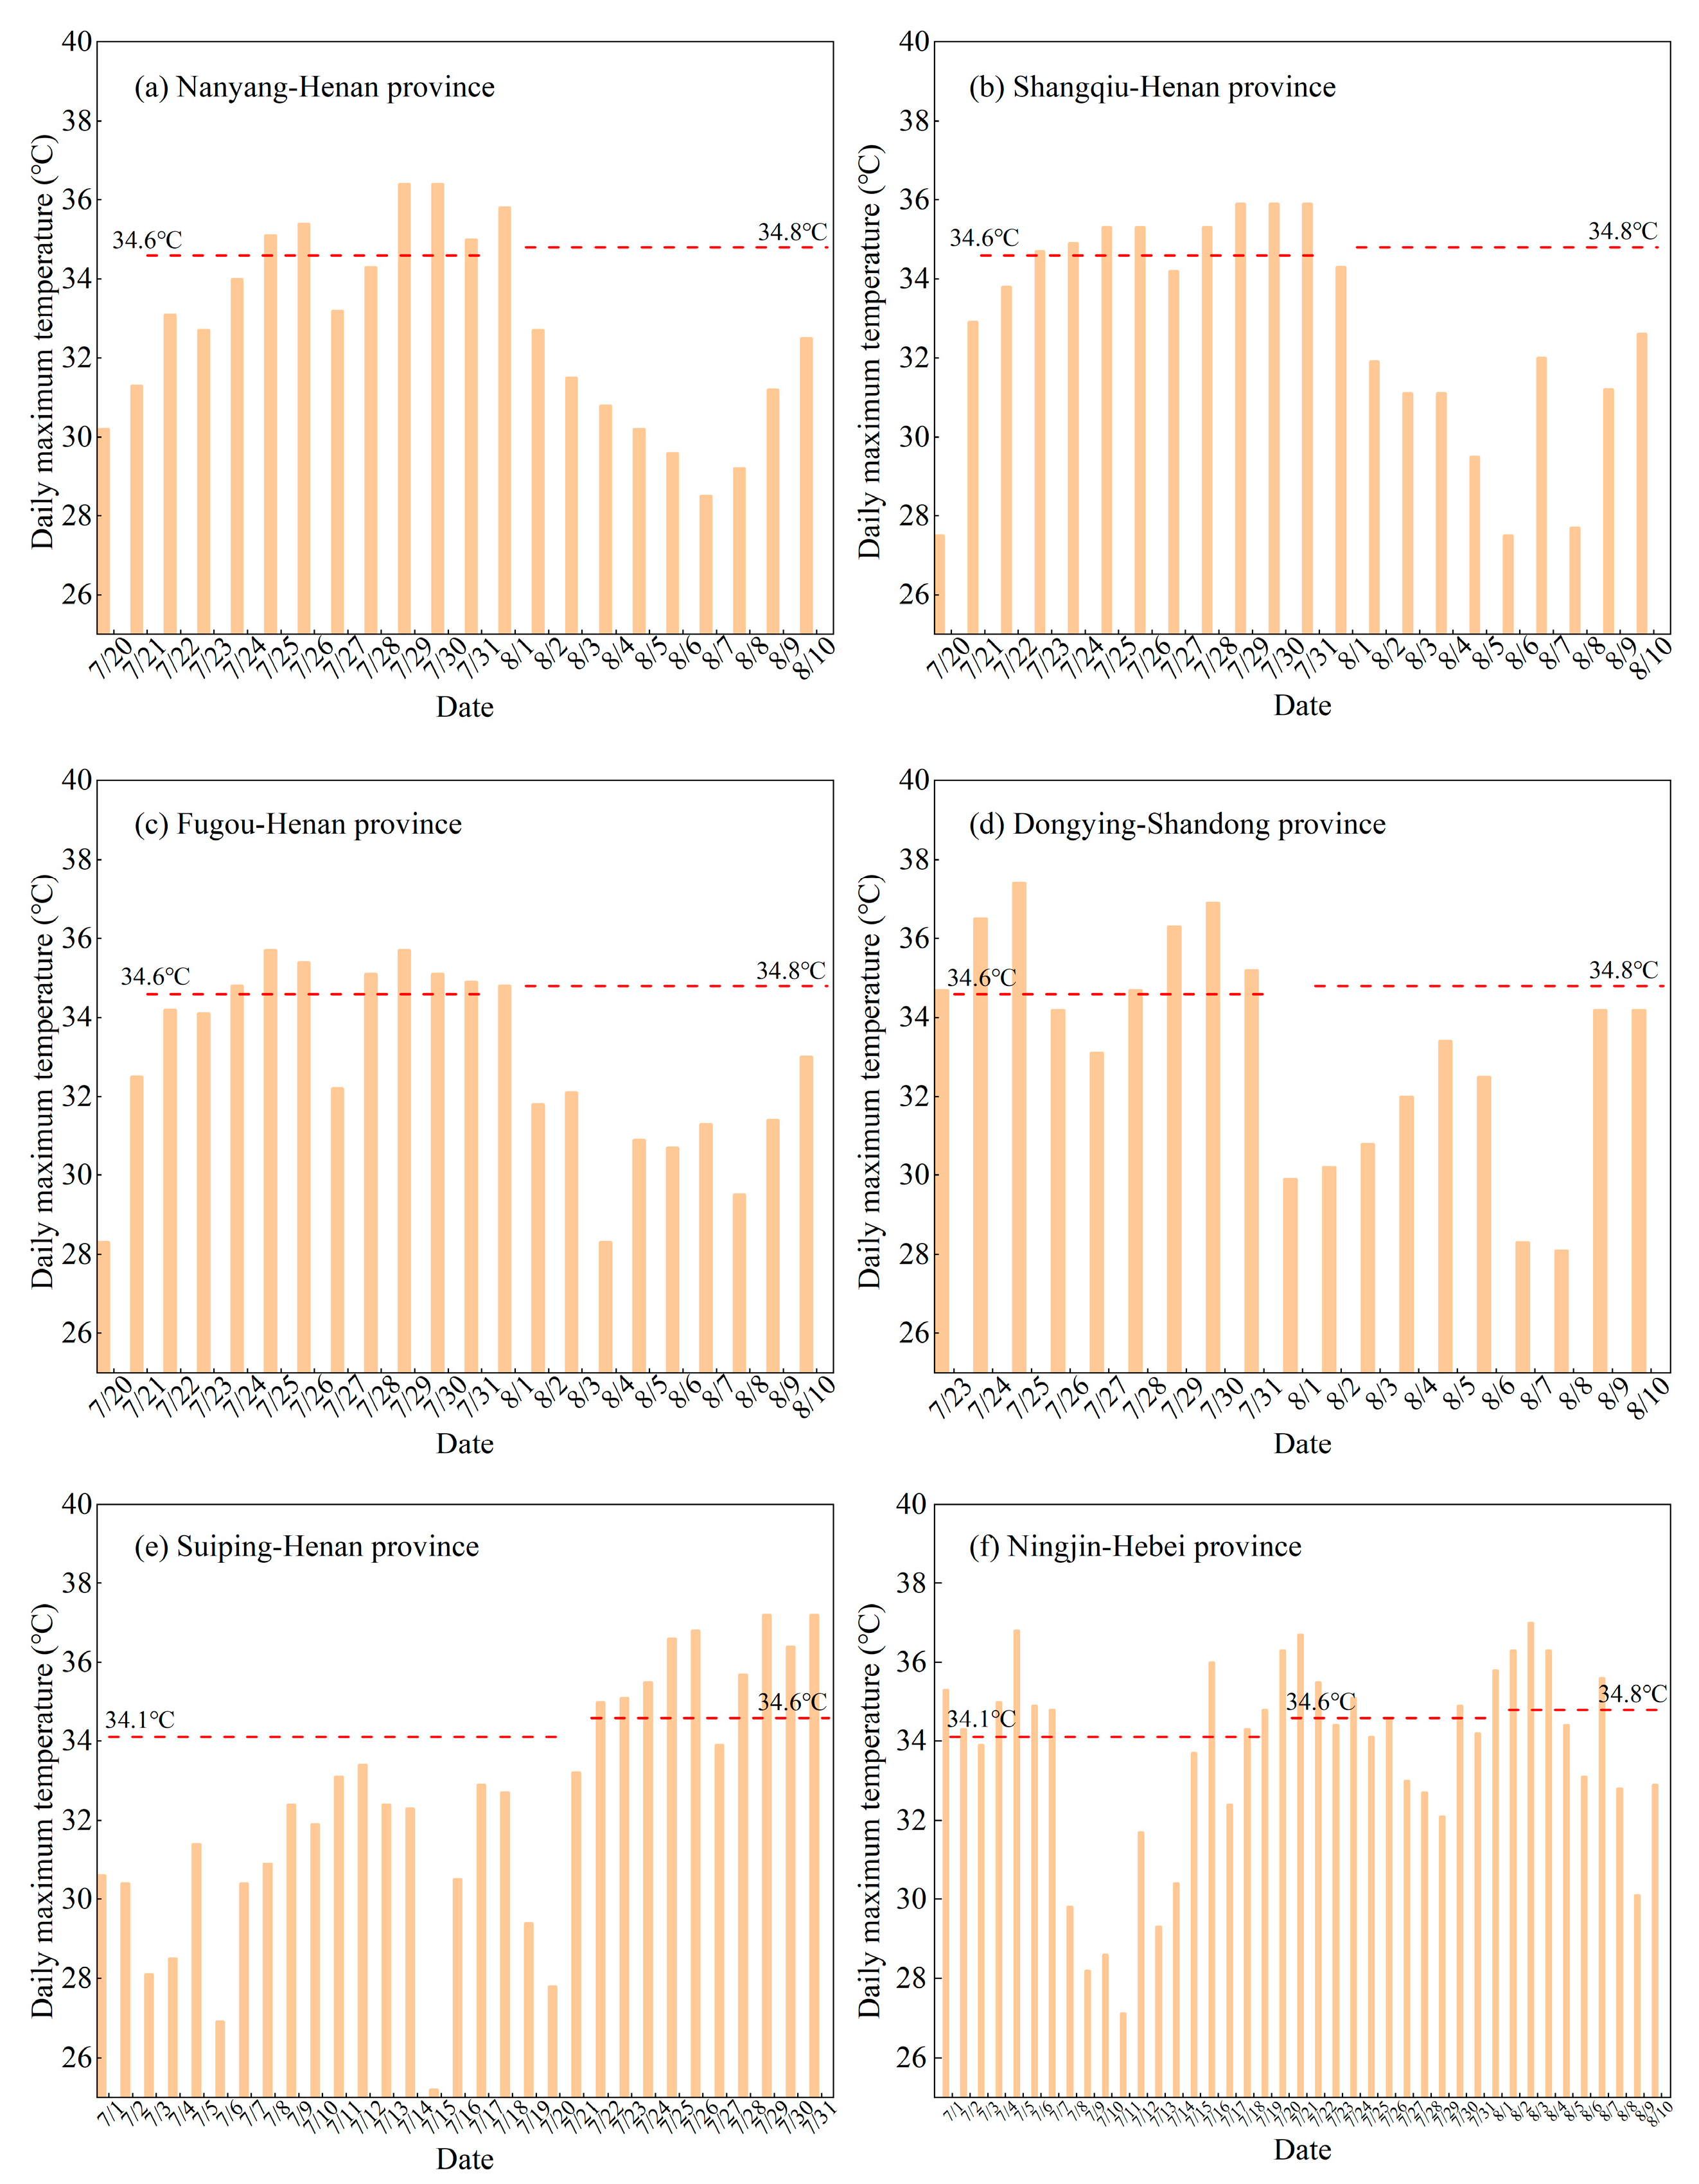
3.1.2. Validation Grade Indicators for Heat Damage

A validation sample for classifying heat damage grades in summer maize was constructed based on 72 disaster records containing heat damage to summer maize and was used to verify the accuracy of the grade indicators (Table 3). Among them, 45 samples were fully consistent with the grades classified by the indicators, while 21 samples were mostly consistent. The overall accuracy was 91.67%. The validation results demonstrate that the grade indicators, which are based on the duration of heat damage analyzed using K-means clustering, can accurately identify the actual heat damage in summer maize.
Severe heat damage in summer maize that did not match the actual disaster conditions occurred in Nanyang, Shangqiu, Fugou, and Suiping in Henan Province, Dongying in Shandong Province, and Ningjin in Hebei Province. The actual daily maximum temperature changes for these regions are plotted in Figure 2. According to the disaster records, severe heat damage occurred in Nanyang, Shangqiu, and Fugou in Henan Province from late July to early August 2016, in Dongying in Shandong Province from 24 July to 4 August 2016, in Suiping in Henan in July 2016, and Ningjin in Hebei Province from July to early August 2018. However, the indicator judgments all indicated more than two mild heat damage events, with each heat damage event lasting 3 to 5 d and an interval of about 1–2 d. It is possible that the actual cumulative effect of multiple heat damage events led to the discrepancy between the indicator judgement and the actual disaster, which may be the reason why the disaster records suggested more severe conditions than the indicator judgement.

3.2. Characteristics of Spatial and Temporal Distribution of Heat Damage

3.2.1. Ratio of Stations with Different Levels of Heat Damage

Figure 3 shows the ratios of meteorological stations in the HHH Plain with different grades of heat damage at different growth stages of summer maize from 1980 to 2023. As shown in Figure 3, during the V0–VE stage, the highest station ratios of mild heat damage in 1988, moderate heat damage in 2002, and severe heat damage in 2005 were 69.72%, 35.74%, and 15.85%, respectively. At the VE–V6 stage, heat damage in summer maize occurred every year, with the highest station ratio of mild heat damage in 2010, moderate heat damage in 2023, and severe heat damage in 1994, which were 77.82%, 48.77%, and 27.64%, respectively. At the V6–VT stage, heat damage in summer maize occurred every year except 1993 and 1998. The highest station ratios were 63.20%, 26.06%, and 35.39% for mild heat damage in 2010, moderate heat damage in 1992, and severe heat damage in 2019, respectively. During the VT–R1 stage, heat damage to summer maize occurred in every year except 1980 and 1991, with the highest station ratios being 55.99% for mild heat damage in 2017, 26.94% for moderate heat damage in 2022, and 27.64% for severe heat damage in 2013. At the R1–R3 stage, mild heat damage in 2013, moderate heat damage in 2022, and severe heat damage in 2020 were the highest with 47.71, 17.08, and 4.58%, respectively. At the R3–R6 stage, mild heat damage in 1998, moderate heat damage in 2020, and severe heat damage in 1995 had the highest station-to-station ratios of 42.96%, 14.44%, and 2.11%, respectively.

3.2.2. The Temporal Changes in the Proportion of Stations Experiencing Different Levels

The temporal changes in the total frequency of heat damage during different growth stages of summer maize in the HHH Plain from 1980 to 2023 are illustrated in Figure 4. The station ratios for different growth stages reached their peak values in 1988, 2002, 2019, 2022, 2013, and 1999, respectively. MK test results indicated that the total frequency of heat damage has shown a fluctuating upward trend at different growth stages of summer maize. Specifically, during the V0–VE stage, the total station ratio of heat damage exhibited a highly significant increasing trend after 2020 (p < 0.01). A similarly significant upward trend was observed during the VE–V6 stage, starting from 1996 (p < 0.01). During the tasseling-to-grain-filling stage, significant increases were observed after 2016 and 2017 (p < 0.01), while for the R1–R3 stage, a significant increasing trend began after 2020 (p < 0.05). These stages are particularly sensitive to heat damage. This sensitivity is mainly due to suppression of pollen viability and hormonal imbalances. These factors collectively lead to delayed panicle development, resulting in smaller spike sizes, reduced assimilated products, and increased seed abortion, ultimately affecting maize kernel yield.

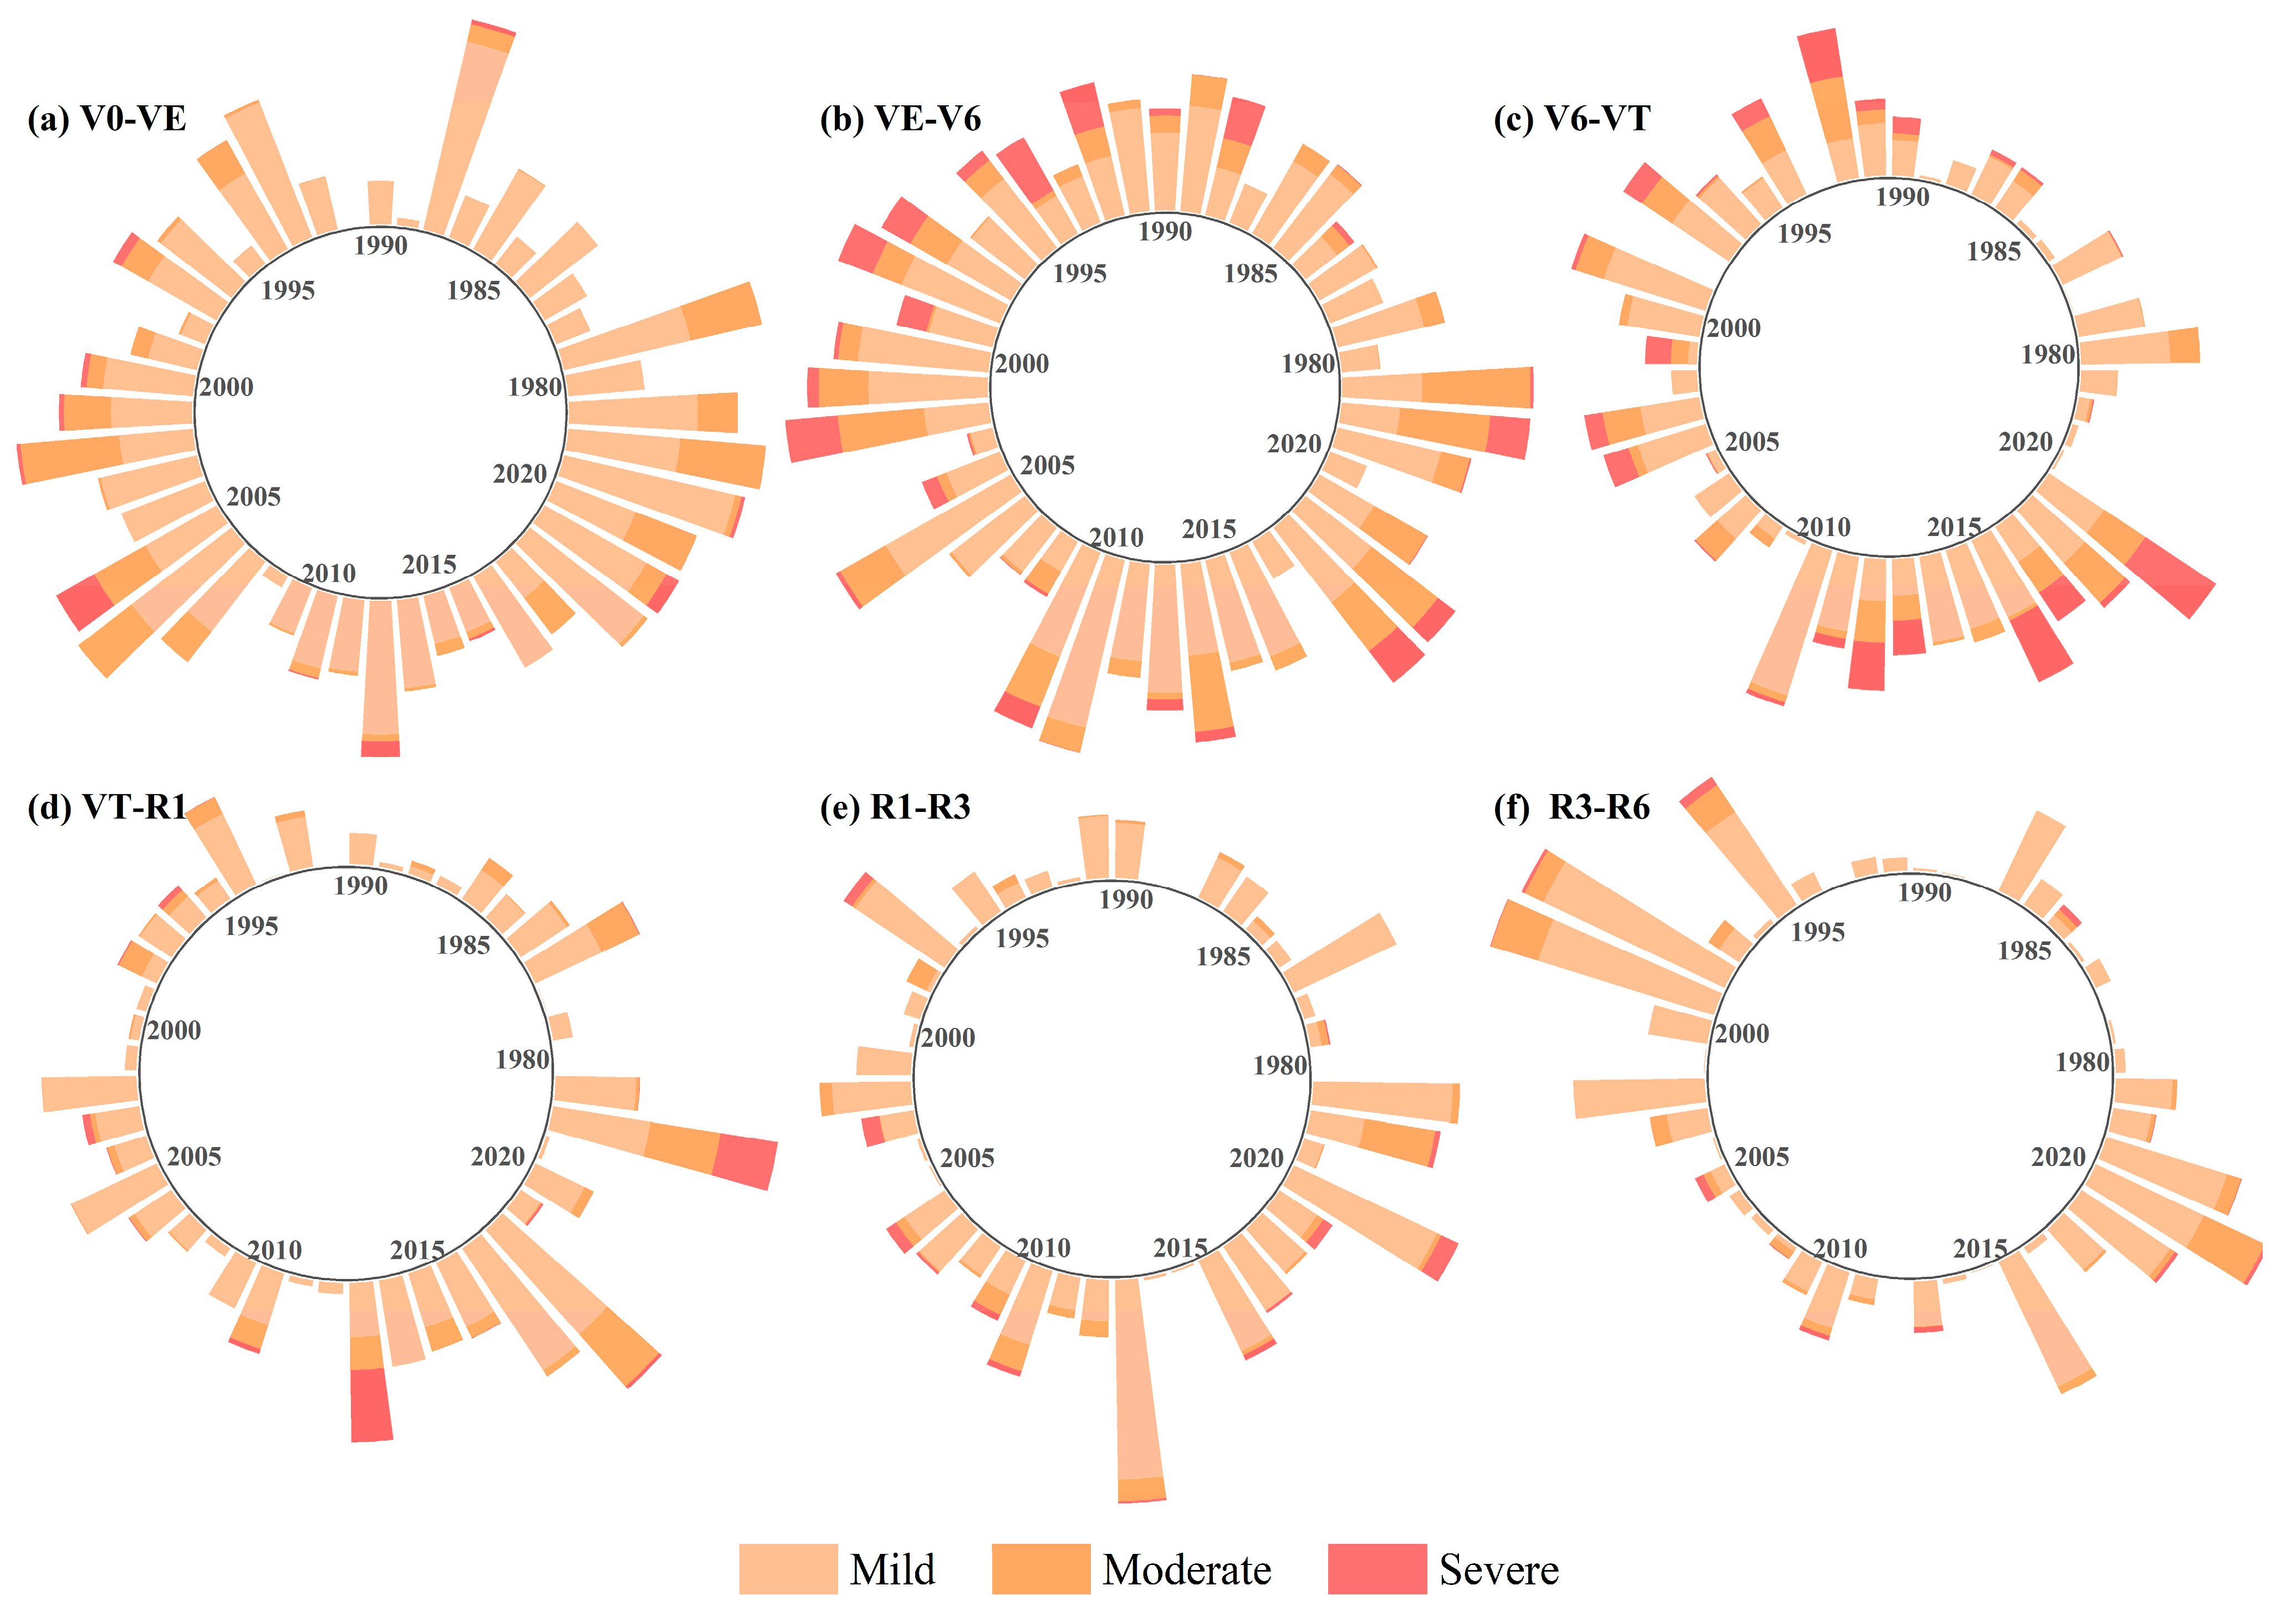
3.2.3. Spatial Variations in the Frequency of Heat Damage at Different Levels

The frequency of heat damage grades at different growth stages of summer maize in the HHH Plain from 1980 to 2023 is shown in Figure 4. As shown in Figure 5(a1–2, b1–2), the occurrence frequency of heat damage events during the V0–V6 stage generally exhibited an increasing trend from the northeast to the southwest. High frequency of mild heat damage occurred in the central and southern parts of Hebei Province, most of Henan Province, the central and western parts of Shandong Province, most of Anhui Province, and northern Jiangsu Province, with frequencies ranging from 40.91% to 79.55%. Concurrently, moderate heat damage events were concentrated in the north of Hebei Province, most of Henan Province, and the west of Shandong Province, with frequencies between 20.45 and 38.64%. As shown in Figure 5(c1–f1, c2–f2), the frequency of heat damage events from the V6–R6 stage generally demonstrated an increasing trend from the northeast to the southeast. Mild heat damage events mainly occurred in most parts of Henan Province and Anhui Province and southern Jiangsu Province, with frequencies ranging from 20.45% to 59.09%. Moderate heat damage events mainly occurred in Anhui Province and southern Jiangsu Province, with frequencies between 11.36% and 31.82%. Overall, severe heat damage events from the VE-to-VT stage occurred frequently in Anhui Province and southern Jiangsu Province, with frequencies ranging from 20.45% to 36.36%.

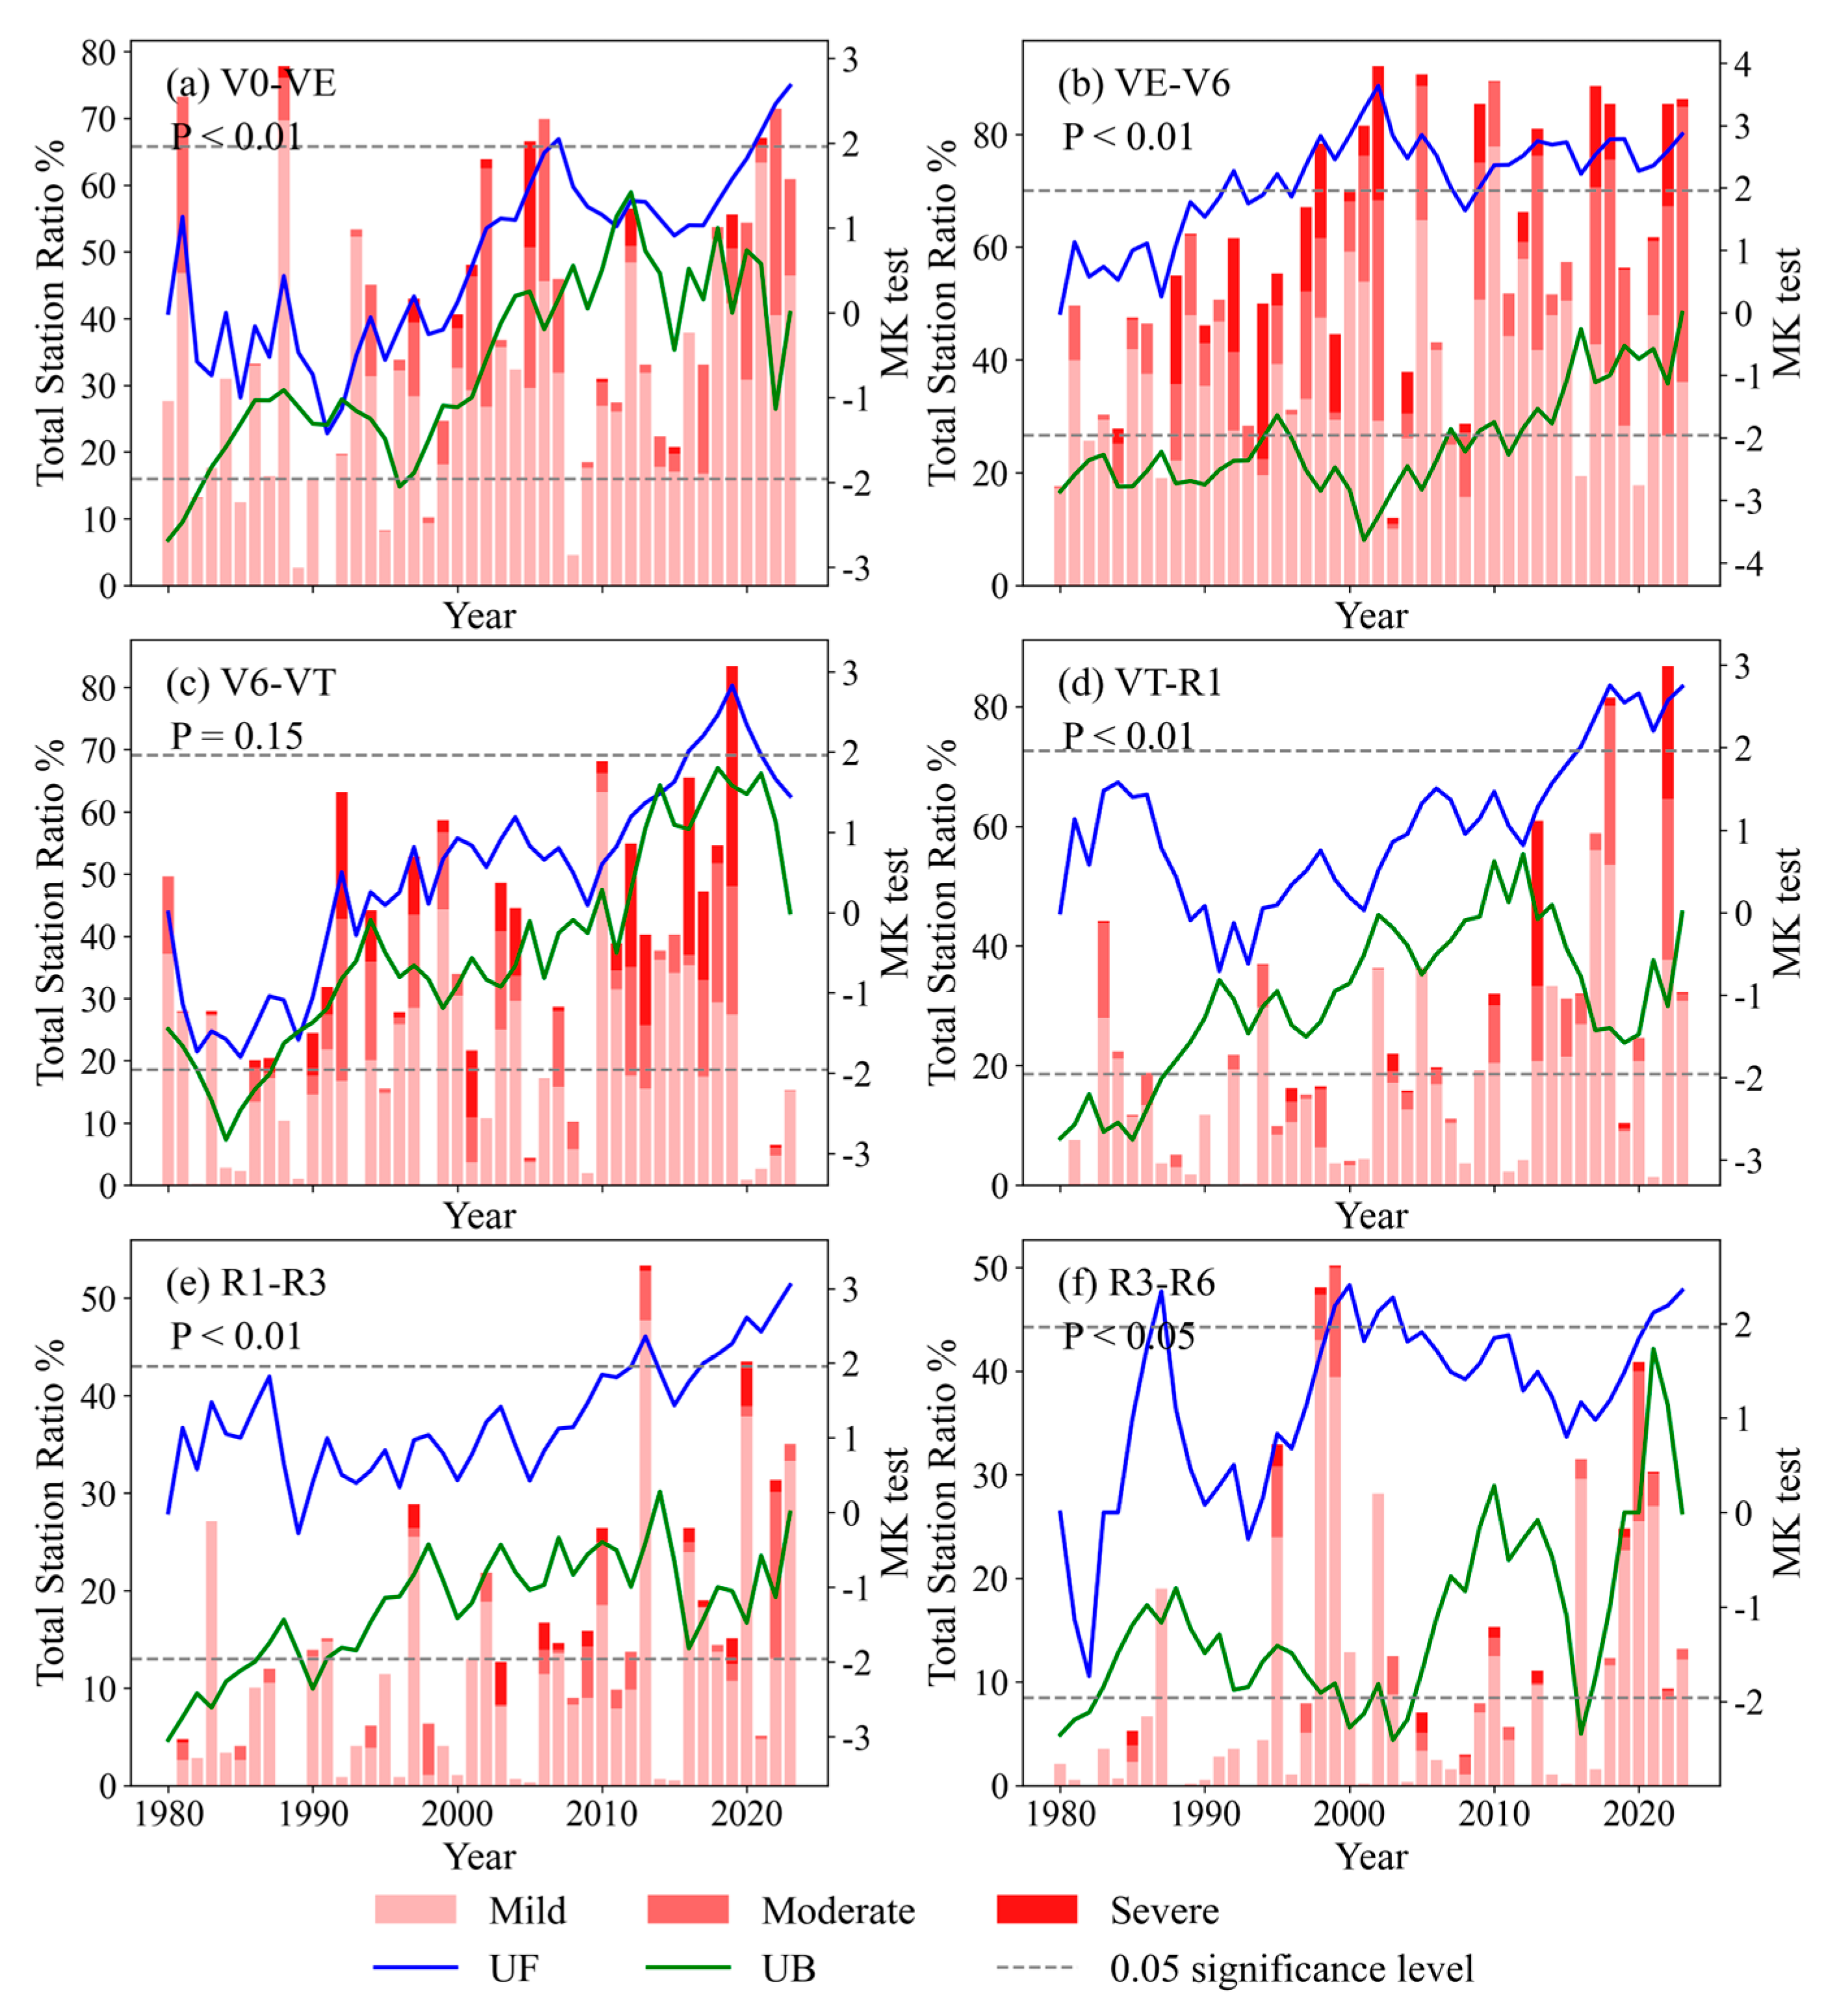
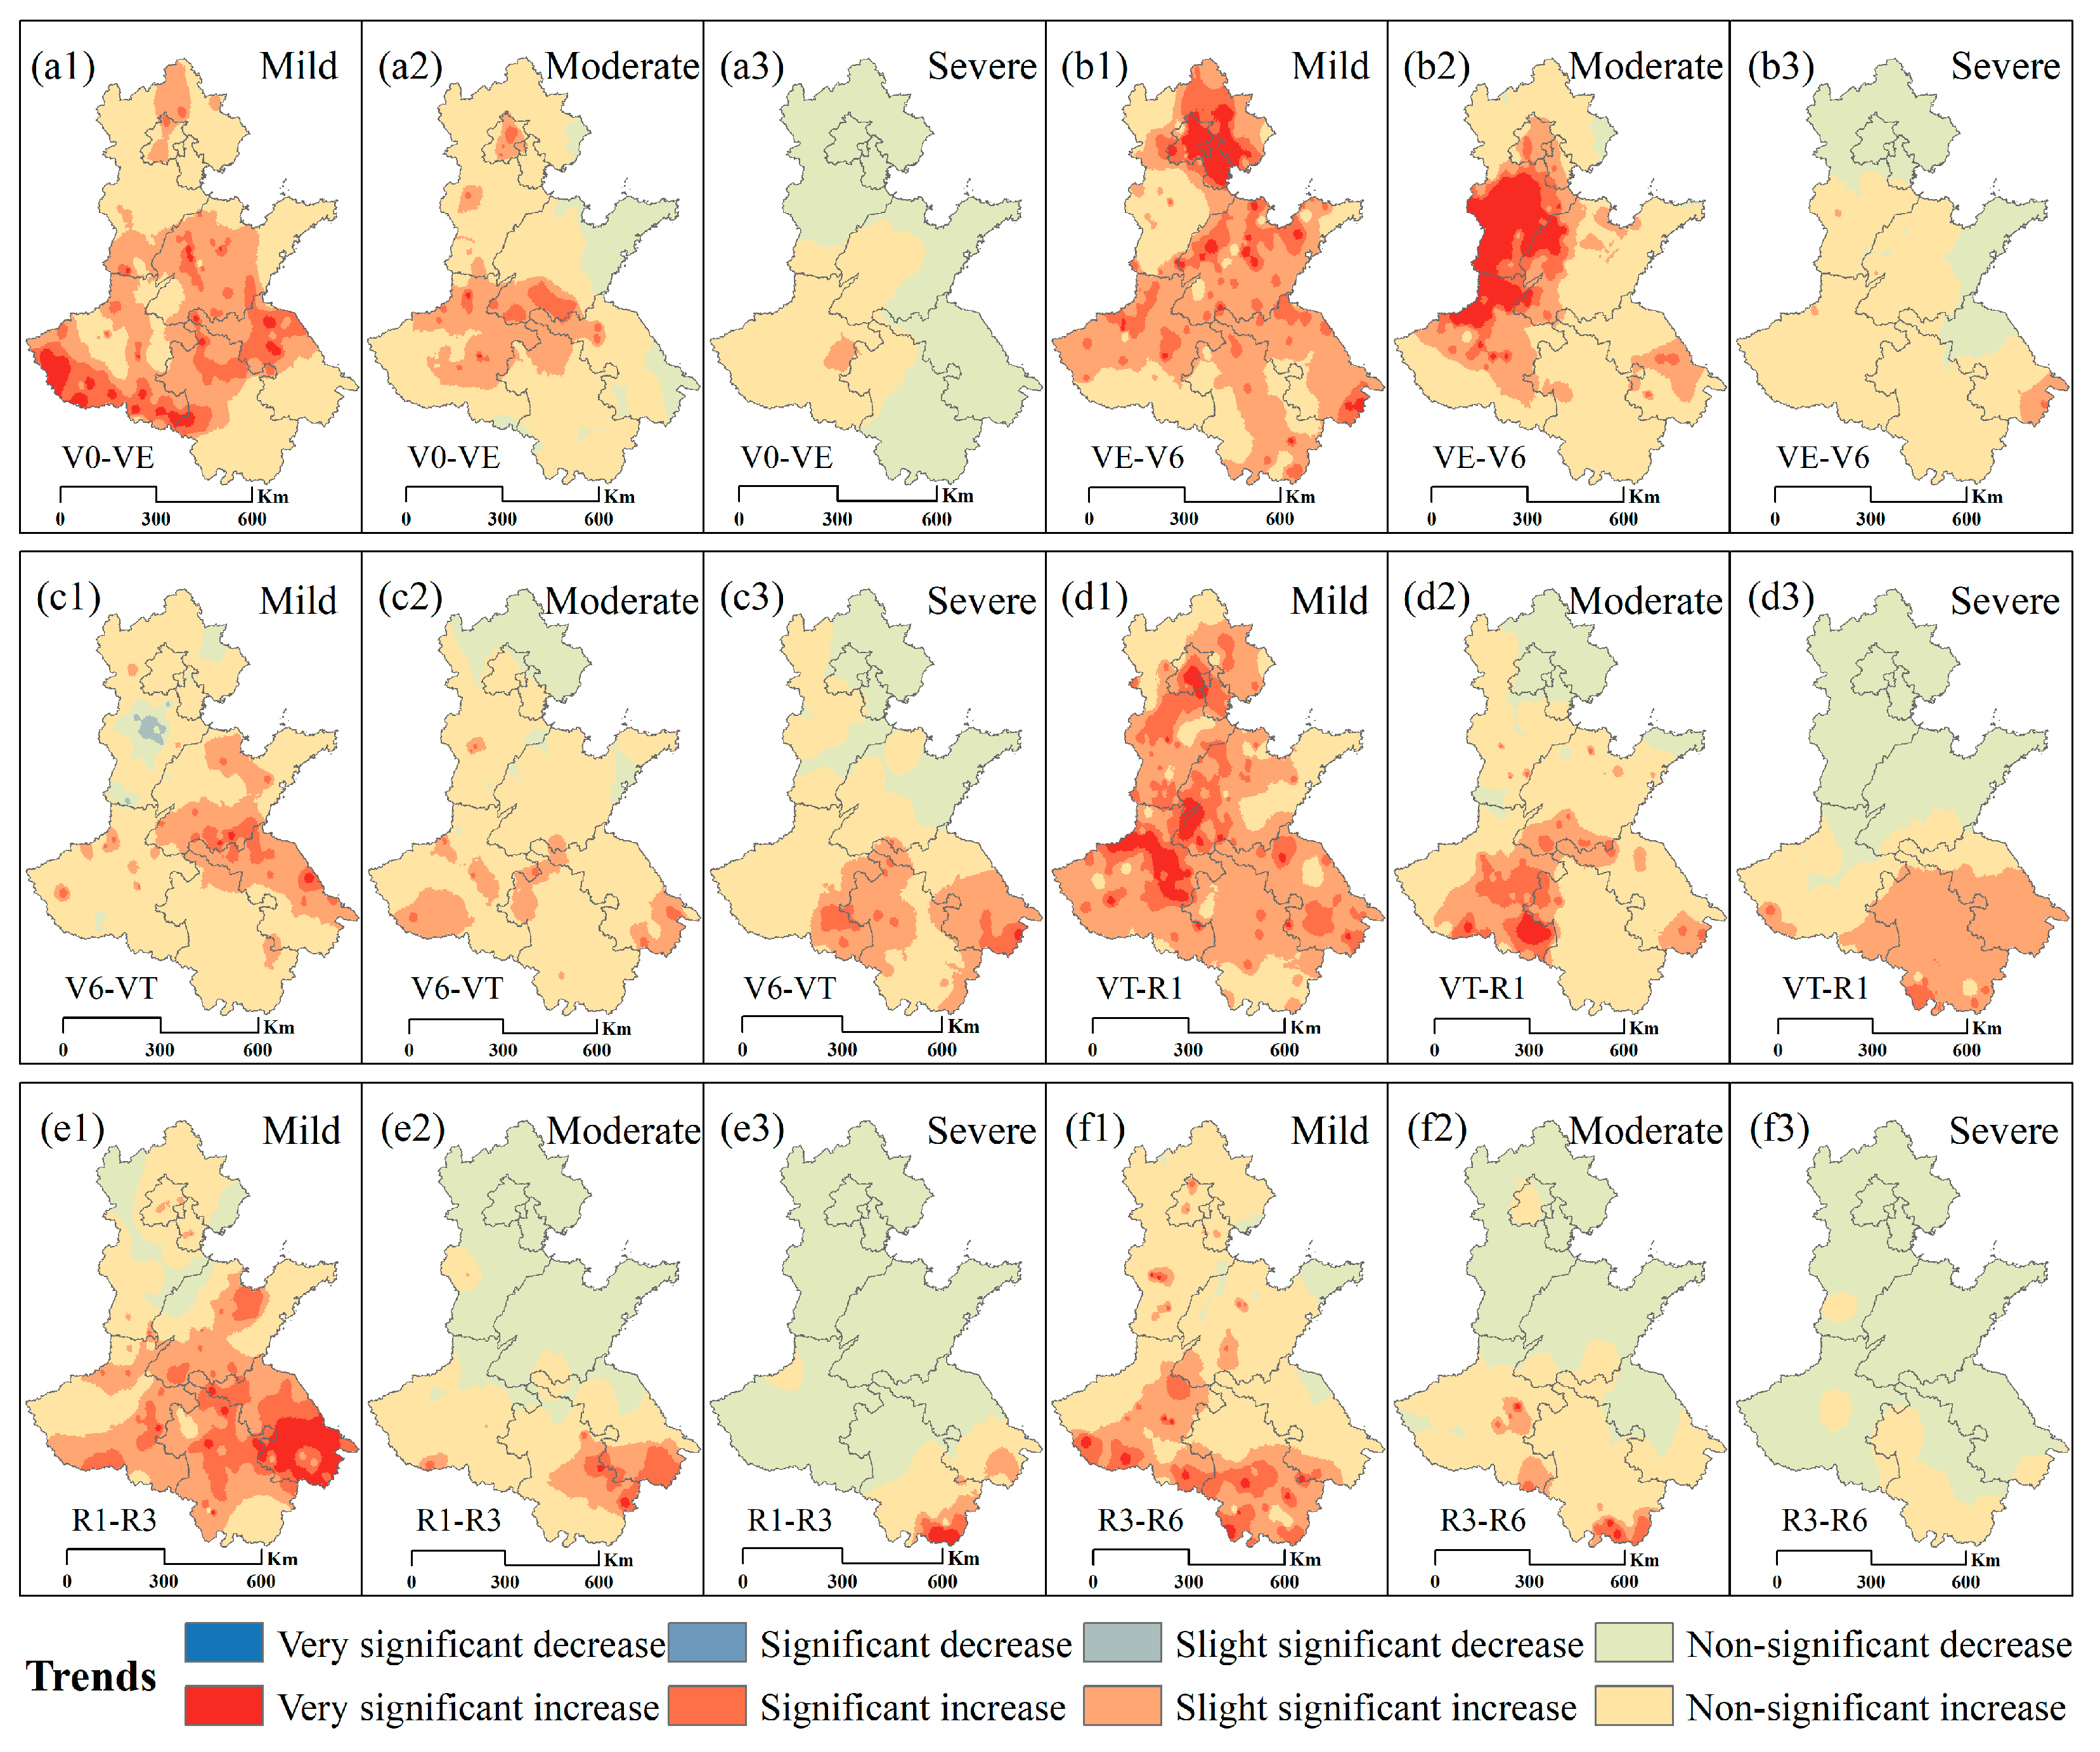
3.2.4. Trends of Heat Damage in Different Grades

Figure 6 illustrates the trends of heat damage across different levels during various growth stages of summer maize at meteorological stations across the HHH Plain from 1980 to 2023. As shown in Figure 6, mild heat damage during different growth stages mainly exhibited slightly significant or significant increasing trends, while moderate and severe heat damage generally showed non-significant increasing or decreasing trends. Specifically, during the V0–VE stage, mild heat damage in southern Hebei, central and western Shandong, western Henan, Anhui, and northern Jiangsu mainly showed slight significant or significant increasing trends. Regions such as Lushi, Luanchuan, Xixia, Dengzhou, and Nanyang in Henan Province showed very significant increasing trends (13.46%/10a −17.27%/10a, p < 0.01). During the VE–V6 stage, mild heat damage in northeastern Hebei, most areas of Shandong, central and northern Henan, and most parts of Anhui and Jiangsu showed slight significant or significant increasing trends. Moderate heat damage was mainly concentrated in central and southern Hebei, central and northern Henan, and northwestern Shandong, showing highly significant increasing trends. Notably, Qihuang in Shandong and Wenxian in Henan exhibited highly significant increasing trends of 19.24%/10a and 16.07%/10a, respectively (p < 0.01). During the VT–R1 stage, mild heat damage across most of the HHH Plain showed slightly significant increasing trends. Particularly, in southwestern Shandong (Shenxian, Liangshan, Yuncheng, and Jucheng) and northern Henan (Boai, Yanjin, Weihui, Xinxiang, and Huojia), the trends were very significant, ranging from 9.02%/10a to 14.66%/10a (p < 0.01). Moderate heat damage in southeastern Henan mainly showed slight increasing trends, with very significant increases observed in Xincai, Gushi, Huangchuan, and Huaibin, ranging from 3.17%/10a to 19.09%/10a (p < 0.01).

4. Discussion

4.1. The Duration Thresholds for Mild, Moderate, and Severe Heat Damage

This study determined and validated the grade indicators of heat damage for summer maize at different growth stages based on disaster samples of heat damage to summer maize in the HHH Plain using disaster inversion and the K-means clustering method. The disaster inversion method, widely applied in agricultural meteorological disasters such as drought in summer maize [10], frost damage in wheat [22], and high temperature and heat damage in rice [20], was employed to determine data samples. The K-means clustering method can group different data into subsets according to their similar characteristics [49] and has been extensively used in various research fields such as image detection and recognition [50], quality grading [51], and grade indicator construction [52]. The research further clarified the duration thresholds for mild, moderate, and severe heat damage at different growth stages of summer maize as 3–5 days, 6–8 days, and over 8 days, respectively. Compared with previous studies [25,26,27,28,29,53,54], the indicators established in this study, which are based on disaster samples, more quantitatively and objectively reflect the impacts of heat damage on summer maize at various growth stages. Meanwhile, these indicators also showed high consistency with the durations of heat damage indicators for summer maize throughout all growth stages in the HHH Plain as determined by Zhang et al. [15]. The validation results indicated that the accuracy rate of the heat damage indicators in this study is 91.67%, suggesting that these grade indicators possess high practicality and reliability, providing a scientific basis for accurately assessing the impacts of different heat damage grades on summer maize production. These quantitatively established thresholds for heat damage duration at different growth stages provide valuable reference points for improving agricultural risk management practices, including early-warning systems, crop insurance programs, and adaptive farming strategies, while also contributing to more accurate climate change impact assessments for summer maize in the HHH Plain.

4.2. Spatiotemporal Characteristics and Trends of Heat Damage

This study identified the station frequency ratios, occurrence frequency, and trend changes of heat damage at different growth stages of summer maize. The results indicate that from 1980 to 2023, the frequencies of mild and moderate heat damage during the sowing-to-jointing stage of summer maize showed an increasing trend from the northeast to the southwest of the HHH Plain, which is consistent with the research findings of Zhang [29]. This spatial pattern is mainly influenced by abnormal atmospheric circulation and topography effects. Under the impact of the continental high-pressure system in the mid-to-high-latitude westerly belt, the HHH Plain is predominantly characterized by clear weather with a significant sinking and warming effect. Additionally, due to the presence of the Taihang Mountains, the topography of the study area is “higher in the west and lower in the east”, and the influence of westerly winds exacerbates heat damage in the southwest of the HHH Plain [55]. During the tasseling-to-flowering stage, mild heat damage events occurred more frequently in southeastern Henan Province, which aligns with the conclusions of Li et al. [25,26] that heat damage during the flowering stage of summer maize in Henan Province was mainly concentrated in southern Henan. Furthermore, mild heat damage exhibited slight significant increasing trends across most of the HHH Plain, with highly significant increases in southwestern Shandong (Shenxian, Liangshan, Yuncheng, and Jucheng) and northern Henan (Boai, Yanjin, Weihui, Xinxiang, and Huojia), which is consistent with the research findings of Fu et al. [2].

4.3. Limitations and Future Research

The heat damage samples for summer maize in this study were derived from the inversion results of heat damage events records in the China Meteorological Disaster Yearbook, the China Meteorological Disasters Dictionary, the Meteorological Disaster Management System, and the related literature. However, these disaster records primarily include heat damage events that have significant impacts on the morphology, growth, and yield of maize, which may lead to the omission of records for mild heat damage [23,36]. There may be significant differences in heat damage thresholds among different maize varieties [4,56], which could result in inconsistent validation outcomes for certain samples. Further research is required to clarify heat damage thresholds and their specific cultivar impacts. Although the growth stage divisions in this study were drawn from the previous literature, due to the scarcity of variety related records and the potential adoption of climate change adaptation measures in certain regions, there may be a certain degree of subjectivity in the temporal segmentation of growth stages [31]. Additionally, when constructing the heat damage samples in this study, only the influence of daily maximum temperature was considered. However, heat damage often occurs concurrently with drought, and their combined effect results in much higher maize yield losses compared to individual drought or heat damage events [9]. Therefore, future studies should further incorporate factors representing drought disasters, such as soil moisture and precipitation, to explore the occurrence mechanisms of heat damage and drought events in summer maize. This will provide a better basis for formulating policies on disaster prevention and mitigation for summer maize production in the HHH Plain.

5. Conclusions

In this study, based on the daily maximum temperature and the historical disaster data of heat damage on summer maize, we determined the grade indicators of heat damage for different growth stages of summer maize, through the disaster inversion and K-means clustering methods; further identified the station ratio, frequency, and trend of different grades of heat damage in the HHH Plain from 1980 to 2023; and revealed the characteristics of spatial and temporal distribution of heat damage in the HHH Plain. The main conclusions are as follows:
(1) The durations of mild, moderate, and severe heat damage indicators for summer maize at different growth stages in the HHH Plain ranged from 3 to 5 d, 6 to 8 d, and more than 8d, respectively. Among them, 45 samples were fully consistent with the grade indicators, and 21 samples were generally consistent, resulting in an overall accuracy rate of 91.67%.
(2) The total station ratio of heat damage in different growth stages of summer maize in the HHH Plain showed a fluctuating upward trend from 1980 to 2023, and the station ratios of different growth stages reached the highest levels in 1988, 2002, 2019, 2022, 2013, and 1999, respectively.
(3) Mild heat damage in summer maize from sowing to maturity in the HHH Plain was more widely distributed spatially and mainly showed a slight increasing trend. Specifically, the mild heat damage events from the tasseling-to-flowering stage showed a slight significant increasing trend in most areas of the HHH Plain, and the moderate heat damage events mainly showed a slight increasing trend in southeastern Henan Province.
The grade indicators for heat damage at different growth stages can provide essential references for improving agricultural risk management practices, including the development of early-warning systems, crop insurance frameworks, and adaptive cultivation strategies. Future studies should incorporate additional variables such as soil moisture and precipitation. This integrated approach will help clarify the interactions between heat and drought, thereby offering stronger support for policy development in disaster prevention and mitigation within regional maize production.

Author Contributions

Conceptualization, X.L. and J.T.; methodology, X.L. and J.T.; software, Y.L.; validation, Y.L. and Y.Z.; formal analysis, Y.L. and Y.Z.; investigation, Y.M.; resources, Y.M.; data curation, Y.M.; writing—original draft, Q.L.; writing—review and editing, Q.L.; visualization, P.W.; supervision, P.W.; funding acquisition, P.W. All authors have read and agreed to the published version of the manuscript.

Funding

This research was funded by the National Natural Science Foundation of China (32171916), the Basic Research Fund of CAMS (2023Z014 and 2024Z001), the Science and Technology Development Fund of CAMS (2023KJ025 and 2024KJ010), the key innovation team of the China Meteorological Administration (CMA2024ZD02), and the Postgraduate Research & Practice Innovation Program of Jiangsu Province (KYCX24_1455).

Data Availability Statement

The original contributions presented in the study are included in the article; further inquiries can be directed to the corresponding author.

Conflicts of Interest

The authors declare no conflicts of interest.

References

  1. IPCC. Climate Change 2021: The Physical Science Basis; Cambridge University Press: Cambridge, UK, 2021. [Google Scholar]
  2. Fu, Z.; Liu, Z.; Guo, S.; Zhang, Z.; Lu, X.; Gong, J.; Dong, M.; Yang, X. Impact assessment of heat stress during post-silking period of summer maize in the Huang-Huai-Hai Plain, China. J. Agric. Sci. 2023, 161, 318–327. [Google Scholar] [CrossRef]
  3. Guan, K.; Li, T.; Yang, F.; Guo, E.; Zhang, W.; Shi, Y.; Yang, X. Adaptation measures of the potential double cropping region in Northern China to future climate change. Sci. Total Environ. 2024, 927, 172203. [Google Scholar] [CrossRef]
  4. Li, T.; Wang, S.; Liu, Q.; Zhang, X.; Chen, L.; Chen, Y.; Gao, W.; Sui, P. Effects of changing assimilate supply on starch synthesis in maize kernels under high temperature stress. J. Integr. Agric. 2024, 2095–3119. [Google Scholar] [CrossRef]
  5. Zhao, Z.W.; Leng, P.; Han, X.J.; Shang, G.F. Global maize yield responses to essential climate variables: Assessment using atmospheric reanalysis and future climate scenarios. Comput. Electron. Agric. 2025, 232, 110140. [Google Scholar] [CrossRef]
  6. Yang, J.; Wu, J.; Zhou, L.; Zhou, H.; Zhang, Z.; Zhang, R. Characteristics of compound heat and drought events during the spring maize growing season in Northeast China Based on a novel daily-scale analysis framework. J. Hydrol. Reg. Stud. 2025, 57, 102140. [Google Scholar] [CrossRef]
  7. Liu, Z.; Qiu, R.; Zhang, Q. Differences in effects of varying compound extreme temperature and precipitation events on summer maize yield in North China. Agric. Water Manag. 2025, 307, 109237. [Google Scholar] [CrossRef]
  8. Food and Agriculture Organization of the United Nations. World Food and Agriculture-Statistical Yearbook 2023; FAO: Rome, Italy, 2023. [Google Scholar] [CrossRef]
  9. Li, Q.; Wang, P.J.; Li, Y.; Tang, J.; Li, X.; Zhang, Y.; Han, D.; Wang, Q.; Zhao, Y.; Yang, Z. Hazard assessment of compound drought and heat events on summer maize from agricultural and meteorological perspectives. Agric. Water Manag. 2025, 313, 109479. [Google Scholar] [CrossRef]
  10. Zhang, Y.; Wang, P.J.; Chen, Y.; Yang, J.; Wu, D.; Ma, Y.; Huo, Z.; Liu, S. Daily dynamic thresholds of different agricultural drought grades for summer maize based on the Vegetation Water Index. J. Hydrol. 2023, 625, 130070. [Google Scholar] [CrossRef]
  11. Feng, Y.; Zhang, Y.; Li, S.; Wang, C.; Yin, X.; Chu, Q.; Chen, F. Sustainable options for reducing carbon inputs and improving the eco-efficiency of smallholder wheat-maize cropping systems in the Huanghuaihai Farming Region of China. J. Clean. Prod. 2020, 244, 118887. [Google Scholar] [CrossRef]
  12. Niu, S.; Yu, L.; Li, J.; Qu, L.; Wang, Z.; Li, G.; Guo, J.; Lu, D. Effect of high temperature on maize yield and grain components: A meta-analysis. Sci. Total Environ. 2024, 952, 175898. [Google Scholar] [CrossRef]
  13. Lizaso, J.I.; Ruiz, R.M.; Rodríguez, L.; Gabaldon-Leal, C.; Oliveira, J.A.; Lorite, I.J.; Sánchez, D.; García, E.; Rodríguez, A. Impact of high temperatures in maize: Phenology and yield components. Field Crops Res. 2018, 216, 129–140. [Google Scholar] [CrossRef]
  14. Lesk, C.; Rowhani, P.; Ramankutty, N. Influence of extreme weather disasters on global crop production. Nature 2016, 529, 84–87. [Google Scholar] [CrossRef]
  15. Zhang, H.Y. Construction and Risk Assessment of High Temperature Heat Damage Index of Summer Maize in Huang-Huai-Hai Area. Master’s Thesis, Chinese Academy of Meteorological Sciences, Beijing, China, 2023. [Google Scholar]
  16. Xiang, X.; Li, Y.; Wu, X.; Cao, H.; Lin, X. Delineating the predominant impact of rising temperature on the enhancement of severity in compound drought-hot events in China: An empirical Copula and path analysis-based approach. J. Hydrol. Reg. Stud. 2024, 53, 101769. [Google Scholar] [CrossRef]
  17. DB41/T 2094-2021; Local Standard of Henan Province—Meteorological Grade for High Temperature Warning During Flowering Stage of Summer Maize. Standardization Administration of China: Beijing, China, 2021. (In Chinese)
  18. DB37/T 4144.2-2020; Local Standard of Shandong Province—Identification and Evaluation Specifications for Meteorological Disasters in Summer Maize Part 2: High Temperature. Standardization Administration of China: Beijing, China, 2020. (In Chinese)
  19. GB/T21985-2008; Standards for the Meteorological Industry in China—Temperature Thresholds for Heat Damage to Major Crops. Standardization Administration of China: Beijing, China, 2008. (In Chinese)
  20. Li, M.; Zhou, H.; Miao, B.; Li, M.; Shi, C.; Jiang, M. Developing an early warning system and risk assessment based on model for heat damage in rice. Ecol. Indic. 2024, 167, 112657. [Google Scholar] [CrossRef]
  21. Sheng, D.Y.; Wang, Y.Y.; Huang, S.B.; Bin, T.; Pu, W. Effects of high Temperature on morphology and function, yield components and grain nutrients of maize plants. J. Maize Sci. 2020, 28, 86–92. (In Chinese) [Google Scholar]
  22. Xu, J.; Zhang, J.; Wei, X.; Zhi, F.; Zhao, Y.; Guo, Y.; Wei, S.; Cui, Z.; Ga, R. Study on frost damage index and hazard assessment of wheat in the Huanghuaihai region. Ecol. Indic. 2024, 167, 112679. [Google Scholar] [CrossRef]
  23. Wang, P.J.; Li, X.; Tang, J.; Yang, J.; Ma, Y.; Wu, D.; Huo, Z. Determining the critical threshold of meteorological heat damage to tea plants based on MODIS LST products for tea planting areas in China. Ecol. Inf. 2023, 77, 102235. [Google Scholar] [CrossRef]
  24. Wei, X.; Zhang, J.; Wang, D.; Zhao, C.; Song, Z.; Guo, Y.; Liu, X.; Tong, Z. T Study on fine early warning of maize high wind lodging disaster risk in Jilin Province, China. Int. J. Disaster Risk Reduct. 2025, 119, 105311. [Google Scholar] [CrossRef]
  25. Li, Z.; Lu, H.R.; Yang, G.G.; Li, H.P.; Wang, P.; Li, C.; Zhou, G.; Lu, C.; Zhang, Y. Spatiotemporal characteristics of high temperature stress during the flowering stage of summer maize in Henan Province. Henan Agric. Sci. 2024, 53, 10–20. (In Chinese) [Google Scholar]
  26. Li, S.; Fang, W.; Liu, T.; Ma, Z.; Noor, M.A.; Liang, L.; Ma, W.; Xue, C. Meteorological Pre-warning Grade of High Temperature During Flowering Stage for Summer Maize in North China Plain. Int. J. Plant Prod. 2023, 17, 193–203. [Google Scholar] [CrossRef]
  27. Wang, X.P.; Fang, W.S.; Du, Z.X.; Du, Z. Spatiotemporal variation of flowering stage heat damage of summer maize. J. Maize Sci. 2021, 29, 61–68. (In Chinese) [Google Scholar]
  28. Dai, L.Q.; Wang, M.; Dong, H.Y.; Kang, X.Y.; Li, C. Spatio-temporal change characteristics and trend of high temperature damage to maize in Hebei province. Acta Agric. Jiangxi 2022, 34, 158–164. (In Chinese) [Google Scholar]
  29. Zhang, D. The Study on the Impact of High Temperature Heat Damage on Summer Maize in Hebei Province Under the Background of Climate Change. Master’s Thesis, Hebei Agricultural University, Baoding, China, 2024. [Google Scholar]
  30. Zhang, Q.; Han, J.; Yang, Z. Hazard assessment of extreme heat during summer maize growing season in Haihe Plain, China. Int. J. Climatol. 2021, 41, 4794–4803. [Google Scholar] [CrossRef]
  31. Zhang, F.; Liu, Y.; Wu, S.; Liu, J.; Luo, Y.; Ma, Y.; Pan, X. Prediction and spatial–temporal changes of soil organic matter in the Huanghuaihai Plain by combining legacy and recent data. Geoderma. 2024, 450, 117031. [Google Scholar] [CrossRef]
  32. Cheng, Y.; Ma, D.; Zhao, J.; Zhang, Q.; Li, X.; Zhao, Y.; Zheng, W.; Zhang, B.; Liu, Z. Biochar application does not improve crop growth and yield in a semi-humid region in the HuangHuaiHai Plain of China: A 7-year consecutive field experiment. Soil. Tillage Res. 2025, 247, 106367. [Google Scholar] [CrossRef]
  33. Zhao, J.; Chen, P. High-resolution cropland mapping in China’s Huang-Huai-Hai Plain: The coupling of machine learning methods and prior information. Comput. Electron. Agric. 2024, 224, 109225. [Google Scholar] [CrossRef]
  34. Yang, L.; Jin, W.; Chen, X.; Song, W.; Yang, Y.; Zhou, J.; Kong, L.; Huang, Z.; Liu, R.; Du, X. Effect of soybean inclusion in cropping systems on productivity, profitability, and carbon footprints: A case study from the Huang-Huai-Hai Plain. Energy 2025, 316, 134422. [Google Scholar] [CrossRef]
  35. Yan, K.; Wang, D.; Feng, Y.; Hou, S.; Zhang, Y.; Yang, H. Digital mapping of soil organic carbon in a plain area based on time-series features. Ecol. Indic. 2025, 171, 113215. [Google Scholar] [CrossRef]
  36. Li, X.; Wang, P.J.; Tang, J.X.; Yang, J.; Ma, Y.; Wu, D.; Huo, Z. High temperature heat damage grade index of tea plants and its distribution characteristics in Southern Yangtze River and South China. J. Appl. Meteorol. Sci. 2024, 35, 57–67. (In Chinese) [Google Scholar]
  37. Li, Q.; Wang, P.; Li, Y.; Tang, J.; Li, X.; Zhang, Y.; Han, D.; Zhao, Y.; Wang, Q.; Yang, Z. Identifying trigger thresholds for heat damage at different growth stages of summer maize: A case study of the Huang-Huai-Hai Plain, China. Eur. J. Agron. 2025, 170, 127729. [Google Scholar] [CrossRef]
  38. Yu, H.; Wen, G.; Gan, J.; Zheng, W.; Lei, C. Self-paced Learning for K-means Clustering Algorithm. Pattern Recognit. Lett. 2020, 132, 69–75. [Google Scholar] [CrossRef]
  39. Hu, H.; Liu, J.; Zhang, X.; Fang, M. An Effective and Adaptable K-means Algorithm for Big Data Cluster Analysis. Pattern Recognit. 2023, 139, 109404. [Google Scholar] [CrossRef]
  40. Bai, Q.F.; Liang, Y.; Li, N.; Pan, Y. Analysis of freezing injury risk in Northern Expansion Area of Shannxi apple based on meteorological big data. Desert Oasis Meteorol. 2023, 17, 171–175. (In Chinese) [Google Scholar]
  41. Jin, H.; Chen, X.; Wu, P.; Song, C.; Xia, W. Evaluation of spatial-temporal distribution of precipitation in mainland China by statistic and clustering methods. Atmos. Res. 2021, 262, 105772. [Google Scholar] [CrossRef]
  42. Fischer, S.; Schumann, A.H. Temporal changes in the frequency of flood types and their impact on flood statistics. J. Hydrol. X 2024, 22, 100171. [Google Scholar] [CrossRef]
  43. Güçlü, Y.S.; Acar, R.; Saplıoğlu, K. Seasonally adjusted periodic time series for Mann-Kendall trend test. Phys. Chem. Earth 2025, 138, 103848. [Google Scholar] [CrossRef]
  44. Sa’adi, Z.; Samikan Mazilamani, L.; Sa’adi, N.; Basri, M.H.A.; Alias, N.E.; Yusop, Z.; Zainon Noor, Z.; Kemarau, R.A.; Shiru, M.S.; Masood, A. The likelihood of a significant trend based on a family of Mann-Kendall tests for extreme rainfall in Borneo. Phys. Chem. Earth 2025, 139, 103959. [Google Scholar] [CrossRef]
  45. Mudelsee, M. Trend analysis of climate time series: A review of methods. Earth-Sci. Rev. 2019, 190, 310–322. [Google Scholar] [CrossRef]
  46. Gu, Z.; Duan, X.; Liu, B.; Hu, J.; He, J. The spatial distribution and temporal variation of rainfall erosivity in the Yunnan Plateau, Southwest China: 1960–2012. Catena 2016, 145, 291–300. [Google Scholar] [CrossRef]
  47. Guo, Y.; Zhang, J.; Li, K.; Aru, H.; Feng, Z.; Liu, X.; Tong, Z. Quantifying hazard of drought and heat compound extreme events during maize (Zea mays L.) growing season using Magnitude Index and Copula. Wea.Clim. Extrem. 2023, 40, 100566. [Google Scholar] [CrossRef]
  48. Guo, Y.; Lu, X.; Zhang, J.; Wang, R.; Rong, G.; Liu, X.; Tong, Z. Joint analysis of drought and heat events during maize (Zea mays L.) growth periods using copula and cloud models: A case study of Songliao Plain. Agric. Water Manag. 2022, 259, 107238. [Google Scholar] [CrossRef]
  49. Mussabayev, R.; Mladenovic, N.; Jarboui, B.; Mussabayev, R. How to Use K-means for Big Data Clustering? Pattern Recognit. 2023, 137, 109269. [Google Scholar] [CrossRef]
  50. Miao, Y.; Li, S.; Wang, L.; Li, H.; Qiu, R.; Zhang, M. A single plant segmentation method of maize point cloud based on Euclidean clustering and K-means clustering. Comput. Electron. Agric. 2023, 210, 107951. [Google Scholar] [CrossRef]
  51. Bi, M.; Chen, H.; Zuo, M. Comprehensive quality grading and dynamic prediction of physicochemical indicators of maize during storage based on clustering and time-series prediction models. J. Cereal Sci. 2025, 123, 104187. [Google Scholar] [CrossRef]
  52. Wang, S.; Peng, H. Multiple spatio-temporal scale runoff forecasting and driving mechanism exploration by K-means optimized XGBoost and SHAP. J. Hydrol. 2024, 630, 130650. [Google Scholar] [CrossRef]
  53. Dai, L.Q.; Kang, X.Y.; Yao, S.R.; Wang, M.; Meng, L. Monitoring and evalution indices of high temperature damage for maize in Hebei province. J. Arid. Land. Resour. Env. 2022, 36, 171–176. (In Chinese) [Google Scholar]
  54. Chen, H.L.; Li, S.Y. Prediction of high temperature disaster risks during summer maize flowering under future climate warming background in Henan Province. Chin. J. Eco-Agric. 2020, 28, 337–348. (In Chinese) [Google Scholar]
  55. Qian, C.; Ye, Y.; Jiang, J.; Zhong, Y.; Zhang, Y.; Pinto, I.; Huang, C.; Li, S.; Wei, K. Rapid attribution of the record-breaking heatwave event in North China in June 2023 and future risks. Environ. Res. Lett. 2023, 19, 014028. [Google Scholar] [CrossRef]
  56. Zhang, F.X.; Chen, X.; Huang, N.; Bi, P.; Gao, R.; Meng, J.; Huang, Z.; Yang, R.; Pan, Z. Spatio-temporal distribution of high-temperature, drought and their compound events during the critical fertility stages of single-season rice in the Yangtze River Basin. J. China Agric. Univ. 2025, 30, 1–14. (In Chinese) [Google Scholar]
Figure 1. The spatial distribution of summer maize growing areas and meteorological stations in the Huang–Huai–Hai Plain. (a) Location of the Huang-Huai-Hai Plain in China; (b) Distribution of meteorological stations, disaster recorded stations, and summer maize growing areas.
Agronomy 15 01545 g001
Figure 2. The daily maximum temperature variation chart for severe heat damage levels inconsistent with actual disaster conditions.
Agronomy 15 01545 g002
Figure 3. The annual proportion of stations experiencing different levels of heat damage during various growth stages of summer maize.
Agronomy 15 01545 g003
Figure 4. The temporal changes in the station ratio of different levels of heat damage during different growth stages of summer maize, and MK trend analysis of the total station ratio of heat damage.
Agronomy 15 01545 g004
Figure 5. The spatial variation in the frequency of different levels of heat damage during different growth stages of summer maize.
Agronomy 15 01545 g005
Figure 6. The frequency trend of different levels of heat damage during different growth stages of summer maize from 1980 to 2023.
Agronomy 15 01545 g006
Table 1. Classification of heat disasters in summer maize [17,18].
GradesDescription of the Disaster
MildPlant leaves showed temporary curling and wilting, flowering and pollination were slightly affected by poor fruiting, grouting was hindered, the number of grains in spikes and the weight of 1000 grains were slightly reduced, and the yield was reduced by less than 10%.
ModerateThe leaves of the whole plant curled and wilted for a long time, the female spike spitting was delayed, the male spike bloomed less, the number of grains in the spike and the weight of 1000 grains decreased significantly, and the yield was reduced by 10–30%.
SevereThe leaves of the whole plant curled and wilted for a long time and then withered, the female ear could not spit silk normally, the male ear bloomed less, the pollen grain lost its vitality, grain filling did not occur normally, the kernels per ear and the 1000-kernel weight were seriously reduced, seriously affecting maize production, and the yield was reduced by more than 30%, or even complete crop failure in some cases.
Table 2. The summer maize heat damage grade indicators.
The Growth Stages of Summer MaizeHeat Damage Grade Indicators
Mild/dModerate/dSevere/d
V0–VE2.5~4.74.7~7.7>7.7
VE–V63.7~5.95.9~8.6>8.6
V6–VT3.5~5.45.4~7.5>7.5
VT–R12.3~4.54.5~7.9>7.9
R1–R32.8~4.74.7~8.3>8.3
R3–R63.2~5.35.3~8.1>8.1
Table 3. Validation results of heat damage level indicators for summer maize.
Grade
Indicators
Verification ResultsSummary
Fully
Consistent
Generally ConsistentInconsistent with Actual Conditions
Mild134017
Moderate139022
Severe198633
Disclaimer/Publisher’s Note: The statements, opinions and data contained in all publications are solely those of the individual author(s) and contributor(s) and not of MDPI and/or the editor(s). MDPI and/or the editor(s) disclaim responsibility for any injury to people or property resulting from any ideas, methods, instructions or products referred to in the content.

