1. Introduction
Tomato fruit maturity at harvest is a critical factor influencing taste, nutritional value, and the shelf life of the produce. Traditionally, growers and the industry have relied on the external color as a primary indicator of ripeness, with standards like the USDA six-stage color scale (from full green to red ripe) guiding harvest timing [
1]. While color change (from green chlorophyll to red lycopene) is a convenient visual cue of ripening, it alone may not reliably indicate the optimal harvest time. Tomatoes often exhibit uneven ripening—“maturing from the inside out”—which means a fruit can appear red on the outside while still developing internally [
2]. Consequently, an over-reliance on skin color can lead to picking fruit that is under- or overripe in terms of flavor and texture. Recent research in precision agriculture emphasizes the need to assess additional phenomic traits (firmness, sugar content, aroma volatiles, internal structure, etc.) using sensor-based methods for a more accurate maturity evaluation [
3].
Color is an important maturity index but has clear limitations if used alone. The development of red color is correlated with certain quality changes (e.g., lycopene accumulation and chlorophyll loss), yet it does not capture the full picture of ripeness. Tomatoes can reach a desired external color through ethylene-induced ripening off-vine, but such fruits often have inferior flavor compared to vine-ripened counterparts. This is because key internal changes—like sugar accumulation and aroma biosynthesis—may lag in visual color. Studies confirm that as a tomato moves from mature-green to red-ripe stages, internal quality attributes change significantly: the flesh softens (firmness dropping from ~43 N in green fruit to ~25 N in red fruit) and sugars and carotenoids increase substantially by the fully ripe stage [
4]. A tomato picked when just fully red on the outside might still lack the peak sugar or flavor compound levels if that color was achieved rapidly or artificially. In short, externally similar colors can mask differences in internal maturity. Researchers have noted that tomato aroma profiles in ripe fruit are strongly influenced by the fruit’s physiological maturity at harvest—tomatoes harvested too early (even if later reddened) develop a different, often diminished volatile flavor profile [
5]. Likewise, fruit harvested at a more advanced color stage tends to have better flavor but will be softer and more perishable [
4]. Therefore, relying on color alone presents a trade-off: it may ensure cosmetic ripeness, but it risks suboptimal taste (if harvested too early) or a reduced shelf life (if harvested too late). These limitations motivate the inclusion of additional phenomic maturity indicators.
Volatile organic compounds (VOCs) are important indicators of tomato fruit ripening. During ripening, VOC profiles shift significantly, and these changes can be tracked to monitor fruit maturity. According to M. Quintero Ramirez et al. [
5], VOCs associated with ripening are categorized into nine groups: esters, terpenes, aldehydes, hydrocarbons, alcohols, acids, ketones, and phenylpropenes. Gas chromatography–mass spectrometry (GC-MS) analysis revealed that the relative content of esters and terpenes increases as ripening progresses, while aldehydes, hydrocarbons, and alcohols decrease.
Among the terpenes, β-myrcene and eucalyptol were found in the highest concentrations across all stages. For esters, methyl butanoate and ethyl butanoate were most abundant. The aldehyde trans-2-hexenal and hydrocarbon trans-3-methyl-1,3,5-hexatriene showed a declining trend, whereas alcohols like cis-3-hexenol and acids like acetic acid were more prominent at early stages. Notably, estragole, a phenylpropene, was undetectable at all stages.
Further, Guler et al. [
6] identified 41, 47, and 33 VOCs at the green, red, and overripe stages, respectively, using solid-phase microextraction (SPME). Aldehydes generally decreased during ripening, except (E)-2-octenal, which increased. The compound 6-methyl-5-hepten-2-one significantly increased and dominated at the red stage, accompanied by 2-isobutylthiazole, 1-hexenol, and (Z)-4-decenal. In overripe tomatoes, 4-ethyl phenol and 4-ethyl-2-methoxyphenol were the most abundant compounds. Methyl salicylate was dominant at the green stage, while 6-methyl-5-hepten-2-one prevailed at the red stage, illustrating dynamic shifts in VOC composition as the tomato matures. These VOC patterns provide valuable biochemical markers for determining ripening stages and ensuring the optimal harvest timing in tomato production.
2. Materials and Methods
2.1. Experiment
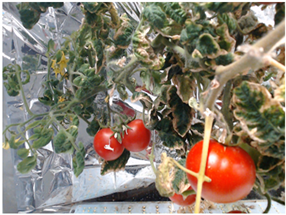
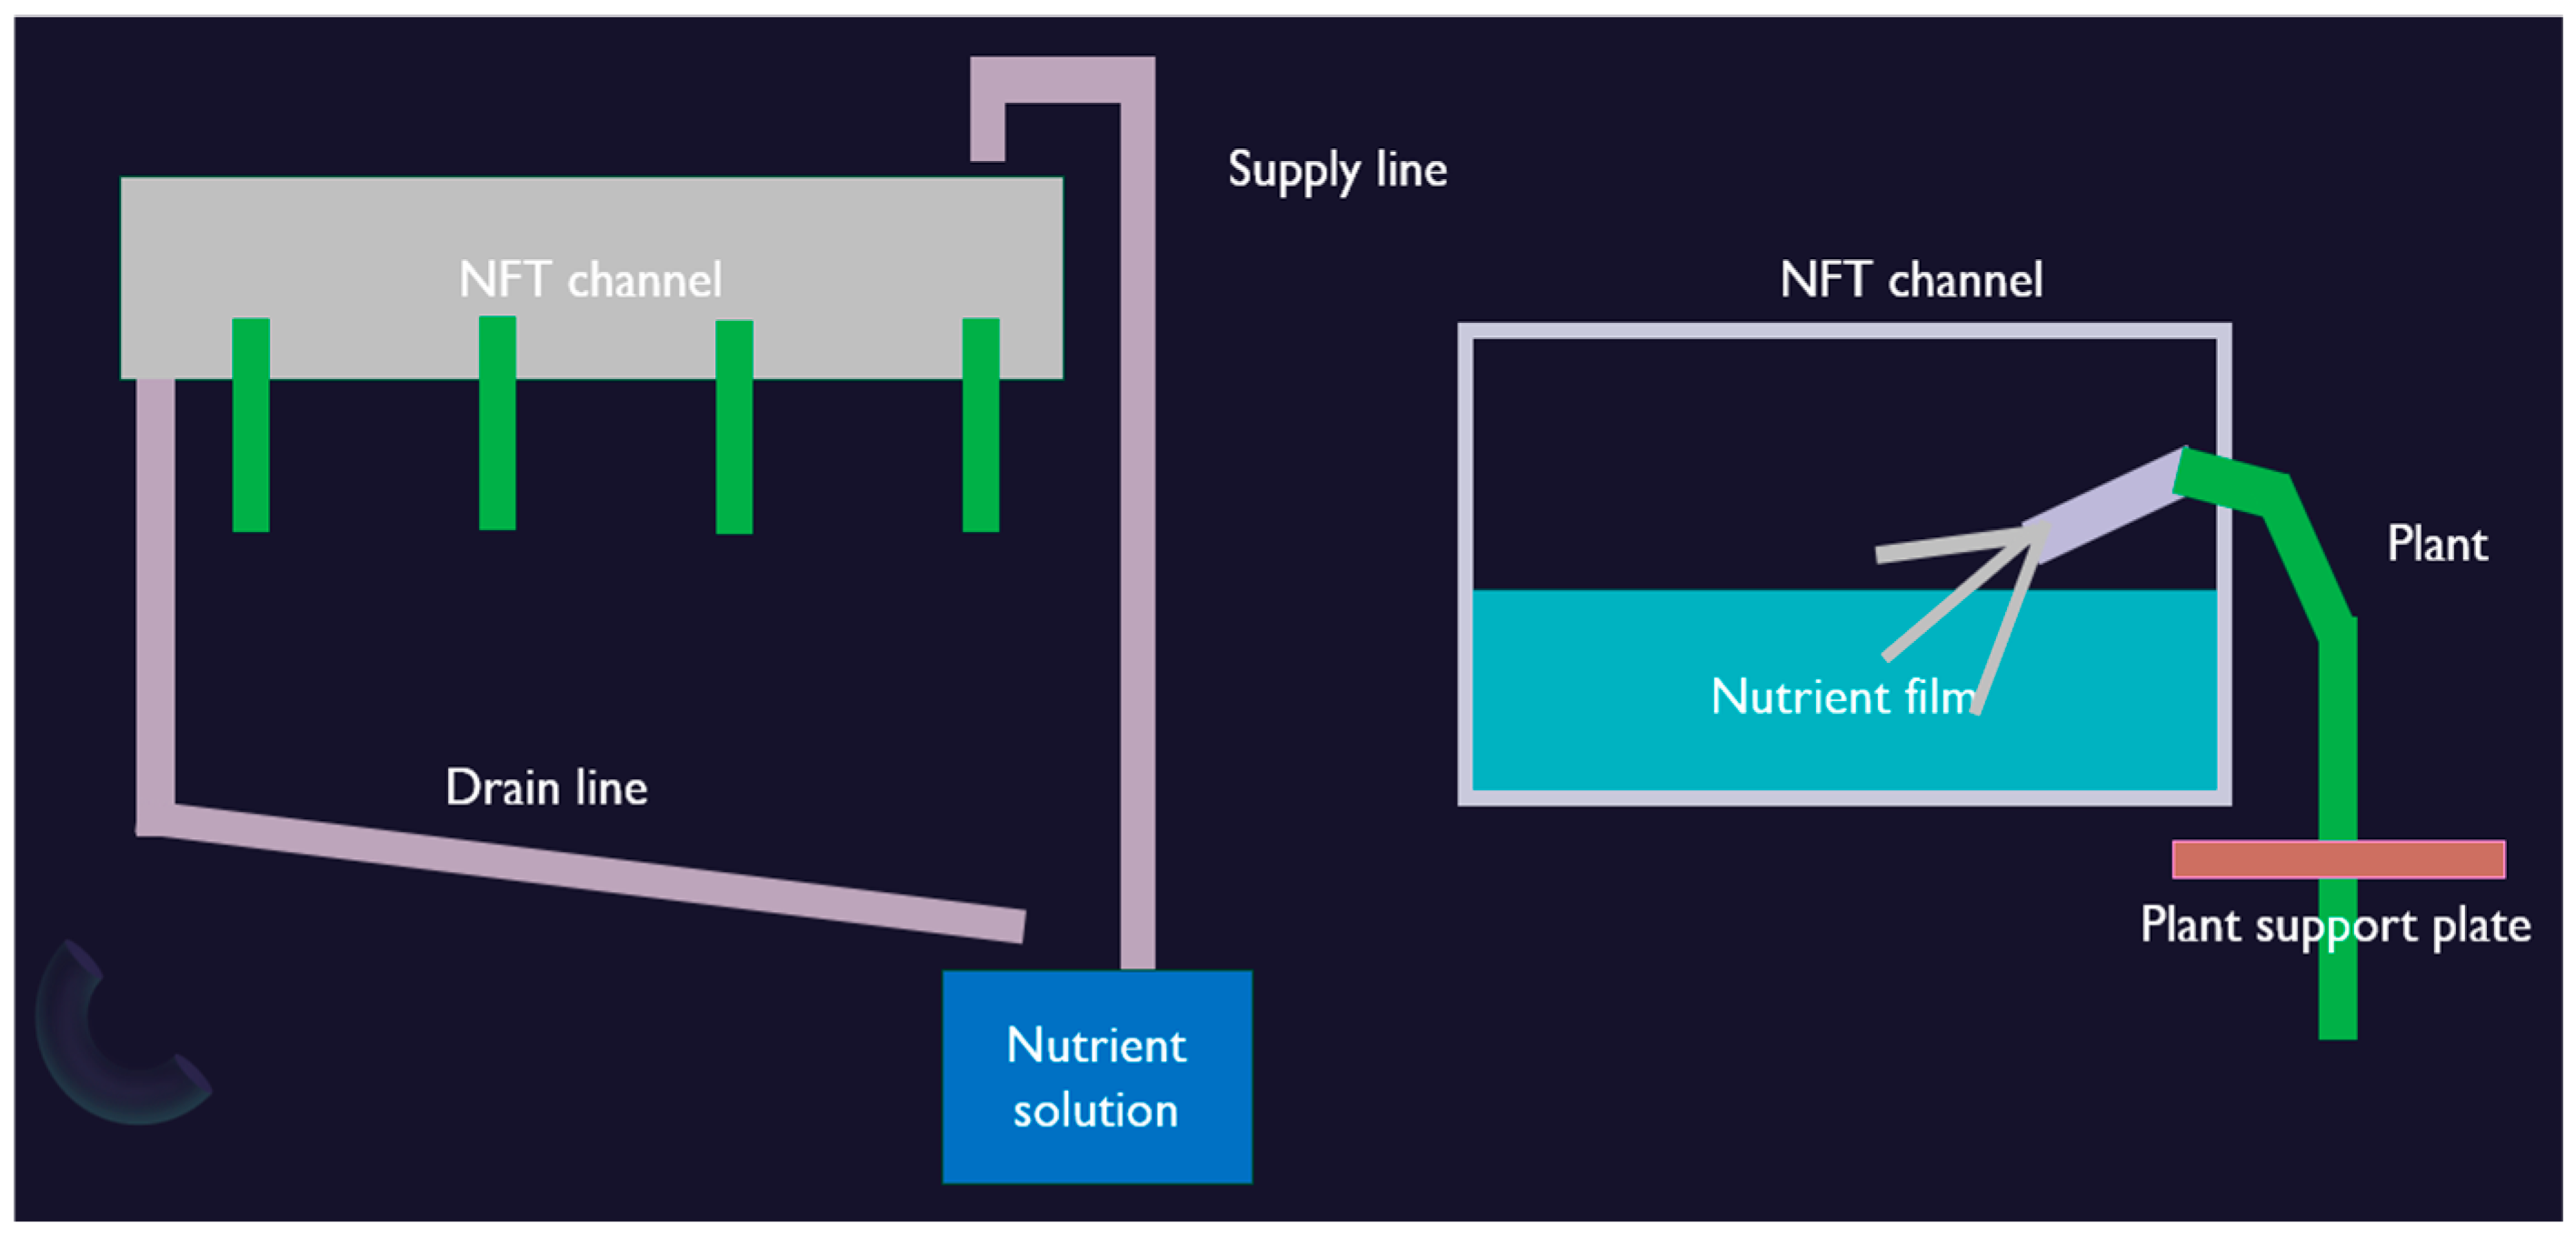
The experimental set was produced in an NFT-based hydroponic growing system. The design and implementation of the NFT hydroponic system for inverted tomato cultivation in the bio-cell setup were primarily aimed at enhancing space utilization, optimizing nutrient delivery, and improving harvesting efficiency (
Figure 1). This system was conceptualized to accommodate a unique plant orientation where tomato plants grow upside-down, simplifying fruit collection and enabling a compact growth environment. The bio-cell setup is designed with the dimensions of 1.5 m in length, 0.5 m in width, and 1.8 m in height, providing sufficient space for vertical growth while maintaining a manageable structure for experimental control (
Figure 1). The core of the system relies on the NFT hydroponic principles to maintain a thin film of nutrient solution flowing through the NFT channels, ensuring consistent nutrient absorption and root oxygenation.
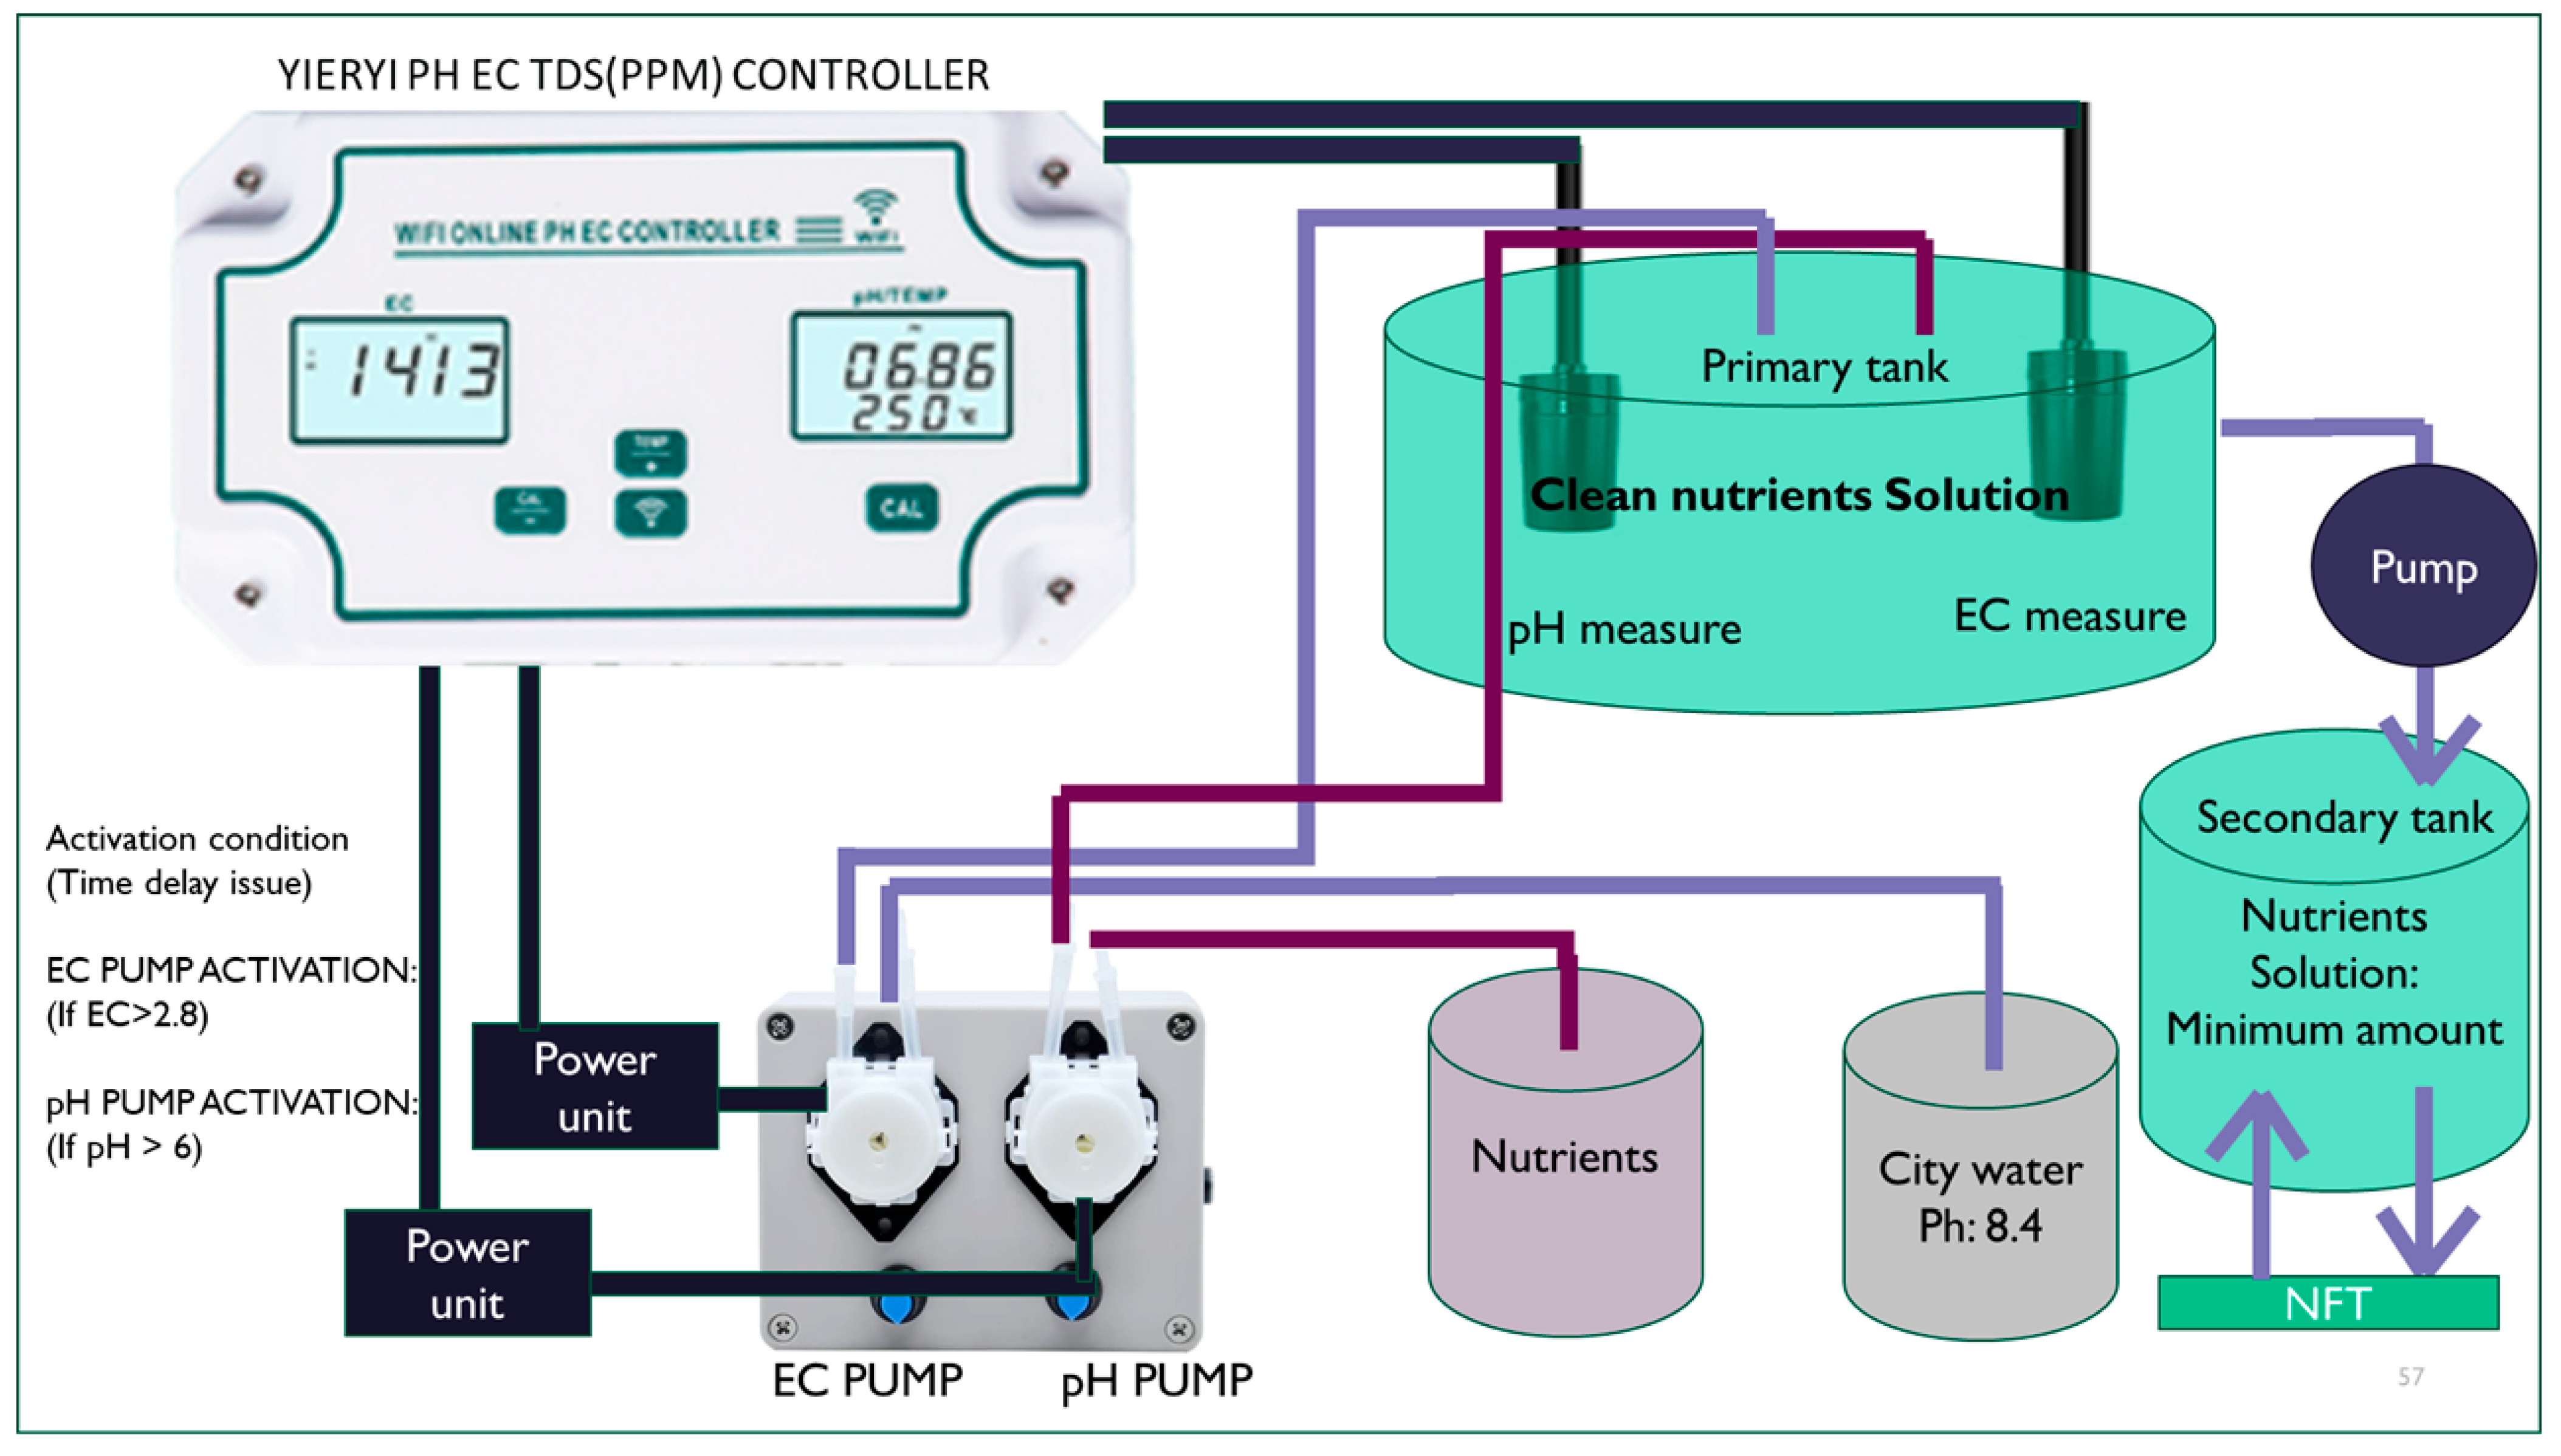
The nutrient solution control system is essential for the proposed bio-cell in the upside-down NFT (nutrient film technique) channel for several reasons. In this unique setup, maintaining precise pH levels and EC (electrical conductivity) is critical to ensure the optimal nutrient uptake for tomato plants. An automated control system helps maintain the nutrient solution within the ideal pH range of 6.0 to 6.3, which promotes healthy root development, efficient nutrient absorption, and overall plant growth. The upside-down NFT design can increase the risk of nutrient imbalances due to gravity affecting the flow of the solution. A controlled system ensures that the nutrient concentration remains balanced in the root zone, preventing issues such as nutrient lockout or toxicity. By automating the correction of pH imbalances, the system also reduces manual intervention, leading to more consistent growing conditions, enhanced plant health, and higher tomato yields in the bio-cell setup.
The system connects to the mobile application via Wi-Fi, enabling automated control of the power supply to the electric pump. Within the app, a permissible pH range can be set as an ‘if’ condition, triggering the system to turn the power supply ON or OFF based on the pH levels detected. In this setup, a pH range of 6.0 to 6.3 is designated for optimal plant growth in the NFT system. If the pH remains within this range, the power to the electric pump is turned OFF. However, if the pH falls outside this range, the pump is activated to deliver a low-pH solution from the nutrient tank to the water tank, helping to restore balance. The use of a secondary tank helps stabilize NFT nutrient levels by preventing fluctuations caused by variations in nutrient absorption between the daytime and nighttime. Additionally, maintaining the primary tank at the recommended levels of nitrogen, phosphorus, and potassium based on the plant’s growth stage ensures that the nutrient solution remains in the optimal condition for a continuous and balanced supply (
Figure 2).
Once the NFT-based experimental setup was constructed at the smart agriculture lab in Texas A&M University-CC, we developed necessary sensors for maturity measurement. Upon finishing the testbed and necessary sensors, data collection was initiated and performed for over 6 months. Modern sensor-based methods enable a non-destructive assessment of the above traits, providing a more comprehensive picture of tomato maturity than color inspection alone [
3]. Key sensor technologies include the following.
Computer Vision for Color and External Features: Machine vision systems (digital cameras with image analysis algorithms) are widely used to grade tomato color and size. High-resolution imaging combined with color analysis can classify tomatoes into maturity stages automatically, based on predefined color indices or using deep learning. In fact, deep learning models (e.g., CNNs) have achieved over 90% accuracy in distinguishing tomato ripeness stages from images [
2]. However, vision is inherently limited to surface characteristics—as noted, it is adept at identifying external maturity indicators but struggles with internal changes [
3].
Vis/NIR Spectroscopy and Hyperspectral Imaging: Visible/near-infrared (Vis/NIR) spectroscopy is a proven technique to probe the internal composition of fruits. Portable NIR spectrometers and hyperspectral cameras have shown success in predicting tomato quality attributes. Researchers report that hyperspectral imaging can accurately estimate the soluble solid content (SSC) and firmness of tomatoes non-destructively [
7]. Another demonstration from Fraunhofer researchers is that hyperspectral reflectance can measure tomato Brix to determine the perfect harvest time [
3].
Firmness and Texture Sensors: Devices like the Cantifruit sensor use a small, instrumented plunger that gently presses the tomato and gauges its resistance to deformation [
4]. Robotic grippers with force feedback and acoustic resonance methods are also employed. These tactile sensors directly relate to the fruit’s expected shelf life and texture quality—attributes not discernible from color.
Electronic Nose (E-nose) and Gas Analysis: Tomatoes emit ethylene and a mix of volatile organic compounds (VOCs) during ripening. Electronic nose devices use arrays of gas sensors to detect such volatiles, providing a rapid, non-invasive way to assess aroma profiles that correlate with the ripeness stage [
7]. One recent example is the “Tomato-Nose” system, combining gas sensors and an optical reader to monitor tomatoes at different ripeness levels [
7].
Advanced Imaging (Internal Structure Scanning): High-end imaging techniques like MRI and X-ray CT are used to examine internal features of tomato fruit. MRI can visualize the water distribution and internal cavities; X-ray tomography can show seed development and internal defects. While not practical for routine on-farm use, these are valuable in laboratory phenotyping studies [
8].
Plant Wearable Sensor Technology: Traditional methods, such as visual inspection and firmness testing, are subjective and unreliable across different growing conditions. The advent of wearable sensor technologies and AI-based assessment methods now offers a more precise, real-time solution for monitoring plant health and ripeness. Wearable sensors have become invaluable in precision agriculture, offering cost-effective and flexible alternatives to traditional monitoring systems. For example, the plant-wear system developed by Di Tocco et al. [
9] is a multi-sensor platform designed to track plant growth and microclimate conditions like real-time temperature and humidity indoors and outdoors. However, large-scale application of such technologies remains in its infancy and requires further research into long-term feasibility. Fiber optic technology also shows promise in plant monitoring. Lo Presti et al. [
10] introduced fiber Bragg grating (FBG) sensors as a wearable solution for measuring plant growth and microclimate factors such as temperature and humidity. These flexible, lightweight sensors continuously monitor plant health and are particularly suitable for smart farming applications. This study integrates similar wearable sensor systems to assess physiological conditions such as plant hydration and maturity detection via the NFT and soil-based indoor farming environments.
2.2. Key Phenomics Traits and Physiological Factors Influencing Tomato Quality
To optimize eating quality and storability, several fruit attributes besides color should be evaluated prior to harvest:
Firmness (Texture): Firmness is a crucial indicator of ripeness and postharvest life. As tomatoes ripen, cell wall enzymes cause a progressive softening of the flesh. This affects mouthfeel and also determines resistance to transport damage. A firm, mature-green tomato will have a crisp texture but underdeveloped flavor, whereas a fully vine-ripe tomato is tender and juicy but prone to bruising. Studies have quantified this softening—e.g., a drop from ~43 N to ~25 N in compression force between mature-green and red-ripe stages [
4]. Because texture changes are not visible externally, measuring firmness can signal ripeness beyond what color shows. Optimal harvest often involves finding a firmness level that balances shelf stability and eating quality.
Soluble Solids (Sugar Content): Sugar levels (often measured as °Brix) rise during tomato ripening and are strongly linked to flavor sweetness and consumer preference [
7]. Green or breaker-stage tomatoes have lower soluble solids, while tomatoes allowed to ripen on the vine accumulate more sugars and taste sweeter. However, two tomatoes with similar red colors can have different Brix values depending on growing conditions and ripeness. For instance, research has shown that fully red tomatoes contain significantly higher reduced sugars than earlier stages, correlating with a better taste [
4]. Measuring the sugar content provides a direct indicator of the flavor potential that color cannot fully guarantee.
Acidity and Flavor Compounds: The balance of sugars and acids (such as malic and citric acid) defines tomato taste. Acidity tends to decrease slightly as the fruit ripens (raising pH), but the change is variety-dependent. More noticeable are the aroma volatiles—dozens of compounds (aldehydes, alcohols, ketones, sulfur compounds, etc.) that create the tomato’s flavor aroma. These compounds (e.g., hexenal, geranylacetone) dramatically increase in late ripening stages. A tomato picked too early may never develop the same volatile profile, even if it later attains full color [
5]. Likewise, a slightly pale tomato that is soft and aromatic might be flagged as ready despite its lighter color. Aroma is thus a critical quality attribute linked to ripeness, but it requires sensory or instrumental detection rather than visual cues.
Internal Structure and Composition: Tomato ripening involves internal changes such as gel formation around seeds, reduction in starch, and increased lycopene and beta-carotene in the flesh. Nutritional components like lycopene (a potent antioxidant) and vitamin C reach their peaks at full ripeness, enhancing the fruit’s nutritional value [
11]. On the other hand, an internally immature tomato (even if partially red outside) might have white, starchy flesh and undeveloped seeds. Internal structural maturity (often termed “physiological maturity”) is important for a tomato’s ability to continue ripening off-vine. This trait is not apparent from external color alone.
Table 1 and
Table 2 outline the selected physiological traits and their corresponding monitoring methods used in the proposed multimodal data fusion framework.
This study aims to integrate in situ physiological and phenomic traits’ monitoring, including humidity sensors, phenomic assessments (e.g., stem thickness and leaf size), and AI-based chromatic assessments via digital refractometers and spectrophotometers. This approach provides both quantitative and qualitative assessments of tomato health and ripeness. With enough data accumulated over time, the aim is to develop an AI-driven model that can, first, maintain plant growth on the basis of bio-feedback and, second, predict the optimal harvest time and assess harvest readiness with high precision. The main contribution of this paper is to present integrated approaches for real-time and autonomous plant phenomic and physiological data collection to perform a foundational work toward bio-feedback-based plant health monitoring and harvest readiness evaluation.
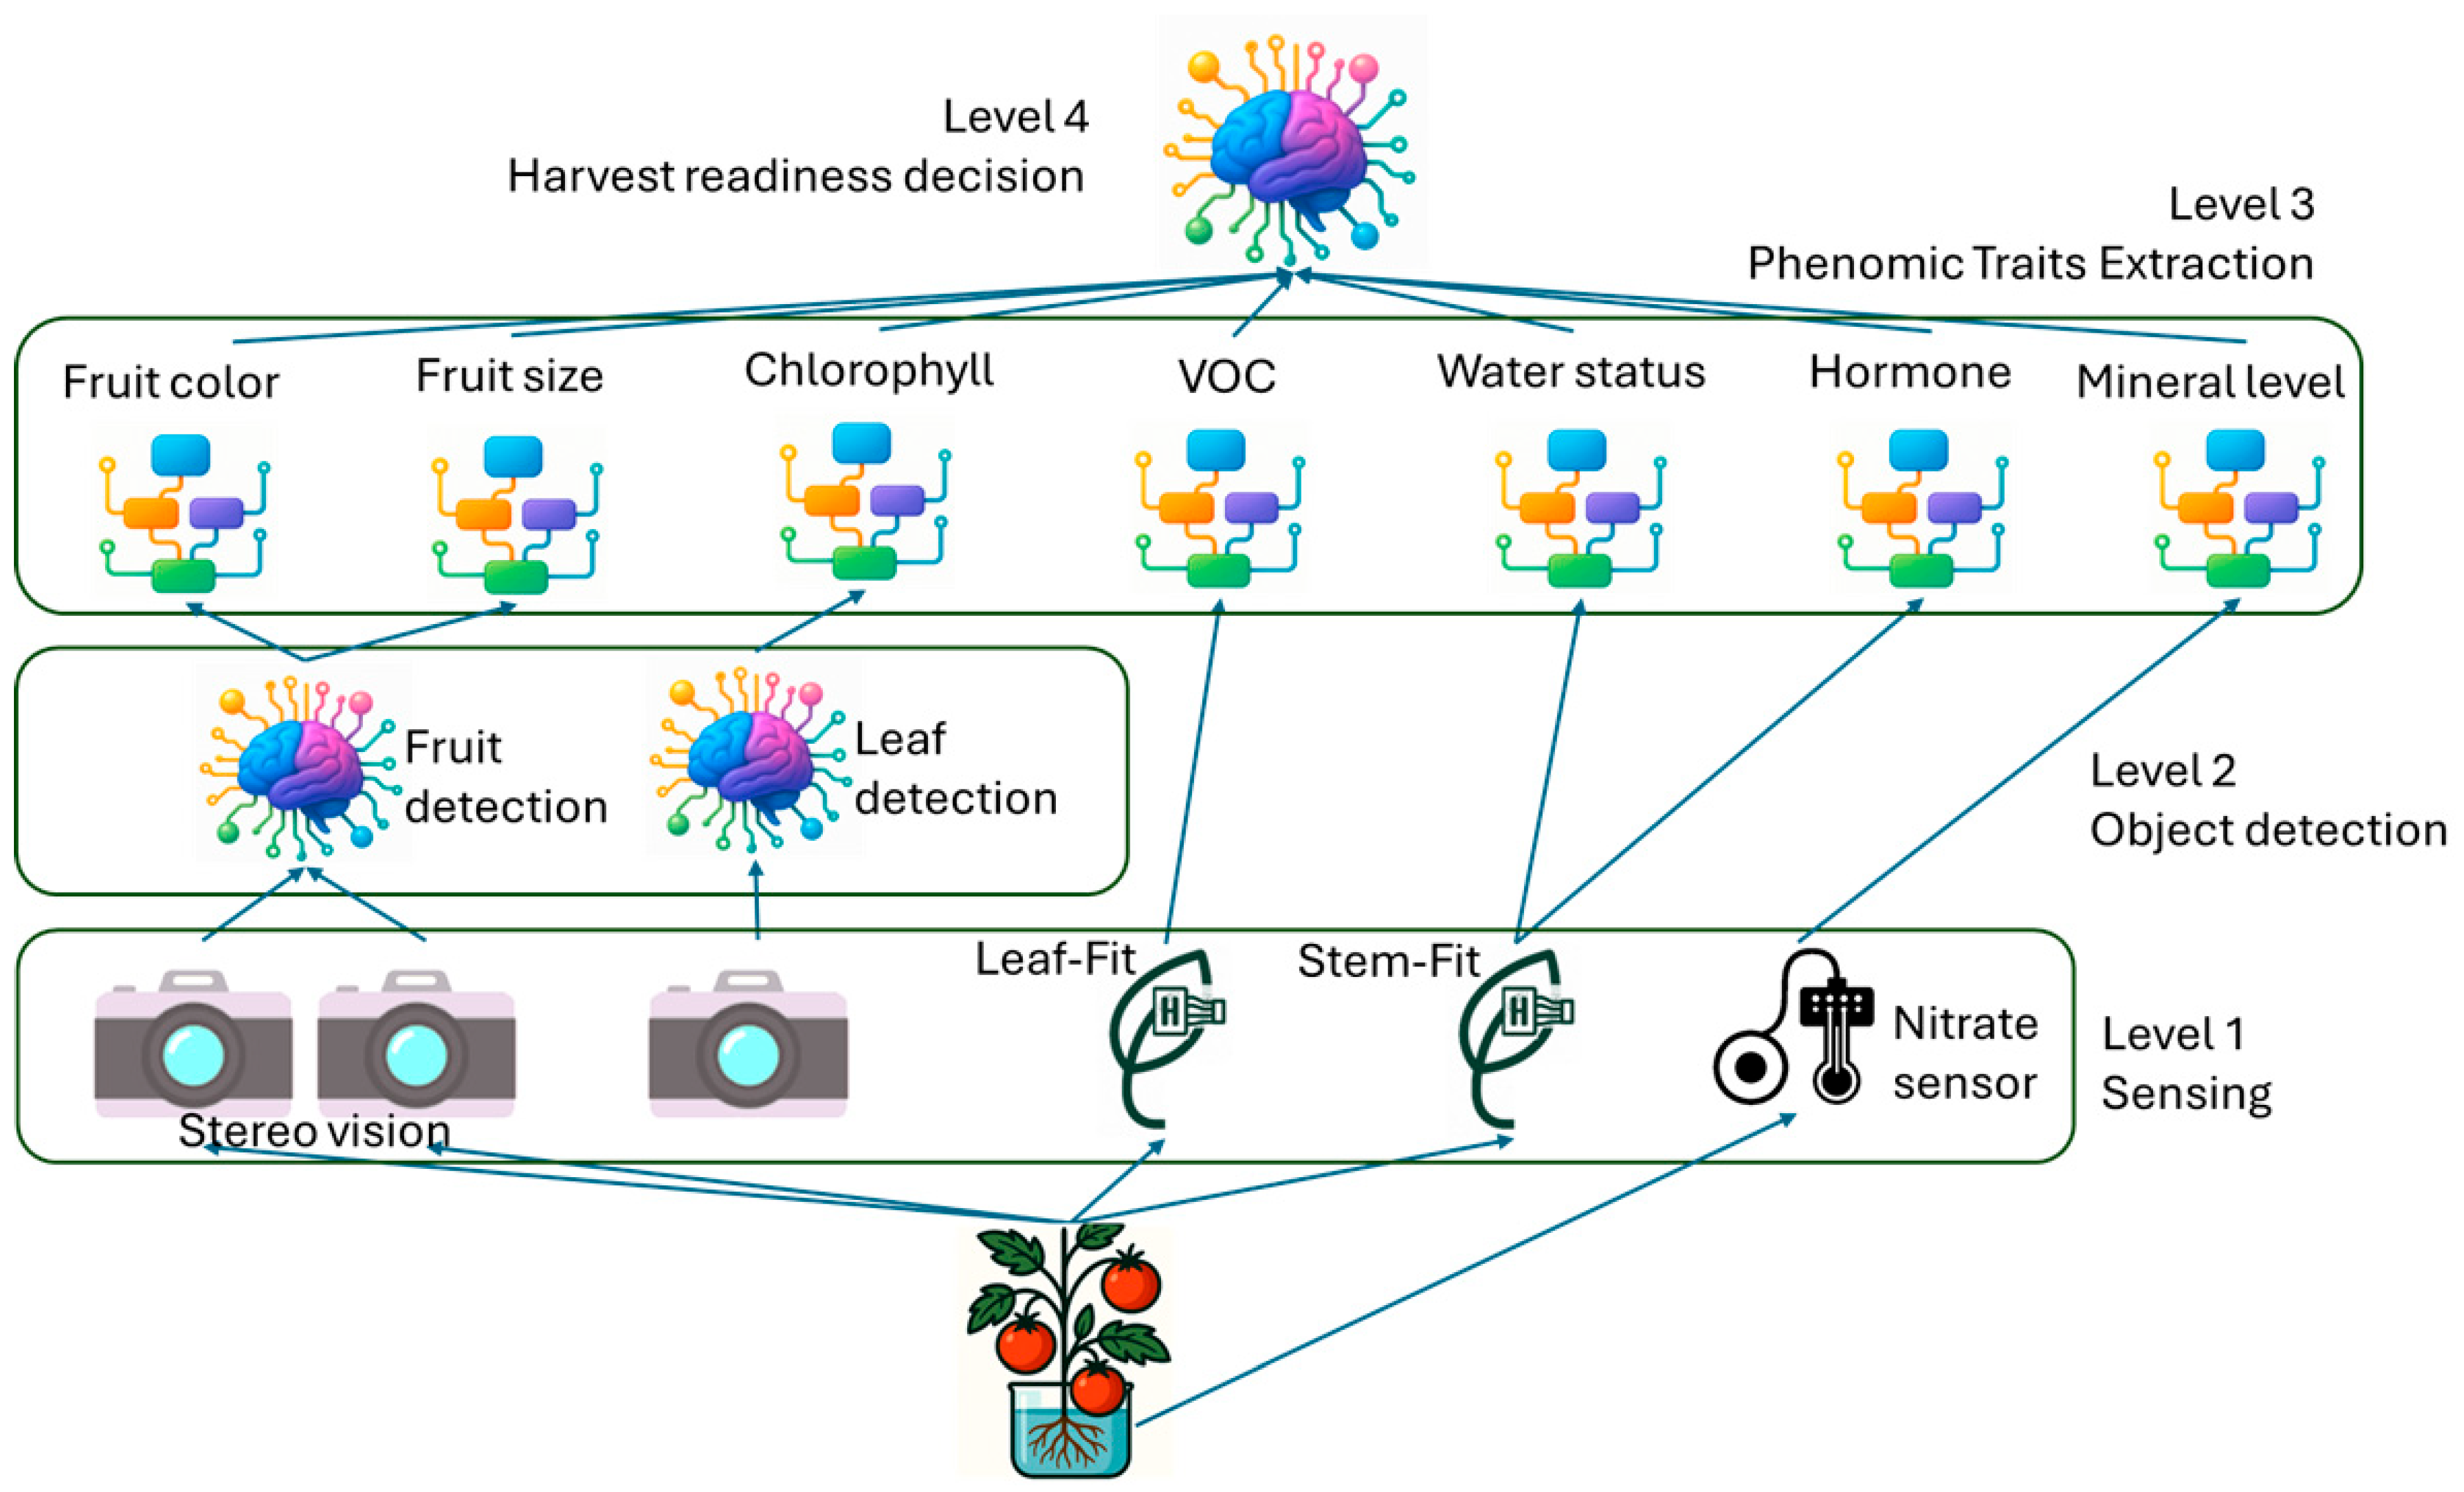
Figure 3 illustrates the key plant traits we aim to monitor in real-time to assess tomato plant health and ripeness readiness. The entire process is divided into four levels:
Level 1: Raw sensor data is collected and preprocessed for object detection.
Level 2: Using the YOLOv4 approach, individual plant traits are identified and extracted.
Level 3: The extracted traits are quantitatively analyzed.
Level 4: A ripeness decision model is used to check the harvest readiness from all 7 measurements.
This paper focuses on contributions spanning Level 1 through Level 4. In Level 4, a simple rule-based decision model is used to validate harvest readiness. First, the fruit must pass the size and color test, followed by validation of each criterion. Therefore, only fruits that pass through all the tests will be harvested. This method can be improved by a machine learning model that can evaluate the level of harvest readiness of each fruit for quantitative assessment.
2.3. Sensor Technology
As an initial screening method for assessing tomato ripeness, the focus is on measuring fruit color and size. This study integrates digital tools—including a refractometer for sweetness measurement and a spectrophotometer for color analysis—with AI-powered image processing to monitor fruit development. To further enhance phenotyping, the experiment incorporates techniques such as fruit size estimation using stereovision to estimate fruit size accurately. These combined approaches provide a comprehensive evaluation of the first signature of the fruit ripeness.
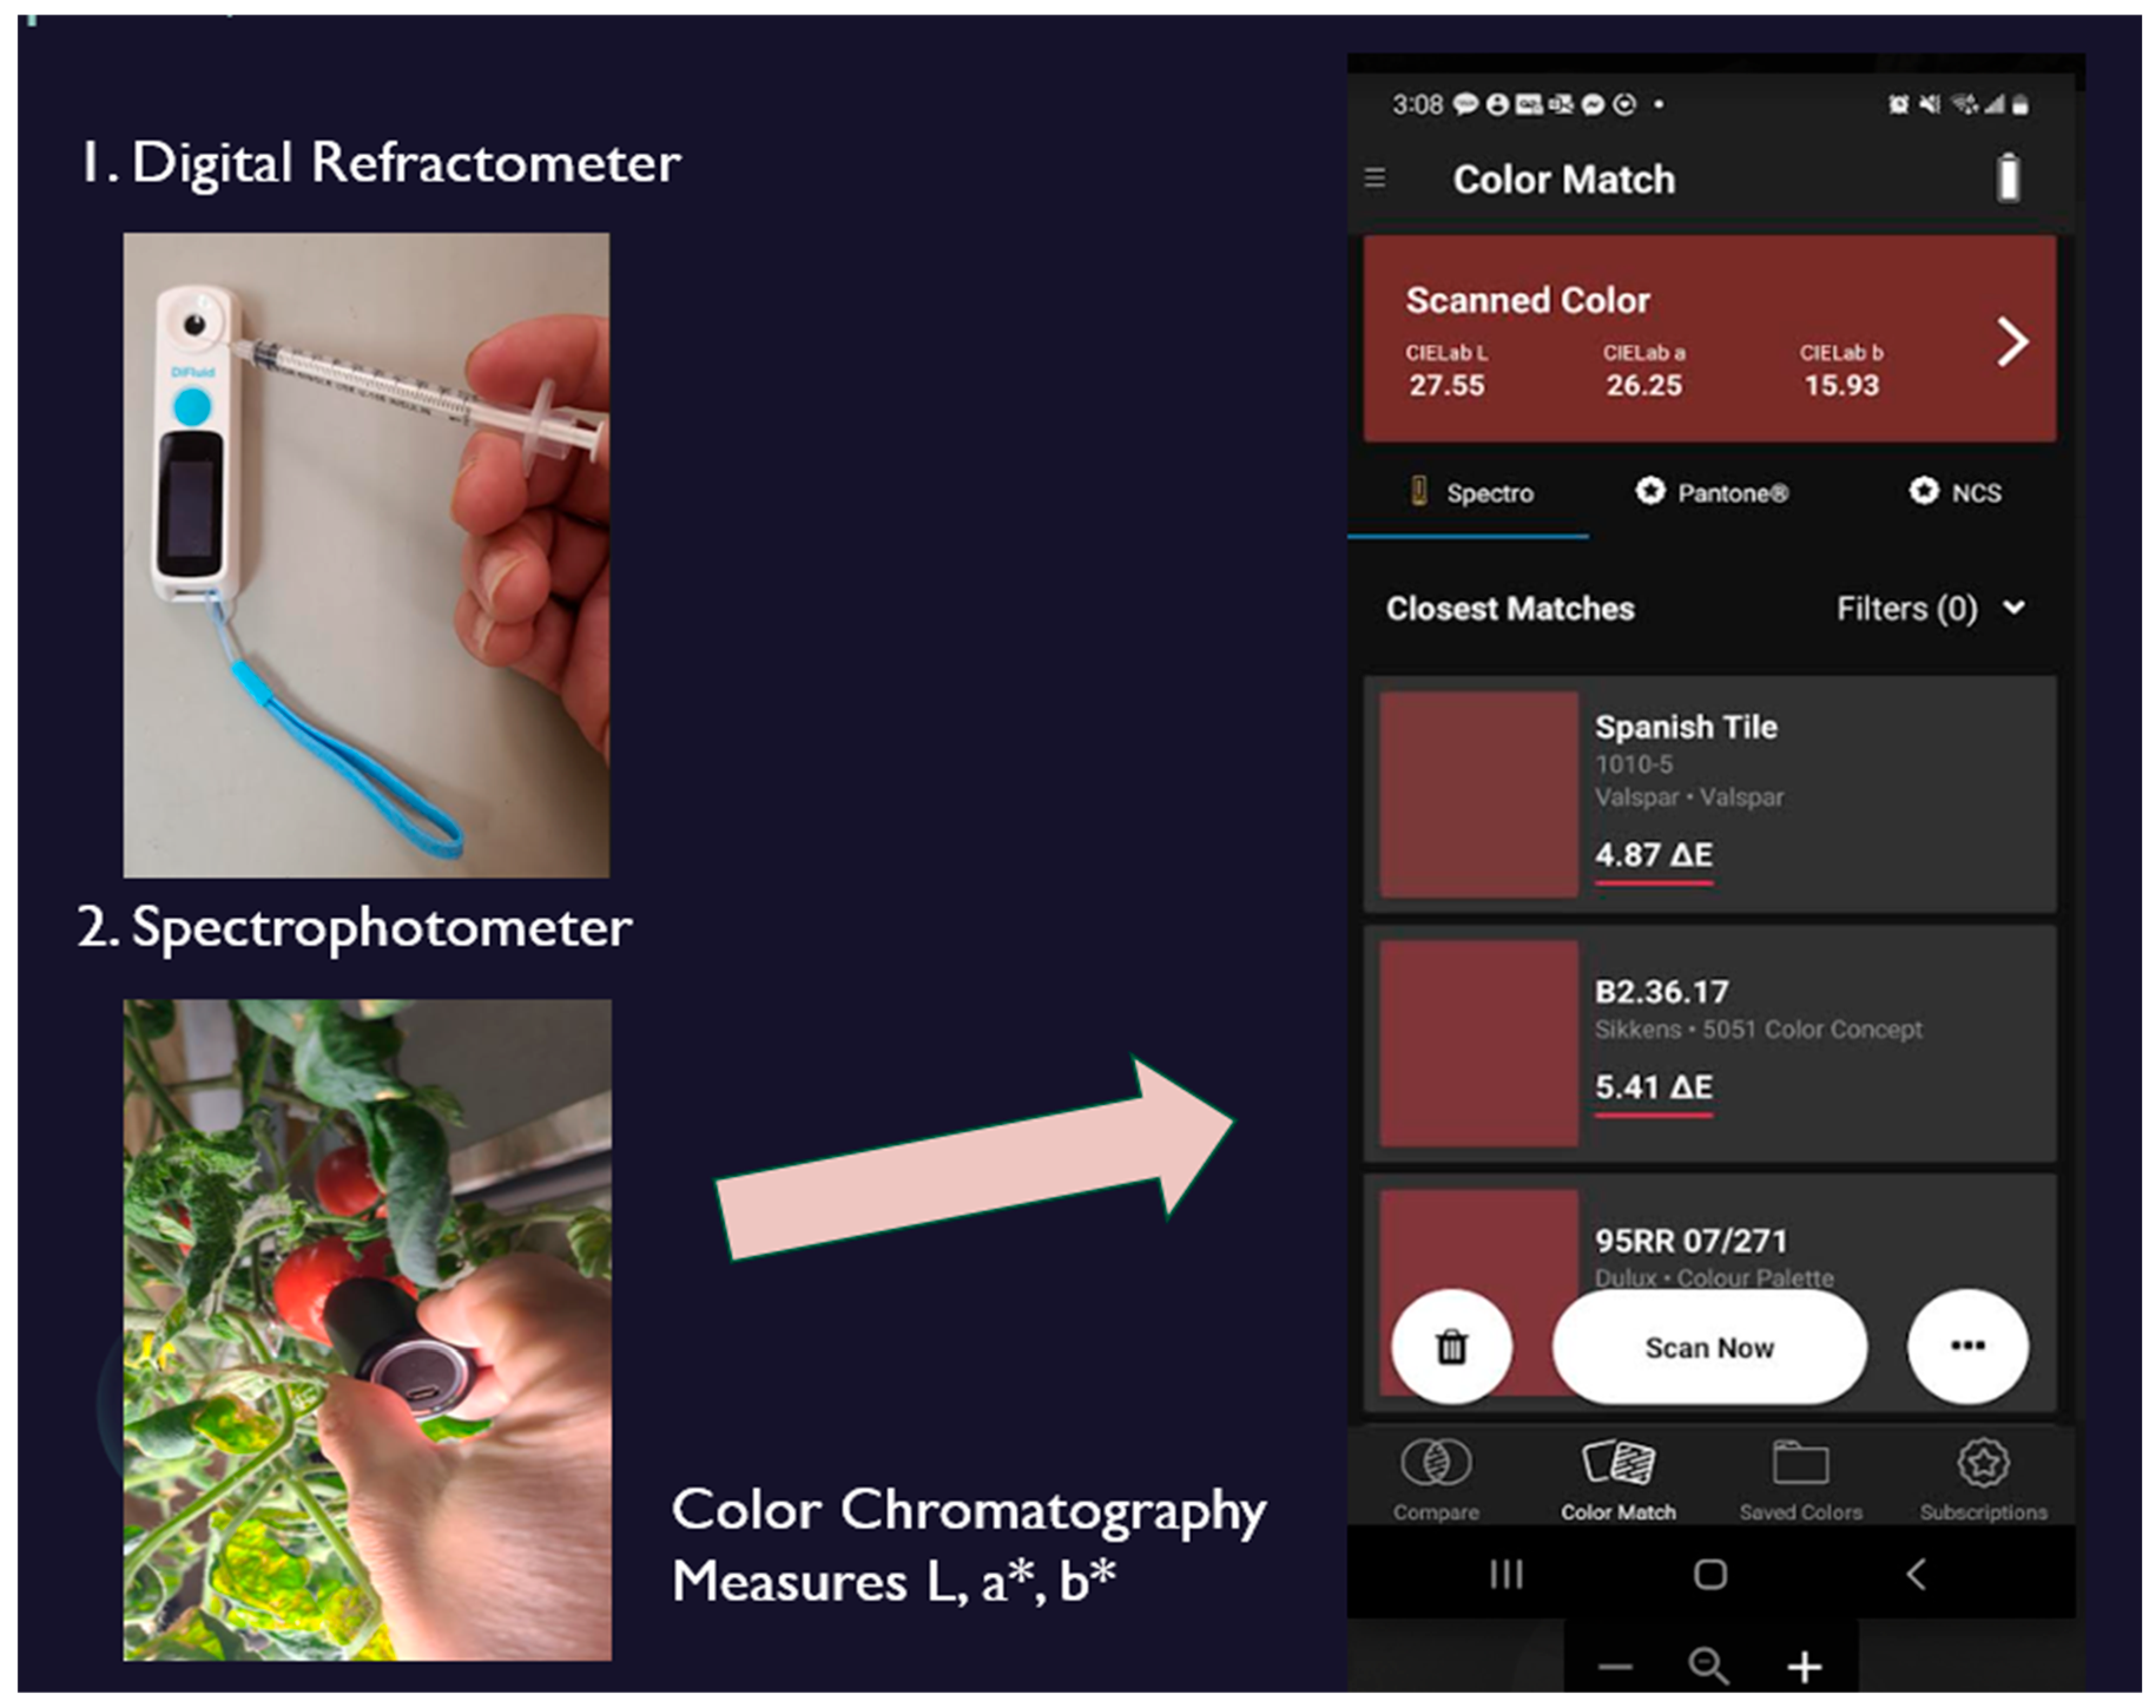
2.3.1. Color Chromatography
Sweetness, an important indicator of fruit ripeness, was measured using a digital refractometer. Tomatoes at appropriate developmental stages were selected for testing, and juice was extracted using a sterile syringe. Prior to each measurement, the refractometer was calibrated by cleaning it with water and ensuring a baseline reading of 0% Brix. A small amount of tomato juice was then placed on the refractometer sensor surface, and the sweetness level was recorded by activating the device (
Figure 4). Measurements were conducted daily to capture changes in soluble sugar content throughout the ripening process. This data will be later used for a color-based sweetness estimation model.
To assess surface color characteristics during tomato ripening, a portable spectrophotometer was employed to measure colorimetric values, including L*, a*, b*, hue, chroma, and lycopene content (
Figure 4). Measurements began at the unripe stage and continued throughout the ripening process to capture dynamic changes in fruit pigmentation.
2.3.2. Fruit Size by Bounding Box Estimation and Depth Sensing
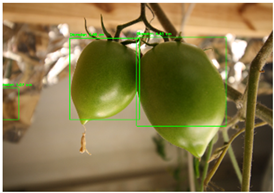
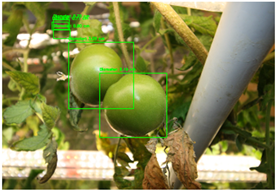
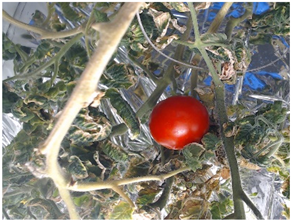
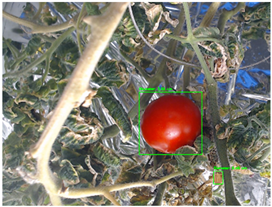
As an initial screening method for assessing tomato fruit ripeness, AI-driven visual sensing is employed to estimate fruit size. The YOLO 8 (You Only Look Once) object detection algorithm is used to generate bounding boxes around detected fruits in captured images. The coordinates of the top-left and bottom-right corners of each bounding box are used to calculate the width (w) and height (h), which serve as proxies for the fruit’s dimensions. These measurements, including the bounding box area and aspect ratio (w/h), provide information on both size and shape. To approximate real-world dimensions, the bounding boxes are scaled using reference objects within the image and enhanced through depth sensing. This size estimation allows for the identification of fruits that are likely to be mature and ready for harvesting.
The tomato images are preprocessed and divided into an 8:1:1 dataset, where 179 data images were used for both the test and validation sets, and 817 data images were used for the training set. After creating the configuration file (YAML), we chose the yolov8s.pt model to train on the tomato dataset.
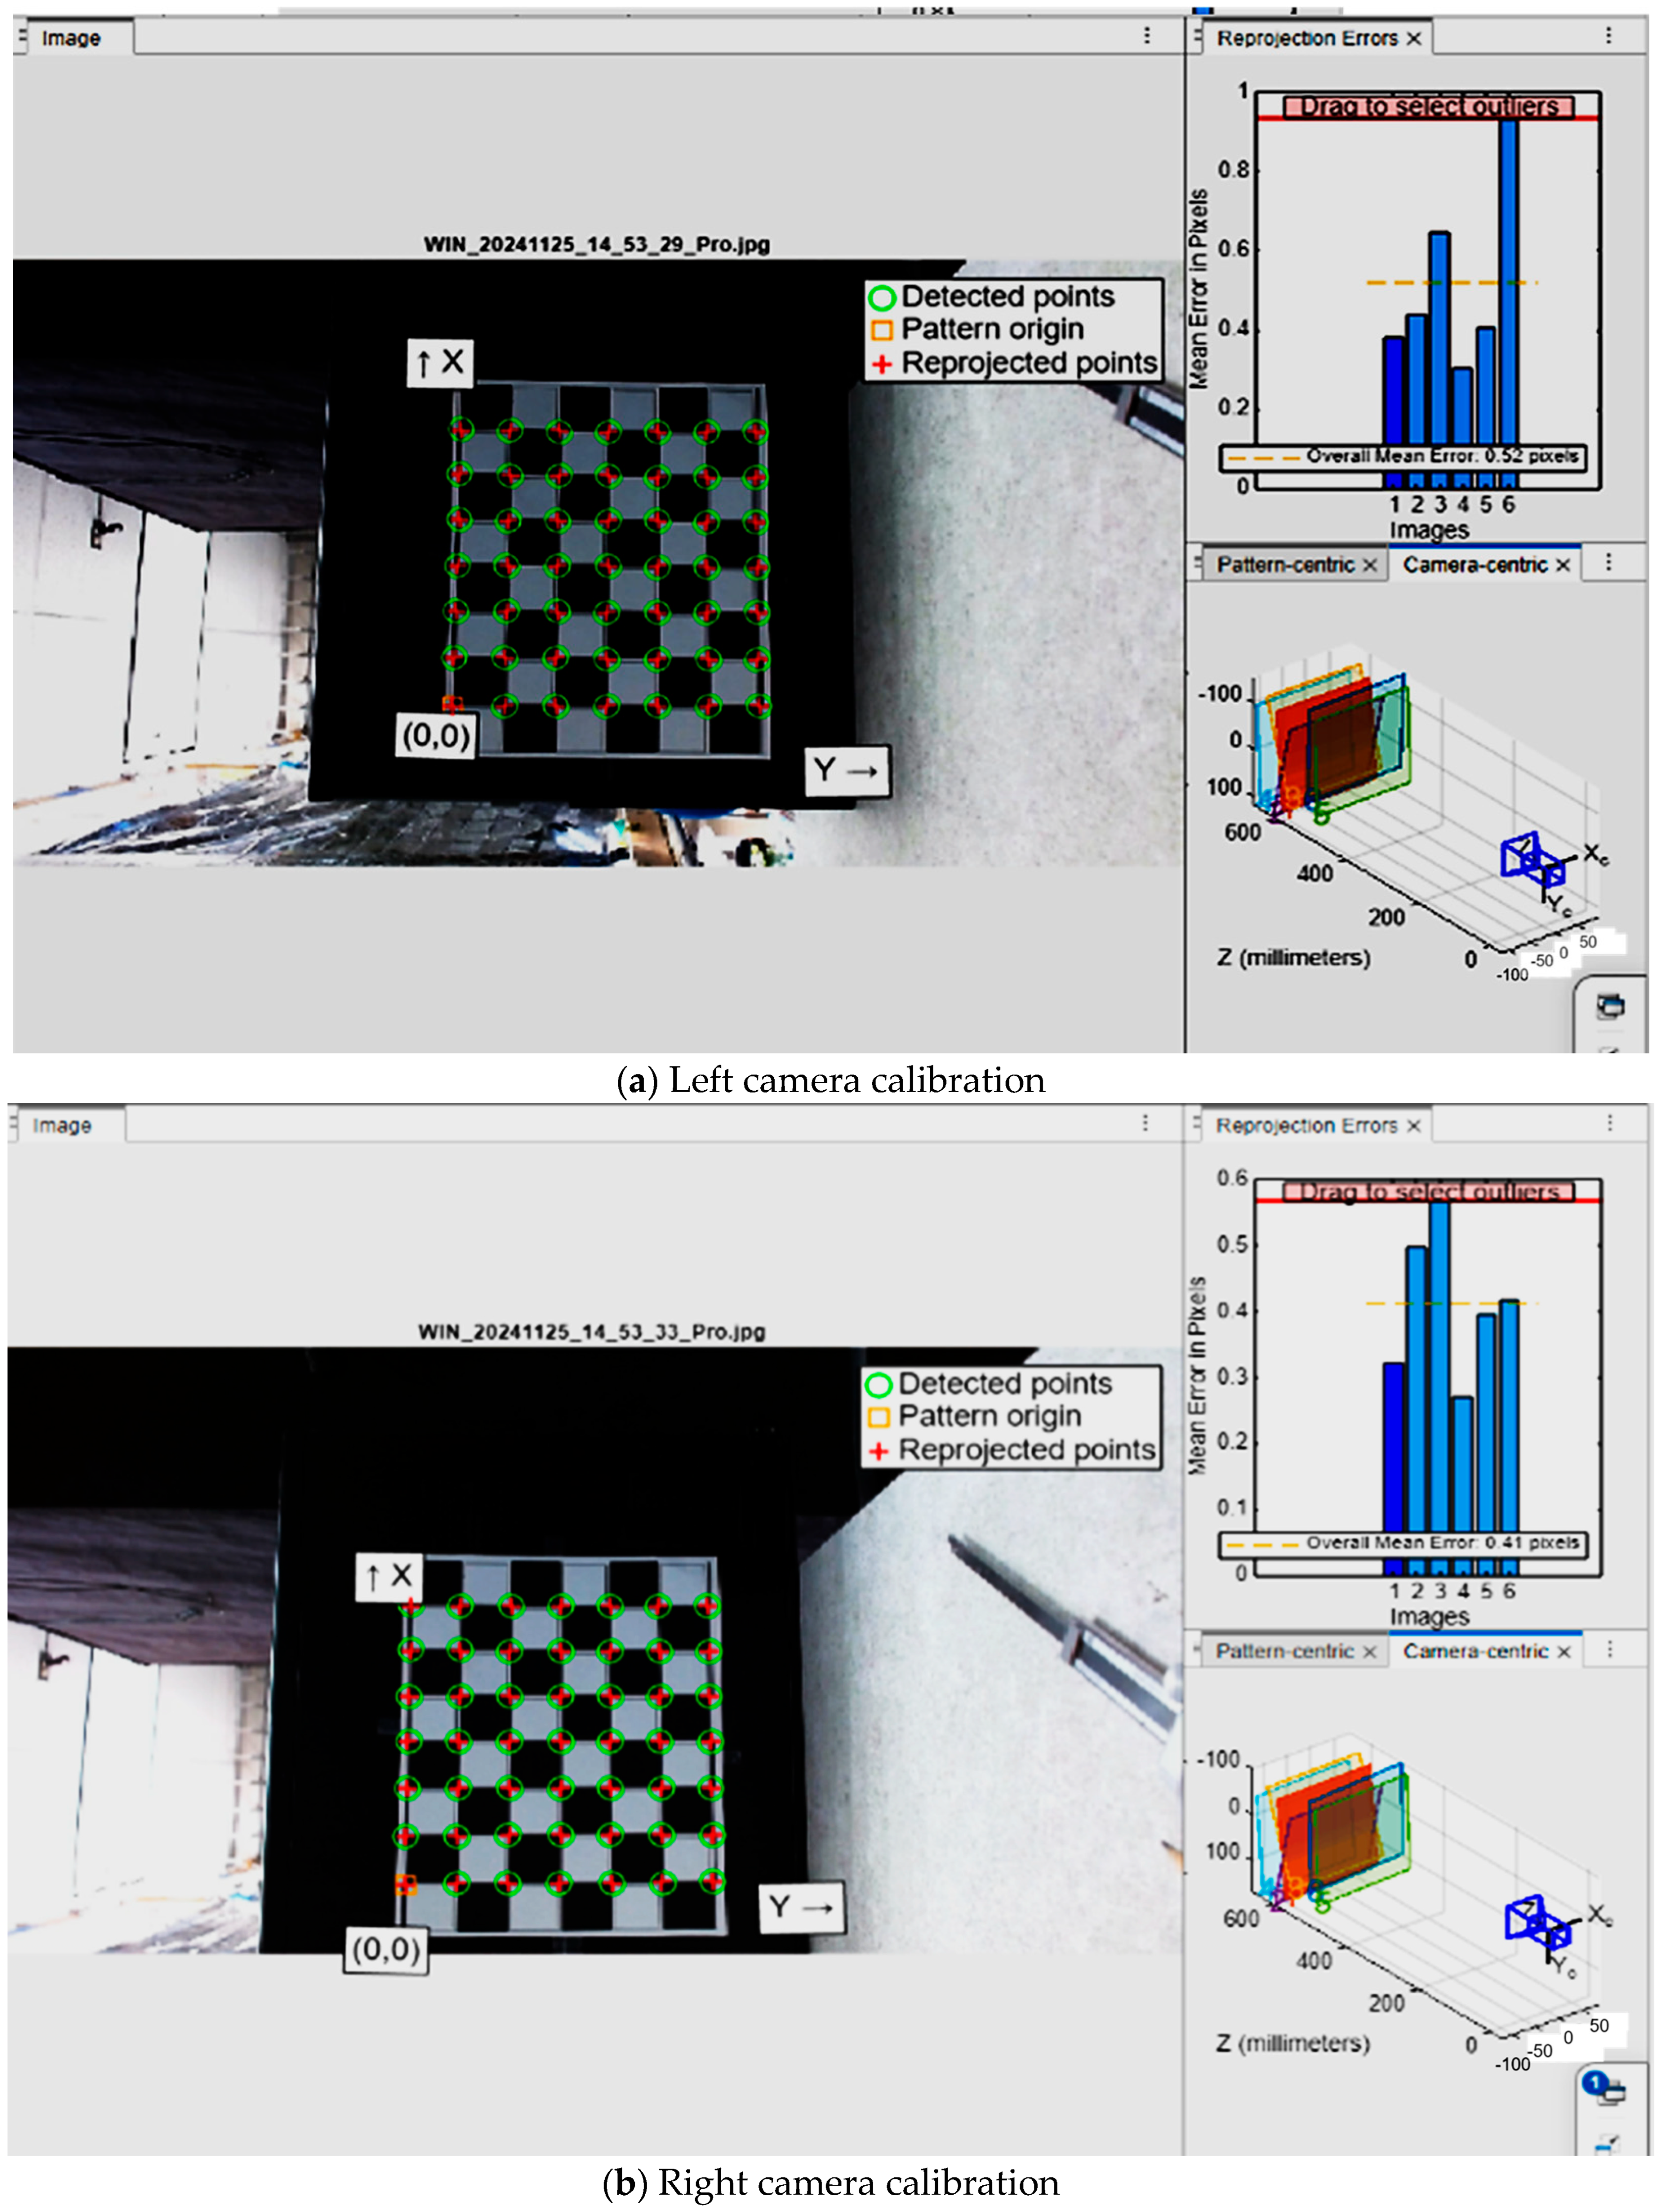
Stereovision is a technique used to replicate human depth perception by analyzing two images of the same scene from different viewpoints. In our project, stereovision can enhance object detection by providing in-depth information, which is critical for accurately measuring the size and position of a tomato in 3D space. The stereo-depth calculation method involves using a stereo-vision system, consisting of two cameras aligned horizontally and calibrated to compute depth information
The calibration results were exported as stereoParams (MATLAB (R2025a) stereo-parameter format), containing both intrinsic and extrinsic parameters, including the baseline distance between the cameras and their relative orientation (
Figure 5).
The regression equation for depth estimation is formulated as
where
x represents the actual distance and
y is the measured value. This regression model was used to refine depth calculations. By applying this equation, measurement errors were corrected, enabling a more precise estimation of fruit size. To validate this approach, a tomato with a known diameter of 50 mm was placed at five different distances. Using the corrected depth values, the approximate fruit diameter was recalculated, ensuring an improved accuracy in fruit size estimation based on depth perception.
2.3.3. Water Status by Humidity
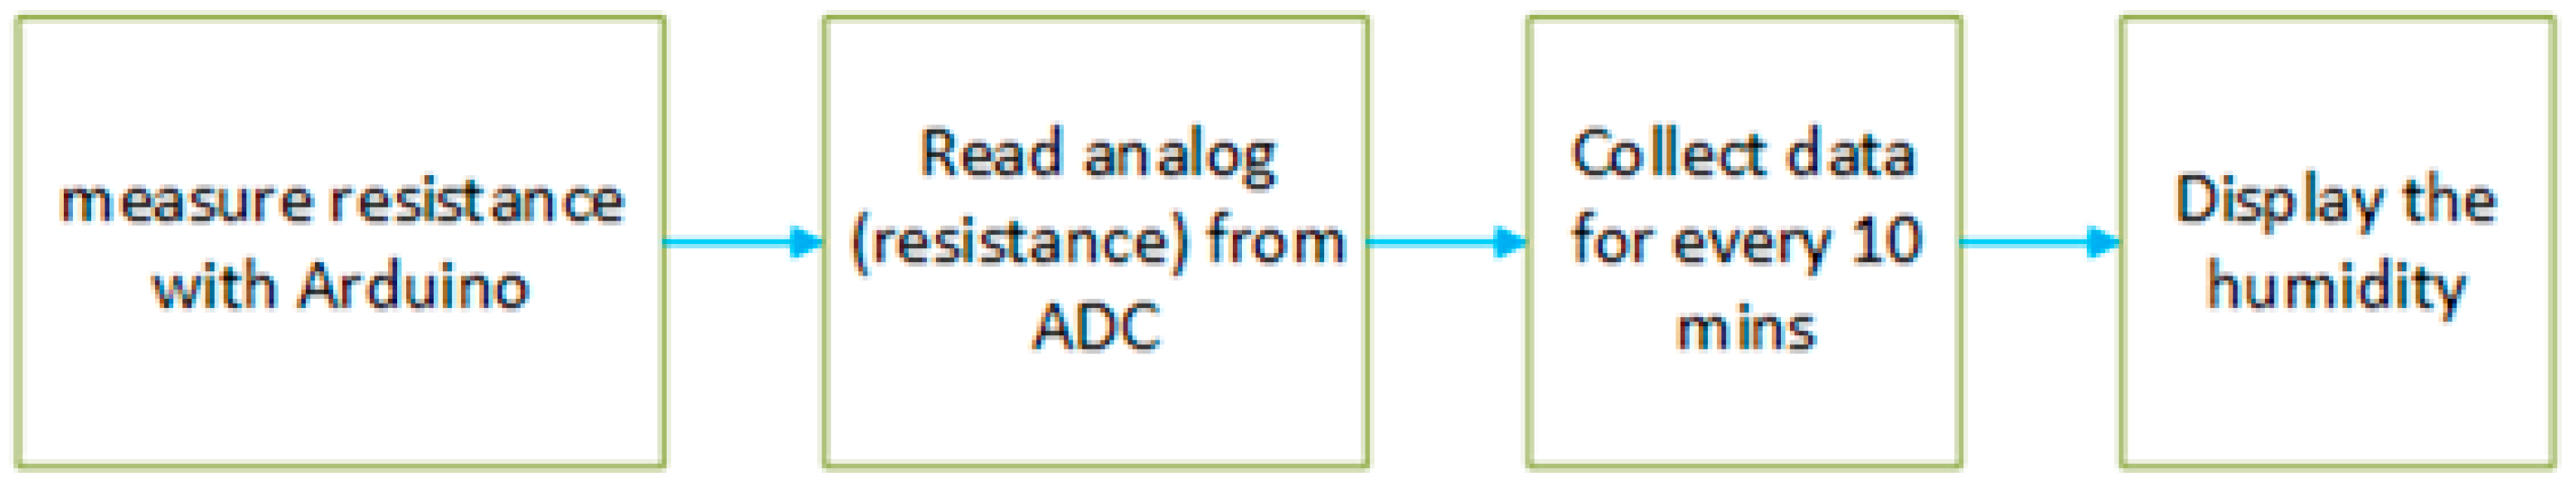
The amount of water that plants have is essential to their development, well-being, and yield. Measuring the humidity levels around and within the plant is a useful method of determining this because it can reveal the plant’s state of hydration. A lower water content is typically correlated with higher resistance, suggesting that the plant may be experiencing water stress. Conversely, lesser resistance suggests increased water availability inside the plant tissue. After that, the relative humidity percentages obtained from these resistance readings are transformed into a quantifiable measurement. By tracking humidity levels over time, it is possible to monitor the plant’s hydration patterns and make informed decisions regarding irrigation or water management. This non-invasive method provides a reliable way to gauge water availability in plants without causing damage to the tissues.
Humidity is then estimated using a linear equation (slope = –1.5, intercept = 100%) based on resistance values collected through the Arduino. Then, the humidity is calculated as
where
H is humidity,
r is resistance, and
s and
y are parameters of the linear relationship between humidity and resistance.
2.3.4. Chlorophyll Content
Chlorophyll is essential for tomato plant health, serving as the primary pigment for photosynthesis—the process that converts sunlight into energy. Its concentration reflects the plant’s nutritional status, particularly nitrogen levels critical for rapid growth. High chlorophyll levels promote vigorous photosynthesis, enhancing overall development. As fruits mature, chlorophyll degrades, allowing carotenoids like lycopene and beta-carotene to accumulate—key indicators of ripening. Monitoring chlorophyll using tools like SPAD meters helps predict ripening stages and optimize fertilizer management for improved growth and yield.
2.3.5. Mineral Deficiencies in the Hydroponic Medium
Hydroponics relies on the solution as the only mineral source for plant growth, making nutrient depletion a limiting factor for development [
16]. On the other hand, ensuring a constant supply of nutrient-rich solutions can lead to excessive nitrate absorption by plants, posing potential health risks for humans. Thus, it is crucial to carefully manage the nutrient supply to maintain a balance between optimal plant growth and safe nutrient levels in consumable parts. In hydroponics, nutrients are typically delivered by targeting a specific electrical conductivity (EC), often without measuring the individual nutrient concentrations. This is due to the cost and complexity of frequent assessments. However, this method can result in nutrient imbalances and hinder crop growth. Research on greenhouse-grown lettuce demonstrated that recycling the nutrient solution to maintain an EC of 1.8 dS·m
−1 caused a significant reduction in both shoot fresh and dry weight, decreasing by 22–36% compared to a control that used newly prepared solutions at the same EC. Additionally, recycling led to lower N, P, K, and Fe levels in tissue concentrations, with an increase in Na and Cu levels. There was a substantial rise in solution EC between adjustments, negatively influencing plant growth. Image analysis revealed adverse effects on the canopy area two weeks post-transplanting, attributed to the buildup of undesirable compounds like bicarbonates and gradually consumed nutrients such as Ca and Mg from moderately alkaline tap water. These cumulative effects artificially elevated solution EC, obscuring the decline of essential nutrients, resulting in nutrient deficiencies in the tissue and impaired plant growth. A different study by Pardossi et al. [
17] investigated how tomato plants in NFT absorbed macronutrients at two nutrient levels: 3.2 g/L and 1.8 g/L. The results indicated that a higher nutrient concentration increased fruit yield and greater mineral uptake. The peak growth and nutrient absorption occurred between the fruit set and the early harvest period. Nonetheless, both nutrient solutions displayed a low overall nutrient uptake, attributed to a decreased root efficiency as time progressed. Although no leaf nutritional disorders were detected, the quality of the fruit was found to be lacking.
Additionally, the recycling process can cause ion accumulation, which leads to nutrient imbalances that harm crop yield and quality. Lopez et al. [
18] examined the short-term impacts of nutrient solution recirculation on greenhouse tomatoes in an experiment. After four weeks of continuous recycling, there was a notable buildup of ions (K
+, Mg
2+, Ca
2+, SO
42−, Na
+, Cl
−), which resulted in increased salinity and electrical conductivity of the solution. While foliar nutrient levels remained unaffected, ion concentrations were higher in NFT than in substrate systems. Although the total fruit yield was 11% greater in substrate systems, the marketable yield dropped by 22.4% with recycled solutions due to increased salinity. Vigorous root growth and function are vital for absorbing nutrients, promoting growth and fruiting in NFT tomatoes. Throughout the peak growth phase (from the first fruit set to harvest), boosting the nutrient supply by increasing the solution volume per plant through automation rather than escalating concentration to prevent physiological complications in adverse conditions is essential. Key strategies for maintaining root efficiency include wide gullies, elevated flow rates, aeration, and managing root diseases.
2.3.6. Abiotic and Biotic Stresses Through Phytohormone and VOC Levels
This experiment was to develop the Leaf-FIT and Stem-FIT systems [
12,
19,
20], which are flexible patch-like or microneedle-structured multi-sensor platforms designed for in situ and real-time monitoring of phytohormone levels (i.e., salicylic acid) and volatile organic compounds (i.e., ethylene) in plants, as well as the leaf microclimate (i.e., temperature and humidity). The patch-style Leaf-FIT sensor is fabricated using a roll-to-roll screen-printing technique and attached to the leaf using a simple stick-and-peel mechanism. The Stem-FIT sensor, featuring a microneedle structure, is 3D-printed and semi-implanted into the stem. Both sensor arrays are immobilized with chemical assays for selective interactions with target analytes. Salicylic acid and ethylene function as the plant’s primary defense response to environmental stress conditions [
21], and their concentrations in the leaf and stem are measured by the Leaf-FIT and Stem-FIT sensors through electrochemistry and correlated with water stress conditions. The leaf microclimate sensors measure leaf temperature and humidity to examine the spatiotemporal dynamics of water transport across the plant, which are then used to calculate the leaf-scale vapor pressure deficit. These temperature and humidity sensors measure resistance variations corresponding to changes in leaf temperature and relative humidity, respectively. Additionally, principal component analyses reveal a strong association between hormone levels, vapor pressure deficit, and water transport within the plant.
In another work, we have introduced a plant tattoo sensor to continuously measure ethylene emissions under water, temperature, and light stress [
22]. Statistically significant differences, with
p-values below 0.05, are identified between the various stress types. Non-biodegradable sensors contribute to environmental pollution, emphasizing the need for biodegradable sensors in greenhouse and agricultural applications. To address this, we developed a biodegradable sensor substrate from polyvinyl alcohol and corn starch, featuring a screen-printed interdigitated electrode coated with a metal-oxide nanorod and platinum nanoparticle composite for detecting gaseous methanol [
13]. This biodegradable patch was tested in situ on tomato plants under various stress conditions, including water deprivation (24 h without irrigation), wounding (injury on a plant node), and light stress (24 h in darkness). Attached to the leaves, the sensor detected methanol emissions, with the highest capacitance changes during water stress.
3. Results
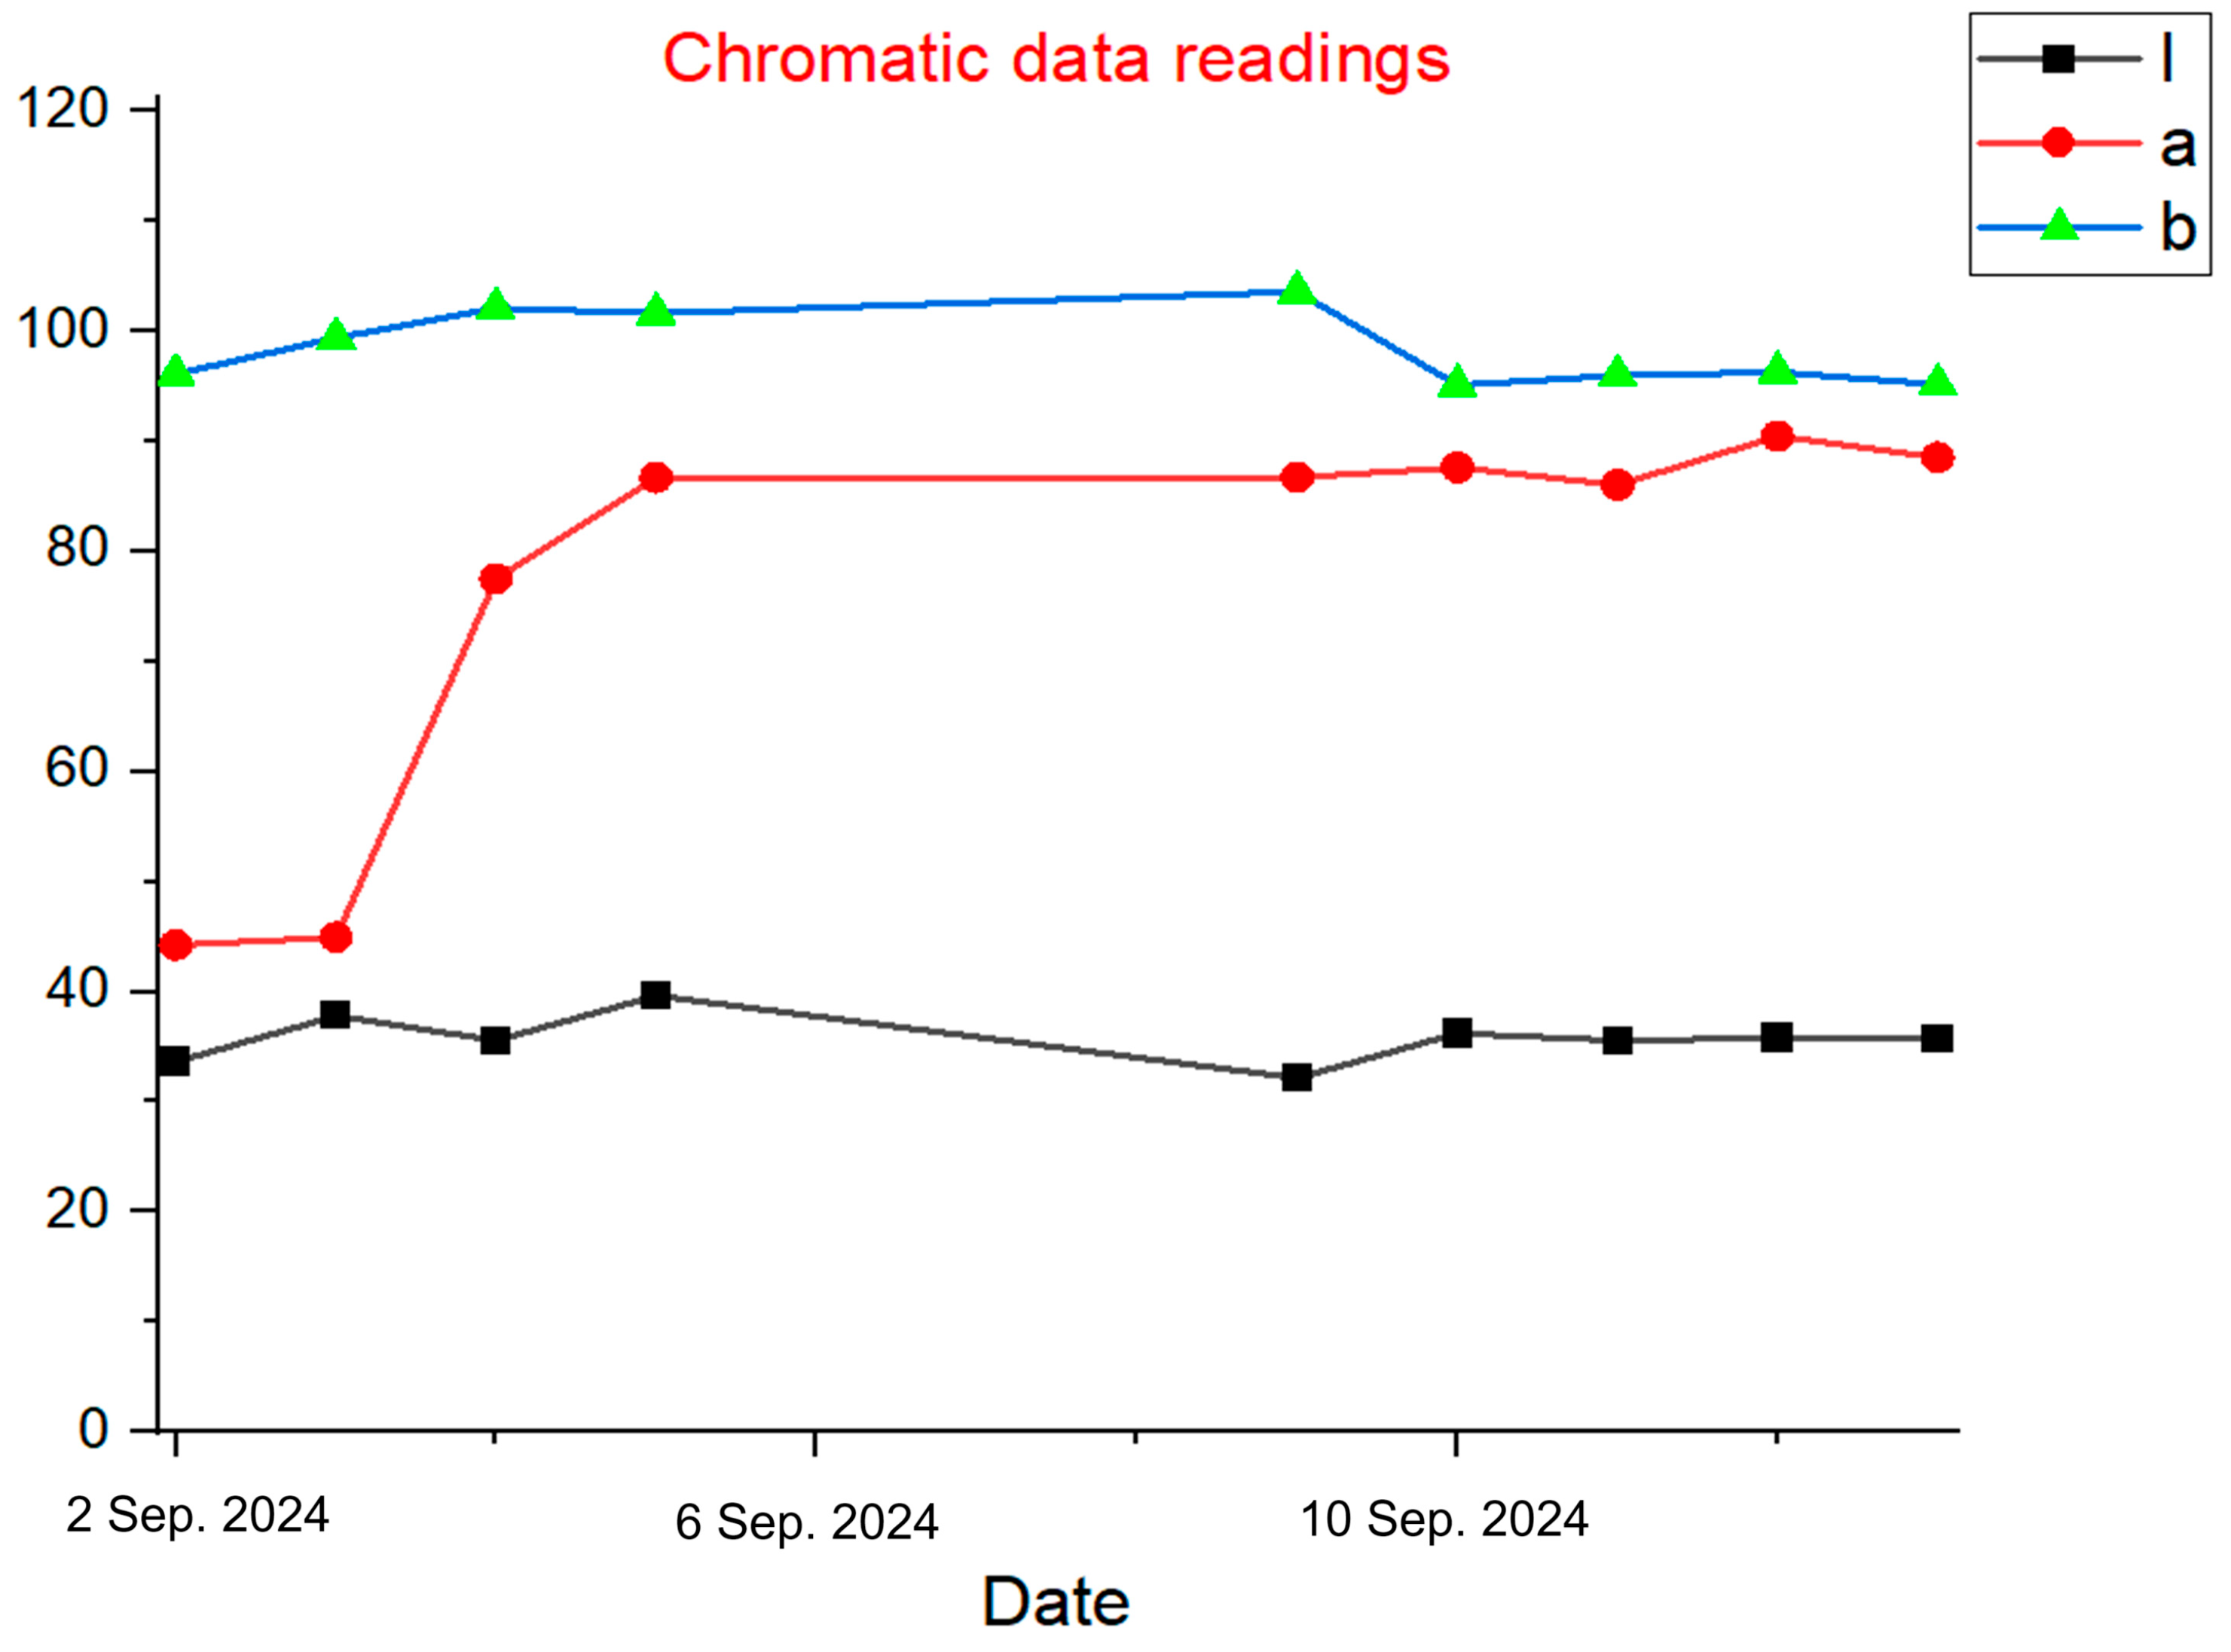
3.1. Color
Figure 6 presents spectroscopic measurements of a tomato fruit collected from bio-cells, illustrating the temporal progression of color parameters during ripening. Each graph displays a specific color metric: Graph 1 shows L* values in black, Graph 2 shows a* values in red, and Graph 3 shows b* values in green. The data represent the developmental trajectory of a single fruit, with results indicating a notable increase in the a* value over time, while L* and b* values remain relatively stable. The chromaticity data was obtained using a portable spectrophotometer to measure surface color parameters of tomato fruit during ripening. Measurements were taken daily from individual fruits at various ripeness stages, beginning at the green stage and continuing through to full red maturity. The spectrophotometer captured color metrics in the CIE Lab color space, which includes the following:
L*: Lightness (0 = black, 100 = white);
a*: Green-to-red axis (negative = green, positive = red);
b*: Blue-to-yellow axis (negative = blue, positive = yellow).
In this study, the a* value was emphasized as the primary chromaticity indicator due to its strong correlation with lycopene accumulation, the red pigment responsible for tomato coloration. As ripening progressed, the a* value increased, indicating the accumulation of lycopene, while L* and b* remained relatively stable. Five pigments were measured (one at the center and four each at a different corner of the fruit) and averaged to represent the color of the fruit.
Figure 7 demonstrates the correlation between fruit sweetness (measured via refractometry) and the a* value obtained from spectrophotometric readings, revealing a characteristic ‘C’-shaped curve. This pattern reflects an initial rise in sweetness during ripening followed by a decline in overripe stages, offering a valuable indicator for determining the optimal harvest window.
3.2. Fruit Size
Table 3 below shows the input image and output image with the bounding box and diameter in millimeters (mm). There are five images with their corresponding output images and diameters.
The proposed methodology in
Section 3.2 provided a systematic approach for refining object size measurements in stereo-vision-based applications.
Figure 8 shows the test results for fruit size compensation using depth sensing, illustrating the accurate detection of fruit size regardless of its location. The process flow in
Figure 9 shows the data flow to calculate the actual fruit size by using a stereo-vision approach.
3.3. Humidity
Figure 10 represents the data-processing flow of the plant humidity measurement. The graph in
Figure 11 shows the estimated humidity for every 1 h for both soil-based plants and hydroponic plants, where the
x-axis represents time, and the
y-axis represents estimated humidity (%). The graph is plotted for each data point collected. A slight change in the water status occurred in hydroponically grown plants (about 5%), but the water level in the soil-based plant reduced significantly, with more than 20% change during the same time period.
3.4. Chlorophyll Content
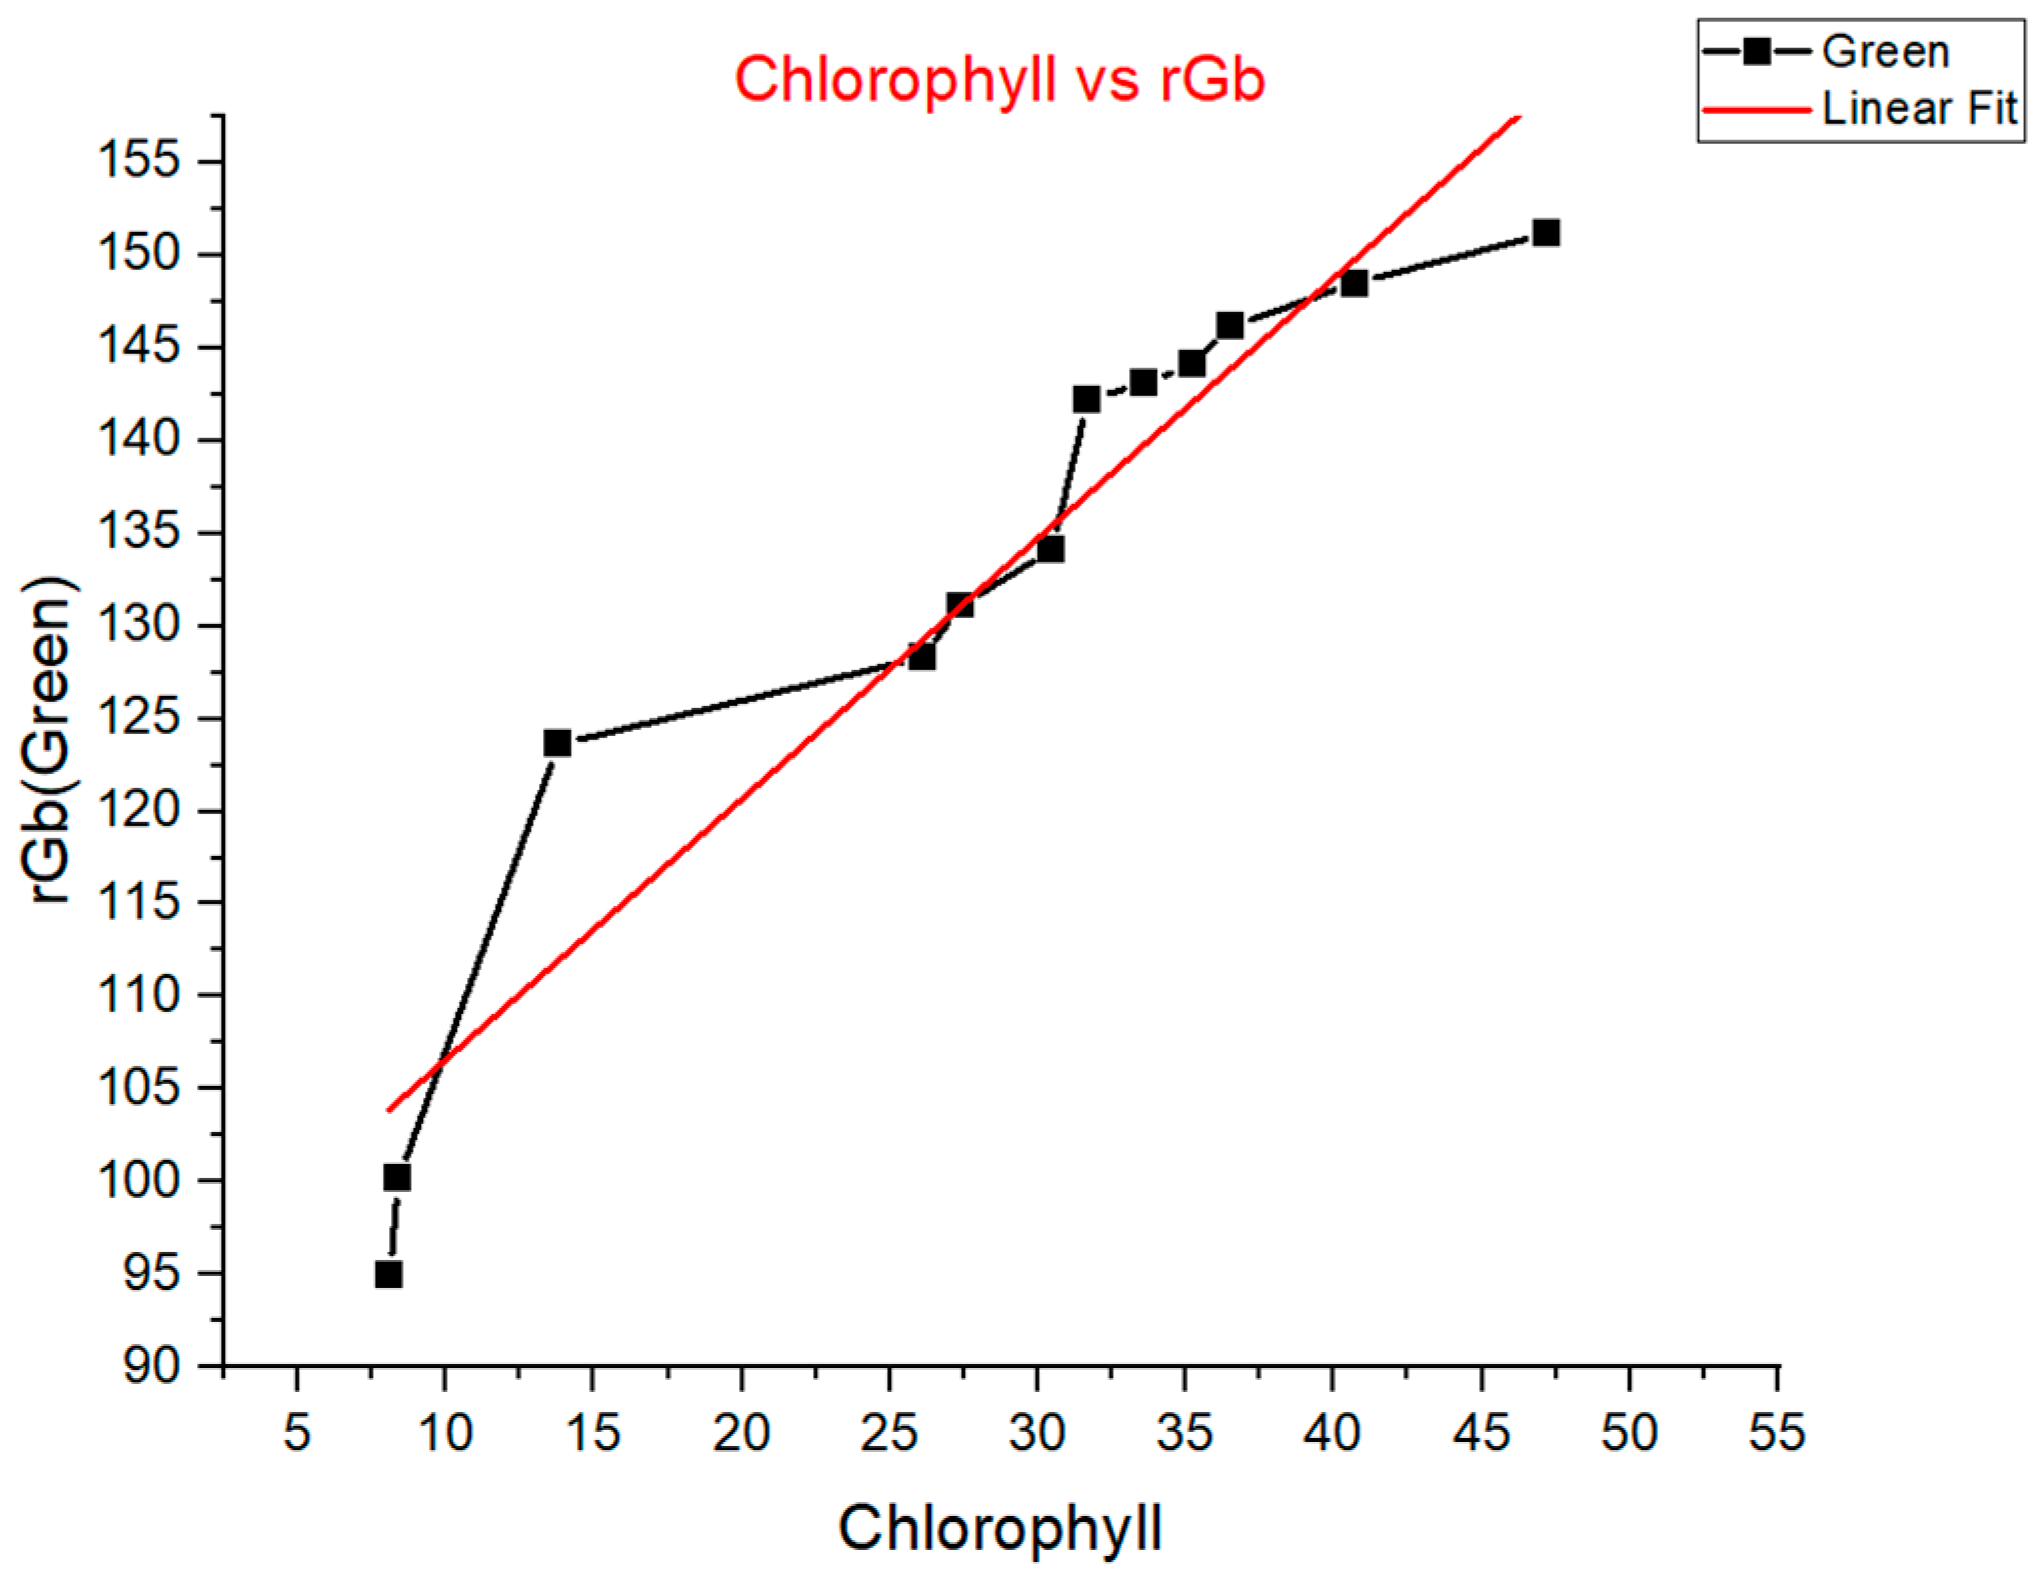
This experiment aimed to investigate the correlation between the chlorophyll content of tomato leaves and their corresponding Green Index (rGb) (
Figure 12). Chlorophyll content was first measured and recorded for 13–15 individual leaves, as shown in
Table 4. A custom image analysis tool was then developed to calculate the average RGB (Red, Green, Blue) values within a fixed-radius circular region on each leaf image, ensuring consistent sampling across varying leaf sizesAs shown in
Figure 13, the graph plots the chlorophyll content (
x-axis) against rGb values (
y-axis), indicating a generally positive linear correlation—leaves with higher chlorophyll levels tend to exhibit higher rGb values.
3.5. Mineral
The electrochemistry-based nitrate and ammonium sensors developed in our lab were used to measure nitrate and ammonium ion concentrations in water solutions with different electrical conductivities (ECs) and total dissolved solids (TDSs) (
Figure 14a). Both sensors operated as three electrode-based amperometric systems. The nitrate sensor selectively detected nitrate by reducing NO
3− to NO
2− through a Cu nanocluster coating, as detailed in our prior work [
23,
24,
25]. The ammonium sensor specifically detected ammonium ions using a polyaniline coating layered over Cu nanoclusters, promoting selective interactions through protonation–deprotonation mechanisms. Nitrate and ammonium concentrations were measured in water samples listed in
Table 5.
The ion sensor readings were compared with those obtained from a commercial multi-ion meter (Imacimus series, Vila-Seca, Tarragona, Spain), as shown in
Figure 14b,c. In most cases, our sensors provided ion measurements that closely aligned with the commercial meter, except for the ammonium concentration in the EC2.6 sample, likely due to the sensor’s narrow detection range. While commercial meters may offer higher accuracy, they lack continuous monitoring capabilities, are expensive, and require frequent calibration—challenges that low-cost sensors effectively address.
3.6. Phytohormone and VOCs
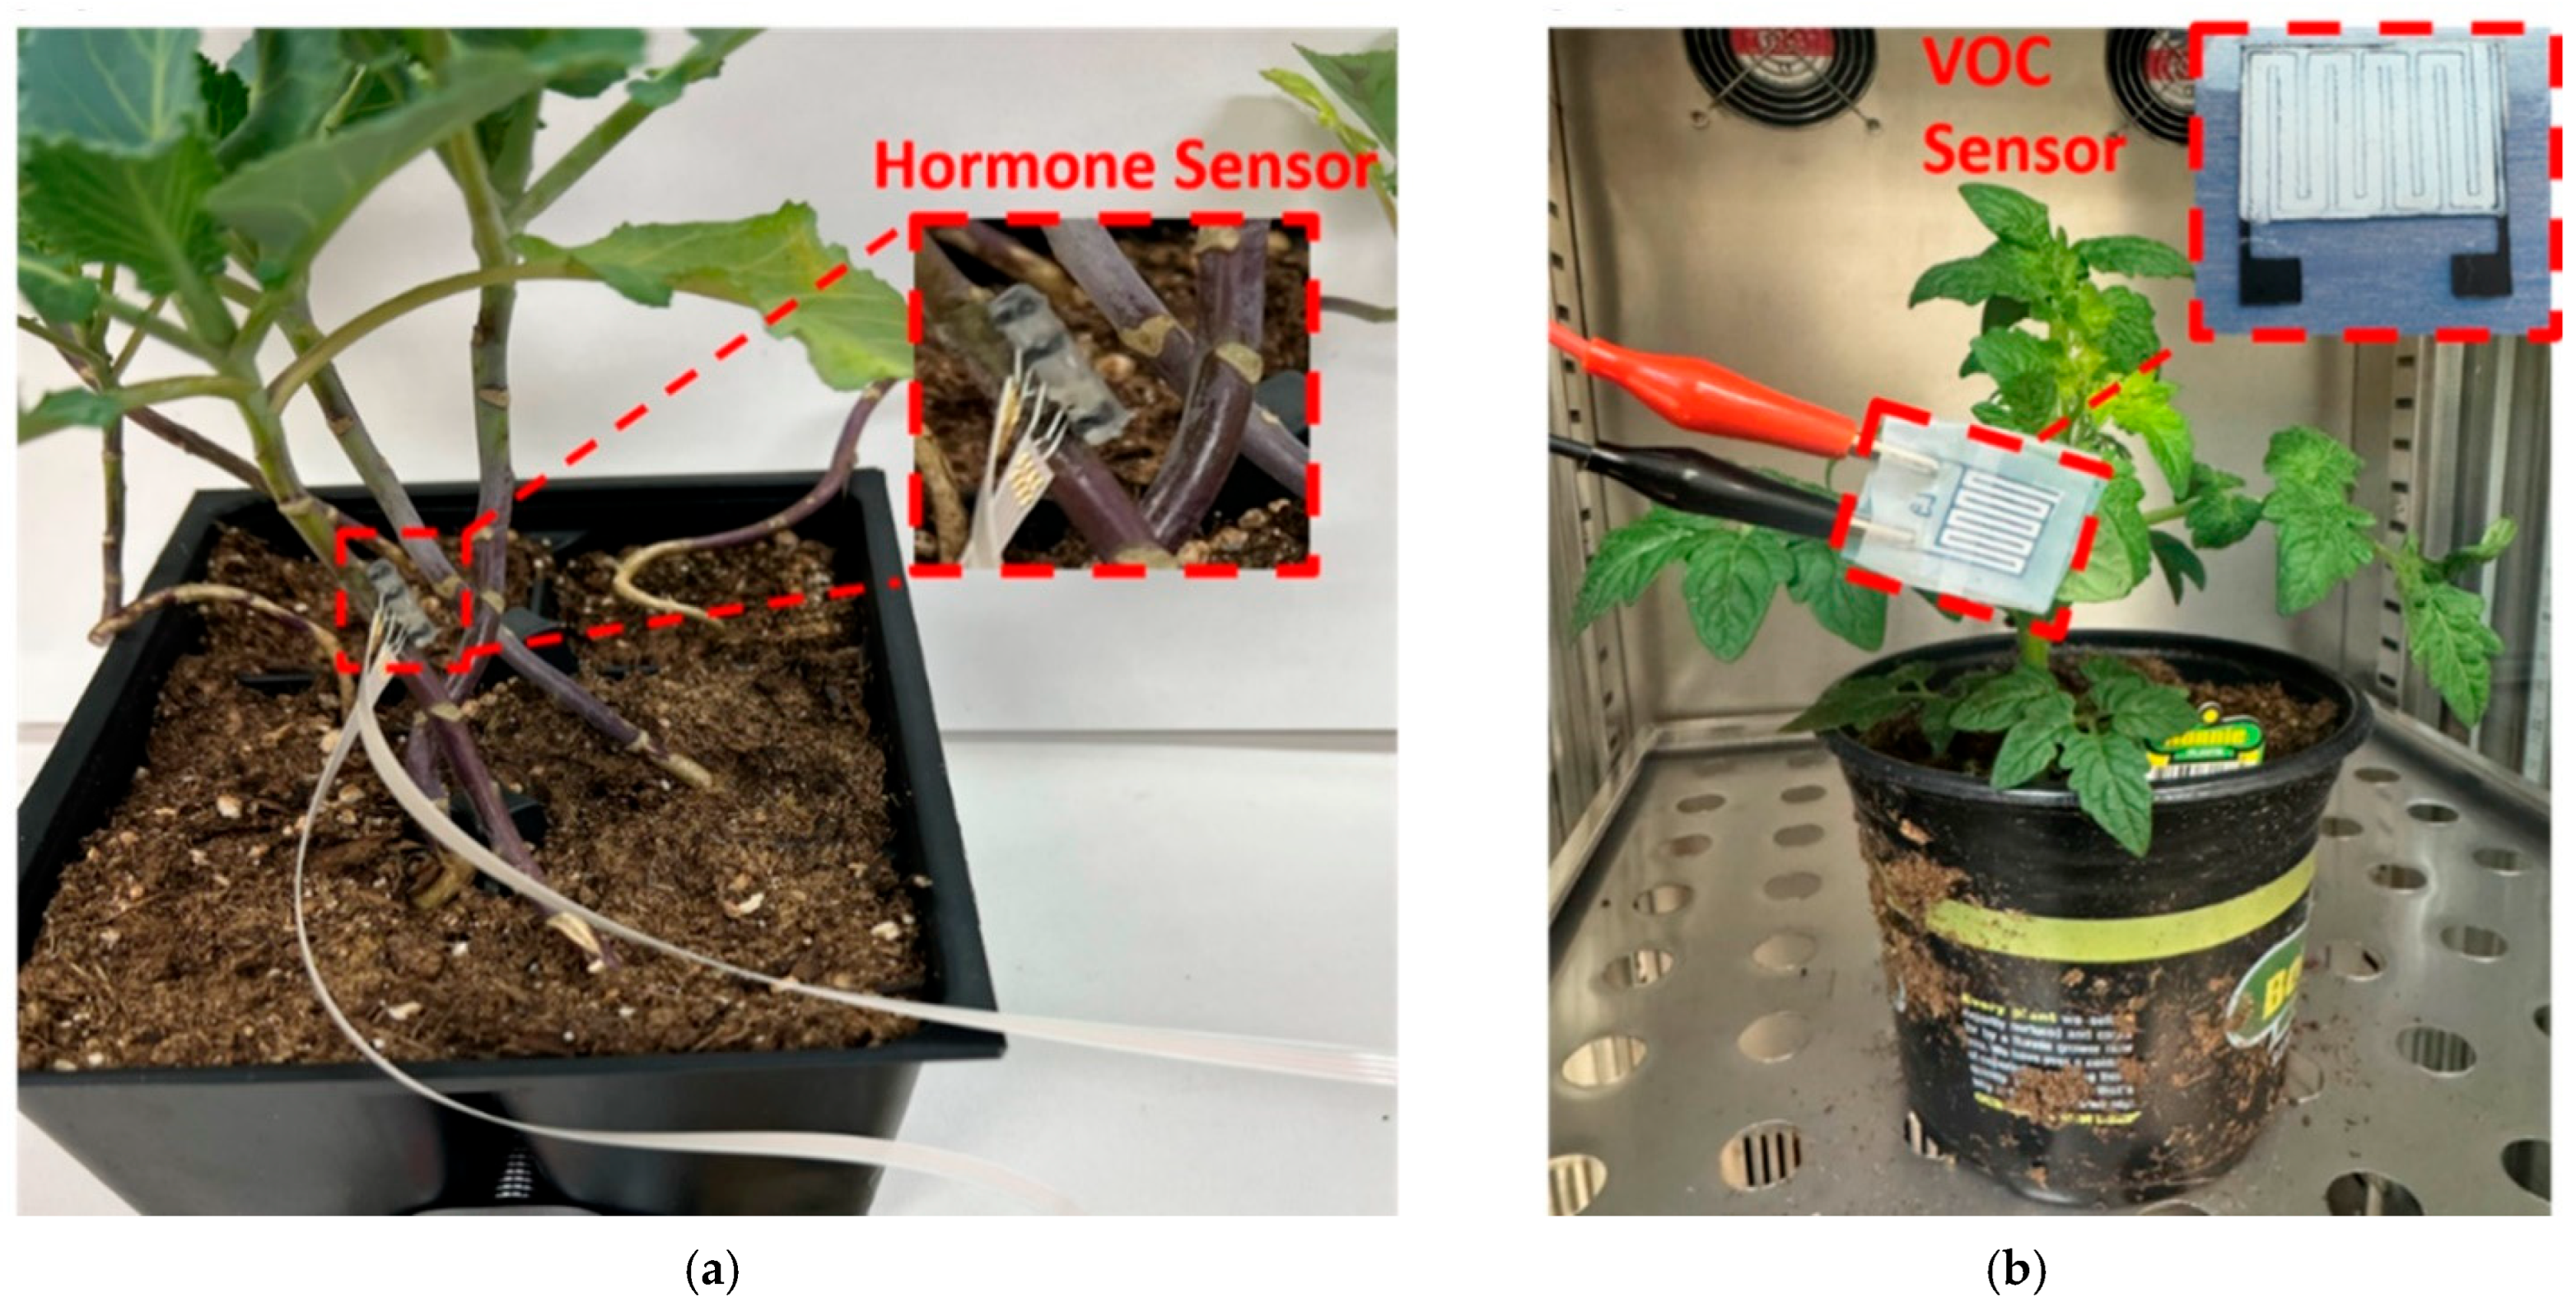
The hormone sensors were tested on live bell pepper plants by installing needle-structured SA and IAA sensors into the plant stem, as shown in
Figure 15a. The measured SA and IAA concentrations in the plants are presented in
Figure 16. The sensors recorded data every three hours, yielding eight measurements per day. The experiment included two treatment groups, each with 10 plant replicates, totaling 20 pots. The treatments consisted of two water regimes (fully irrigated and deficit irrigated). The deficit-irrigated plants were irrigated every 5 days, while fully irrigated plants were watered daily. As shown in
Figure 16a,b, both SA and IAA demonstrated an increasing trend in water-stressed plants, as compared to the plants that received regular water. This trend in hormonal concentrations is supported by findings in the literature, which indicate that water-stressed plants exhibit elevated levels of SA and IAA [
21].
The plant hormone [
12] and VOC sensors [
13] developed in our lab are shown in
Figure 15. The hormone sensor was designed to monitor salicylic acid (SA) and indole-3-acetic acid (IAA) levels in the plant stem, while the VOC sensor was designed to detect gaseous methanol emitted from leaves. The hormone sensors operated based on electrochemical principles, where the redox reaction of SA/IAA on the sensor surface generated a detectable current signal. The resulting current was directly correlated with the concentration of SA/IAA. In contrast, the methanol sensor specifically detected methanol vapor through variations in the capacitance of an interdigitated electrode.
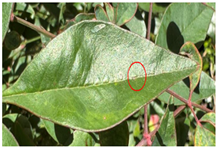
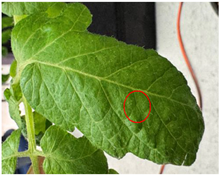
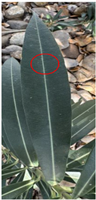
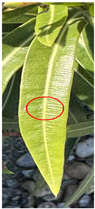
The interdigitated methanol sensor (
Figure 15b) was tested on tomato plants subjected to three stress conditions: water stress (deprived of irrigation for 21 h), wound stress (injury applied to the plant node), and light stress (kept in the dark for 21 h). Sensors were attached to the leaves, and beginning at the 400-min mark, methanol emissions were continuously measured for 10-min periods at roughly 3-h intervals over the course of approximately 21 h. The sensor on the control plant exhibited the smallest capacitance increase of 1.9 pF (
Figure 17a), which was equivalent to a 1.47 ppm increase in the methanol concentration. In contrast, the water-stressed plant exhibited the largest capacitance rise of 9.4 pF, equivalent to a methanol concentration increase of 54.55 ppm (
Figure 17b). Sensor responses and hence methanol concentrations increased moderately by 44.12 ppm and 15.85 ppm in plants subjected to light stress (
Figure 17c) and wound stress (
Figure 17d), respectively.
4. Discussion
To validate the proposed harvest readiness method illustrated in
Figure 3, we conducted a selection trial using 11 tomato plants. The complete list of selection criteria, as outlined in
Figure 3, is provided in
Table 6.
The experimental conditions included four distinct plant treatments: control (well-irrigated with enough light), water-stressed, light-stressed, and wounded. The results of the harvest readiness evaluation for each of these plants under different stress conditions are summarized in
Table 7.
As shown in
Table 7, the VOC and hormone sensors effectively identified the appropriate plant for harvesting under varying stress conditions. Following plant selection, additional physiological and phenotypic assessments were conducted to determine which tomato fruit met the harvest readiness criteria (
Table 8).
This study presents an integrated phenomic and physiological assessment framework for evaluating tomato maturity and environmental responses in a controlled growing environment. Multiple sensor modalities and data-driven techniques were employed to evaluate fruit ripening, size, humidity, chlorophyll content, mineral uptake, and phytohormonal stress markers
Colorimetric analysis using spectrophotometric data revealed a consistent increase in the a* value over time, signifying the accumulation of red pigmentation during ripening. This colorimetric trend was strongly correlated with the sugar content, which exhibited a characteristic “C-shaped” curve when plotted against a*. This relationship highlights a narrow optimal window for harvesting—beyond which fruit sweetness diminishes—underscoring the importance of integrating such color-sweetness dynamics into autonomous harvesting decision systems.
The application of deep learning (YOLO) combined with stereo-vision depth compensation enabled robust, size-aware fruit detection. Despite variability in fruit positions across bio-cells, the stereo-vision model accurately estimated fruit diameters, demonstrating the value of spatial depth correction in vision-guided robotic harvesting. This approach outperforms traditional monocular systems, which often misestimate size due to perspective distortion.
Humidity measurements showed clear temporal patterns and variability between hydroponic and soil-based plants. Continuous tracking revealed distinct water retention dynamics, which could guide irrigation optimization strategies. Particularly in hydroponic systems, the consistent humidity trends point toward more stable water availability, affirming the suitability of such systems for precise environmental control.
In the chlorophyll-rGb correlation experiment, image-derived green indices aligned well with the measured chlorophyll content, validating rGb as a surrogate marker. This supports the feasibility of using non-invasive imaging for continuous, high-throughput monitoring of plant health and photosynthetic efficiency in smart farm environments.
The custom-built nitrate and ammonium ion sensors exhibited good agreement with commercial meters, confirming their utility as low-cost, scalable alternatives for continuous nutrient monitoring. The slight underperformance in high-conductivity conditions suggests a need for extending the dynamic range of detection, particularly for ammonium. Nevertheless, these sensors offer a practical solution for real-time nutrient management, especially in resource-limited or automation-focused environments.
For more precise VOC level estimation, several sensor and system-level design enhancements can be implemented to enable the large-scale deployment of these sensors in a tomato NFT-based hydroponic system.
Integration of robotics, AI, and computer vision: Wearable biosensors can be integrated into robotic surveillance systems for high-throughput monitoring of plant stress conditions. Advanced sensors can significantly improve AI models in agriculture by enhancing the quality and accuracy of the data used for analysis. Integrating plant’s chemical signatures, such as phytohormone and VOC levels, with traditional physiological parameters like the chlorophyll index, leaf area index, and stomatal conductance, as well as multispectral and hyperspectral imaging, will improve the AI model’s ability to interpret complex relationships in crop growth, enabling more accurate predictions and recommendations. Plant-wearable sensors will continuously monitor crop conditions and provide real-time updates. This feedback loop allows AI models to adjust their predictions and recommendations based on the most recent data. Moreover, sensors provide context-specific data such as localized weather conditions, water conditions, or crop growth stages, allowing AI to tailor recommendations to local conditions, reducing errors.
Disease scouting: Electronic nose-based VOC sensors will allow for scouting and diagnosing emerging tomato diseases early, such as tomato brown rugose fruit virus (ToBRFV), which has led to a global pandemic over the past decade [
26,
27]. Since its initial identification in 2014 in the Middle East, ToBRFV has become one of the most significant greenhouse tomato viruses due to its seed-borne nature and ability to overcome common resistance genes (
Tm-1,
Tm-2, and
Tm-22), rendering all tomato cultivars vulnerable [
28,
29]. This seed-borne tobamovirus seriously threatens tomato production globally, including in the U.S. [
26,
27]. A sensor array consisting of gas sensors can detect the VOC signatures associated with ToBRFV infection. Sensor-based surveillance can also guide breeders in selecting genetic material for developing new tomato cultivars with a high resistance to ToBRFV.
Sensor design improvements: Several design optimizations are necessary to ensure long-term sensor operation. Biofouling, caused by the accumulation of microorganisms, debris, or algae, can degrade sensor performance. Applying antifouling coatings to the electrode surface can protect against biofilm formation, thus extending the operational lifespan of the sensor [
30,
31]. Electrochemical sensors also face signal drift over time, requiring specific electrode modifications to stabilize the reference potential and improve longevity. Multi-array sensors on miniaturized platforms encounter crosstalk due to their spatial proximity. Strategies such as electrochemical shielding or temporal multiplexing can minimize this crosstalk. Lastly, for sensors that require frequent and complex recalibration, an onboard edge intelligence system can be developed to calibrate the sensors periodically. A machine learning model trained to recognize patterns in sensor outputs and reference values can adjust for nonlinearities, correct sensor drift, and use adaptive calibration methods, eliminating the need for frequent manual recalibration.
Thus, the widespread use of plant wearable sensors in tomato hydroponics can assist growers in the early detection of biotic and abiotic stress conditions, enabling timely interventions to mitigate stress-related tomato yield reductions. These sensors will also help determine the harvest readiness of tomato fruits.
5. Conclusions
This study demonstrates the feasibility and effectiveness of a multi-trait, sensor-integrated framework for assessing tomato harvest readiness in controlled NFT-based growing environments. By combining wearable biosensors, VOC sensing, hormone profiling, and vision-based phenotyping modules, we implemented a two-stage decision pipeline that integrates both plant-level physiological stress indicators and fruit-level ripeness attributes.
The proposed four-level harvest readiness method consists of (1) plant health screening based on physiological thresholds (methanol VOCs, salicylic acid, and IAA); (2) fruit phenotyping through AI-assisted models for size (YOLO-based with stereo-vision), color (spectrophotometric regression), chlorophyll (image-based rGb index), and water status (humidity estimation); (3) parameter validation using sensor-derived thresholds; and (4) a final rule-based decision stage. While the final decision logic remains threshold-based, the underlying phenotypic assessments are powered by AI-trained modules, establishing a semi-automated pipeline for ripeness evaluation.
Our results confirm that relying solely on external color cues can lead to premature or inaccurate harvest decisions, especially under plant stress conditions. In contrast, integrating internal physiological signals enable more reliable screening of both healthy plants and optimally ripe fruits. Specifically, the use of physiological screening excluded water-stressed, wounded, and light-stressed plants, and the subsequent multimodal phenotyping effectively isolated fruits that met commercial ripeness standards.
Although the current decision framework is rule-based, the integration of AI modules for feature estimation validates a scalable path forward for deploying autonomous sensing platforms. The demonstrated performance of low-cost biosensors for nitrate and ammonium monitoring underscores their future potential in closed-loop fertigation and crop health management systems. Moreover, real-time hormone and VOC data provide actionable feedback for early stress detection and adaptive harvesting strategies.
Looking ahead, future work will focus on transitioning from rule-based logic to deep learning-based decision-making, expanding temporal modeling via LSTM networks, and scaling across seasons and environmental conditions. Ultimately, this research lays the groundwork for developing a self-adaptive, AI-guided harvest system that optimizes not only timing and yield but also fruit quality, nutritional value, and shelf life in next-generation smart farms.


 ,
, 


