Abstract
In order to maintain adequate hydration of apple rootstock softwood cuttings during the initial stage of cutting, a drought stress grading model based on machine vision was designed. This model was optimized based on the U-Net (U-shaped Neural Network), and the petiole morphology of the cuttings was used as the basis for classifying the drought stress levels. For the CU-ICA-Net model, which is obtained by improving U-Net with the ICA (Improved Coordinate Attention) module designed using a cascaded structure and dynamic convolution, the average accuracy rate of the predictions for the three parts of the cuttings, namely the leaf, stem, and petiole, is 93.37%. The R2 values of the prediction results for the petiole curvature k and the angle α between the petiole and the stem are 0.8109 and 0.8123, respectively. The dataset used for model training consists of 1200 RGB images of cuttings under different grades of drought stress. The ratio of the training set to the test set is 1:0.7. A humidification test was carried out using an automatic humidification system equipped with this model. The MIoU (Mean Intersection over Union) value is 0.913, and the FPS (Frames Per Second) value is 31.90. The test results prove that the improved U-Net model has excellent performance, providing a method for the design of an automatic humidification control system for industrialized cutting propagation of apple rootstocks.
1. Introduction
The cutting propagation of apple rootstocks has the advantages of a short cycle and the retention of excellent traits from the female parent. It can provide excellent germplasm for molecular-assisted breeding and is of great significance in mining genes of important traits and improving breeding efficiency [1,2]. When the softwood cuttings of apple rootstocks suffer from drought stress due to a reduced water supply in their environment, the cells will have their normal physiological functions affected due to water loss, thus reducing the survival rate of the cuttings [3,4]. In terms of plant phenotypes, the petioles of the cuttings will bend when there is a lack of water. This is a comprehensive adaptive manifestation of the structural characteristics of the cuttings when interacting with the arid environment during the growth and development process [5]. The bending of the petioles can change the angle between the leaves and the sunlight, reducing the directly exposed area of the leaves to the sunlight, thereby reducing transpiration and minimizing water loss [6,7]. This helps the cuttings maintain the water balance in their bodies in an arid environment and improves their survival ability. Therefore, the phenotype of the petioles of the cuttings is an important characteristic of their water content. Achieving precise monitoring of the petiole morphology of the cuttings is beneficial for judging the level of drought stress [8].
The morphology of the petioles of the cuttings lacking water mainly relies on manual observation at present, which is labor-intensive and inefficient. To cope with this challenge, many studies describe the small changes of plant traits through phenotypic analysis and study the performance of plants under drought conditions [9,10]. The imaging technology based on machine vision provides an important means for dynamic monitoring and sensitivity evaluation of phenotypic traits of plant growth response under drought stress [11]. Machine vision technology collects the target images of plant phenotypes through a visual system [12] and uses image processing algorithms to complete the task of identifying and classifying target features, enabling the monitoring of plant drought conditions. Zhou et al. used the poplar skeleton extraction algorithm based on YOLOv8-pose to identify the individual leaves and key nodes inside the plants, achieved the extraction of the overall morphological structure information of the plants, and established a classification model for the drought stress levels of poplars [13]. However, the output of the YOLO neural network for target detection is the bounding box and category confidence, and the model can only roughly locate the target region, which cannot meet the needs of detail analysis. The task in this study is to quantify the morphological details of the bending angle of the petiole of cuttings and analyze the connecting boundary between the petiole and the stem. Therefore, a neural network is required to accurately recognize the pixels of the images of various parts of the cuttings, and has the ability of dense feature classification, so as to facilitate the analysis of the phenotypic traits of cuttings.
Semantic segmentation networks can densely predict each pixel in a plant image by marking it with the corresponding category, classify each pixel into the corresponding object category or background category, and generate a segmentation result with the same size as the input image, which has a wide range of applications in monitoring the physiological state of plants. Feng established a model for identifying the drought state of cotton based on the improved ResNet18 model and conducted research on identifying the drought state of cotton and predicting its growth visually [14]. Zhang used the SE-ResNet50 network to grade the drought resistance of potted wheat and used the image feature parameters to conduct a genome-wide association analysis to mine the candidate genes for wheat drought resistance [15]. However, ReSNet is a classification network in essence. Moving to segmentation requires a decoder. Its advantage lies in deep semantic expression, but its detail and positioning capabilities are insufficient. The DeeplabV3+ prediction model can realize the analysis of canopy remote sensing images in large scenes, establish characteristic parameters, such as crop transpiration rate and stomatal conductance, and realize the efficient monitoring of crop physiological response to drought stress [16]. DeeplabV3+ is good at multi-scale context modeling, but it has a poor effect on small target recognition [17]. U-Net uses the U-shaped network structure composed of encoder–decoder and jump connection layer to fuse shallow high-resolution features with deep high semantic features [18,19], which is helpful to recover the spatial details of small targets [20]. Zheng et al. improved the U-Net model, increased the receptive field of the neural network, and improved the accuracy of root phenotype measurement and calculation based on micro-root canal images [21]. U-Net has application value for real-time detection of weeds in densely planted fields [22,23]. The petiole part of the cuttings image is small and densely distributed, and the number of pixels is relatively small compared with other parts of the cuttings. U-Net is effective in dealing with this kind of unbalanced task [24,25]. Therefore, as a feature prediction model of dense small targets, U-Net can capture more details in plant images, accurately identify different tissue parts of plants, and provide ideas for this study to solve the classification of drought stress in cuttings.
In this study, a drought stress grading model for softwood cuttings of apple rootstocks was established based on the U-Net neural network. The U-Net neural network was improved using a cascade structure and an ICA (Improved Coordinate Attention) attention mechanism module to obtain the CU-ICA-Net model. In order to achieve more accurate segmentation and refinement of the boundary between the petiole cuttings and other tissues, the cascade structure is used to optimize the backbone network of U-Net, which improves the ability of the model to integrate deep-seated features. The optimized ICA coordinate attention mechanism module enhances the recognition effect of the model on the spatial position of petiole cuttings. The model can automatically monitor the drought stress status of the cuttings. The automatic humidification system designed with CU-ICA-Net model can complete automatic humidification based on the judged drought stress levels of the cuttings. Humidification tests were carried out in a greenhouse environment to verify the performance of the control system. This model provides a design reference for the automatic monitoring of drought stress and precise humidification of softwood cuttings of apple rootstocks in facility agriculture systems.
2. Materials and Methods
Figure 1 is the flowchart of research methods in this study. The diagram includes the design of drought stress characteristics of cuttings, data collection and augmentation, dataset segmentation, model training and evaluation, and model application. This diagram visually represents the step-by-step process from data collection to model evaluation.
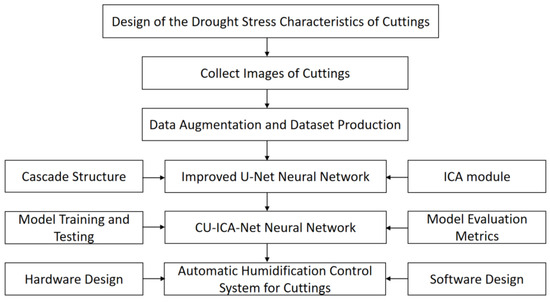
Figure 1.
Flowchart of research methods.
2.1. Design of the Drought Stress Characteristics of Cuttings
As shown in the structural diagram of the cuttings in Figure 2, the axil A is located at the junction of the stem l1 and the petiole l2 of the cutting, which is an important part for the water transportation of the plant. In this study, the cells of the petiole are evenly distributed. As the connecting part between the leaves and the stem of the cutting, the curvature of the petiole changes due to the influence of its own water content, which reflects the drought stress level of the cutting. There is a significant negative correlation between the water content of the petiole and the morphological parameters of its transverse shrinkage rate and longitudinal shrinkage rate. The curvature of the petiole gradually increases with the loss of water, showing a more curved morphology.
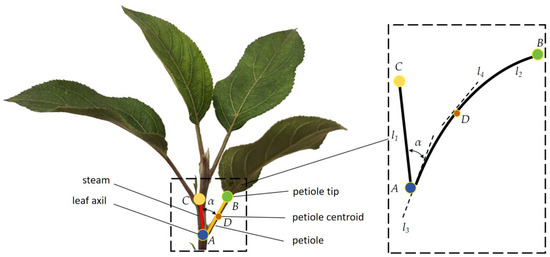
Figure 2.
Physical picture of inserting tassels.
The curve l2 is the mathematical expression of the petiole, which is y = f(x). The calculation method of the coordinates (,) of the centroid D in the interval [a, b] is Equation (1).
In the Equation, .
The centroid D of the petiole represents the position where the mass of the petiole part is evenly distributed. The limit value of the ratio between the variation of the direction of the tangent line l4 at the centroid D of the petiole and the distance moved along the petiole l2 is the curvature k at this point. The calculation process of the curvature of the curve l2 is Equation (2).
The coordinates of point C are (x1, y1), which represent the position of the axil at the other end of the stem l1 from this perspective. In this study, simultaneously, the angle α between the tangent line l3 at the axil A(x2, y2) of the stem l1 and the petiole is used to reflect the drought stress level of the cutting. The calculation process of the angle α is Equation (3).
The change in the water content of the petiole leads to the alteration of the angle α. The lower the water content is, the greater the shrinkage rate will be, and the angle α will increase accordingly due to the change in cell morphology. A micrometer was used to measure 500 images of softwood cuttings of apple rootstocks with different drought stress levels. Leaves fully extended without curling or drooping indicate a normal water status. Slight leaf drooping with initial curling at the tip represents a mild drought stress status. Obvious leaf drooping with curling reaching 1/3 of the leaf length is defined as moderate drought stress. Severe leaf curling (exceeding 1/3) with partial leaf wilting corresponds to a severe drought stress status. The curvature k was calculated according to the length of the petiole of the cutting and the length of the straight line AB. The angle α was measured with a protractor and recorded. As shown in Figure 3, it is the statistical results of the curvature k of the petiole of the cutting and the angle α under different drought stress levels. The petiole curvature k and angle α of all cutting images were corrected using the OpenCV line detection method to ensure the accuracy of experimental data.
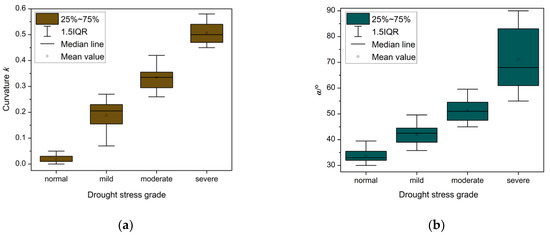
Figure 3.
Statistical Results of the Characteristics of the Petioles of the Cuttings under Different Drought Stresses: (a) Correlation between the curvature k and the drought stress level; (b) Correlation between the angle α and the drought stress level.
Determining the pixel coordinates of the stem and petiole regions of the cutting is the key to calculating the angle α and the curvature k. The semantic segmentation neural network can assign exclusive class labels to the stem and petiole regions of the cutting image, achieve pixel-level classification of the image, and accurately outline their boundaries. In this study, the semantic segmentation task requires an image dataset annotated with the stem and petiole regions of the cutting image, and the quality and scale of the dataset directly affect the training effect and performance of the neural network.
2.2. Collect Images of Cuttings
The image data collection selects the 200 softwood cuttings of the apple rootstock with the genotype G935 during the initial stage of cutting growth from 0 to 10 days. In this stage, the cuttings have not grown roots and are prone to drought stress when water replenishment is not timely. According to the actual production process, the cuttings are divided into four drought stress levels: normal water status, mild drought, moderate drought, and severe drought. All drought stress states of apple rootstock cuttings are classified according to the four categories defined in this study. The image data of the apple rootstock cuttings comes from Linghangda Fruit Industry Technology Co., Ltd. in Linyi County, Yuncheng City, Shanxi Province, China, as shown in Figure 4. To ensure the correctness of the experimental conclusion, the dataset includes photos of the bending degree of the petioles of the apple rootstock cuttings under different drought stress levels. The image acquisition device is a high-definition camera with a resolution of 1920 × 1080P manufactured by HIKVISION in China, and the shooting position is at the same horizontal height as the cutting branches. The image capturing angle is 45°. The horizontal distance between the camera and the cuttings is 25 cm. When the temperature rose, no cooling measures were taken, causing the cuttings to exhibit four levels of drought stress. A total of 100 images are collected for each of the four drought stress levels of the 200 cuttings, and a total of 400 RGB images are collected as the dataset.
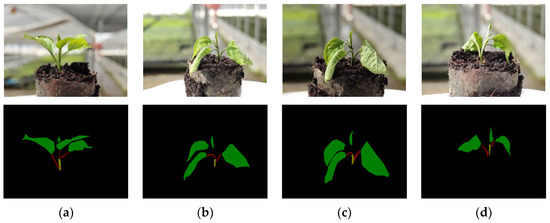
Figure 4.
RGB images and manual annotation images of apple rootstock cuttings: (a) Normal water status; (b) Mild drought stress; (c) Moderate drought stress; (d) Severe drought stress.
2.3. Data Augmentation and Dataset Production
Dosovitskiy et al. demonstrated the value of data augmentation for learning invariance in neural network feature learning [26]. Data augmentation can improve the generalization ability and robustness of the model, reduce overfitting, and enhance the accuracy of model prediction [27]. To achieve a more accurate prediction of the drought stress degree of the cuttings by the model, the images of the rootstocks of the SH28 and GM256 varieties were added. For each variety, 100 cutting images were collected. A total of 200 images were collected for the two varieties using the same procedure. The newly added images include the same four drought stress levels, with 25 samples per level for each variety. Meanwhile, through geometric transformations, such as random rotation and image scaling, the number of images in the existing dataset increased. The rotation angle was 90° clockwise, and the scaling ratio was 1:0.5. The initial 600 photos were expanded to 1200. Labelme = 3.16.7 was used to annotate the cutting images. Labelme = 3.16.7 is an open-source image annotation software used to accurately outline the contours of cuttings’ leaves, petioles, and stems in this study. It generates JSON-format annotation files containing coordinate points, label names, and other information for model training. The components of the cuttings in the images were divided into three parts: the stem, the leaf, and the petiole. The yellow area of the manual annotation image is steam, the green area is leaf, and the red area is petiole in Figure 4. The Cohen’s kappa coefficient of the annotated images was 0.76, indicating good consistency. The mean Dice score was 0.83 ± 0.04, demonstrating that the annotation process had high reliability. The dataset was divided into training, testing, and validation sets in a ratio of 8:1:1 to support model training and ensure the robustness and generalization of the model.
2.4. The U-Net Neural Network
The U-Net network, an encoder–decoder segmentation architecture proposed by Ronneberger et al. [28], retains low-level details from the encoder and high-level semantic information from the decoder via skip connections. As illustrated in Figure 5, its architecture comprises a contracting path (left) and an expansive path (right). The contracting path follows a typical convolutional network design: it performs two successive 3 × 3 convolutional operations, each followed by a ReLU activation to introduce nonlinearity, and a 2 × 2 max pooling with stride 2 for downsampling. Notably, each downsampling step doubles the number of feature channels. For example, the f1 feature layer has 64 channels, which increases to 512 in the f5 layer after three such operations. Conversely, the expansive path (from f5′ to f1′) employs skip connections to fuse features with corresponding layers from the contracting path. Specifically, feature maps from both paths are concatenated, followed by two 3 × 3 convolutions. Up-convolution with 2 × 2 kernels then progressively upsamples the data, restoring the feature layer to the input image’s dimensions. This design ensures seamless integration of contextual information and fine-grained details for precise segmentation.
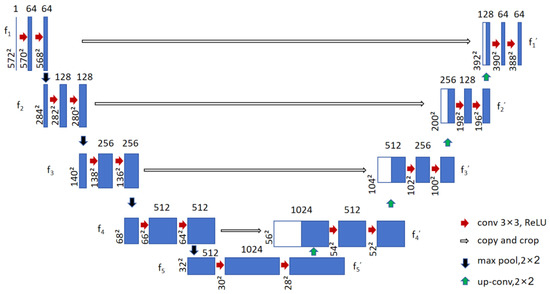
Figure 5.
The structural diagram of the U-Net neural network.
The angle α and the curvature k represent the changes in the spatial position of the petiole of the cutting under the effect of drought stress. Therefore, the U-Net semantic segmentation model needs to accurately classify the various structural parts of the cutting, determine the spatial information of the petiole of the cutting in the image data, and judge the degree of morphological changes of each part of the tissue. In this study, the pixels of the petiole part account for an average of about 1.5% in the image. In order to improve the recognition and positioning of the petiole pixels by the model, the attention mechanism is used to optimize the neural network structure, so as to enhance the ability of the model to capture the features of the petiole.
2.4.1. Attention Mechanism Module
SENet, CBAM, and CA are all attention mechanism modules. They can guide the model to selectively focus on and process key information when dealing with a large amount of information. The network structure diagrams of these three types of attention mechanism modules are shown in Figure 6.
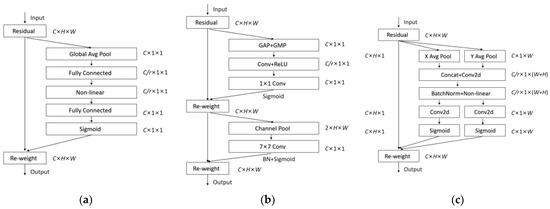
Figure 6.
The network structure of the attention mechanism module: (a) SENet; (b) CBAM; (c) CA.
SENet (Squeeze-and-Excitation Network) [29], a channel attention mechanism, is divided into two steps: squeeze and excitation. The input feature image is compressed (squeezed) into a channel vector (C × 1 × 1) through global average pooling (Global Average Pool). After being excited (excitation) by two fully connected layers (Fully Connected) and a non-linear function (Non-linear), weights are generated. The Sigmoid function adjusts the weights of the feature vector, and the weights are weighted and operated with the channel dimension of the input feature map to enhance the channel attention.
The CBAM attention mechanism module (Convolutional Block Attention Module, CBAM) [30] uses global average pooling and global max pooling (Global Max Pool) to generate channel attention weights. Based on the channel attention weighted feature map, a feature map (1 × H × W) with spatial information is obtained through a 7 × 7 convolution. The channel attention and spatial attention jointly act on the initially input feature map.
Both the SE attention mechanism module and the CBAM attention mechanism module can improve the model’s ability to capture key features. However, the SE attention mechanism module loses the spatial information of the feature map during the compression process. The CBAM attention mechanism module realizes the feature weighting in both the channel dimension and the spatial dimension, but the feature operation in the increased channel dimension leads to an increase in the computing power requirements. The CA coordinate attention mechanism embeds the position information into the channel attention to enhance the model’s expression ability of the spatial position [31]. The CA coordinate attention mechanism decouples the spatial information into two independent axial operations, decomposes the 2D channel attention into two 1D encoding processes, and the 1D pooling operations aggregate features along the horizontal direction (X Avg Pool) and the vertical direction (Y Avg Pool), respectively, generating two feature maps in the directions of (C × 1 × W) and (C × H × 1) to retain the spatial position information of the feature map. For a given input Q, two pooling kernels (H, 1) and (1, W) are used to encode each channel along the horizontal coordinate and the vertical coordinate, respectively, and the output of the c-th channel at the height h and the width w is Equation (4):
After the feature maps of C × 1 × W and C × H × 1 are concatenated, a convolution operation with a 2 × 2 convolution kernel is performed to generate the attention weights in the horizontal and vertical directions. These two weights are respectively applied to the two directions of the initial input feature map to enhance the ability to acquire directional features. These two transformations aggregate features along two spatial directions, enabling the attention module to capture long-range dependence along one spatial direction and retain precise position information along the other direction. This can better capture position dependence and help to more accurately locate objects. While retaining fine-grained position information, the model can capture spatial dependence, which helps the model better locate the structural changes of the cutting’s petiole.
In standard convolution, each channel of the input features is convolved by a convolution kernel, and it cannot be adaptively adjusted according to the needs of the task. The petiole of the cutting shows dynamic and continuous structural changes under different drought stress levels, and the cutting image data input into the neural network has the characteristics of complexity. Therefore, based on the characteristic that dynamic convolution can adaptively adjust the convolution kernel, an improved CA attention mechanism module is proposed. The ODConv dynamic convolution kernel is used to replace the 2 × 2 convolution in the CA module to form the ICA module, so as to improve the accuracy of the coordinate attention mechanism module and further enhance the prediction ability of the semantic segmentation model regarding the position information of the cutting structure. The ODConv dynamic convolution takes the extracted coordinate attention weight matrix as a part of the offset in the dynamic convolution to realize the adaptive adjustment of the sampling point position of the convolution kernel, making the convolution operation pay more attention to the spatial information of the petiole part of the cutting image in the vertical and horizontal directions [32,33]. The network structure of the ICA attention mechanism module is shown in Figure 7.
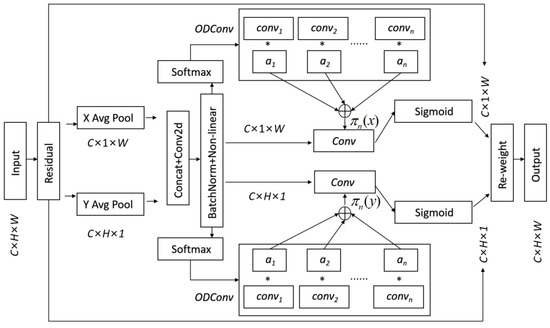
Figure 7.
The network structure diagram of the ICA attention mechanism module.
As shown in Figure 7, the global spatial information of the feature map input to the ICA attention mechanism module is first compressed by global average pooling in the horizontal direction (X Avg Pool) and the vertical direction (Y Avg Pool). BatchNorm calculates and adjusts the mean and variance of each mini-batch of data, converting the input data into a standard normal distribution with a mean of 0 and a variance of 1. Non-linear is a ReLU activation function that maps the input data to a non-linear space, thereby enhancing the expression ability of the neural network. The output of the BatchNorm + Non-linear layer generates the normalized attention weights of n convolutional kernels through the softmax function and is aggregated into the attention weight πn after the dynamic convolution operation ODConv. The n convolutional kernels of the dynamic convolution share the same kernel size and input/output dimensions, and the kernel attention weights {πn(x)} and {πn(y)} in the X direction and the Y direction are respectively obtained. W and b are the weight matrix and the bias vector, g is the ReLU activation function. The attention weights {πn(x)} change with the input x, representing the optimal aggregation of the input non-linear model {}; the attention weights {πn(y)} change with the input y, representing the optimal aggregation of the input non-linear model {}. The calculation process of the key parameters in the ICA attention mechanism module is expressed as Equation (5), where X and Y respectively represent the output results in the horizontal direction (X Avg Pool) and the vertical direction (Y Avg Pool).
Dynamic convolution adjusts the convolution kernel according to the spatial distribution of the cutting image data, enabling the model to better adapt to the distribution of cutting image data under different drought stress states. For petioles with different diameter cuttings, ICA can dynamically adjust the sensitivity to angle and curvature to improve the versatility of detection. To enhance the ability of the semantic segmentation model to extract the morphological features of the petiole of the cutting, it not only relies on the ICA attention mechanism module but also requires the improvement of the main structure of the model to improve the accuracy of target detection.
2.4.2. The Main Structure and Improvement of the U-Net Neural Network
The “encoder–decoder” main structure of the U-Net model captures and integrates the global and local information in the cutting image to improve prediction accuracy. The cascaded encoder–decoder structure is a network structure that connects multiple encoder–decoder pairs in series [34]. The cascading method allows the subsequent encoder–decoder pair to use the output of the previous encoder–decoder pair as the input, thus gradually optimizing the segmentation result [35]. This structure helps to extract and fuse features at different scales step by step. By optimizing the performance of the classification backbone and the feature fusion module, the prediction ability of the model is improved. Therefore, the cascaded structure is suitable for the improvement of the U-Net model to enable the neural network to learn data features stage by stage and layer by layer. The original U-Net has a limited receptive field in its single encoder, making it difficult to capture both global semantics (such as the overall morphology of cuttings) and local details (such as the bending angle of petioles). The cascaded structure gradually restores the edge details of small targets (such as the blurred boundary between petioles and stems) through multiple upsamplings and feature fusion.
As shown in Figure 8, according to the characteristics of the cascaded network structure, two groups of smaller encoder–decoder pairs of the U-Net network, Encoder1–Decoder1 and Encoder2–Decoder2, are combined. Each group of encoder–decoder pairs can contain a certain number of convolutional layers, pooling layers, upsampling layers and convolutional layers. The split encoder–decoder pairs are connected in series in order, and the input of the subsequent encoder–decoder pair is the output of the previous encoder–decoder pair. Skip connection layers are added between each encoder–decoder pair to ensure that the feature information can be transmitted between the same levels. The deepest layer s5 and the shallowest layer s1 of the skip connection layer of the improved CU-ICA-Net neural network integrate the ICA coordinate attention mechanism module, which improves the model’s attention to the morphological features of the petiole of the cutting at different levels and is conducive to the fusion of features at each level. The cascading structure provides richer contextual information for the ICA module through a multi-scale feature fusion mechanism. The ICA module can dynamically adjust attention allocation to prevent the feature resolution reduction of small targets caused by downsampling. The ICA attention mechanism module enhances the expression of the coordinate features of the u5 feature layer, and the output is sent to the u’5 feature layer through the skip connection layer, enabling the CU-ICA-Net to pay attention to the image coordinate information in the deep neural network. u5 represents the deep feature layer output of the cutting image data input to the d1 feature layer after four times of 2 × 2 max pooling and five times of [3,3] convolution in Encoder1.
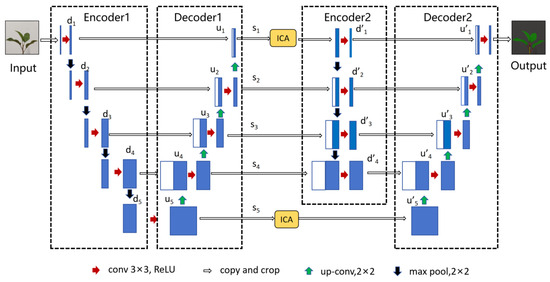
Figure 8.
The Main Structure of the CU-ICA-Net Neural Network.
Decoder1 performs four instances of two-fold upsampling on the u5 feature layer and conducts three instances of Concatenate stacking to obtain the u1 feature layer. The d’1 feature layer of Encoder2 receives the image data of the u1 feature layer through the skip connection layer s1. The ICA attention mechanism module assigns weights to the coordinate information of the u1 feature layer and outputs it to the d’1 feature layer. The CU-ICA-Net realizes the attention to the image coordinate information in the shallow neural network. Encoder2 performs 2 × 2 max pooling three times and convolution with [3,3] four times on the d’1 feature layer to output the deep feature layer d’4. The skip connection layer s1-5 transmits the convolution results of the feature layer u1-4 of Decoder1 to Encoder2 and realizes the fusion with the feature layers d’1-4 of Encoder2 through Concatenate stacking. Decoder2 performs four operations of two-fold upsampling on the feature layer u’5. The result of each upsampling and the convolution result of the corresponding deep feature layer of Encoder2 are subjected to Concatenate stacking through the skip connection layer to realize information fusion. The fused feature layer undergoes a convolution operation with [3,3] in Decoder2, and finally outputs the feature layer u’1 (Figure 9).
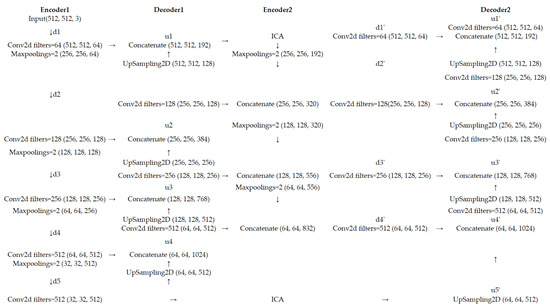
Figure 9.
The operation process of image data in the CU-ICA-Net neural network →: represents the process of data transmission.
The image is input into the CU-ICA-Net neural network for operation, and the resolution of the input and output images is 512 × 512. The data change process of the image data in the CU-ICA-Net neural network is shown in Figure 8. When Encoder1 and Encoder2 perform 2 × 2 max pooling (Maxpooling) downsampling on the feature layer, the size of the image feature layer is transformed from H × W in the shallow neural network to H/2 × W/2 in the deeper neural network. When the feature layer undergoes a convolution operation with a 3 × 3 convolution kernel, the number of feature channels is determined by the value of filter = n (n = 64, 128, 256, 512) during the convolution operation. The value of the filter follows the rule of increasing during the downsampling of the feature layer and decreasing during the upsampling, and at the same time, the size of the image remains unchanged to meet the Concatenate stacking at the output position of the skip connection layer for the feature layers at the corresponding depth. When Decoder1 and Decoder2 perform upsampling (UpSampling) on the feature layer, the size of the image feature layer is transformed from H/2 × W/2 in the deep neural network to H × W in the shallower neural network. The ICA attention mechanism module only enhances the attention to the coordinate information of the feature layer without changing the size and the number of channels of the feature layer. The size of the feature layer u’1 output by Decoder2 is consistent with that of the initial image input to Encoder1. The prediction network adjusts the channels of the u’1 feature layer and adjusts the number of channels of the final feature layer to three types to be predicted, namely the stem, leaf and petiole regions of the cutting. The number of parameters calculated by the neural network mainly comes from the convolution operation. Let the number of input channels of the convolutional layer be Cin and the number of output channels be Cout. The size of the convolution kernel of the convolution operation in this study is 3 × 3, so the number of parameters output by the convolutional layer is Cin × Cout × 3 × 3. The number of parameters calculated by the CU-Net neural network improved by cascaded structure is approximately 2.46 × 10⁷ without adding the ICA module, and the number of parameters calculated by the original U-Net neural network is approximately 2.48 × 10⁷. The number of parameter calculations before and after the improvement is basically the same to ensure that the inference efficiency of the model is not affected.
2.4.3. Model Training and Testing
Parameters of the workstation for CU-ICA-Net model training: Intel i9 14900k processor produced by Intel Corporation (Santa Clara, CA, USA), 64 GB RAM, 4 TB disk storage space, and RTX 4090 graphics card produced by NVIDIA Corporation (Santa Clara, CA, USA) with 24 GB video memory. The training environment was built based on PyTorch = 1.7.1. The Adam optimizer was selected, with a training cycle of 200 epochs. The weights were saved once per epoch, with a maximum learning rate of 0.1 and a minimum learning rate of 0.0001.
To verify the performance of the improved CU-ICA-Net neural network model, comparative experiments were conducted with U-Net, PSPNet, and DeepLabV3+ neural network models. The model based on the U-Net neural network with only the cascaded structure improvement was named CU-Net. The CA and ICA attention mechanism modules were respectively embedded into the CU-Net neural network with the cascaded structure to form the CU-CA-Net and CU-ICA-Net neural networks for ablation experiments to verify the impact of the cascaded structure and the ICA module on the overall performance of the model. Both types of experiments were tested on the same cutting image dataset. The comparison of ablation test network structures is shown in Table 1.

Table 1.
Comparative Table of Ablation Test Network Structures.
2.4.4. Model Evaluation Metrics
The training loss value (Loss) and the validation set loss value (Val_Loss) during the model training process can serve as the basis for selecting the best model [36,37]. As the training loss value (Loss) and the validation set loss value (Val_Loss) continuously decline during the training process, the performance of the model on the validation set gradually improves.
The confusion matrix is a tool used to evaluate the classification performance of a model, which can clearly display the prediction situation of each category by the model [38,39]. In this study, the model needs to identify three types of regions, namely the stem, leaves, and petiole of the cuttings. Therefore, the confusion matrix is a 3 × 3 matrix as shown in Table 2.
Table 2.
Confusion Matrix for the Recognition of Cutting Images.
TP (True Positive) represents a true positive example, indicating the number of samples that are actually of a certain category and are correctly predicted as that category by the model. TPA is the number of samples that are actually of category A and are predicted as category A, and the same applies to TPB and TPC. FP (False Positive) represents a false positive example, referring to the number of samples that actually do not belong to a certain category but are wrongly predicted as that category by the model. FPA represents the number of samples that are actually of category B or C but are wrongly predicted as category A, and the same goes for FPB as for FPA. FN (False Negative) represents a false negative example, indicating the number of samples that actually belong to a certain category but are wrongly predicted as other categories by the model. FAB is a false negative example of category B, representing the number of samples that are actually of category B but are predicted as category A, and the same logic applies to FAC, FCA, and FCB as to FAB. Accuracy represents the proportion of samples of correctly predicted categories by the model to the total number of samples. The calculation process of the accuracy of the semantic segmentation result of the model based on the confusion matrix is shown in Equation (6).
During the process of image prediction by the semantic segmentation model, certain errors will occur. In this study, 400 manually annotated images are used as the standard for pre-tests. The accuracy (Ac) of the three types of regions in the images predicted by each model is statistically analyzed to evaluate the segmentation effect of the network.
The coefficient of determination (R2) in statistics is used to quantify how well a model fits the observed data. A value closer to 1 indicates a better fitting effect of the model, and a stronger explanatory ability of the independent variables for the dependent variable [40,41]. The evaluation parameter R2 is calculated using Equation (7).
In the Equation, Kb represents the actual value of the b sample, Kb’ represents the predicted value of the b-th sample, and Ka represents the average value of all samples in group a that contain sample b.
2.5. The Automatic Humidification Control System for Cuttings
The cuttings have different water requirements under different drought stress levels. It is difficult for the cuttings in the initial stage of cutting to recover when they reach the severe drought stress state, and they need a large amount of continuous water supply. Timely monitoring of the drought stress level of the cuttings and more precisely controlling the irrigation amount and irrigation frequency can not only meet the growth needs of the cuttings but also avoid the waste of water resources. Based on this, the design of the humidification control system can achieve the purposes of precise humidification and water conservation.
2.5.1. Hardware Design of the Humidification System
As shown in Figure 10, this is the hardware composition of the humidification system. The resolution of the camera is 1920 × 1080P, and the maximum shooting frame rate can reach 60 fps. The Nvidia Jetson Xavier nx module is manufactured by Nvidia in California, the United States, with a video memory of 8 GB and can carry a semantic segmentation model. The rated power of the booster pump is 1.85 KW, and the rated flow rate is 8 T/h. The valve of the solenoid valve is normally closed, and the working voltage is DC 24 V. The direct aperture of the high-pressure atomizing nozzle is 9.52 mm, and the two spray holes are distributed at a horizontal angle of 180°. The aperture of the spray plate is 0.1 mm. The booster pump, solenoid valve and high-pressure atomizing nozzle are connected by a high-pressure PE pipe. The water flow is pressurized by the booster pump and then transported through the solenoid valve to the high-pressure atomizing nozzle for spraying and humidifying the cuttings from above.
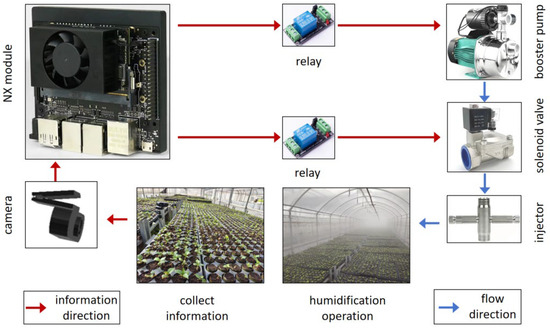
Figure 10.
Hardware Design of the Cutting Humidification System.
2.5.2. Software Design of the Humidification System
As shown in Figure 11, this is the software design flowchart of the humidification system. The Nvidia Jetson Xavier nx module regularly collects the images of the cuttings through the camera. The image data is input into the semantic segmentation model of the module to predict the angle α of the petiole and the curvature k of the cutting images. The control system determines the drought stress degree of the cuttings at this time according to the prediction results of the semantic segmentation model. The control system analyzes the drought stress degree as the input signal and outputs control signals to control the action of the relay according to the drought stress degree. After the relay is turned on, the booster pump starts to operate, the solenoid valve opens, and the water flow is transported to the high-pressure atomizing nozzle through the PE high-pressure pipeline to complete the humidification operation. The on-time of the relay determines the working time of the high-pressure atomizing nozzle. The more severe the drought stress degree of the cuttings is, the longer the humidification time will be.
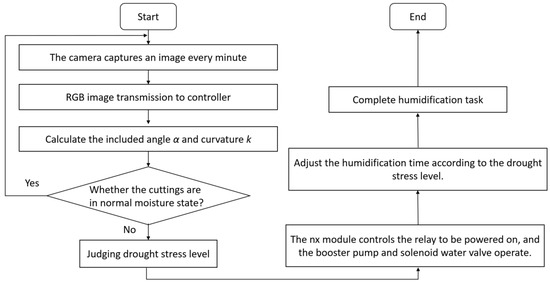
Figure 11.
Software Design of the Cutting Humidification System.
The single humidification duration of the humidification system is determined by the drought stress level of the cuttings. The humidification strategy designed in this study is that for the cuttings in the normal water state, the single humidification duration is 0 s, and at this time, the solenoid valve does not open, and the monitoring system continues to monitor the petiole state of the cuttings. For the cuttings in the mild, moderate, and severe drought stress states, the single humidification durations are 1 s, 2 s, and 10 s, respectively. The humidification duration for cuttings at different drought stress levels was determined based on experience and pre-experiments. After the humidification task is completed, the system stops monitoring for 5 min. Afterwards, it restarts to judge the drought stress status of the cuttings and continues humidifying according to the judgment results until the cuttings are in a normal water state.
3. Results
3.1. Model Performance Evaluation Methods
3.1.1. Results Based on Loss Values
Figure 12 shows the statistical results of the Loss and Val_Loss values during the training process of each neural network model. A total of 200 epochs of training were carried out, and the values were recorded once per epoch.
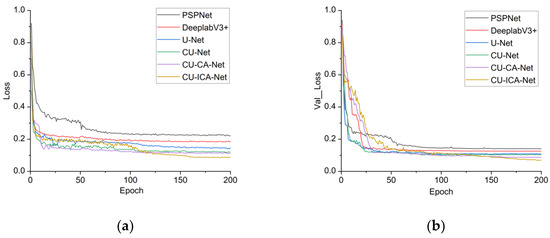
Figure 12.
The training loss value (Loss) and validation loss value (Val_Loss) of the neural network model: (a) Loss; (b) Val_Loss.
The Loss and Val_Loss values of all neural networks exhibited a continuous decreasing trend, indicating a gradual improvement in the performance of each model. In the comparative experiments, the Loss of the U-Net neural network was 0.1460, which was 0.077 and 0.041 lower than those of the PSPNet and DeepLabV3+ networks, respectively. The Val_Loss of U-Net was 0.1100, 0.031 and 0.016 lower than those of PSPNet and DeepLabV3+, respectively. This suggests that the U-Net network achieved better convergence than PSPNet and DeepLabV3+ when training the segmentation model for cutting images. In the ablation experiments, the CU-ICA-Net model achieved the lowest minimum values for both training loss (0.0878) and validation loss (0.0689) compared to other networks. However, the convergence of Loss and Val_Loss to these minima occurred at the 105th and 67th epochs, respectively, indicating a slower convergence speed.
3.1.2. Results Based on Confusion Matrix
Shown in Figure 13 are the segmentation results of the cutting images by each model.
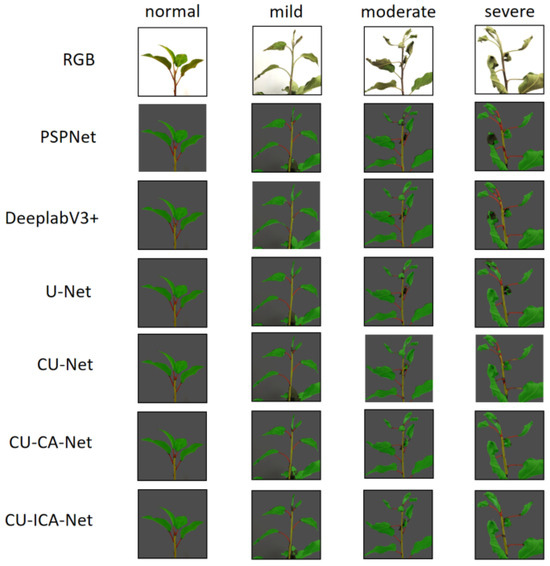
Figure 13.
The segmentation results of the neural network. The yellow segmented area represents the stem of the cutting, the green segmented area represents the leaf surface of the cutting, and the red segmented area represents the petiole of the cutting.
3.1.3. Results Based on R2
When testing the performance of the model in fitting the curvature of the petiole and the angle between the petiole and the stem, the number of petioles and leaves on the left and right sides of the stem of the cutting, with the stem of the cutting as the axis of symmetry, should be kept consistent as much as possible in the image, and the petioles and leaves should not block the stem. According to the drought stress of different grades of the cuttings, the actual quantity of the fitting image is determined. A total of 100 images are selected as a group for the prediction of each actual quantity. Within-group variance analysis was conducted for each group to enhance the rationality of the data and the reliability of the conclusions. As shown in Table 3, the threshold statistical results of the variance s2 for petiole curvature k and angle α under different drought stress grades are presented.
Table 3.
Threshold Statistics of Variance s2 for petiole curvature k and angle α.
The variance ratio of each group (maximum/minimum) is < 3, meeting the requirement of homogeneity of variance for the precondition of ANOVA. Using 100 images per group is reasonable and can provide support for the reliability of experimental results.
The statistical results of the average value of the predicted quantity are shown in Figure 14. When the cutting is in a normal water state, the cells of the petiole tissue are filled with liquid and show a firm state. At this time, the curvature k of the petiole is 0, and the angle α between the petiole and the stem is approximately 30°. When the cutting loses part of its water and shows mild drought stress, the curvature k of the petiole increases, the curvature range is [0, 1/4], and the angle α between the petiole and the stem is approximately 40°. For the cuttings under moderate drought stress, the petioles lose more water, the curvature k of the petioles further increases, the curvature k range is [1/4, 1/3], the angle α between the petiole and the stem is approximately 60°, and part of the angle α reaches 90°. For the cuttings under severe drought stress the water is severely lost, and most of the petioles show a straight shape. At this time, the curvature k range is [1/3, 1/2], and the angle α between the petioles and the stem is mostly 90°.
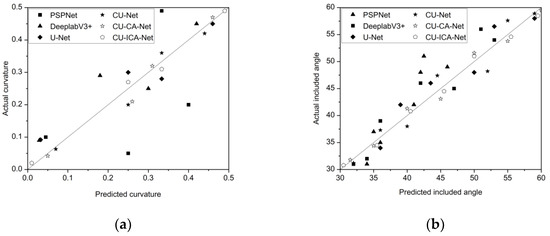
Figure 14.
Model Performance Fitting Results: (a) Fitting diagram of the curvature k of the petiole; (b) Fitting diagram of the angle α between the petiole and the stem.
Shown in Figure 15 is a histogram of the statistical results of the average accuracy rate and the average R2 of the three types of regions of the cutting image segmented by each neural network. The segmentation accuracy rate of each region by CU-Net is higher than that by the U-Net neural network, indicating that the cascaded network structure improves the segmentation effect of the model on the image. The accuracy rate of CU-ICA-Net is the highest compared with other neural networks. The improved ICA coordinate attention mechanism module strengthens the model’s ability to obtain the spatial coordinate information of the image, helping the model to classify each region in the cutting image more accurately.
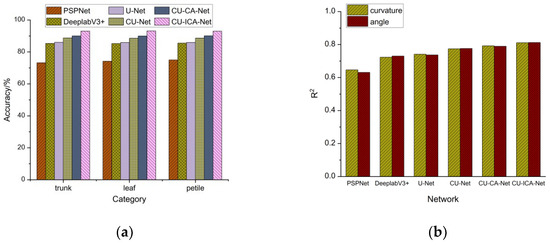
Figure 15.
Histogram of the performance test results of the neural network: (a) The average prediction accuracy of the three types of regions; (b) The R2 of the prediction results of the curvature k of the petiole and the angle α.
As can be seen from Figure 13 and Figure 15a, compared with other neural networks, CU-ICA-Net has the highest prediction accuracy for the three regions of stem, leaf, and petiole, which are 92.94%, 93.17% and 93.99%, respectively. As can be seen from Figure 14 and Figure 15b, CU-ICA-Net has the largest R2 values for the prediction results of the petiole curvature k and the angle α between the petiole and the stem, which are 0.8109 and 0.8123, respectively. The PSPNet model showed the worst coefficient of determination in predicting the petiole curvature k and the angle α between the petiole and the stem.
3.2. Humidification Test
In order to verify the application effect of the improved semantic segmentation model in the actual scene, a humidification operation test was carried out in Linghangda Fruit Industry Technology Co., Ltd. in Linyi County, Yuncheng City, Shanxi Province, China. Each model was transplanted into the Nvidia Jetson Xavier nx module, and the drought stress of the rootstock cuttings of the G935, MM106, M27, M26, and M9 models was identified and graded, and the humidification operation was carried out. Table 4 shows the statistical results of the test data of the models.
Table 4.
Statistical Table of Model Test Data.
FPS is an abbreviation for “Frames Per Second”, which is used to measure the number of image frames refreshed by a display device per second and serves as a core indicator for evaluating image smoothness. MIoU is an abbreviation for “Mean Intersection over Union”, a standard metric in computer vision for evaluating the performance of semantic segmentation models. In order to further verify the performance of the automatic humidification system, 500 cuttings were selected for a comparative test with the manual group. In the manual group, the staff manually controlled the start and stop switches of the solenoid valve and the booster pump. The test time was selected from 12:00 to 14:00, which is the period of the highest temperature in a day. The cuttings need to be humidified in a timely manner during this period to prevent severe drought stress. The external temperature of the greenhouse is 16–21 °C, and the internal temperature of the greenhouse is 26–30 °C without starting the cooling equipment. The statistical results of the test data are shown in Table 5.
Table 5.
Statistical Table of Humidification Test Data.
The automatic humidification system group with the CU-ICA-Net model as the control core and the manual group use the same model of booster pump, solenoid valve and high-pressure spray head. The total number of start-ups of the automatic humidification system group is nine more than that of the manual group. The total operation time of CU-ICA-Net is reduced by 6 s compared with the labor group. When the manual group determines that the cutting is under moderate drought stress, the humidification system will be turned on. The automatic humidification system group determines the start-up duration according to the drought stress level of the cutting. There are no cuttings in the severe drought stress state in both groups. Due to the ability to timely observe the drought stress level of the cuttings and replenish water, the cuttings in the automatic humidification system are in the mild drought stress level for a relatively long time.
4. Discussion
- In this study, the CU-ICA-Net model improved based on the U-Net semantic segmentation model is used for the classification of the drought stress levels of the cuttings, and the humidification system is controlled to achieve automatic humidification. However, the occurrence of drought stress in the cuttings is not only due to the lack of water in the environment. Under the influence of diseases [42] and salt–alkali stress [43], the plants will also show a physiological wilted state, which is similar to the morphological performance of the petioles of the cuttings under drought stress. Therefore, when judging the drought stress level of the cuttings through the morphological characteristics of the petioles of the cuttings, it is necessary to eliminate the interference of other factors to ensure the healthy state of the cuttings without water loss. At the same time, the plant phenotype of the petiole morphology is monitored by machine vision technology in this study, which can provide a methodological reference when judging the cuttings suffering from diseases and salt–alkali stress.
- The cascade structure is beneficial for the neural network to mine deep-level feature information. When using the cascade structure to improve the main structure of the neural network, it is necessary to ensure that the number of parameter calculations before and after the improvement is not much different, and the data of the feature layers remain consistent before and after being transmitted through the added encoder–decoder pairs to ensure the effective fusion of information. The ICA attention mechanism module improved by dynamic convolution enables the model to adapt to the morphological change features of the petioles of the cuttings, but it increases the model inference time. In this study, the main focus is on improving the accuracy of the model in identifying the various parts of the cuttings. In a high-temperature environment, the model needs to respond quickly. In the future, a lightweight design will be adopted to improve the real-time performance of model monitoring to avoid irreversible damage to the cuttings caused by severe drought stress. The systematic errors inherent in the model predictions primarily stem from two sources. The first is the deviation of the axis of symmetry during image acquisition, which introduces geometric distortions in morphological features. The second involves edge cases where petioles and leaves partially obscure the stem, despite rigorous experimental controls implemented to minimize occlusion. These factors collectively contribute to prediction errors in scenarios involving complex morphologies. Future research could incorporate 3D reconstruction techniques or transfer learning models to enhance prediction robustness for complex morphologies, thereby enabling more precise determination of drought stress levels in cuttings.
- Both the automatic humidification system and the manual group ensure the normal water demand of the cuttings. Compared with the manual group, the automatic humidification system can timely monitor the mild drought stress state of the cuttings and carry out humidification, saving a certain amount of water resources. However, the operation of the model consumes electricity. Therefore, when designing the humidification system in the future, the number of times and duration of the opening of the system according to the drought stress level of the cuttings need to be further combined with environmental data to establish a predictive humidification decision-making model, so as to achieve a dynamic balance between energy consumption and water conservation.
5. Conclusions
- The Loss value and Val_Loss value of the CU-ICA-Net model are 0.0582 and 0.0411 less than those of the U-Net, respectively. The average prediction accuracy for the three regions of stem, leaf, and petiole is increased by 7.41%, and the average R2 of the prediction results for the petiole curvature k and the angle α between the petiole and the stem is increased by 0.0724. This indicates that the cascade structure and the improved ICA attention mechanism module enhance the model’s ability to obtain the characteristics of the cuttings and improve the accuracy of the model’s prediction.
- The FPS value of the CU-ICA-Net model is 13.24% lower than that of the U-Net, and the speed at which the Loss value and Val_Loss value converge to smaller values is slower than that of the U-Net. This shows that the embedding of the ICA attention mechanism module in the model leads to an increase in the model’s inference time. In the humidification test, the average accuracy of the CU-ICA-Net model in identifying the petiole curvature k and the angle α in the images of cuttings with multiple genotypes is 92.99%, and the MIoU value is 0.913, which are higher than those of other semantic segmentation models. This indicates that the CU-ICA-Net model has good robustness and generalization ability.
- Both the automatic humidification system and the manual group ensure that the cuttings do not suffer from severe drought stress. The total number of start-ups of the automatic humidification system is increased by 64.29% compared with the manual group, and water consumption is reduced by 14.29%, which is beneficial for saving water resources. This model provides a reference for the design of the automatic humidification system for apple rootstock cutting seedlings.
Author Contributions
Conceptualization, X.W.; methodology, X.W. and P.W.; software, X.W. and P.W.; validation, J.L. and H.L.; formal analysis, X.W. and H.L.; investigation, X.Y. resources, P.W.; data curation, X.W. and J.L.; writing—original draft preparation, X.W.; writing—review and editing, X.W., P.W. and J.L.; visualization, X.W. and J.L.; supervision, P.W., H.L., and J.L.; project administration, H.L. and X.Y.; funding acquisition, J.L. and X.Y. All authors have read and agreed to the published version of the manuscript.
Funding
This research was funded by the earmarked fund for CARS (CARS-27) and supported by the Earmarked Fund for Hebei Apple Innovation Team of Modern Agro-industry Technology Research System (HBCT2024150202).
Data Availability Statement
The data presented in this study are available on request from the corresponding author.
Conflicts of Interest
The authors declare no conflict of interest.
References
- Chen, C.; Hu, Y.; Ikeuchi, M.; Jiao, Y.; Prasad, K.; Su, Y.H.; Xiao, J.; Xu, L.; Yang, W.; Zhao, Z.; et al. Plant regeneration in the new era: From molecular mechanisms to biotechnology applications. Sci. China Life Sci. 2024, 67, 1338–1367. [Google Scholar] [CrossRef] [PubMed]
- Liu, K.; Yang, A.; Yan, J.; Liang, Z.; Yuan, G.; Cong, P.; Zhang, L.; Han, X.; Zhang, C. MdAIL5 overexpression promotes apple adventitious shoot regeneration by regulating hormone signaling and activating the expression of shoot development-related genes. Hortic. Res. 2023, 10, uhad198. [Google Scholar] [CrossRef]
- Zhao, H.; Fu, Y.; Lv, W.; Zhang, X.; Li, J.; Yang, D.; Shi, L.; Wang, H.; Li, W.; Huang, H.; et al. PuUBL5-mediated ZINC FINGER PROTEIN 1 stability is critical for root development under drought stress in Populus ussuriensis. Plant Physiol. 2025, 198, kiaf181. [Google Scholar] [CrossRef] [PubMed]
- Li, D.; Yang, J.; Pak, S.; Zeng, M.; Sun, J.; Yu, S.; He, Y.; Li, C. PuC3H35 confers drought tolerance by enhancing lignin and proanthocyanidin biosynthesis in the roots of Populus ussuriensis. New Phytol. 2021, 233, 390–408. [Google Scholar] [CrossRef]
- Rowland, L.; Ramírez-Valiente, J.; Hartley, I.P.; Mencuccini, M. How woody plants adjust above- and below-ground traits in response to sustained drought. New Phytol. 2023, 239, 1173–1189. [Google Scholar] [CrossRef]
- McGregor, I.R.; Helcoski, R.; Kunert, N.; Tepley, A.J.; Gonzalez-Akre, E.B.; Herrmann, V.; Zailaa, J.; Stovall, A.E.L.; Bourg, N.A.; McShea, W.J.; et al. Tree height and leaf drought tolerance traits shape growth responses across droughts in a temperate broadleaf forest. New Phytol. 2020, 231, 601–616. [Google Scholar] [CrossRef]
- Martínez-Vilalta, J.; García-Valdés, R.; Jump, A.; Vilà-Cabrera, A.; Mencuccini, M. Accounting for trait variability and coordination in predictions of drought-induced range shifts in woody plants. New Phytol. 2023, 240, 23–40. [Google Scholar] [CrossRef]
- Wang, X.; Liu, L.; Xie, J.; Wang, X.; Gu, H.; Li, J.; Liu, H.; Wang, P.; Yang, X. Research Status and Prospects on the Construction Methods of Temperature and Humidity Environmental Models in Arbor Tree Cuttage. Agronomy 2023, 14, 58. [Google Scholar] [CrossRef]
- Depardieu, C.; Girardin, M.; Nadeau, S. Adaptive genetic variation to drought in a widely distributed conifer suggests a potential for increasing forest resilience in a drying climate. New Phytologist. 2020, 227, 427–439. [Google Scholar] [CrossRef]
- Ahammed, G.J.; Li, X.; Yang, Y.; Liu, C.; Zhou, G.; Wan, H.; Cheng, Y. Tomato WRKY81 acts as a negative regulator for drought tolerance by modulating guard cell H2O2–mediated stomatal closure. Environ. Exp. Bot. 2020, 171, 103960. [Google Scholar] [CrossRef]
- Javornik, T.; Carović-Stanko, K.; Gunjača, J.; Vidak, M.; Lazarević, B. Monitoring Drought Stress in Common Bean Using Chlorophyll Fluorescence and Multispectral Imaging. Plants 2023, 12, 1386. [Google Scholar] [CrossRef]
- Schneider, H.M. Characterization, costs, cues and future perspectives of phenotypic plasticity. Ann. Bot. 2022, 130, 131–148. [Google Scholar] [CrossRef]
- Zhou, L.; Zhang, H.; Bian, L. Transactions of the Chinese Society of Agricultural Engineering few-shot learning and skeleton extraction algorithm. Trans. Chin. Soc. Agric. Eng. 2024, 40, 177–185. [Google Scholar]
- Feng, J. Research on Cotton Drought State Identification and Growth Visualization Prediction. Master’s Thesis, Huazhong Ag-ricultural University, Wuhan, China, 2024. [Google Scholar]
- Zhang, J. Image Analysis and Digital Extraction of Drought-Resistant Phenotypes in Potted Wheat. Master’s Thesis, Huazhong Agricultural University, Wuhan, China, 2023. [Google Scholar]
- Yuan, H.; Zhu, J.; Wang, Q.; Cheng, M.; Cai, Z. An Improved DeepLab v3+ Deep Learning Network Applied to the Segmentation of Grape Leaf Black Rot Spots. Front. Plant Sci. 2022, 13, 795410. [Google Scholar] [CrossRef]
- Heryadi, Y.; Irwansyah, E.; Miranda, E.; Soeparno, H.; Herlawati; Hashimoto, K. The Effect of Resnet Model as Feature Extractor Network to Performance of DeepLabV3 Model for Semantic Satellite Image Segmentation. In Proceedings of the 2020 IEEE Asia-Pacific Conference on Geoscience, Electronics and Remote Sensing Technology (AGERS), Jakarta, Indonesia, 7–8 December 2020; pp. 74–77. [Google Scholar]
- Du, G.; Cao, X.; Liang, J.; Chen, X.; Zhan, Y. Medical Image Segmentation based on U-Net: A Review. J. Imaging Sci. Technol. 2020, 64, jist0710. [Google Scholar] [CrossRef]
- Azad, R.; Aghdam, E.; Rauland, A. Medical image segmentation review: The success of u-net. IEEE Trans. Pattern Anal. Mach. Intell. 2024, 46, 10076–10095. [Google Scholar] [CrossRef]
- Liu, Y.; Zhou, X.; Wang, Y.; Yu, H.; Geng, C.; He, M. Straw coverage detection of conservation tillage farmland based on improved U-Net model. Opt. Precis. Eng. 2022, 30, 1101–1112. [Google Scholar] [CrossRef]
- Zheng, Y.; Zhang, Z.; Xing, D. Crop root segmentation and phenotypic information extraction based on images of minirhizo-tron. Trans. Chin. Soc. Agric. Eng. 2024, 40, 110–119. [Google Scholar]
- Sahin, H.M.; Miftahushudur, T.; Grieve, B.; Yin, H. Segmentation of weeds and crops using multispectral imaging and CRF-enhanced U-Net. Comput. Electron. Agric. 2023, 211, 107956. [Google Scholar] [CrossRef]
- Bhatti, M.A.; Syam, M.; Chen, H.; Hu, Y.; Keung, L.W.; Zeeshan, Z.; Ali, Y.A.; Sarhan, N. Utilizing convolutional neural networks (CNN) and U-Net architecture for precise crop and weed segmentation in agricultural imagery: A deep learning approach. Big Data Res. 2024, 36, 100465. [Google Scholar] [CrossRef]
- Ferro, M.; Claus, G.; Pietro, C. Comparison of different computer vision methods for vineyard canopy detection using UAV multispectral images. Comput. Electron. Agric. 2024, 225, 109277. [Google Scholar] [CrossRef]
- Peng, H.; Li, Z.; Zhou, Z. Weed detection in paddy field using an improved RetinaNet network. Comput. Electron. Agric. 2022, 199, 107179. [Google Scholar] [CrossRef]
- Dosovitskiy, A.; Fischer, P.; Springenberg, J. Discriminative Unsupervised Feature Learning with Exemplar Convolutional Neural Networks. IEEE Trans. Pattern Anal. Mach. Intell. 2016, 38, 1734–1747. [Google Scholar] [CrossRef] [PubMed]
- Kang, J.; Liu, L.; Zhang, F.; Shen, C.; Wang, N.; Shao, L. Semantic segmentation model of cotton roots in-situ image based on attention mechanism. Comput. Electron. Agric. 2021, 189, 106370. [Google Scholar] [CrossRef]
- Ronneberger, O.; Fischer, P.; Brox, T. U-Net: Convolutional Networks for Biomedical Image Segmentation. In Proceedings of the Medical Image Computing and Computer-Assisted Intervention—MICCAI 2015, 18th International Conference, Munich, Germany, 5–9 October 2015; Part III 18. Springer International Publishing: Berlin/Heidelberg, Germany, 2015; pp. 234–241. [Google Scholar]
- Hu, J.; Shen, L.; Sun, G. Squeeze-and-excitation networks. In Proceedings of the IEEE Conference on Computer Vision and Pattern Recognition, Salt Lake City, UT, USA, 18–23 June 2018; pp. 7132–7141. [Google Scholar]
- Woo, S.; Park, J.; Lee, J.; Kweon, I. Cbam: Convolutional block attention module. In Proceedings of the European Conference on Computer Vision (ECCV), Munich, Germany, 8–14 September 2018; pp. 3–19. [Google Scholar]
- Hou, Q.; Zhou, D.; Feng, J. Coordinate Attention for Efficient Mobile Network Design. In Proceedings of the IEEE/CVF Conference on Computer Vision and Pattern Recognition, Virtual Conference, 19–25 June 2021; pp. 13713–13722. [Google Scholar]
- Li, C.; Zhou, A.; Yao, A. Omni-dimensional dynamic convolution. arXiv 2022, arXiv:2209.07947. [Google Scholar]
- Qian, J.; Lin, J.; Bai, D.; Xu, R.; Lin, H. Omni-Dimensional Dynamic Convolution Meets Bottleneck Transformer: A Novel Improved High Accuracy Forest Fire Smoke Detection Model. Forests 2023, 14, 838. [Google Scholar] [CrossRef]
- Zhang, G.; Li, Z.; Tang, C.; Li, J.; Hu, X. CEDNet: A cascade encoder–decoder network for dense prediction. Pattern Recognit. 2024, 158, 111072. [Google Scholar] [CrossRef]
- Li, C.; Tan, Y.; Chen, W.; Luo, X.; Gao, Y.; Jia, X.; Wang, Z. Attention unet++: A nested attention-aware u-net for liver ct image segmentation. In Proceedings of the 2020 IEEE International Conference on Image Processing (ICIP), Abu Dhabi, United Arab Emirates, 25–28 October 2020; pp. 345–349. [Google Scholar]
- Jin, C.; Ben, X.; Chao, J. Apple inflorescence recognition of phenology stage in complex background based on improved YOLOv7. Comput. Electron. Agric. 2023, 51, 211–219. [Google Scholar]
- Li, S.; Zhang, S.; Xue, J.; Sun, H. Lightweight target detection for the field flat jujube based on improved YOLOv5. Comput. Electron. Agric. 2022, 202, 107391. [Google Scholar] [CrossRef]
- Caelen, O. A Bayesian interpretation of the confusion matrix. Ann. Math. Artif. Intell. 2017, 81, 429–450. [Google Scholar] [CrossRef]
- Huo, P.; Ma, S.; Su, C.; Ding, Z. Emergency obstacle avoidance system of sugarcane basecutter based on improved YOLOv5s. Comput. Electron. Agric. 2023, 216, 108468. [Google Scholar] [CrossRef]
- Zhang, J.; Wang, X.; Liu, J.; Zhang, D.; Lu, Y.; Zhou, Y.; Sun, L.; Hou, S.; Fan, X.; Shen, S.; et al. Multispectral Drone Imagery and SRGAN for Rapid Phenotypic Mapping of Individual Chinese Cabbage Plants. Plant Phenomics 2022, 2022, 0007. [Google Scholar] [CrossRef] [PubMed]
- Ye, Z.; Yang, K.; Lin, Y.; Guo, S.; Sun, Y.; Chen, X.; Lai, R.; Zhang, H. A comparison between Pixel-based deep learning and Object-based image analysis (OBIA) for individual detection of cabbage plants based on UAV Visible-light images. Comput. Electron. Agric. 2023, 209, 107822. [Google Scholar] [CrossRef]
- Wang, J.; Liang, X.; Gao, M.; Wu, L.; Zhao, Y.; Wang, Y.; Huang, S.; Chen, Y.; Montanaro, G.; Briglia, N.; et al. Image-based sensing of salt stress in grapevine montanato Fusarium Wilt Infection. Sci. Silvae Sin. 2022, 58, 159–170. [Google Scholar]
- Montanaro, G.; Briglia, N.; Petrozza, A.; Carlomagno, A.; Rustioni, L.; Cellini, F.; Nuzzo, V. Image-based sensing of salt stress in grapevine. OENO One 2023, 58. [Google Scholar] [CrossRef]
Disclaimer/Publisher’s Note: The statements, opinions and data contained in all publications are solely those of the individual author(s) and contributor(s) and not of MDPI and/or the editor(s). MDPI and/or the editor(s) disclaim responsibility for any injury to people or property resulting from any ideas, methods, instructions or products referred to in the content. |
© 2025 by the authors. Licensee MDPI, Basel, Switzerland. This article is an open access article distributed under the terms and conditions of the Creative Commons Attribution (CC BY) license (https://creativecommons.org/licenses/by/4.0/).