Article

Temporal Stability of Plant Species α-Diversity in Alpine Grasslands of the Tibetan Plateau and Their Implications for Biodiversity Conservation

1
Lhasa Alpine Ecosystem Research Station, Key Laboratory of Ecosystem Network Observation and Modeling, Institute of Geographic Sciences and Natural Resources Research, Chinese Academy of Sciences, Lhasa 850000, China
2
University of Chinese Academy of Sciences, Beijing 100049, China
*
Author to whom correspondence should be addressed.
Agronomy 2025, 15(7), 1502; https://doi.org/10.3390/agronomy15071502
Submission received: 28 April 2025 / Revised: 13 June 2025 / Accepted: 18 June 2025 / Published: 20 June 2025
(This article belongs to the Section Grassland and Pasture Science)

Abstract

The temporal stability of alpine plant α-diversity remains poorly understood, constraining predictions of biodiversity dynamics. Here, this study examined spatiotemporal patterns in the temporal stability of plant α-diversity (species richness, Shannon, Simpson, and Pielou) across the Tibetan grasslands from 2000 to 2020. The temporal stability of plant α-diversity was more sensitive to changes in elevation compared to longitude and latitude. The greater the temporal stability of a plant species’ Shannon, the higher its rate of increase under the combined effects of climate change and human activities. The spatial average temporal stability of plant α-diversity declined by 8.83–16.40% across all the grasslands of the Qinghai-Xizang Plateau, while 39.34–43.77% of the region exhibited increasing trends under the combined effects of climate change and human activities. Climate change and human activities dominated 44.12–48.71% and 51.24–55.84% of grassland areas of the change of temporal stability of plant α-diversity, respectively. Radiation variability exerted some exclusive effects on the temporal stability of plant α-diversity. The relative change in plant α-diversity did not exhibit simple linear relationships with the relative change in its temporal stability. Therefore, climate change and human activities resulted in the spatial heterogenization of the temporal stability of plant α-diversity. While the overall temporal stability of plant α-diversity declined, some areas experienced local increases. Human activities drove changes in temporal stability across a broader area than climate change. In addition to climate warming and precipitation changes, attention should also be paid to the impact of radiation variability on the temporal stability of plant α-diversity. The relationships between plant α-diversity and its temporal stability were not always characterized by a trade-off or synergy. In future grassland biodiversity conservation efforts, it is essential to consider the potential influence of global dimming on the temporal stability of plant α-diversity. Simultaneously monitoring both α-diversity and its temporal stability, especially in areas where both are declining, should be a priority.

1. Introduction

As one of the largest ecosystems on Earth, grassland ecosystems are facing dual threats from climate change and human activities, which undermine their capacity to provide essential ecosystem services [1,2]. Understanding the dynamics of grassland ecosystem stability is crucial for anticipating the impacts of these threats and informing effective conservation strategies [3,4]. Extensive studies are conducted on the temporal stability of grassland ecosystems [5,6]. These studies not only deepen our understanding of ecosystem stability but also provide valuable guidance for grassland management. However, current studies still face three main limitations. First, interannual fluctuations in plant diversity are closely linked to those in productivity, suggesting that the temporal stability of diversity should be related to that of productivity [7,8]. However, most studies focus on the temporal stability of productivity, and few studies pay attention to the temporal stability of biodiversity [9,10]. This oversight limits our ability to gain a deeper understanding of plant productivity stability. Second, radiation variability is a key climatic factor influencing soil variables and related ecological processes [11,12]. However, current studies on the temporal stability of ecosystems focus on temperature and precipitation [13]; the role of radiation variability was largely overlooked. This neglect of radiation variability may lead to a biased understanding of climate-driven mechanisms and undermine the accuracy of ecosystem modeling. Third, a trend toward homogenization may suggest that management practices such as grazing regulation could be effective at broader spatial scales, whereas spatial heterogeneity may indicate the need for more refined, site-specific strategies tailored to diverse microenvironments. However, there is still ongoing debate over whether climate change and human activities homogenized or heterogenized the stability of plant species α-diversity [14,15,16]. This controversy may hinder the precise implementation of grassland management practices. Therefore, addressing the above uncertainties is essential for advancing our understanding of ecosystem dynamics and informing adaptive grassland management under global change scenarios.
The Qinghai–Xizang Plateau (QTP), as a high-altitude region highly vulnerable and sensitive to global change, is experiencing pronounced degradation of its alpine grasslands, drawing growing attention from the global scientific community [17,18,19]. Investigating the temporal stability of alpine grassland plant communities in this region helps assess the impacts of climate change and human activities on ecosystems and provides a preliminary reference and theoretical basis for anticipating changes in other ecosystems [20,21]. However, current studies on plant community stability in the QTP still face limitations and unresolved debates. First, most existing studies conducted at the plot scale [22], while addressing the spatiotemporal patterns of the temporal stability of plant diversity across the entire QTP grasslands remained relatively rare [9,23]. Moreover, most previous studies focused on the central and eastern QTP [24], with relatively little attention given to the western part. The western region is characterized by vast desert steppes and receives lower precipitation, making it potentially more sensitive to external disturbances [25,26]. Focusing solely on the central and eastern areas may therefore underestimate the sensitivity of temporal stability to environmental stressors. Second, there was considerable debate (increases, decreases, or no significant changes) regarding the effects of external disturbances on the temporal stability of plant α-diversity on the QTP [27,28]. These discrepancies may be attributed to variations in climatic and soil conditions [12,29]. Third, there was no consensus on the relationship between the change in biodiversity and its temporal stability [30,31,32]. This inconsistency may be related to the heterogeneity of environmental pressures, such as grazing intensity [33]. Thus, a comprehensive, large-scale assessment of temporal stability of plant α-diversity and its driving factors can better inform ecosystem management under global change in this sensitive region.
To solve the above limitations, this study drew on 21 consecutive years (2000–2020) of temporal stability of plant α-diversity covering the entire grassland areas on the QTP. Three key scientific questions were proposed: (1) what were the spatiotemporal patterns of the temporal stability of plant α-diversity and underlying driving mechanisms? (2) how did variation in radiation, together with precipitation and temperature variability influenced the temporal stability of plant α-diversity? (3) what was the relationship between changes in plant α-diversity and its temporal stability?

2. Materials and Methods

2.1. Study Area

The study area is located in the grasslands of the QTP, spanning approximately from 26°00′ N to 39°30′ N in latitude and from 73°30′ E to 104°40′ E in longitude. It is a vast alpine region in western China, covering approximately 2.5 million km2, with most areas lying between 3000 and 5000 m above sea level [34,35]. The plateau is characterized by a strong east–west climate gradient, transitioning from humid alpine meadows in the southeast to cold, arid desert steppes in the northwest [25,36]. Annual precipitation declines sharply from over 600 mm in the southeast to below 100 mm—and in some basins, even below 50 mm—in the west, while mean annual temperatures range from −5.6 to 17.6 °C [37]. Grassland types across the plateau include alpine meadow, alpine steppe, and alpine desert steppe, each hosting distinct plant community compositions [38]. The dominant land use is livestock grazing, with variable grazing intensity influenced by topography, climate, and regional policies [33].

2.2. Data

This study employed species richness (SR), Shannon, Simpson, and Pielou indices to capture more aspects of community structure. Species richness reflects the total number of species within a community. Shannon and Simpson were used to capture the influence from rare species and dominant species [39,40,41]. Pielou was selected for its ability to detect subtle changes in species evenness, making it especially suitable for capturing community responses to environmental disturbances [42,43]. Geographic factors (longitude, latitude, elevation) were included to capture broad-scale spatial variation and environmental context across the QTP. Climate variables (AT: annual temperature, AP: annual precipitation, Arad: annual radiation) are key factors influencing plant community, governing seed germination, water availability, and photosynthesis dynamics [32,44,45]. Soil properties (including soil organic carbon, SOC; total nitrogen, TN; total phosphorus, TP; ratio of SOC to TN; ratio of SOC to TP; ratio of TN to TP; ammonium nitrogen, NH4+-N; nitrate nitrogen, NO3-N; available phosphorus, SAP; C:N, ratio of SOC to TN; C:P, ratio of SOC to TP; N:P, ratio of TN to TP) were selected to represent key nutrient constraints on plant growth and community dynamics [12,46,47]. In addition, soil pH was considered due to its strong effects on nutrient availability and microbial processes [48,49] and thus may influence the temporal stability of plant α-diversity. Collectively, these variables provide an integrated perspective on the environmental controls of biodiversity temporal stability across the grasslands in the QTP.
The climate data were derived from monthly observations at 145 stations. The monthly data were first interpolated to obtain gridded climate data for the entire QTP, and then the annual gridded data were derived from the monthly gridded data. Plant α-diversity and soil data under the single effect of climate change scenario (C) and the combined effects of human activities and climate change scenario (C+H) were directly obtained using the random forest models [50,51,52,53]. The input variables for the random forest models under C included AT, AP, and Arad, while those under C+H included AT, AP, Arad, and maximum normalized difference vegetation index (NDVImax; data were obtained from the product of MOD13A3, 1 km × 1 km). Additionally, data under the single effect of human activities scenario (H) were obtained by dividing the values from the C+H by those from the C. All these data had a spatial resolution of 1 km × 1 km and covered the period from 2000 to 2020. The relative bias between observed and modeled plant α-diversity and soil data ranged from −4.49% to 4.39% and −8.44% to 9.49%, respectively [31,32,33,34]. The temporal stability of species richness under the combined effects of climate change and human activities, climate change alone, and human activities alone was denoted as the StabilitySR_C+H, StabilitySR_C, and StabilitySR_H, respectively. The relative changes in the temporal stability of species richness were denoted as RC_StabilitySR_C+H, RC_StabilitySR_C, and RC_StabilitySR_H, respectively. The temporal stability and relative changes of the other three plant α-diversity indices (Shannon, Simpson, and Pielou), climate data, and soil data were represented in a similar manner to the temporal stability and relative changes of species richness.

2.3. Statistical Analyses

Based on the climate data, soil data, and plant α-diversity data obtained from 2000 to 2020, the temporal stability of each grid cell over the past 21 years was calculated using the following formula (Equations (1)–(3)) [54]. These data were subsequently utilized to quantify the spatial patterns of temporal stability of plant α-diversity and driving mechanisms.
D ¯ = 1 T t = 1 T D t
σ H = 1 T 1 t = 1 T D ( t ) D ¯ 2
S t a b i l i t y D = D ¯ σ H
where D ¯ and σH represent the mean value and standard deviation of the climate, soil, or plant α-diversity from 2000 to 2020, respectively. T = 21 .
To obtain the relative change in temporal stability, this study employed the method of moving window (window size = 3). Firstly, 19 temporal stability values were calculated for each grid cell based on the Equations (1)–(3). Secondly, the slope was calculated based on the 19 data points of temporal stability. Finally, the relative change in temporal stability from 2000 to 2020 was determined using the slope and the temporal stability data from 2000 to 2002.
This study utilized univariate regression analysis to quantify the relationship between the temporal stability of plant α-diversity and geographic location, the temporal stability of climate data, and soil data. Structural equation modeling (the lavaan package) was utilized to quantify the direct and indirect effects of geographic location, the temporal stability of climate data, and soil data on the temporal stability of plant α-diversity. The varpart function was used to quantify the relative contributions of geographic location, the temporal stability of climate variables, the temporal stability of soil pH, and the temporal stability of the other soil data on the temporal stability of plant α-diversity.
The slopes of the temporal stability of plant α-diversity under the three scenarios were used to quantify whether climate change or human activities predominantly influenced changes in the temporal stability of plant α-diversity (Table S1). More importantly, to examine whether spatial homogenization or heterogenization occurred over time, this study analyzed the relationship between the temporal stability of plant α-diversity (stability) and the relative change in temporal stability (ΔStability). Specifically, ΔStabilitySR_C+H, ΔStabilityShannon_C+H, ΔStabilitySimpson_C+H and ΔStabilityPielou_C+H indicated the variation of the temporal stability of species richness, Shannon, Simpson, and Pielou in 2000–2020 under the combined effects of climate change and human activities; the other two scenarios were represented in a similar manner, respectively. A positive slope indicated that as the stability of α-diversity increases, the variation amplitude (ΔStability) also increases. This pattern suggested that higher-stability areas exhibited stronger increases, thereby widening the inter-pixel gaps and enhancing spatial heterogeneity. Conversely, a negative slope implied that low-stability areas changed more, narrowing the disparity among different areas and promoting spatial homogenization. Weak or non-significant slopes indicated negligible change of spatial distribution. Additionally, the study quantified the relationship between the relative change of plant species α-diversity and the relative change of the temporal stability of plant species α-diversity. All statistical analyses were conducted using the R software (version 4.2.2).

3. Results

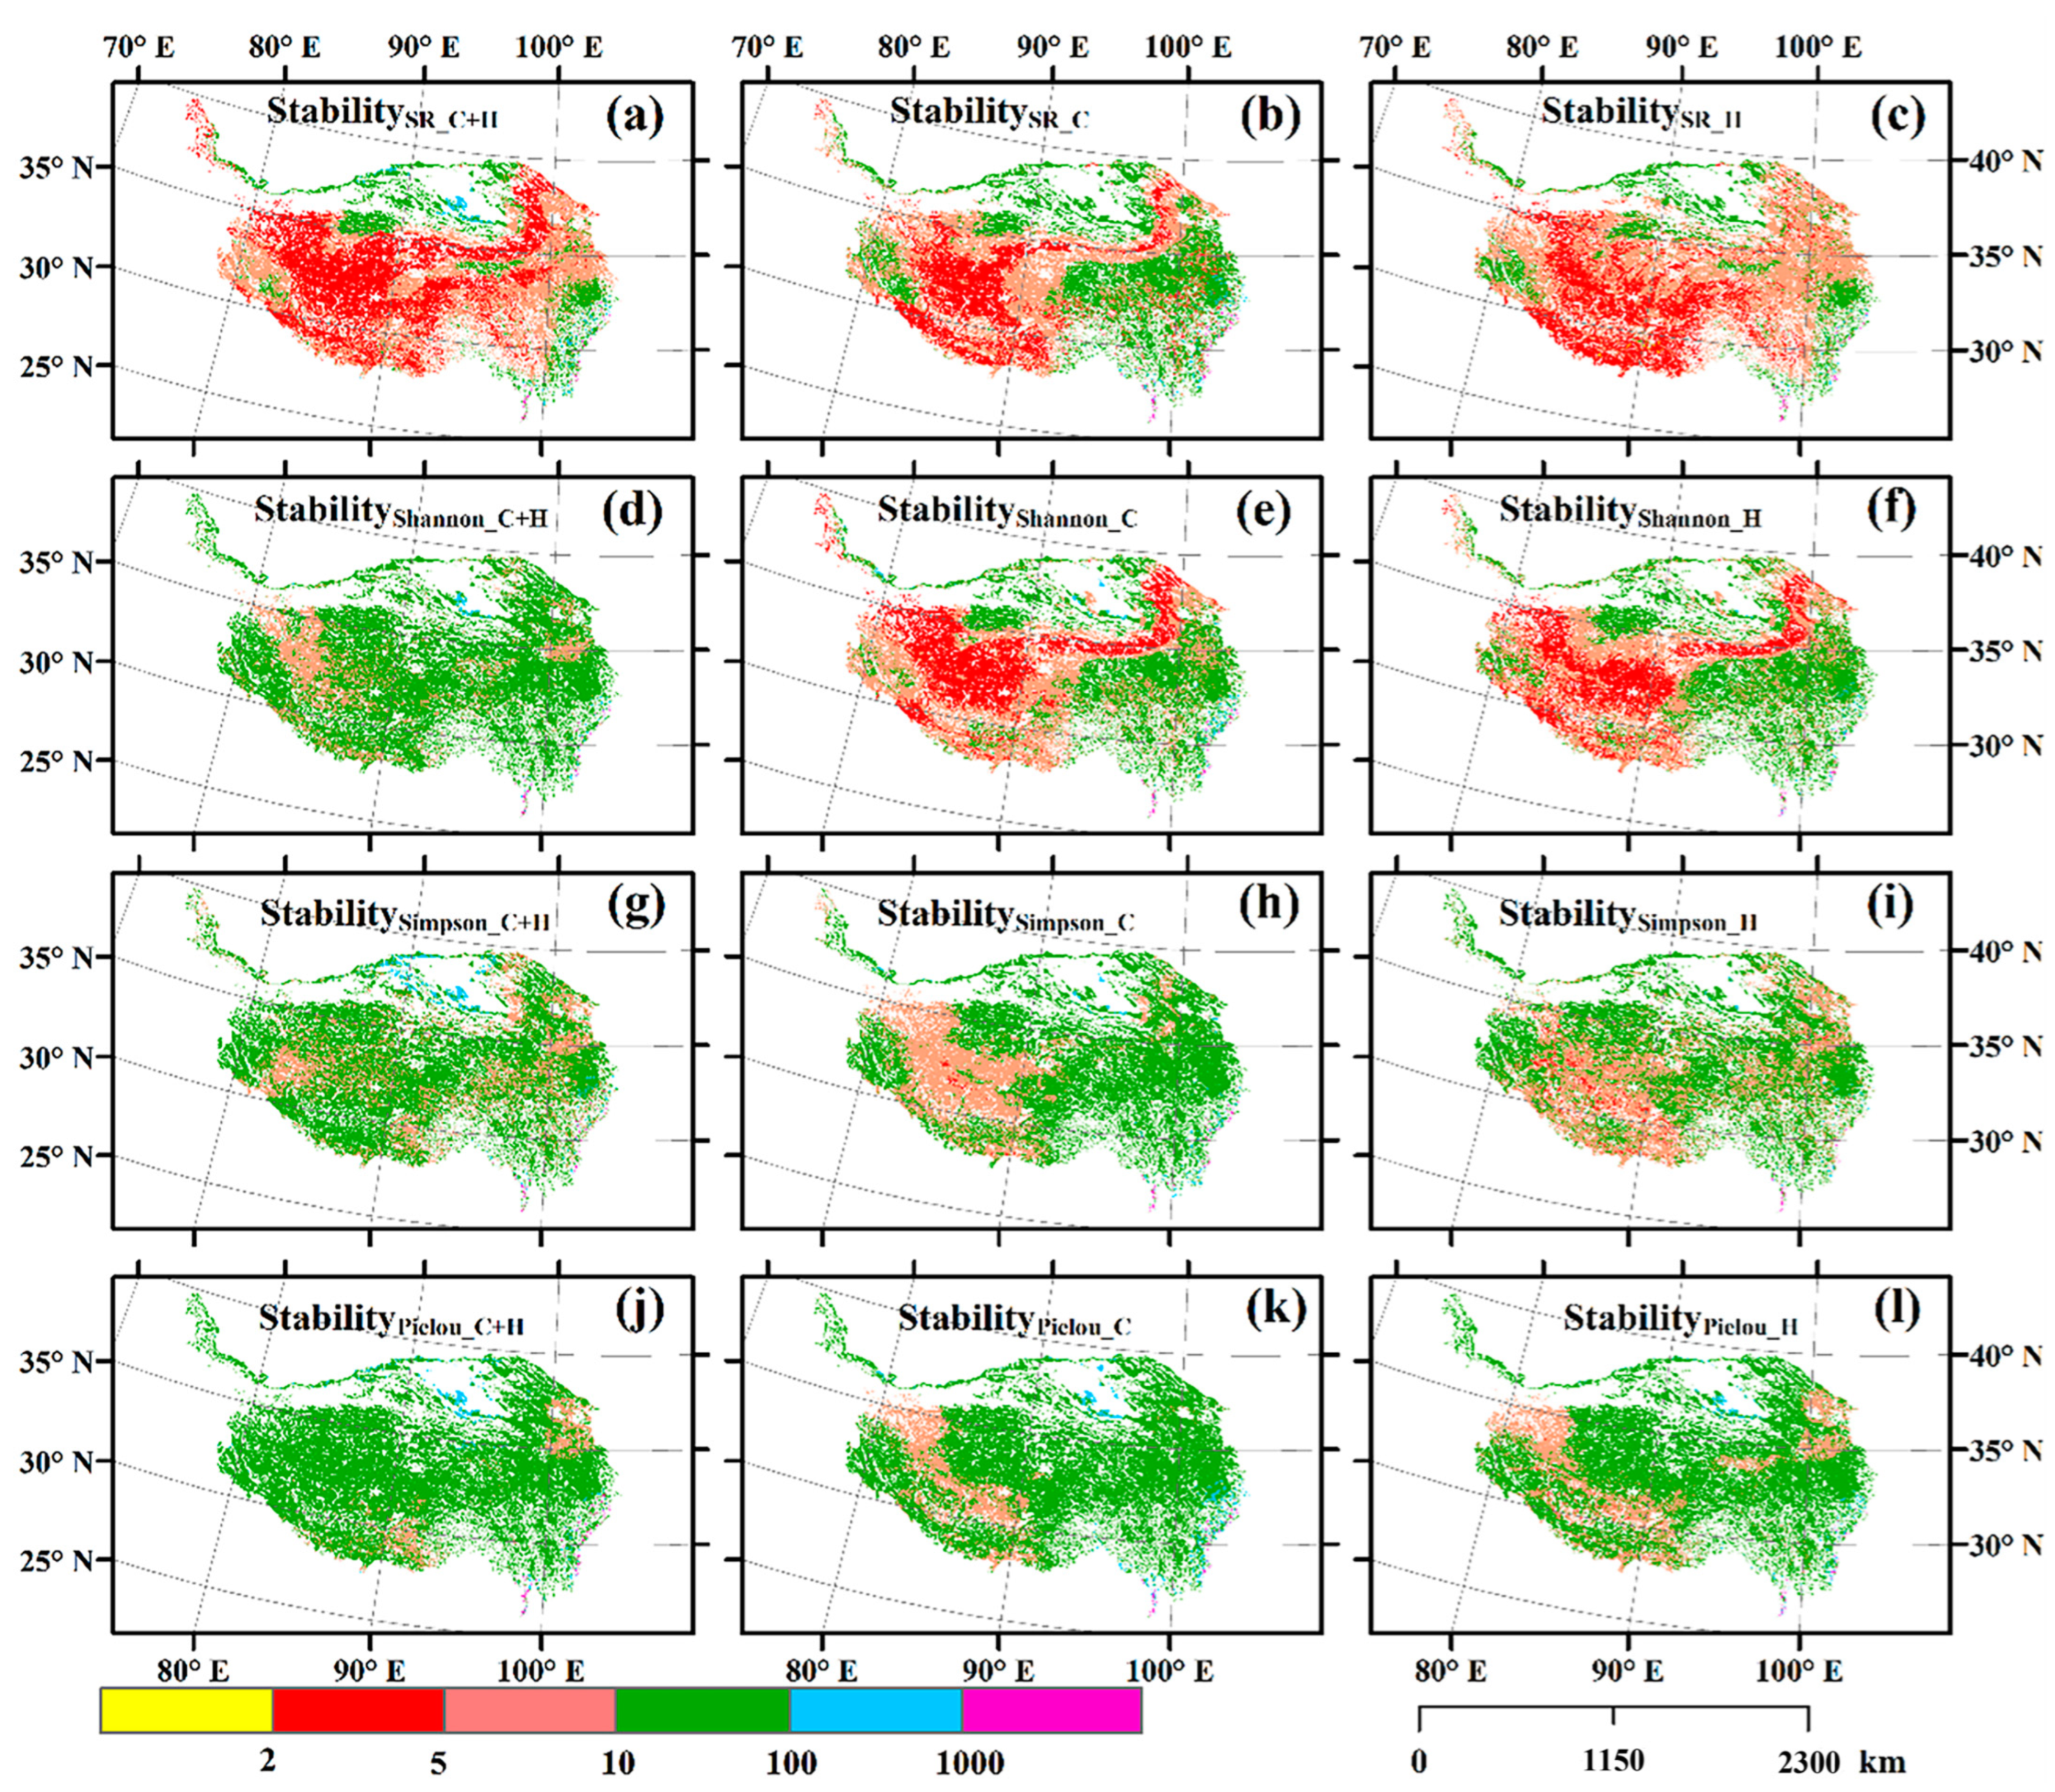
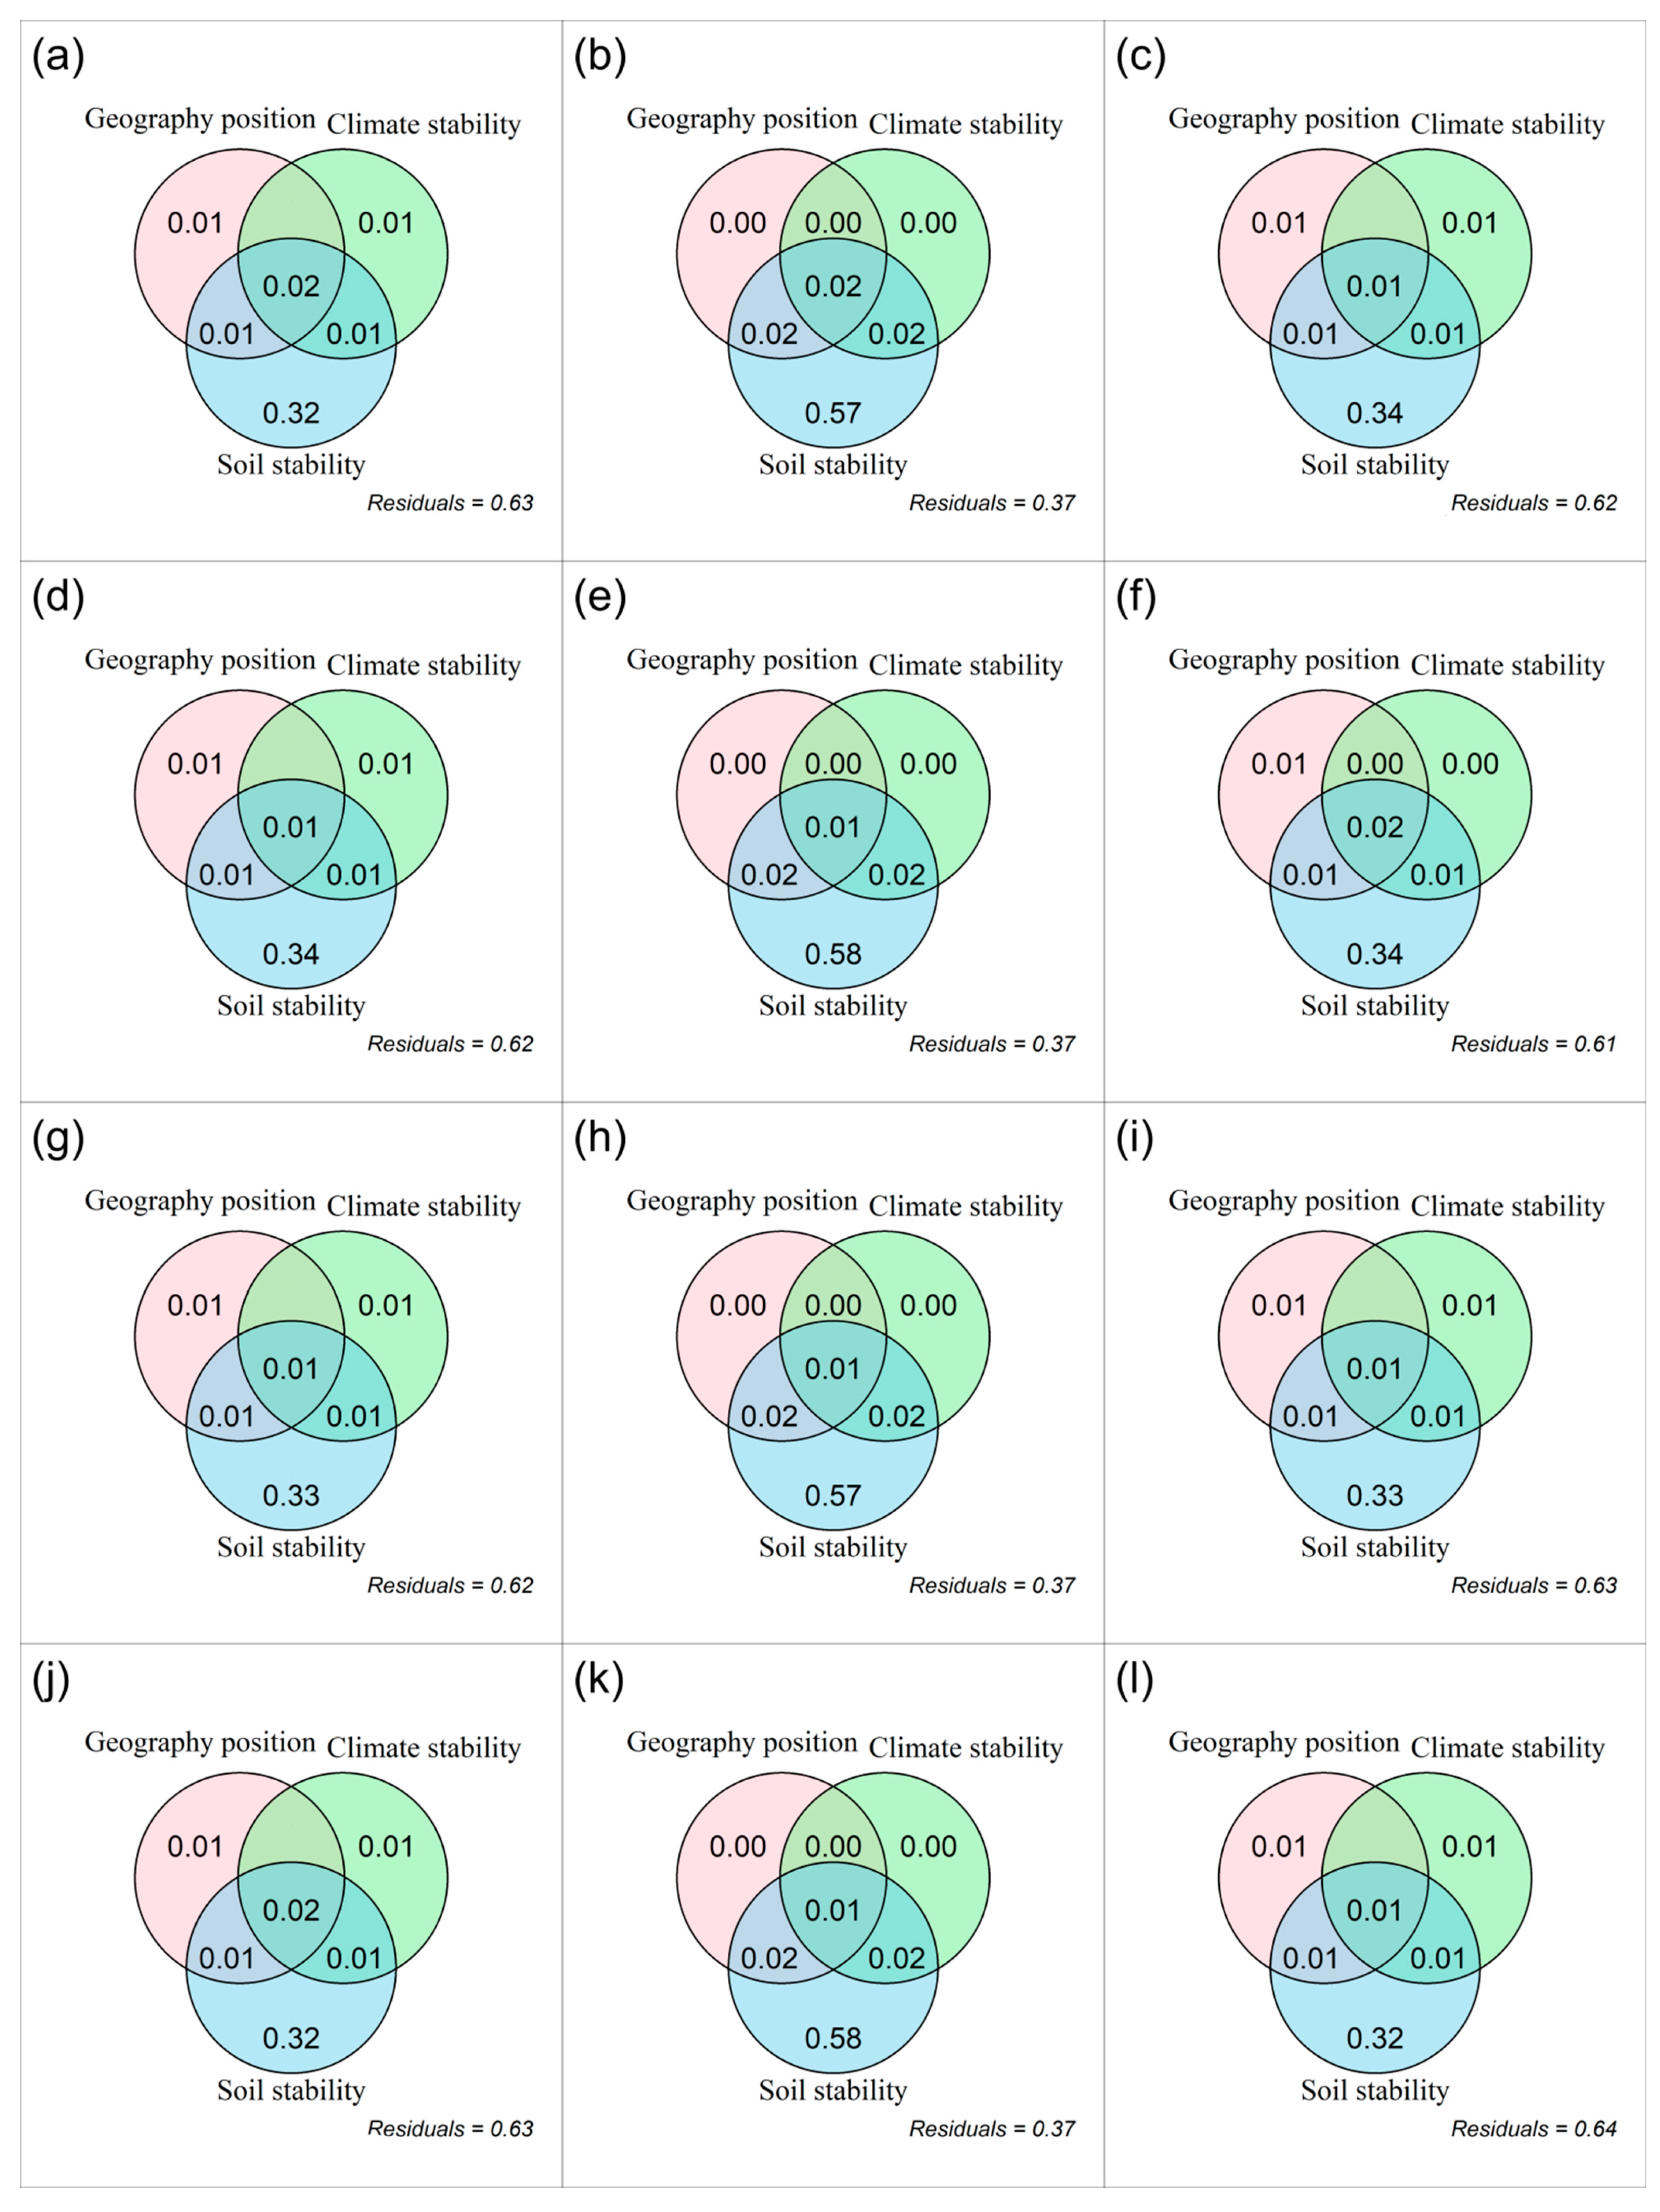
3.1. Spatial Distributions of Temporal Stability of Plant α-Diversity and Its Drivers

The temporal stability of plant α-diversity exhibited a clear elevational pattern, first decreasing and then increasing with rising elevation (Figure 1 and Figures S1–S3 and Table 1). Under the combined effects of climate change and human activities, the temporal stability of the Shannon became heterogeneous (Figure 2b). When influenced by climate change alone, SR and Shannon displayed a trend toward homogenization (Figure 2e,f), whereas Pielou showed heterogeneity (Figure 2h). In contrast, under the influence of human activities alone, SR, Shannon, and Simpson all tended toward heterogenization (Figure 2i–k).
Under the combined effects of climate change and human activities, the temporal stability of plant α-diversity generally increased with the rising temporal stability of AT and soil variables (Figures S4–S7). When influenced by climate change alone, the temporal stability of plant α-diversity was positively correlated with the temporal stability of AT and soil pH (Figures S8 and S11). Additionally, it showed a quadratic relationship with the temporal stability of SOC, TN, TP, their stoichiometric ratios, and the available nitrogen and SAP (Figures S9–S11). Under the influence of human activities alone, the temporal stability of plant α-diversity generally increased with the stability of AT, SOC, TN, TP, and their stoichiometric ratios, as well as soil pH (Figures S12–S15), and showed a quadratic relationship with the temporal stability of soil NH4+-N (Figure S15). Geographic, the temporal stability of climatic, and soil factors all exerted either direct or indirect influences on the temporal stability of plant α-diversity (Figures S16–S18). Compared to the stability of climate variables, the temporal stability of SOC, TN, TP, and their stoichiometric ratios, available nutrients, along with soil pH, had a more pronounced and exclusive effect on the temporal stability of plant α-diversity (Figure 3).

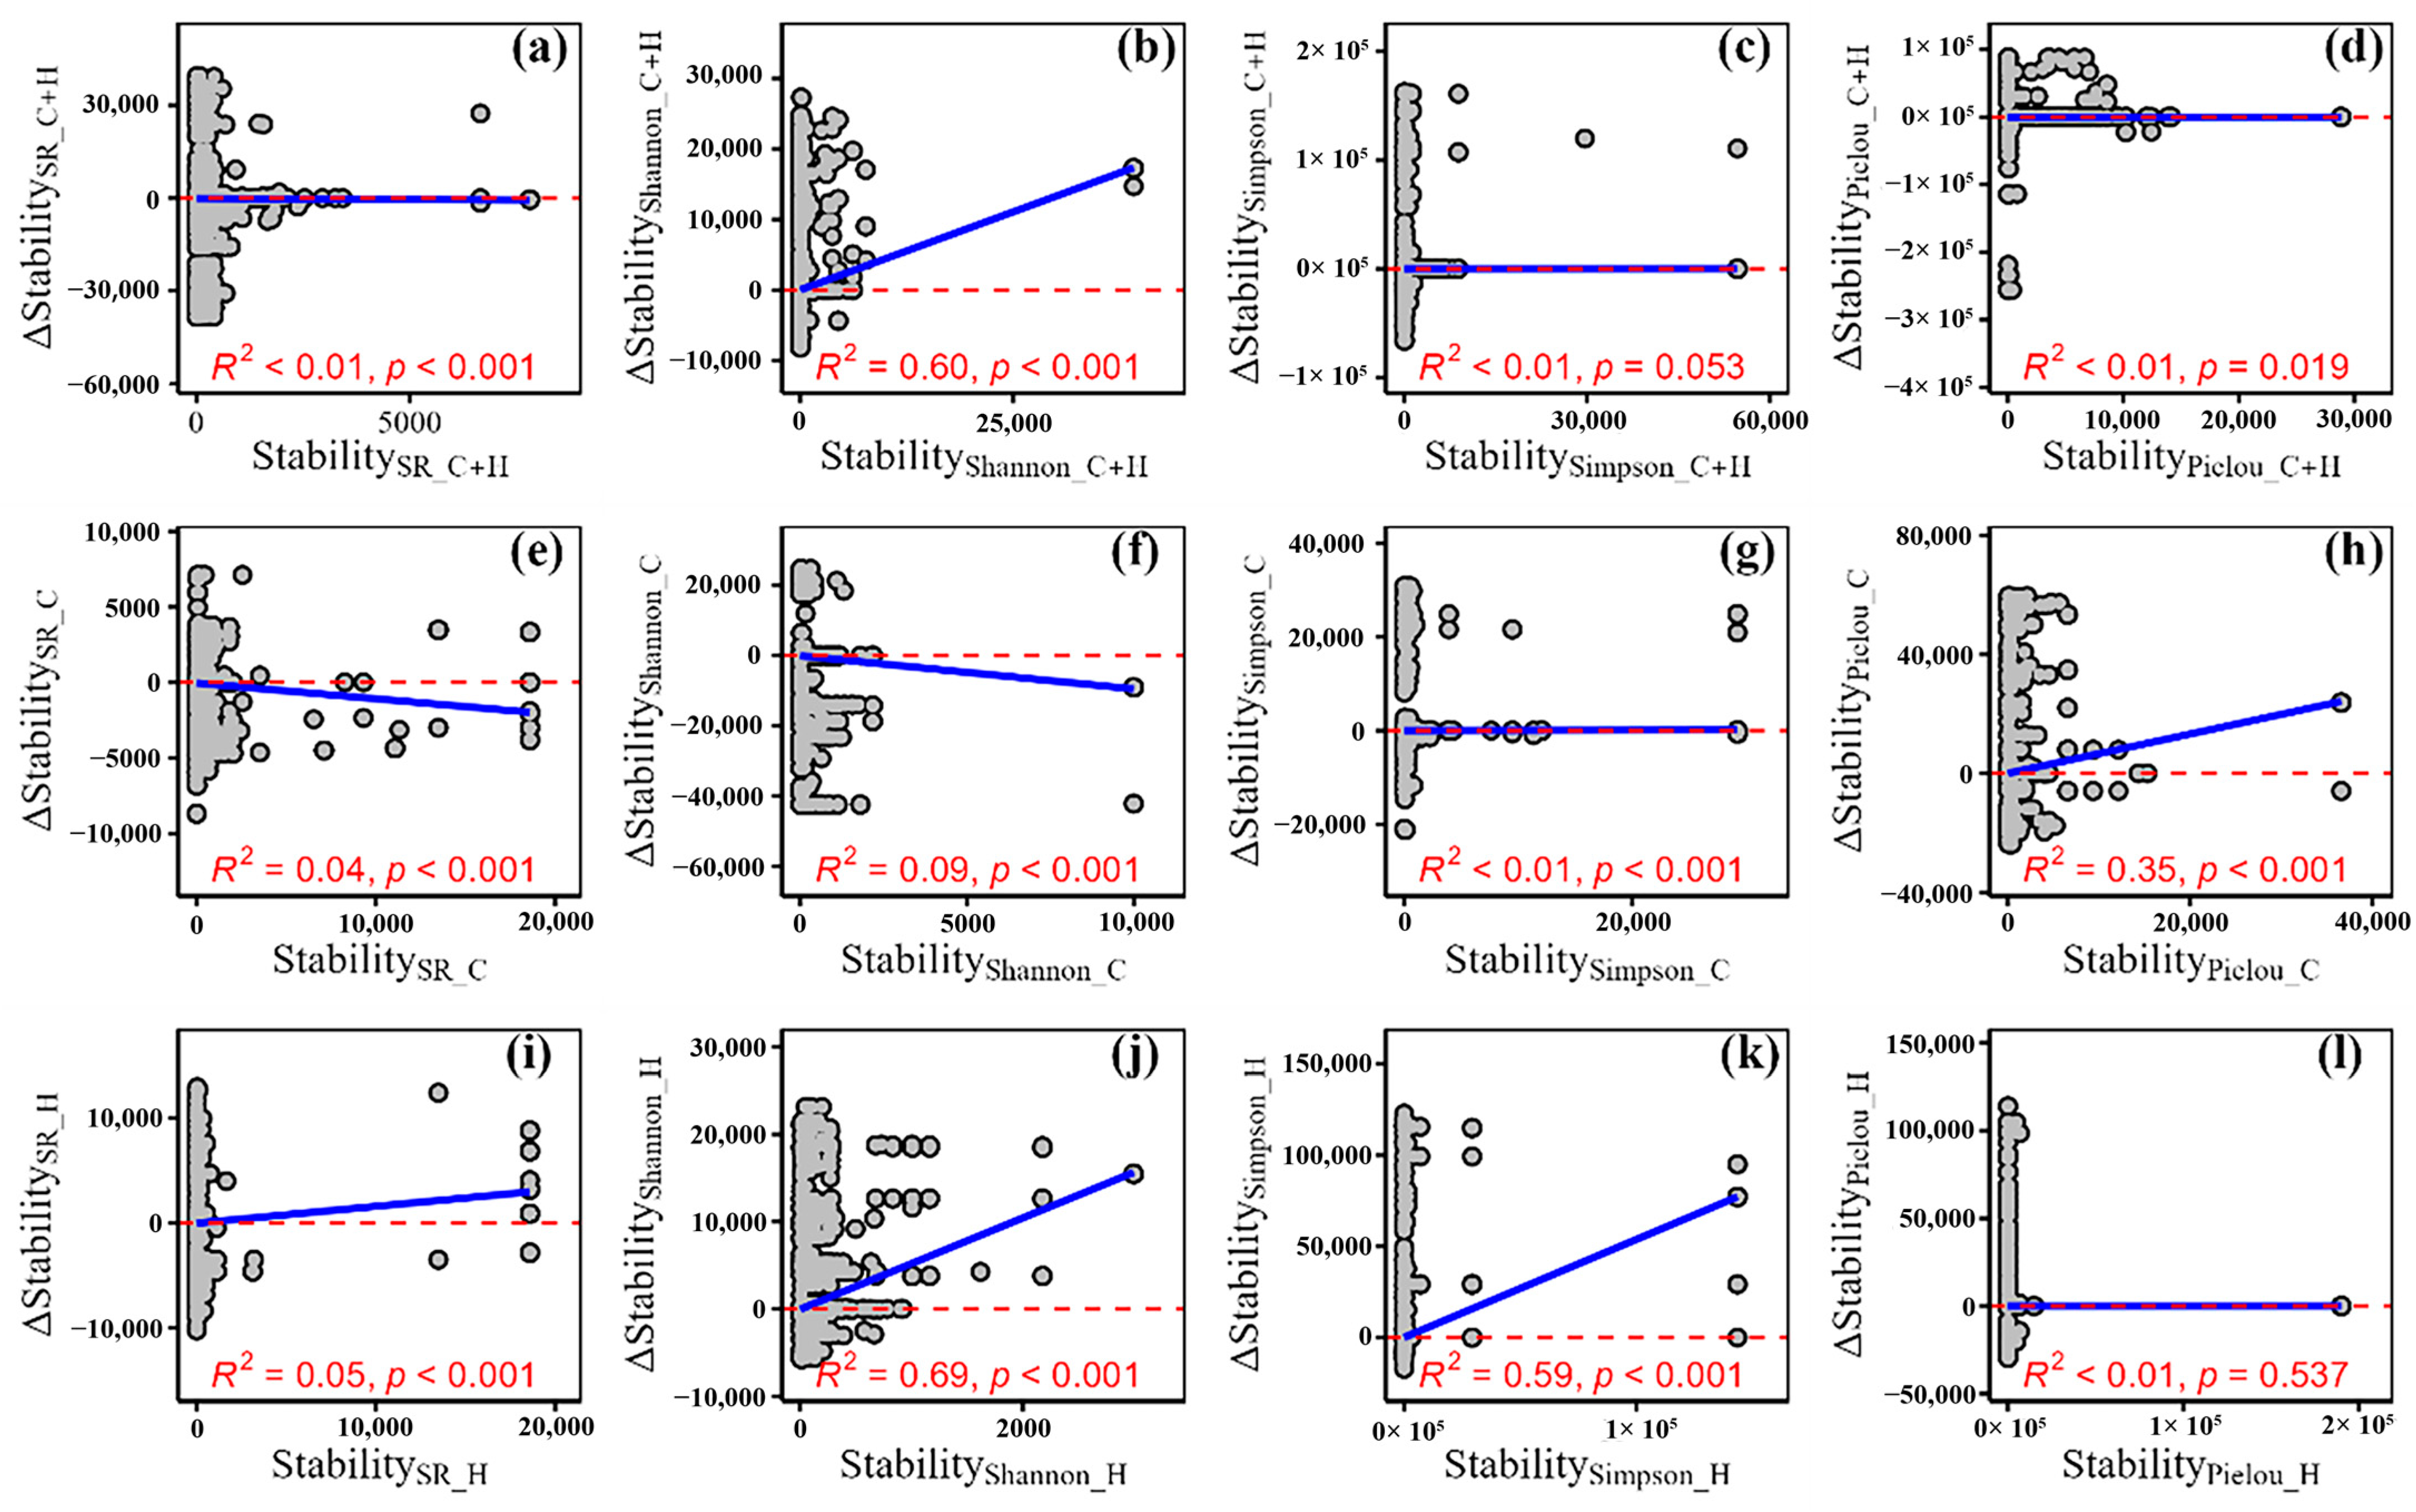
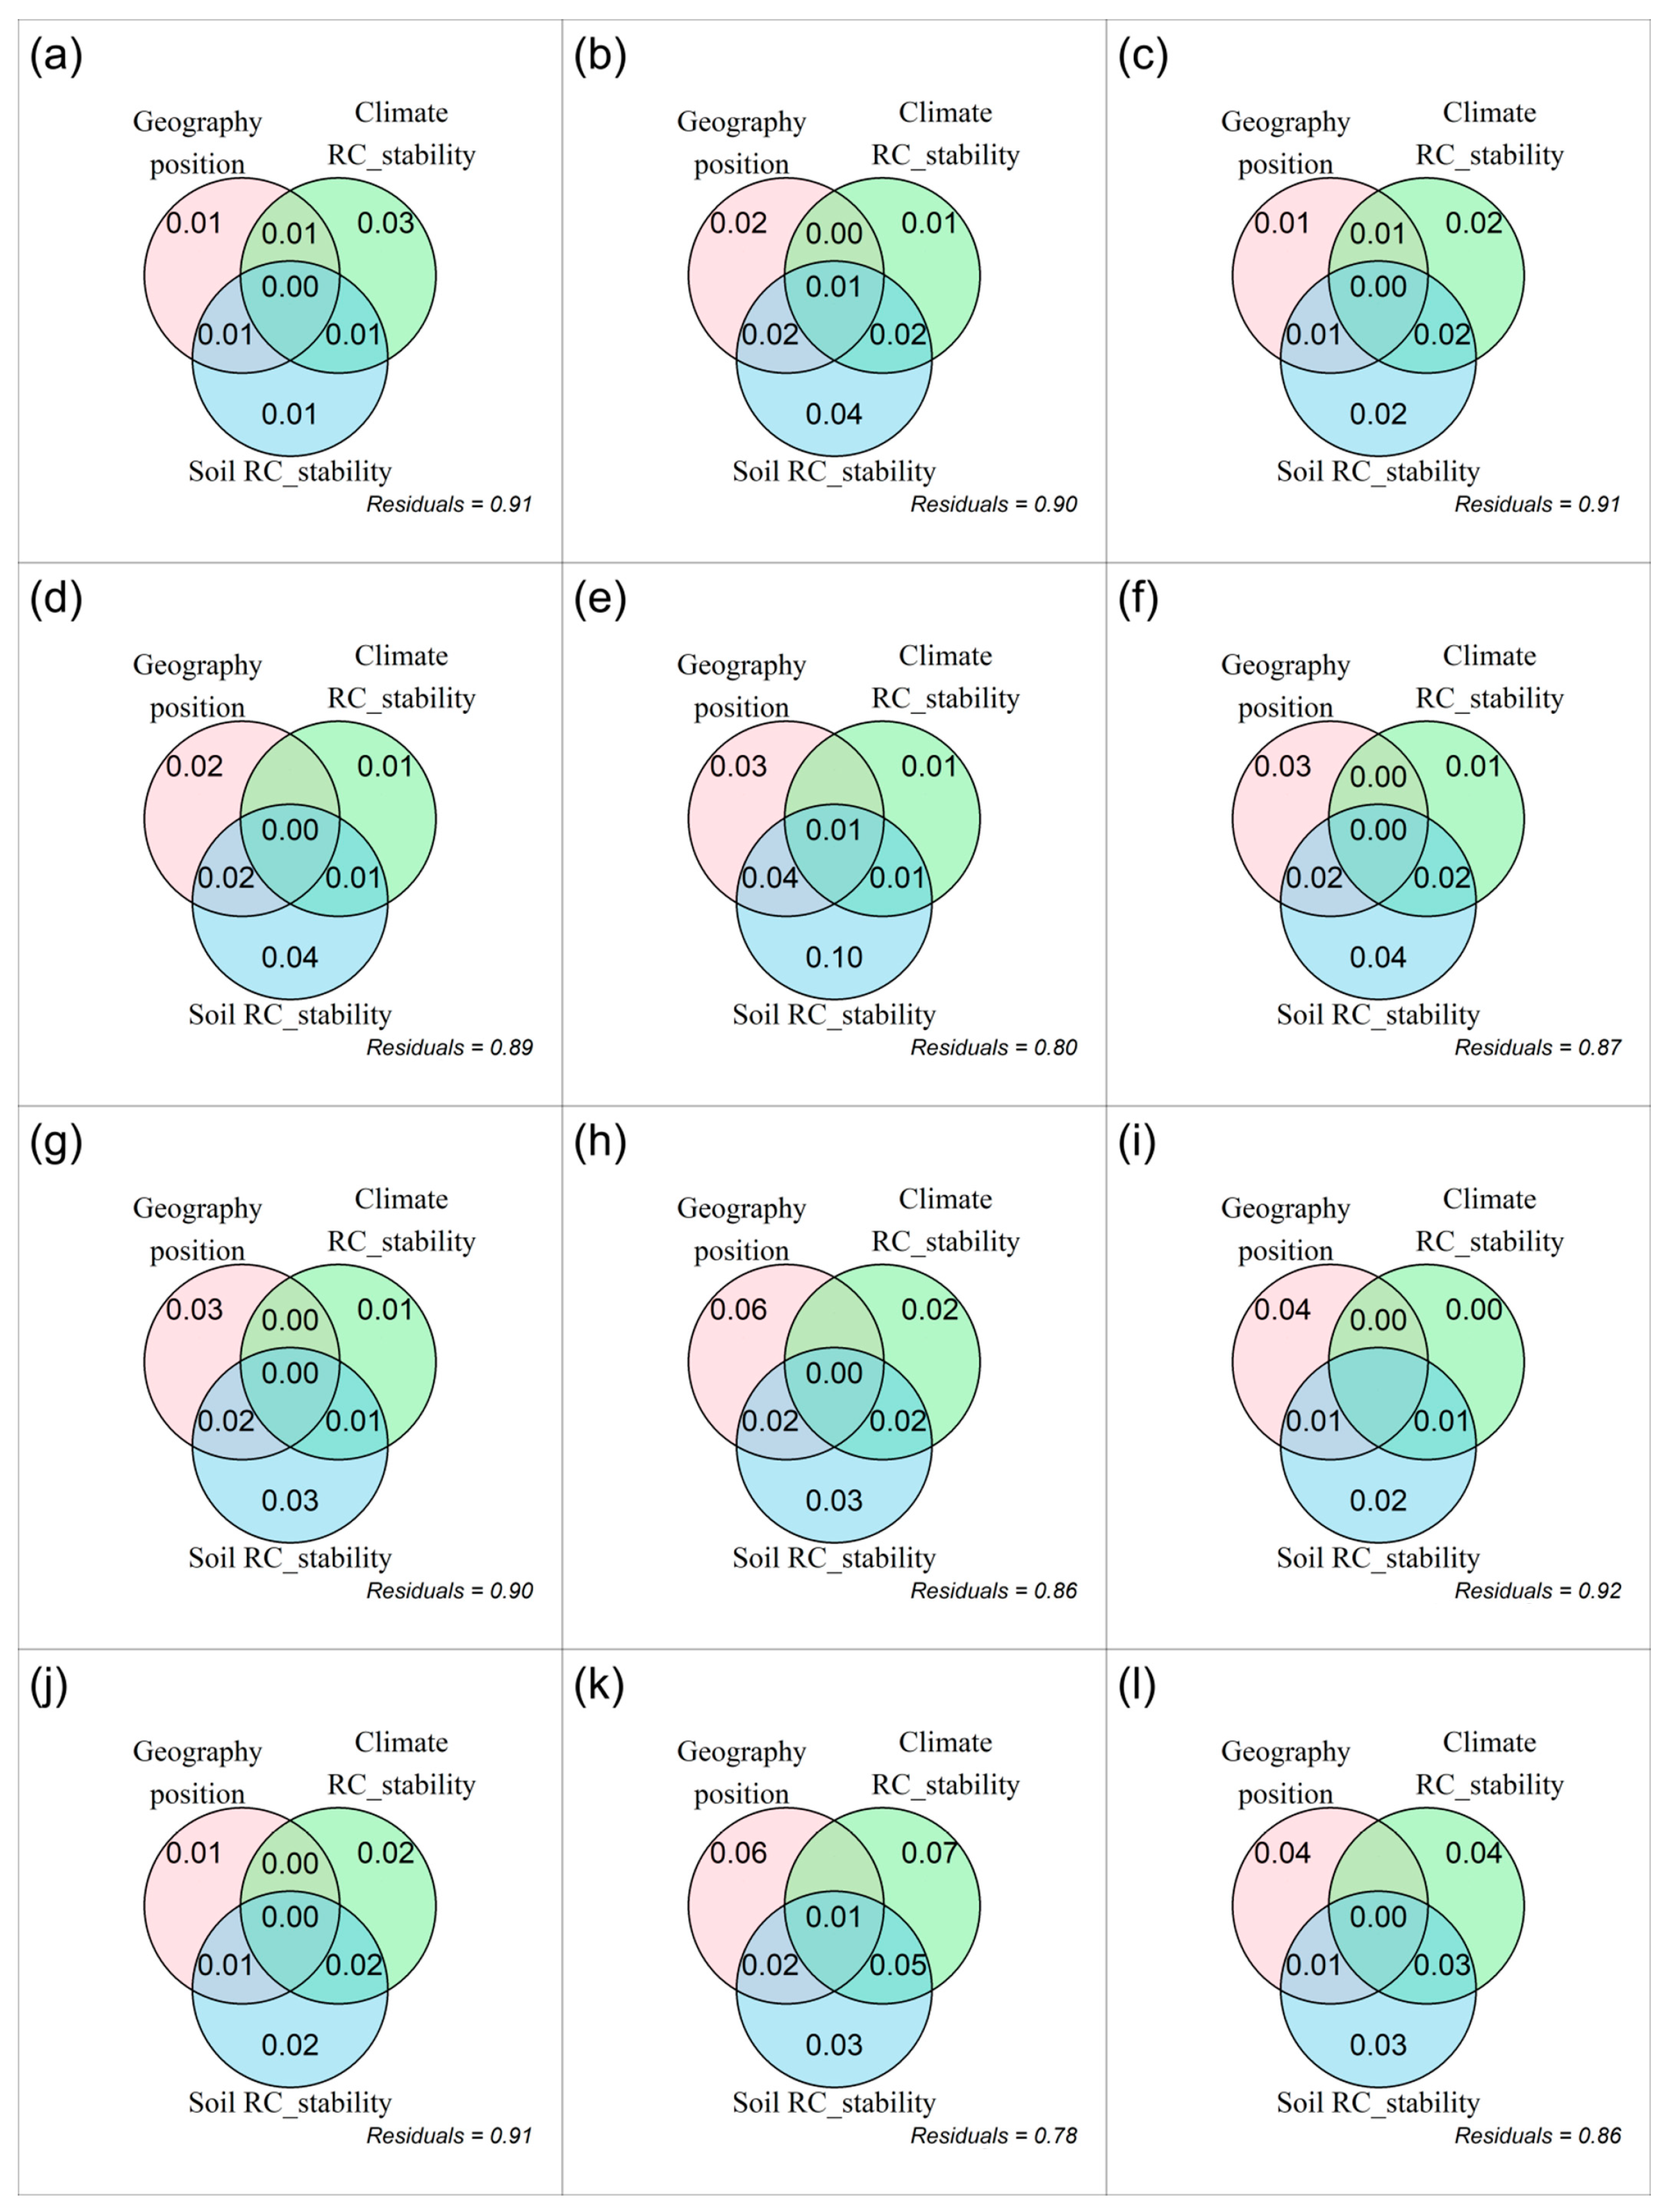
3.2. The Relative Change of Temporal Stability of Plant α-Diversity and Its Drivers

The spatial mean of plant α-diversity temporal stability declined overall by 8.83% to 16.40% (Table 2). Despite the overall decline, an increase in the temporal stability of plant α-diversity was detected across 39.34–43.77% of the alpine grassland (Figure 4, Table 2).
Increases in the temporal stability of plant α-diversity in QTP were mainly driven by climate change in 18.99–19.41% and by human activities in 19.40–24.02%, respectively. Conversely, in areas where stability declined, climate change was the main driver across 24.69–28.90% of the area, while that of human activities accounted for 29.98–31.72% (Figure 5, Table 3).
The relative changes of the temporal stability of plant α-diversity exhibited nonlinear relationships with geographic factors (Figures S19–S21). Under the combined influence of climate change and human activities, these relative changes showed a positive correlation with changes in AP and the temporal stability of soil variables (Figures S22–S25). When influenced by climate change alone, the relative changes of the temporal stability of plant α-diversity generally followed a quadratic relationship with changes in AP, ARad, SOC, TN, TP, and their stoichiometric ratios, soil NH4+-N and pH (Figures S26–S29). Under the influence of human activities alone, the relative changes of stability exhibited quadratic relationships with AP, ARad, and soil pH and showed a certain degree of synergy with the stoichiometric ratios of SOC, TN, and TP (Figures S30–S33). The relative changes of the temporal stability of climate variables, SOC, TN, TP, and their stoichiometric ratios, soil pH, as well as available nitrogen and SAP, all directly or indirectly influenced the temporal variability of plant α-diversity stability (Figure 6 and Figures S34–S36).
For the SR under the C scenario (Figure 7e), Shannon under the C+H scenario (Figure 7b), and Simpson under the C scenario (Figure 7g), positive correlations were observed, suggesting that areas with increasing plant α-diversity also tended to experience enhancement in their temporal stability. However, the relationships were not uniformly consistent across all the indices and scenarios. Notably, all four possible combinations—(i) increases in both diversity and its temporal stability, (ii) decreases in both, (iii) diversity gains accompanied by stability declines, and (iv) stability increases despite diversity losses—were observed across different areas (Figure 7).

4. Discussion

4.1. Spatiotemporal Patterns of the Temporal Stability of Plant α-Diversity and Its Drivers

Unlike previous studies from other alpine grassland regions [55,56], the temporal stability of plant α-diversity was heterogenized under the combined effect of climate change and human activities in the QTP (Figure 2b). This phenomenon may be attributed to several mechanisms. First, human activities heterogenized the temporal stability of plant α-diversity (Figure 2i–k). Although climate change homogenized the temporal stability of plant α-diversity, its effect was lower than the heterogenization caused by human activities (Figure 2f). Second, as solar radiation is generally higher in high-altitude regions than in low-altitude areas [57], the decline in solar radiation at higher elevations is less pronounced than that observed at lower elevations under the background of global dimming [58]. In addition, compared with low-altitude areas, mid-altitude regions experience relatively lower grazing intensity [59]. Additionally, the increase in grazing intensity is more substantial in low-altitude zones than in mid-altitude areas over recent decades [33]. Finally, soil total nitrogen and pH were heterogenized by climate change and human activities [60], which contributed to the heterogenization of temporal stability of plant α-diversity (Figure 3 and Figures S1–S15).
The reasons for the overall decline in the spatial average temporal stability of plant α-diversity and localized increases (Figure 4 and Table 2) may be the following aspects. First, the area where the temporal stability of plant α-diversity declined was consistently larger than the area where it increased (Table 3). In most cases, the absolute value of the minimum relative change in plant species α-diversity stability also exceeded that of the maximum (Table 2). Second, the temporal stability of soil and climate factors also showed an overall declining trend with localized increases [60]. Moreover, the temporal stability of plant α-diversity was influenced either directly or indirectly by the temporal stability of these factors (Figure 6 and Figures S1–S36). Third, the directions and intensities of climate change differed among different grassland areas [11]. Finally, some grasslands underwent positive succession, and their temporal stability may be enhanced [24,61,62]. In contrast, other grasslands degradated, and their temporal stability may be reduced [63,64].
Unlike the findings from other alpine grassland areas outside the QTP [65,66,67], the area where human activities dominate the temporal stability of plant α-diversity was larger than that dominated by climate change. This phenomenon may be explained by the following reasons. First, the temporal stability of soil nutrients was more strongly influenced by human activities in larger areas than those under climate change [60]. Second, due to technological advancements such as improved transportation infrastructure, the scope of human activities expanded in recent years [68,69]. Finally, the rate of climate warming across the entire QTP is slowing down [70,71].

4.2. The Effects of Precipitation, Temperature, and Radiation on the Temporal Stability of Plant α-Diversity

Precipitation, temperature, and radiation can influence the temporal stability of plant α-diversity through the following mechanisms. First, water, temperature, and radiation are three important resources for plant growth [32,44,72], implying that the precipitation, temperature, and radiation factors may directly affect the temporal stability of plant α-diversity. Second, increased precipitation may accompany the decline in radiation reaching aboveground, probably alleviating climate warming [73,74,75]. Controversially, climate warming may enhance the evapotranspiration, which in turn increases the probability of precipitation. Finally, changes in precipitation and temperature directly regulate soil microbial activity involved in nitrogen mineralization, ammonification, and nitrification processes [76,77]. Radiation can alter the above- and below-ground biomass allocation in plants, thereby reshaping rhizosphere environments and modifying plant–microbe interactions [78], which ultimately affects the microbial activity responsible for nutrient mineralization [79]. These cascading effects may modulate how soil nutrient availability influences the temporal stability of plant α-diversity.

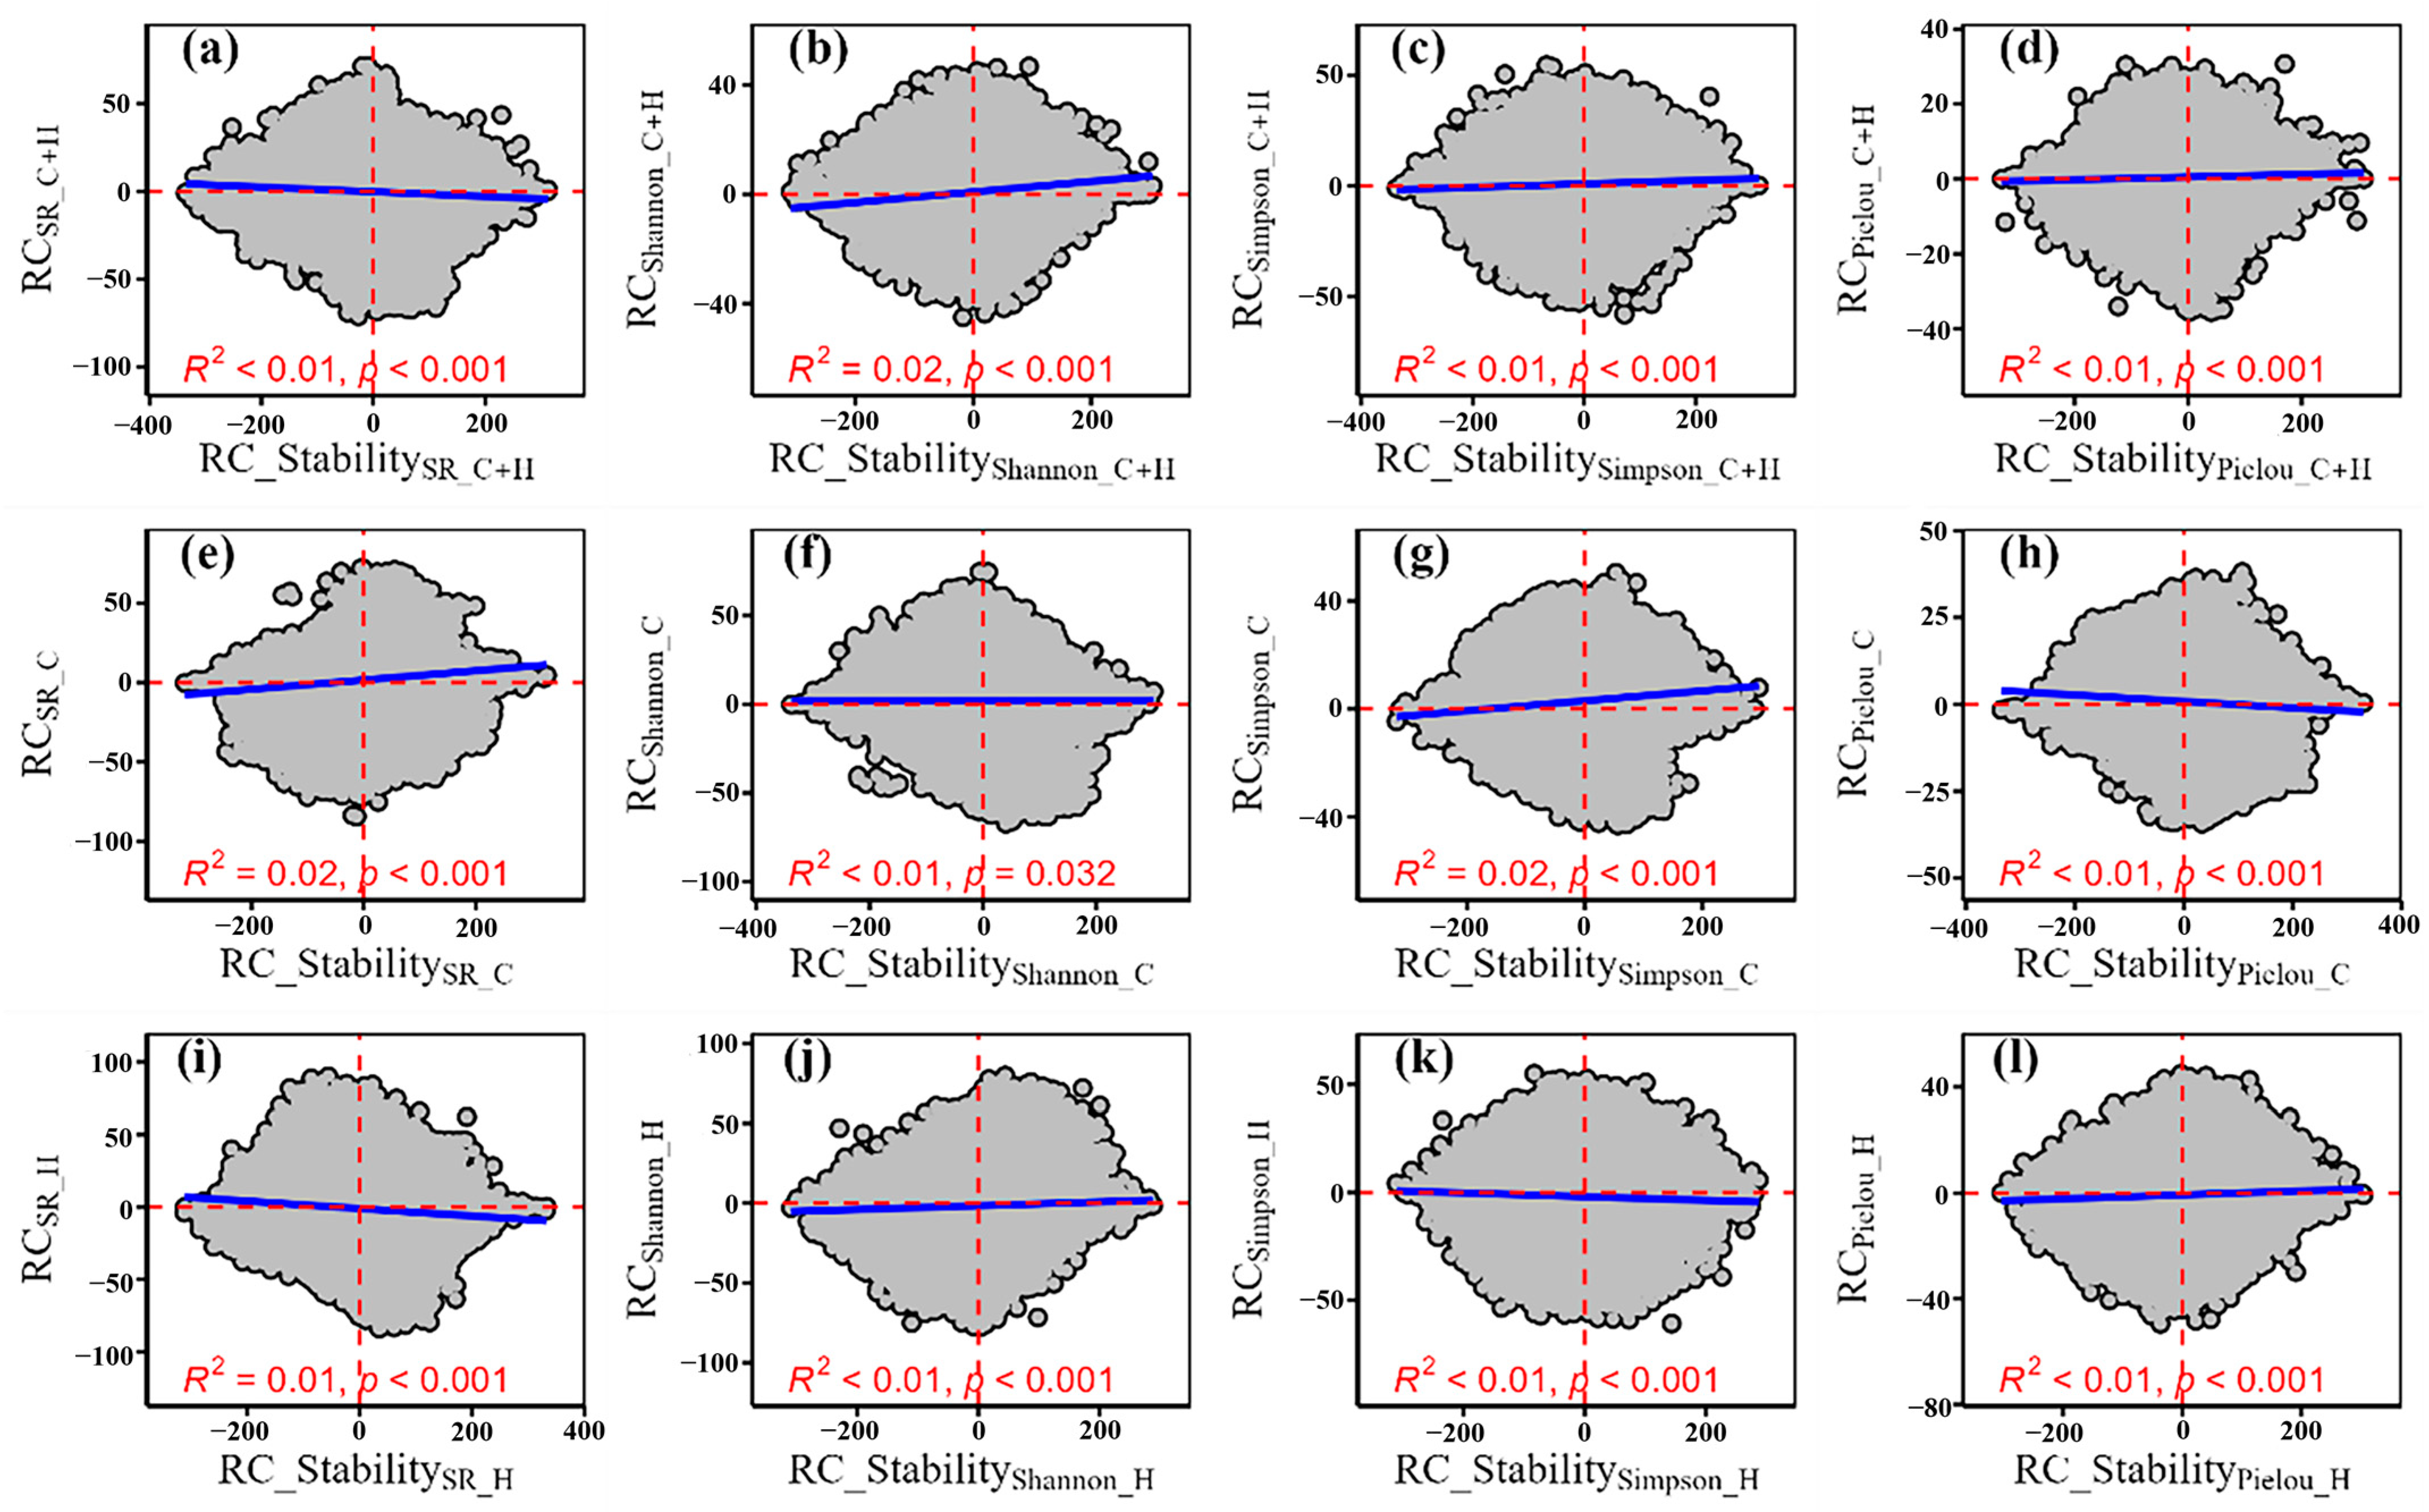
4.3. The Relationship Between the Relative Change of Plant α-Diversity and That of Its Temporal Stability

The relationship between the relative change of plant α-diversity and that of its temporal stability was not always synergy or trade-off (Figure 7). Several factors may account for this phenomenon. First, the initial (2000), intermediate, and final (2020) stages of plant community succession could represent either climax or non-climax communities. Generally, as succession progresses from non-climax to climax communities, the temporal stability of plant α-diversity should tend to increase, while a reverse successional trend would likely decrease stability [80]. However, climax communities do not necessarily exhibit higher α-diversity than non-climax communities [81,82]. That is, the higher temporal stability may not always align with the higher diversity. Second, factors such as livestock selective grazing, habitat fragmentation caused by road construction, and wind speed decline driven by asymmetric warming can reduce plant dispersal capacity [83,84,85]. Although these factors may restrict increases in plant α-diversity, they could also inhibit the establishment of invasive species and alleviate resource competition [86], thereby maintaining or even enhancing the temporal stability of plant α-diversity. Finally, the “insurance effect” may also partially explain this observation. Although overgrazing may reduce α-diversity, the selective pressure could enhance species asynchrony among the remaining species, thereby strengthening the stability of plant communities under disturbance [87,88].

5. Conclusions

The study drew the four main conclusions. First, climate change and human activities jointly heterogenized the spatial patterns of temporal stability of plant α-diversity, primarily attributed to the heterogenizing effect of human activities. The area dominated by human activities-induced changes in temporal stability of plant α-diversity was larger than that driven by climate warming. These findings indicated that the impact of human activities gradually intensified.
Second, climate change and human activities collectively caused an overall decline in the temporal stability of plant α-diversity, with local increases. This implied that protection of plant α-diversity should be continuously strengthened, especially in regions where α-diversity decreased.
Third, the changes in plant α-diversity and its temporal stability did not always exhibit synergistic or trade-off relationships. For example, there were regions where both α-diversity and its temporal stability decreased simultaneously. This suggested that even if plant diversity increased, the risk of decreasing temporal stability should be monitored. In future plant biodiversity conservation, both diversity and its temporal stability should be concurrently addressed, with particular attention to regions where both are declining.
Finally, in addition to climate warming and precipitation changes, radiation variability significantly influenced the temporal stability of plant α-diversity. This highlighted that the impact of global dimming on plant α-diversity should not be overlooked in biodiversity conservation efforts. Moreover, the effect of temperature, preciptation, and radiation should be considered simultaneously.

Supplementary Materials

The following supporting information can be downloaded at https://www.mdpi.com/article/10.3390/agronomy15071502/s1, Table S1 shows the dominant factors of temporal stability of plant α-diversity. Figure S1, presents the relationships between the temporal stability of plant species α-diversity and geographic position under the scene simultaneously affected by climate change and human activities, respectively; Figure S2, illustrates the relationships between the temporal stability of plant species α-diversity and geographic position under the scene solely affected by climate change; Figure S3, depicts the relationships between the temporal stability of plant species α-diversity and geographic position under the scene solely affected by human activities; Figure S4, shows the relationships between the temporal stability of plant species α-diversity and the temporal stability of climate variables under the scene simultaneously affected by climate change and human activities, respectively; Figure S5, exhibits the relationships between the temporal stability of plant species α-diversity and the temporal stability of soil C, N, P under the scene simultaneously affected by climate change and human activities, respectively; Figure S6, illustrates the relationships between the temporal stability of plant species α-diversity and the temporal stability of the stoichiometric ratios of soil C, N, P under the scene simultaneously affected by climate change and human activities, respectively; Figure S7, demonstrates the relationships between the temporal stability of plant species α-diversity and the temporal stability of the available soil N and P under the scene simultaneously affected by climate change and human activities, respectively; Figure S8, shows the relationships between the temporal stability of plant species α-diversity and the temporal stability of climate variables under the scene solely affected by climate change; Figure S9, presents the relationships between the temporal stability of plant species α-diversity and the temporal stability of soil C, N, P under the scene solely affected by climate change; Figure S10, shows the relationships between the temporal stability of plant species α-diversity and the temporal stability of the stoichiometric ratios of soil C, N, P under the scene solely affected by climate change; Figure S11, highlights the relationships between the temporal stability of plant species α-diversity and the temporal stability of the available soil N and P under the scene solely affected by climate change; Figure S12, presents the relationships between the temporal stability of plant species α-diversity and the temporal stability of climate variables under the scene solely affected by human activities; Figure S13, illustrates the relationships between the temporal stability of plant species α-diversity and the temporal stability of soil C, N, P under the scene solely affected by human activities; Figure S14, shows the relationships between the temporal stability of plant species α-diversity and the temporal stability of the stoichiometric ratios of soil C, N, P under the scene solely affected by human activities; Figure S15, depicts the relationships between the temporal stability of plant species α-diversity and the temporal stability of the available soil N and P under the scene solely affected by human activities; Figure S16, presents a structural equation model, showing the direct and indirect effects of geographic position, temporal stability of climate variables and soil variables to temporal stability of plant species α-diversity under the scene simultaneously affected by climate change and human activities, respectively; Figure S17, showcases a structural equation model, showing the direct and indirect effects of geographic position, temporal stability of climate variables and soil variables to temporal stability of plant species α-diversity under the scene solely affected by climate change; Figure S18, presents a structural equation model, showing the direct and indirect effects of geographic position, temporal stability of climate variables and soil variables to temporal stability of plant species α-diversity under the scene solely affected by human activities; Figure S19, illustrates the relationships between the relative change of temporal stability of plant species α-diversity and geographic position under the scene simultaneously affected by climate change and human activities, respectively; Figure S20, details the relationships between the relative change of temporal stability of plant species α-diversity and geographic position under the scene solely affected by climate change; Figure S21, presents the relationships between the relative change of temporal stability of plant species α-diversity and geographic position under the scene solely affected by human activities; Figure S22, demonstrates the relationships between the relative change of temporal stability of plant species α-diversity and the relative change of temporal stability of climate variables under the scene simultaneously affected by climate change and human activities, respectively; Figure S23, shows the relationships between the relative change of temporal stability of plant species α-diversity and the relative change of temporal stability of soil C, N, P under the scene simultaneously affected by climate change and human activities, respectively; Figure S24, highlights the relationships between the relative change of temporal stability of plant species α-diversity and the relative change of temporal stability of the stoichiometric ratios of soil C, N, P under the scene simultaneously affected by climate change and human activities, respectively; Figure S25, shows the relationships between the relative change of temporal stability of plant species α-diversity and the relative change of temporal stability of the available soil N and P under the scene simultaneously affected by climate change and human activities, respectively; Figure S26, presents the relationships between the relative change of temporal stability of plant species α-diversity and the relative change of temporal stability of climate variables under the scene solely affected by climate change; Figure S27, depicts the relationships between the relative change of temporal stability of plant species α-diversity and the relative change of temporal stability of soil C, N, P under the scene solely affected by climate change; Figure S28, illustrates the relationships between the relative change of temporal stability of plant species α-diversity and the relative change of temporal stability of the stoichiometric ratios of soil C, N, P under the scene solely affected by climate change; Figure S29, shows the relationships between the relative change of temporal stability of plant species α-diversity and the relative change of temporal stability of the available soil N and P under the scene solely affected by climate change; Figure S30, presents the relationships between the relative change of temporal stability of plant species α-diversity and the relative change of temporal stability of climate variables under the scene solely affected by human activities; Figure S31, shows the relationships between the relative change of temporal stability of plant species α-diversity and the relative change of temporal stability of soil C, N, P under the scene solely affected by human activities; Figure S32, depicts the relationships between the relative change of temporal stability of plant species α-diversity and the relative change of temporal stability of the stoichiometric ratios of soil C, N, P under the scene solely affected by human activities; Figure S33, shows the relationships between the relative change of temporal stability of plant species α-diversity and the relative change of temporal stability of the available soil N and P under the scene solely affected by human activities; Figure S34, shows the structural equation model, showing the direct and indirect effects of geographic position, the relative change of temporal stability of climate variables and soil variables to the relative change of temporal stability of plant species α-diversity under the scene simultaneously affected by climate change and human activities, respectively; Figure S35, illustrates the structural equation model, showing the direct and indirect effects of geographic position, the relative change of temporal stability of climate variables and soil variables to the relative change of temporal stability of plant species α-diversity under the scene solely affected by climate change; and Figure S36, presents the structural equation model, showing the direct and indirect effects of geographic position, the relative change of temporal stability of climate variables and soil variables to the relative change of temporal stability of plant species α-diversity under the scene solely affected by human activities.

Author Contributions

Writing—original draft preparation, T.L., W.S., S.L., E.D., and G.F.; writing—review and editing, T.L., W.S., S.L., E.D., and G.F. All authors have read and agreed to the published version of the manuscript.

Funding

This study was funded by the Xizang Autonomous Region Science and Technology Project [XZ202401JD0029, XZ202501ZY0056, XZ202401ZY0074, XZ202501ZY0086] and the Lhasa Science and Technology Plan Project [LSKJ202422].

Data Availability Statement

The original data have been included in the main text and Supplementary Materials.

Conflicts of Interest

The authors declare no conflicts of interest.

References

  1. Lei, T.J.; Feng, J.; Lv, J.; Wang, J.B.; Song, H.Q.; Song, W.L.; Gao, X.F. Net Primary Productivity Loss under different drought levels in different grassland ecosystems. J. Environ. Manag. 2020, 274, 111144. [Google Scholar] [CrossRef] [PubMed]
  2. Kamp, J.; Koshkin, M.A.; Bragina, T.M.; Katzner, T.E.; Milner-Gulland, E.J.; Schreiber, D.; Sheldon, R.; Shmalenko, A.; Smelansky, I.; Terraube, J.; et al. Persistent and novel threats to the biodiversity of Kazakhstan’s steppes and semi-deserts. Biodivers. Conserv. 2016, 25, 2521–2541. [Google Scholar] [CrossRef]
  3. Zhao, Y.; Peth, S.; Krümmelbein, J.; Horn, R.; Wang, Z.Y.; Steffens, M.; Hoffmann, C.; Peng, X.H. Spatial variability of soil properties affected by grazing intensity in Inner Mongolia grassland. Ecol. Model. 2007, 205, 241–254. [Google Scholar] [CrossRef]
  4. Davidson, E.A.; Janssens, I.A. Temperature sensitivity of soil carbon decomposition and feedbacks to climate change. Nature 2006, 440, 165–173. [Google Scholar] [CrossRef]
  5. Guo, H.B.; Quan, Q.; Niu, S.L.; Li, T.T.; He, Y.C.; Fu, Y.W.; Li, J.P.; Wang, J.S.; Zhang, R.Y.; Li, Z.L.; et al. Shifting biomass allocation and light limitation co-regulate the temporal stability of an alpine meadow under eutrophication. Sci. Total Environ. 2023, 860, 160411. [Google Scholar] [CrossRef] [PubMed]
  6. Kang, S.; Ma, W.J.; Li, F.Y.; Zhang, Q.; Niu, J.M.; Ding, Y.; Han, F.; Sun, X.L. Functional Redundancy Instead of Species Redundancy Determines Community Stability in a Typical Steppe of Inner Mongolia. PLoS ONE 2015, 10, e0145605. [Google Scholar] [CrossRef]
  7. Magurran, A.E.; Deacon, A.E.; Moyes, F.; Shimadzu, H.; Dornelas, M.; Phillip, D.A.T.; Ramnarine, I.W. Divergent biodiversity change within ecosystems. Proc. Natl. Acad. Sci. USA 2018, 115, 1843–1847. [Google Scholar] [CrossRef]
  8. Qiao, X.T.; Geng, Y.; Zhang, C.Y.; Han, Z.X.; Zhang, Z.H.; Zhao, X.H.; Gadow, K. Spatial asynchrony matters more than alpha stability in stabilizing ecosystem productivity in a large temperate forest region. Glob. Ecol. Biogeogr. 2022, 31, 1133–1146. [Google Scholar] [CrossRef]
  9. Shi, Y.; Wang, Y.; Ma, Y.; Ma, W.; Liang, C.; Flynn, D.F.B.; Schmid, B.; Fang, J.; He, J.S. Field-based observations of regional-scale, temporal variation in net primary production in Tibetan alpine grasslands. Biogeosciences 2014, 11, 2003–2016. [Google Scholar] [CrossRef]
  10. Li, Y.; Dong, S.K.; Gao, Q.Z.; Zhang, Y.; Liu, S.L.; Ganjurjav, H.; Hu, G.Z.; Wang, X.X.; Yan, Y.L.; Wu, H.B.; et al. Rotational grazing promotes grassland aboveground plant biomass and its temporal stability under changing weather conditions on the Qinghai-Tibetan plateau. Land Degrad. Dev. 2020, 31, 2662–2671. [Google Scholar] [CrossRef]
  11. Huang, S.L.; Fu, G. Impacts of Climate Change and Human Activities on Plant Species a-Diversity across the Tibetan Grasslands. Remote Sens. 2023, 15, 2947. [Google Scholar] [CrossRef]
  12. Zhang, G.Y.; Fu, G. Changes in soil organic carbon, total nitrogen and total phosphorus in 2000-2020 and their driving mechanisms in Tibetan alpine grasslands. Glob. Planet. Chang. 2024, 239, 104484. [Google Scholar] [CrossRef]
  13. Li, M.; Zhang, X.Z.; Niu, B.; He, Y.T.; Wang, X.T.; Wu, J.S. Changes in plant species richness distribution in Tibetan alpine grasslands under different precipitation scenarios. Glob. Ecol. Conserv. 2020, 21, e00848. [Google Scholar] [CrossRef]
  14. Campana, S.; Tognetti, P.M.; Alberti, J.; Graff, P.; Molina, C.D.; Silvoso, M.C.; Yahdjian, L. The spatiotemporal stability of plant diversity is disconnected from biomass stability in response to human activities in a South American temperate grassland. Sci. Total Environ. 2024, 955, 177031. [Google Scholar] [CrossRef] [PubMed]
  15. Sandoval-Calderon, A.P.; Meijer, M.J.J.; Wang, S.P.; van Kuijk, M.; Verweij, P.; Hautier, Y. Andean grassland stability across spatial scales increases with camelid grazing intensity despite biotic homogenization. J. Ecol. 2025, 113, 931–942. [Google Scholar] [CrossRef]
  16. Lama, G.; Villarroel, M. Behavioural biology of South American domestic camelids: An overview from a welfare perspective. Small Rumin. Res. 2023, 220, 106918. [Google Scholar] [CrossRef]
  17. Liu, F.; Liu, F.; Zhou, Q.; Chen, Q.; Wang, S.; Guo, R.; Ma, W. Ecological risk and regional differentiation in the Qinghai-Tibet Plateau. J. Nat. Resour. 2021, 36, 3232–3246. [Google Scholar] [CrossRef]
  18. Zhu, Q.A.; Chen, H.; Peng, C.H.; Liu, J.X.; Piao, S.L.; He, J.S.; Wang, S.P.; Zhao, X.Q.; Zhang, J.; Fang, X.Q.; et al. An early warning signal for grassland degradation on the Qinghai-Tibetan Plateau. Nat. Commun. 2023, 14, 6406. [Google Scholar] [CrossRef]
  19. Zhang, W.J.; Xue, X.; Peng, F.; You, Q.G.; Hao, A.H. Meta-analysis of the effects of grassland degradation on plant and soil properties in the alpine meadows of the Qinghai-Tibetan Plateau. Glob. Ecol. Conserv. 2019, 20, e00774. [Google Scholar] [CrossRef]
  20. Duan, X.Y.; Chen, Y.; Wang, L.Q.; Zheng, G.D.; Liang, T. The impact of land use and land cover changes on the landscape pattern and ecosystem service value in Sanjiangyuan region of the Qinghai-Tibet Plateau. J. Environ. Manag. 2023, 325, 116539. [Google Scholar] [CrossRef]
  21. Ran, Q.W.; Hao, Y.B.; Xia, A.Q.; Liu, W.J.; Hu, R.H.; Cui, X.Y.; Xue, K.; Song, X.N.; Xu, C.; Ding, B.Y.; et al. Quantitative Assessment of the Impact of Physical and Anthropogenic Factors on Vegetation Spatial-Temporal Variation in Northern Tibet. Remote Sens. 2019, 11, 1183. [Google Scholar] [CrossRef]
  22. Ganjurjav, H.; Gornish, E.S.; Hu, G.Z.; Wan, Y.F.; Li, Y.; Danjiu, L.B.; Gao, Q.Z. Temperature leads to annual changes of plant community composition in alpine grasslands on the Qinghai-Tibetan Plateau. Environ. Monit. Assess. 2018, 190, 585. [Google Scholar] [CrossRef] [PubMed]
  23. Li, C.X.; Wulf, H.; Schmid, B.; He, J.S.; Schaepman, M.E. Estimating Plant Traits of Alpine Grasslands on the Qinghai-Tibetan Plateau Using Remote Sensing. IEEE J. Sel. Top. Appl. Earth Obs. Remote Sens. 2018, 11, 2263–2275. [Google Scholar] [CrossRef]
  24. Xu, H.J.; Wang, X.P.; Zhang, X.X. Alpine grasslands response to climatic factors and anthropogenic activities on the Tibetan Plateau from 2000 to 2012. Ecol. Eng. 2016, 92, 251–259. [Google Scholar] [CrossRef]
  25. Zhang, H.; Zhu, W.; Shi, P.; Zhao, C.; Liu, R.; Tang, H.; Wang, J.a.; He, B. The differences of vegetation characteristics and environmental conditions among main vegetation types on the Qinghai-Tibet Plateau. Acta Ecol. Sin. 2024, 44, 2955–2970. [Google Scholar]
  26. Duan, H.; Xue, X.; Wang, T.; Kang, W.; Liao, J.; Liu, S. Spatial and Temporal Differences in Alpine Meadow, Alpine Steppe and All Vegetation of the Qinghai-Tibetan Plateau and Their Responses to Climate Change. Remote Sens. 2021, 13, 669. [Google Scholar] [CrossRef]
  27. Yan, Y.J.; Ma, F.F.; Wang, J.S.; Zhang, R.Y.; Peng, J.L.; Liao, J.Q.; Zhou, Q.P.; Niu, S.L. Warming stabilizes alpine ecosystem facing extreme rainfall events by changing plant species composition. J. Ecol. 2023, 111, 2064–2076. [Google Scholar] [CrossRef]
  28. Ma, Z.Y.; Liu, H.Y.; Mi, Z.R.; Zhang, Z.H.; Wang, Y.H.; Xu, W.; Jiang, L.; He, J.S. Climate warming reduces the temporal stability of plant community biomass production. Nat. Commun. 2017, 8, 15378. [Google Scholar] [CrossRef]
  29. Zhang, J.; Fang, S.B.; Liu, H.H. Estimation of alpine grassland above-ground biomass and its response to climate on the Qinghai-Tibet Plateau during 2001 to 2019. Glob. Ecol. Conserv. 2022, 35, e02065. [Google Scholar] [CrossRef]
  30. Yuan, Z.R.; Liang, Y.L.; Zhao, H.; Wei, D.; Wang, X.D. Trade-offs and synergies between ecosystem services on the Tibetan Plateau. Ecol. Indic. 2024, 158, 111384. [Google Scholar] [CrossRef]
  31. Wang, C.Y.; Wang, J.B.; Zhang, F.W.; Yang, Y.S.; Luo, F.L.; Li, Y.N.; Li, J.X. Stability response of alpine meadow communities to temperature and precipitation changes on the Northern Tibetan Plateau. Ecol. Evol. 2022, 12, e8592. [Google Scholar] [CrossRef] [PubMed]
  32. Han, Y.; Wu, Y.T.; Cui, J.H.; Li, H.Y.; Li, H.; Zhang, J.H.; Miao, B.L.; Wang, L.X.; Li, Z.Y.; Liang, C.Z. Temporal Stability of Grazed Grassland Ecosystems Alters Response to Climate Variability, While Resistance Stability Remains Unchanged. Agronomy 2023, 13, 2030. [Google Scholar] [CrossRef]
  33. Li, L.; Huang, C.; Zhang, Y.; Liu, L.; Wang, Z.; Zhang, H.; Ding, M.; Zhang, H. Mapping the multi-temporal grazing intensity on the Qinghai-Tibet Plateau using geographically weighted random forest. Sci. Geogr. Sin. 2023, 43, 398–410. [Google Scholar]
  34. Qiu, J. The third pole. Nature 2008, 454, 393–396. [Google Scholar] [CrossRef]
  35. Liu, J.S.; Wang, S.Y.; Yu, S.M.; Yang, D.Q.; Zhang, L. Climate warming and growth of high-elevation inland lakes on the Tibetan Plateau. Glob. Planet. Chang. 2009, 67, 209–217. [Google Scholar] [CrossRef]
  36. Yang, K.; Wu, H.; Qin, J.; Lin, C.G.; Tang, W.J.; Chen, Y.Y. Recent climate changes over the Tibetan Plateau and their impacts on energy and water cycle: A review. Glob. Planet. Chang. 2014, 112, 79–91. [Google Scholar] [CrossRef]
  37. Gong, X.W.; Wang, X.Y.; Li, Y.Q.; Ma, L.; Li, M.Y.; Si, H.T. Observed Changes in Extreme Temperature and Precipitation Indices on the Qinghai-Tibet Plateau, 1960–2016. Front. Environ. Sci. 2022, 10, 888937. [Google Scholar] [CrossRef]
  38. Tang, L.; Dong, S.K.; Sherman, R.; Liu, S.L.; Liu, Q.R.; Wang, X.X.; Su, X.K.; Zhang, Y.; Li, Y.Y.; Wu, Y.; et al. Changes in vegetation composition and plant diversity with rangeland degradation in the alpine region of Qinghai-Tibet Plateau. Rangel. J. 2015, 37, 107–115. [Google Scholar] [CrossRef]
  39. Solow, A.R.; Polasky, S. Measuring biological diversity. Environ. Ecol. Stat. 1994, 1, 95–103. [Google Scholar] [CrossRef]
  40. Lozupone, C.A.; Knight, R. Species divergence and the measurement of microbial diversity. Fems Microbiol. Rev. 2008, 32, 557–578. [Google Scholar] [CrossRef]
  41. Gorelick, R. Combining richness and abundance into a single diversity index using matrix analogues of Shannon’s and Simpson’s indices. Ecography 2006, 29, 525–530. [Google Scholar] [CrossRef]
  42. Pielou, E.C. The measurement of diversity in different types of biological collections. J. Theor. Biol. 1966, 13, 131–144. [Google Scholar] [CrossRef]
  43. Wilsey, B.J.; Potvin, C. Biodiversity and ecosystem functioning: Importance of species evenness in an old field. Ecology 2000, 81, 887–892. [Google Scholar] [CrossRef]
  44. Isbell, F.; Craven, D.; Connolly, J.; Loreau, M.; Schmid, B.; Beierkuhnlein, C.; Bezemer, T.M.; Bonin, C.; Bruelheide, H.; de Luca, E.; et al. Biodiversity increases the resistance of ecosystem productivity to climate extremes. Nature 2015, 526, 574–577. [Google Scholar] [CrossRef]
  45. Gu, Y.T.; Meng, L.; Wang, Y.T.; Wu, Z.R.; Pan, Y.H.; Zhao, Y.Y.; Detto, M.; Wu, J. Uncovering the role of solar radiation and water stress factors in constraining decadal intra-site spring phenology variability in diverse ecosystems across the Northern Hemisphere. New Phytol. 2025, 246, 1986–2003. [Google Scholar] [CrossRef]
  46. van der Putten, W.H.; Bardgett, R.D.; Bever, J.D.; Bezemer, T.M.; Casper, B.B.; Fukami, T.; Kardol, P.; Klironomos, J.N.; Kulmatiski, A.; Schweitzer, J.A.; et al. Plant-soil feedbacks: The past, the present and future challenges. J. Ecol. 2013, 101, 265–276. [Google Scholar] [CrossRef]
  47. Fu, Z.; Xiao, Y.; Xu, H.; Shi, X.; Luo, H.; Ben, C.; Yang, Z.; Li, M. Interannual dynamics and homeostasis of soil carbon, nitrogen, and phosphorus stoichiometry in a subtropical evergreen broad-leaved forest: Based on ten years observation. Chin. J. Ecol. 2025, 44, 1–10. [Google Scholar]
  48. Liu, K.; Liu, Z.C.; Zhou, N.; Shi, X.R.; Lock, T.R.; Kallenbach, R.L.; Yuan, Z.Y. Diversity-stability relationships in temperate grasslands as a function of soil pH. Land Degrad. Dev. 2022, 33, 1704–1717. [Google Scholar] [CrossRef]
  49. Zhang, H.; Jiang, N.; Zhang, S.Y.; Zhu, X.Y.; Wang, H.; Xiu, W.M.; Zhao, J.N.; Liu, H.M.; Zhang, H.F.; Yang, D.L. Soil bacterial community composition is altered more by soil nutrient availability than pH following long-term nutrient addition in a temperate steppe. Front. Microbiol. 2024, 15, 1455891. [Google Scholar] [CrossRef]
  50. Dai, E.R.; Zhang, G.Y.; Fu, G.; Zha, X.J. Can meteorological data and normalized difference vegetation index be used to quantify soil pH in grasslands? Front. Ecol. Evol. 2023, 11, 1206581. [Google Scholar] [CrossRef]
  51. Wang, S.H.; Qi, H.X.; Li, T.Y.; Qin, Y.; Fu, G.; Pan, X.; Zha, X.J. Can normalized difference vegetation index and climate data be used to estimate soil carbon, nitrogen, and phosphorus and their ratios in the Xizang grasslands? Front. Earth Sci. 2024, 11, 1340020. [Google Scholar] [CrossRef]
  52. Sun, W.; Qi, H.X.; Li, T.Y.; Qin, Y.; Fu, G.; Han, F.S.; Wang, S.H.; Pan, X. Modelling Soil Ammonium Nitrogen, Nitrate Nitrogen and Available Phosphorus Using Normalized Difference Vegetation Index and Climate Data in Xizang’s Grasslands. Sustainability 2024, 16, 4695. [Google Scholar] [CrossRef]
  53. Tian, Y.; Fu, G. Quantifying Plant Species α-Diversity Using Normalized Difference Vegetation Index and Climate Data in Alpine Grasslands. Remote Sens. 2022, 14, 5007. [Google Scholar] [CrossRef]
  54. Tilman, D. The ecological consequences of changes in biodiversity: A search for general principles. Ecology 1999, 80, 1455–1474. [Google Scholar] [CrossRef]
  55. Sandoval-Calderon, A.P.; Soons, M.B.; van Kuijk, M.; Verweij, P.A.; Barry, K.E.; Hautier, Y. Camelid herding may homogenize Andean grassland plant communities. Ecol. Indic. 2024, 167, 112590. [Google Scholar] [CrossRef]
  56. Song, X.X.; Wang, L.; Zhao, X.; Liu, C.; Chang, Q.; Wang, Y.; Xu, T.T.; Wang, D.L. Sheep grazing and local community diversity interact to control litter decomposition of dominant species in grassland ecosystem. Soil Biol. Biochem. 2017, 115, 364–370. [Google Scholar] [CrossRef]
  57. Xian, Y.Y.; Wang, T.X.; Leng, W.C.; Letu, H.; Shi, J.C.; Wang, G.F.; Yan, X.W.; Yuan, H.Y. Can Topographic Effects on Solar Radiation Be Ignored: Evidence From the Tibetan Plateau. Geophys. Res. Lett. 2024, 51, e2024GL108653. [Google Scholar] [CrossRef]
  58. Jia, A.L.; Liang, S.L.; Wang, D.D.; Jiang, B.; Zhang, X.T. Air pollution slows down surface warming over the Tibetan Plateau. Atmos. Chem. Phys. 2020, 20, 881–899. [Google Scholar] [CrossRef]
  59. Buzhdygan, O.Y.; Tietjen, B.; Rudenko, S.S.; Nikorych, V.A.; Petermann, J.S. Direct and indirect effects of land-use intensity on plant communities across elevation in semi-natural grasslands. PLoS ONE 2020, 15, e0231122. [Google Scholar] [CrossRef]
  60. Ding, R.; Qin, Y.; Li, T.Y.; Fu, G. Exploring spatiotemporal dynamics in temporal stability of soil carbon, nitrogen, phosphorus, and pH in Tibetan grasslands. Geoderma 2024, 451, 117062. [Google Scholar] [CrossRef]
  61. Zhan, T.Y.; Zhang, S.R.; Zhao, W.W. Adaptive management for alpine grassland of the Tibetan Plateau based on a multi-criteria assessment. Front. Plant Sci. 2025, 16, 1518721. [Google Scholar] [CrossRef] [PubMed]
  62. Liu, Y.G.; Zhang, X.K.; Du, X.D.; Du, Z.Y.; Sun, M.Z. Alpine grassland greening on the Northern Tibetan Plateau driven by climate change and human activities considering extreme temperature and soil moisture. Sci. Total Environ. 2024, 916, 169995. [Google Scholar] [CrossRef] [PubMed]
  63. Li, C.X.; de Jong, R.; Schmid, B.; Wulf, H.; Schaepman, M.E. Changes in grassland cover and in its spatial heterogeneity indicate degradation on the Qinghai-Tibetan Plateau. Ecol. Indic. 2020, 119, 106641. [Google Scholar] [CrossRef]
  64. Wang, S.S.; Jia, L.Z.; Cai, L.P.; Wang, Y.J.; Zhan, T.Y.; Huang, A.Q.; Fan, D.L. Assessment of Grassland Degradation on the Tibetan Plateau Based on Multi-Source Data. Remote Sens. 2022, 14, 6011. [Google Scholar] [CrossRef]
  65. Pauli, H.; Gottfried, M.; Reiter, K.; Klettner, C.; Grabherr, G. Signals of range expansions and contractions of vascular plants in the high Alps: Observations (1994-2004) at the GLORIA*master site Schrankogel, Tyrol, Austria. Glob. Change Biol. 2007, 13, 147–156. [Google Scholar] [CrossRef]
  66. Gottfried, M.; Pauli, H.; Futschik, A.; Akhalkatsi, M.; Barancok, P.; Alonso, J.L.B.; Coldea, G.; Dick, J.; Erschbamer, B.; Calzado, M.R.F.; et al. Continent-wide response of mountain vegetation to climate change. Nat. Clim. Chang. 2012, 2, 111–115. [Google Scholar] [CrossRef]
  67. Pauli, H.; Gottfried, M.; Dullinger, S.; Abdaladze, O.; Akhalkatsi, M.; Alonso, J.L.B.; Coldea, G.; Dick, J.; Erschbamer, B.; Calzado, R.F.; et al. Recent Plant Diversity Changes on Europe’s Mountain Summits. Science 2012, 336, 353–355. [Google Scholar] [CrossRef]
  68. Yan, Y.; Lu, X.Y. Is grazing exclusion effective in restoring vegetation in degraded alpine grasslands in Tibet, China? PeerJ 2015, 3, e1020. [Google Scholar] [CrossRef]
  69. Wang, Z.; Li, J.; Guo, Y.; Liang, L. Ecological protection and restoration model of multi-ecological elements in Qinghai-Tibet Plateau: A case study of Lhasa River Basin. Acta Ecol. Sin. 2019, 39, 8966–8974. [Google Scholar]
  70. Wang, L.M.; Han, S.J.; Tian, F.Q.; Li, K.B.; Li, Y.K.; Tudaji, M.; Cao, X.J.; Nan, Y.; Cui, T.; Zheng, X.Y.; et al. The Evaporation on the Tibetan Plateau Stops Increasing in the Recent Two Decades. J. Geophys. Res.-Atmos. 2022, 127, e2022JD037377. [Google Scholar] [CrossRef]
  71. Sun, J.; Yang, K.; Yu, Y.; Lu, H.; Lin, Y.L. Land-Atmosphere Interactions Partially Offset the Accelerated Tibetan Plateau Water Cycle through Dynamical Processes. J. Clim. 2023, 36, 3867–3880. [Google Scholar] [CrossRef]
  72. Zarzycki, J.; Kopec, M. Effect of Habitat and Historical Factors on the Distribution of Meadow Plant Species in the Radziejowa Range (Beskid Sadecki Mountains). Pol. J. Environ. Stud. 2009, 18, 949–955. [Google Scholar]
  73. Khamidov, M.; Ishchanov, J.; Hamidov, A.; Shermatov, E.; Gafurov, Z. Impact of Soil Surface Temperature on Changes in the Groundwater Level. Water 2023, 15, 3865. [Google Scholar] [CrossRef]
  74. Luo, H.; Quaas, J.; Han, Y. Diurnally asymmetric cloud cover trends amplify greenhouse warming. Sci. Adv. 2024, 10, eado5179. [Google Scholar] [CrossRef]
  75. Kejna, M.; Uscka-Kowalkowska, J.; Kejna, P. The influence of cloudiness and atmospheric circulation on radiation balance and its components. Theor. Appl. Climatol. 2021, 144, 823–838. [Google Scholar] [CrossRef]
  76. Liu, J.; Zhang, W.; Wu, L.; Wang, B.; Xu, M. Response of organic carbon mineralization to temperature changing pattern under long-term fertilization in red soil. Soil Fertil. Sci. China 2020, 10–16. [Google Scholar]
  77. Chen, Q.; Tao, B.; Shang, Y.; Zhan, M.; Li, H.; Li, G.; Li, Y. Combined effects of nitrogen forms and temperature on soil organic carbon mineralization of forest in the sandy area of western Shandong Province, China. J. Agro-Environ. Sci. 2023, 42, 414–423. [Google Scholar]
  78. Bardgett, R.D.; van der Putten, W.H. Belowground biodiversity and ecosystem functioning. Nature 2014, 515, 505–511. [Google Scholar] [CrossRef] [PubMed]
  79. Robinson, D.; Griffiths, B.; Ritz, K.; Wheatley, R. Root-induced nitrogen mineralisation: A theoretical analysis. Plant Soil 1989, 117, 185–193. [Google Scholar] [CrossRef]
  80. Connell, J.H.; Slatyer, R.O. Mechanisms of succession in natural communities and their role in community stability and organization. Am. Nat. 1977, 111, 1119–1144. [Google Scholar] [CrossRef]
  81. Xiang, X.M.; De, K.J.; Lin, W.S.; Feng, T.X.; Li, F.; Wei, X.J. Effects of warming and nitrogen deposition on species and functional diversity of plant communities in the alpine meadow of Qinghai-Tibet Plateau. PLoS ONE 2025, 20, e0319581. [Google Scholar] [CrossRef] [PubMed]
  82. Spohn, M.; Bagchi, S.; Bakker, J.D.; Borer, E.T.; Carbutt, C.; Catford, J.A.; Dickman, C.R.; Eisenhauer, N.; Eskelinen, A.; Hagenah, N.; et al. Interactive and unimodal relationships between plant biomass, abiotic factors, and plant diversity in global grasslands. Commun. Biol. 2025, 8, 97. [Google Scholar] [CrossRef]
  83. Wu, X.; Gong, K.; Jin, G.; Ma, J.; Yomaerjiang, I.; Abdukutus, K. Effects of Different Animals on Seed Dispersal Characteristics of Achnatherum inebrians. Acta Agrestia Sin. 2021, 29, 2240–2246. [Google Scholar]
  84. Qin, X.P.; Liang, W.; Liu, Z.M.; Liu, M.H.; Baskin, C.C.; Baskin, J.M.; Xin, Z.M.; Wang, Z.G.; Zhou, Q.L. Plant canopy may promote seed dispersal by wind. Sci. Rep. 2022, 12, 63. [Google Scholar] [CrossRef] [PubMed]
  85. Beck, J.J.; Hernández, D.L.; Pasari, J.R.; Zavaleta, E.S. Grazing maintains native plant diversity and promotes community stability in an annual grassland. Ecol. Appl. 2015, 25, 1259–1270. [Google Scholar] [CrossRef] [PubMed]
  86. Steidl, R.J.; Litt, A.R.; Matter, W.J. Effects of Plant Invasions on Wildlife in Desert Grasslands. Wildl. Soc. Bull. 2013, 37, 527–536. [Google Scholar] [CrossRef]
  87. Liang, M.W.; Cappelli, S.L.; Borer, E.T.; Tilman, D.; Seabloom, E.W. Consumers Modulate Effects of Plant Diversity on Community Stability. Ecol. Lett. 2025, 28, e70103. [Google Scholar] [CrossRef]
  88. Wang, Y.H.; Wang, S.P.; Zhao, L.Q.; Liang, C.Z.; Miao, B.L.; Zhang, Q.; Niu, X.X.; Ma, W.H.; Schmid, B. Stability and asynchrony of local communities but less so diversity increase regional stability of Inner Mongolian grassland. Elife 2022, 11, e74881. [Google Scholar] [CrossRef]
Figure 1. Spatial distribution of temporal stability of plant species α-diversity under three scenarios. Plant species α-diversity included species richness (SR: (ac)), Shannon (df), Simpson (gi), and Pielou (jl). Three scenarios included those driven by the combined effects of both climate change and human activities (C+H: (a,d,g,j)), solely driven by climate change (C: (b,e,h,k)), and solely driven by human activities (H: (c,f,i,l)).
Agronomy 15 01502 g001
Figure 2. Relationships between the temporal stability of plant species α-diversity and their change rate (Δstability) under three scenarios. Plant species α-diversity included species richness (SR: (a,e,i)), Shannon: (b,f,j), Simpson: (c,g,k), and Pielou: (d,h,l). Three scenarios included those driven by the combined effects of both climate change and human activities (C+H: (ad)), solely driven by climate change (C: (eh)), and solely driven by human activities (H: (il)).
Agronomy 15 01502 g002
Figure 3. Relative contributions of geographic position, climate stability, and soil stability to the temporal stability of plant species α-diversity under three scenarios. Geographic position included longitude, latitude, and elevation. Climate stability included temporal stability of annual temperature, precipitation, and radiation. Soil stability included temporal stability of soil organic carbon (SOC), total nitrogen (TN), total phosphorus (TP), ratio of SOC to TN, ratio of SOC to TP, ratio of TN to TP, ammonium nitrogen, nitrate nitrogen, available phosphorus, and soil pH. Plant species α-diversity included species richness (ac), Shannon (df), Simpson (gi), and Pielou (jl). The three scenarios included those driven by combined effects of both climate change and human activities, (C+H: (a,d,g,j)), solely driven by climate change (C: (b,e,h,k)), and solely driven by human activities (H: (c,f,i,l)).
Agronomy 15 01502 g003
Figure 4. Spatial distribution of the relative change of temporal stability (RC_stability) of plant species α-diversity under three scenarios. Plant species α-diversity included species richness (SR: (ac)), Shannon (df), Simpson (gi), and Pielou (jl). Three scenarios included those driven by the combined effects of both climate change and human activities (C+H: (a,d,g,j)), solely driven by climate change (C: (b,e,h,k)), and solely driven by human activities (H: (c,f,i,l)).
Agronomy 15 01502 g004
Figure 5. Drivers of temporal variability—the relative contributions of climate change and human activity to the temporal stability of four variables of actual species alpha diversity ((a) SR, (b) Shannon, (c) Simpson, (d) Pielou). ICC: increase caused by climate change; IHA: increase caused by human activities; ICCHA: increase caused simultaneously; DCC: decrease primarily caused by climate change; DHA: decrease primarily caused by human activities; DCCHA: decrease simultaneously caused by climate change and human activities. NCC: none caused by climate change; NHA: none caused by human activities; NCCHA: none caused simultaneously.
Agronomy 15 01502 g005
Figure 6. Relative contributions of geographic position, climate RC_stability, and soil RC_stability to the relative change of temporal stability of plant species α-diversity under three scenarios. Geographic position included longitude, latitude, and elevation. Climate RC_stability included relative change of temporal stability of annual temperature, precipitation, and radiation. Soil RC_stability included relative change of temporal stability of soil organic carbon (SOC), total nitrogen (TN), total phosphorus (TP), ratio of SOC to TN, ratio of SOC to TP, ratio of TN to TP, ammonium nitrogen, nitrate nitrogen, available phosphorus, and soil pH. Plant species α-diversity included species richness (ac), Shannon (df), Simpson (gi), and Pielou (jl). Three scenarios included those driven by the combined effects of both climate change and human activities (C+H: (a,d,g,j)), solely driven by climate change (C: (b,e,h,k)), and solely driven by human activities (H: (c,f,i,l)).
Agronomy 15 01502 g006
Figure 7. Relationships between the relative change of temporal stability of plant species α-diversity (RC_Stability) and the relative change of plant species α-diversity (RC) under three scenarios. Plant species α-diversity included species richness (SR: (a,e,i)), Shannon: (b,f,j), Simpson: (c,g,k), and Pielou: (d,h,l). Three scenarios included those driven by the combined effects of both climate change and human activities (C+H: (ad)), solely driven by climate change (C: (eh)), and solely driven by human activities (H: (il)).
Agronomy 15 01502 g007
Table 1. The area ratio of temporal stability of plant species α-diversity (SR, Shannon, Simpson, and Pielou) across six ranges (<2, 2–5, 5–10, 10–100, 100–1000, and >1000) and their spatial minimum (Min), maximum (Max), and mean values under the three scenarios: combined effects of climate change and human activities (C+H), sole climate change (C), and sole human activities (H).
<22–55–1010–100100–1000>1000MinMaxMean
StabilitySR_C+H0.0041.0241.4916.211.100.182.187822.0023.55
StabilityShannon_C+H0.000.0018.6180.770.440.174.3039,138.9875.47
StabilitySimpson_C+H0.000.0424.3573.691.740.184.2454,677.60103.48
StabilityPielou_C+H0.000.006.3791.761.510.362.9628,863.6493.17
StabilitySR_C0.0023.0538.6437.460.550.301.9418,588.0863.79
StabilityShannon_C0.0025.3938.7534.970.680.212.009995.6531.06
StabilitySimpson_C0.000.3128.5770.200.730.203.2629,259.6674.37
StabilityPielou_C0.000.0213.8384.151.770.234.1336,580.2792.42
StabilitySR_H0.1027.4555.0217.150.130.151.3918,582.6635.77
StabilityShannon_H0.0021.4639.8538.240.300.152.032993.5415.74
StabilitySimpson_H0.001.9939.5558.080.250.142.38143,375.86204.73
StabilityPielou_H0.000.3921.2977.240.920.162.87190,054.64278.30
Table 2. The area ratio of relative change of temporal stability of plant species α-diversity (SR, Shannon, Simpson, and Pielou) across six ranges (<−100, −100 to−50, −50 to 0, 0–50, 50–100, and >100) and their spatial minimum (Min), maximum (Max), and mean values under the three scenarios: combined effects of climate change and human activities (C+H), sole climate change (C), and sole human activities (H).
<−100−100 to −50−50 to 00–5050–100>100MinMaxMean
RC_StabilitySR_C+H5.919.4642.8135.424.591.81−335.44312.21−11.75
RC_StabilityShannon_C+H4.4213.3138.533.728.211.84−309.89304.89−8.83
RC_StabilitySimpson_C+H7.3514.2839.0131.56.041.8−336.88313.16−16.40
RC_StabilityPielou_C+H4.7711.4542.5333.356.31.61−328.54310.01−10.69
RC_StabilitySR_C5.271436.9334.387.182.24−319.37327.21−9.99
RC_StabilityShannon_C6.5812.437.7733.796.622.83−337.92301.02−10.87
RC_StabilitySimpson_C5.7614.3536.6732.858.312.06−319.43295.41−11.14
RC_StabilityPielou_C6.1815.0236.2631.938.212.4−335.04330.42−11.43
RC_StabilitySR_H5.3314.1738.3332.158.131.88−311.58333.04−10.69
RC_StabilityShannon_H6.9414.4934.9832.388.462.76−308.82288.22−11.22
RC_StabilitySimpson_H5.6515.3537.3629.929.062.67−310.06286.72−10.68
RC_StabilityPielou_H5.6914.9636.5930.789.122.85−303.74304.18−9.83
Table 3. The predominant factors of the relative change of temporal stability of plant α-diversity.
RC_StabilitySR_C+HRC_StabilityShannon_C+HRC_StabilitySimpson_C+HRC_StabilityPielou_C+H
ICC19.0019.2618.9919.41
IHA21.6024.0219.4020.72
ICCHA0.010.010.010.01
DCC28.2024.6928.9028.55
DHA29.9831.5231.7230.18
DCCHA0.010.010.040.00
NCC0.660.170.370.75
NHA0.530.300.550.34
NCCHA0.010.020.030.04
ICC: increase caused by climate change; IHA: increase caused by human activities; ICCHA: increase caused simultaneously; DCC: decrease primarily caused by climate change; DHA: decrease primarily caused by human activities; DCCHA: decrease simultaneously caused by climate change and human activities. NCC: none caused by climate change; NHA: none caused by human activities; NCCHA: none caused simultaneously.
Disclaimer/Publisher’s Note: The statements, opinions and data contained in all publications are solely those of the individual author(s) and contributor(s) and not of MDPI and/or the editor(s). MDPI and/or the editor(s) disclaim responsibility for any injury to people or property resulting from any ideas, methods, instructions or products referred to in the content.

