Article

Synergistic Effects of Drivers on Spatiotemporal Changes in Carbon and Water Use Efficiency in Irrigated Cropland Ecosystems

1
College of Tourism, Henan Normal University, Xinxiang 453007, China
2
College of Life Sciences, Henan Normal University, Xinxiang 453007, China
*
Authors to whom correspondence should be addressed.
Agronomy 2025, 15(7), 1500; https://doi.org/10.3390/agronomy15071500
Submission received: 13 May 2025 / Revised: 17 June 2025 / Accepted: 18 June 2025 / Published: 20 June 2025
(This article belongs to the Section Water Use and Irrigation)

Abstract

:
Understanding the spatiotemporal patterns of cropland carbon and carbon water use efficiency (CWUE) and its driving factors is essential for sustainable agricultural development. Based on a multi-source remote sensing dataset, this study applies a trend analysis (Sen + Mann–Kendall), a dual-type randomized extraction algorithm, and an optimized XGBoost model to examine the spatiotemporal variations in cropland CWUE, including the water use efficiency of net primary production (WUENPP), water use efficiency of gross primary production (WUEGPP), and carbon use efficiency (CUE) in Henan Province from 2001 to 2019. This study further quantifies the impact of irrigation on the cropland CWUE and explores the synergistic effects of its driving factors in irrigated areas. Results reveal significant regional differences in cropland CWUE across Henan Province. Higher multi-year average values of CUE and WUENPP were observed in the western region, while the WUEGPP was more prominent in the south-central region. Over 76% of cropland areas showed a general downward trend in three indicators, with significant interannual declines. Non-irrigated cropland exhibited higher CWUE values than irrigated ones. The average values over multiple years of the WUEGPP, WUENPP, and CUE of irrigated cropland were 2.51 g   C   m 2   mm 1 , 1.08 g   C   m 2   mm 1 , and 0.43, respectively. Sunlight was the dominant factor influencing the WUEGPP in irrigated areas, while precipitation primarily regulated the WUENPP and CUE. The influence of the gross domestic product (GDP) was found to be minimal. Notably, both the leaf area index (LAI) and precipitation exhibited a shift from a positive to negative influence on CUE once their values exceeded optimal thresholds, indicating that resource overabundance can lead to physiological limitations. This study offers valuable insights into how irrigated cropland responds to the combined effects of multiple environmental and socio-economic drivers.

1. Introduction

In the context of global climate change and increasing water scarcity [1], food security poses a major challenge worldwide. Water resources are widely recognized as a key factor for ensuring food security and the sustainable development of regional agricultural production [2,3]. The development of irrigated agriculture is essential to increase the regional food output and secure food supplies [4,5,6]. Climate change exacerbates water stress, inevitably impacting water availability for agriculture, particularly irrigated farming, thereby constraining and threatening food production [7,8].
As the world’s largest food producer and consumer, China depends heavily on the health of its agricultural ecosystems [9]. Henan Province, a major agricultural region with extensive arable land and a favorable climate, serves as a critical production base for China’s staple grains [10], making its cropland ecosystems vital to national food security [11]. Croplands play a dual role: they are essential for food production and act as climate regulators. Agricultural soils represent significant global carbon reservoirs, while cropland vegetation generates an “oasis effect” that moderates the surface temperature, humidity, and energy balance [12,13]. Conversely, agricultural activities are major sources of greenhouse gases, such as methane (CH4) and nitrous oxide (N2O) [14]. To sustain healthy agroecosystems that balance these functions amid climate change and unsustainable irrigation practices, robust metrics are required to quantify productivity and water use efficiency.
A core indicator, carbon water use efficiency (CWUE), describes the ability of terrestrial ecosystems to optimize carbon uptake and water use synergistically [15]. Essentially, it measures how efficiently an ecosystem uses water to capture and store carbon dioxide. CWUE primarily encompasses water use efficiency (WUE) and carbon use efficiency (CUE). WUE includes two key components: the WUEGPP and WUENPP [16,17]. The WUEGPP, defined as the gross primary productivity (GPP) divided by evapotranspiration (ET) [18], serves as a critical indicator for assessing carbon sequestration relative to water consumption in terrestrial ecosystems [19].The WUENPP, calculated as the net primary productivity (NPP) divided by ET, is a vital physiological indicator linking the carbon and water cycles and provides an important basis for evaluating ecosystem responses to climate change [20]. CUE measures the efficiency with which an ecosystem converts total captured carbon (GPP) into net carbon stored as biomass (NPP), after accounting for the carbon lost through plant respiration [21]. This ratio offers valuable insight into ecosystem carbon management, influencing both internal processes and the global carbon cycle [22,23,24].
Recent studies leveraging satellite remote sensing have significantly advanced the understanding of the spatiotemporal variability of ecosystem CWUE and its coupled processes [18,25,26]. The sensitivity of different CWUE indicators to environmental factors varies substantially across ecosystems. The global terrestrial vegetation CUE increased significantly from 2000 to 2018, although localized declines occurred in regions such as the Amazon and northeastern India [27]. The ecosystem WUEGPP exhibits a latitudinal gradient, increasing toward lower latitudes [28,29]. In natural and urban plantation forests, the GPP and CUE strongly respond to temperature and humidity [30], while changes in the WUENPP in North China’s mountain ecosystems are primarily driven by combined effects of the leaf area index (LAI), temperature, and precipitation [19,31].
Although these ecosystem-level studies offer fundamental insights into the spatiotemporal variability and its drivers, agricultural systems require specialized research frameworks owing to their unique carbon–water dynamics and intensive human impacts. Eddy covariance (EC) techniques have facilitated critical comparisons: Wang et al. [32] analyzed the long-term WUEGPP variability across soybean, maize, winter wheat, and rice systems; Shen et al. [33] conducted wheat–maize double-cropping analyses using data from Luancheng and Weishan stations; and Wang et al. [34] characterized WUEGPP trends at the Jinzhou agroecosystem field experiment station in Shenyang City. Regional remote sensing analyses address spatial limitations of station observations by providing large-scale coverage and continuous spatiotemporal data, enabling multi-source data fusion and model validation. Examples include Elfarkh et al. [35], who mapped the WUEGPP in Saudi Arabian olive plantations; Li et al. [36], who documented rising WUEGPP trends in China’s croplands; and Zhao et al. [37], who revealed ecosystem-specific WUEGPP gradients in southwestern China from 2000 to 2017, following the order of forestland > scrub > cropland > grassland.
Drawing on findings from CWUE research in agroecosystems, optimization irrigation strategies have emerged as a key means to balance water conservation and enhance agricultural productivity. Crop water consumption is quantified by the cumulative ET during the growing season. For instance, research by Fang et al. [38] demonstrated that optimizing irrigation scheduling improved WUE by 10–25% in wheat–maize rotation systems in the North China Plain. Field evidence suggests that controlled deficit irrigation strategies can maximize WUE through medium water stress [39]. Conversely, over-irrigation has been shown to decrease both the yield and WUE [40]. The accurate quantification of ET fluxes and biomass accumulation patterns remains the basis for reliable WUE assessments, as emphasized by multi-method validation studies [40,41].
While previous studies have advanced our understanding of the spatiotemporal variability in cropland ecosystems, limited research has focused on the impacts of irrigation on cropland CWUE and the synergistic effects of drivers on CWUE in irrigated cropland. Irrigation plays a critical role in sustainable agriculture [42], as it significantly alters the soil moisture distribution and modifies the wetting patterns in the crop root zone. These changes directly influence the root water and nutrient uptake [43], hereby affecting cropland CWUE. Consequently, effective irrigation water management is essential for optimizing the crop system performance [44]. As a major grain-producing region in China, Henan Province is of strategic importance to national food security [45], highlighting the need for an in-depth investigation into the spatiotemporal dynamics of its cropland CWUE and the underlying driving mechanisms. Therefore, this study aims to (1) analyze the spatiotemporal changes in cropland CWUE across Henan Province during 2001–2019; (2) quantitatively evaluate the impact of irrigation on CWUE; and (3) systematically examine the synergistic effects of driving factors on the CWUE in the region. The structure of this study is organized as follows: Section 3.1 analyzes the spatiotemporal changes in the cropland CWUE, GPP, NPP, and ET, Section 3.2 presents a quantitative evaluation of the impact of irrigation on CWUE in cropland, and Section 3.3 explores the synergistic effects of multiple driving factors on CWUE in irrigated cropland.

2. Materials and Methods
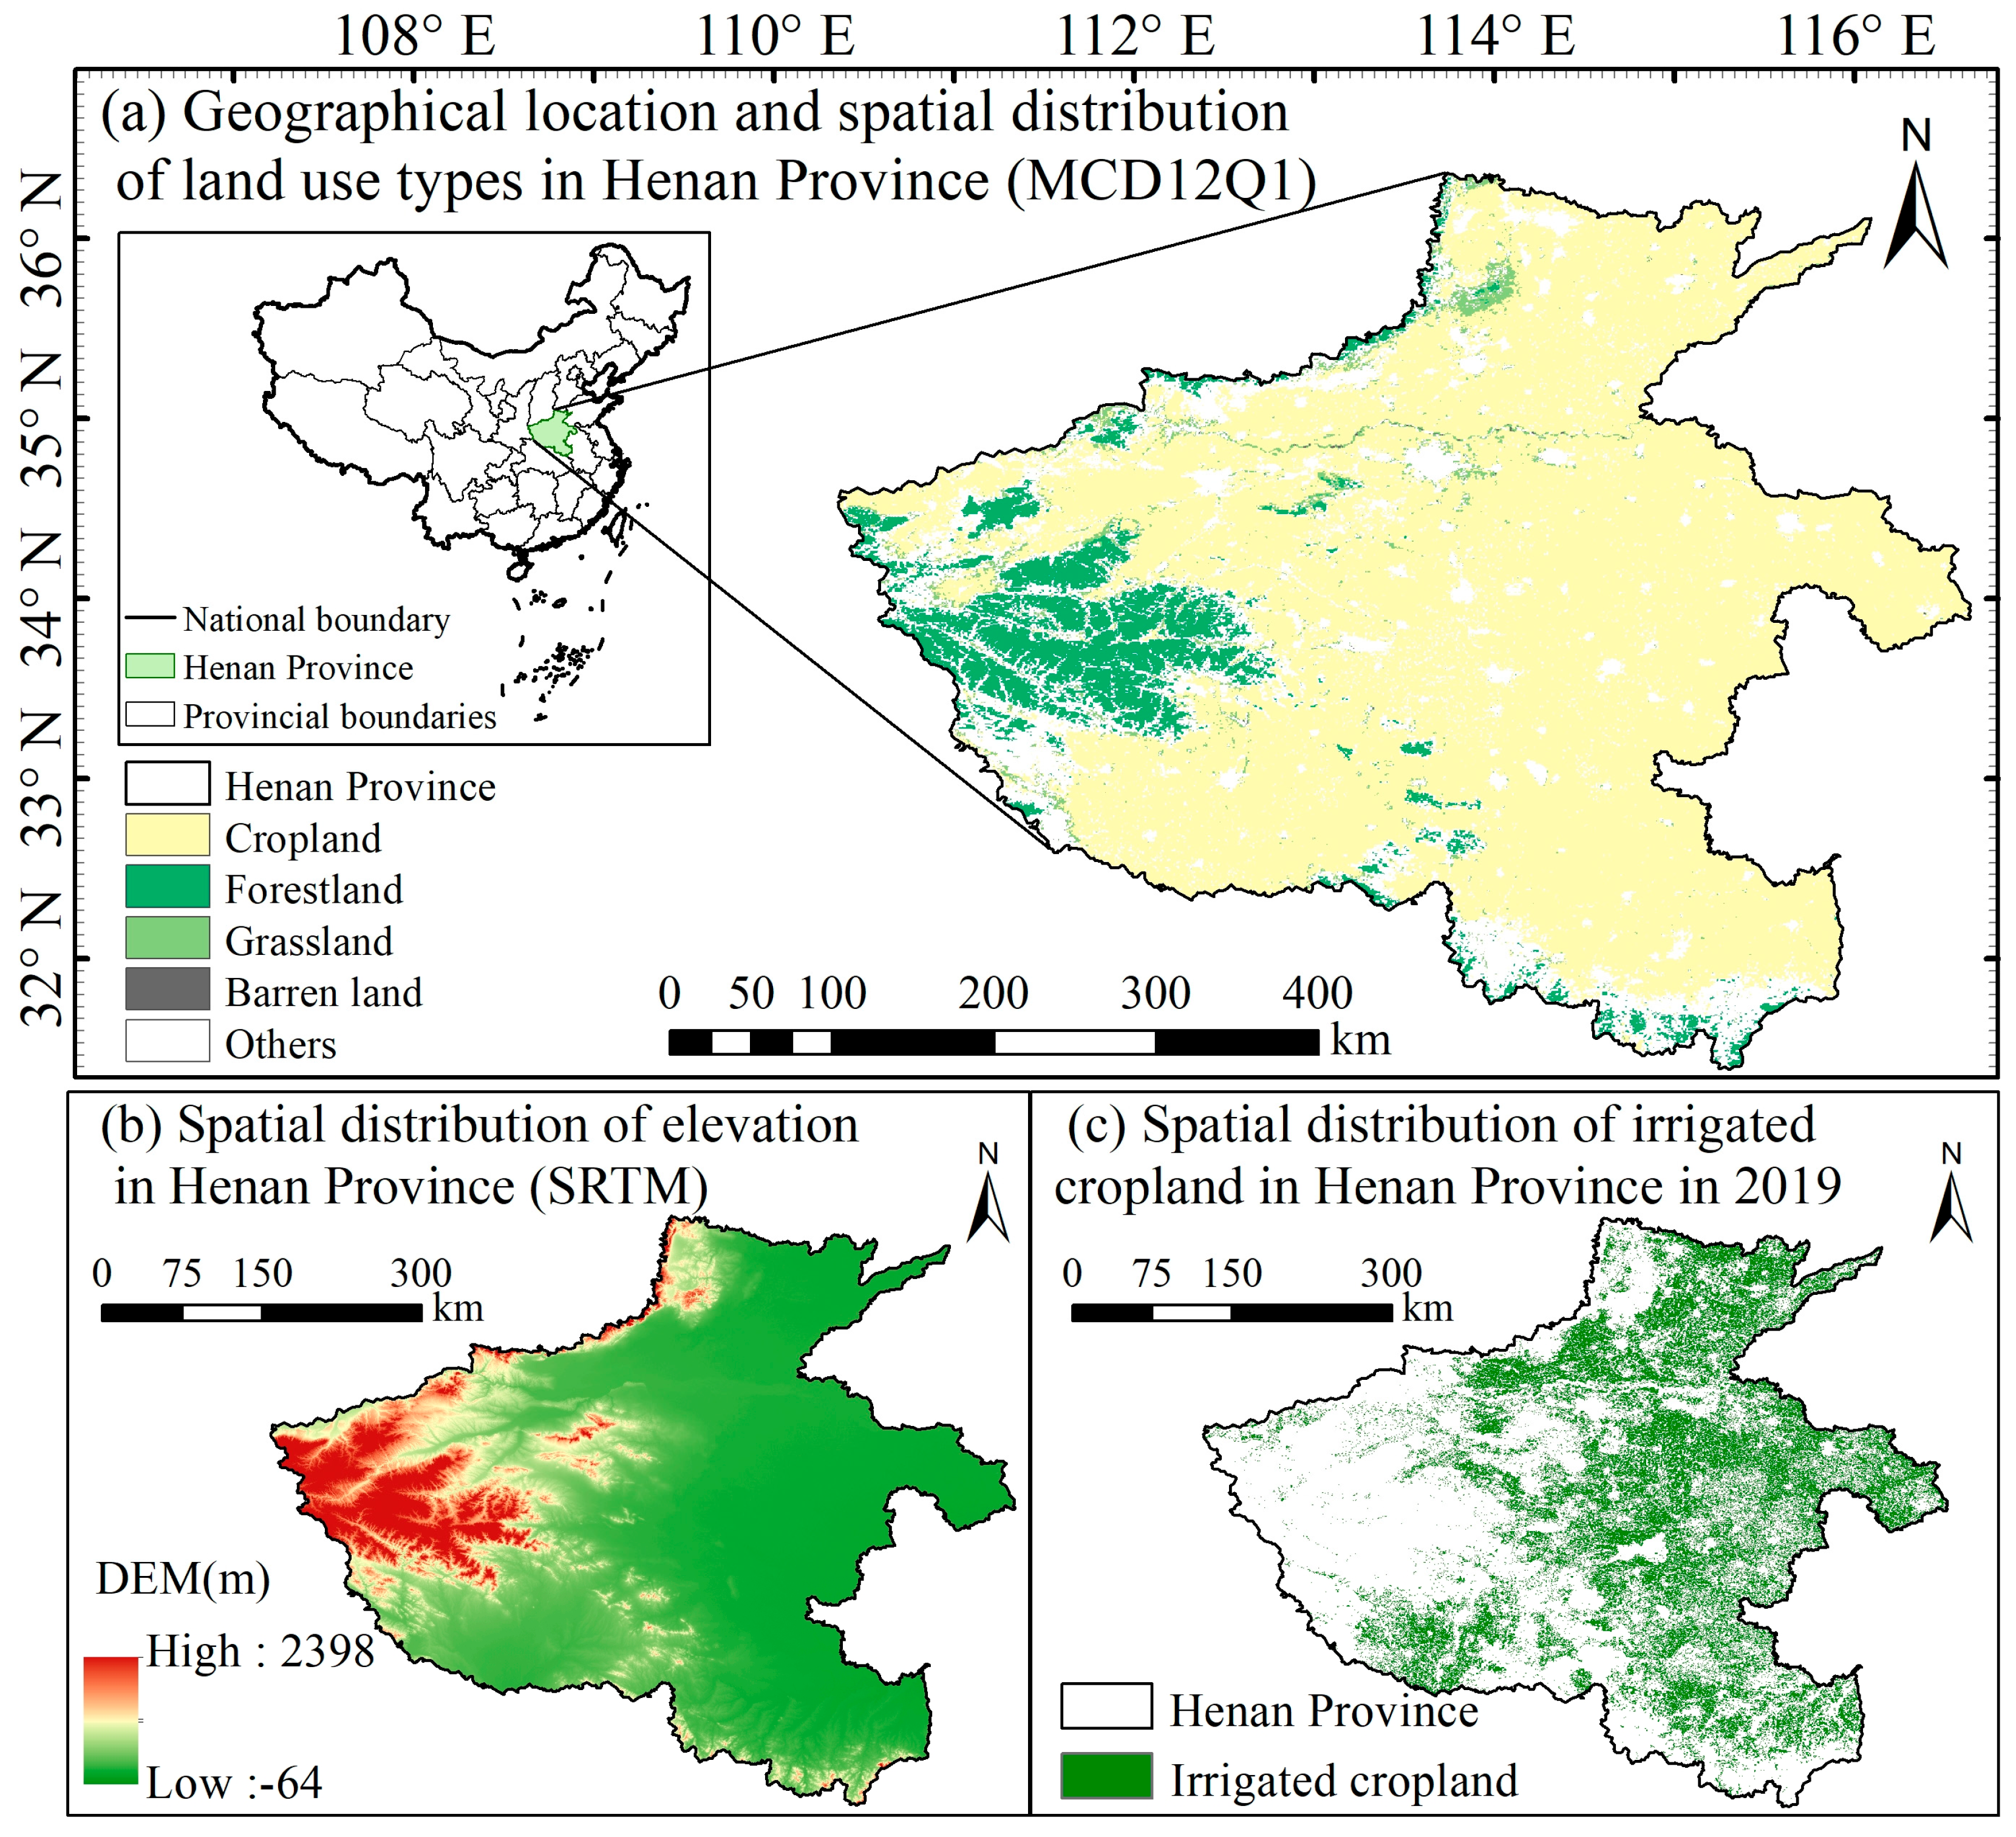
2.1. Research Area

The overview of the research area is shown in Figure 1. Henan Province, situated in east-central China (31°23′–36°22′ N, 110°21′–116°39′ E), covers a total area of 167,000 square kilometers, ranking 17th in size among all Chinese provinces, autonomous regions, and municipalities [46]. Henan Province experiences a typical temperate monsoon climate with four distinct seasons, characterized by warm, humid springs and cold, dry winters. The dominant land use types include cropland (87.11%), forestland (9.83%), grassland (3.02%), and barren land (0.04%). Cropland dominates nearly the entire province except the West Taihang Mountains (Figure 1a). The topography of Henan is relatively flat, transitioning from plains in the east to mountainous terrain in the west (Figure 1b). In 2019, irrigated cropland accounted for a significant portion of Henan Province’s total area, with these lands densely concentrated in the central and eastern regions Figure 1c. Henan is one of China’s largest provinces in terms of arable land area, possessing abundant agricultural resources. As a key agricultural region and a climate-sensitive zone, Henan holds high research value for studying the coupling of carbon and water processes in irrigated cropland ecosystems. Spanning both warm temperate and sub-tropical zones, the province exhibits significant spatial heterogeneity in hydrothermal conditions. This variability leads to distinct farming systems, most notably, winter wheat–summer maize and rice–wheat rotations, accompanied by gradient differentiation in irrigation patterns, crop maturity types, carbon assimilation efficiency, and water transpiration characteristics. These natural gradients provide an ideal experimental setting to analyze the coupled effects of climate variability and irrigation management on carbon and water processes in agroecosystems.

2.2. Data

The GPP and NPP data employed in this study were sourced from the MODIS data products MOD17A2H and MOD17A3HGF, respectively. ET and LAI data were obtained from the Global Land Surface Characterization Parameter (GLASS) product. Land use data were derived from the MODIS land cover dataset (MCD12Q1), and the reclassified land use results are presented in Figure 1a. Following the reclassification of 17 land cover types, four major land use categories in Henan Province were extracted (Figure 1a). Data on irrigated cropland were acquired from the China Ecosystem Research Network Data Center (CERNDC).
Meteorological data, including temperature and precipitation, were obtained from the National Tibetan Plateau Science Data Center. Data on the photosynthetically active radiation absorption ratio and sunshine duration were sourced from the National Earth System Science Data Center. Real GDP data were obtained from a global GDP dataset constructed using nighttime light data. A detailed description of all datasets used in this study is provided in Table 1. “N/A” in Table 1 indicates no units.
The data preprocessing in this study involved several steps. First, the raw GPP, NPP, and ET data were converted from HDF format to raster format, followed by batch extraction and mosaicking. ArcPy was then used to crop the raster images to the study area (Henan Province) and resample them to a uniform spatial resolution. Second, ArcPy was employed to batch-calculate cropland CWUE values at the pixel level across Henan Province. Third, based on the land use data, the irrigated and non-irrigated cropland were processed using ArcPy 10.2, and the results were image elements of irrigated and non-irrigated cropland that were consistently kept constant from 2001 to 2019. Finally, the vector-scale TIFF image of Henan Province was cropped using ArcPy and resampled to ensure consistency in spatial resolution. The ArcPy used for data processing in this manuscript is version 10.2.

2.3. Methods

All calculations in this study were performed at the pixel level.

2.3.1. Carbon and Water Use Efficiency

CWUE consists of CUE, WUEGPP, and WUENPP, which are calculated using the following formulas [18,19,21]:
C U E = N P P G P P
W U E N P P = N P P E T
W U E G P P = G P P E T

2.3.2. Sen + MK Trends Analysis

The combination of Theil–Sen median trend analysis and the Mann–Kendall test provides a robust and reliable method for detecting trends in long-term time series data [47]. The approach effectively captures the spatiotemporal variation patterns of cropland CWUE, GPP, NPP, and ET in Henan Province during 2001–2019.
The Theil–Sen median trend is calculated by the formula:
S e n = M e d i a n ( X a X b a b ) , 2001 b a 2019
X represents one of the CWUE, GPP, NPP, or ET metrics. A positive Sen slope (Sen > 0) indicates an increasing trend in X, while a negative Sen slope (Sen < 0) reflects a declining trend.
The Mann–Kendall test is calculated as follows:
Let X b , b = 2001 , 2002 , , 2019 , define the Z statistic as
Z = S 1 s ( S ) , S > 0 0 , S = 0 S + 1 s ( S } , S < 0 of   which ,   S = a = 1 n - 1 b = a + 1 n sgn ( X a X b )
sgn ( X a X b ) = 1 , X a X b > 0 0 , X a X b = 0 1 , X a X b < 0 , s ( S ) = n ( n 1 ) ( 2 n + 5 ) 18
The results of the Mann–Kendall significance test at the 0.05 confidence level were classified as either significant (Z ≥ 1.96 or Z ≤ −1.96) or non-significant (−1.96 < Z < 1.96).

2.3.3. Dual-Type Randomized Extraction Algorithm

The dual-type randomized extraction algorithm is primarily designed for datasets comprising two distinct data types. It employs a random sampling strategy to extract rectangular vectors of irrigated and non-irrigated cropland within small regions. Within each of these rectangular vector ranges, all other environmental variables are assumed to remain constant. Based on this assumption, the algorithm enables the accurate quantification of irrigation’s impact on cropland CWUE across different regions. This approach supports the optimal use of carbon and water resources, helps maintain ecological balance, enhance agricultural productivity, and provide a scientific foundation for agricultural decision-making and sustainable development. For more details, refer to Chen et al. [48]. In this study, the dual-type randomized extraction algorithm was used to generate random geographic coordinate points across Henan Province. Around each point, a 20 km × 20 km rectangular vector cell (referred to as a study subregion) was constructed. Each randomly generated cell was required to include a sufficient number of irrigated and non-irrigated cropland pixels with stable spatial locations. Specifically, each cell had to contain (1) at least 40 pixels of non-irrigated cropland and (2) at least 40 pixels of irrigated cropland, both of which remained unchanged throughout the study period. Only cells that met both thresholds were selected for further analysis. Ultimately, 100 eligible rectangular cells were identified and extracted as representative study areas.

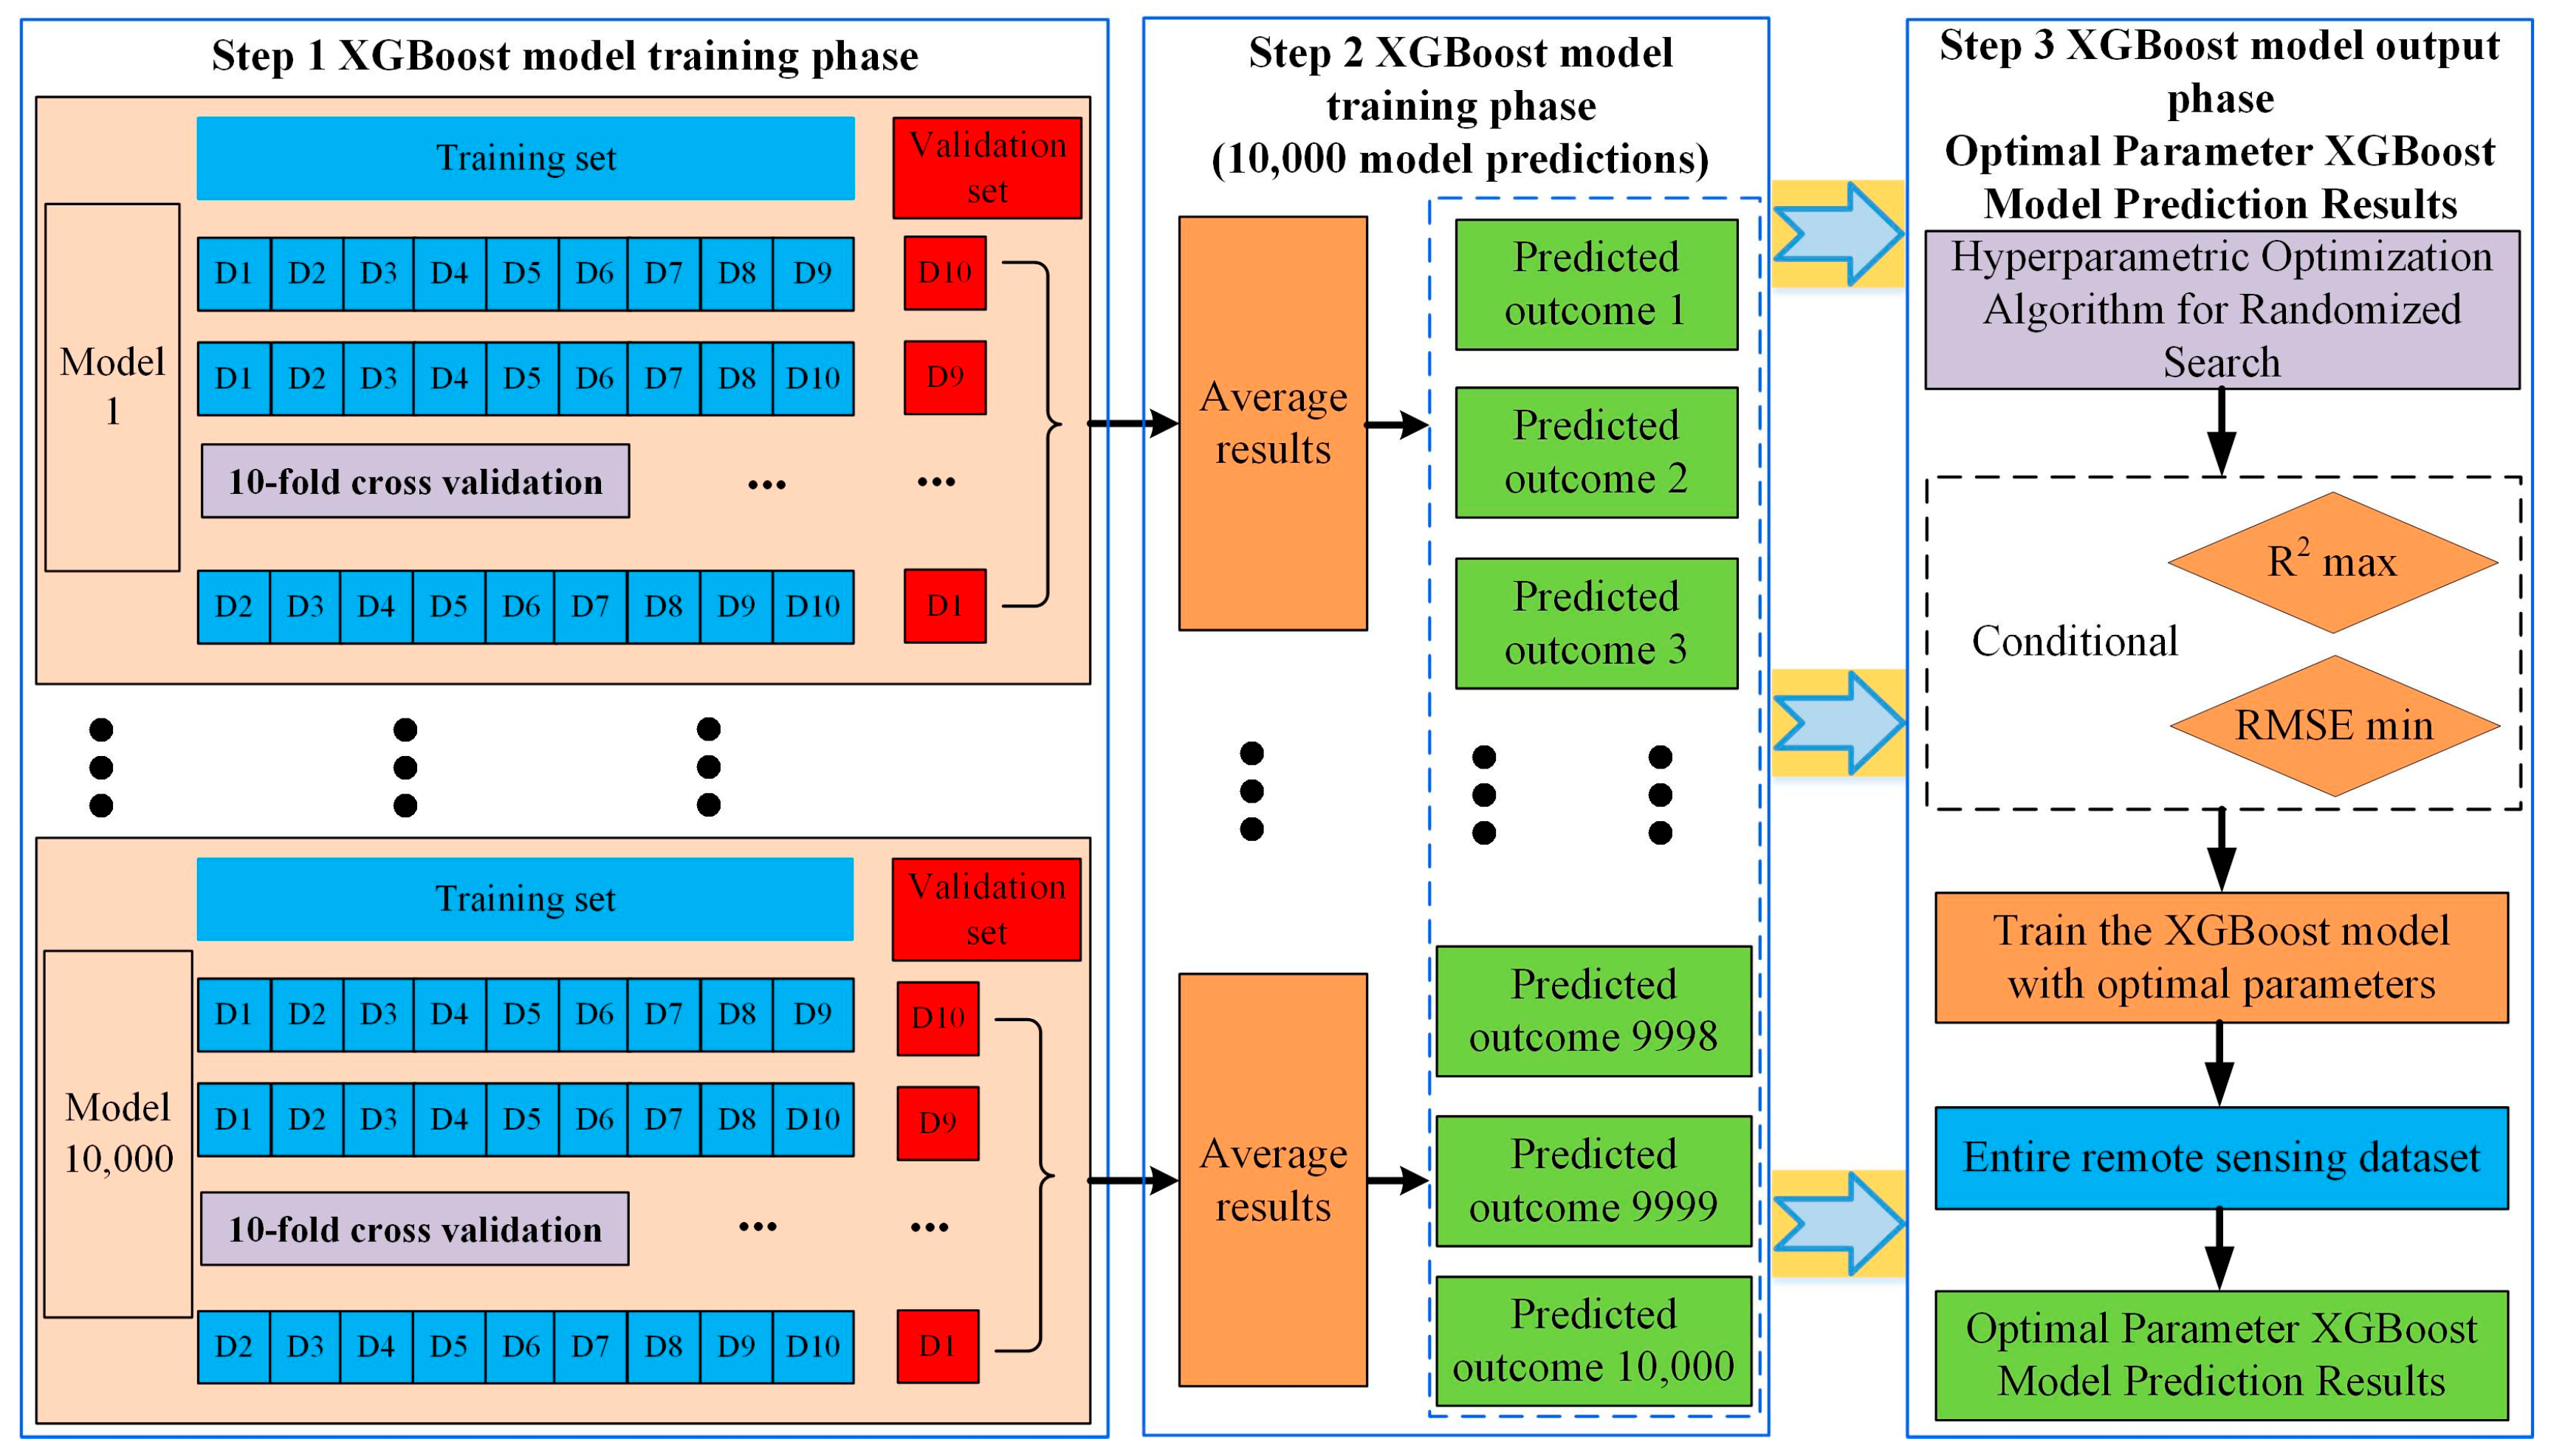
2.3.4. Optimal Parameters XGBoost Model

The XGBoost model is an ensemble learning algorithm based on gradient boosting, designed to reduce bias and underfitting by iteratively constructing multiple estimators [49]. It is widely recognized for its strong performance, computational efficiency, and scalability in regression, classification, and ranking tasks [18]. In this study, to enhance the accuracy of the XGBoost model, optimal hyperparameters were determined using a combination of 10-fold cross-validation and random search optimization. The model was trained and evaluated 10,000 times, with the best-performing hyperparameters selected for training the final model. The structure and workflow of the optimized XGBoost model are illustrated in Figure 2. Additionally, to further improve training efficiency, the model utilized GPU acceleration and parallel processing.
The XGBoost model was developed using seven datasets, where the dependent variable was one of the CWUE metrics for irrigated cropland, and the independent variables included precipitation, temperature, LAI, GDP, radiation, and sunshine. To determine the optimal hyperparameters, a combination of 10-fold cross-validation and randomized search was employed. The hyperparameter optimization process consisted of the following steps: Step 1: The dataset was equally divided into 10 subsets of similar size, each representative of the overall data characteristics. The XGBoost model was trained 10 times, with each iteration using the ith subset as the validation set and the remaining nine subsets combined as the training set. Step 2: After completing the 10 training iterations, the average model predictions were computed and outputted. Step 3: Model tuning was performed using a random search hyperparameter optimization method. This method randomly sampled parameter combinations within the parameter space, evaluating model performance via Root Mean Square Error (RMSE) and Coefficient of Determination (R2). Among 10,000 trained XGBoost models, the parameter set with the best performance was selected. The optimal hyperparameters for the three CWUE indicators in Henan Province are listed in Table 2, with all models achieving R2 values above 0.81. These results demonstrate that the optimized XGBoost model accurately and reliably identifies the spatiotemporal heterogeneity of key drivers underlying CWUE dynamics in Henan Province.
We provide the exact range of hyperparameters in the article as follows: param_distributions = {‘n_estimators’: randint (100, 500), ‘learning_rate’: uniform (0.01, 0.2), ‘max_depth’: randint (3, 10), ‘subsample’: uniform (0.7, 0.3), ‘colsample_bytree’: uniform (0.7, 0.3), lambda: [0.1, 10], and alpha: [0, 5]}. The computer environment information used in this study shown in Table 3.

2.3.5. SHAP Explanatory Model

Shapley Additive exPlanations (SHAP) is a game theory-based interpretability method that quantifies each feature’s contribution to a model’s predicted outcome [50]. SHAP addresses the “black-box” problem of machine learning by calculating the marginal contribution of each feature to the prediction using concepts from cooperative game theory [51]. The method is grounded in three key axioms: local accuracy (ensuring exact prediction explanations at the individual sample level), missingness (assigning zero impact to absent features), and consistency (guaranteeing stable feature attributions across different models) [52]. In this study, SHAP is used to interpret the XGBoost model predictions of irrigated cropland CWUE by quantifying both the direction and magnitude of each driver’s nonlinear influence on irrigated cropland CWUE. The formula is defined as follows:
x i = s S i ( n s ) ! ( s 1 ) ! n ! v s v ( s / i )
where x i denotes the set containing all subsets of member i ; s indicates any subset of S i ; s corresponds to the cardinality (size) of the subset s ; n denotes the total number of players; v s represents the gain of the full set s ; and v ( s / i ) is the set gain excluding member i .
The Shapley value provides a robust measure to quantify the individual contributions of each driver to the model’s final predicted outcome.
y i = y b a s e + f x i , 1 + f x i , 2 + + f x i , j + + f x i , k
where y i denotes the forecast result of the i th subset, y b a s e stands for the mean predicted value of every subset in the dataset, x i denotes the i th subset, f x i , j indicates the SHAP value of the i th sample and j th feature, and k is the quantity of input features.

2.3.6. Calculation of Importance Index

Based on the spatial distribution of SHAP values for the drivers affecting irrigated cropland CWUE in Henan Province, further spatial statistical analysis was conducted using ArcPy. For each driving factor, the absolute SHAP values were calculated for every image pixel. Then, the absolute SHAP values of all driving factors were compared pixel-wise to identify the maximum absolute SHAP value for each pixel. This maximum value was assigned to the corresponding driving factor, enabling the identification of the dominant drivers behind the spatiotemporal variations in irrigated cropland CWUE across Henan Province and their spatial distribution.

3. Results

3.1. Spatiotemporal Changes in Cropland CWUE, GPP, NPP, and ET

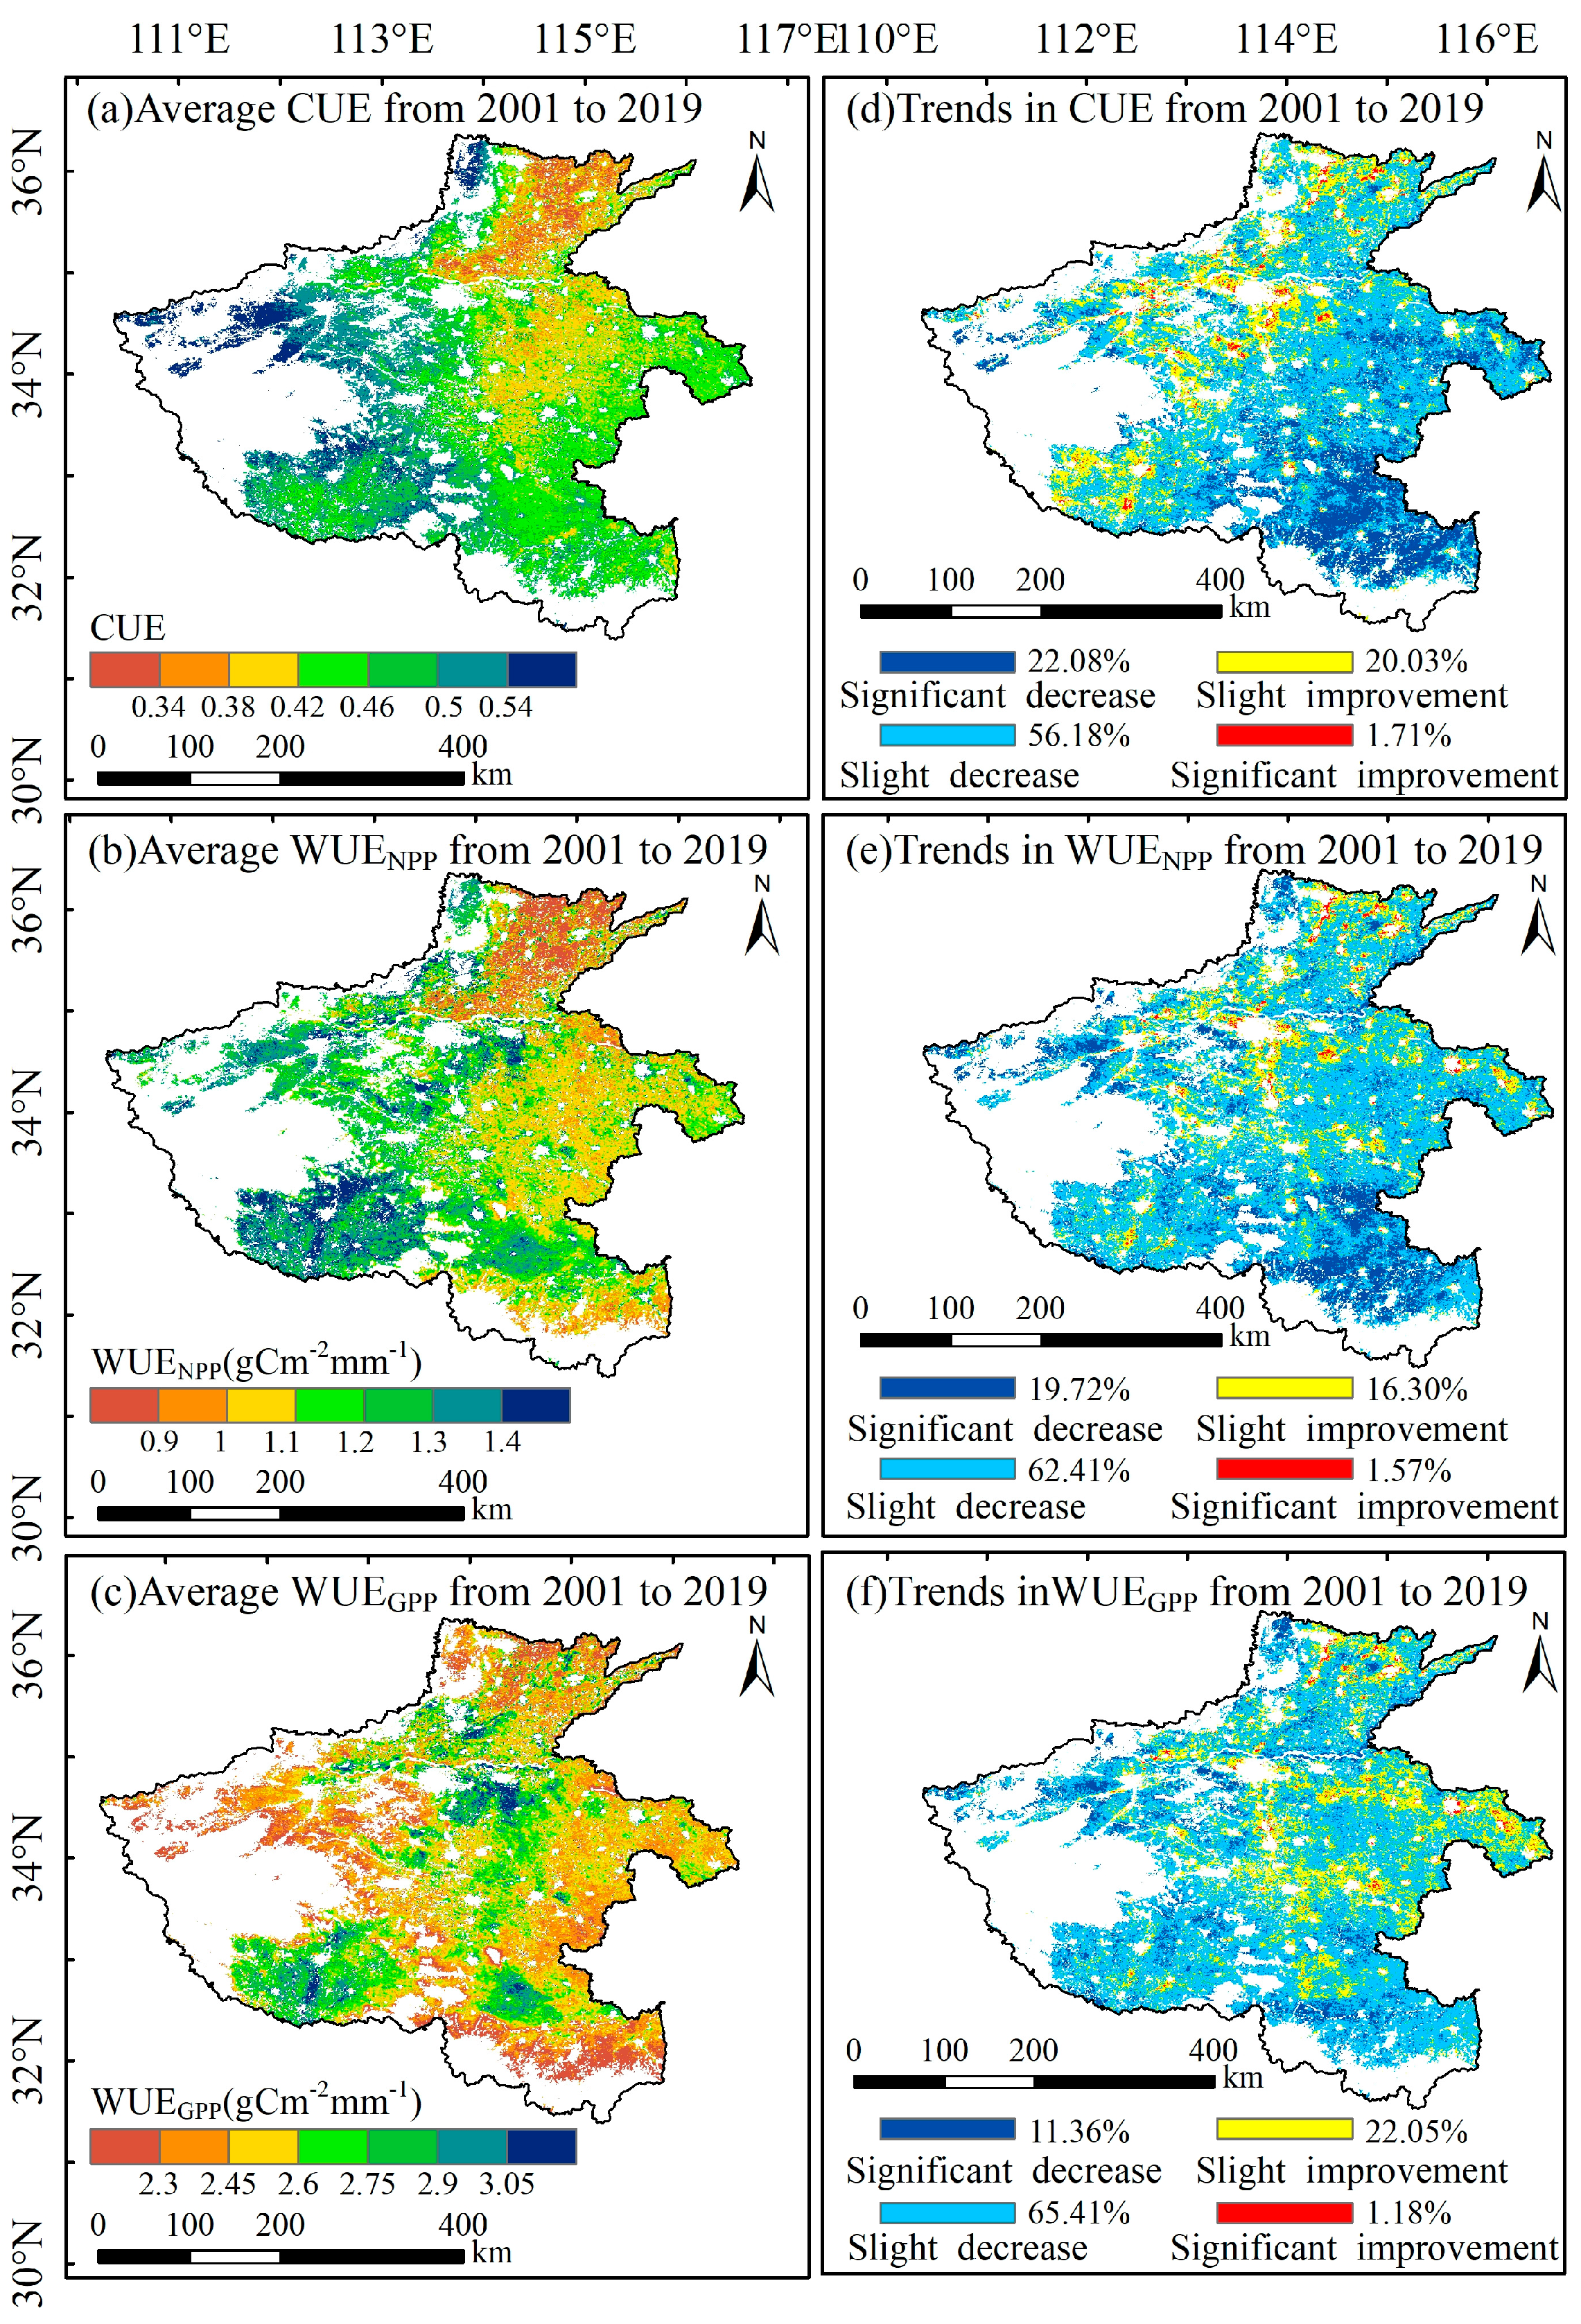
3.1.1. Spatiotemporal Changes in Cropland CWUE

Figure 3 illustrates the spatial distribution and spatiotemporal trends of the cropland CWUE in Henan Province from 2001 to 2019. During this period, the multi-year average values of the CUE and WUENPP were predominantly high in the western region and low in the northeastern region, while the WUEGPP exhibited higher average values mainly in the central and southwestern regions. Overall, the cropland CWUE in Henan showed a primarily decreasing trend between 2001 and 2019, with the CUE, WUENPP, and WUEGPP declining over approximately 78.26%, 82.13%, and 76.77% of the cropland area, respectively. Significant reductions in the CUE and WUENPP were mainly concentrated in the southeastern region, accounting for about 22.08% and 19.72% of cropland, respectively, while there were significant decreases in the WUEGPP over approximately 11.36% of the area. Conversely, the proportion of cropland experiencing a significant increase in CWUE was minimal, with the CUE, WUENPP, and WUEGPP rising over only about 1.71%, 1.57%, and 1.18% of the cropland area, respectively.

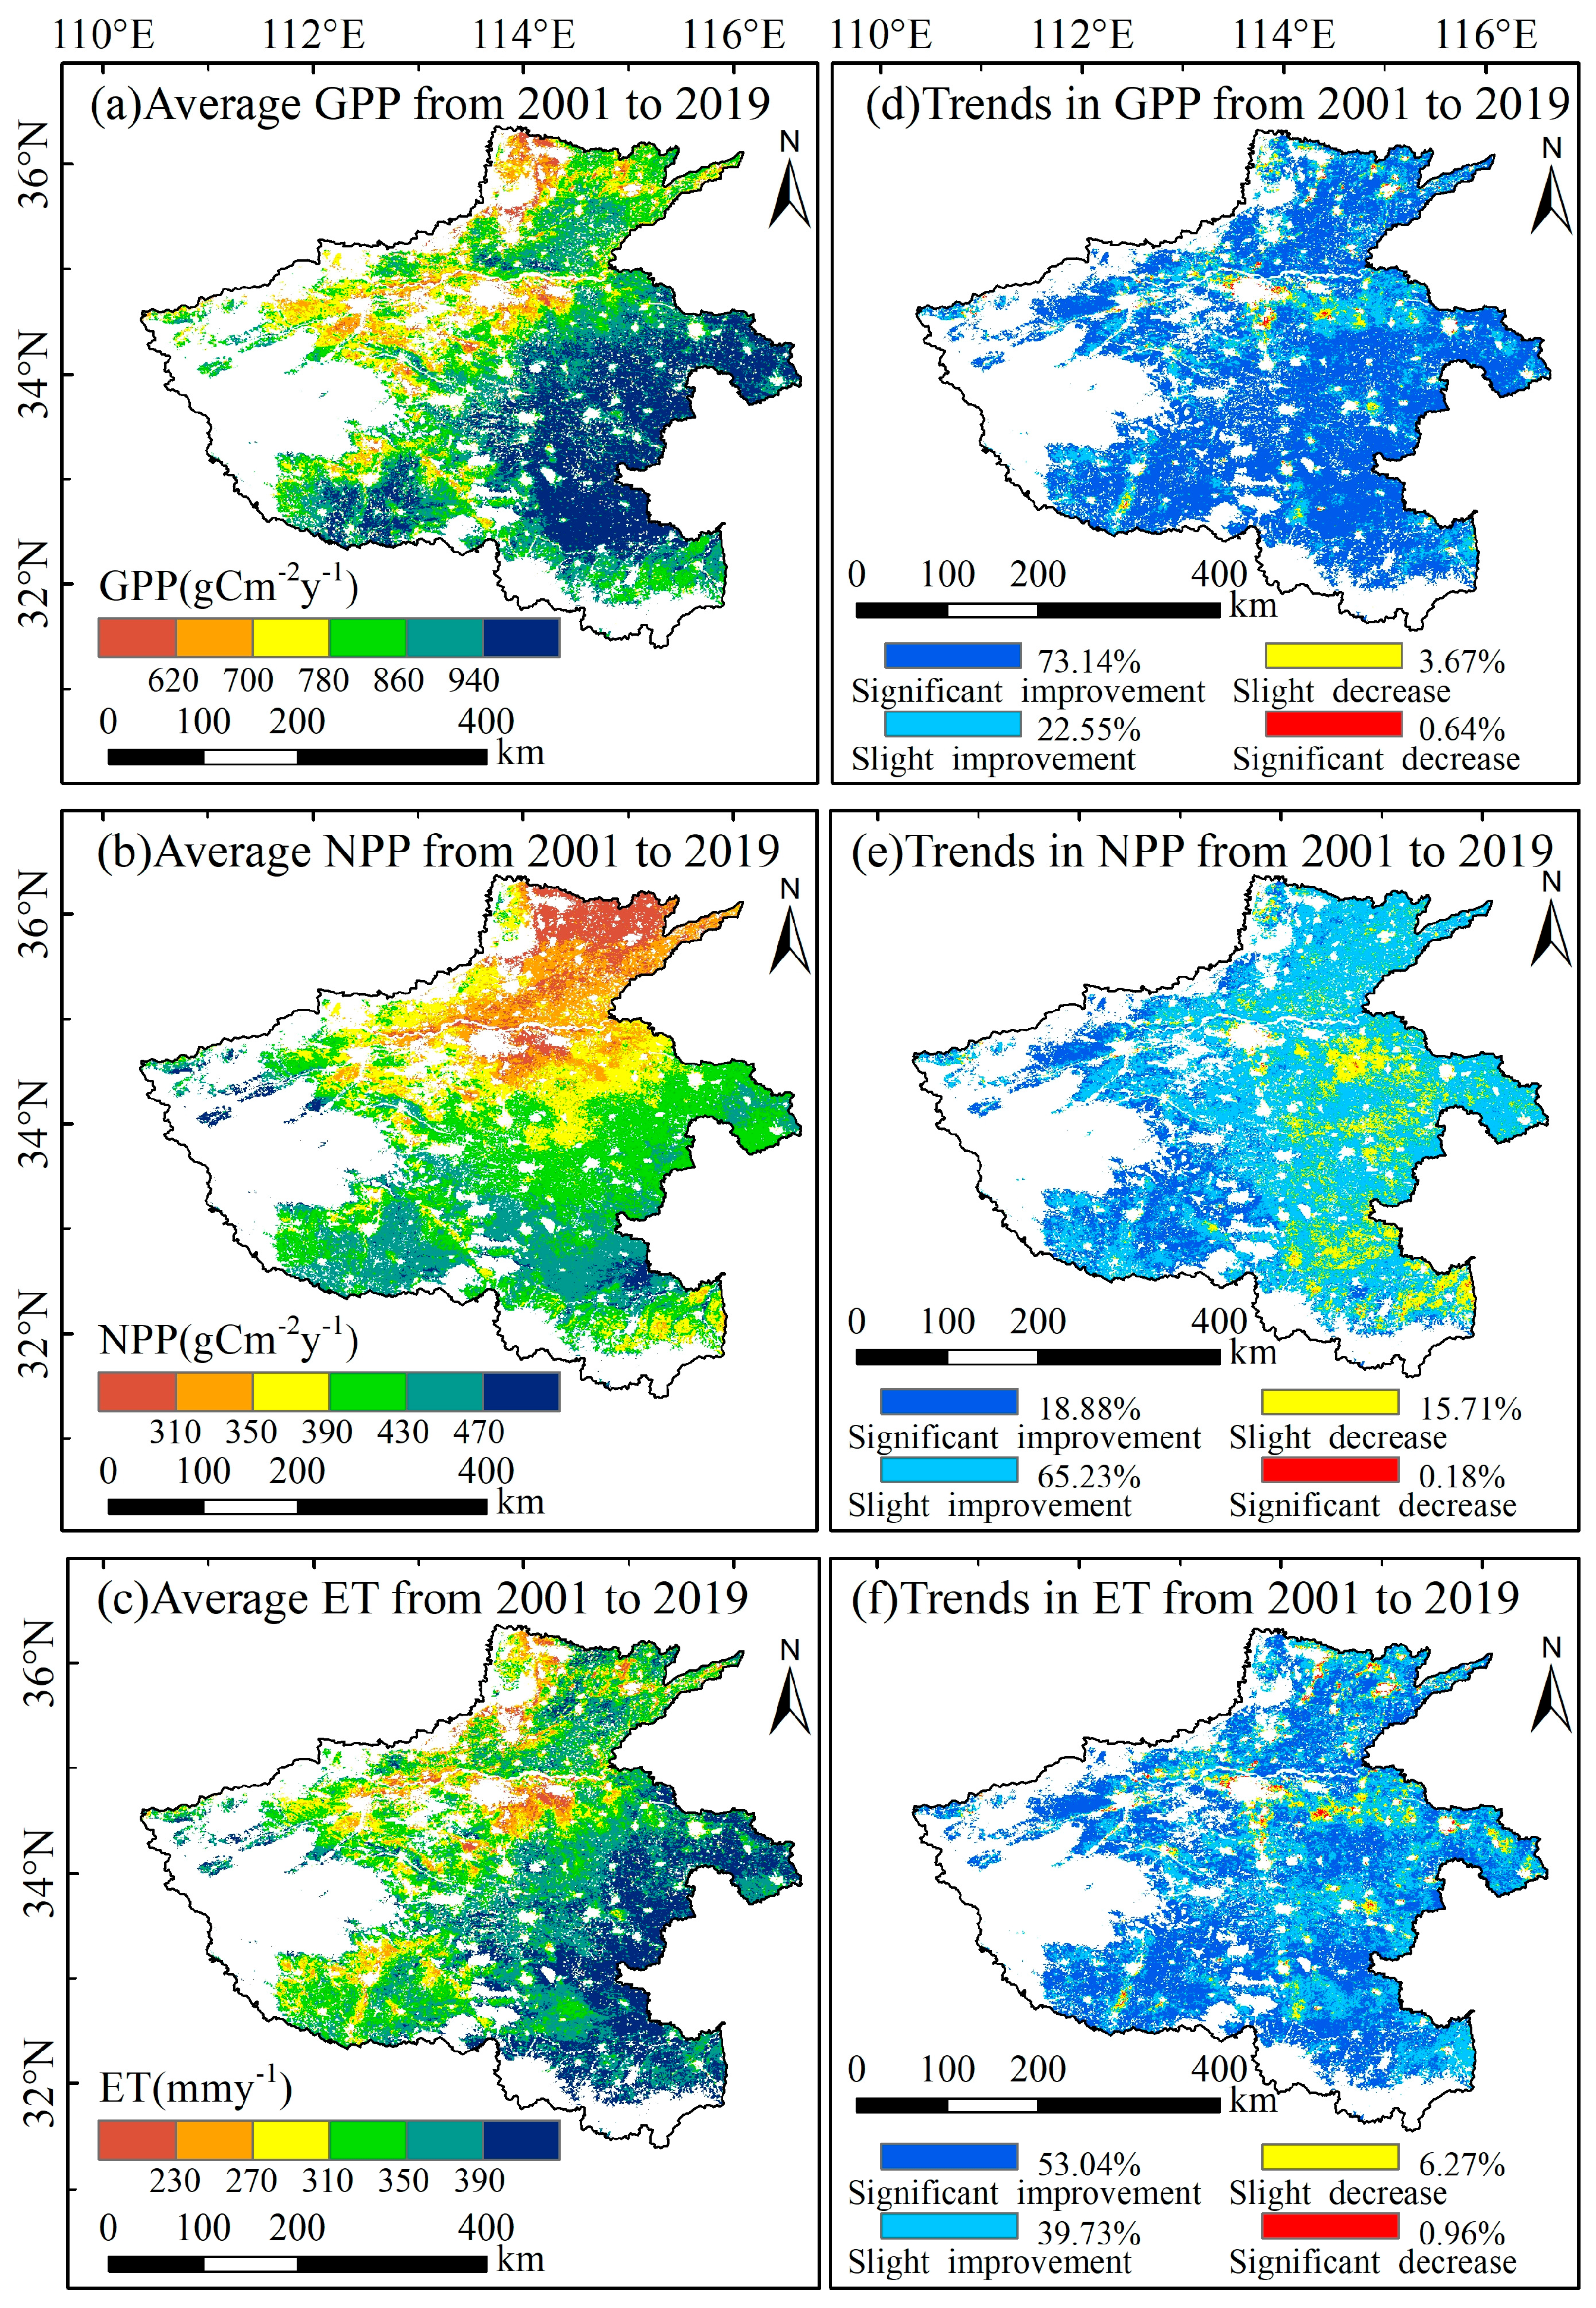
3.1.2. Spatiotemporal Changes in Cropland GPP, NPP, and ET

Figure 4 presents the spatial distribution and spatiotemporal dynamics of the GPP, NPP, and ET for cropland in Henan Province from 2001 to 2019. The spatial patterns of the GPP and ET are similar, displaying east–west and south–north gradients, while the NPP shows a meridional decline from south to north. The GPP, NPP and ET mainly exhibited increasing trends, covering approximately 95.70%, 84.11%, and 92.77% of the cropland area, respectively. Notably, areas with significant increases accounted for about 73.14%, 18.88%, and 53.04% of cropland for the GPP, NPP, and ET, respectively. The spatial distributions of the increasing GPP and ET largely overlapped, whereas increases in the NPP were primarily concentrated in western Henan. Areas where the GPP, NPP, and ET showed significant decreases were minimal, representing only about 0.64%, 0.18%, and 0.96% of the cropland area, respectively.

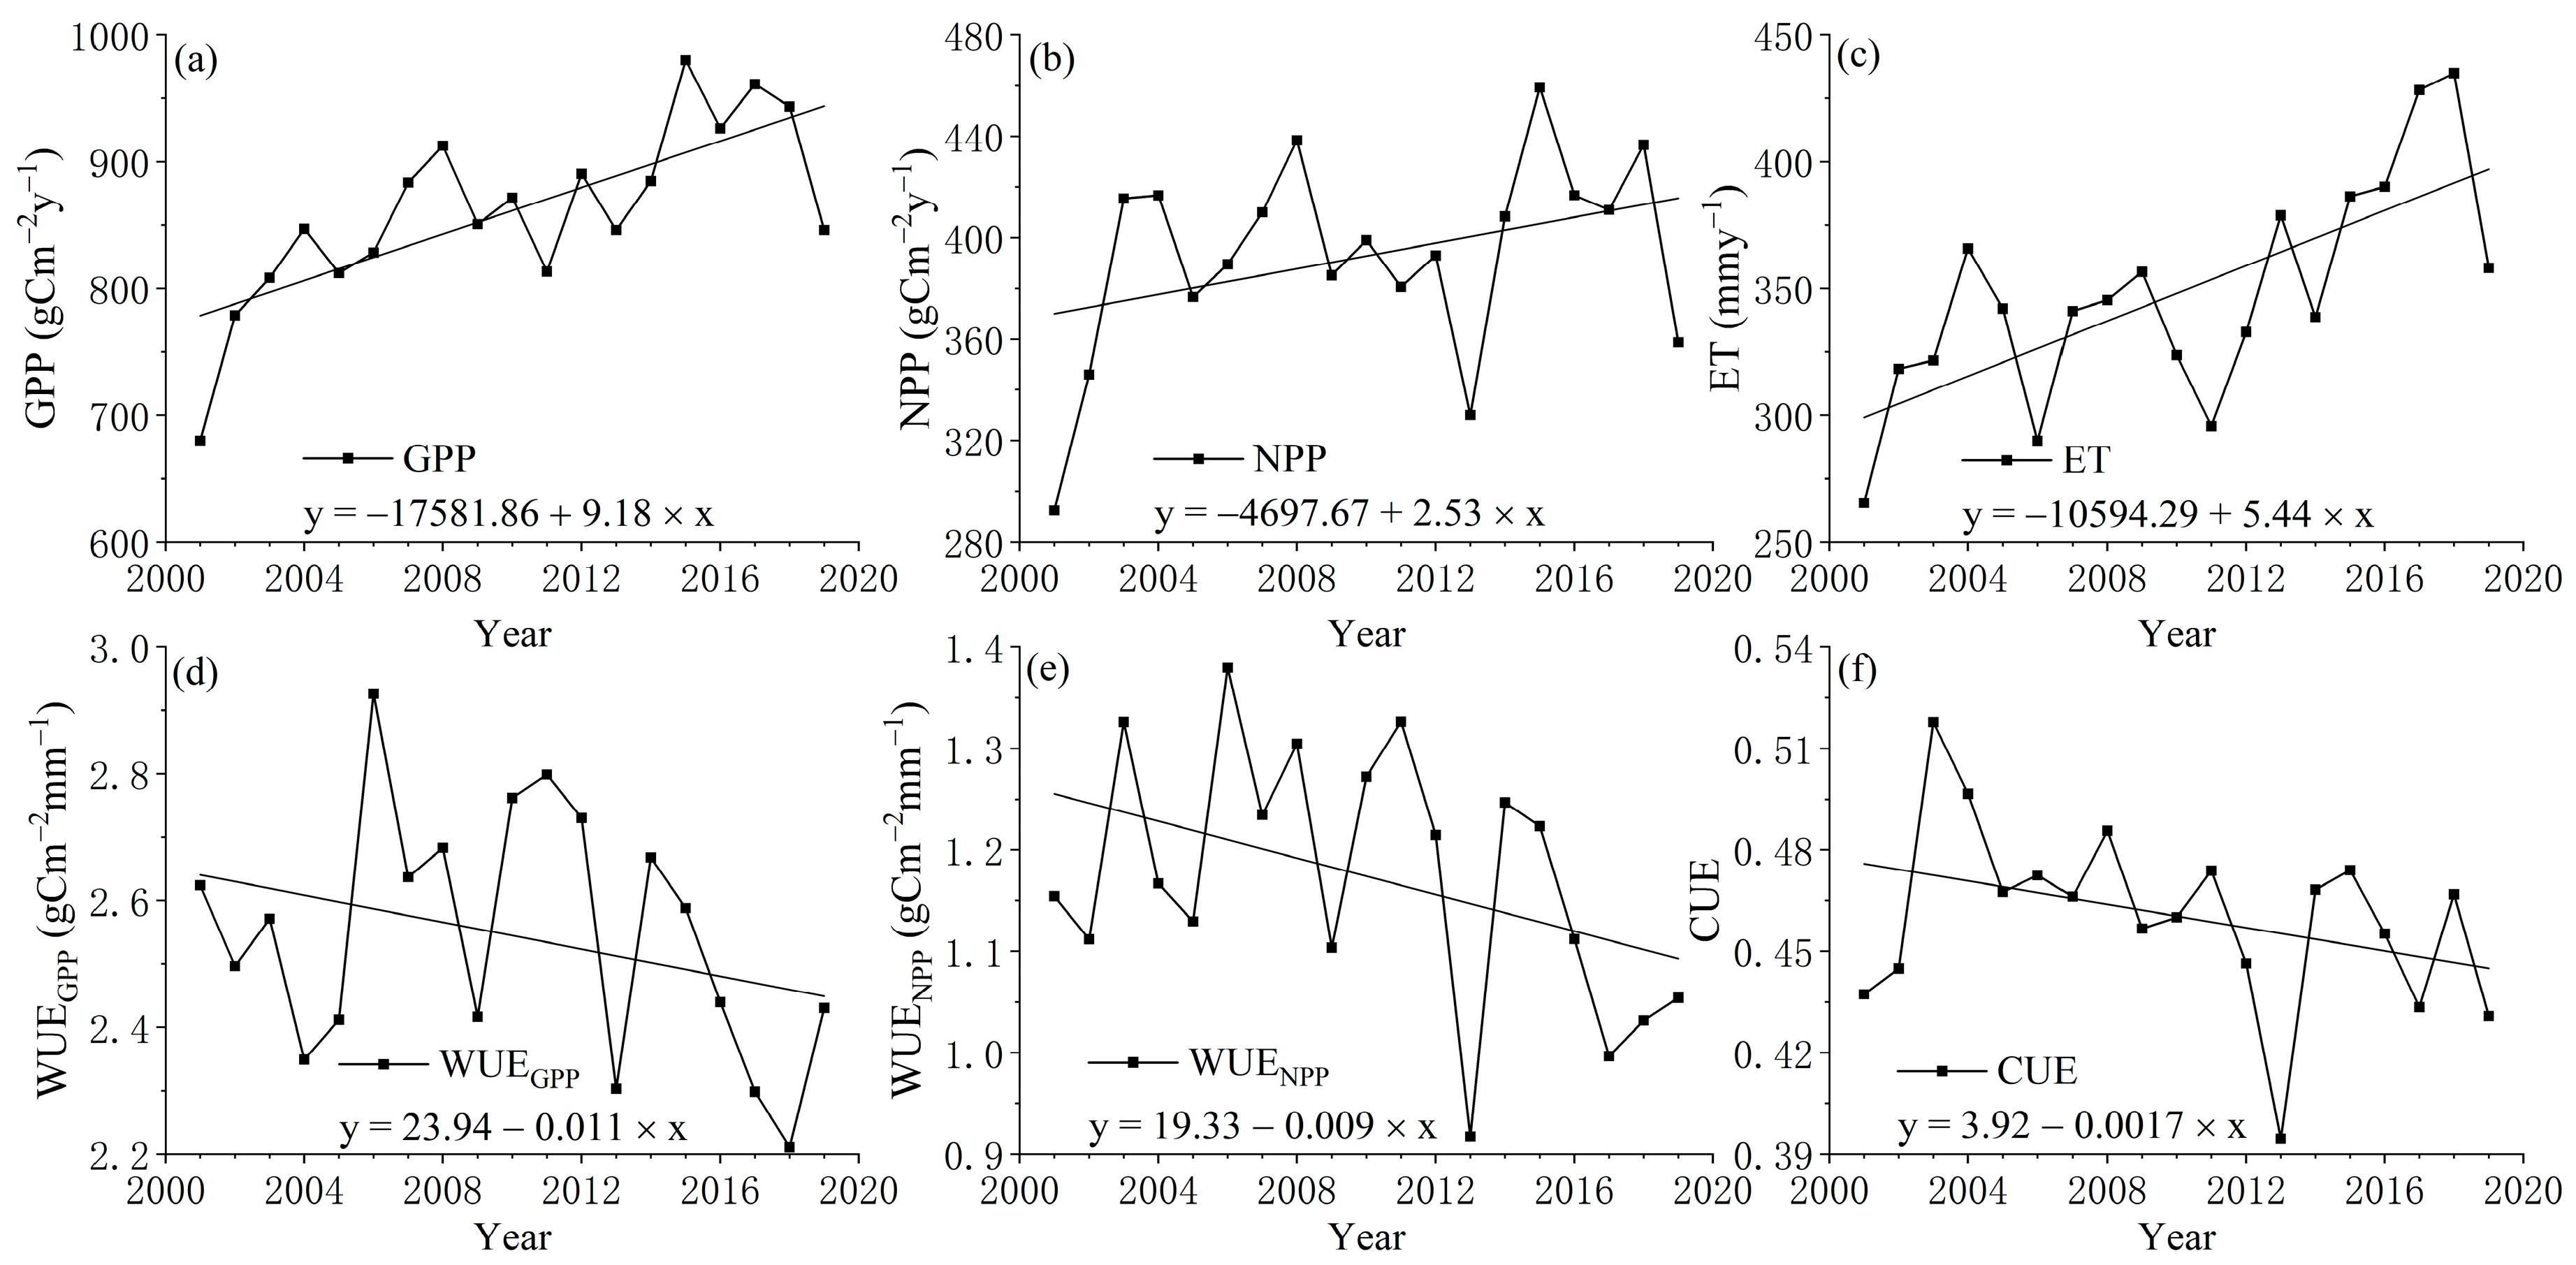
3.1.3. Interannual Variations in Average Annual of Cropland CWUE, GPP, NPP, and ET

Figure 5 illustrates the interannual variation trends of the annual averages of the CWUE, GPP, NPP, and ET for cropland in Henan Province from 2001 to 2019. The multi-year averages of the WUEGPP, WUENPP, and CUE are 2.54 g   C   m 2   mm 1 , 1.17 g   C   m 2   mm 1 , and 0.46, respectively, with decreasing rates of 0.011 g   C   m 2   mm 1 a 1 , 0.009 g   C   m 2   mm 1 a 1 , and 0.0017 a 1 , respectively. The WUEGPP and WUENPP peaked in 2006 at 2.93 g   C   m 2   mm 1 and 1.38 g   C   m 2   mm 1 , respectively, while CUE reached its maximum of 0.52 in 2003. The multi-year mean values of the GPP, NPP, and ET were 861.23 g   C   m 2   y 1 , 392.81 g   C   m 2   y 1 , and 348.05 mm   y 1 , respectively, with increasing rates of 9.18 g   C   m 2   y 1   a 1 , 2.53 g   C   m 2   y 1   a 1 , and 5.44 mm   y 1   a 1 . The GPP and NPP peaked in 2015 at 980.05 g   C   m 2   y 1 and 459.31 g   C   m 2   y 1 , respectively, while ET reached its maximum of 434.90 mm   y 1 in 2018.

3.2. A Quantitative Evaluation of the Impact of Irrigation on CWUE in Cropland

3.2.1. A Dual-Type Randomized Extraction Algorithm to Extract the Study Area

The extraction of non-irrigated and irrigated cropland in Henan Province from 2001 to 2019 is shown in Figure 6. Areas with unchanged irrigated cropland during this period were primarily located in the central-eastern and northern regions, including Zhengzhou, Kaifeng, Xinxiang, Jiaozuo, Shangqiu, Luohe, and Xuchang (Figure 6a), indicating these regions’ continued reliance on irrigation for agricultural stability. Except for the Taihang Mountains region in the west, the area of cropland that remained unchanged largely covered all prefecture-level cities in Henan Province (Figure 6b), highlighting the vital foundation for Henan Province as a major agricultural region in maintaining the long-term scale advantage of its 18 cropland resources. Irrigated cropland that remained stable from 2001 to 2019 accounted for approximately 8.97% of the total unchanged cropland area (Figure 6c), underscoring the limited spatial coverage of irrigation infrastructure despite its critical role. Using the dual-type randomized extraction algorithm developed in this study, 100 rectangular vectors representing irrigated and non-irrigated cropland were extracted; their spatial distribution is shown in Figure 6d, ensuring statistically robust comparisons between the two systems in the cropland CWUE analysis.

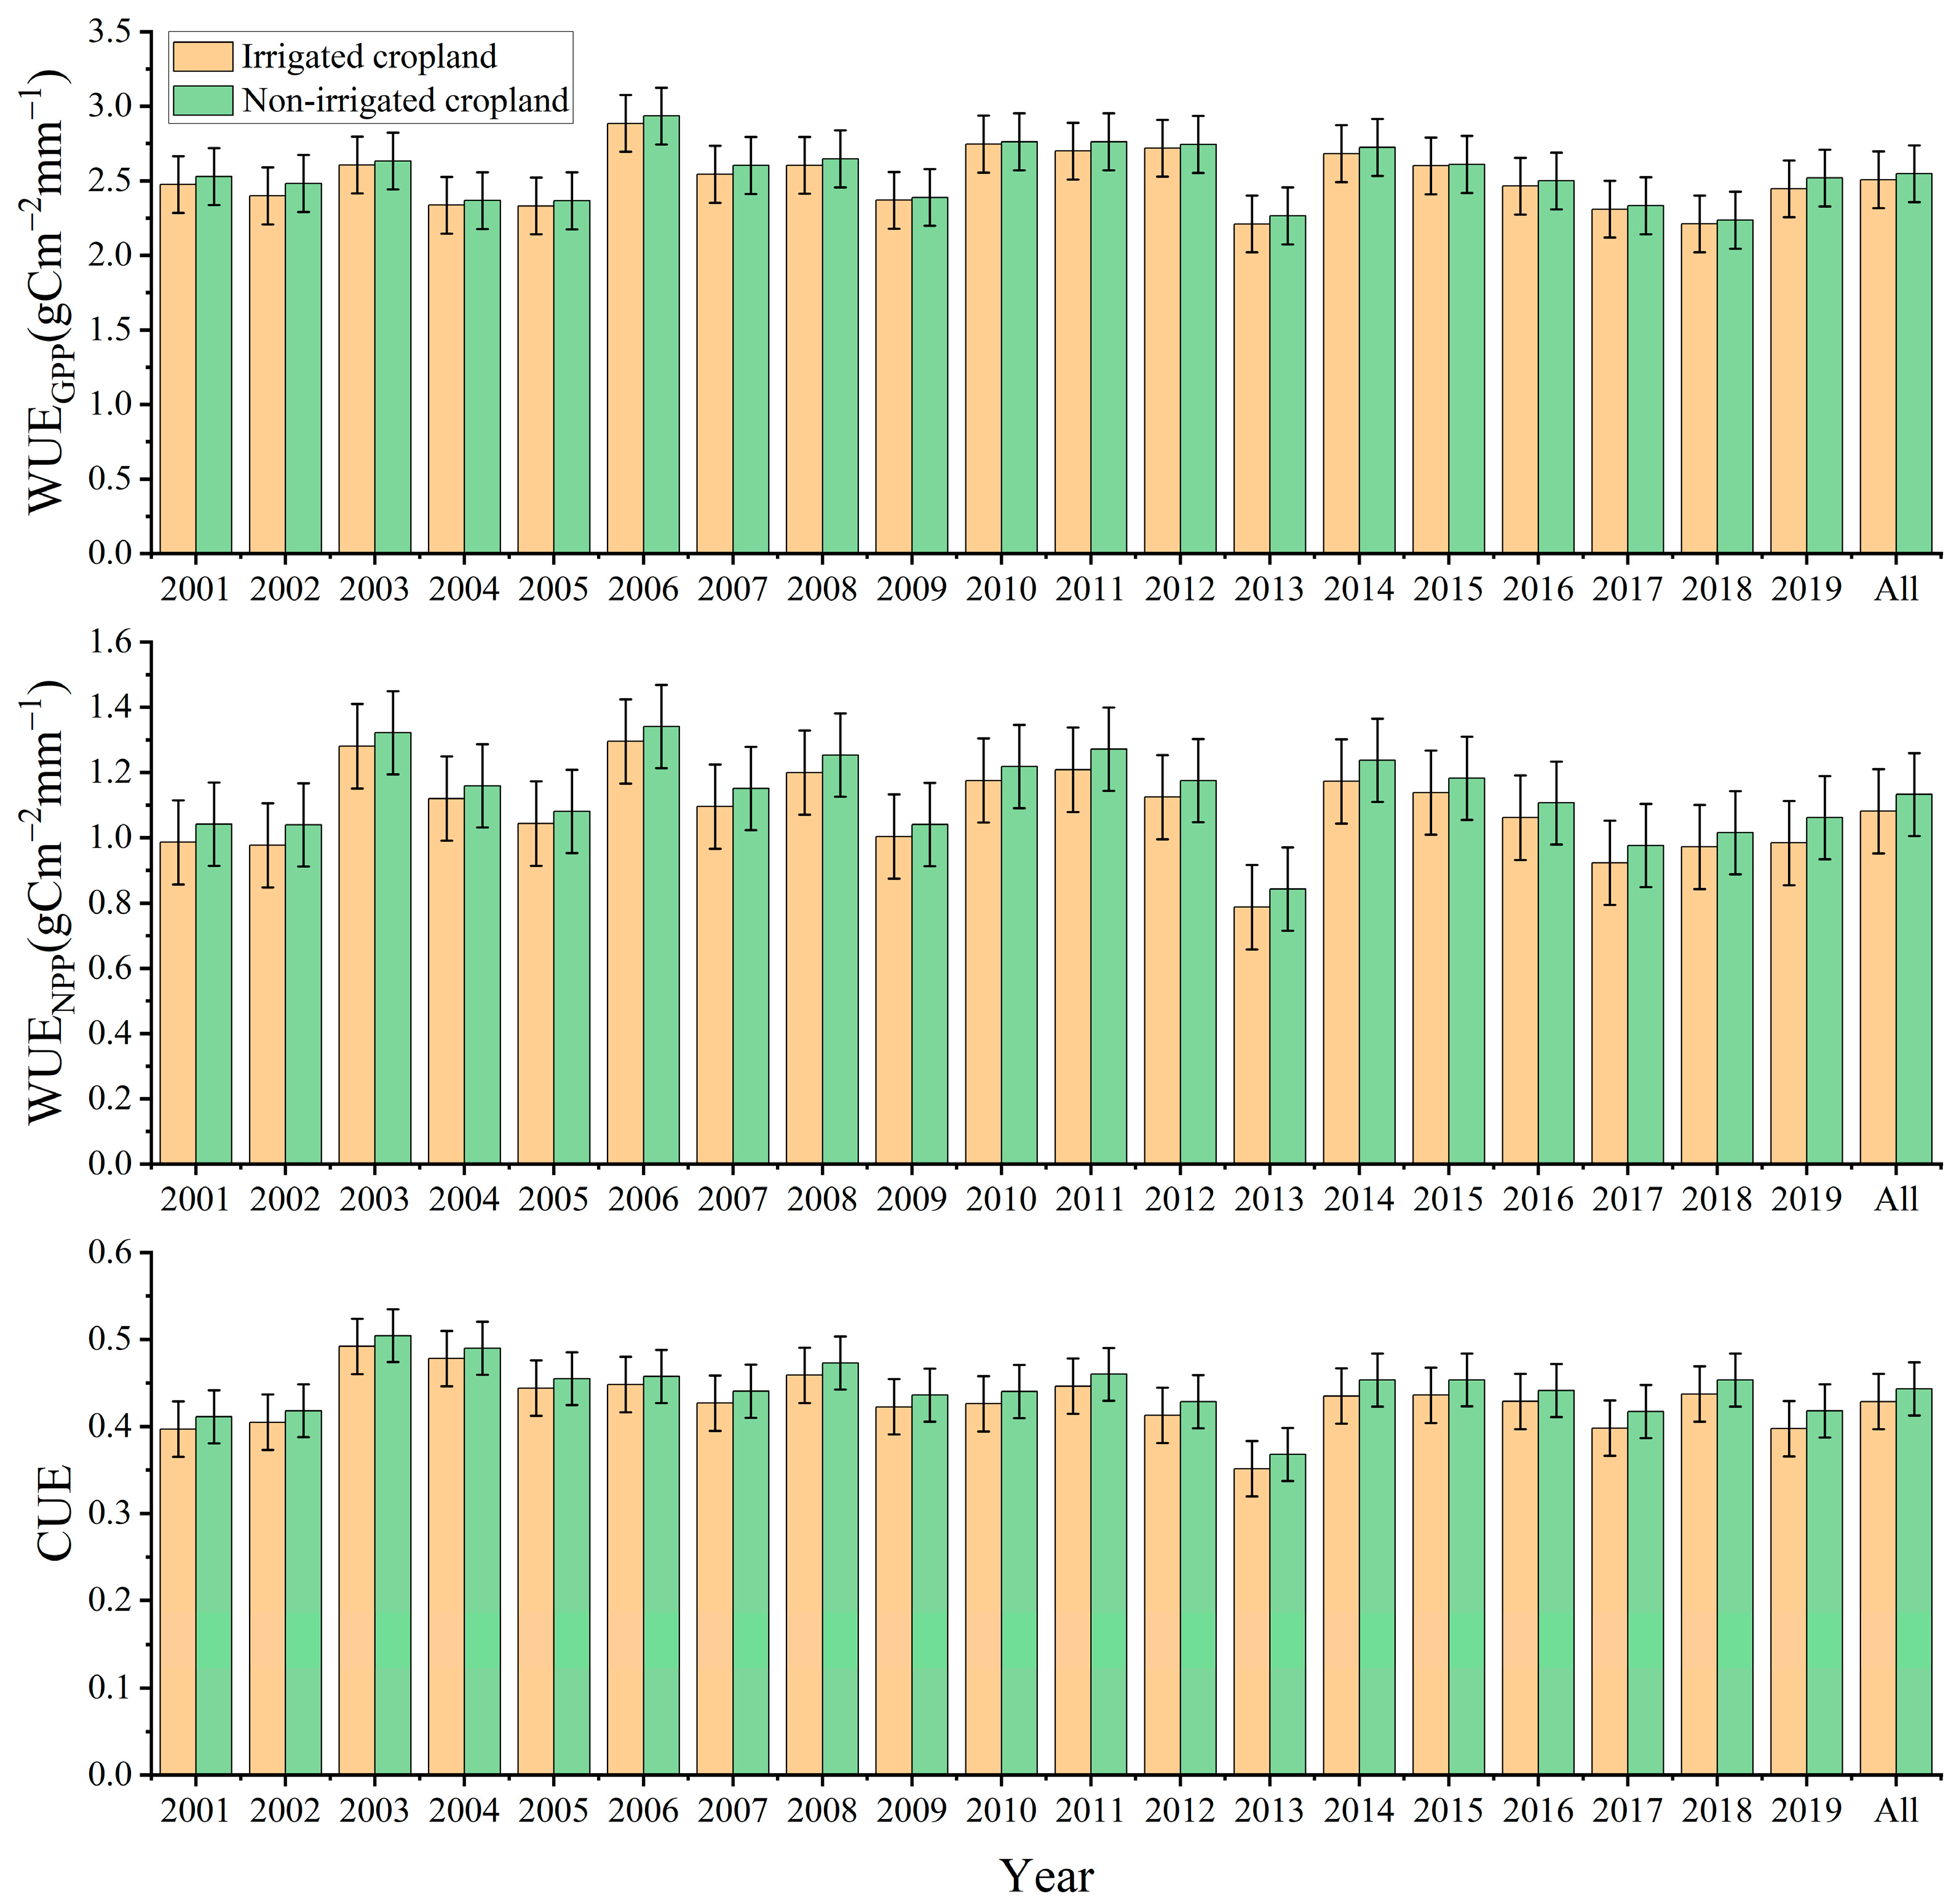
3.2.2. Quantitative Evaluation of CWUE for Irrigated and Non-Irrigated Cropland

The quantitative evaluation of cropland CWUE for irrigated and non-irrigated areas in Henan Province from 2001 to 2019 is presented in Figure 7. Throughout this period, CWUE in non-irrigated cropland consistently exceeded that of irrigated cropland. The multi-year averages of the WUEGPP, WUENPP, and CUE for irrigated cropland were 2.51 g   C   m 2   mm 1 , 1.08 g   C   m 2   mm 1 , and 0.43, while those for non-irrigated cropland were slightly higher at 2.55 g   C   m 2   mm 1 , 1.13 g   C   m 2   mm 1 , and 0.44, respectively. The peak WUEGPP values for irrigated and non-irrigated cropland both occurred in 2006, reaching 2.88 g   C   m 2   mm 1 and 2.93 g   C   m 2   mm 1 , respectively. Similarly, the highest WUENPP values were observed in 2006 at 1.30 g   C   m 2   mm 1 for irrigated cropland and 1.34 g   C   m 2   mm 1 for non-irrigated cropland. The maximum CUE values were recorded in 2003, with 0.49 for irrigated cropland and 0.50 for non-irrigated cropland.
Quantitative assessments of the GPP, NPP, and ET for irrigated and non-irrigated cropland in Henan Province from 2001 to 2019 are shown in Figure 8. During this period, the GPP, NPP, and ET values for irrigated cropland consistently exceeded those of non-irrigated cropland. The multi-year mean values of the GPP, NPP and ET for irrigated cropland were 881.96 g   C   m 2   y 1 , 379.17 g   C   m 2   y 1 , and 359.84 mm   y 1 , respectively, while those for non-irrigated cropland were slightly lower at 846.50 mm   y 1 , 375.83 g   C   m 2   y 1 , and 342.61 mm   y 1 , respectively. The highest GPP values for irrigated and non-irrigated cropland occurred in 2015, reaching 1005.59 g   C   m 2   y 1 and 963.98 g   C   m 2   y 1 , respectively. Similarly, the peak NPP values were observed in 2015, with 439.28 g   C   m 2   y 1 for irrigated cropland and 436.90 g   C   m 2   y 1 for non-irrigated cropland. The maximum ET values were recorded in 2017 at 437.74 mm   y 1 for irrigated cropland and 418.46 mm   y 1 for non-irrigated cropland.

3.3. Spatial Drivers and Synergistic Mechanisms of Irrigated Cropland CWUE

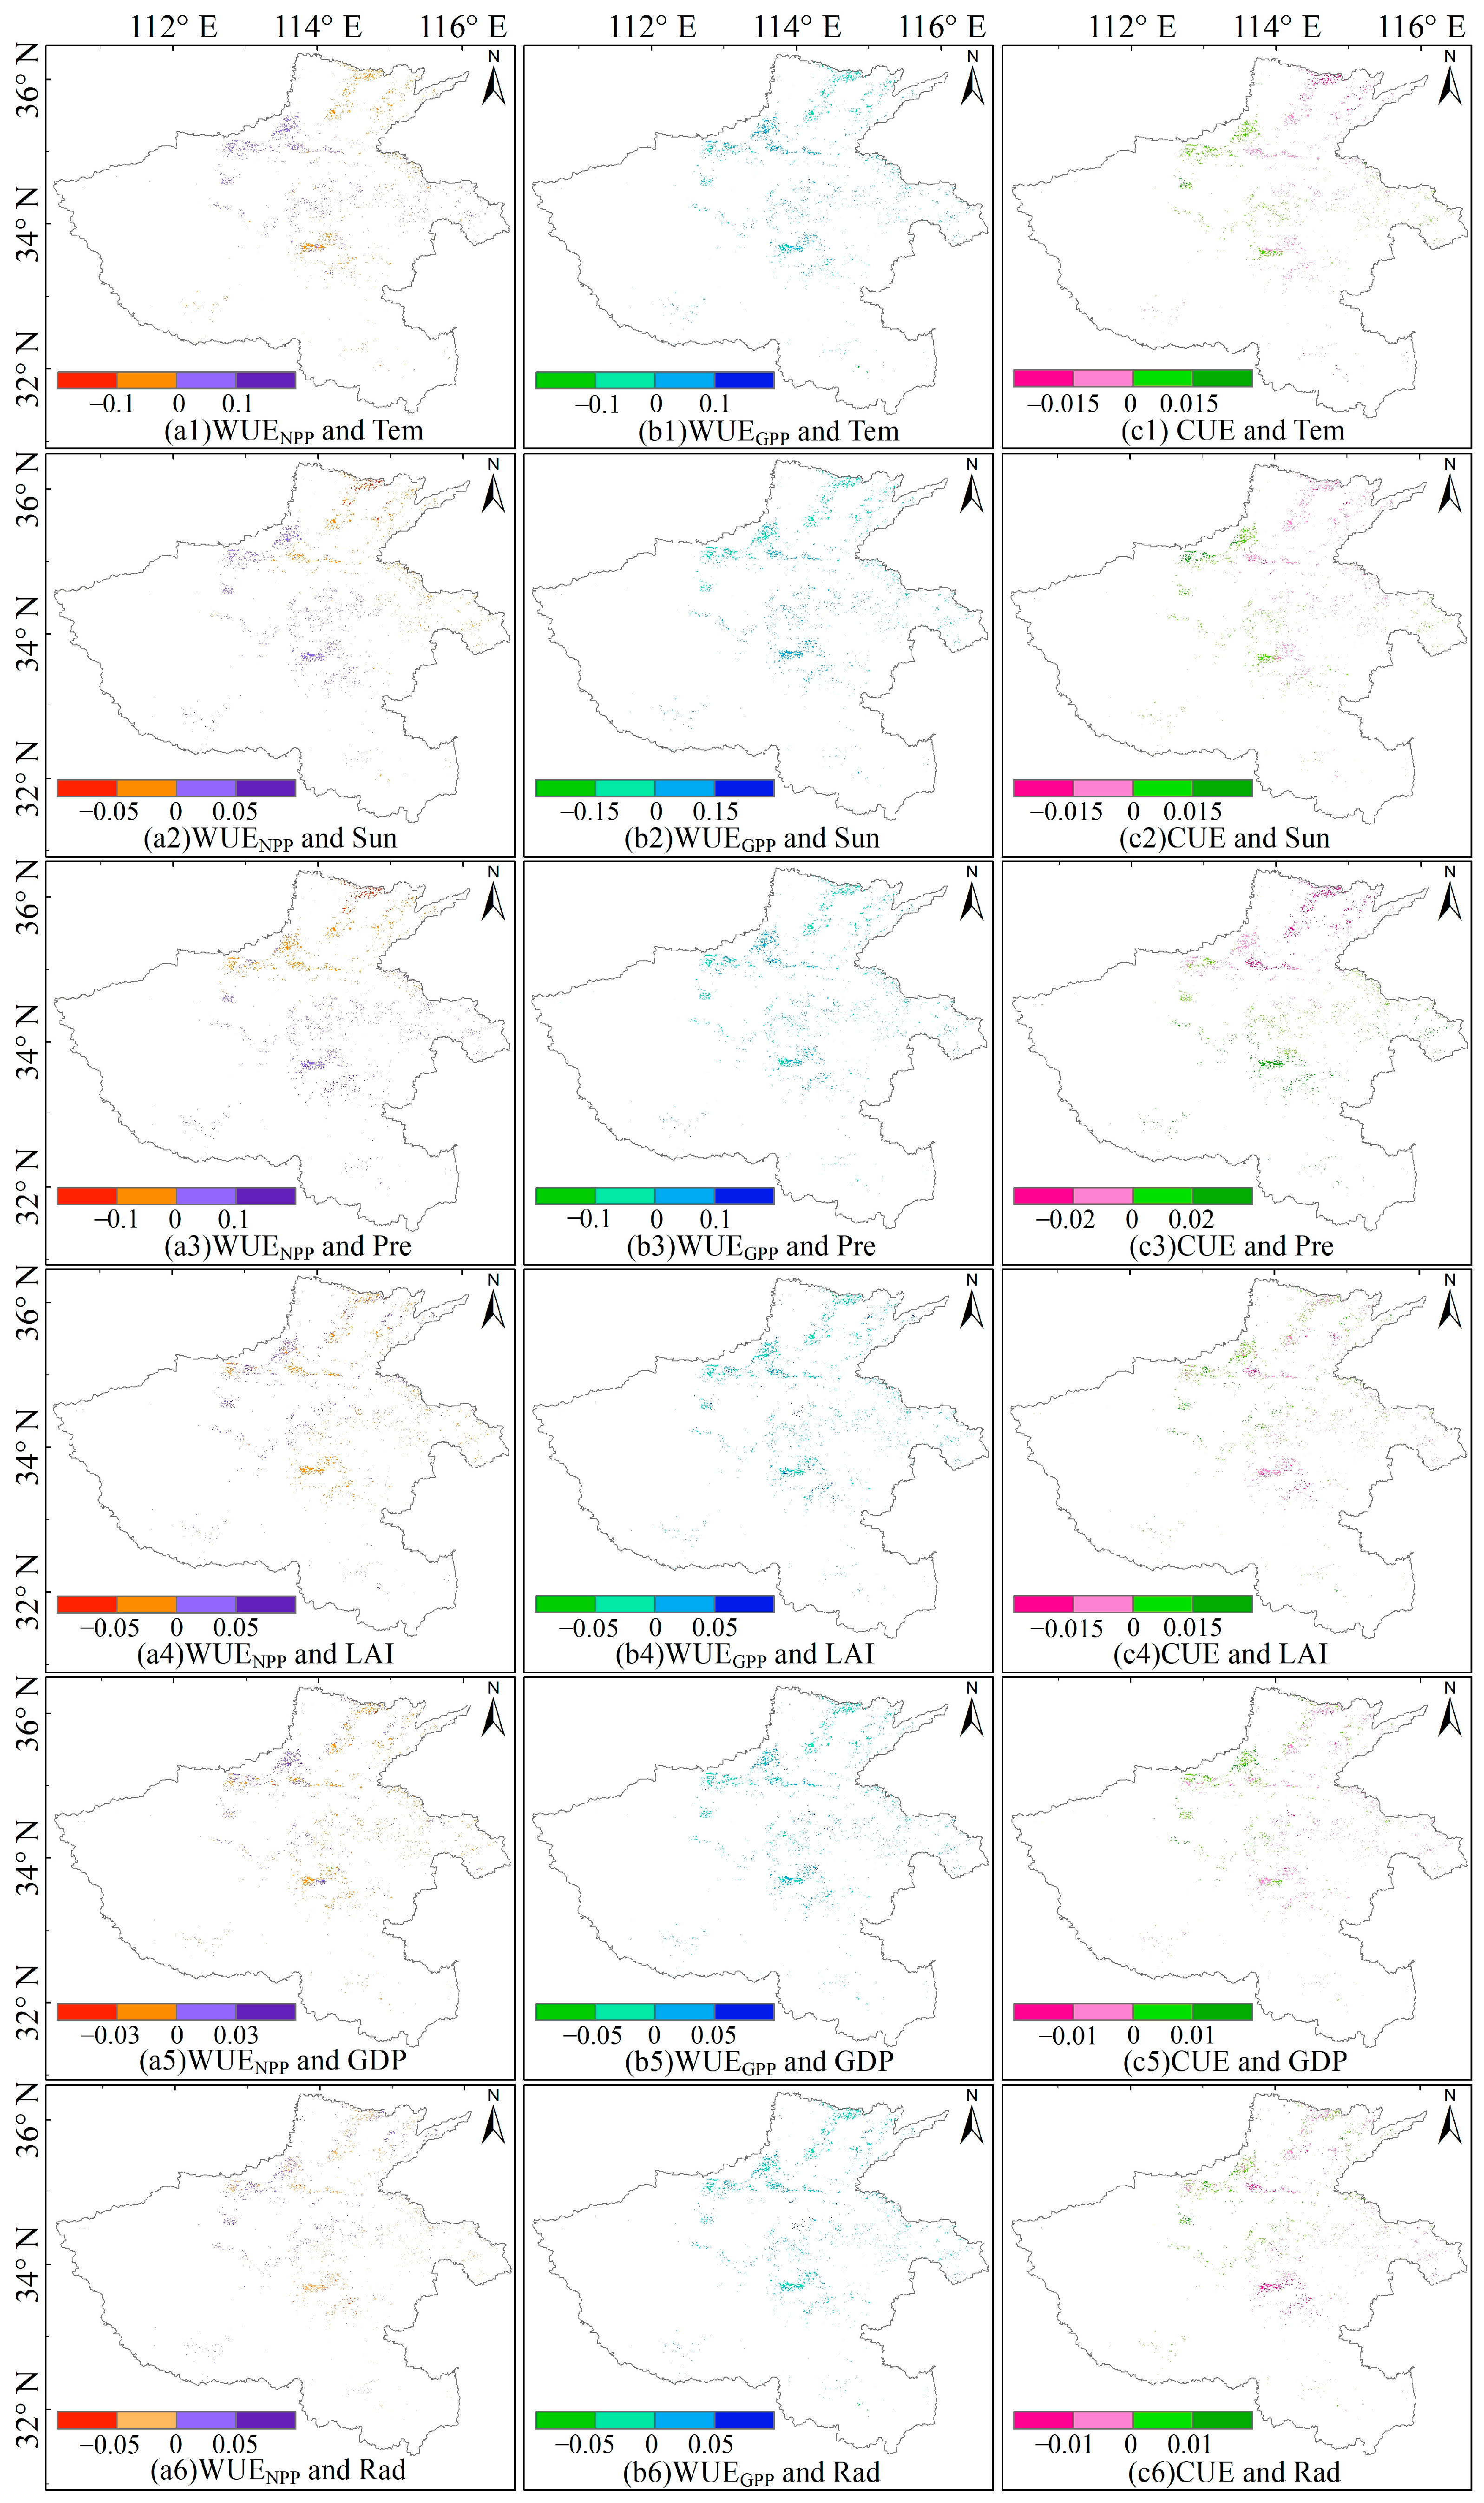
3.3.1. Spatial Distribution of SHAP Values of Driving Factors and Irrigated Cropland CWUE

The spatial distribution of SHAP values of drivers and irrigated cropland CWUE in Henan Province is illustrated in Figure 9. The statistical table of SHAP values for the influence of driving factors on CWUE in irrigated cropland is shown in Table 4. The positive effects of the GDP and photosynthetically active radiation absorption ratio on changes in the irrigated cropland WUENPP accounted for 60.63% and 60.72% of the area, respectively, predominantly in northwestern Henan. Temperature had a negative impact on the WUENPP over 51.53% of the area, mainly in the northern region, with the spatial influence of the LAI on the WUENPP showing a similar pattern. In central and northern Henan, temperature generally exerted negative effects on the WUEGPP, while other drivers had mostly positive impacts. Specifically, the positive influence of the LAI and GDP on the irrigated cropland WUEGPP accounted for 62.52% and 55.77% of the area, respectively. Additionally, the photosynthetically active radiation absorption ratio data positively affected the WUEGPP across approximately 61.20% of the irrigated cropland, with the strongest effects in the northern part of the province. For CUE, positive effects of the temperature, sunlight, GDP, and photosynthetically active radiation absorption ratio covered about 53.11%, 53.46%, 56.31%, and 57.62% of the irrigated cropland area, respectively, largely concentrated in northern Henan.
The SHAP summary of the drivers of irrigated cropland versus CWUE in Henan Province from 2001 to 2019, along with the relative importance of each driver, is presented in Figure 10. Sunlight was identified as the primary determinant of the WUEGPP in irrigated cropland, while precipitation played a secondary yet significant role in modulating this relationship (Figure 10(a1,a2)). Precipitation emerged as the dominant driver for the WUENPP and CUE, with sunlight and the LAI serving as secondary determinants for the WUENPP and CUE, respectively. In irrigated cropland, a larger SHAP value magnitude corresponds to a stronger influence on CWUE. Among all factors, precipitation had the greatest impact on CWUE, whereas the GDP had the least influence on the irrigated cropland CWUE.

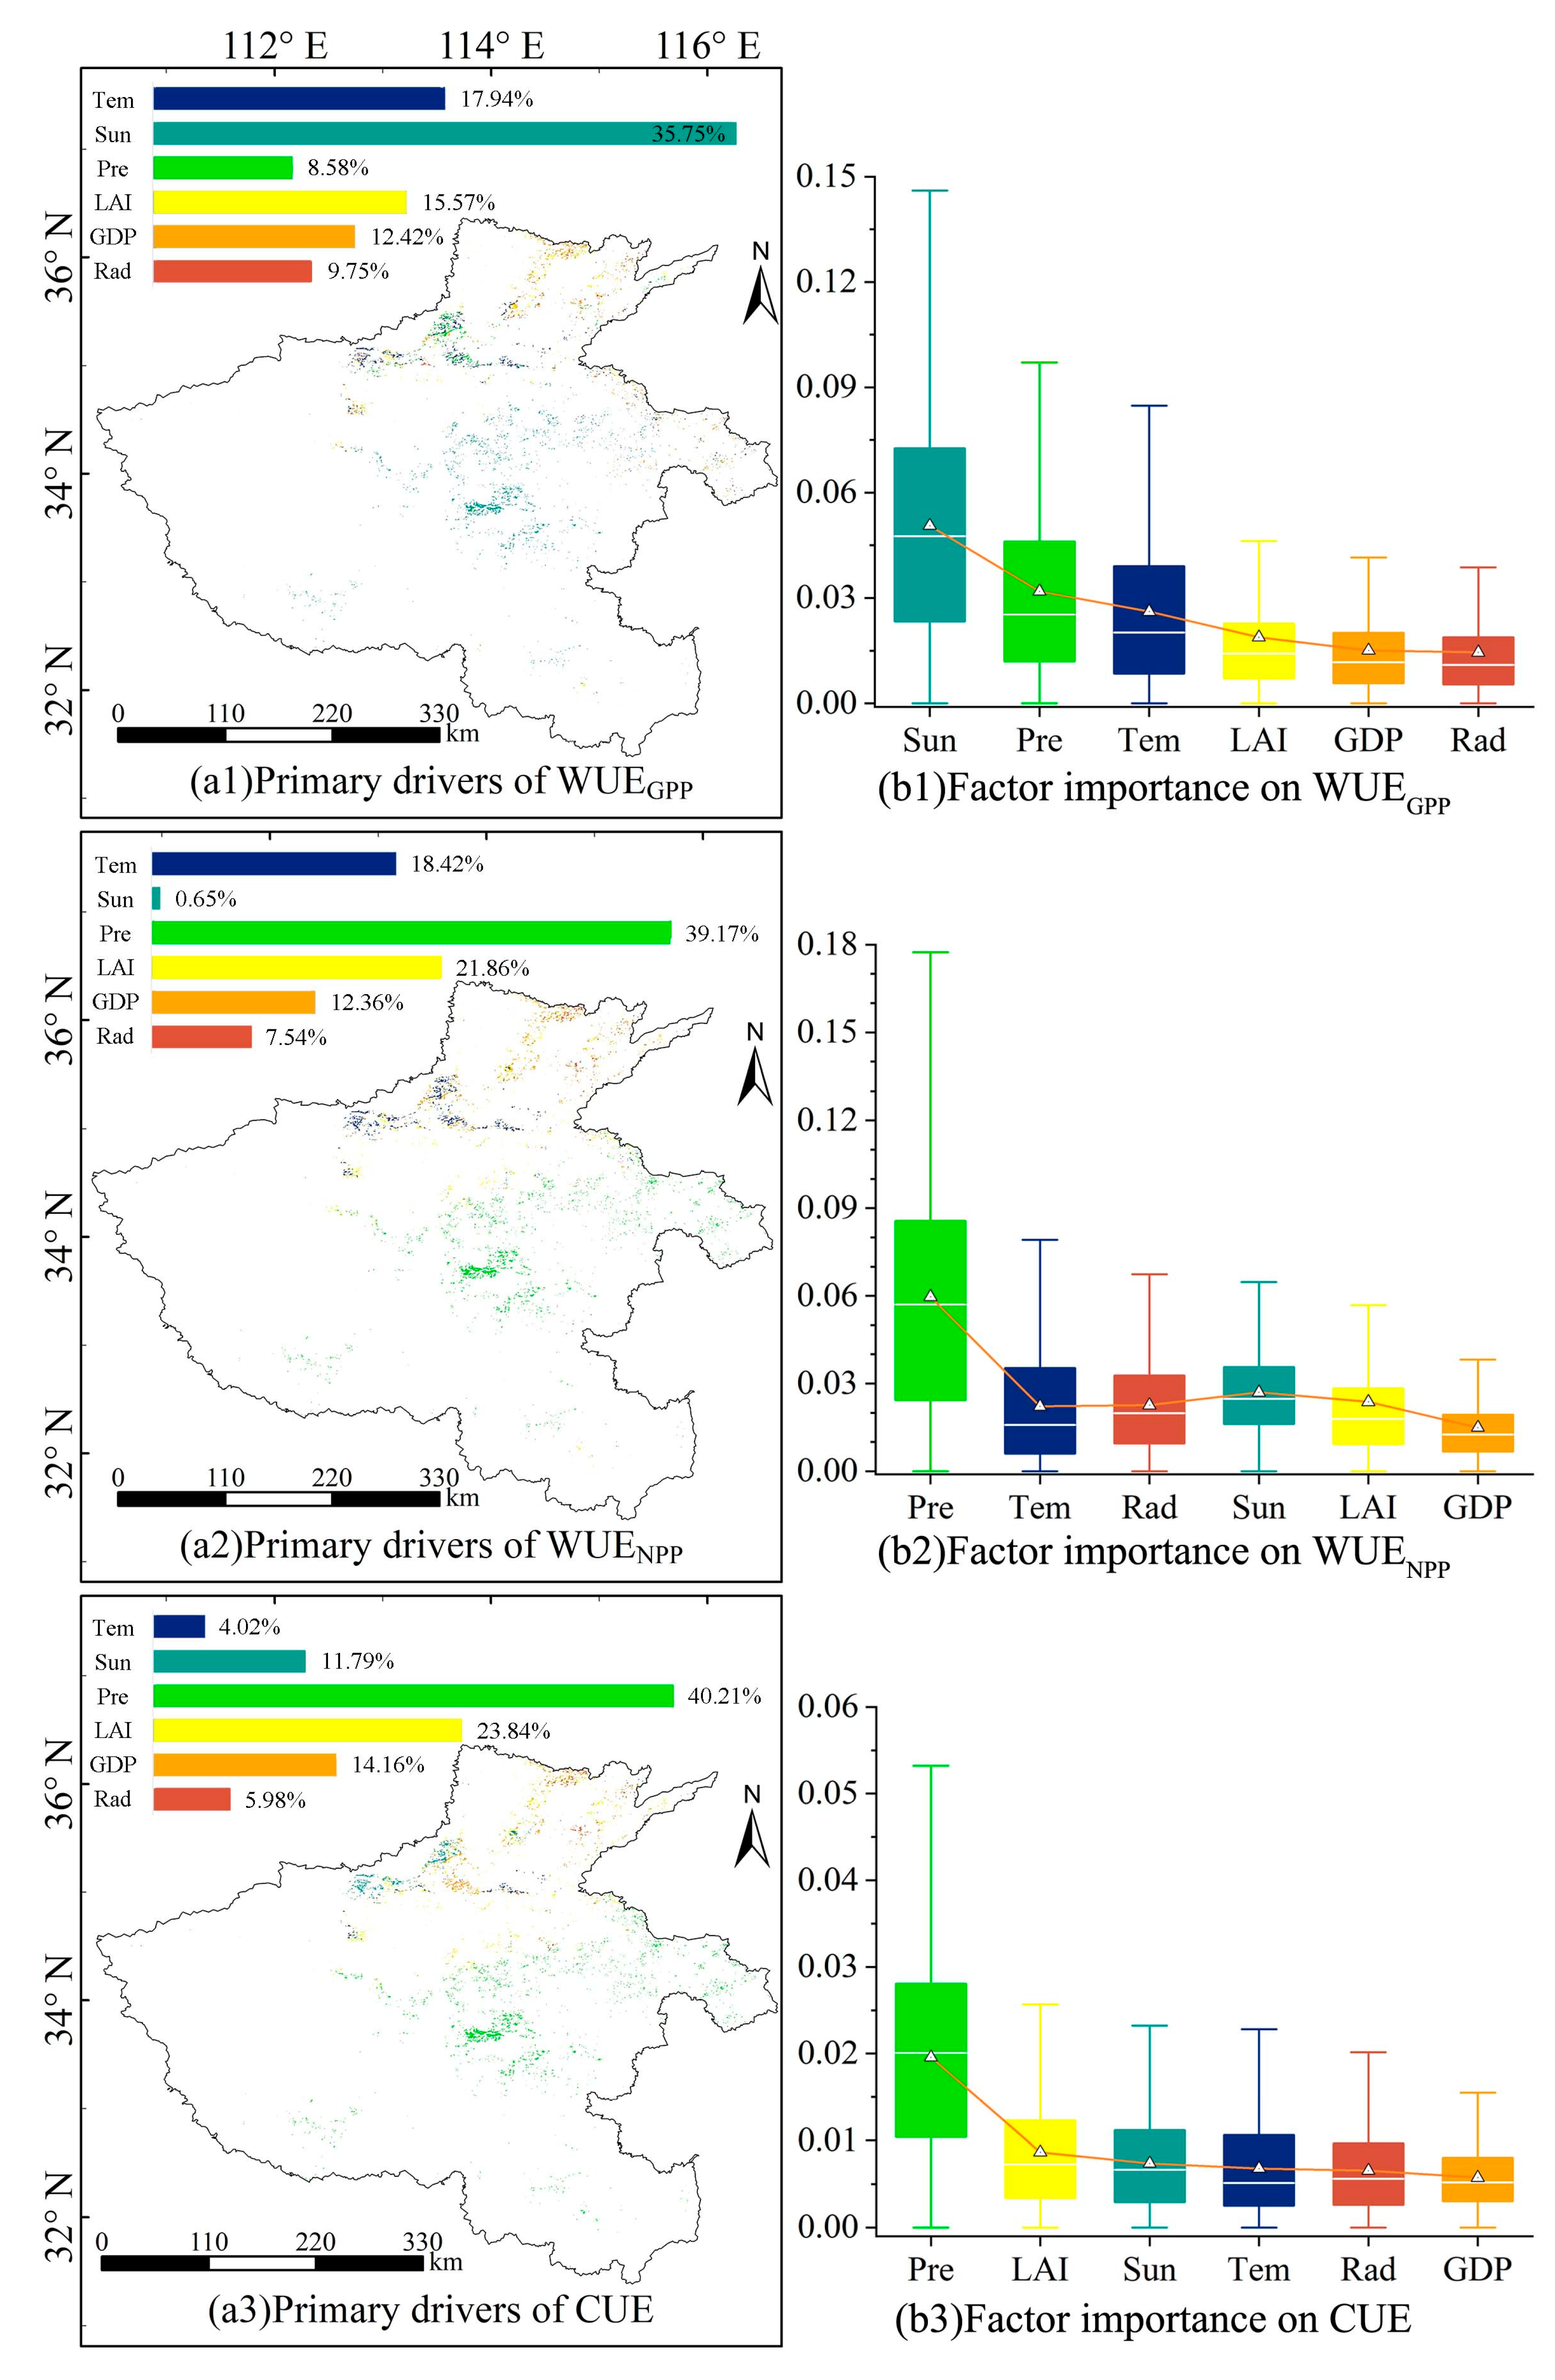
3.3.2. Dominant Factors and Spatial Distribution of CWUE in Irrigated Cropland

The dominant factors driving spatiotemporal changes in CWUE and their spatial distribution in irrigated cropland across Henan Province from 2001 to 2019 are illustrated in Figure 11. Sunlight is the primary determinant influencing the irrigated cropland WUEGPP, with an importance index of 0.05 g   C   kg 2   mm 1 yr 1 , predominantly distributed in the central-southern and northern parts of Henan, covering about 35.75% of the irrigated cropland area (Figure 11(a1,a2)). Precipitation significantly shapes the spatial variation in the WUENPP and CUE, with importance indices of approximately 0.06 g   C   kg 2   mm 1 yr 1 and 0.02, respectively, mainly concentrated in the south-central region and accounting for about 39.17% and 40.21% of the irrigated cropland area. The LAI ranks second in its influence on CUE, contributing around 23.84% of the irrigated cropland area’s variability. The GDP has the least impact on the WUENPP and CUE, playing a dominant role in only 12.36% and 14.16% of the study area, respectively.

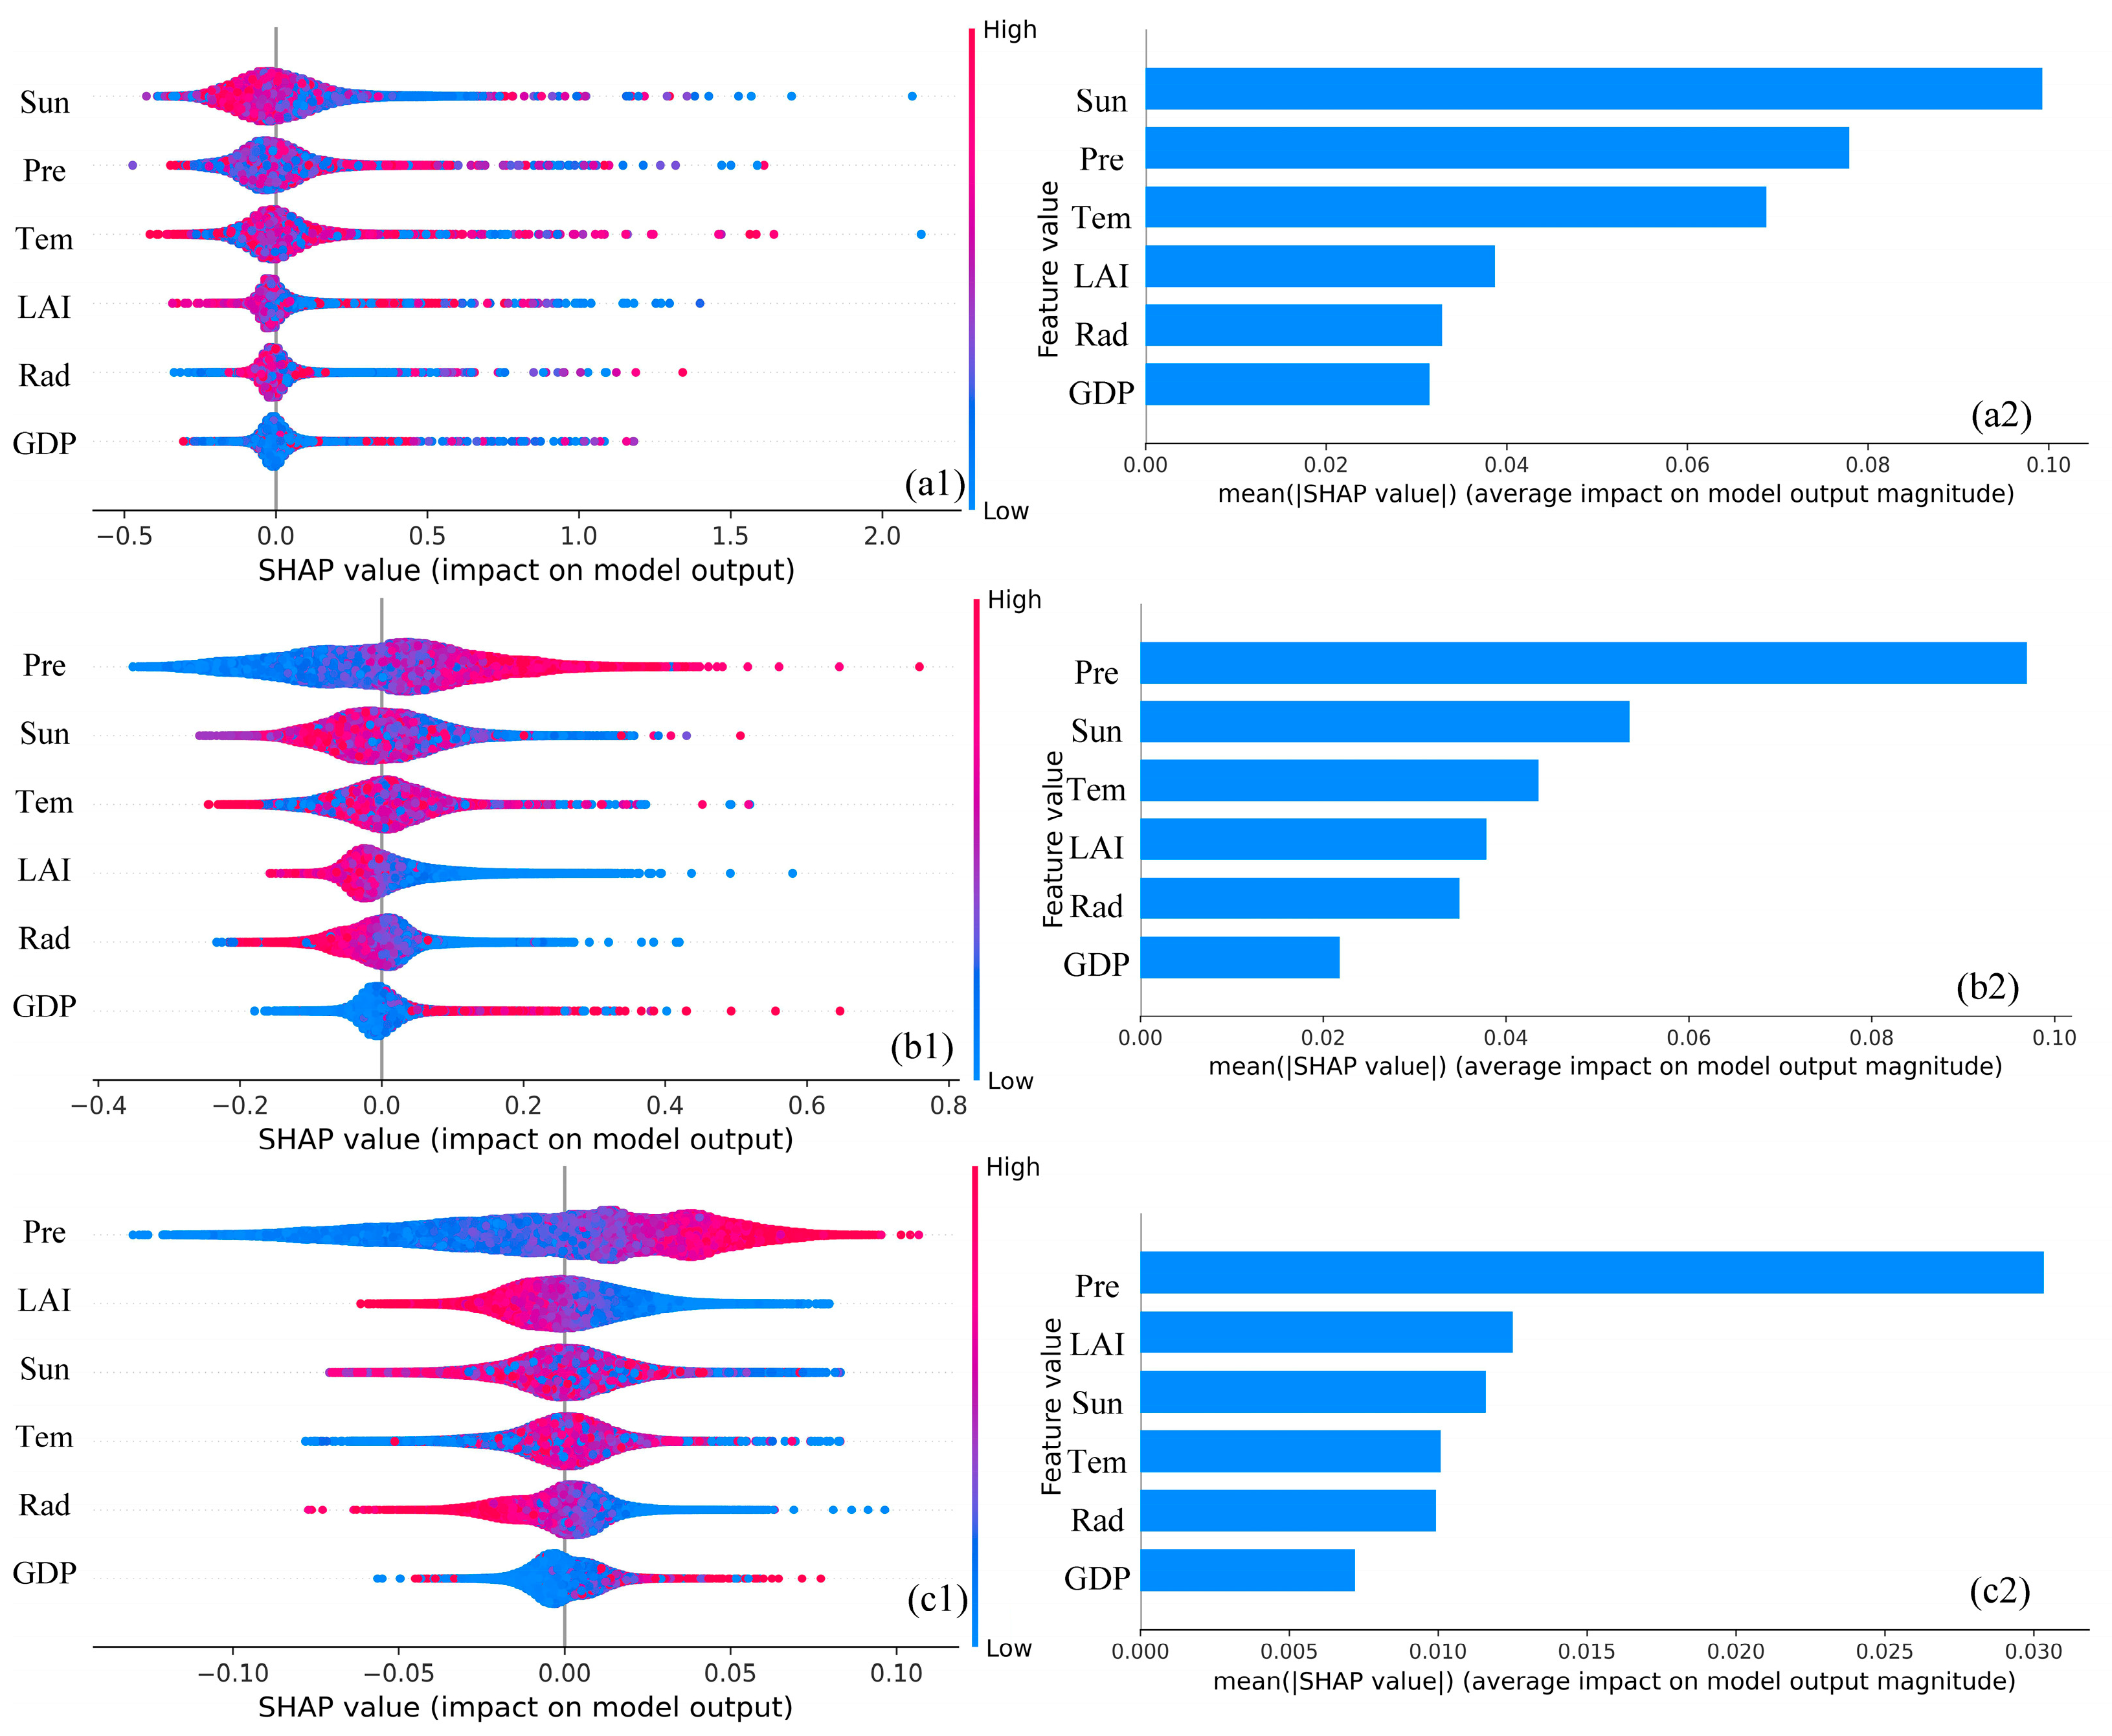
3.3.3. Synergistic Effects of Drivers on Irrigated Cropland CWUE

Figure 12 presents the SHAP dependence of the key drivers affecting irrigated cropland in Henan Province from 2001 to 2019. When the sunlight exposure was low (1400 h < Sun < 1550 h) and precipitation was also high (Pre > 800 mm), SHAP values were negative, indicating that both sunlight and precipitation negatively impacted the irrigated cropland WUEGPP within this range. Conversely, at higher sunlight levels (1550 h < Sun < 2200 h) with varying precipitation, SHAP values remained mostly positive, suggesting a generally positive influence of sunlight and precipitation on the WUEGPP (Figure 12(a4)). For the photosynthetically active radiation absorption ratio (Rad), values in the lower range (0.25 < Rad < 0.35) combined with high precipitation (Pre > 800 mm) corresponded to negative SHAP values, indicating a negative effect on the WUENPP. As the Rad increased and precipitation decreased, SHAP values declined further, reflecting a growing negative impact (Figure 12(b3)). Similarly, as the LAI and precipitation increased, SHAP values for CUE showed a declining trend. This value gradually decreases from its positive peak to zero and then further declines below zero to its minimum negative value. This indicates that the influence of the LAI and precipitation on the CUE of irrigated cropland shifts from a gradually weakening positive effect to a progressively intensifying negative effect (Figure 12(c2)). Initially, moderate increases in the LAI and precipitation improved CUE by easing light and water limitations, thereby enhancing photosynthetic carbon assimilation. However, beyond optimal thresholds, an excessive LAI caused leaf shading, increasing respiratory carbon loss and reducing the nutrient allocation per leaf area. At the same time, excessive precipitation led to soil anoxia, impairing the root respiration and nutrient uptake, while promoting nutrient leaching and unproductive soil evaporation. Together, these factors transformed the LAI and precipitation from facilitators of carbon assimilation into metabolic stressors, ultimately reducing CUE.

4. Discussion

4.1. Spatiotemporal Variations in Cropland CWUE

In this study, we analyzed the spatiotemporal distribution of cropland CWUE in Henan Province from 2001 to 2019. Elevated multi-year average values of the CUE and WUENPP were predominantly observed in the western region, while lower values were concentrated in the northeastern area. These spatial patterns align with the distributions and trends of the cropland WUENPP and CUE reported by Liu et al. [53] and Chuai et al. [54]. The multi-year average values of the WUEGPP were mainly higher in the central and southwestern regions, which is consistent with previous studies on the spatial distribution and dynamics of the WUEGPP, GPP, and ET in Henan Province [55]. Additionally, the present study found that cropland areas exhibiting significant increases in both the GPP and ET constituted the majority of the total cropland, corroborating the results of Li et al. [36].
Chen et al. [56] reported that the GPP values of cropland in Asian terrestrial ecosystems ground monitoring stations ranged around 1209.3 ± 670.5 g   C   m 2   y 1 , within which the multi-year mean GPP value of 861.23 g   C   m 2   y 1 observed in Henan Province in this study falls. Wang et al. [34] monitored WUEGPP values at the Jinzhou Agricultural Ecosystem Field Experiment Station in Shenyang, reporting a range of 2.1–3.6 g   C   m 2   mm 1 and a multi-year mean of 2.8 g   C   m 2   mm 1 , closely matching the multi-year mean WUEGPP of 2.93 g   C   m 2   mm 1 found for cropland in Henan Province here. Xiao et al. [57] observed ET processes at the Duolun cropland site, recording an ET value of 327.6 mm   y 1 , which is very close to the multi-year average ET of 348.05 mm   y 1 reported for Henan Province cropland in this study. Additionally, Wang et al. [32] systematically monitored the annual mean WUEGPP values of four crops, soybean (1.92 ± 0.52 g   C   m 2   mm 1 ), corn (2.48 ± 0.69 g   C   m 2   mm 1 ), winter wheat (2.00 ± 0.39 g   C   m 2   mm 1 ), and rice (1.88 ± 0.63 g   C   m 2   mm 1 ), all of which closely align with the multi-year average WUEGPP value of 2.8 g   C   m 2   mm 1 found in this study.

4.2. Impact of Irrigation on Cropland CWUE

The spatiotemporal trends of the cropland WUEGPP, GPP, and ET across Henan Province from 2001 to 2019 largely correspond with the global patterns of these variables in cropland from 2000 to 2014, as reported by Ai et al. [58]. Human activities, such as changes in irrigation management, significantly influence the ecosystem GPP, NPP, ET, and WUE [20,35]. In Henan Province, the WUEGPP and WUENPP of non-irrigated cropland are higher than those of irrigated cropland, which is consistent with previous findings indicating that when differences in the NPP, GPP, and ET between irrigated and non-irrigated cropland are minimal, WUE tends to be lower in irrigated fields [59,60]. This pattern can be explained by water management during vegetation growth: while moderate supplemental irrigation can quickly enhance WUE in the short term, excessive irrigation leads to decreased WUE as ET rises sharply and the marginal gains in carbon assimilation diminish [61]. Additionally, ET values are higher in irrigated cropland because irrigation increases soil moisture, which promotes the crop LAI and photosynthetic activity, thereby enhancing water ET [43,62].

4.3. Impact of Drivers on CWUE

The driving mechanism of irrigated cropland CWUE in Henan Province, a key national grain production area, is vital for regional agricultural sustainability. In this study, precipitation has a significant positive impact on the irrigated cropland WUEGPP, covering an area of approximately 58.67% of the total irrigated cropland area in Henan Province. This finding aligns closely with Ai et al. [58], who examined the drivers of interannual WUEGPP variations across cropland in China. Although precipitation exerts a broad influence at the regional scale, unique irrigation management practices in Henan Province likely amplify the regulation of natural factors on cropland CWUE. This interaction between natural and human factors becomes more complex at seasonal scales. From January to May, frequent irrigation maintains a sufficient soil moisture, thereby increasing both the ET and GPP. In this period, solar radiation is the primary factor controlling fluctuations in these two variables. The ample water supply keeps vegetation stomata open, significantly raising canopy transpiration, while photosynthetic carbon assimilation becomes limited due to the saturation of the light-use efficiency. This imbalance results in an inverse trend in the WUEGPP [35].

4.4. Limitations and Perspectives of This Study

While this study quantitatively assessed the impact of irrigation on cropland CWUE, it did not comprehensively explore the synergistic mechanisms among irrigation policies, management practices, and natural environmental factors. For instance, traditional irrigation methods commonly used in Henan Province often result in substantial water resource inefficiencies. However, this study failed to quantify the dynamic coupling between anthropogenic management practices and environmental variables, such as soil organic matter and fast-acting nutrients. Future research should integrate high-resolution remote sensing data, ecological process models, and socio-economic data through multidisciplinary approaches. This integration would support the development of a dual-driven CWUE response model that captures the interactions between natural and human factors. Such a model would enable multi-source data fusion and the coordinated optimization of carbon–water processes, offering an evidence-based pathway to support Henan Province’s “storing grain in the ground” strategy—one that simultaneously promotes water conservation, carbon sequestration, and stable yields.

5. Conclusions

Based on the findings of this study, we conclude the following: First, elevated multi-year average values of the cropland CUE and WUENPP are mainly concentrated in western Henan Province, whereas higher WUEGPP values are primarily found in the central and southwestern regions; the proportion of cropland exhibiting declining trends in the CUE, WUENPP, and WUEGPP accounted for 78.26%, 82.13%, and 76.77% in the overall cropland area, with annual decreases of 0.0017 a 1 , 0.009 g   C   m 2   mm 1 a 1 , and 0.01 g   C   m 2   mm 1 a 1 , respectively. Second, non-irrigated cropland consistently exhibited higher CWUE values compared to irrigated cropland. The multi-year average values of the irrigated cropland WUEGPP, WUENPP, and CUE were 2.51 g   C   m 2   mm 1 , 1.08 g   C   m 2   mm 1 , and 0.43, respectively. Third, sunlight emerged as the primary driver of the irrigated cropland WUEGPP, while precipitation played a major role in influencing the WUENPP and irrigated cropland CUE. In contrast, the GDP has the least effect on irrigated cropland CWUE. Finally, as the LAI and precipitation increased, SHAP values for irrigated cropland CUE declined from positive peaks to zero and then to negative minima, indicating a transition from weakening positive effects to strengthening negative impacts.
This study revealed the spatiotemporal dynamics of cropland CWUE in Henan Province, offering a scientific basis for regional agricultural optimization. It is recommended to establish ecological agricultural reserves in the high-value western regions to sustain efficient water use while promoting drip irrigation in the central-eastern low-value areas to counter the observed annual decline in the WUEGPP (0.01 g   C   m 2   mm 1 a 1 ). CWUE was found to be significantly higher in non-irrigated cropland compared to irrigated areas, suggesting the potential value of piloting a hybrid model that combines rainfed dry farming with precision supplemental irrigation. These findings provide practical support for the development of a 5 million mu water-saving irrigation demonstration zone in the Yellow River Basin, contributing to food security and resource conservation. Future research will focus on constructing a multi-scale technical system by integrating Sentinel-6 data with optimized XGBoost modeling, aiming to develop a meter-scale cropland CWUE assessment framework that offers precise guidance for advancing water-efficient agricultural technologies.

Author Contributions

Conceptualization, G.L.; Data curation, Y.C.; Formal analysis, G.L., F.Y. and L.H.; Funding acquisition, G.L. and F.Y.; Methodology, G.L., Z.Y., L.H. and Y.L.; Resources, Z.Y.; Validation, T.Q., Y.L. and K.Z.; Visualization, H.G.; Writing—original draft, G.L., Z.Y., T.Q. and Y.C.; Writing—review and editing, H.G., Y.L. and K.Z. All authors have read and agreed to the published version of the manuscript.

Funding

This research has gained substantial support from the Postdoctoral Fellowship Program of CPSF (GZC20230732), the Major Science and Technology Projects in Gansu Province (24ZDGE002), and the Science and Technology Research Projects in Henan Province (242102321167, 252102320300).

Data Availability Statement

The raw data supporting the conclusions of this article will be made available by the authors on request.

Conflicts of Interest

The authors declare no conflicts of interest.

References

  1. Omar, P.J.; Gupta, P.; Wang, Q. Exploring the rise of AI-based smart water management systems. AQUA—Water Infrastruct. Ecosyst. Soc. 2023, 72, iii–iv. [Google Scholar] [CrossRef]
  2. Sinclair, T.R.; Rufty, T.W. Nitrogen and water resources commonly limit crop yield increases, not necessarily plant genetics. Glob. Food Secur.-Agric. Policy Econ. Environ. 2012, 1, 94–98. [Google Scholar] [CrossRef]
  3. Song, Y.; Guo, Y.H.; Li, S.J.; Li, W.Y.P.; Jin, X.L. Elevated CO2 concentrations contribute to a closer relationship between vegetation growth and water availability in the Northern Hemisphere mid-latitudes. Environ. Res. Lett. 2024, 19, 084013. [Google Scholar] [CrossRef]
  4. Zeleke, K.T.; Nendel, C. Analysis of options for increasing wheat (Triticum aestivum L.) yield in south-eastern Australia: The role of irrigation, cultivar choice and time of sowing. Agric. Water Manag. 2016, 166, 139–148. [Google Scholar] [CrossRef]
  5. Li, J.P.; Xu, X.X.; Lin, G.; Wang, Y.Q.; Liu, Y.; Zhang, M.; Zhou, J.Y.; Wang, Z.M.; Zhang, Y.H. Micro-irrigation improves grain yield and resource use efficiency by co-locating the roots and N-fertilizer distribution of winter wheat in the North China Plain. Sci. Total Environ. 2018, 643, 367–377. [Google Scholar] [CrossRef] [PubMed]
  6. Stagno, F.; Brambilla, M.; Roccuzzo, G.; Assirelli, A. Water Use Efficiency in a Deficit-Irrigated Orange Orchard. Horticulturae 2024, 10, 498. [Google Scholar] [CrossRef]
  7. Breckner, M.; Sunde, U. Temperature extremes, global warming and armed conflict: New insights from high resolution data. World Dev. 2019, 123, 104624. [Google Scholar] [CrossRef]
  8. Siddik, M.A.; Zhang, J.; Chen, J.; Qian, H.Y.; Jiang, Y.; Raheem, A.K.; Deng, A.X.; Song, Z.W.; Zheng, C.Y.; Zhang, W.J. Responses of indica rice yield and quality to extreme high and low temperatures during the reproductive period. Eur. J. Agron. 2019, 106, 30–38. [Google Scholar] [CrossRef]
  9. Zhao, C.; Liu, B.; Piao, S.; Wang, X.; Lobell, D.B.; Huang, Y.; Huang, M.; Yao, Y.; Bassu, S.; Ciais, P.; et al. Temperature increase reduces global yields of major crops in four independent estimates. Proc. Natl. Acad. Sci. USA 2017, 114, 9326–9331. [Google Scholar] [CrossRef] [PubMed]
  10. Li, Z.; Cao, T.T.; Sun, Z.Y. Spatial-Temporal Pattern and Driving Factors of Carbon Emission Intensity of Main Crops in Henan Province. Sustainability 2022, 14, 16569. [Google Scholar] [CrossRef]
  11. Chen, J.D.; Tian, H.W.; Huang, J.; Zhang, J.C.; Zhang, F.M. Climate-driven Yield Variability for Winter Wheat in Henan Province, North China and its Relation to Large-scale Atmospheric Circulation Indices. Int. J. Plant Prod. 2021, 15, 79–91. [Google Scholar] [CrossRef]
  12. Gao, J.; Wang, L.C. Embedding spatiotemporal changes in carbon storage into urban agglomeration ecosystem management—A case study of the Yangtze River Delta, China. J. Clean. Prod. 2019, 237, 117764. [Google Scholar] [CrossRef]
  13. Abidi, A.; Soltani, A.; Zeinali, E. Identifying plant traits to increase wheat yield under irrigated conditions. Heliyon 2024, 10, e31734. [Google Scholar] [CrossRef]
  14. Hao, D.C.; Su, X.Y.; Xie, H.T.; Bao, X.L.; Zhang, X.D.; Wang, L.F. Effects of tillage patterns and stover mulching on N2O production, nitrogen cycling genes and microbial dynamics in black soil. J. Environ. Manag. 2023, 345, 118458. [Google Scholar] [CrossRef]
  15. Migliavacca, M.; Musavi, T.; Mahecha, M.D.; Nelson, J.A.; Knauer, J.; Baldocchi, D.D.; Perez-Priego, O.; Christiansen, R.; Peters, J.; Anderson, K.; et al. The three major axes of terrestrial ecosystem function. Nature 2021, 598, 468–472. [Google Scholar] [CrossRef] [PubMed]
  16. Hua, L.; Zhang, F.; Sun, R.; Yu, X.; Ma, H. Synergy of carbon and water use efficiencies in the Huai River Basin. Ecol. Indic. 2024, 160, 111874. [Google Scholar] [CrossRef]
  17. Wang, Y.; Gao, G.; Huang, Y.; Wang, Z.; Fu, B. Ecosystem water use efficiency and carbon use efficiency respond oppositely to vegetation greening in China’s Loess Plateau. Sci. Total Environ. 2025, 964, 178575. [Google Scholar] [CrossRef]
  18. Cai, X.; Li, L.; Fisher, J.B.; Zeng, Z.; Zhou, S.; Tan, X.; Liu, B.; Chen, X. The responses of ecosystem water use efficiency to CO2, nitrogen deposition, and climatic drivers across China. J. Hydrol. 2023, 622, 129696. [Google Scholar] [CrossRef]
  19. Wang, D.; Qin, W.; Xu, H.; Shan, Z.; Yu, X. Assessing the response of water use efficiency to climate variability and land-use changes in the mountainous area of North China. For. Ecol. Manag. 2023, 530, 120780. [Google Scholar] [CrossRef]
  20. Xing, W.; Yang, L.; Wang, W.; Yu, Z.; Shao, Q.; Xu, S.; Fu, J. Environmental controls on carbon and water fluxes of a wheat-maize rotation cropland over the Huaibei Plain of China. Agric. Water Manag. 2023, 283, 108310. [Google Scholar] [CrossRef]
  21. Chen, Z.; Yu, G. Spatial variations and controls of carbon use efficiency in China’s terrestrial ecosystems. Sci. Rep. 2019, 9, 19516. [Google Scholar] [CrossRef] [PubMed]
  22. Chakraborty, A.; Sekhar, M.; Rao, L. The fate of vegetation carbon stocks of India: Insights from a remote-sensed evaluation of carbon use efficiency. Ecol. Inform. 2023, 78, 102374. [Google Scholar] [CrossRef]
  23. Simone, F.; Christoforos, P.; Jakob, Z.; Sebastian, L. Modelling carbon sources and sinks in terrestrial vegetation. New Phytol. 2019, 221, 652–668. [Google Scholar]
  24. Xiao, B.; Bai, X.; Tan, Q.; Li, Y.; Zhao, C.; Luo, G.; Wu, L.; Chen, F.; Li, C.; Ran, C.; et al. Nitrogen Deposition Enhances the Positive Contribution of CO2 Fertilization to China’s Carbon and Water Use Efficiencies. Land 2023, 12, 413. [Google Scholar] [CrossRef]
  25. Xiao, B.; Bai, X.; Zhao, C.; Tan, Q.; Li, Y.; Luo, G.; Wu, L.; Chen, F.; Li, C.; Ran, C.; et al. Responses of carbon and water use efficiencies to climate and land use changes in China’s karst areas. J. Hydrol. 2023, 617, 128968. [Google Scholar] [CrossRef]
  26. Chen, Z.; Yu, G.; Wang, Q. Magnitude, pattern and controls of carbon flux and carbon use efficiency in China’s typical forests. Glob. Planet. Change 2019, 172, 464–473. [Google Scholar] [CrossRef]
  27. Gang, C.C.; Wang, Z.N.; You, Y.F.; Liu, Y.; Xu, R.T.; Bian, Z.H.; Pan, N.Q.; Gao, X.R.; Chen, M.X.; Zhang, M. Divergent responses of terrestrial carbon use efficiency to climate variation from 2000 to 2018. Glob. Planet. Change 2022, 208, 103709. [Google Scholar] [CrossRef]
  28. Wei, W.; Li, H.; Wang, B.; Zhang, K. Rain- and water-use efficiencies of a shrub ecosystem and its resilience to drought in the Central Asia region during 2000–2014. Glob. Ecol. Conserv. 2019, 17, e00595. [Google Scholar] [CrossRef]
  29. Kim, D.; Baik, J.; Umair, M.; Choi, M. Water use efficiency in terrestrial ecosystem over East Asia: Effects of climate regimes and land cover types. Sci. Total Environ. 2021, 773, 145519. [Google Scholar] [CrossRef]
  30. Li, X.H.; Zha, T.S.; Liu, P.; Tian, Y.; Jia, X.; Bourque, C.P.A.; Jin, C.; Yang, R.Z.; Jiang, Y.; Hao, S.R. Multi-year trend and interannual variability in soil respiration measurements collected in an urban forest ecosystem in Beijing, China. Agric. For. Meteorol. 2022, 316, 108877. [Google Scholar] [CrossRef]
  31. Sun, Y.; Piao, S.; Huang, M.; Ciais, P.; Zeng, Z.; Cheng, L.; Li, X.; Zhang, X.; Mao, J.; Peng, S.; et al. Global patterns and climate drivers of water-use efficiency in terrestrial ecosystems deduced from satellite-based datasets and carbon cycle models. Glob. Ecol. Biogeogr. 2016, 25, 311–323. [Google Scholar] [CrossRef]
  32. Wang, T.; Tang, X.; Zheng, C.; Gu, Q.; Wei, J.; Ma, M. Differences in ecosystem water-use efficiency among the typical croplands. Agric. Water Manag. 2018, 209, 142–150. [Google Scholar] [CrossRef]
  33. Shen, Y.; Zhang, Y.; Scanlon, B.R.; Lei, H.; Yang, D.; Yang, F. Energy/water budgets and productivity of the typical croplands irrigated with groundwater and surface water in the North China Plain. Agric. For. Meteorol. 2013, 181, 133–142. [Google Scholar] [CrossRef]
  34. Wang, Y.; Zhou, L.; Ping, X.; Jia, Q.; Li, R. Ten-year variability and environmental controls of ecosystem water use efficiency in a rainfed maize cropland in Northeast China. Field Crops Res. 2018, 226, 48–55. [Google Scholar] [CrossRef]
  35. Elfarkh, J.; Johansen, K.; El Hajj, M.M.; Almashharawi, S.K.; McCabe, M.F. Evapotranspiration, gross primary productivity and water use efficiency over a high-density olive orchard using ground and satellite based data. Agric. Water Manag. 2023, 287, 108423. [Google Scholar] [CrossRef]
  36. Li, G.C.; Chen, W.; Li, R.R.; Zhang, X.P.; Liu, J.L. Assessing the spatiotemporal dynamics of ecosystem water use efficiency across China and the response to natural and human activities. Ecol. Indic. 2021, 126, 107680. [Google Scholar] [CrossRef]
  37. Zhao, J.; Xu, T.; Xiao, J.; Liu, S.; Mao, K.; Song, L.; Yao, Y.; He, X.; Feng, H. Responses of Water Use Efficiency to Drought in Southwest China. Remote Sens. 2020, 12, 199. [Google Scholar] [CrossRef]
  38. Fang, Q.X.; Ma, L.; Green, T.R.; Yu, Q.; Wang, T.D.; Ahuja, L.R. Water resources and water use efficiency in the North China Plain: Current status and agronomic management options. Agric. Water Manag. 2010, 97, 1102–1116. [Google Scholar] [CrossRef]
  39. Zhang, X.; Chen, S.; Sun, H.; Wang, Y.; Shao, L. Water use efficiency and associated traits in winter wheat cultivars in the North China Plain. Agric. Water Manag. 2010, 97, 1117–1125. [Google Scholar] [CrossRef]
  40. Sun, H.-Y.; Liu, C.-M.; Zhang, X.-Y.; Shen, Y.-J.; Zhang, Y.-Q. Effects of irrigation on water balance, yield and WUE of winter wheat in the North China Plain. Agric. Water Manag. 2006, 85, 211–218. [Google Scholar] [CrossRef]
  41. Shao, L.; Zhang, X.; Hideki, A.; Tsuji, W.; Chen, S. Effects of defoliation on grain yield and water use of winter wheat. J. Agric. Sci. 2010, 148, 191–204. [Google Scholar] [CrossRef]
  42. Li, H.; Liu, H. Climate Change, Farm Irrigation Facilities and Agriculture Total Factor Productivity: Evidence from China. Sustainability 2023, 15, 2889. [Google Scholar] [CrossRef]
  43. Jha, S.K.; Ramatshaba, T.S.; Wang, G.; Liang, Y.; Liu, H.; Gao, Y.; Duan, A. Response of growth, yield and water use efficiency of winter wheat to different irrigation methods and scheduling in North China Plain. Agric. Water Manag. 2019, 217, 292–302. [Google Scholar]
  44. Partridge, T.; Winter, J.; Kendall, A.; Basso, B.; Pei, L.; Hyndman, D. Irrigation benefits outweigh costs in more US croplands by mid-century. Commun. Earth Environ. 2023, 4, 274. [Google Scholar] [CrossRef]
  45. Gao, P.; Xie, Y.; Song, C.; Cheng, C.; Ye, S. Exploring detailed urban-rural development under intersecting population growth and food production scenarios: Trajectories for China’s most populous agricultural province to 2030. J. Geogr. Sci. 2023, 33, 222–244. [Google Scholar] [CrossRef]
  46. Ling, M.; Qi, T.; Li, W.; Yu, L.; Xia, Q. Simulating and predicting the development trends of the water–energy–food–ecology system in Henan Province, China. Ecol. Indic. 2024, 158, 111513. [Google Scholar] [CrossRef]
  47. Wang, A.; Zhang, M.M.; Chen, E.Q.; Zhang, C.; Han, Y.J. Impact of seasonal global land surface temperature (LST) change on gross primary production (GPP) in the early 21st century. Sustain. Cities Soc. 2024, 110, 105572. [Google Scholar] [CrossRef]
  48. Chen, W.; Li, G.; Wang, D.; Yang, Z.; Wang, Z.; Zhang, X.; Peng, B.; Bi, P.; Zhang, F. Influence of the ecosystem conversion process on the carbon and water cycles in different regions of China. Ecol. Indic. 2023, 148, 110040. [Google Scholar] [CrossRef]
  49. Qiu, Y.G.; Zhou, J.; Khandelwal, M.; Yang, H.T.; Yang, P.X.; Li, C.Q. Performance evaluation of hybrid WOA-XGBoost, GWO-XGBoost and BO-XGBoost models to predict blast-induced ground vibration. Eng. Comput. 2022, 38 (Suppl. 5), 4145–4162. [Google Scholar] [CrossRef]
  50. Ding, H.L.; Wang, R.Q.; Chen, T.T.; Sze, N.N.; Chung, H.; Dong, N. A hybrid approach for modeling bicycle crash frequencies: Integrating random forest based SHAP model with random parameter negative binomial regression model. Accid. Anal. Prev. 2024, 208, 107778. [Google Scholar] [CrossRef]
  51. Hu, J.; Li, X. A novel prediction model construction and result interpretation method for slope deformation of deep excavated expansive soil canals. Expert Syst. Appl. 2024, 236, 121326. [Google Scholar] [CrossRef]
  52. Lundberg, S.M.; Erion, G.; Chen, H.; DeGrave, A.; Prutkin, J.M.; Nair, B.; Katz, R.; Himmelfarb, J.; Bansal, N.; Lee, S.I. From local explanations to global understanding with explainable AI for trees. Nat. Mach. Intell. 2020, 2, 56–67. [Google Scholar] [CrossRef] [PubMed]
  53. Liu, Y.; Xiao, J.; Ju, W.; Zhou, Y.; Wang, S.; Wu, X. Water use efficiency of China’s terrestrial ecosystems and responses to drought. Sci. Rep. 2015, 5, 13799. [Google Scholar] [CrossRef] [PubMed]
  54. Chuai, X.; Guo, X.; Zhang, M.; Yuan, Y.; Li, J.; Zhao, R.; Yang, W.; Li, J. Vegetation and climate zones based carbon use efficiency variation and the main determinants analysis in China. Ecol. Indic. 2020, 111, 105967. [Google Scholar] [CrossRef]
  55. Sun, H.; Bai, Y.; Lu, M.; Wang, J.; Tuo, Y.; Yan, D.; Zhang, W. Drivers of the water use efficiency changes in China during 1982-2015. Sci. Total Environ. 2021, 799, 149145. [Google Scholar] [CrossRef]
  56. Chen, Z.; Yu, G.; Ge, J.; Sun, X.; Hirano, T.; Saigusa, N.; Wang, Q.; Zhu, X.; Zhang, Y.; Zhang, J.; et al. Temperature and precipitation control of the spatial variation of terrestrial ecosystem carbon exchange in the Asian region. Agric. For. Meteorol. 2013, 182–183, 266–276. [Google Scholar] [CrossRef]
  57. Xiao, J.; Sun, G.; Chen, J.; Chen, H.; Chen, S.; Dong, G.; Gao, S.; Guo, H.; Guo, J.; Han, S.; et al. Carbon fluxes, evapotranspiration, and water use efficiency of terrestrial ecosystems in China. Agric. For. Meteorol. 2013, 182–183, 76–90. [Google Scholar] [CrossRef]
  58. Ai, Z.; Wang, Q.; Yang, Y.; Manevski, K.; Yi, S.; Zhao, X. Variation of gross primary production, evapotranspiration and water use efficiency for global croplands. Agric. For. Meteorol. 2020, 287, 107935. [Google Scholar] [CrossRef]
  59. Qin, S.; Ding, J.; Ge, X.; Wang, J.; Wang, R.; Zou, J.; Tan, J.; Han, L. Spatio-Temporal Changes in Water Use Efficiency and Its Driving Factors in Central Asia (2001–2021). Remote Sens. 2023, 15, 767. [Google Scholar] [CrossRef]
  60. Yang, S.; Zhang, J.; Wang, J.; Zhang, S.; Bai, Y.; Shi, S.; Cao, D. Spatiotemporal variations of water productivity for cropland and driving factors over China during 2001–2015. Agric. Water Manag. 2021, 262, 107328. [Google Scholar] [CrossRef]
  61. Huang, Y.; Zhang, Z.; Li, Z.; Dai, D.; Li, Y. Evaluation of water use efficiency and optimal irrigation quantity of spring maize in Hetao Irrigation District using the Noah-MP Land Surface Model. Agric. Water Manag. 2022, 264, 107498. [Google Scholar] [CrossRef]
  62. Allen, R.G.; Pereira, L.S.; Raes, D.; Smith, M. Crop Evapotranspiration-Guidelines for Computing Crop Water Requirements; FAO: Rome, Italy, 1998; FAO Irrigation and Drainage Paper 56. [Google Scholar]
Figure 1. An overview of the research area.
Agronomy 15 01500 g001
Figure 2. The working principle of the optimal parameter XGBoost model.
Agronomy 15 01500 g002
Figure 3. Spatial distribution and spatiotemporal change dynamics of cropland CWUE in Henan Province from 2001 to 2019. CUE mean (a), WUENPP mean (b), WUEGPP mean (c), CUE annual mean change dynamics (d), WUENPP annual mean change dynamics (e), and WUEGPP annual mean change dynamics (f).
Agronomy 15 01500 g003
Figure 4. Spatial distribution and spatiotemporal trends of GPP, NPP, and ET in cropland in Henan Province from 2001 to 2019. GPP mean (a), GPP annual mean change trend (d), NPP mean (b), NPP annual mean change trend (e), ET mean (c), and ET annual mean change trend (f).
Agronomy 15 01500 g004
Figure 5. Interannual variation trends of CWUE, GPP, NPP, and ET annual averages of cropland in Henan Province from 2001 to 2019. The annual mean change trends of GPP (a), NPP (b), ET (c), WUEGPP (d), WUENPP (e), and CUE (f).
Agronomy 15 01500 g005
Figure 6. Study area extraction of non-irrigated and irrigated cropland in Henan Province, 2001–2019.
Agronomy 15 01500 g006
Figure 7. Quantitative evaluation of CWUE of irrigated and non-irrigated cropland in Henan Province, 2001–2019.
Agronomy 15 01500 g007
Figure 8. Quantitative evaluation of GPP, NPP, and ET of irrigated and non-irrigated cropland in Henan Province, 2001–2019.
Agronomy 15 01500 g008
Figure 9. Spatial distribution of SHAP values of drivers and CWUE of irrigated cropland in Henan Province: (a1a6) WUENPP, (b1b6) WUEGPP, and (c1c6) CUE, with respect to Tem, Sun, Pre, LAI, GDP, and Rad.
Agronomy 15 01500 g009
Figure 10. The SHAP summary of drivers of irrigated cropland versus CWUE and relative importance plots for each feature in Henan Province, 2001 to 2019. The summary of SHAP values and the graph showing the relative importance of drivers for the WUEGPP (a1,a2); the summary of SHAP values and the plot depicting the relative importance of drivers for the WUENPP (b1,b2); the summary of SHAP values and the plot depicting the relative importance of drivers for CUE (c1,c2).
Agronomy 15 01500 g010
Figure 11. The dominant factors of spatiotemporal changes in CWUE and their spatial distribution in irrigated cropland across Henan Province from 2001 to 2019. The ranking of importance indices of the impact of drivers on irrigated cropland CWUE in Henan Province (a1a3) and dominant factors of spatiotemporal variation in irrigated cropland CWUE and their spatial distribution (b1b3). The histograms in the figure show the area share of every factor serves as the main driving force throughout the research area.
Agronomy 15 01500 g011
Figure 12. A shape-dependent graph of the importance of driving factors of CWUE of irrigated cropland in Henan Province from 2001 to 2019 (the abscissa axis represents the driving factor value, and the ordinate axis represents the SHAP value). The red to blue bars on the right side of the graph indicate the high to low values of precipitation, respectively. Similarly, the reddest points and the bluest points in the figure indicate the highest and lowest precipitation values, respectively. Shape dependency plots of the importance of WUEGPP drivers (a1a5), the importance of WUENPP drivers (b1b5), and the importance of CUE drivers (c1c5).
Agronomy 15 01500 g012
Table 1. Summary of data used in this study.
DatasetUnitTime
Period
Temporal
Resolutions
Spatial
Resolutions
Data Source
GPPgCm−2y−12001–2019500 m8 dayshttps://ladsweb.modaps.eosdis.nasa.gov/
NPPgCm−2y−12001–2019500 m8 dayshttps://ladsweb.modaps.eosdis.nasa.gov/
ETmmy−12001–2019500 m8 dayshttps://glass-product.bnu.edu.cn/introduction/ET.html (accessed on 5 April 2024)
LAIN/A2001–2019500 m8 dayshttps://glass-product.bnu.edu.cn/type.html (accessed on 5 May 2024)
Land useN/A2001–2019500 mannual scalehttps://doi.org/10.5067/MODIS/MCD12Q1.006 (accessed on 8 June 2024)
Temperature°C2001–20191 kmmonthly scalehttps://data.tpdc.ac.cn/
Precipitationmm2001–20191 kmmonthly scalehttps://data.tpdc.ac.cn/
RadN/A2001–20191 km8 dayshttps://www.geodata.cn/
Sunh2001–20191 kmannual scalehttps://www.geodata.cn/
GDPmillion USD/km22001–20191 kmannual scalehttps://doi.org/10.6084/m9.figshare.17004523.v1 (accessed on 10 November 2024)
IrrigationN/A2001–2019500 mannual scalehttps://www.nesdc.org.cn/
DEMm200030 mN/Ahttps://www.gscloud.cn/
Table 2. Optimal hyperparameter details for optimal parameter XGBoost.
CWUEN EstimatorsLearning RateMax DepthSubsampleR2RMSE
CUE4540.116390.89120.87870.0250
WUENPP4230.120690.72430.85470.1042
WUEGPP4230.120690.72430.81220.1869
Table 3. Computer environment information.
ComponentSpecification
Processor12th generation Intel® Core™ i7-12700F (12 cores/20 threads, base frequency 2.10 GHz, RWI up to 4.90 GHz)
Memory:32.0 GB DDR4 (31.8 GB available)
Operating system64-bit Windows (based on x64 architecture)
Parallel
computing
20 logical cores of the processor were fully utilized by setting the
n_jobs = −1 parameter to fully utilize the processor’s 20 logical cores
GPUNVIDIA GeForce RTX, using GPU acceleration
Table 4. The statistical table of SHAP values for the influence of driving factors on the irrigated cropland CWUE.
Impact FactorImpactWUENPPWUEGPPCUE
TemPositive48.47%44.69%53.11%
Negative51.53%55.31%46.89%
SUNPositive45.83%51.23%53.46%
Negative54.17%48.77%46.54%
PrePositive49.99%58.67%49.70%
Negative50.01%41.33%50.30%
LAIPositive56.89%62.52%50.54%
Negative43.11%37.48%49.46%
GDPPositive60.63%55.77%56.31%
Negative39.37%44.23%43.69%
RadPositive60.72%61.20%57.62%
Negative39.28%38.80%42.38%
Disclaimer/Publisher’s Note: The statements, opinions and data contained in all publications are solely those of the individual author(s) and contributor(s) and not of MDPI and/or the editor(s). MDPI and/or the editor(s) disclaim responsibility for any injury to people or property resulting from any ideas, methods, instructions or products referred to in the content.

