Article

Screening Terminal Drought Tolerance in Dry Bean Genotypes and Commercial Bean Cultivars in Chile

1
Department of Plant Production, Faculty of Agronomy, Universidad de Concepción, Chillán 3812120, Chile
2
Department of Plant Production, Instituto de Investigaciones Agropecuarias, INIA Quilamapu, Chillán 3800062, Chile
3
Panhandle Research Extension and Education Center, University of Nebraska, 4502 Avenue I, Scottsbluff, NE 69361, USA
*
Authors to whom correspondence should be addressed.
Agronomy 2025, 15(7), 1499; https://doi.org/10.3390/agronomy15071499
Submission received: 1 May 2025 / Revised: 26 May 2025 / Accepted: 5 June 2025 / Published: 20 June 2025
(This article belongs to the Section Farming Sustainability)

Abstract

:
Drought significantly constrains common bean (Phaseolus vulgaris L.) production worldwide, and as climate change intensifies, projections indicate a subsequent reduction in yield. This study aimed to identify drought-resilient genotypes among twenty common bean lines in Chile under two water regimes: regular irrigation and terminal drought stress. The research was conducted over two seasons in south-central Chile. Drought significantly reduced grain yield (22.7%), aboveground biomass (37%), harvest index (19.5%), the number of grains per pod (61.3%), and hundred-grain weight (10.1%). Genotypes 452, 473, and 483 exhibited minimal yield reductions (<11%) and maintained stable physiological performance, including higher quantum yield of photosystem II and efficient photoprotective mechanisms (increased ΦNPQ) under stress. In contrast, sensitive genotypes like Blanco Español showed marked yield loss (54%) and lower photosynthetic efficiency. Chlorophyll retention emerged as a key trait for identifying high-yielding, drought-tolerant genotypes. Drought also accelerated crop maturation in susceptible genotypes, compromising yield potential. These findings highlight the importance of integrating agronomic, phenological, and physiological traits in breeding programs to develop drought-adapted varieties. The tolerant genotypes offer valuable genetic traits to improve drought resilience and contribute to food security in the face of climate change.

1. Introduction

The common bean is a globally important crop in nutrition and food security, particularly in Latin America and Africa. As the most consumed legume worldwide, it contributes up to 15% of daily caloric intake and 36% of protein intake, making it a staple food source for people worldwide [1,2,3]. Beans also provide an affordable source of essential nutrients, including fiber, vitamins, and minerals, as a low-cost alternative to animal protein [4,5,6,7]. However, climate change has increasingly threatened the cultivation of common beans, mainly due to rising temperatures and decreasing water availability. These environmental changes can result in yield losses of up to 70%, posing a significant threat to food security in regions where beans are a dietary staple [8,9]. By 2040, Chile is projected to be among the 30 nations facing the most severe water scarcity if current trends continue [10]. Furthermore, by the end of the 21st century, winter precipitation in Chile is expected to decrease by more than 40% [11].
Water scarcity affecting beans leads to reduced leaf area, lower photosynthetic activity, decreased biomass, and a significant reduction in seed yield [12]. The extent of yield reduction varies depending on the bean genotype and the severity and timing of the drought [13]. In Chile, bean cultivation is predominantly affected by terminal drought, which severely impacts the reproductive stage, leading to a critical decrease in grain production; the production is primarily associated with smallholders who manage relatively small plots, with most of the crop being produced under irrigation [14]. Most bean production is concentrated in the central valley, particularly in the south-central regions of Maule, Ñuble, and Biobío. However, these key production areas have been severely affected by an unprecedented mega-drought, characterized by a 20–40% reduction in rainfall and diminished snowpack in the Andes [15]. As a result, river flow and water reservoir levels have significantly decreased, particularly during the summer months, exacerbating water shortages, which have placed additional pressure on bean production, making it increasingly challenging for Chilean farmers to achieve high yields under limited water availability [16,17].
Despite significant global progress in identifying drought-tolerant common bean genotypes, there is a lack of information on genotypes evaluated under Chilean conditions.
Traditionally, breeding programs have focused on selecting drought-resistant bean genotypes primarily based on grain yield under drought stress, as this trait has been considered the most important. However, a more comprehensive approach incorporating additional factors could enhance the identification of parent lines with complementary traits [18,19]. In this context, two widely used indices for evaluating genotypes under drought are the Drought Susceptibility Index (DSI) and Geometric Mean Productivity (GMP). The DSI measures the relative yield reduction of a genotype under drought compared to optimal conditions [20]. However, it may penalize high-yielding genotypes when the drought is not severe. In contrast, GMP highlights stability and productivity [21]. Using both indices provides a balanced approach to genotype selection across different environments and selection criteria [7]. Traditionally, plant drought tolerance has been evaluated using physiological parameters such as leaf water potential, stomatal conductance, and relative water content. However, incorporating advanced physiological traits, as chlorophyll content, quantum yield of photosystem II, non-photochemical quenching, and proportion of light energy dissipated via non-regulated processes, provides a more complete physiological evaluation. Integrating these parameters into the selection process enhances efficiency and precision, allowing breeders to gain a more comprehensive understanding of the genotype’s response to water scarcity, leading to more successful drought-tolerant selection [22,23,24,25,26]. Additionally, evaluating drought-tolerant bean lines using these methods enhances the accuracy of the selection criteria, making the genotype selection more effective and the breeding process more rapid, thereby reducing breeding costs [27]. Integrating these selected genotypes into breeding programs will facilitate the development of common bean varieties with improved adaptation to drought conditions [7,28].
The goal is to identify parental lines with superior agronomic, phenological, and physiological traits suited to water-limited environments, ensuring high yield performance for their incorporation into breeding programs.

2. Materials and Methods

2.1. Experimental Site Conditions and Genetic Materials

The experiment was conducted for two consecutive seasons (from November to March) in 2021/2022 and 2022/2023 at the Santa Rosa Experimental Field of the Institute of Agricultural Research (INIA) Quilamapu, Chillán, Chile (36°31′ S; 71°54′ W, 196 m.a.s.l). The soil at the experimental site is volcanic (Melanoxerand) [29], with a loamy texture (Supplementary Table S1), and the climate is temperate Mediterranean, characterized by a hot, dry summer and cold, wet winter. Field trials were conducted during the 2021/2022 and 2022/2023 growing seasons. Sowing was carried out on 5 November 2021 and 3 November 2022, respectively. Meteorological data, including precipitation, evapotranspiration, and temperature, were obtained from an automated weather station at the research site and reported by the INIA Agrometeorological Network (Table 1). The trial received only 11 and 8 mm precipitation between flowering and harvest during the 2021/2022 and 2022/2023 seasons. After flowering, only the trial without drought receives irrigation. Detailed climatic and irrigation quantities during the two crop cycles are presented in Table 1.
The germplasm consisted of twenty common bean genotypes (Table 2). Fifteen genotypes were selected from the US dry bean breeding drought nursery at the University of Nebraska, USA. Additionally, five cultivars belonging to the Chilean race and Andean genetic pool were selected from the Bean breeding program of INIA.
The genotypes were evaluated under two water regimes: regular irrigation (ND) and terminal drought stress (DS). Trials were irrigated from sowing until flowering to ensure proper plant establishment and early growth. In DS stressed plots, irrigation was discontinued on day 56 after sowing, coinciding with the period when all genetic materials were in full flowering. A 20-m buffer zone was maintained between adjacent trials to minimize water movement from the non-stressed to the drought-stressed plots.

2.2. Crop Management and Experimental Design

The genotypes were assigned to experimental units using a randomized complete block design with four replications. Each plot consisted of four 5.0-m rows spaced 0.6 m apart, targeting a plant density of 250,000 plants per hectare. Furrow irrigation systems were used throughout the trial. Before sowing, the soil was fertilized with 60 kg ha−1 of N, 50 kg ha−1 of P2O5, 40 kg ha−1 of K2O, 18 kg ha−1 of S, and 12 kg ha−1 of MgO. (Supplementary Table S2). Seeds were treated with Fludioxonile and Thiamethoxam. Chemical control of weeds was applied with the Sodium salt of Fomesafen, and management of weeds also included manual labor.

2.3. Agronomic Evaluations

To assess the plant’s response to water stress, aerial biomass, grain yield, number of grains per pod, and hundred-grain weight were evaluated. At the mid-pod stage, a 21 cm row from each plot containing three plants was destructively sampled to measure aboveground biomass (AGB), which was then extrapolated to kg−1 per hectare. The collected plant samples were oven-dried at 70 °C until they reached a constant weight, and the total dry weight was recorded. The grain yield (GY) was determined by harvesting seeds at the same moisture (14%) from two central rows of each plot, excluding 50 cm end plants, for both the irrigated and drought-stressed plots; the GY was then extrapolated to a per-hectare basis. For assessing the hundred-grain weight (HGW) at harvest, a random sample was taken to determine the weight of 100 seeds; the values were expressed in grams. The number of grains per pod (NGP) was extrapolated to the number of grains per area (m2). The harvest index (HI %) directly estimates how much of the plant’s biomass was allocated to grain formation [30]. The HI for each genotype was calculated as the dry weight of seeds at harvest divided by the dry weight of aboveground biomass (leaves + stems + pods) at mid-pod filling and was expressed as a percentage.

2.4. The Drought Intensity and Susceptibility Index Calculations

Multiple indices were evaluated, given the challenge of selecting germplasm with drought tolerance and high yield potential. For drought severity quantification, the Drought Intensity Index (DII) was calculated using Equation (1) as follows:
D I I = 1 X d X p
where Xd represents the mean yield under drought conditions and Xp the mean yield under non-stress conditions. The Drought Susceptibility Index (DSI) and the Geometric Mean (GM) were used to identify drought-tolerant germplasm. The DSI was calculated according to the following Equation (2):
D S I = 1 ( Y d Y p ) D I I
where Yd is the mean yield under drought stress and Yp is the mean yield under non-stress conditions [20,25,31].
A low DSI value indicates less yield reduction under drought conditions. However, selection based solely on this index does not allow to distinguish between genotypes with a low DSI due to genuine drought tolerance (maintaining good yield even under water-limited conditions) and those with a low DSI due to poor yield performance in both drought and non-stress conditions, which may be associated with factors such as poor adaptation or inherently low yield potential. Therefore, relying exclusively on the DSI could lead to the selection of plants that are not truly drought-tolerant but do not have a low overall yield.
To address this limitation, this study proposes using additional indices, such as Geometric Mean Productivity (GMP), alongside the DSI to obtain a more comprehensive evaluation of genotype performance. The Geometric Mean was calculated using the following Equation (3):
G M P = Y p × Y d
where Yp is the mean yield under DS and Yd is the mean yield of the same genotype under ND. This index provides a more robust measure of a particular genotype’s yield stability across different water conditions [7,31].

2.5. Phenological Evaluations

Days to flowering (DF) are the days after sowing until 50% of the plants have at least one open flower. Days to physiological maturity (DPM) is the days after sowing until 50% of plants have at least one pod losing its green pigmentation.

2.6. Physiological Evaluations

Physiological traits were measured using the MultispeQ v1.0 (PhotosynQ Inc., East Lansing, MI, USA), which simultaneously quantified chlorophyll fluorescence parameters such as ΦII (quantum yield of photosystem II), ΦNO (the proportion of light energy dissipated via non-regulated processes), ΦNPQ (proportion of light energy dissipated as heat through non-photochemical quenching), and chlorophyll content in leaves (SPAD units) [23,32,33]. The measurements were performed on three plants per plot that were randomly selected and evaluated per treatment at the flowering and pod-filling stage between 11:00 and 15:00

2.7. Statistical Analysis

The study was performed as four separate trials (environments): ND1 (no drought 2021/2022), DS1 (terminal drought 2021/2022), ND2 (no drought 2022/2023), and DS2 (terminal drought 2022/2023). Each water regime (ND and DS) comprised a sample size of N = 160, resulting from 2 growing seasons × 20 genotypes × 4 replicates. Levene’s test verified the equality of variances in the samples (homogeneity of variance). Thus, the combined analysis of variance (two-way ANOVA) for the two years was performed using the general linear model (GLM) procedure to calculate the effects of water regimes (WR) and genotypes (G) and the G × WR interactions. The means separation of water regimes (ND vs. DS) and genotypes for the different parameters was performed by the independent sample t-test (p ≤ 0.05) and Duncan’s test, respectively. Data were analyzed using Statgraphics Centurion, Version 18.1.12 (Statgraphics Technologies, Inc., The Plains, VA, USA, 2018). Figures were created using Sigma Plot 11.0 for Windows (Sysat Software Inc., Point Richmond, CA, USA). Principal component analysis (PCA) and Genotype + Genotype × Environment interaction analysis (GGE) were conducted in RStudio, version 4.2.1 (R Core Team, Vienna, Austria, 2021).

3. Results and Discussion

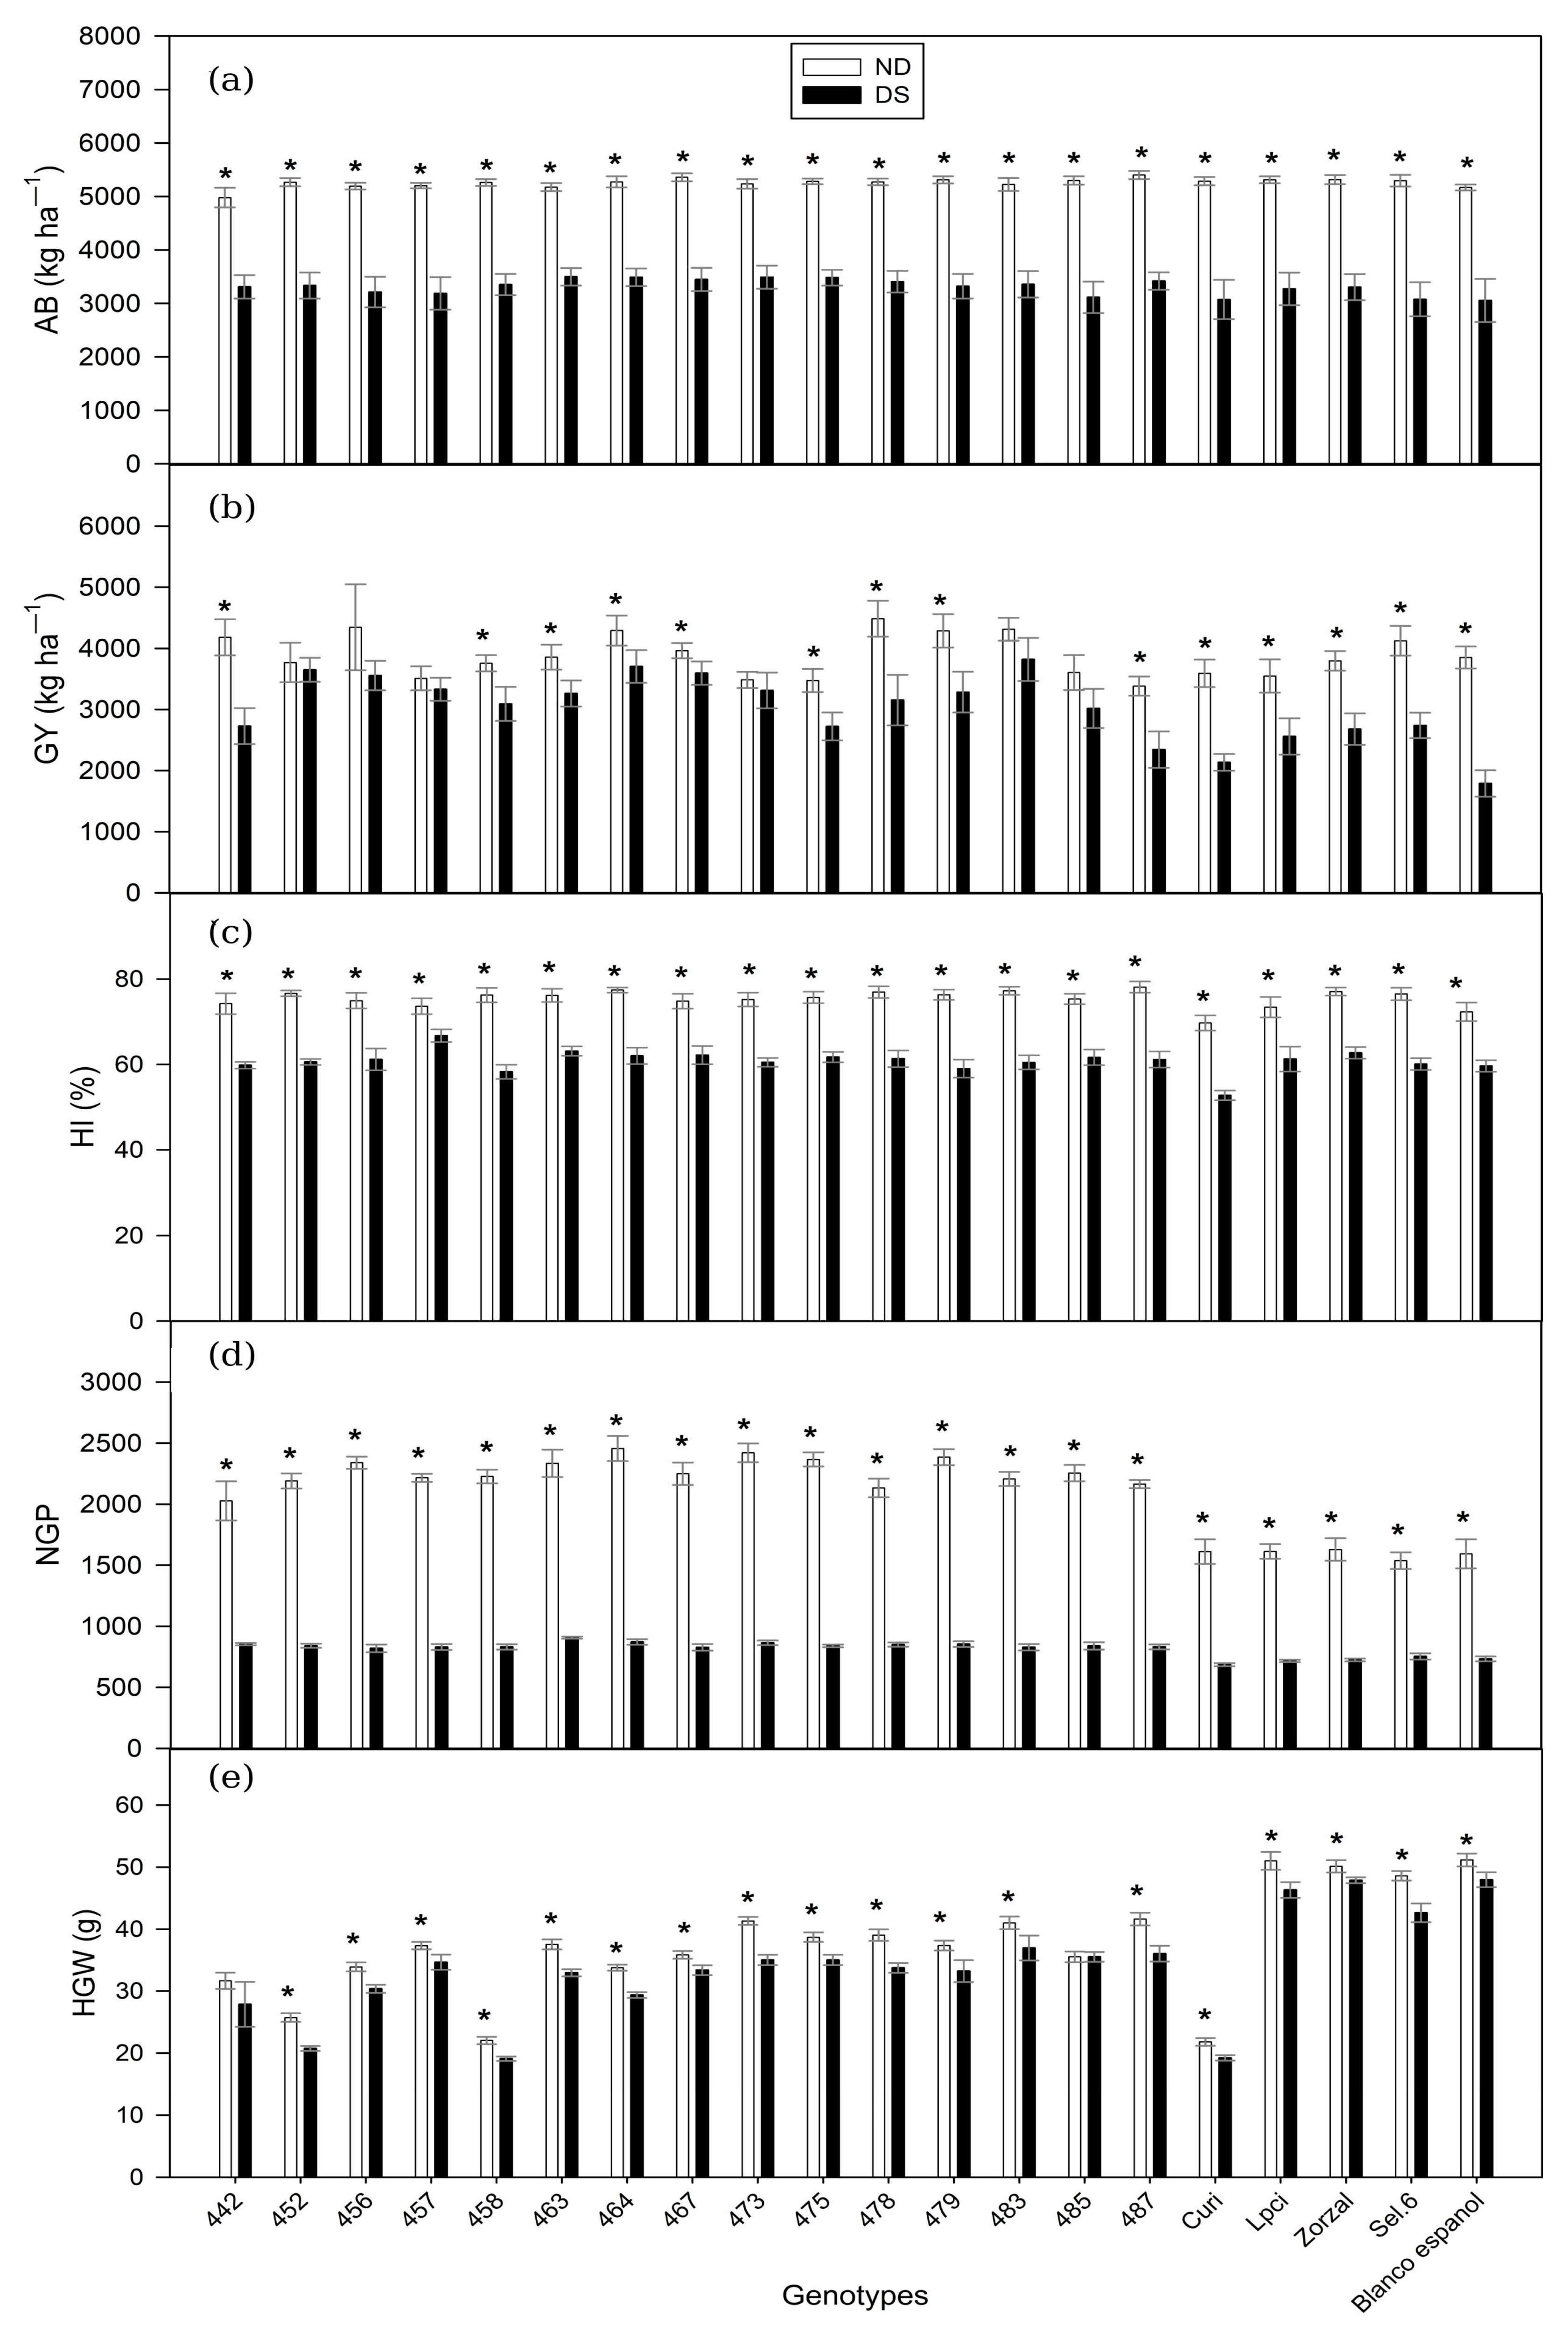
3.1. Agronomic and Productive Traits

The field experiments, conducted under (DS) and (ND), provided a robust and comprehensive framework to evaluate how drought influences a diverse range of agronomic, phenological, and physiological traits in common bean genotypes. The results presented in the following sections reflect the importance of genotypic variability in response to water limitation.
Seed yield is the most important and reliable agronomic trait of interest in abiotic stress studies [34]. Under ND conditions, the mean yield for all tested genotypes was about 3891 kg ha−1; under DS, the mean yield decreased to about 3023 kg ha−1, a reduction of 22.7%. The main effects of genotype, water regime, and their interaction (G × WR) were highly significant (***, p ≤ 0.001) (Table 3). The former indicates that water stress considerably impacted yield, and the variation among genotypes and their interaction with water availability suggests differences in genotype performance under water stress. Table 4 presents the analysis of variance for key phenological and physiological traits, further supporting the observed genotype-specific responses to drought. Blanco Español was the most affected by drought stress, with a 54% reduction in yield (Figure 1b), and also showed a high DSI value, and Sel 6 had a low yield under both conditions and the lowest GMP value (Table 5). These findings are consistent with previously reported studies on common beans, which have shown significant yield reductions ranging from 20% to 76% under drought conditions compared to well-watered conditions [35,36]. As demonstrated in previous studies in common bean [31,34]. Drought occurring during early grain filling can severely reduce sink capacity and restrict the partitioning of assimilates to developing seeds. The (DS) in this study was imposed at flowering, a reproductive stage known to be highly sensitive to water deficit. The observed reductions in the number of grains per pod (NGP) by 61.3% and hundred-grain weight (HGW) by 10.1% (Table 3) reflect this stage vulnerability. These results indicate that pod formation and seed filling were negatively affected by water stress, corroborating previous findings that highlight the impact of terminal drought on yield components in common beans.
In contrast, the genotypes least affected by drought stress were 452, 473, and 483 (Figure 1; Table 3), with less than 11% reduction in yield; similar results were reported in common beans by [37,38], who observed that specific genotypes were able to maintain relatively high yields under drought stress conditions, demonstrating high drought tolerance.
The water regime had a highly significant effect (*** p ≤ 0.001) on aboveground biomass production (Table 3) since terminal drought reduced AGB by approximately 37%. The genotype effect was insignificant for AGB, suggesting that differences in biomass among the 20 genotypes are relatively minor compared to the strong influence of the water regime (Figure 1a). This finding aligns with previous reports describing how limited water availability reduces vegetative biomass by constraining photosynthesis, cell growth, and leaf expansion [31,34]. The reduction observed underscores the impact on the plant’s capacity to capture and convert resources into dry matter, highlighting the critical role of water management in optimizing biomass production.
A high variability was observed among genotypes in their biomass response to water stress. Some genotypes, such as 473 and 463, showed smaller reductions in biomass (33%), indicating greater resilience to water deficit (Figure 1a). This variability in biomass response to water stress may be associated with differences among the genotypes regarding their water use efficiency, depth of root system, or capacity for osmotic adjustment [32,36,38]. In contrast, genotypes such as Curi and Blanco Español exhibited more pronounced reductions (41.8% and 40.9%, respectively), suggesting lower drought tolerance. Although biomass is important in grain yield formation, redistributing photoassimilates to reproductive organs (pods and grains) under water stress can modulate this relationship [39]. Genotype 464 maintained relatively high AGB (3489.9 kg ha−1) and grain yield (3703.4 kg ha−1) under ND, suggesting efficient resource allocation to grain production. This behavior could be associated with a high harvest index, indicating a prioritization of reproductive development over vegetative growth under adverse conditions [40,41].
The number of grains per pod was highly influenced by water regime (WR) and genotype (G) (** p ≤ 0.001), with a significant genotype × water regime interaction (*** p ≤ 0.001) (Table 3). Under terminal drought, NGP decreased sharply from 2105.1 ± 29.1 (ND) to 815.0 ± 6.3 (DS) (Figure 1d).
Under ND conditions, genotypes 464 and 473 achieve the highest numbers of grains per pod (exceeding 2400 seeds m−2), while others like 463, 456, and 479 also stand out in the 2200–2300 range (Figure 1d), indicating excellent floral set when water is not a limiting factor. However, in the DS condition, most genotypes undergo a 55–65% reduction in NGP, underscoring the strong dependence on water during the reproductive phase.
Genotypes such as Curi, Blanco Español, Lpci, and Zorzal were particularly sensitive, with a 50–57% decrease and reaching only 686–754 grains per m2. In contrast, although reduced, 464, 473, and 463 still maintain relatively high counts (864–907) (Figure 1d), demonstrating a degree of drought tolerance. Similar results were reported [33,41], indicating that the seed number in drought-resistant genotypes is associated with more efficient water use, higher canopy biomass, and stronger dry matter partitioning to the pods. The variability in grain number per pod across genotypes emphasizes the agronomic importance of maintaining an adequate number of grains under water-limited conditions, which can promote more stable and competitive crop yields.
Hundred-grain weight is one of the main quality and yield components in beans, influencing both the commercial value and the productive potential of the genotype. There was a significant effect of the water regime (*** p ≤ 0.001) on HGW and a negative impact of drought on individual grain weight (Table 3). Differential responses among genotypes were observed, with several genotypes exhibiting high stability in HGW, with minimal changes under drought stress conditions (Figure 1e). Notably, genotype 485 maintained the same grain weight in both water regimes. Other genotypes, such as Zorzal (−4.51%), 467 (−6.91%), Blanco Español (−6.23%), and 457 (−7.17%), were slightly impacted by the terminal drought. The HGW stability in drought-tolerant genotypes enhances seed vigor through sustained sink strength, promoting carbohydrate and protein accumulation for improved germination [42,43], this result also aligns with previous studies highlighting the importance of genetic variability in drought tolerance in common beans, where specific genotypes can maintain physiological processes and seed development under drought stress [31,36]. In contrast, genotypes 452, 458, 442, 456, and 463 experienced higher losses in HGW under drought stress, with reductions ranging from 10.43% to 19.38% (Figure 1e). The differential response of HGW across genotypes under drought stress can be attributed to various adaptive mechanisms, such as efficient water use, osmotic adjustment, and the prioritization of resources toward reproductive development [44].
The harvest index reflects the efficiency of biomass partitioning into the grain. It was significantly affected by water regime and genotype (*** p ≤ 0.001) (Table 3). Under DS, HI decreased from 75.4% (ND) to 60.81% (DS) (Figure 1c), indicating that drought not only reduces biomass but also impairs the plant’s ability to allocate resources to grain production [35].

3.2. Phenological Traits

The study revealed significant variability in the phenological traits among the twenty common bean genotypes under terminal drought stress and regular irrigation conditions. These traits are critical for understanding the phenological responses and how genotypes adjust their development to cope with water limitations.
The ND and DS treatments did not affect the timing of flowering (Table 4), as both experimental conditions experienced the same moisture regime until flowering. The average number of days to the flowering stage was 48 across the genotypes (Figure 2a). Additionally, flowering within each genotype occurred within a relatively narrow timeframe of 3 days.
Under terminal drought conditions, significant variability was observed among genotypes in the number of days to maturity (DM). On average, the genotypes under water deficit reached maturity 8 days earlier compared to well-watered conditions (Figure 2b). This acceleration in the developmental cycle is a typical adaptive response to terminal water deficit, as plants often complete their life cycle earlier to avoid prolonged stress [31]; however, the magnitude of this acceleration varies among cultivars. The genotypes LPCI and Zorzal reached maturity at 105 days under ND, but in DS, the development cycle was reduced, reaching maturity at 87 days. This reduction represents an 18% increase in crop precocity in these genotypes, which appear more sensitive to water scarcity. The former potentially led to a minor number of grains and, consequently, lower yield potential.
In contrast, genotypes 456 and 458 display only a 5% difference in DM between the two water regimes, suggesting more stable phenological behavior and an inherent drought tolerance. These findings highlighted that such variability could be linked to root architecture and water-use efficiency, which were not measured in this study but warrant further investigation [44,45]. The accelerated maturity in sensitive genotypes may compromise yield potential due to reduced grain filling periods, whereas tolerant genotypes balance stress avoidance and yield stability.

3.3. Physiological Traits

In addition to the observed phenological variation, substantial differences were also found in physiological traits among the evaluated genotypes. These traits are closely linked to adaptive mechanisms of drought tolerance in common bean.
The analysis of leaf chlorophyll content revealed variable responses across the bean genotypes under ND and DS conditions. A significant difference (*** p ≤ 0.01) was observed between the genotypes and water regimes (Table 4; Figure 2a). In addition, the drought-resistant genotype 473 showed the highest chlorophyll content (Figure 2a). This increase in chlorophyll content under DS may be attributed to adaptive mechanisms avoiding oxidative damage and photoinhibition [46,47]. Also, the higher chlorophyll content under DS could result from reduced leaf expansion (smaller leaf area with concentrated chlorophyll) or upregulation of chlorophyll biosynthesis as part of the stress response [48].
The quantum yield of PSII (ΦII) is a dimensionless parameter that quantifies the efficiency with which absorbed light is converted into excited electrons that drive the electron transport chain and, ultimately, the synthesis of chemical energy [49]. The results of the present study revealed significant variations in ΦII among genotypes and under both well-watered and drought-stress conditions (*** p ≤ 0.001) (Table 4). There was a decline in ΦII under drought (Figure 2d), indicating reduced photosynthetic performance, likely due to stomatal closure and the consequent reduction in CO2 availability [48], which is consistent with previous studies showing how drought stress negatively impacts PSII efficiency [35].
Notably, some genotypes, such as 464 and 478 (Figure 2d), maintain relatively high ΦII values under both ND and DS, suggesting they possess mechanisms that sustain photosynthetic activity and protect the photosynthetic apparatus under water deficit [50]. On the other hand, genotypes like Zorzal and Sel 6 showed the lowest ΦII values under drought, which may render them more susceptible to photooxidative damage and PSII inactivation under stress. In addition, the lowest grain yield genotype, Blanco Español, showed reduced ΦII values under drought. Furthermore, the absence of a significant genotype × water regime interaction (NS) suggests that the inherent genetic differences in ΦII remain consistent regardless of the water conditions (Table 4).
The non-photochemical quenching (ΦNPQ) values across multiple genotypes under irrigation and drought conditions reveal significant variability in photoprotective capacity. In general, ΦNPQ values increase under drought stress, and there were significant differences between water regimes (*** p ≤ 0.001) (Table 4). The enhanced NPQ under DS suggests that plants actively dissipate excess light energy as heat to protect the photosynthetic apparatus from photodamage [47,51]. This response is consistent with the known role of NPQ as a critical photoprotective mechanism under conditions of water limitation, where stomatal closure reduces CO2 availability and increases the risk of excess light energy accumulation.
Among the genotypes, 483 and Zorzal (Figure 2e) stand out for their robust photoprotective responses, with ΦNPQ values increasing significantly under drought. These genotypes likely possess efficient mechanisms for dissipating excess energy, which helps maintain photosynthetic efficiency and minimize damage under stress [52]. In contrast, genotype 457 showed a little increase in ΦNPQ under drought, suggesting less effective photoprotection and potentially greater susceptibility to photooxidative stress [53].
The non-regulated energy dissipation parameter (ΦNO) also showed significant differences (*** p ≤ 0.001) between water treatments. This parameter decreased in plants under DS, indicating a shift towards regulated energy dissipation (Table 4). Lower ΦNO under DS can indicate a reduction in energy dissipation, which may indicate improved regulation of energy use under stress and could be beneficial, as it minimizes energy loss through unregulated processes that can lead to photoinhibition and highlight the plant’s ability to adjust energy dissipation pathways to cope with drought stress [54]. These results underscore that maintaining low ΦNO values under water deficit indicates adaptive physiological mechanisms such as sustained CO2 assimilation and effective osmotic adjustment, collectively contributing to enhanced drought tolerance.
Therefore, a notable association was observed between physiological traits and yield performance, particularly under DS. Genotypes that exhibited elevated values of quantum yield of photosystem II (ΦII) and non-photochemical quenching (ΦNPQ) consistently maintained higher grain yields. This trend suggests that the ability to sustain efficient photochemical activity and activate photoprotective mechanisms under water-limited conditions contributes significantly to drought tolerance in common beans.
The combined analysis of agronomic, phenological, and physiological traits with drought tolerance indices (DSI and GMP) (Table 5) revealed distinct genotypic responses to terminal drought stress. Genotypes 452, 473, and 483 exhibited superior drought tolerance, characterized by minimal yield reductions (<11%), but also recorded the lowest DSI (≤0.5) and highest GMP (>3400 kg ha−1), confirming their superior drought tolerance and yield stability. This genotype also had a superior physiological performance (high ΦII and ΦNPQ). These responses suggest that these genotypes employ stress tolerance mechanisms, such as maintaining photochemical activity, efficient energy dissipation, and physiological stability, through delayed senescence and chlorophyll retention under water deficit [53,54]. In contrast, genotypes such as Blanco Español, Sel 6, and Curi showed high DSI values (>1.5) and low GMP, aligning with their poor yield performance under drought. In contrast, genotypes like Blanco Español showed high DSI values (>1.5) and low GMP (Table 5), reflecting greater susceptibility. These findings emphasize the value of combining yield-based indices with physiological parameters, such as chlorophyll retention and photosystem II efficiency, to identify genotypes with high drought adaptation. This approach highlights the differential impact of water scarcity on bean productivity. Also, it provides a framework for selecting parental lines for breeding programs to enhance drought resilience in water-scarce environments.
The findings of this study are consistent with previous research conducted in semi-arid regions of South America, where common bean genotypes with enhanced photosynthetic efficiency and greater capacity for non-photochemical energy dissipation have shown superior performance under terminal drought. For instance, Rosales et al. [55] reported that drought-tolerant cultivars exhibited smaller reductions in photosystem II efficiency and higher ΦNPQ values, which contributed to improved adaptation to water stress in semi-arid environments; another study [56] also emphasized the significance of physiological traits such as chlorophyll content and efficiency of photosystem II in selecting drought-resilient genotypes in Mexico and northeast Brazil. These studies reinforce the value of integrating physiological parameters as selection criteria in breeding programs aimed at enhancing drought tolerance in common bean.
The genotypes identified as drought-tolerant in this study—particularly 452, 473, and 483—demonstrated stable yield performance, efficient photosynthetic functioning, and favorable phenological adjustment under terminal drought. These traits make them strong candidates for use as parental lines in the national breeding program of INIA in the central valley of Chile.

3.4. Relationships Between Traits and Yield Stability

Principal Component Analysis (PCA) was used to reduce the dimensionality of the dataset and to explore relationships between genotypes and the physiological and productive traits of common beans under different water conditions. The analysis (Figure 3) explained 71.6% of the total data variability through the first two principal components (PC1 and PC2). The traits AGB, HI, NGP, ΦNPQ, and GY explained more than 50% of the data variability. These findings agree with previous studies indicating that drought-adapted common beans rely on efficient biomass partitioning (harvest index) and sustained photosynthetic efficiency under stress—two well-established traits that contribute to yield stability in water-limited conditions [31,57,58].
The PCA reveals a clear separation of genotypes based on environmental conditions, which were distributed at opposite ends of PC1. Within each environment, two distinct groups of genotypes were observed. Under ND conditions, the genotypes Zorzal, Lpci, Sel 6, and Blanco Español were separated from the others, indicating different performances. This separation was primarily driven by traits such as HGW and DM. These four genotypes exhibited higher grain weight but produced fewer grains overall, resulting in an average yield compared to the full set of genotypes under control conditions (Figure 1). Additionally, they showed a tendency for delayed maturity (Figure 2).
Under drought conditions, crop productivity is primarily limited by water availability. To maximize water-use efficiency, three key factors must be considered: (1) optimizing the uptake of available water, (2) enhancing its utilization to improve dry matter accumulation, and (3) efficiently partitioning the accumulated biomass into harvestable grain yield [59]. The observed delay in DM suggests an extended vegetative phase, which may reduce resource allocation to reproductive structures—a trade-off commonly associated with conservative drought-avoidant genotypes [58].
The remaining group of genotypes under irrigated conditions showed a strong positive association with HI, AGB, NGP, and GY, as well as the photosynthetic parameters ΦII and ΦNO. These associations suggest a strong link between photosynthetic efficiency, biomass accumulation, and yield under non-stressful conditions [31,56,60].
A similar pattern of genotype separation was observed under terminal drought conditions (Figure 3). In this environment, Zorzal, Lpci, Sel 6, and Blanco Español again formed a distinct group, characterized by low yield and marked by high values of ΦNPQ and low values of ΦII (Figure 1 and Figure 2). This suggests that the low yields observed under water stress were primarily due to a marked decline in photosynthetic efficiency (decrease in ΦII), coupled with an increase in thermal energy dissipation processes (increase in ΦNPQ) to protect PSII from oxidative damage—a hallmark of drought-sensitive common bean genotypes [50,61].
The analysis also showed no association between GY and DF, which was expected given that water stress occurred after flowering. Additionally, a negative correlation was observed between GY and Chl, although the contribution of leaf chlorophyll content to the overall variability in the analysis was very low. This negative association may be explained by two key mechanisms: (1) photo-oxidative stress in high-chlorophyll genotypes: under drought stress, genotypes with elevated chlorophyll content may experience excessive reactive oxygen species (ROS) production, leading to photo-oxidative damage [62]; (2) enhanced nutrient remobilization in low-chlorophyll genotypes: conversely, low-chlorophyll genotypes may exhibit accelerated senescence, promoting more efficient nutrient redistribution to developing grains [63].
The Genotype + Genotype-by-Environment interaction (GGE) analysis is widely used in plant breeding for evaluating data from multi-environment trials. It facilitates the identification of stable genotypes that perform consistently across diverse environments and those with superior performance in specific conditions [64,65,66]. The GGE analysis revealed that the first principal component accounted for 56% of the variance attributed to the genotype-by-environment interaction for grain yield, while the second component explained 26% (Figure 4), capturing a substantial proportion of the yield variability [67].
The high cumulative explained variance (82%) is consistent with findings from the common bean trials of Acosta-Díaz et al. [68], reinforcing that genotype × environment (G × E) interactions are the primary drivers of yield adaptation in this crop. These results underscore the critical importance of multi-environment testing to distinguish genotypes with broad adaptability from those suited to specific conditions.
Several genotypes, such as Blanco Español, Sel 6, Zorzal, Lpci, Curi, 442, 475, and 487, were classified as unstable. Although they exhibited relatively high yields under irrigated conditions, their performance declined sharply under terminal water stress (Figure 1), as reflected in above-average DSI values. Similarly, genotypes 478 and 479 were closely associated with irrigated conditions (Figure 4), characterized by high yields under ND environments. However, both experienced significant yield reductions under water stress, showing below-average DSI values (Figure 1, Table 5). This observed pattern aligns with the “water-spending” strategy documented in Andean bean genotypes by Polania et al. [35], characterized by vigorous growth under well-watered conditions but poor drought avoidance mechanisms, such as shallow root systems and limited osmotic adjustment. The high drought susceptibility index (DSI) values further support this trend, mirroring results from drought-sensitive bean lines [58]. The observed dramatic yield reduction under drought conditions is consistent with findings from Rosales et al. [55], who attributed such patterns to impaired photosynthate remobilization during stress periods. Despite this, their high performance in well-watered conditions makes them suitable candidates for breeding targeting non-limiting water environments.
In contrast, genotypes 452, 456, 457, 464, 473, and 483, along with 458, 463, 467, and 485, demonstrated stability across environments (Figure 1 and Figure 4) and consistently low DSI values (Table 5). These genotypes exhibit greater versatility and could be used in environments with variable water availability. These genotypes exhibit characteristics similar to the high-yielding, but drought-sensitive varieties reported by Beebe et al. [31], where breeding for irrigated conditions favors harvest index improvement at the expense of stress resilience.

4. Conclusions

The study demonstrated that drought significantly reduced grain yield (22.3%), aboveground biomass (37%), harvest index (19.5%), grains per pod (61.3%), and hundred-grain weight (22.7%), highlighting water scarcity’s severe impact on bean productivity. Drought also accelerated physiological maturity in susceptible genotypes, shortening the crop cycle—a stress avoidance mechanism that may compromise yield potential. Notably, genotypes 452, 473, and 483 exhibited exceptional drought tolerance with minimal yield reductions and the lowest drought susceptibility index (DSI). These genotypes maintained high, stable photosystem II quantum yield (ΦII) under both non-drought (ND) and drought-stressed (DS) conditions, crucial for sustaining photosynthesis under stress. In contrast, sensitive genotypes like Blanco Español suffered severe yield declines (54%) and reduced photosynthetic efficiency, underscoring cultivar-dependent drought adaptation. PCA analysis explained 71.6% of trait variability, with >50% driven by biomass, harvest index, grain number, non-photochemical quenching (ΦNPQ), and grain yield. Drought-sensitive genotypes (Zorzal, Lpci, Sel 6, Blanco Español) showed low yields, reduced ΦII, and ΦNPQ, while genotypes 452 and 456 excelled in yield and ΦII under ND, indicating efficient biomass partitioning. These results emphasize the value of combining physiological traits (ΦII, ΦNPQ) with agronomic metrics in breeding drought-resilient beans. Future research should assess selected genotypes under sustained moderate drought from sowing, alongside root architecture analysis (depth, density) to identify tolerance traits. Multi-location farmer-field trials are also critical to verify their stability and yield performance across diverse environments. This integrated approach will accelerate the development of climate-resilient bean varieties.

Supplementary Materials

The following supporting information can be downloaded at: https://www.mdpi.com/article/10.3390/agronomy15071499/s1, Table S1: Soil physical analysis; Table S2: Soil chemical analysis; Table S3: Agronomic, Phenological, and Physiological Traits of 20 Common Bean (Phaseolus vulgaris L.) Genotypes under Non-Drought (ND) Conditions; Table S4: Agronomic, Phenological, and Physiological Traits of 20 Common Bean (Phaseolus vulgaris L.) Genotypes under Drought Stress (DS) Conditions; Figure S1. Principal components analysis (PCA) biplot of agronomic and physiological traits of twenty common bean genotypes assessed under no stress conditions over two years and Figure S2. Principal components analysis (PCA) biplot of agronomic and physiological traits of twenty common bean genotypes assessed under terminal drought stress (DS) conditions over two years.

Author Contributions

Conceptualization, Experiment design and Methodology, K.T., N.Z. and C.A.U.; Data curation K.T.; Analyzed data A.E., M.G., K.T. and N.Z.; Writing original draft K.T., A.E., M.G. and N.Z., Writing-review and editing.; K.T., N.Z., A.E., M.G., C.A.U. and L.L. All authors have read and agreed to the published version of the manuscript.

Funding

This research was funded by Subsecretaría de Agricultura, Gobierno de Chile, and Programa de Fitomejoramiento del Fréjol (500155-70).

Data Availability Statement

The data supporting the findings of this study are available from the corresponding authors if reasonable request are made.

Acknowledgments

The authors thank the field workers and technical staff for their valuable assistance during the experiments. This research was conducted as part of the Doctoral Program in Agronomy Science at the Faculty of Agronomy, Universidad de Concepción, Chillán, Chile.

Conflicts of Interest

The authors declare no conflicts of interest.

References

  1. Uebersax, M.A.; Cichy, K.A.; Gomez, F.E.; Porch, T.G.; Heitholt, J.J.; Osorno, J.M.; Kamfwa, K.; Snapp, S.S.; Bales, S.R. Dry Beans (Phaseolus vulgaris L.) as a Vital Component of Sustainable Agriculture and Food Security—A Review. Legume Sci. 2022, 5, 1. [Google Scholar] [CrossRef]
  2. Didinger, C.; Foster, M.T.; Bunning, M.; Thompson, H.J. Nutrition and Human Health Benefits of Dry Beans and Other Pulses. In Dry Beans and Pulses: Production, Processing, and Nutrition; Siddiq, M., Uebersax, M.A., Eds.; John Wiley & Sons: Hoboken, NJ, USA, 2022; pp. 481–504. [Google Scholar]
  3. Lisciani, S.; Marconi, S.; Donne, C.L.; Camilli, E.; Aguzzi, A.; Gabrielli, P.; Gambelli, L.; Kunert, K.; Marais, D.; Vorster, J.; et al. Legumes and Common Beans in Sustainable Diets: Nutritional Quality, Environmental Benefits, Spread and Use in Food Preparations. Front. Nutr. 2024, 11, 1385232. [Google Scholar] [CrossRef] [PubMed]
  4. Cominelli, E.; Sparvoli, F.; Lisciani, F.; Forti, C.; Camilli, G.; Ferrari, S.; Le Donne, M.; Marconi, S.; Vorster, B.J.; Botha, A.-M.; et al. Antinutritional factors, nutritional improvement, and future food use of common beans: A perspective. Front. Plant Sci. 2022, 13, 992169. [Google Scholar] [CrossRef]
  5. Papanikolaou, Y.; Slavin, J.; Fulgoni, V.L. Adult Dietary Patterns with Increased Bean Consumption Are Associated with Greater Overall Shortfall Nutrient Intakes, Lower Added Sugar, Improved Weight-Related Outcomes and Better Diet Quality. Nutr. J. 2024, 23, 36. [Google Scholar] [CrossRef] [PubMed]
  6. Singh, N.; Jain, P.; Ujinwal, M.; Langyan, S. Escalate protein plates from legumes for sustainable human nutrition. Front. Nutr. 2022, 9, 977986. [Google Scholar] [CrossRef]
  7. Parker, T.A.; Acosta-Gallegos, J.; Beaver, J.; Brick, M.; Brown, J.K.; Cichy, K.A.; Debouck, D.G.; Delgado-Salinas, A.; Dohle, S.; Ernest, E.; et al. Genetic Resources and Breeding Priorities in Phaseolus Beans: Vulnerability, Resilience, and Future Challenges. Plant Breed. Rev. 2023, 46, 289–420. [Google Scholar]
  8. Farrow, A.; Muthoni-Andriatsitohaina, R. Atlas of Common Bean Production in Africa, 2nd ed.; Pan-Africa Bean Research Alliance (PABRA) International Center for Tropical Agriculture (CIAT): Nairobi, Kenya, 2020; p. 242. [Google Scholar]
  9. Jha, P.K.; Beebe, S.; Alvarez-Toro, P.; Mukankusi, C.; Ramirez-Villegas, J. Characterizing Patterns of Seasonal Drought Stress for Use in Common Bean Breeding in East Africa under Present and Future Climates. Agric. For. Meteorol. 2023, 342, 109735. [Google Scholar] [CrossRef] [PubMed]
  10. Luo, T.; Young, R.; Reig, P. Aqueduct projected water stress country rankings. World Resources Institute. Tech. Note 2015, 16, 1–16. [Google Scholar]
  11. Araya-Osses, D.; Casanueva, A.; Román-Figueroa, C.; Jaramillo, J.M.; Paneque, M. Climate change projections of temperature and precipitation in Chile based on statistical downscaling. Clim. Dyn. 2020, 54, 4309–4330. [Google Scholar] [CrossRef]
  12. Rai, A.; Sharma, V.; Heitholt, J. Dry Bean (Phaseolus vulgaris L.) Growth and Yield Response to Variable Irrigation in the Arid to Semi-Arid Climate. Sustainability 2020, 12, 3851. [Google Scholar] [CrossRef]
  13. Labastida, D.; Ingvarsson, P.K.; Rendón-Anaya, M. Dissecting the genetic basis of drought responses in common bean using natural variation. Front. Plant Sci. 2023, 14, 1143873. [Google Scholar] [CrossRef] [PubMed]
  14. González, J.; Tay, K. Producción de Poroto y Garbanzo en el Secano Costero del Valle del Mataquito: Línea Base Productiva, Económica y Comercial; Instituto de Investigaciones Agropecuarias (INIA): Santiago, Chile, 2017; Volume 349, p. 146. [Google Scholar]
  15. Martínez-Barradas, V.; Inostroza-Blancheteau, C.; Tighe-Neira, R.; Romero-Romero, J.L.; Schwember, A.R.; Arce-Johnson, P. Drought Tolerance Evaluation of ‘Zorzal,’ the Most Cultivated Common Bean in Chile, a Country Facing Desertification. Agric. Res. 2023, 13, 41–54. [Google Scholar] [CrossRef]
  16. Garreaud, R.; Boisier, J.P.; Rondanelli, R.; Montecinos, A.; Sepúlveda, H.H.; Veloso-Aguila, D. The Central Chile Mega Drought (2010–2018): A climate dynamics perspective. Int. J. Climatol. 2019, 40, 421–439. [Google Scholar] [CrossRef]
  17. Jódar, J.; Urrutia, J.; Herrera, C.; Custódio, E.; Martos-Rosillo, S.; Lambán, L.J. The catastrophic effects of groundwater intensive exploitation and Mega-drought on aquifers in Central Chile: Global change impact projections in water re-sources based on groundwater balance modeling. Sci. Total Environ. 2023, 914, 169651. [Google Scholar] [CrossRef]
  18. Mutari, B.; Sibiya, J.; Shayanowako, A.; Chidzanga, C.; Matova, P.M.; Gasura, E. Genome-wide association mapping for component traits of drought tolerance in dry beans (Phaseolus vulgaris L.). PLoS ONE 2023, 18, e0278500. [Google Scholar] [CrossRef] [PubMed]
  19. Mladenov, P.; Aziz, S.; Tonev, T.; Georgieva, T.; Uzundzhalieva, K.; Nikolova, K. Physiological Responses of Common Bean Genotypes to Drought Stress. Agronomy 2023, 13, 1022. [Google Scholar] [CrossRef]
  20. Memari, M.; Dadashi, M.R.; Sheikh, F.; Mohammadi, M. Evaluation of drought stress tolerance in some faba bean genotypes using drought tolerance indices. Rom. Agric. Res. 2022, 39, 59–66. [Google Scholar] [CrossRef]
  21. Mutari, B.; Sibiya, J.; Gasura, E.; Mabasa, S.; Chirwa, R. Genetic Analysis of Grain Yield and Yield-Attributing Traits in Navy Bean (Phaseolus vulgaris L.) under Drought Stress. Euphytica 2022, 218, 51. [Google Scholar] [CrossRef]
  22. Khadka, K.; Earl, H.J.; Raizada, M.N.; Navabi, A. A Physio-Morphological Trait-Based Approach for Breeding Drought Tolerant Wheat. Front. Plant Sci. 2020, 11, 715. [Google Scholar] [CrossRef]
  23. Gracia-Romero, A.; Segarra, J.; Rezzouk, F.Z.; Aparicio, N.; Kefauver, S.C.; Araus, J.L. In-Field Phenotyping Using the Low-Cost and Open Access Fluorescence PhotosynQ Multispeq Sensor Together with NDVI: A Case Study with Durum Wheat. Agriculture 2025, 15, 385. [Google Scholar] [CrossRef]
  24. Tefera, A.T.; O’Leary, G.J.; Thayalakumaran, T.; Rao, S.; Silva-Perez, V.; Shunmugam, A.S.K.; Armstrong, R.; Rosewarne, G.M. Identification of agro-physiological traits of lentil that reduce risks of drought. Front. Plant Sci. 2022, 13, 1019491. [Google Scholar] [CrossRef] [PubMed]
  25. Papathanasiou, F.; Ninou, E.; Mylonas, I.; Baxevanos, D.; Papadopoulou, F.; Avdikos, I.; Sistanis, I.; Koskosidis, A.; Vlachostergios, D.N.; Stefanou, S.; et al. The Evaluation of Common Bean (Phaseolus vulgaris L.) Genotypes under Water Stress Based on Physiological and Agronomic Parameters. Plants 2022, 11, 2432. [Google Scholar] [CrossRef] [PubMed]
  26. Traub, J.; Porch, T.G.; Naeem, M.; Urrea, C.A.; Austic, G.; Kelly, J.D.; Loescher, W.H. Screening for Heat Tolerance in Phaseolus spp. Using Multiple Methods. Crop Sci. 2018, 58, 2459–2469. [Google Scholar] [CrossRef]
  27. Gonçalves, J.G.R.; de Andrade, E.R.; da Silva, D.A.; de Fátima Esteves, J.A.; Chiorato, A.F.; Carbonell, S.A.M. Drought tolerance evaluated in common bean genotypes. Ciênc. Agrotec. 2019, 43, e01719. [Google Scholar] [CrossRef]
  28. Mickelbart, M.V.; Hasegawa, P.M.; Bailey-Serres, J. Genetic mechanisms of abiotic stress tolerance that translate to crop yield stability. Nat. Rev. Genet. 2015, 16, 237–251. [Google Scholar] [CrossRef]
  29. USDA. Keys to Soil Taxonomy, 12th ed.; United States Department of Agriculture (USDA): Washington, DC, USA, 2014.
  30. Suárez, J.C.; Polanía, J.A.; Contreras, A.T.; Beebe, S.E.; Rao, I.M. Adaptation of Common Bean Lines to High Temperature Conditions: Genotypic Differences in Phenological and Agronomic Performance. Euphytica 2020, 216, 28. [Google Scholar] [CrossRef]
  31. Beebe, S.; Rao, I.M.; Blair, M.W.; Acosta-Gallegos, J.A. Phenotyping common beans for adaptation to drought. Front. Physiol. 2013, 4, 35. [Google Scholar] [CrossRef]
  32. Dramadri, I.O.; Nkalubo, S.T.; Kramer, D.; Kelly, J.D. Genome-wide association analysis of drought adaptive traits in common bean. Crop Sci. 2021, 61, 3232–3248. [Google Scholar] [CrossRef]
  33. Rodriguez, D.F.C.; Urban, M.O.; Santaella, M.; Gereda, J.M.; Contreras, A.D.; Wenzl, P. Using Phenomics to Identify and Integrate Traits of Interest for Better-Performing Common Beans: A Validation Study on an Interspecific Hybrid and Its Acutifolii Parents. Front. Plant Sci. 2022, 13, 1008666. [Google Scholar] [CrossRef]
  34. Oliveira Neto, S.S.; Pereira, F.F.S.; Zoz, T.; Oliveira, C.E.S.; Cirino, V.M. Effect of water deficit on morphoagronomic traits of black common bean genotypes (Phaseolus vulgaris L.) with contrasting drought tolerance. J. Agron. Crop Sci. 2022, 208, 460–468. [Google Scholar] [CrossRef]
  35. Polanía, J.; Poschenrieder, C.; Beebe, S.; Rao, I.M. Effective Use of Water and Increased Dry Matter Partitioned to Grain Contribute to Yield of Common Bean Improved for Drought Resistance. Front. Plant Sci. 2016, 7, 660. [Google Scholar] [CrossRef] [PubMed]
  36. Androcioli, L.G.; Zeffa, D.M.; Alves, D.S.; Tomaz, J.P.; Moda-Cirino, V. Effect of Water Deficit on Morpho agronomic and Physiological Traits of Common Bean Genotypes with Contrasting Drought Tolerance. Water 2020, 12, 217. [Google Scholar] [CrossRef]
  37. Rezene, Y.; Gebeyehu, S.; Zelleke, H. Morpho-physiological response to post-flowering drought stress in small red seeded common bean (Phaseolus vulgaris L.) genotypes. J. Plant Stud. 2012, 2, 42–52. [Google Scholar] [CrossRef]
  38. Darkwa, K.; Ambachew, D.; Mohammed, H.; Asfaw, A.; Blair, M.W. Evaluation of common bean (Phaseolus vulgaris L.) genotypes for drought stress adaptation in Ethiopia. Crop Sci. 2016, 56, 568–583. [Google Scholar] [CrossRef]
  39. Lynch, J.P. Steep, cheap and deep: An ideotype to optimize water and N acquisition by maize root systems. Ann. Bot. 2013, 112, 347–357. [Google Scholar] [CrossRef]
  40. Sita, K.; Sehgal, A.; Hanumantha Rao, B.; Nair, R.M.; Prasad, P.V.V.; Kumar, S.; Gaur, P.M.; Farooq, M.; Siddique, K.H.M.; Varshney, R.K.; et al. Food Legumes and Rising Temperatures: Effects, Adaptive Functional Mechanisms Specific to Repro-ductive Growth Stage and Strategies to Improve Heat Tolerance. Front. Plant Sci. 2017, 8, 1658. [Google Scholar] [CrossRef] [PubMed]
  41. Gebeyehu, S. Physiological Response to Drought Stress of Common Bean (Phaseolus vulgaris L.) Genotypes Differing in Drought Resistance. J. Agron. Crop Sci. 2006, 192, 257–263. [Google Scholar]
  42. Hageman, A.; Van Volkenburgh, E. Sink Strength Maintenance Underlies Drought Tolerance in Common Bean. Plants 2021, 10, 489. [Google Scholar] [CrossRef]
  43. Sánchez-Reinoso, A.D.; Moreno, G.A.L.; Restrepo-Díaz, H. Evaluation of drought indices to identify tolerant genotypes in common bean bush (Phaseolus vulgaris L.). J. Integr. Agric. 2020, 19, 99–107. [Google Scholar] [CrossRef]
  44. Assefa, T.; Rao, I.M.; Cannon, S.B.; Wu, J.; Gutema, Z.; Blair, M.; Otyama, P.; Alemayehu, F.; Dagne, B. Improving adaptation to drought stress in white pea bean (Phaseolus vulgaris L.): Genotypic effects on grain yield, yield components and pod harvest index. Plant Breed. 2017, 136, 548–561. [Google Scholar] [CrossRef]
  45. Polanía, J.; Salazar-Chavarría, V.; González-Lemes, I.; Acosta-Maspons, A.; Chater, C.C.C.; Covarrubias, A.A. Contrasting Phaseolus Crop Water Use Patterns and Stomatal Dynamics in Response to Terminal Drought. Front. Plant Sci. 2022, 13, 894657. [Google Scholar] [CrossRef] [PubMed]
  46. Tapia, G.; Méndez, J.; Inostroza, L.; Lozano, C. Water Shortage Affects Vegetative and Reproductive Stages of Common Bean (Phaseolus vulgaris) Chilean Landraces, Differentially Impacting Grain Yield Components. Plants 2022, 11, 749. [Google Scholar] [CrossRef]
  47. Chaves, M.M.; Flexas, J.; Pinheiro, C. Photosynthesis under drought and salt stress: Regulation mechanisms from whole plant to cell. Ann. Bot. 2008, 103, 551–560. [Google Scholar] [CrossRef] [PubMed]
  48. Flexas, J.; Bota, J.; Galmés, J.; Medrano, H.; Ribas-Carbó, M. Keeping a positive carbon balance under adverse conditions: Responses of photosynthesis and respiration to water stress. Physiol. Plant. 2006, 127, 343–352. [Google Scholar] [CrossRef]
  49. Genty, B.; Briantais, J.; Baker, N.R. The relationship between the quantum yield of photosynthetic electron transport and quenching of chlorophyll fluorescence. Biochim. Biophys. Acta Gen. Subj. 1989, 990, 87–92. [Google Scholar] [CrossRef]
  50. Bashir, N.; Athar, H.; Kalaji, H.M.; Wróbel, J.; Mahmood, S.; Zafar, Z.U.; Ashraf, M. Is Photoprotection of PSII One of the Key Mechanisms for Drought Tolerance in Maize? Int. J. Mol. Sci. 2021, 22, 13490. [Google Scholar] [CrossRef]
  51. Ruban, A.V. Non-photochemical Chlorophyll Fluorescence Quenching: Mechanism and Effectiveness in Protecting Plants from Photodamage. Plant Physiol. 2016, 170, 1903–1916. [Google Scholar] [CrossRef]
  52. Živčák, M.; Kalaji, H.M.; Shao, H.; Olšovská, K.; Brestič, M. Photosynthetic proton and electron transport in wheat leaves under prolonged moderate drought stress. J. Photochem. Photobiol. 2014, 137, 107–115. [Google Scholar] [CrossRef]
  53. Müller, P.; Li, X.-P.; Niyogi, K.K. Non-photochemical quenching. A response to excess light energy. Plant Physiol. 2001, 125, 1558–1566. [Google Scholar] [CrossRef]
  54. Porcar-Castell, A.; Tyystjärvi, E.; Atherton, J.; van der Tol, C.; Flexas, J.; Pfündel, E.E.; Moreno, J.; Frankenberg, C.; Berry, J.A. Linking chlorophyll a fluorescence to photosynthesis for remote sensing applications: Mechanisms and challenges. J. Exp. Bot. 2014, 65, 4065–4095. [Google Scholar] [CrossRef]
  55. Rosales, M.A.; Ocampo, E.; Rodríguez-Valentín, R.; Olvera-Carrillo, Y.; Acosta-Gallegos, J.; Covarrubias, A.A. Physiological Analysis of Common Bean (Phaseolus vulgaris L.) Cultivars Uncovers Characteristics Related to Terminal Drought Resistance. Plant Physiol. Biochem. 2012, 56, 24–34. [Google Scholar] [CrossRef]
  56. Lanna, A.C.; Silva, R.A.; Ferraresi, T.M.; Mendonça, J.A.; Coelho, G.R.C.; Moreira, A.S.; Valdisser, P.A.M.R.; Brondani, C.; Vianello, R.P. Physiological Characterization of Common Bean (Phaseolus vulgaris L.) under Abiotic Stresses for Breeding Purposes. Environ. Sci. Pollut. Res. Int. 2018, 25, 31149–33116. [Google Scholar] [CrossRef] [PubMed]
  57. Wentworth, M.; Murchie, E.H.; Gray, J.E.; Villegas, D.; Pastenes, C.; Pinto, M.; Horton, P. Differential Adaptation of Two Varieties of Common Bean to Abiotic Stress: II. Acclimation of Photosynthesis. J. Exp. Bot. 2006, 57, 699–709. [Google Scholar] [CrossRef] [PubMed]
  58. Rao, I.M.; Beebe, S.E.; Polania, J.; Grajales, M.; Cajiao, C.; Ricaurte, J.; Garcia, R.; Rivera, M. Evidence for Genotypic Differences among Elite Lines of Common Bean in Their Ability to Remobilize Photosynthate to Increase Yield under Drought. J. Agric. Sci. 2017, 155, 857–875. [Google Scholar] [CrossRef]
  59. Beebe, S.E.; Rao, I.M.; Blair, M.W.; Butare, L. Breeding for Abiotic Stress Tolerance in Common Bean: Present and Future Challenges. SABRAO J. Breed. Genet. 2009, 41, 1–11. [Google Scholar]
  60. Keller, B.; Soto, J.; Steier, A.; Portilla-Benavides, A.E.; Raatz, B.; Studer, B.; Walter, A.; Muller, O.; Urban, M.O. Linking photosynthesis and yield reveals a strategy to improve light use efficiency in a climbing bean breeding population. J. Exp. Bot. 2024, 75, 901–916. [Google Scholar] [CrossRef]
  61. Macedo, D.C.; Lima, G.R.; Barros, R.L.N.; Pimentel, C. The Intensity of and Recovery from Photoinhibition under Drought in a Thermotolerant Common Bean Compared to Drought Tolerant Genotypes. Biol. Plant. 2019, 63, 465–473. [Google Scholar] [CrossRef]
  62. Foyer, C.H.; Noctor, G. Redox Regulation in Photosynthetic Organisms: Signaling, Acclimation, and Practical Implications. Antioxid. Redox Signal. 2009, 11, 861–905. [Google Scholar] [CrossRef]
  63. Gregersen, P.L.; Culetic, A.; Boschian, L.; Krupinska, K. Plant Senescence and Crop Productivity. Plant Mol. Biol. 2013, 82, 603–622. [Google Scholar] [CrossRef]
  64. Esan, V.I.; Oke, G.O.; Ogunbode, T.O.; Obisesan, I.A. AMMI and GGE Biplot Analyses of Bambara Groundnut [Vigna subterranea (L.) Verdc.] for Agronomic Performances under Three Environmental Conditions. Front. Plant Sci. 2022, 13, 997429. [Google Scholar] [CrossRef]
  65. Omrani, A.; Omrani, S.; Khodarahmi, M.; Shojaei, S.H.; Illés, Á.; Bojtor, C.; Mousavi, S.M.N.; Nagy, J. Evaluation of Grain Yield Stability in Some Selected Wheat Genotypes Using AMMI and GGE Biplot Methods. Agronomy 2022, 12, 1130. [Google Scholar] [CrossRef]
  66. Wang, R.; Wang, H.; Huang, S.; Zhao, Y.; Chen, E.; Li, F.; Qin, L.; Yang, Y.; Guan, Y.; Liu, B.; et al. Assessment of Yield Performances for Grain Sorghum Varieties by AMMI and GGE Biplot Analyses. Front. Plant Sci. 2023, 14, 1261323. [Google Scholar] [CrossRef] [PubMed]
  67. Gauch, H.G.; Piepho, H.P.; Annicchiarico, P. Statistical Analysis of Yield Trials by AMMI and GGE: Further Considerations. Crop Sci. 2008, 48, 866–889. [Google Scholar] [CrossRef]
  68. Acosta-Díaz, E.; Acosta-Gallegos, J.A.; Trejo-López, C.; Padilla-Ramírez, J.S.; Amador-Ramírez, M.D. Adaptation Traits in Dry Bean Cultivars Grown under Drought Stress. Agric. Téc. Méx. 2009, 35, 419–428. [Google Scholar]
Figure 1. Agronomic and productive traits evaluated in twenty bean genotypes during two seasons under no stress (ND) and terminal drought stress (DS). (a) Aboveground biomass (AGB), (b) grain yield (GY) kg ha−1, (c) harvest index (HI), (d) number of grains m−2 (NGP), (e) hundred-grain weight (HGW). Error bars represent the standard error of the mean. Means followed by asterisks indicate the significant difference between ND and DS for the same genotype using the independent samples t-test (p ≤ 0.05).
Agronomy 15 01499 g001
Figure 2. Phenological and physiological traits evaluated in twenty bean genotypes under no stress (ND) and terminal drought stress (DS) during two seasons. (a) Days to flowering (DF), (b) days to maturity (DM), (c) chlorophyll content (Chl; SPAD units), (d) quantum yield of photosystem II (ΦII), (e) proportion of light energy dissipated as heat through non-photochemical quenching means for the studied genotypes (ΦNPQ), (f) proportion of light energy dissipated via non-regulated processes (ΦNO). Error bars represent the standard error of the mean. Means followed by asterisks indicate the significant difference between ND and DS for the same genotype using the independent samples t-test (p ≤ 0.05).
Agronomy 15 01499 g002
Figure 3. Principal components analysis (PCA) biplot of agronomic and physiological traits of twenty common bean genotypes assessed under no stress (ND) and terminal drought stress (DS) conditions over two years. AGB: above ground biomass, GY: grain yield, HI: harvest index, NGP: number of grains per square meter, HGW: hundred-grain weight, DF: days to flowering, DM: days to maturity, Chl: chlorophyll content, ΦII: quantum yield of photosystem II, ΦNPQ: proportion of light energy dissipated as heat through non-photochemical quenching means for the studied genotypes, ΦNO: proportion of light energy dissipated via non-regulated processes. Zor: Zorzal and B.Esp: Blanco Español.
Agronomy 15 01499 g003
Figure 4. Genotype + Genotype × Environment interaction (GGE) biplot based on the grain yield of twenty common bean genotypes assessed under no stress (ND) and terminal drought stress (DS) conditions for two years. Zor: Zorzal and B.Esp: Blanco Español.
Agronomy 15 01499 g004
Table 1. Monthly maximum (T Max), minimum (T Min), average (T Ave), evapotranspiration (ET0), Rainfall (Rf), and applied irrigation (Irr) at the Santa Rosa Experimental Field, INIA-Quilamapu, Chillán, Chile, during the 2021/2022 and 2022/2023 seasons.
SeasonMonthT° Max (°C)T° Min (°C)T° Ave
(°C)
ET0
(mm)
Rf
(mm)
Irr
(mm)
ND
(mm)
DS
(mm)
2021/2022Nov.25.26.716.0119.56.06066.066.0
Dec.29.39.319.3147.013.0100113.0113.0
Jan.29.29.019.1143.21.6120121.61.6
Feb.29.78.319.0130.49.59099.59.5
2022/2023Nov.26.59.317.9123.125.76085.785.7
Dec.29.09.719.4142.20.0100100100
Jan.30.39.920.1159.57.4140147.47.4
Feb.31.18.619.8128.80.0909000
Regular irrigation (ND) and terminal drought stress (DS). The bold values refer to irrigations applied only in the ND water regime after flowering to physiological maturity.
Table 2. Genotypes from the University of Nebraska, USA, and the Institute of Agricultural Research (INIA), Chile, were evaluated at the Santa Rosa Experimental Field from 2021 to 2023.
CodeGenotypeMarket ClassGrowth HabitOrigen
442GN16-7Great NorthernIINE
452SB2-171CreamIINE
456NE1-09-19Great NorthernIINE
457NE2-17-6PintoIINE
458NE14-17-2BlackIINE
463MatterhornGreat NorthernIINE
464MarquisGreat NorthernIINE
467NE1-18-9Great NorthernIINE
473NE1-18-42Great NorthernIINE
475NE3-18-3Great NorthernIINE
478NE3-18-9Great NorthernIINE
479NE3-18-22Great NorthernIINE
483NE3-18-40Great NorthernIINE
485NE3-18-58Great NorthernIINE
487NE3-18-99Great NorthernIINE
CuriCuriBlackIINIA
LpciLpciCoscorrónIIIINIA
ZorzalZorzalTórtolaIIIINIA
Sel 6Sel 6TórtolaIIIINIA
Blanco EspañolBlanco EspañolGreat NorthernIIIINIA
Growth habit classifications standards of common bean: Type I (determinate bush, characterized by a reproductive phase with terminal flowering and pod set), Type II (indeterminate bush, exhibiting prolonged vegetative growth with upright architecture and continuous pod production), and Type III (indeterminate vining, with prostrate or climbing growth).
Table 3. Effect of water regime, genotypes, and their interaction on agronomic and productive traits evaluated in twenty bean genotypes during two seasons under no stress (ND) and terminal drought stress (DS).
AGBGYHINGPHGW
GNS************
WR***************
G × WRNS**NS***NS
ND5264.2 ± 17.2 b3890.8 ± 62.6 b75.49 ± 0.4 b2105.1 ± 29.1 b37.7 ± 0.7 b
DS3310.7 ± 54.9 a3022.8 ± 70.8 a60.81 ± 0.4 a815.0 ± 6.3 a33.9 ± 0.7 a
The data show the mean of the twenty genotypes studied for each water condition. AGB, aboveground biomass (kg ha−1); GY, grain yield (kg ha−1); HI, harvest index; NGP, number of grains per pod (seeds m−2); HGW, hundred-grain weight (g). G, genotypes; WR, water regime; G × WR, genotype by water regime interaction. Means followed by different letters were significantly different by the independent samples t-test (p ≤ 0.05). The probabilities (** p ≤ 0.01; *** p ≤ 0.001) are shown, and NS is insignificant.
Table 4. Effect of water regime, genotypes, and their interaction on phenological and physiological traits evaluated in twenty bean genotypes during two seasons under no stress (ND) and terminal drought stress (DS).
DFDMChlΦIIΦNPQΦNO
G************NSNS
WRNS**************
G × WRNS***NSNSNSNS
ND47.9 ± 0.3 a91.2 ± 0.5 b56.4 ± 0.3 a0.29 ± 0.00 b0.52 ± 0.01 a0.19 ± 0.01 b
DS48.2 ± 0.3 a83.6 ± 0.2 a58.0 ± 0.4 b0.26 ± 0.00 a0.59 ± 0.01 b0.15 ± 0.00 a
The data shown are the mean of the twenty genotypes studied for each water combination. DF, days to flowering; DM, days to physiological maturity; Chl, chlorophyll content (SPAD units); ΦII, the quantum yield of photosystem II; ΦNO, the proportion of light energy dissipated via non-regulated processes; ΦNPQ, the proportion of light energy dissipated as heat through non-photochemical quenching. G, genotypes; WR, water regime; G × WR, genotype by water regime interaction. Means followed by different letters were significantly different (p ≤ 0.05) by the independent samples t-test (p ≤ 0.05). The probabilities (** p ≤ 0.01; *** p ≤ 0.001) are shown, and NS is insignificant.
Table 5. Mean yield (kg ha−1), percent yield reduction (PR in %) under drought-stressed (DS) relative to the non-stressed (ND) conditions, geometric mean productivity (GMP), drought susceptibility index (DSI), hundred-seed weight (g), and days to maturity (days) for 20 genotypes evaluated during two seasons at the Santa Rosa Experimental Field, INIA-Quilamapu, Chillán, Chile, during the seasons 2021/2022 and 2022/2023.
CodeYield (kg ha−1) 100-Seed WeightDays to Maturity
NSDSPR (%)GMPDSINDDSNDDS
442439027273834601.731.527.98883
45237683650337080.125.720.78983
456434535551839300.833.930.48783
45735093330534190.237.334.78883
458375730911834080.82219.18883
463385732631535120.637.532.98983
464429237031439870.633.829.48983
46739633594937740.435.833.48983
47334843311534270.141.3358883
47534732722223074138.7358983
478448631543037611.33933.78983
479428732842337521.137.333.28983
483431238191140580.541379083
485360430171632970.735.535.58883
487338223433128151.441.6368883
Curi359121344126242.421.819.29083
Lpci354825582827681.85146.310487
Zorzal379626782930121.350.147.910587
Sel 6412527383433611.548.642.610286
Blanco Español385017885431891.351.547.99585
Overall mean38913023 0.9837.733.89184
LSD (0.05)684.601643.149 1.933.512.041.87
CV%20.3329.64 23.026.17.479.1
Disclaimer/Publisher’s Note: The statements, opinions and data contained in all publications are solely those of the individual author(s) and contributor(s) and not of MDPI and/or the editor(s). MDPI and/or the editor(s) disclaim responsibility for any injury to people or property resulting from any ideas, methods, instructions or products referred to in the content.

