1. Introduction
Nitrogen (N) is a critical macronutrient essential for plant growth and development, playing a fundamental role in chlorophyll synthesis, protein formation, nucleic acid production, and overall biomass accumulation [
1,
2]. Its availability directly influences photosynthetic capacity, crop yield, and soil fertility [
3]. Consequently, nitrogen fertilization is a cornerstone of modern agriculture, aimed at enhancing plant productivity and ensuring food security [
4,
5]. However, prevalent, continuous, and often excessive nitrogen fertilizer application has resulted in major environmental challenges, including nitrate leaching into groundwater, the eutrophication of aquatic ecosystems, soil acidification, and increased emissions of nitrous oxide (N
2O), a potent greenhouse gas contributing to climate change [
6,
7]. Recent studies have emphasized the urgent need for efficient nitrogen management to curb nutrient losses and sustain soil fertility in cropping systems globally [
8,
9,
10,
11].
The environmental risks associated with nitrogen over-application are particularly pronounced in intensive agricultural systems, where nitrogen inputs frequently exceed crop demand, resulting in substantial nitrogen losses to the environment [
4,
12]. These nitrogen losses not only degrade ecosystem health but also represent economic inefficiencies and threaten sustainable agricultural development [
13]. Therefore, optimizing nitrogen use efficiency (NUE)—the ratio of biomass produced per unit of nitrogen applied—is vital for balancing crop productivity with environmental protection [
8,
14]. Efforts to optimize NUE have become a key focus in agricultural research, aiming to minimize nitrogen losses, while maximizing production [
15].
Pennisetum hydridum (
PHY) is a fast-growing and high-yielding plant. It has been extensively studied as an energy crop and a phytoremediate plant for metal-contaminated soils, organic wastewater, and saline–alkali land. Despite these advantages, the species remains understudied outside Asia and Africa, and the effects of nitrogen management on its physiological and ecological performance remain unclear.
PHY is widely cultivated in subtropical regions and valued for its adaptability to nutrient-poor soils, extensive root systems, and ecological benefits, such as soil stabilization and carbon storage. However, while interest in tropical grasses is increasing globally, studies on nitrogen dynamics in
Pennisetum hydridum remain limited [
16].
PHY large rooting system enhances soil structure and reduces erosion, while its fast biomass accumulation contributes to long-term soil organic carbon pools, making it a valuable species for agroforestry and bioenergy production [
17,
18,
19]. Given its high biomass potential and adaptability, understanding the nitrogen response of
PHY is critical for improving sustainable productivity and environmental resilience.
However, the nitrogen response of
PHY under different fertilization regimes has not been systematically evaluated. Most previous studies focus on related species, such as moso bamboo (
Phyllostachys edulis), showing that nitrogen concentration and form significantly influence chlorophyll content, root development, and shoot biomass [
16,
18]. Yet, direct evidence on how nitrogen application affects
PHY’s carbon sequestration capacity and nitrogen efficiency under varying levels is still lacking, representing a key scientific gap.
In this context, PHY offers a unique opportunity to investigate how varying nitrogen application rates influence growth dynamics, biomass allocation, nitrogen uptake, and soil carbon sequestration. We hypothesize that moderate nitrogen application (100–200 kg·ha−1) will enhance plant growth, nitrogen use efficiency, and soil carbon accumulation; whereas, excessive nitrogen input (400 kg·ha−1) will suppress growth and increase the risk of nitrogen loss to the environment. Understanding this mechanism is crucial for developing fertilization strategies that maximize bamboo productivity, while minimizing environmental impacts. This study aims to systematically evaluate the effects of different nitrogen levels on PHY growth and associated soil nutrient dynamics under controlled conditions. By explicitly linking nitrogen input levels with plant response and sustainability outcomes, this study seeks to fill a critical knowledge gap in tropical forage management.
The specific objectives are (1) to evaluate the effects of different nitrogen application rates on growth dynamics and biomass partitioning of Pennisetum hydridum; (2) to determine the influence of nitrogen fertilization on nitrogen uptake, nitrogen use efficiency (NUE), and chlorophyll content (SPAD values) in different plant organs; (3) to analyze the relationships between nitrogen fertilization, soil organic matter content, and total soil nitrogen and carbon sequestration potential; and (4) to assess the environmental risks of excessive nitrogen application by analyzing soil inorganic nitrogen fractions (nitrate and ammonium) and providing recommendations for sustainable nitrogen management.
2. Materials and Methods
2.1. Study Site, Soil Collection, and Plant Material
The experiment was conducted at the experimental field of South China Agricultural University (SCAU), Guangzhou, China (23°9′ N, 113°21′ E), located in a humid subtropical climate zone. The region experiences an average annual temperature of 22–28 °C, annual precipitation of approximately 1700 mm, and relative humidity ranging from 70% to 80%. The soil is classified as red loam, taxonomically identified as an Ultisol according to the USDA Soil Taxonomy system, with good drainage and moderate fertility. To replicate realistic PHY cultivation conditions under controlled settings, topsoil (0–20 cm depth) was collected from the university’s ecological demonstration farm, air-dried, and passed through a 10 mm sieve to remove debris and homogenize the soil. The sieved soil was then thoroughly mixed and stored under dry conditions before potting. Initial soil physicochemical properties were as follows: soil organic matter (OM) 20.92 g·kg−1; total nitrogen (TN) 0.98 g·kg−1; total phosphorus (TP) 0.95 g·kg−1; available potassium (K+) 229.96 mg·kg−1; alkaline nitrogen (alkaline hydrolysable N) 56.41 mg·kg−1; available phosphorus (AP) 71.91 mg·kg−1; pH 5.94; and redox potential (Eh) 66.4 mV.
Uniform and healthy seedlings of PHY (approximately 20–25 cm tall, with 2–3 tillers and well-developed root systems) were selected from a commercial nursery. Damaged or pest-infected seedlings were discarded. One seedling was transplanted into each cylindrical plastic pot (30 cm diameter × 35 cm height), filled with 20 kg of prepared soil. After transplanting, old and yellowing leaves were removed to reduce stress and promote root establishment. All pots were maintained under open-field conditions, and watering was applied regularly to maintain optimal moisture.
2.2. Experimental Design and Nitrogen Fertilization
The experiment followed a completely randomized block design (CRBD) to minimize the effects of environmental variation within the greenhouse. Five nitrogen treatments were applied, as follows: 0 kg·ha⁻1 (CK), 50 kg·ha⁻1 (T1), 100 kg·ha⁻1 (T2), 200 kg·ha⁻1 (T3), and 400 kg·ha⁻1 (T4). Each treatment was replicated three times within each of the three blocks, totaling 15 pots. The blocks were established based on spatial orientation in the greenhouse to account for possible gradients in light or temperature. Within each block, treatments were randomly assigned to pots. Additionally, the positions of the pots within each block were rotated periodically throughout the experiment to further minimize microenvironmental effects. Nitrogen was applied in the form of urea [CO(NH2)2], which contains 46% nitrogen. The total nitrogen dose was divided equally into the following two split applications: the first half was applied at the time of transplanting, and the second half after the first mowing at 90 days. Sampling and measurements were conducted at two time points—90 days (1 October 2012) and 180 days (1 January 2013) after transplanting. All nitrogen was applied via soil incorporation, evenly distributed, and mixed with the top 3–5 cm of soil in each pot. No foliar application was used. This approach ensured uniform nutrient distribution and mimicked common field fertilization practices.
2.3. Measurement of Plant Growth Parameters
Plant growth was assessed by recording the tiller number manually and measuring absolute plant height from the base to the tallest culm tip using a measuring tape at each sampling time (90 and 180 days).
2.4. Biomass Allocation and Dry Matter Determination
At harvest, plants were destructively sampled and separated into aboveground and belowground components. Aboveground parts included green leaves, yellow/dead leaves (wilted > two-thirds), and stems. Belowground parts were divided into root blocks and fibrous roots. Fresh weights were recorded after gently blotting surface moisture. Dry weights were obtained by oven-drying subsamples at 105 °C for 30 min to deactivate enzymes, then at 75 °C until constant weight using a Mettler Toledo AE200 digital balance (Mettler-Toledo GmbH, Greifensee, Switzerland). Total plant biomass was calculated as the sum of dry weights of all components.
In the sand culture subset, plant height and absolute root length were measured with a ruler, and biomass determination followed the same fresh and dry weight procedures as soil culture.
2.5. Determination of Chlorophyll Content and Root Vigor
Leaf chlorophyll content was measured non-destructively using a SPAD-502 Plus portable chlorophyll meter (Konica Minolta, Tokyo, Japan). Three fully expanded upper leaves per plant were measured, and the average SPAD value was recorded.
Root vigor was assessed by the α-naphthylamine oxidation method, which quantifies root dehydrogenase activity as an index of metabolic function, following the protocol of Zhang et al. (2017) [
20].
2.6. Analysis of Soil and Plant Nitrogen Content
Total nitrogen content in plant tissues was determined by the Kjeldahl digestion method [
21]. Dried and ground samples (passing through a 0.25 mm sieve) were digested with concentrated sulfuric acid and catalyst mixture. Nitrogen content was quantified using a Kjeltec 8400 Auto Analyzer (FOSS, Hillerød, Denmark). Soil total nitrogen and soil organic matter (SOM) were analyzed from air-dried, ground soil samples. Total nitrogen was measured by the semi-micro Kjeldahl method, and SOM was determined by the Walkley–Black dichromate oxidation method [
22]. The soil C/N ratio was calculated from carbon and nitrogen concentrations. To assess nitrogen mobility and potential leaching risk, soil inorganic nitrogen fractions (NO
3− and NH
4+) were extracted using 2 M KCl and measured by continuous flow analysis (AutoAnalyzer 3, SEAL Analytical, Norderstedt, Germany).
2.7. Calculation of Nitrogen Use Efficiency (NUE) Indices and Carbon Stock Estimation
To evaluate nitrogen utilization efficiency, the following indices were calculated:
where
Nt is total N uptake with fertilization,
N0 is N uptake in the control, and
F is the amount of N applied.
where
Yt is yield with fertilization, and
Y0 is yield in the control.
Nitrogen uptake was also determined by analyzing nitrogen content in plant tissues (roots, stems, leaves) following Kjeldahl digestion or, where applicable, ICP-OES (Inductively Coupled Plasma Optical Emission Spectrometry).
To evaluate
PHY carbon sequestration potential, carbon stock estimation was conducted using:
2.8. Statistical Analysis
The experiment followed a completely randomized block design (CRBD). All statistical analyses were performed using IBM SPSS Statistics 20.0 (IBM Corp., Armonk, NY, USA) and OriginPro 2021 (OriginLab Corporation, Northampton, MA, USA). Data from all parameters were subjected to a one-way analysis of variance (ANOVA) to evaluate the effects of different nitrogen treatments. When ANOVA results indicated significance, Tukey’s Honestly Significant Difference (HSD) test was used for pairwise comparison of treatment means at a significance level of p < 0.05. Regression analysis (linear and quadratic) was conducted to assess relationships between nitrogen application rates and plant or soil parameters. The coefficient of determination (R2) was used to evaluate the model fit. Figures were created using OriginPro 2021, and all values are presented as means ± standard error (SE) based on three replicates per treatment.
3. Results
3.1. Effects of Nitrogen Fertilization on PHY Growth and Morphological Characteristics
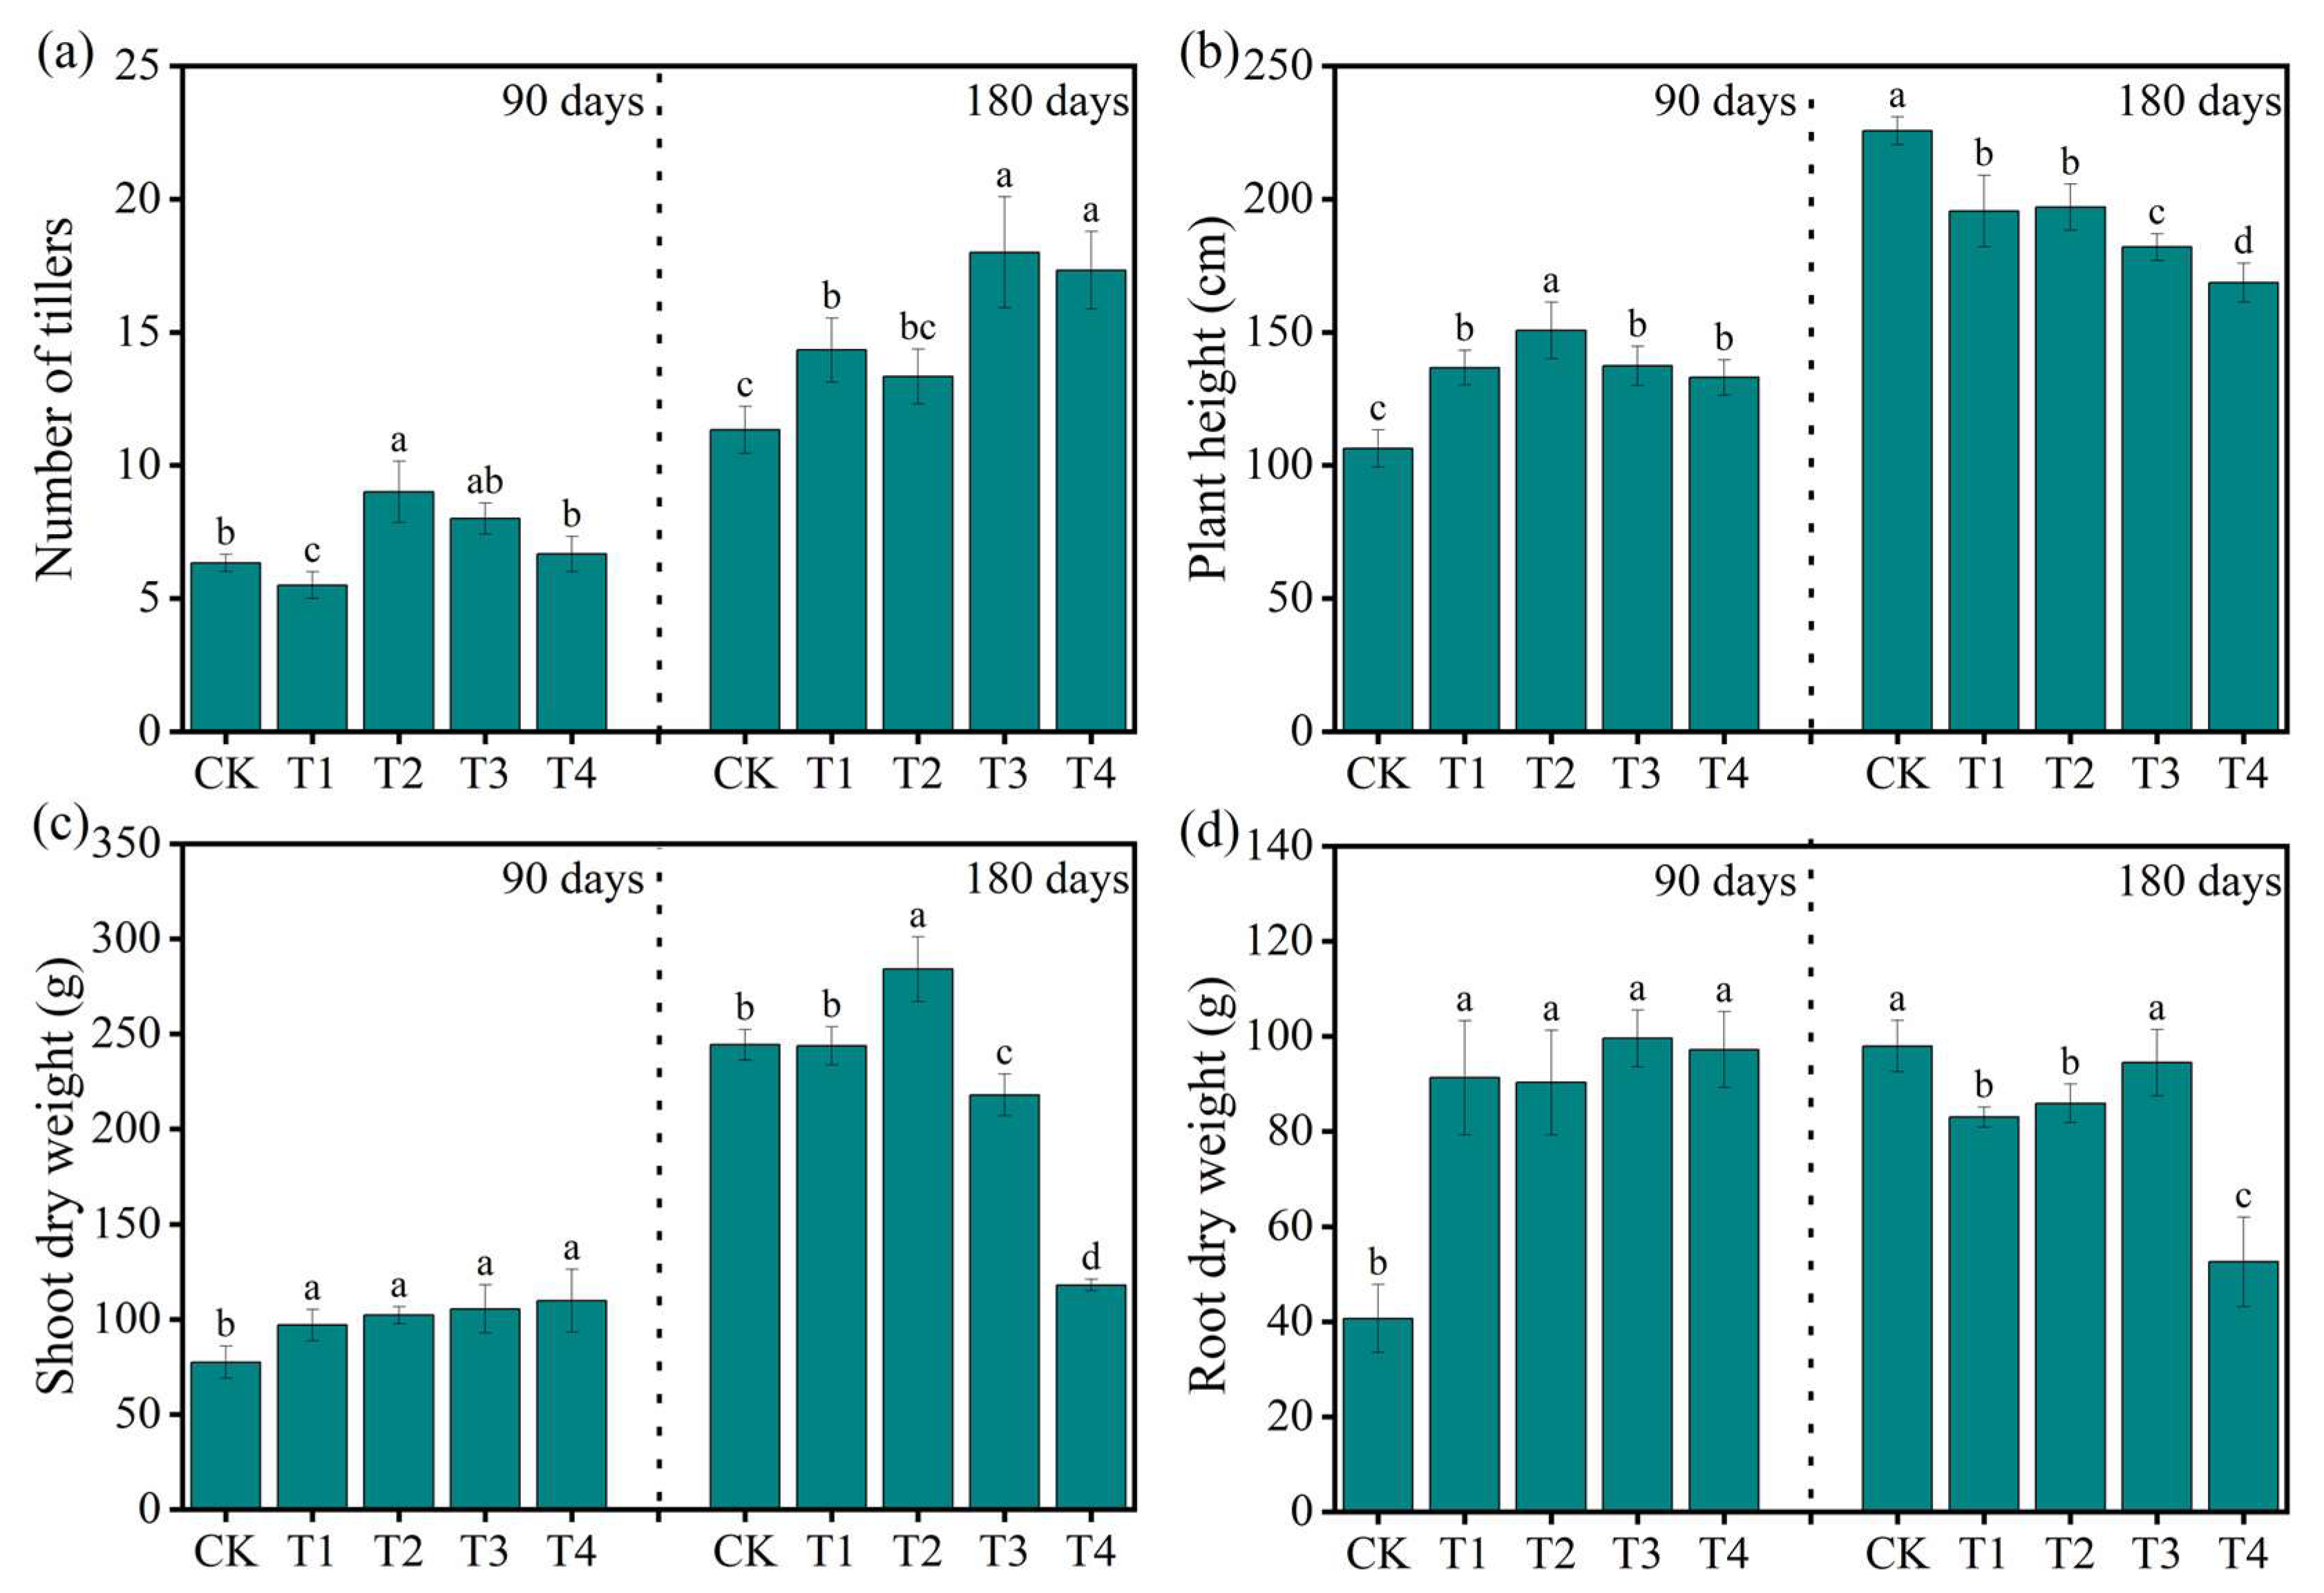
The different nitrogen fertilization levels significantly (
p < 0.05) affected
PHY growth traits at both 90 and 180 days (
Figure 1). Specifically, the number of tillers increased significantly at 180 days, with the highest tiller number observed in T3 (21.33), followed by T2 (19.33) and T1 (17.00), while T4 (14.67) and CK (13.00) showed significantly lower values (
Figure 1a). At 90 days, the tiller number was highest in T2 (11.00), followed by T1 and T3 (9.67), and was significantly lower in CK (7.33) and T4 (8.33). The plant height also varied significantly across treatments (
Figure 1b). At 90 days, CK recorded the tallest plants (225.67 cm), followed by T1 (198.67 cm), while the shortest plant height was found in T4 (168.67 cm). However, at 180 days, the plant height increased across treatments, with T3 (210.33 cm) and T2 (208.00 cm) showing significantly higher values than CK (197.00 cm) and T4 (180.33 cm). Similarly, the shoot dry weight improved significantly (
p < 0.05) with nitrogen application (
Figure 1c). At 180 days, the highest shoot biomass was recorded in T2 (330.43 g), followed by T3 (308.82 g), T1 (273.47 g), and CK (228.58 g), while T4 had the lowest value (179.86 g). At 90 days, T3 (175.70 g) and T2 (172.38 g) showed higher shoot dry weights than CK (116.00 g). Root dry weight (
Figure 1d) followed a similar trend, with T2 showing the highest root biomass at both 90 days (88.34 g) and 180 days (130.08 g), followed by T3 and T1. CK and T4 consistently had significantly lower root dry weights. These results indicate that moderate nitrogen application (100–200 kg·ha
−1) significantly enhances
PHY growth, while excessive nitrogen (400 kg·ha
−1) reduces performance across all growth traits.
3.2. Biomass Allocation Under Different Nitrogen Levels
Nitrogen fertilization significantly (
p < 0.05) influenced biomass allocation across all plant parts of
PHY at both sampling times (
Table 1). At 90 days, the highest green leaf biomass was observed in T2 (27.83 g) and T1 (24.53 g), followed by T4 (25.21 g) and T3 (22.91 g), all significantly greater than CK (7.10 g) (
p < 0.05). Dead leaf biomass followed a similar trend, with T4 (52.73 g) and T3 (45.39 g) showing the highest values, while CK (22.05 g) recorded the lowest. Stem biomass was significantly higher in all nitrogen treatments compared to CK (11.53 g), with the highest recorded in T4 (31.84 g), T2 (31.56 g), and T3 (31.29 g). Root biomass was greatest in T4 (48.19 g), followed by T2 (38.49 g), T3 (38.10 g), and T1 (36.31 g), all significantly higher than CK (30.57 g). Fibrous root biomass peaked in T3 (67.36 g), followed by T1 (60.63 g) and CK (44.63 g).
At 180 days, nitrogen application continued to significantly affect biomass distribution. Dead leaf biomass was highest in T2 (102.31 g) and T1 (85.26 g), significantly greater than CK (75.07 g) and T3 (71.26 g), while T4 showed the lowest value (33.44 g) (p < 0.05). Stem biomass reached its maximum in T2 (137.06 g), followed by CK (119.10 g), and was significantly reduced in T4 (46.78 g), indicating that excessive nitrogen inhibited productive growth. Root biomass remained relatively stable across treatments, with the highest values in T2 (32.94 g) and T3 (32.58 g), while T4 recorded the lowest (19.87 g). Fibrous root biomass followed a similar pattern, peaking in CK (70.59 g) and T3 (61.89 g), but was significantly lower in T4 (32.72 g). These results highlight that moderate nitrogen application (100–200 kg·ha−1) optimally promotes total biomass production and healthy allocation among organs, while excessive nitrogen (400 kg·ha−1) leads to reduced stem and root development, particularly at later stages.
3.3. Effects of Different Nitrogen Application Levels on the Nitrogen Accumulation of Various Plant Parts
Nitrogen application significantly influenced the accumulation of nitrogen in different plant organs of
Pennisetum hydridum. Total nitrogen content in green leaves, dead/yellow leaves, stems, roots, and fibrous roots varied notably among treatments and over time (
Figure 2). At 90 days, the 100 kg·ha
−1 treatment (T2) resulted in the highest nitrogen content in green leaves (11.77 g·kg
−1), dead leaves (6.47 g·kg
−1), and roots (4.69 g·kg
−1), which were significantly greater than those in the control (CK) and other treatments (
p < 0.05). All nitrogen treatments significantly increased nitrogen accumulation in both aboveground and belowground tissues compared to CK.
At 180 days, nitrogen accumulation patterns differed across organs. Green and dead leaves showed a decreasing trend under the highest nitrogen rate (T4); whereas, nitrogen in fibrous roots maintained relatively high nitrogen levels across treatments. The 400 kg·ha−1 treatment consistently resulted in significantly lower nitrogen content in green leaves and stems compared to moderate nitrogen treatments (p < 0.05), indicating reduced nitrogen use efficiency at excessive nitrogen levels. Overall, moderate nitrogen applications (T1–T2) promoted the greatest nitrogen accumulation, particularly in green leaves and fibrous roots, highlighting their role as key nitrogen storage organs. The observed trend of initial increase followed by decline suggests possible nitrogen saturation or inhibition effects at high application rates.
3.4. Effects of Different Nitrogen Application Levels on the Chlorophyll Content in Plants in Green Leaves
The different nitrogen application levels significantly (
p < 0.05) improved chlorophyll content in all treatments (
Figure 3). Specifically, the highest chlorophyll content at 90 days was found in T3 (22.04), followed by T4 (21.36), T2 (20.99), T1 (19.45), and CK (17.86). At 180 days, the highest chlorophyll content was observed in T2 (24.65), followed by T1 (22.56), T3 (22.38), T4 (21.04), and CK (21.17). We observed a significant (
p < 0.05) increase in chlorophyll content in T3 and T4 compared to CK and T1 at both sampling times. However, chlorophyll content in T4 and T3 showed no significant difference at 90 days, but at 180 days, T2 significantly outperformed all other treatments. The lowest chlorophyll content was found in CK, with a significant (
p < 0.05) decrease in chlorophyll content observed under the highest nitrogen application rate of 400 kg·ha
−1.
3.5. Effects of Different Nitrogen Application Levels on Soil Total Nitrogen, SOM, and Change Rate
The different nitrogen application levels significantly (
p < 0.05) affected soil total nitrogen (TN) and organic matter (OM) content at both 90 and 180 days (
Figure 4). Specifically, TN levels increased with nitrogen inputs, with the highest TN content observed in T4 (0.24%) at 180 days, followed by T3 (0.22%), T2 (0.21%), T1 (0.20%), and CK (0.17%) (
Figure 4a). The rate of increase in TN plateaued beyond 200 kg·ha
−1, as no significant difference was found between T3 and T4 (
p > 0.05).
In contrast, soil organic matter (OM) showed a slight increase in response to moderate nitrogen application (T2 and T3), with the highest OM content observed in T3 (2.15%) at 180 days, followed by T2 (2.09%) (
Figure 4b). However, the highest nitrogen application (T4, 400 kg·ha
−1) led to a decrease in OM content (1.98%) at 180 days, suggesting that excess nitrogen may have accelerated mineralization or reduced microbial activity, which impacted OM stability. The change rate of TN and OM over the experimental period was also significantly (
p < 0.05) influenced by nitrogen application, with the highest change rate observed in T3 (0.08% increase in TN) followed by T2 (0.07%) and T4 (0.06%) (
Figure 4c,d).
3.6. Soil Inorganic Nitrogen Fractions (Nitrate and Ammonium)
The concentrations of nitrate (NO
3−-N) and ammonium (NH
4+-N) in the soil were significantly (
p < 0.05) affected by nitrogen fertilizer application at both 90 and 180 days (
Figure 5a,b). At 90 days, the highest nitrate concentration was observed in T4 (41.35 mg/kg), significantly higher than CK (3.65 mg/kg), T1 (7.92 mg/kg), T2 (13.22 mg/kg), and T3 (24.35 mg/kg) (
p < 0.05). A similar trend was observed for ammonium, where T4 (15.6 mg/kg) showed the highest concentration, followed by T3 (12.3 mg/kg), T2 (7.6 mg/kg), T1 (2.5 mg/kg), and CK (1.2 mg/kg) (
p < 0.05). At 180 days, nitrate concentrations remained significantly higher in T4 (21.23 mg/kg) compared to CK (2.98 mg/kg), T1 (6.32 mg/kg), T2 (12.3 mg/kg), and T3 (18.22 mg/kg) (
p < 0.05). Ammonium concentrations also remained elevated in T4 (9.86 mg/kg), with significantly higher values compared to CK (0.92 mg/kg), T1 (2.1 mg/kg), T2 (5.12 mg/kg), and T3 (7.23 mg/kg) (
p < 0.05). These results suggest that higher nitrogen application rates (T3 and T4) lead to increased residual nitrate and ammonium levels in the soil at both sampling times, indicating incomplete nitrogen uptake or utilization.
3.7. Effects of Different Nitrogen Application Levels on Nitrogen Use Efficiency
The nitrogen use efficiency (NUE) indices revealed significant differences in nitrogen uptake and utilization under different nitrogen application levels (
Table 2). At 90 days, T2 (100 kg·ha
−1) exhibited the highest nitrogen harvest index (NHI = 0.75), agronomic nitrogen use efficiency (AgNUE = 26.25%), and physiological nitrogen use efficiency (PNUE = 215.93%). These values were significantly higher than those observed in T1 (50 kg·ha
−1), where the NHI was 0.70, and T4 (400 kg·ha
−1), where all NUE indices declined sharply, suggesting inefficient nitrogen use and potential nitrogen toxicity. By 180 days, T2 maintained the highest apparent nitrogen use efficiency (ANUE) and agronomic nitrogen use efficiency (AgNUE), with values of 0.25 and 40.66%, respectively. These values were higher compared to T1 (ANUE = 0.48, AgNUE = 66.93%), which, despite showing positive NUE indices, demonstrated a slight decline over time. The T2 treatment also maximized partial factor productivity (PFP), while the soil nitrogen dependence rate (SNDR) was notably higher under T4 (271.65%), indicating reduced reliance on soil nitrogen and potential nitrogen overload.
The nitrogen harvest index, which represents the percentage of nitrogen content in the shoots relative to the total nitrogen content of the plant, was highest under T2 (0.75) at 90 days. In contrast, T1 (0.70) and T4 (0.64) showed lower values, with T4 exhibiting the sharpest decline. At 180 days, the NHI was again highest under T2 (0.51) and T4 (0.51), while CK had the lowest NHI (0.35). The apparent nitrogen use efficiency was positive but decreased as the nitrogen concentration increased. A similar trend was observed for agronomic use efficiency, which was highest under moderate nitrogen treatments, like T1 and T2. The SNDR was significantly elevated under T4, suggesting that excessive nitrogen application (400 kg·ha−1) resulted in a reduced reliance on soil nitrogen, potentially leading to nitrogen imbalances.
3.8. Effects of Different Nitrogen Application Levels on Carbon Stock Estimation and C/N Ratio in Plant Tissue
Different nitrogen treatments significantly affected carbon stock and the C/N ratio across all treatments (
p < 0.05) (
Figure 6). At 90 days, the C/N ratio differed significantly among treatments, with T1 showing the highest value (13.21), followed by T2 (12.00) and T3 (11.68), while T4 and CK had lower ratios (12.04 and 11.73, respectively). Notably, T1’s C/N ratio was significantly higher than the control and other treatments (
p < 0.05), indicating enhanced nitrogen uptake and utilization (
Figure 6a). At 180 days, the C/N ratio increased in all treatments, with T3 having the highest ratio (14.16), followed by T2 (13.49) and T1 (12.87); whereas, T4 and CK maintained lower values (12.44 and 12.49, respectively). These results suggest that moderate nitrogen applications, particularly T3, optimize nitrogen use efficiency, while T4 and CK showed suboptimal performance.
Regarding carbon stock in biomass (
Figure 6b), significant differences were observed at 90 days across treatments. T4 had the highest carbon stock (93.15 g/plant), followed closely by T3 (92.27 g/plant), T2 (86.63 g/plant), and T1 (84.71 g/plant), all significantly greater than the control (53.15 g/plant) (
p < 0.05). This indicates that nitrogen fertilization enhances biomass accumulation and carbon sequestration efficiency, with T3 and T4 producing the most pronounced effects. However, at 180 days, T2 exhibited the highest carbon stock (~166.5 g/plant), surpassing the control (~154.04 g/plant), while T1 (147.05 g/plant) and T3 (140.56 g/plant) showed intermediate values. In contrast, T4 showed a marked decline in carbon stock (76.77 g/plant), significantly lower than all other treatments (
p < 0.05), suggesting that excessive nitrogen application negatively impacts long-term carbon storage. These trends demonstrate that moderate nitrogen fertilization, especially T2, enhances carbon sequestration and biomass production, while excessive nitrogen (T4) compromises carbon storage capacity.
3.9. Correlation Analysis Between Biomass and Nitrogen Fertilizer Concentration, Soil Organic Matter, and Organ Biomass of PHY
Correlation analysis revealed that nitrogen fertilizer concentration had a significant positive relationship with biomass accumulation in specific plant organs, particularly dead and yellow leaves, and aboveground parts (
Table 3). At 90 days, the strongest correlation was observed in dead leaves (R
2 = 0.7226), while at 180 days, yellow leaves showed the highest coefficient of determination (R
2 = 0.7231), followed by aboveground biomass (R
2 = 0.7999,
p < 0.01). These findings suggest that nitrogen fertilization promotes the accumulation of senescent leaf biomass and enhances overall aboveground biomass production, particularly with moderate nitrogen inputs. Similarly, stems also exhibited a notable positive correlation, with R
2 = 0.5255 at 90 days and increasing over time. In contrast, fibrous roots demonstrated a weak correlation at 90 days (R
2 = 0.1085), indicating limited responsiveness to nitrogen application during early growth. Although the correlation improved at 180 days (R
2 = 0.626,
p < 0.05), it remained weaker than that of aboveground tissues. Green leaves and roots exhibited moderate correlations (R
2 = 0.6471 and 0.3816, respectively), suggesting that these parts are less sensitive to nitrogen concentration. Notably, the quadratic trends observed in green leaves, dead leaves, and aboveground biomass indicate a diminishing return effect at higher nitrogen levels, where initial increases in nitrogen promote growth but excessive application may reduce efficiency or shift biomass allocation.
Overall, while nitrogen application significantly promotes biomass accumulation in certain tissues, such as dead leaves, yellow leaves, and aboveground biomass, the relatively low R2 values for fibrous roots and green leaves highlight that nitrogen availability alone does not fully explain biomass variability in all plant parts. This limited explanatory power of the models could be attributed to multiple factors, including the influence of other environmental conditions (e.g., soil moisture, nutrient interactions), plant physiological responses, and microbial community dynamics that were not included in the current regression analyses. Additionally, the nonlinear and potentially threshold-dependent effects of nitrogen may not be fully captured by the quadratic or linear regression models applied here.
Therefore, these findings should be interpreted with caution, acknowledging the limitations of the current statistical models. Future research could benefit from more complex modeling approaches—such as multivariate regression or machine learning techniques—that integrate additional biotic and abiotic factors to better elucidate the mechanisms governing biomass responses to nitrogen fertilization in PHY.
Regression analysis was performed to examine the relationship between soil organic matter (SOM) and the biomass of various parts of
PHY (
Table S1). At both 90 and 180 days, SOM did not show a significant correlation with the biomass of aboveground or belowground plant parts, indicating that SOM may not directly influence biomass accumulation in the early to mid-stages of
PHY growth. In the soil culture experiment, a similar analysis was conducted to assess the relationship between soil organic matter and total nitrogen content in different plant parts (
Table S2). As the planting period progressed, the correlation between SOM and nitrogen-related parameters became increasingly significant. Specifically, the linear regression coefficients for the relationships between soil organic matter and total nitrogen content in the root block (R
2 = 0.57), fibrous root total nitrogen (R
2 = 0.54), and soil carbon-to-nitrogen (C/N) ratio (R
2 = 0.67) were all statistically significant at 180 days. These results suggest that, while SOM may not directly drive biomass accumulation, it plays a progressively important role in regulating nitrogen availability and soil nutrient balance over time. This highlights the growing contribution of SOM to nitrogen cycling and supports its role in sustaining long-term soil fertility and plant nutrient acquisition in PHY cultivation systems.
4. Discussion
This study provides robust evidence that nitrogen fertilization significantly influences the growth performance, biomass partitioning, nitrogen use efficiency (NUE), and carbon sequestration potential of
Pennisetum hydridum. The results support the hypothesis that moderate nitrogen inputs (100–200 kg·ha
−1) optimize plant growth and nutrient utilization; whereas, excessive nitrogen application (400 kg·ha
−1) can suppress productivity and alter soil nutrient dynamics. These findings are consistent with prior reports on other bamboo species and perennial grasses, reinforcing the importance of balanced nutrient management for sustainable bamboo cultivation [
23,
24,
25]. In addition to bamboo, similar nitrogen response patterns have been documented in other tropical grasses, such as
Pennisetum purpureum (Napier grass) and
Miscanthus × giganteus, where moderate N application enhanced aboveground biomass and root proliferation, while excessive N led to reduced efficiency and increased senescence [
26,
27]. This suggests that the principles of optimal nitrogen management extend beyond bamboo and apply broadly to fast-growing C4 forage crops.
4.1. Growth and Biomass Response to Nitrogen Inputs
Our results demonstrate that moderate nitrogen application (100–200 kg·ha
−1) significantly enhances the tiller number, plant height, and both shoot and root biomass in
Pennisetum hydridum, while excessive nitrogen (400 kg·ha
−1) reduces these growth parameters. At 180 days, the highest tiller number and shoot biomass were observed in T2 and T3, aligning with findings in other bamboo species, where optimal N promotes vigorous vegetative growth [
16]. The suppression of growth at the highest N rate is likely due to osmotic stress or nitrate toxicity, which has been reported in both bamboo and cereal crops [
18]. Biomass partitioning data further show that moderate N enhances aboveground allocation, while excessive N increases dead leaf mass and reduces productive stem and root growth, suggesting premature senescence and metabolic imbalance [
18,
28]. These patterns are consistent with studies on
Phyllostachys edulis and
Dendrocalamus spp., where moderate N maximizes productivity and excess N disrupts the physiological balance [
29,
30,
31]. Comparable findings in tropical forage systems, including
Napier grass and
switchgrass, also demonstrate that moderate N inputs favor productive growth, while maintaining physiological balance, supporting the wider relevance of precision nitrogen management strategies [
26,
32].
4.2. Nitrogen Use Efficiency and Accumulation
The accumulation of nitrogen in green leaves, stems, and roots was greatest under moderate N application (T2), with a notable decline at the highest N rate (T4). This mirrors earlier work showing that excessive N can inhibit N uptake and assimilation, reducing nitrogen use efficiency (NUE) [
23,
25]. Our results that T2 had the highest total N in green leaves (11.77 g·kg
−1) and roots (4.69 g·kg
−1) are in line with studies on
Phyllostachys edulis and
Bambusa vulgaris, which found that moderate N supports optimal N assimilation and storage in photosynthetic tissues [
33,
34]. The decline in N content at high N rates may be due to the feedback inhibition of nitrate reductase or altered root physiology, phenomena documented in both bamboo and other fast-growing perennials [
25]. NUE indices in our study were maximized at 100–200 kg·ha
−1, supporting the argument that moderate N rates are most efficient for biomass production [
16]. These findings highlight the importance of balancing N supply to avoid both deficiency and excess, which can impair plant performance and environmental sustainability [
23,
25].
4.3. Chlorophyll Content and Physiological Status
Chlorophyll content, a key indicator of photosynthetic capacity, was significantly increased by moderate N application, with the highest SPAD values in T2 and T3 at 180 days. This result is consistent with the positive correlation between leaf N and chlorophyll reported in both bamboo and other C3 species [
35]. However, the lack of further increase—or even a decline—at the highest N rate (T4) suggests that excessive N does not translate to improved physiological status and may instead induce metabolic stress or chlorophyll degradation [
23,
25]. Similar findings in
Phyllostachys edulis and
Bambusa oldhamii show that optimal N enhances chlorophyll and photosynthesis, while surplus N can reduce chlorophyll stability and increase oxidative stress [
36]. These results underscore the need for moderate N management to maximize photosynthetic efficiency without risking toxicity or reduced NUE [
35].
4.4. Soil Nutrient Dynamics and Organic Matter
Our study found that soil total nitrogen (TN) increased with N input, but soil organic matter (OM) only increased slightly with moderate N and declined at the highest N rate (400 kg·ha
−1). This pattern is consistent with previous reports showing that excessive nitrogen fertilization can accelerate the mineralization of organic matter by stimulating soil microbial activity, leading to a net loss of soil carbon stocks [
37,
38]. The observed changes in the C/N ratio and OM stability suggest that excessive N disrupts soil microbial activity and nutrient cycling, as found in both bamboo plantations and other high-input agroecosystems [
25]. The observed changes in the C/N ratio and OM stability in our study suggest that high nitrogen application alters nutrient cycling dynamics, which may negatively affect soil health and fertility over time [
39]. These findings highlight the importance of optimizing nitrogen application rates to maintain soil organic carbon and support sustainable productivity in bamboo plantations and other high-input agroecosystems. Managing nitrogen inputs within moderate levels can enhance nutrient use efficiency and carbon sequestration, while minimizing adverse effects on soil microbial functions and long-term soil quality [
40].
4.5. Implications for Sustainable Bamboo Cultivation
Collectively, our findings indicate that moderate nitrogen fertilization (100–200 kg·ha
−1) is optimal for maximizing growth, NUE, and soil health in
Pennisetum hydridum, while excessive N inputs reduce productivity, impair physiological status, and threaten soil organic matter and ecosystem function. These results support the adoption of precision N management strategies, integrating soil and tissue diagnostics, environmental monitoring, and adaptive fertilization, as recommended in recent reviews [
41,
42]. Moreover, the emerging evidence of SOM’s role in regulating nitrogen dynamics over time suggests that sustainable bamboo cultivation must also prioritize practices that maintain or enhance SOM levels, such as organic amendments, residue management, or crop rotations. Field-scale and long-term studies are needed to validate these recommendations under variable climatic and edaphic conditions [
43,
44]. Sustainable bamboo cultivation should prioritize minimal yet effective N inputs to balance productivity with environmental stewardship, in line with agroecological principles and global nutrient management frameworks [
23,
25,
45].
5. Conclusions
This study demonstrates that nitrogen fertilization significantly influences the growth, physiological performance, and soil nutrient interactions of Pennisetum hydridum. Among the tested treatments, the 200 kg·ha−1 nitrogen application produced the highest plant height, tiller number, and total biomass, along with the greatest chlorophyll content and root vigor. Additionally, it significantly enhanced soil total nitrogen and organic matter content, indicating a positive impact on both plant growth and soil fertility. However, nitrogen use efficiency (NUE) peaked at the 100 kg·ha−1 level, highlighting a trade-off between maximum productivity and nutrient efficiency at higher application rates. Positive correlations between plant nitrogen content and soil organic matter suggest that moderate nitrogen fertilization not only supports vigorous PHY growth but also contributes to soil carbon sequestration, offering potential ecological benefits. These findings provide valuable guidance for optimizing nitrogen management in PHY cultivation systems, balancing high productivity with soil health preservation in subtropical agricultural landscapes. This study was conducted under one-year pot conditions; therefore, further multi-year field trials are recommended to confirm these results, assess long-term impacts on soil microbial communities and carbon dynamics, and ensure the scalability and sustainability of nitrogen management strategies under field conditions.


