Article

Identification of Loci and Candidate Genes Associated with Arginine Content in Soybean

1
Hebei Key Laboratory of Crop Genetics and Breeding, National Soybean Improvement Center Shijiazhuang Sub-Center, Huang-Huai-Hai Key Laboratory of Biology and Genetic Improvement of Soybean, Ministry of Agriculture and Rural Affairs, Institute of Cereal and Oil Crops, Hebei Academy of Agricultural and Forestry Sciences, Shijiazhuang 050035, China
2
College of Agronomy, Hebei Agricultural University, Baoding 071051, China
3
Hebei Key Laboratory of Crop Genetics and Breeding, Institute of Cereal and Oil Crops, Hebei Academy of Agricultural and Forestry Sciences, Shijiazhuang 050035, China
4
Department of Horticulture, University of Arkansas, Fayetteville, AR 72701, USA
*
Author to whom correspondence should be addressed.
Agronomy 2025, 15(6), 1339; https://doi.org/10.3390/agronomy15061339
Submission received: 23 April 2025 / Revised: 21 May 2025 / Accepted: 27 May 2025 / Published: 30 May 2025

Abstract

:
Soybean (Glycine max) seeds are rich in amino acids, offering key nutritional and physiological benefits. In this study, 290 soybean accessions from the USDA Germplasm Collection based in Urbana, IL Information Network (GRIN) were analyzed. Four Genome-Wide Association Study (GWAS) models—Bayesian-information and Linkage-disequilibrium Iteratively Nested Keyway (BLINK), Mixed Linear Model (MLM), Fixed and Random Model Circulating Probability Unification (FarmCPU), and Multi-Locus Mixed Model (MLMM)—identified two significant Single Nucleotide Polymorphisms (SNPs) associated with arginine content: Gm06_19014194_ss715593808 (LOD = 9.91, 3.91% variation) at 19,014,194 bp on chromosome 6 and Gm11_2054710_ss715609614 (LOD = 9.05, 19% variation) at 2,054,710 bp on chromosome 11. Two candidate genes, Glyma.06g203200 and Glyma.11G028600, were found in the two SNP marker regions, respectively. Genomic Prediction (GP) was performed for arginine content using several models: Bayes A (BA), Bayes B (BB), Bayesian LASSO (BL), Bayesian Ridge Regression (BRR), Ridge Regression Best Linear Unbiased Prediction (rrBLUP), Random Forest (RF), and Support Vector Machine (SVM). A high GP accuracy was observed in both across- and cross-populations, supporting Genomic Selection (GS) for breeding high-arginine soybean cultivars. This study holds significant commercial potential by providing valuable genetic resources and molecular tools for improving the nutritional quality and market value of soybean cultivars. Through the identification of SNP markers associated with high arginine content and the demonstration of high prediction accuracy using genomic selection, this research supports the development of soybean accessions with enhanced protein profiles. These advancements can better meet the demands of health-conscious consumers and serve high-value food and feed markets.

1. Introduction

Soybean (Glycine max (L.) Merr.) is one of the most important crops worldwide, providing a vital source of protein and oil [1]. With rising living standards, the demand for high-quality soybean with enhanced nutritional value has increased. Breeding soybean accessions with improved quality traits has become a key focus in research. Among these traits, amino acid composition plays a crucial role in determining the nutritional value of soybean [2]. Amino acids in soybean seeds exist both as free compounds and as components of proteins. Free amino acids contribute to energy metabolism and biochemical pathways, with arginine, glycine, glutamic acid, and lysine being particularly important. Arginine, a fundamental component of proteins, plays a crucial role in various biochemical and physiological functions in plants.
Arginine facilitates nitrogen release during seed germination, thereby promoting plant growth and development [3,4]. Arginine has the highest Nitrogen-to-Carbon (N:C) ratio (4:6) among all amino acids, making it a key molecule for nitrogen storage and transport in plants. Its metabolism plays a crucial role in nitrogen re-assimilation, particularly during stages of bulb development and sprouting. Elevated arginine content and increased arginase activity have been widely reported during seed germination across various plant species.
The metabolism of arginine to urea by arginase, followed by the hydrolysis of urea to ammonia by urease, is a key mechanism in nitrogen recycling that supports the metabolic demands of growing plants. This process detoxifies ammonia by converting it into urea for internal recycling—a mechanism distinct from the urea excretion system observed in animals. In mammals, the primary role of arginase is to eliminate toxic ammonia nitrogen via the urea cycle. In contrast, plants do not excrete urea but instead conserve nitrogen—second only to carbon as a limiting element in plant nutrition—through the combined activity of arginase and urease [5,6].
Additionally, arginine serves as a precursor for polyamine biosynthesis through its conversion into agmatine, thereby influencing plant growth, development, and stress responses. Beyond its role in plant metabolism, arginine is a conditionally essential amino acid with broad physiological and nutritional significance. It plays vital roles in infant nutrition, animal feed, cardiovascular health, immune modulation, and functional food development. In infants, where endogenous synthesis pathways are immature, arginine is considered essential for supporting protein synthesis, immune system maturation, and overall growth and development [7]. In livestock, particularly poultry, dietary arginine supplementation improves growth performance, immune function, and metabolic health by promoting protein synthesis, hormone secretion, and immune responses [8].
Arginine is also the precursor of Nitric Oxide (NO), a critical signaling molecule involved in vasodilation, regulation of blood flow, and cardiovascular protection. This highlights its importance in the prevention and management of hypertension and related disorders [9]. In the immune system, arginine enhances T cell function and immune surveillance and plays a vital role in wound healing and tissue regeneration [10]. As a functional food ingredient, arginine is gaining attention for its applications in sports nutrition, dietary formulations for the elderly, and interventions targeting metabolic syndrome.
Therefore, the identification and genetic enhancement of soybean accessions with high arginine content directly supports human health and nutrition, improves the efficiency of animal production systems, and facilitates the development of value-added functional foods. These considerations underscore the practical significance and long-term value of this research in the realms of modern molecular breeding and precision nutrition.
Genetic improvement is a key strategy for enhancing arginine content in soybean. Previous studies have shown that arginine content is controlled by multiple genes, with several Quantitative Trait Loci (QTLs) identified. For example, Qin et al. (2019) mapped QTLs associated with arginine content on chromosomes 7, 12, and 16, identifying candidate genes, Glyma03g129100 and Glyma03g129700 [11]. Fallen et al. (2013) reported ten QTLs associated with 17 amino acids and three genomic regions on chromosome 13 [12]. Warrington et al. (2015) conducted QTL analysis for the four amino acids in soybean population with 98 SSRs and 323 Single Nucleotide Polymorphism (SNP) markers, and detected two QTLs on chromosomes 8 and 20 for Lysine; three on chromosome 9, 17, and 20 for Threonine; four on chromosome 6, 9, 10, and 20 for Methionine [13]. These studies provide a foundation for understanding the genetic mechanisms underlying arginine content and amino acids in soybean. However, further exploration of key loci and candidate genes is necessary to support breeding efforts aimed at developing high-arginine soybean varieties.
Genomic Selection (GS) is a powerful approach for predicting Genome Estimating Breeding Value (GEBV) using high-density genome-wide markers. By estimating the effects of chromosomal segments, GS facilitates Marker-Assisted Selection (MAS) and provides valuable insights into the genetic architecture of complex traits in soybean [14]. This method relies on the principle that high-density SNP markers are in linkage disequilibrium with QTL influencing target traits, thereby improving prediction accuracy [15,16].
Several studies have demonstrated the effectiveness of GS in improving agronomic traits. Researchers [17] conducted a Genome-Wide Association Study (GWAS) of seed quality using over 30,000 SNPs across 309 soybean accessions. Using this population as a simulation group, they estimated breeding values for seed quality traits and compared GS with MAS, their results showed that GS achieved prediction accuracy ranging from 0.75 to 0.87, whereas MAS achieved accuracies between 0.62 and 0.75, demonstrating a higher efficiency of GS [17]. In rice, Spindel et al. (2015) applied GS to predict yield-related traits, achieving significantly higher accuracy than traditional breeding methods, particularly for complex traits [18]. Crossa et al. (2017) utilized GS to analyze global accessions, improving yield and stress resistance with prediction accuracies of 0.65–0.80 [19]. In rice, researchers demonstrated that GS provided superior prediction accuracy for drought resistance than traditional phenotypic selection [20]. These findings highlight the potential of GS in accelerating crop genetic improvement.
Enhancing arginine content in soybean is a key objective in modern soybean breeding. The development of new molecular markers for MAS and GS will facilitate the efficient identification and advancement of high-arginine soybean lines. However, research on the genetic loci associated with arginine content in soybean remains limited, and even fewer studies have applied GS approaches to dissect this trait. The main objectives of this study are (1) to evaluate arginine content in soybean accessions collected from 12 countries, (2) to identify SNP markers associated with arginine content, and (3) to perform Genomic Prediction (GP) for arginine content using USDA GRIN soybean accessions. Identifying soybean accessions with high arginine content will provide valuable parental materials for breeding programs, while the molecular markers identified can support the selection of high-arginine lines through MAS and GS.

2. Materials and Methods

2.1. Plant Materials

In this study, 290 soybean accessions, obtained from the USDA Germplasm Collection based in Urbana, IL, were based on the availability and geographical representation of data on arginine content (from a total of 12 countries), aiming to cover a wider range of genetic backgrounds. Based on arginine content, the accessions were divided into two subgroups: a lower-arginine-content subgroup consisting of 126 accessions, with arginine content ranging from 5 to 7.5% of total protein, and a higher-arginine-content subgroup comprising 164 accessions, with arginine content ranging from 8.5 to 10.0% of total protein. These accessions originated from 12 countries: South Korea (175), China (45), Japan (37), the United States (14), Nepal (6), India (5), France (2), Russia (2), and one accession each from Malaysia, Moldova, Pakistan, and an unknown origin (Supplementary Table S1).

2.2. Phenotypic Identification

Phenotypic data on arginine content for the 290 soybean accessions were retrieved from the USDA GRIN website (https://npgsweb.ars-grin.gov/gringlobal/descriptors) (accessed on 23 April 2025). The data were provided by Randy Nelson from the USDA Soybean Accessions Collection, Urbana, Illinois, USA (Supplementary Table S1). The 290 soybean accessions reported upon are from the USDA Germplasm Collection based in Urbana, IL. Soybean samples were scanned by NIR at the University of Minnesota’s Soybean Breeding Project laboratory. Whole soybean samples received from USDA-NASS were first ground and then scanned on a FOSS 6500 NIR Instrument. NIR Spectra from the FOSS 6500 were predicted using ISIPredict Software version 1.10.2.4842. Calibrations, provided by FOSS North America, were used to predict soybean composition from the NIR spectra.

2.3. Genotyping and Data Quality Control

Genotyping of the 290 accessions was performed using the USDA Soybean Accessions Soy50K SNP Infinium chip [21,22]. A total of 42,081 SNP markers for the 290 soybean accessions were downloaded from SoyBase (https://www.soybase.org/snps/) (accessed on 23 April 2025). Data quality control was conducted using Microsoft Excel to filter markers and individuals based on Missing rate (MISSING), Heterozygosity rate (H), and Minor Allele Frequency (MAF). Markers with a Missing rate (MISSING) > 5%, Heterozygosity rate (H) > 5%, or Minor Allele Frequency (MAF) < 5% were excluded. After filtering, 33,858 SNP markers were retained for genetic diversity and association analysis (Supplementary Table S2).

2.4. Genetic Diversity and Population Structure Analysis

In this study, GAPIT version 3 [23], (https://zzlab.net/GAPIT/index.html) (accessed on 23 April 2025) was used to analyze the population structure, which was divided into two subgroups. A phylogenetic tree was constructed using the Neighbor-Joining (NJ) method, followed by Principal Component Analysis (PCA) and genetic diversity analysis. Based on preliminary research and initial data exploration, the number of PCA components was set between 2 and 10, and the NJ tree was constructed with subgroup numbers ranging from 2 to 10. Genetic diversity and arginine content of the 290 accessions were evaluated using 33,858 SNPs in GAPIT version 3, while a randomly selected subset of 10,000 SNPs was analyzed in MEGA7 using maximum likelihood-based phylogenetic analysis [24].

2.5. Genome-Wide Association Study

GWAS was conducted using four statistical models implemented in GAPIT version 3: Mixed Linear Model (MLM), Multiple Loci Mixed Model (MLMM), Fixed and Random Model Circulating Probability Unification (FarmCPU), and the Bayesian-information and Linkage-disequilibrium Iteratively Nested Keyway (BLINK) model (https://zzlab.net/GAPIT/index.html) (accessed on 23 April 2025). Association significance was determined using a Bonferroni-corrected threshold (0.05/33,858), corresponding to a Logarithm of Odds (LOD) score of 5.78.

2.6. Candidate Gene Annotation

Candidate gene models were searched within a 5 kb region flanking each significant SNP locus [25]. The soybean genome annotation reference was obtained from the Phytozome database (specifically, Glycine max Wm82. a2. v1, available at (https://phytozome-next.jgi.doe.gov/info/Gmax_Wm82_a2_v1) (accessed on 23 April 2025). Candidate genes associated with soybean arginine content were selected and further analyzed by performing BLAST comparisons with genome annotation data from the Arabidopsis genome database (https://www.arabidopsis.org/Blast/index.jsp) (accessed on 23 April 2025). Corresponding gene annotations were reviewed using the SoyBase database (http://www.soybase.org/dlpages/) (accessed on 23 April 2025). Candidate genes were identified by selecting loci with known gene functions in Arabidopsis.

2.7. Genomic Prediction

2.7.1. Genomic Prediction Using Different SNP Sets

Prediction Accuracy (PA) for arginine content uses random SNP sets for comparative prediction, using seven GP models: Bayes A (BA), Bayes B (BB), Bayesian LASSO (BL), Bayesian Ridge Regression (BRR), Ridge Regression Best Linear Unbiased Prediction (rrBLUP), Random Forest (RF), and Support Vector Machine (SVM). All 33,858 SNPs were analyzed using the R software version 4.4.0 environment [26]. A five-fold cross-validation approach was employed, maintaining a 4:1 ratio between training and testing datasets. Eight randomly selected SNP sets were evaluated, ranging in size from 10 to 10,000 SNPs (labeled r10, r100, r200, r500, r1000, r2000, r5000, and r10,000). In addition, one marker set (m10), derived from a GWAS, was included. Genomic Estimated Breeding Values (GEBVs) were calculated for each of the nine SNP sets across all seven models [27,28,29,30]. Each combination was run 100 times, and mean correlation coefficients (r-values) along with Standard Errors (SEs) were computed. Boxplots illustrating the performance of the GP models across different SNP sets were generated using the ‘ggplot2’ package in R version 4.4.0.

2.7.2. Genomic Prediction Using GAPIT Version 3 for Whole Panel

The GAPIT version 3 package was also employed to GEBVs using three models: genomic Best Linear Unbiased Prediction (gBLUP), SUPER gBLUP (sBLUP), and GWAS-Assisted Genome BLUP (GAGBLUP, previously known as maBLUP). In this analysis, the entire panel of 290 soybean accessions was used as both the training and testing population to predict GEBVs for arginine content.

2.7.3. Genomic Prediction Using GWAS-Derived SNP Markers

GWAS-Derived SNP Markers from the Whole Panel and Self-Prediction

Self-prediction based on GWAS significant SNPs: First, GWAS was conducted using four models (MLMM, MLM, FarmCPU, and BLINK), and the associated SNP markers were identified from these models in the entire GWAS panel (290 soybean accessions). Secondly, GP was performed using the GWAS-derived SNP markers, with the whole panel serving as both the Training Population (TP) and Validation Population (VP). GP was performed as described in the previous section on GP using different SNP sets.

GWAS-Derived SNP Markers from 80% of the Whole Panel

Both cross- and across-population predictions were performed for arginine content using GWAS-derived associated SNP markers. The entire panel (290 accessions) was divided into two subsets: 80% as the Training Population (TP) (232 accessions) and 20% as the Validation Population (VP) (58 accessions). GWAS was performed on the 232 accessions using the BLINK models in GAPIT version 3. Associated SNPs with a LOD score (−log(p)) > 5.78 were selected and used to run the GP model 100 times, calculating GEBVs and estimating the average r-value each time. This process was repeated five times, and the mean r-value across the five replications was obtained as the prediction accuracy (average r-value). Three GP types were tested: ‘Across. Prediction’, ‘Cross. Prediction’, and ‘All(self). Prediction’.
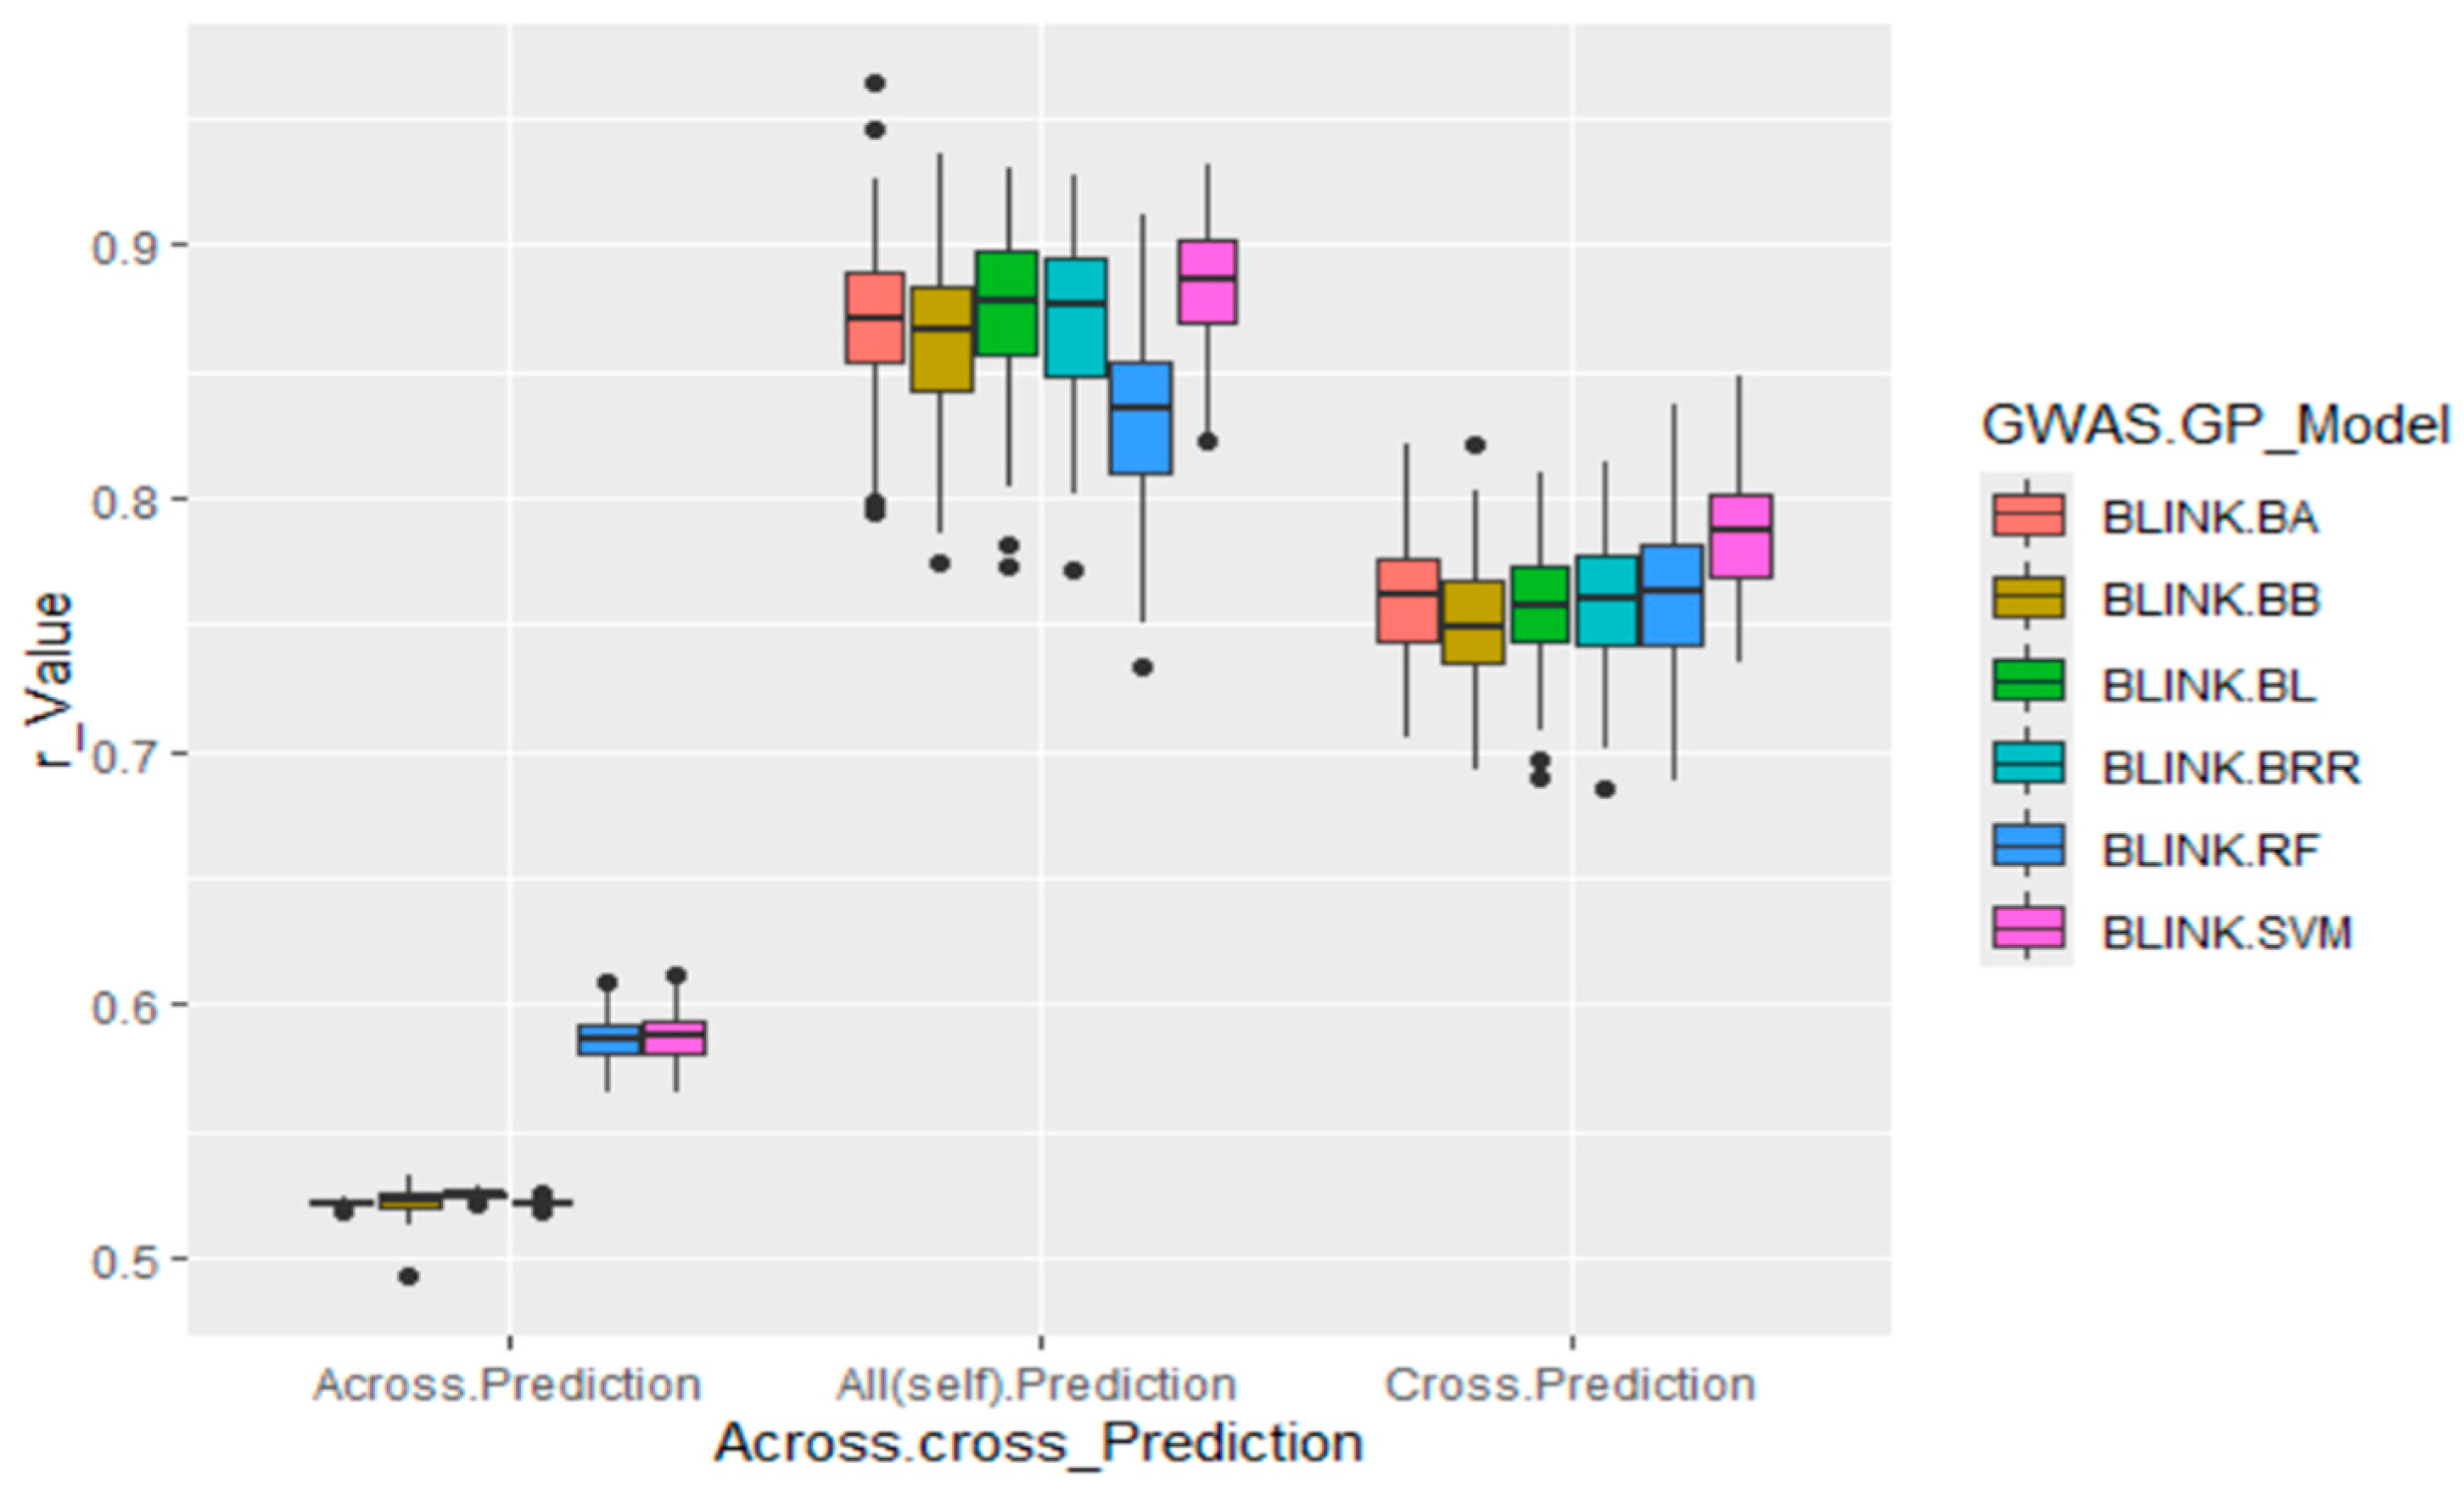
  • Across. Prediction uses GWAS-derived SNP markers from the training set (80% of the population, 232 accessions) to predict the validation set (20–58% accessions).
  • Cross. Prediction uses GWAS-derived SNP markers from the training set (80% of the population, 232 accessions) to predict itself.
  • All(self). Prediction uses all associated SNP markers from the five repeats to predict the entire population (290 accessions).
Additionally, GP was performed with five GP models (BA, BB, BL, BRR), and GEBVs were calculated for all models. Each replication in each model was run 100 times, and mean r-values along with Standard Errors (SEs) were computed. Boxplots illustrating GP model performance across SNP sets were generated using ggplot2 in R software version 4.4.0.

GWAS-Derived SNP Markers Using GAGBLUP in GAPIT Version 3

Following the same approach described above, the entire panel of 290 soybean accessions was randomly divided into two subsets: 80% as the Training Population (TP; 232 accessions) and 20% as the Validation Population (VP; 58 accessions). GP was conducted using the GAGBLUP (BLINK) model—previously referred to as maBLUP—in GAPIT version 3. Within the full panel, the ‘NA’ value was assigned to individuals in the VP. The r-value was calculated as the correlation between the GEBVs and the observed values in the TP for cross-population prediction and the observed values in VP for across-population prediction. This process was repeated five times, and the mean r-value was used to assess GP efficiency.
As in the previous analysis, both across-population and cross-population predictions were performed. Three GP scenarios were evaluated:
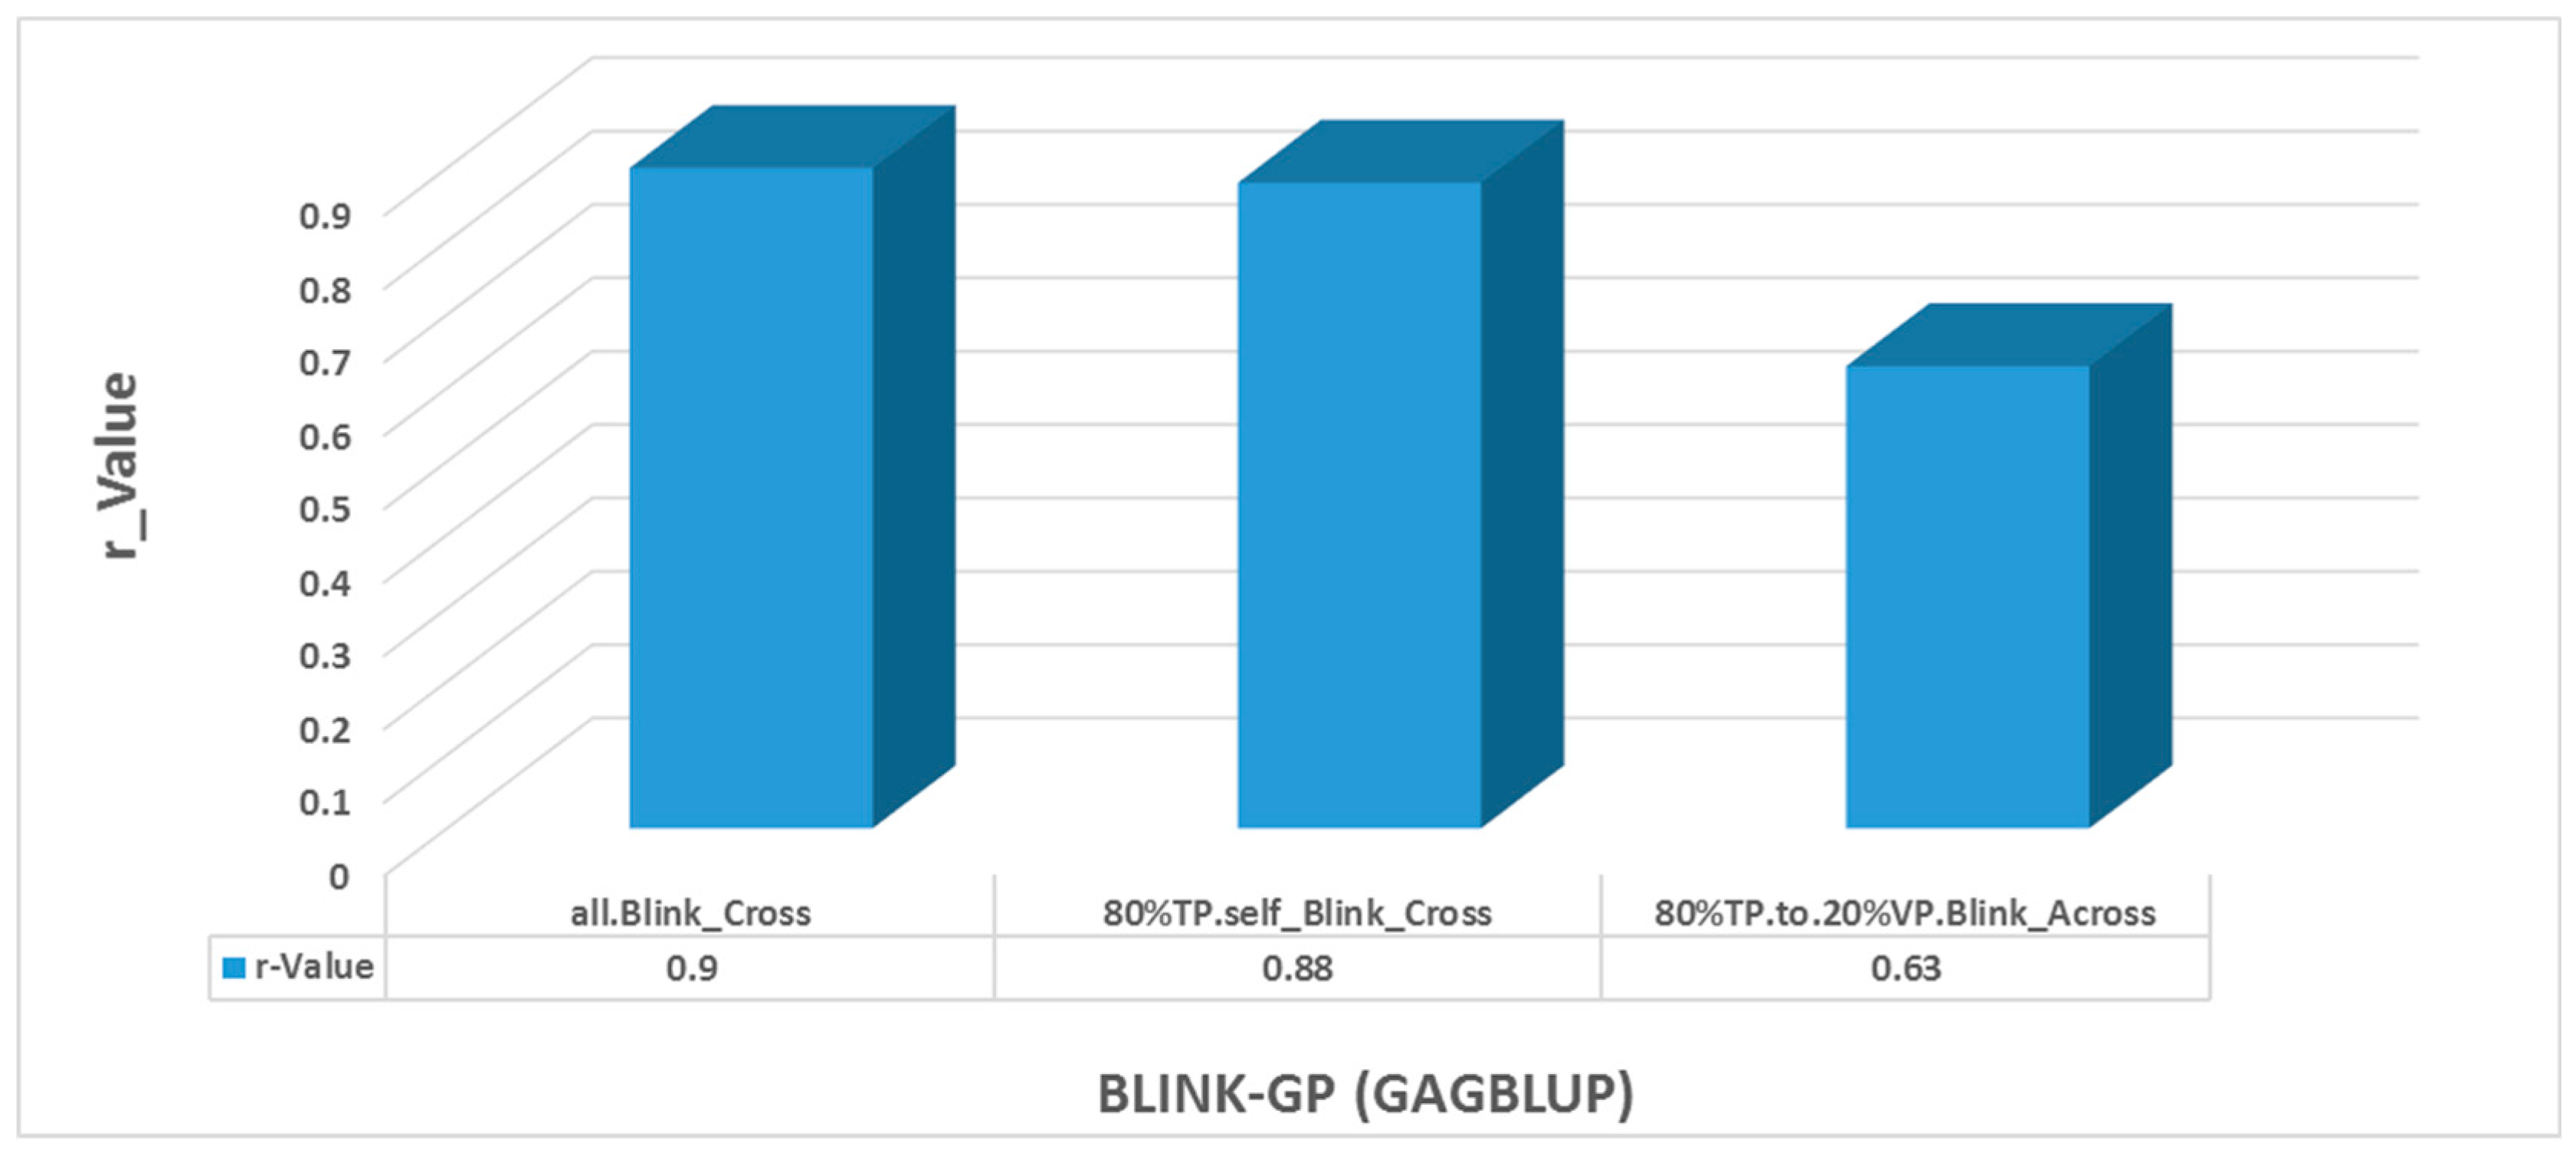
  • Cross-population prediction for entire panel self (all. Blink_Cross)—GWAS-derived SNP markers identified by the BLINK model were used to predict Genomic Estimated Breeding Values (GEBVs) for the entire population of 290 accessions;
  • Cross-population prediction for training population (80%TP.self_Blink_Cross)—SNP markers derived from the training population (TP; 232 accessions) were used for self-prediction within the same training set;
  • Across-population prediction (80%TP.to.20%VP. Blink_Across)—SNP markers identified from the TP (80%; 232 accessions) were applied to predict GEBVs in the validation population (VP; 20%; 53 accessions).
Boxplots depicting the performance of each GP model across different SNP sets were generated using the ggplot2 package in R.

3. Results

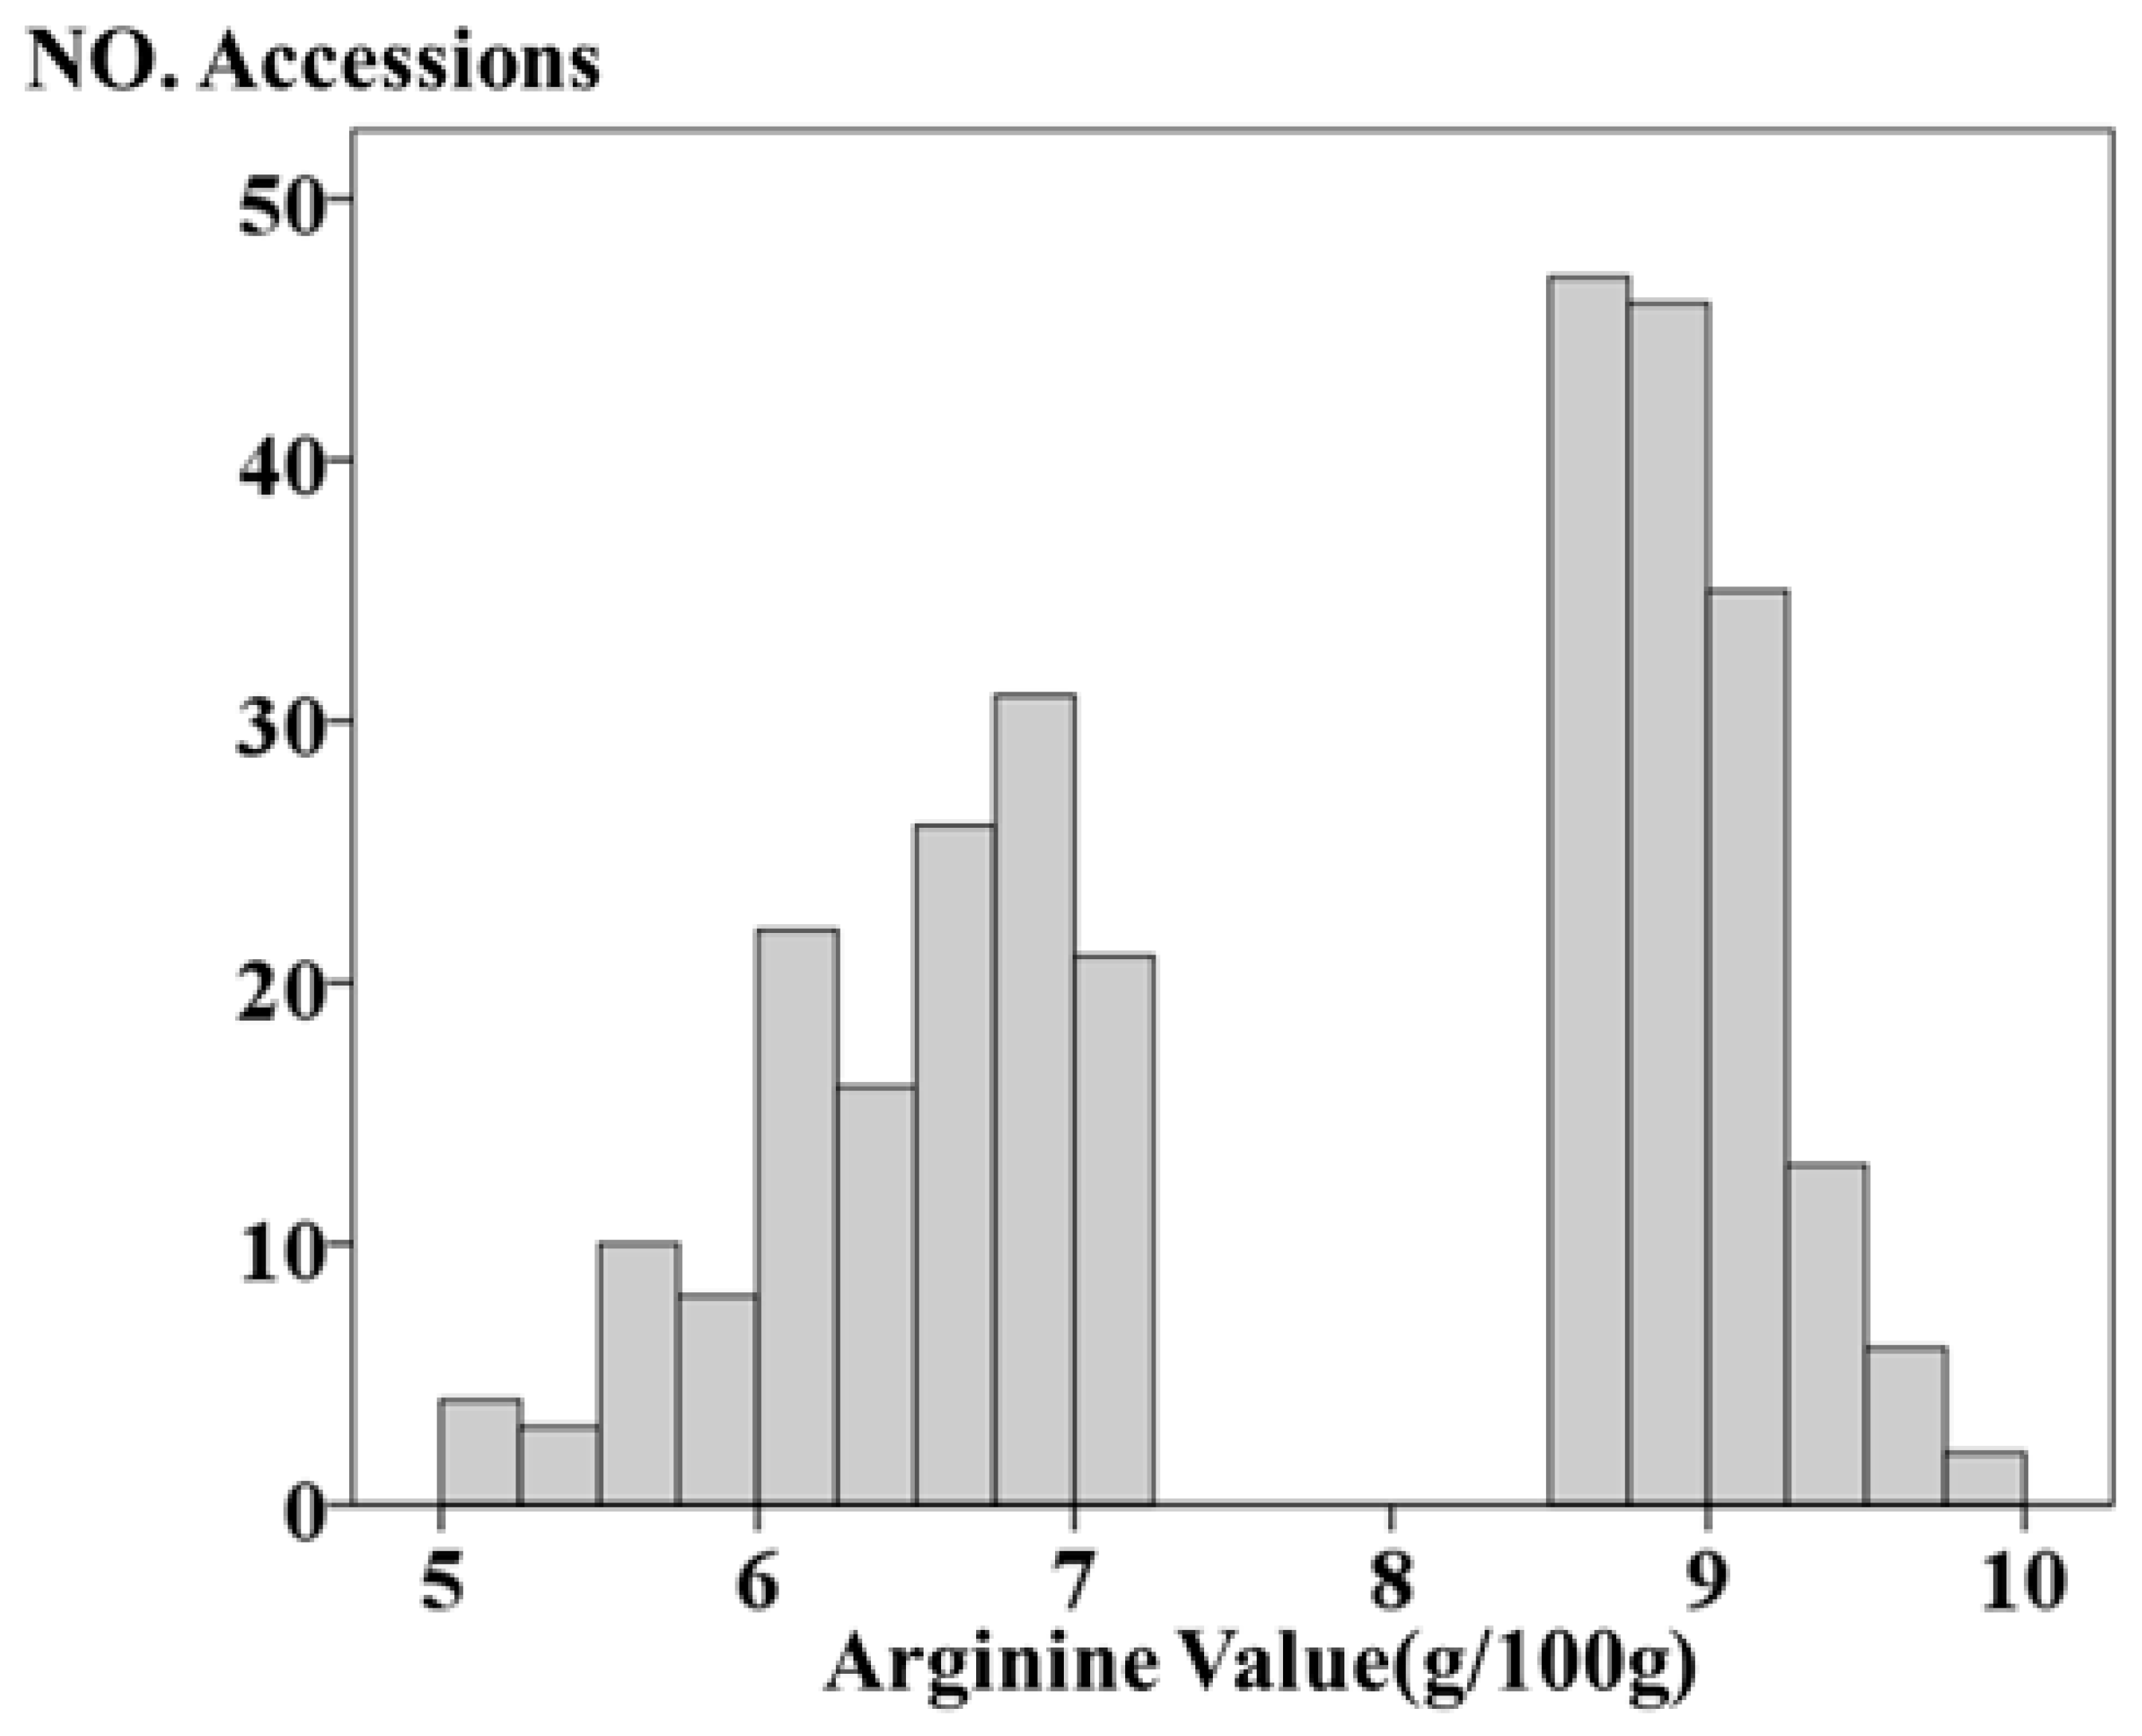
3.1. Phenotypic Analysis of Arginine Content

The arginine content of the 290 soybean accessions exhibited significant variation. The average arginine content was 7.72% of total protein, with a standard deviation of 1.31 and a coefficient of variation of 17.01%. The distribution of arginine content among the accessions was as follows: 7 accessions had arginine content between 5.0% and 5.5% of total protein, 18 between 5.5% and 6.0%, 37 between 6.0% and 6.5%, 54 between 6.5% and 7.0%, 10 between 7.0% and 7.5%, 119 between 8.5% and 9.0%, 40 between 9.0% and 9.5%, and 5 between 9.5% and 10.0%. The distribution of these accessions was concentrated in two distinct intervals: 5.0–7.5% and 8.5–10.0% of total protein, forming a bimodal distribution pattern. The bimodal distribution of arginine content observed among the tested accessions may reflect the existence of at least two subpopulations with distinct genetic backgrounds, or the influence of a major-effect gene or locus that contributes to significant phenotypic differentiation (Figure 1).

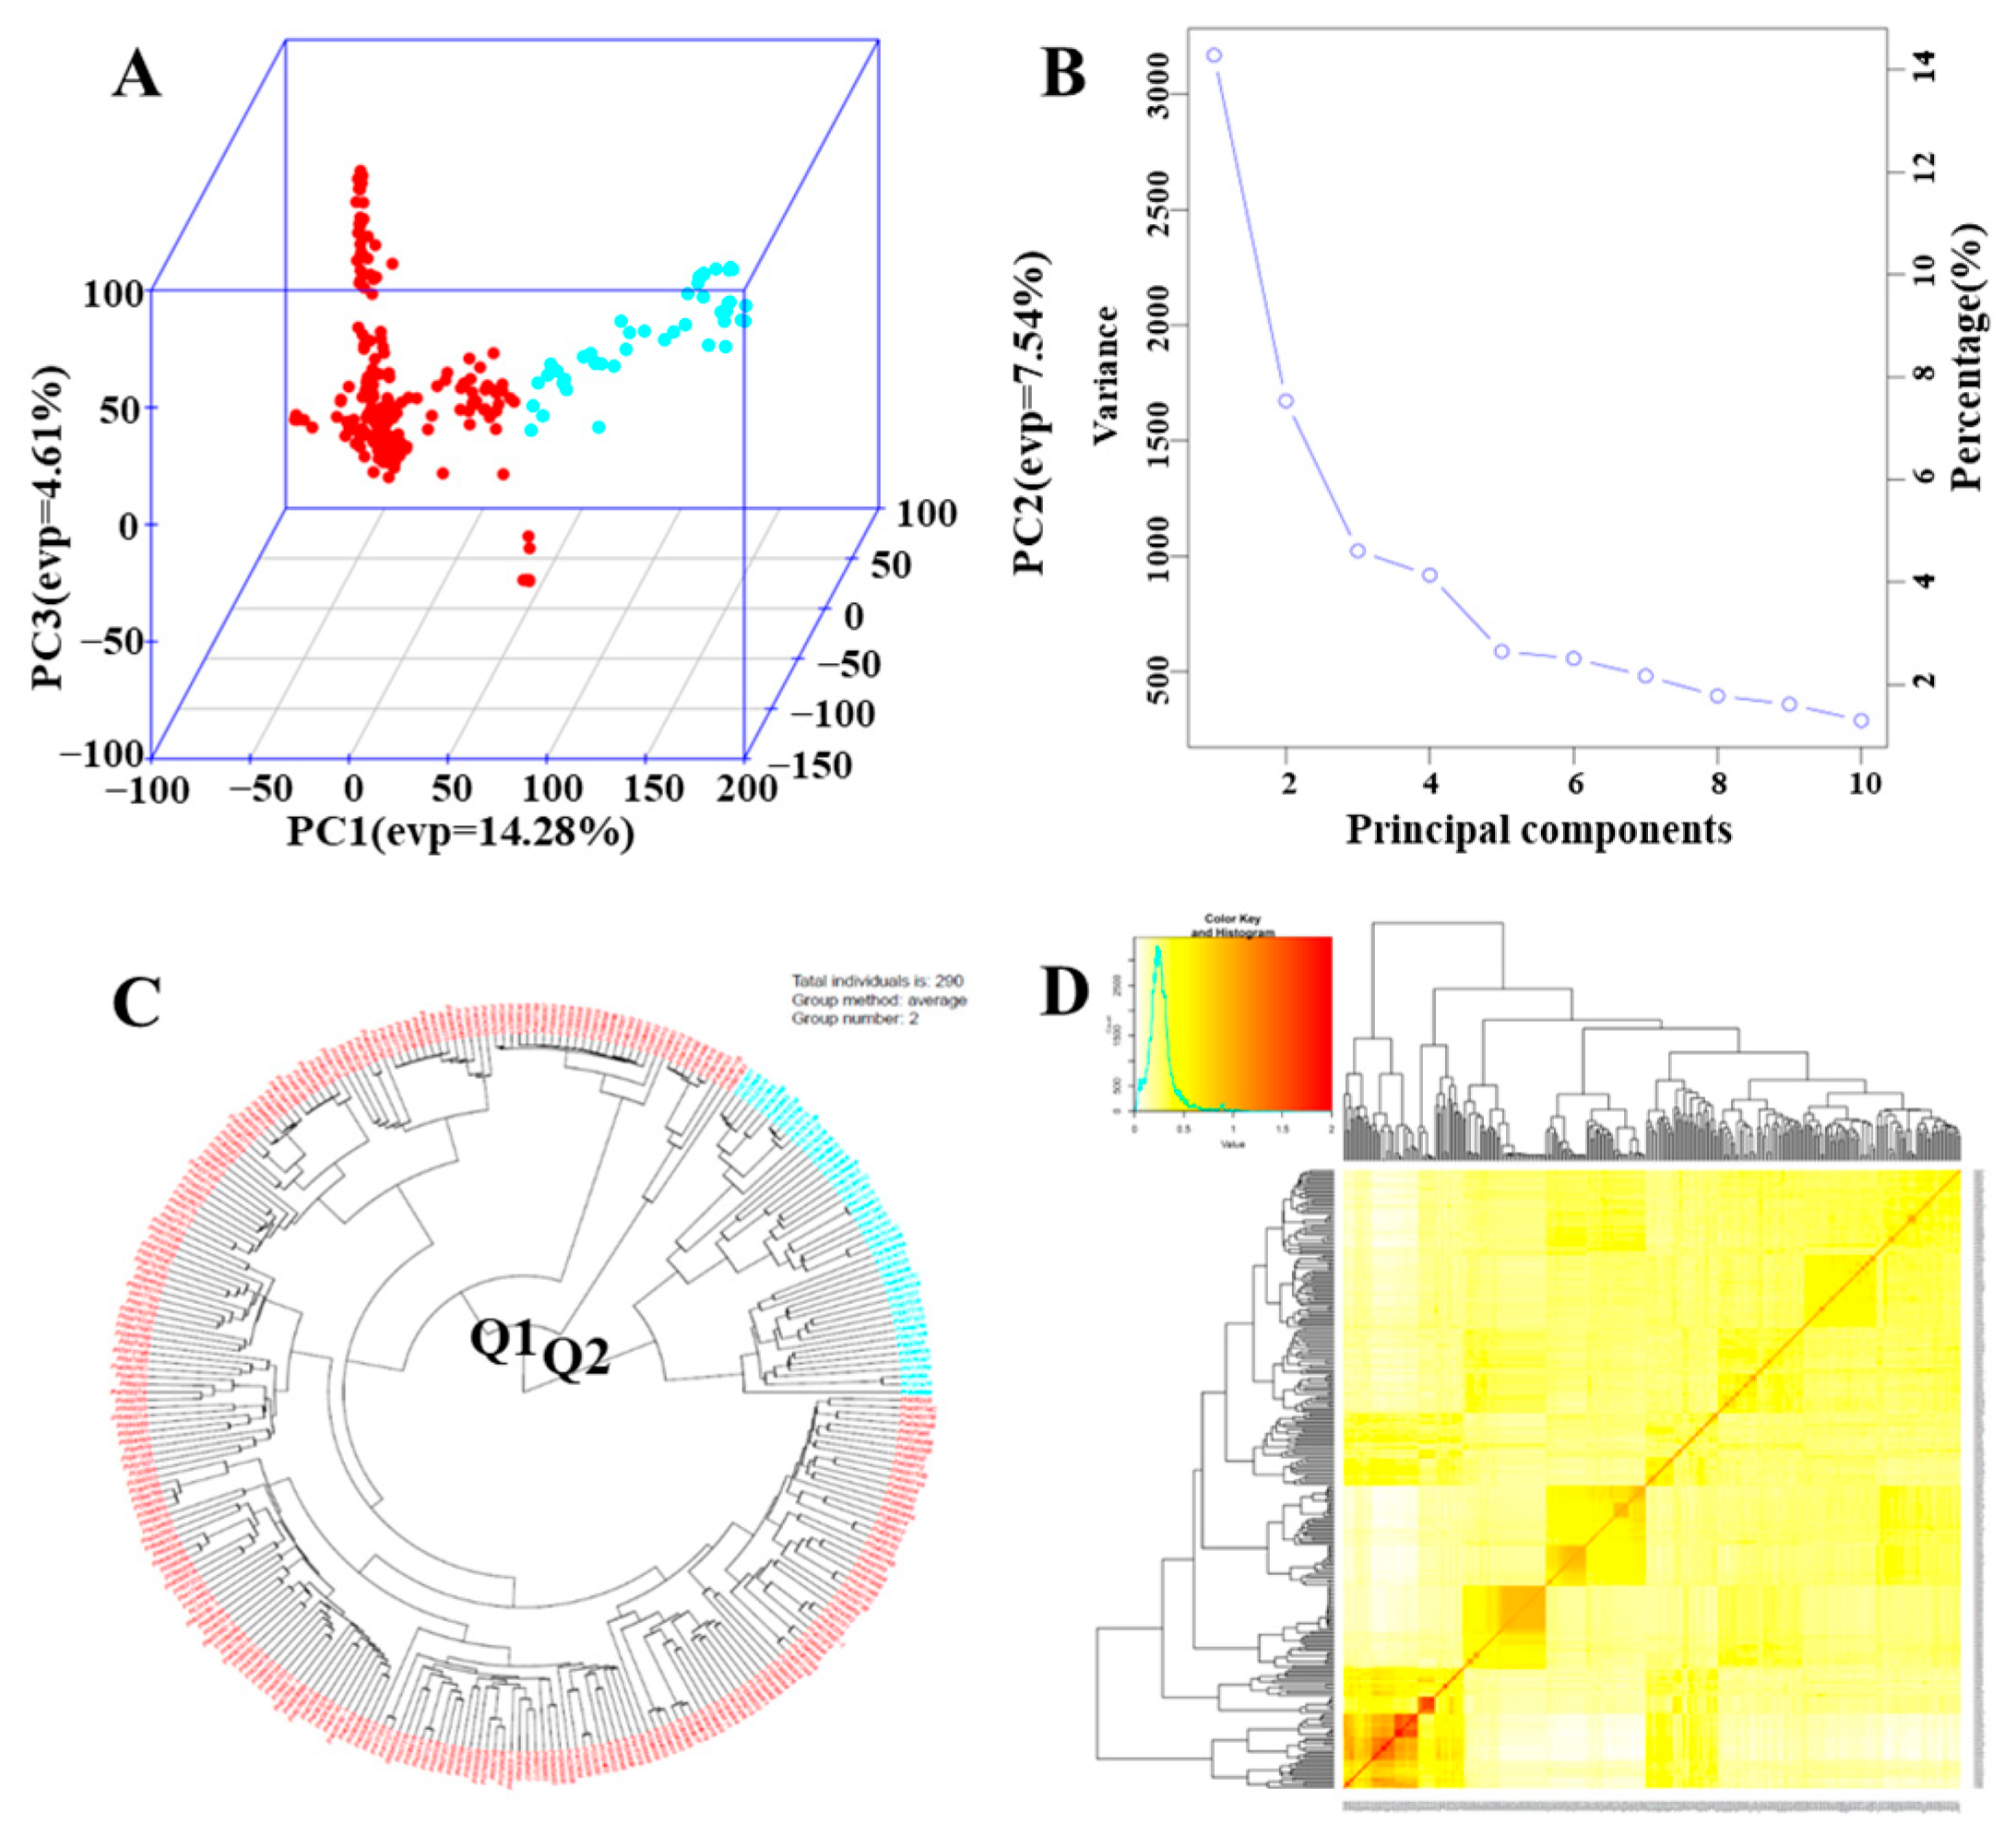
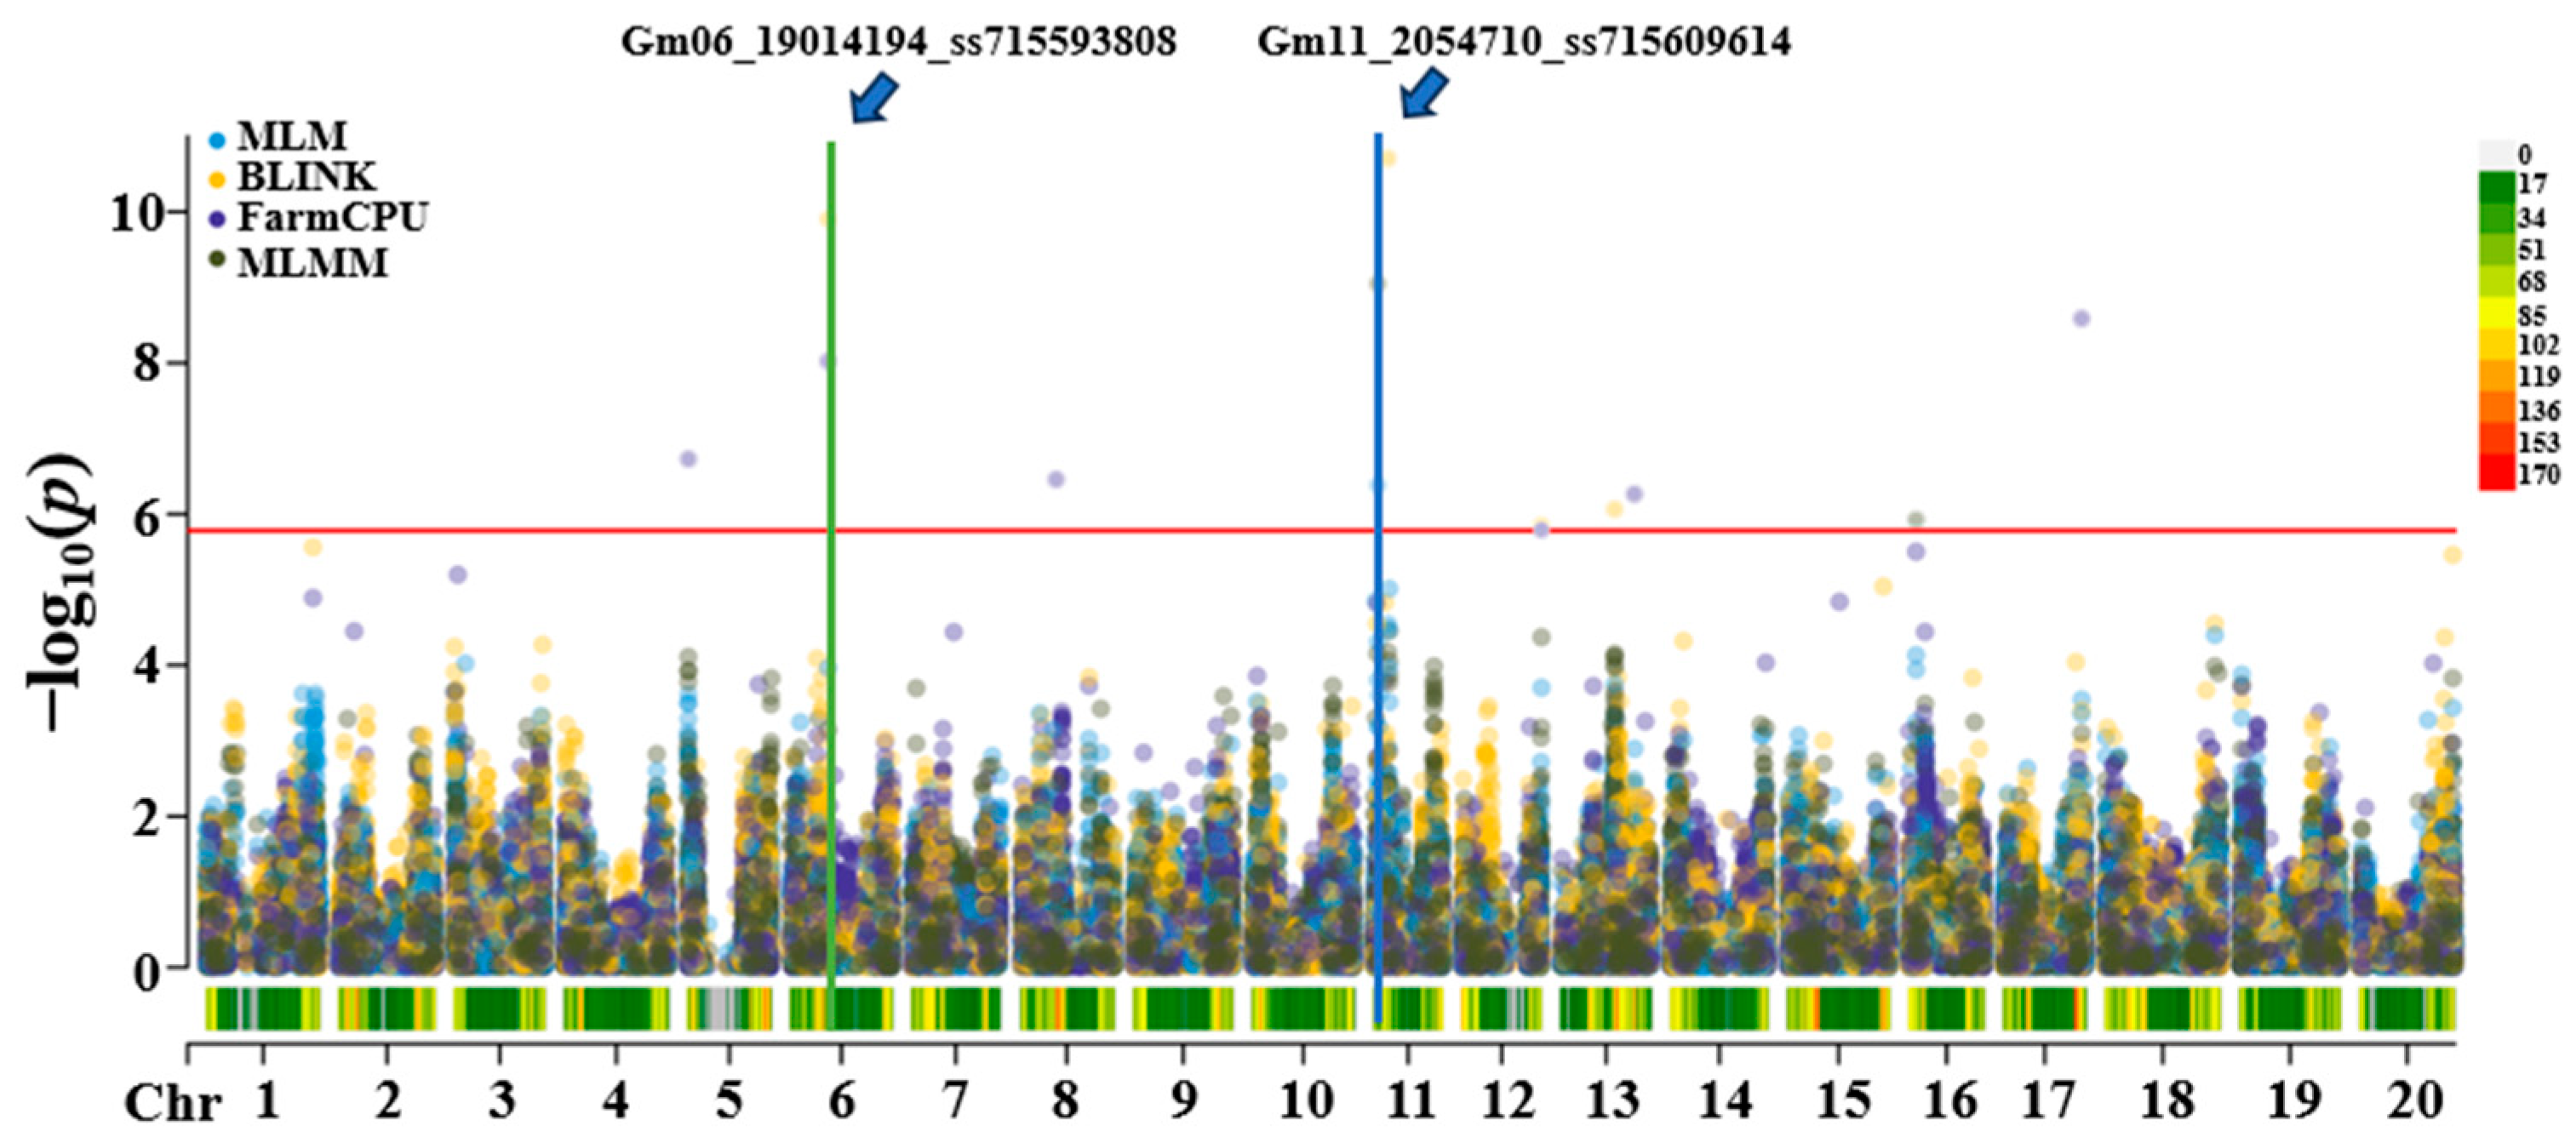
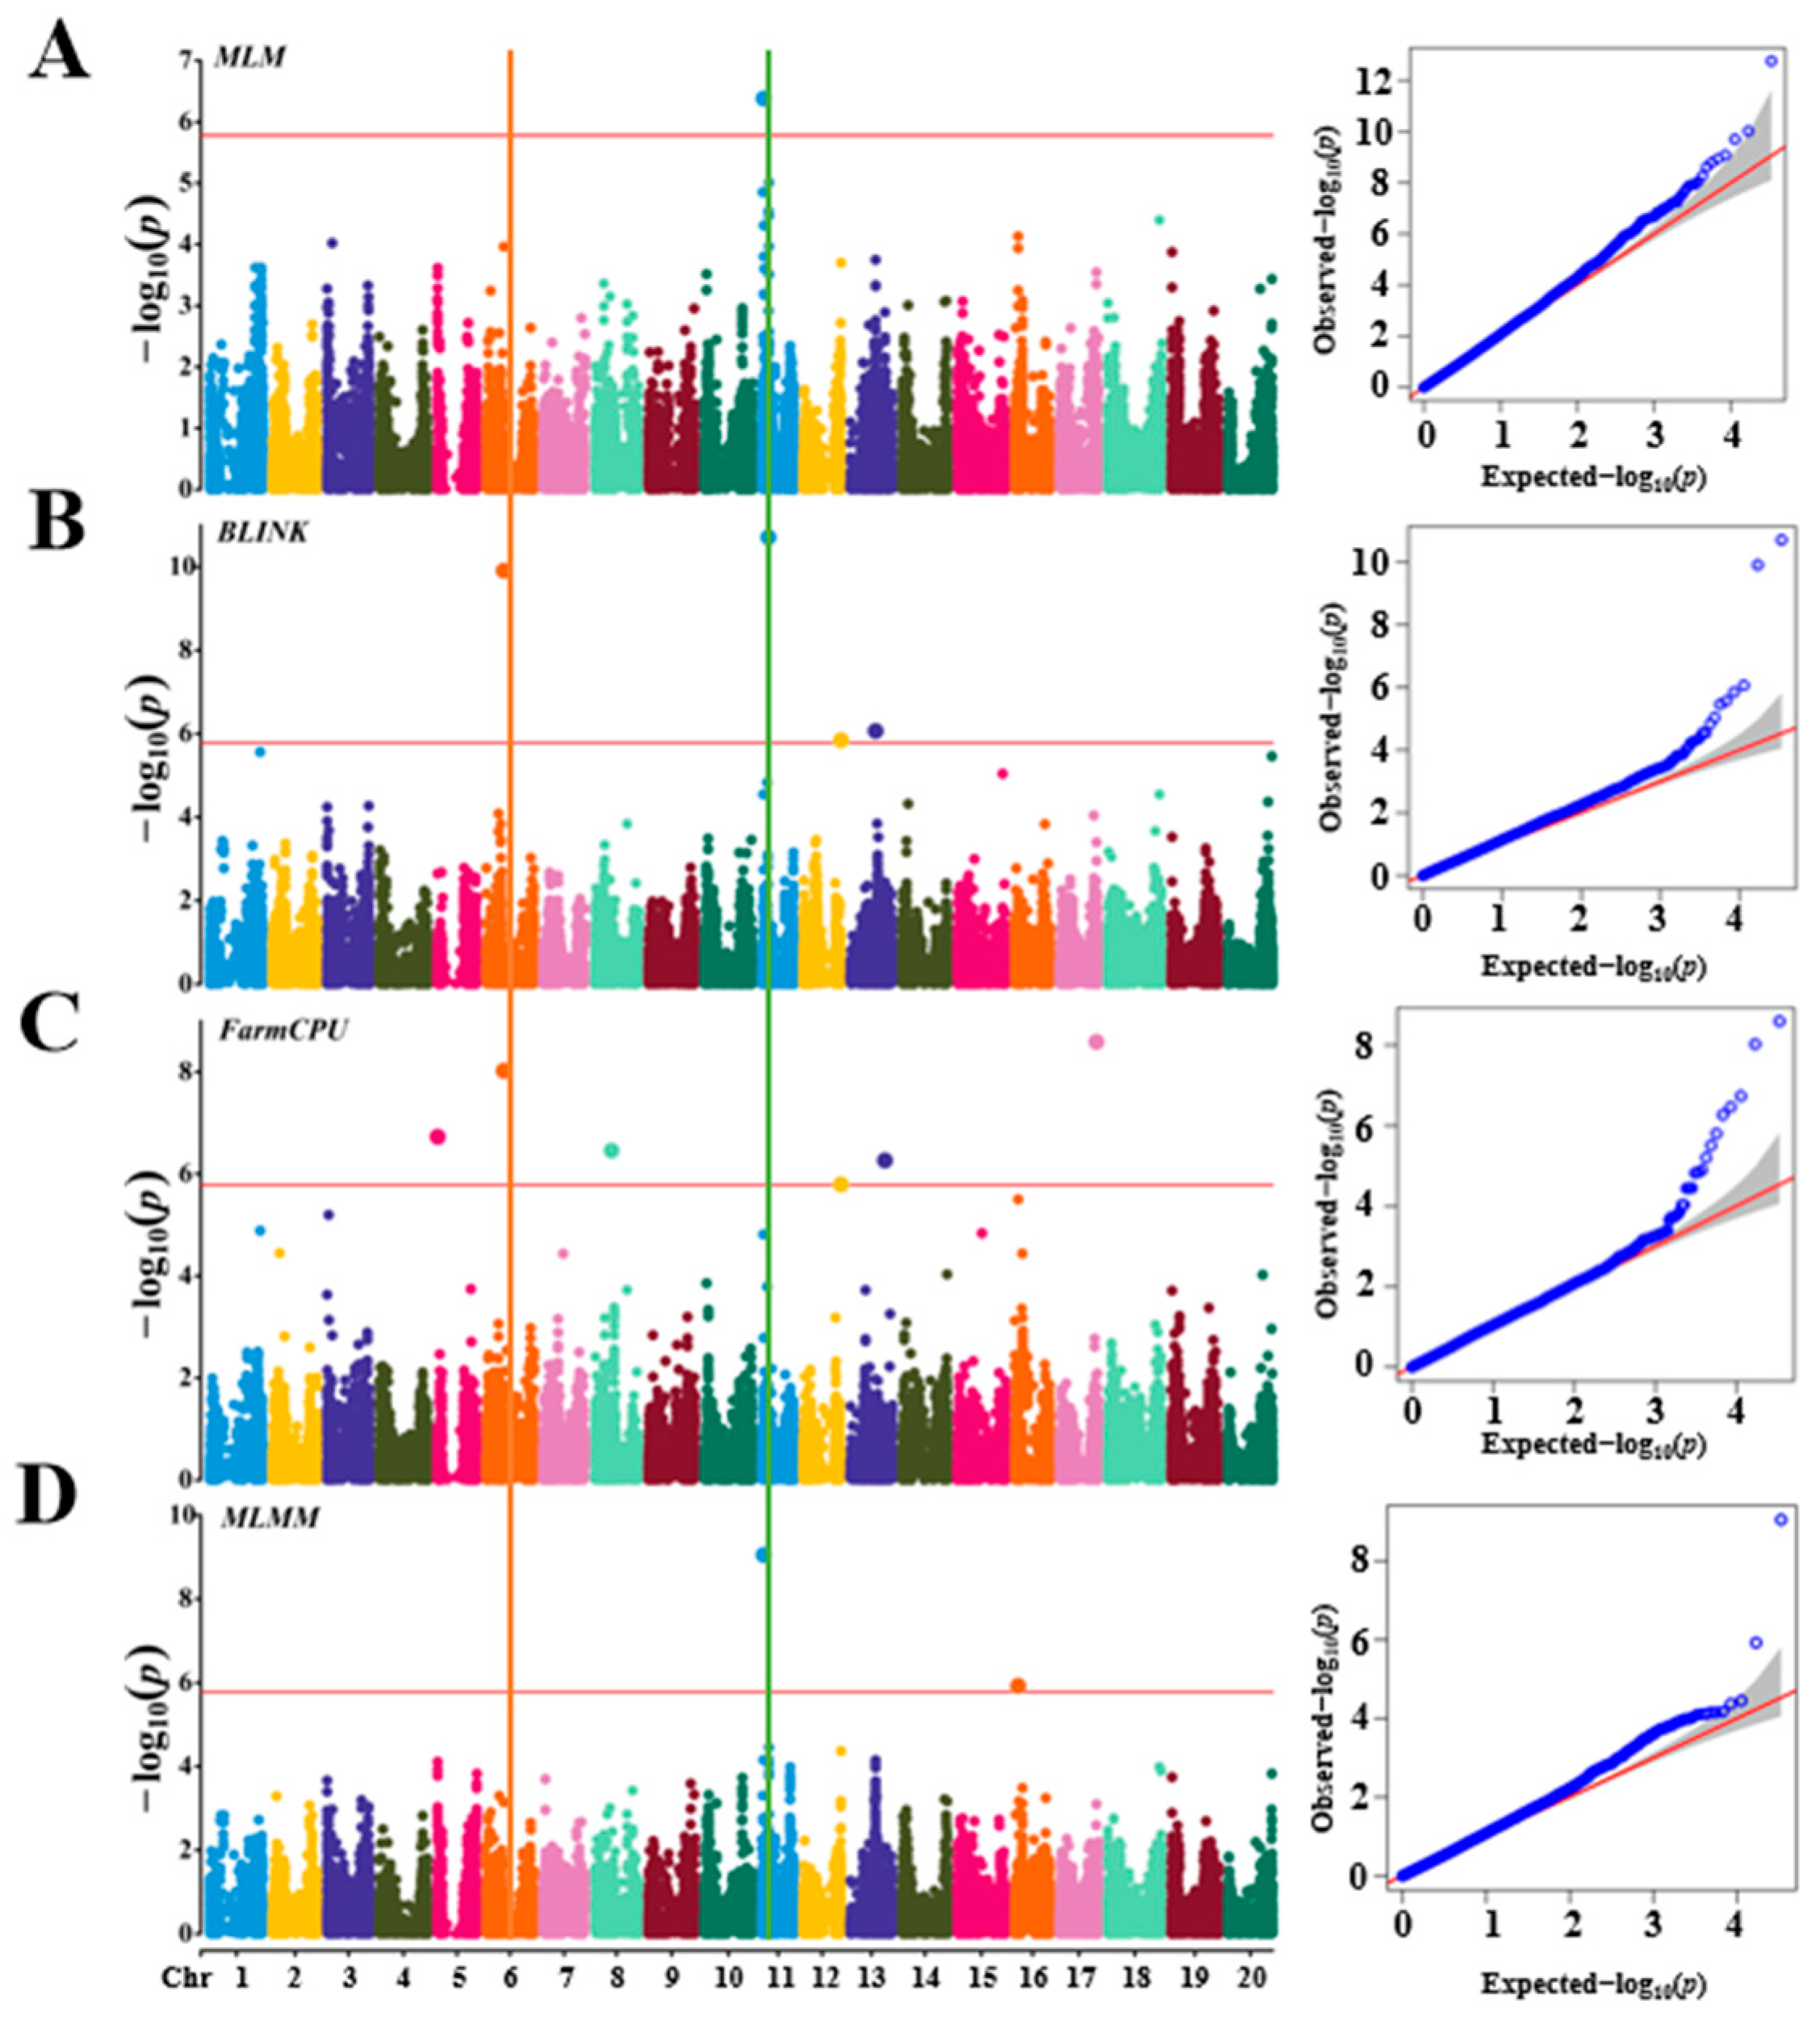
3.2. Population Structure and GWAS

The GAPIT version 3 package was used to analyze the 290 soybean accessions in R version 4.4.0, successfully dividing them into two subgroups, Q1 and Q2 (Figure 2A–D). The two subgroups were clearly separated along the first and second principal components (PC1 and PC2), which explained 14.28% and 7.54% of the genetic variation, respectively (Figure 2A). This suggests significant differences in the genetic composition of materials from different sources. Based on kinship analysis, the kinship coefficients among most inbred lines ranged from 0.0 to 0.5, with only a small portion ranging from 0.5 to 1.0. This indicates that the 290 accessions are distantly related, with a degree of genetic independence, which improves the accuracy of detecting loci associated with arginine content (Figure 2D).
A GWAS for soybean arginine content was performed using four models: MLM, FarmCPU, BLINK, and MLMM. The significance threshold was set at LOD ≥ 5.78, and Phenotypic Variation Explained (PVE) values were calculated using GAPIT version 3. Two significant loci associated with arginine content in soybean were identified:
(1) Gm11_2054710_ss715609614, located at 2,054,710 bp on chromosome 11, with LOD values of 6.38 in MLM and 9.05 in MLMM (Table 1) This SNP explained over 19% of the phenotypic variation, with a corresponding t-test value of 21.24, indicating a highly significant association.
(2) Gm06_19014194_ss715593808, located at 19,014,194 bp on chromosome 6, with LOD values of 9.91 in BLINK and 8.02 in FarmCPU (Table 1) This SNP explained up to 3.91% of the phenotypic variation, with a t-test value of 7.23, also indicating a highly significant association.
These findings are summarized in Table 1 and illustrated in Figure 3 and Figure 4. Both loci were identified by two models simultaneously, suggesting that they are likely major genetic loci controlling soybean arginine content. Additionally, eight other SNPs were also associated with arginine content, respectively (Table 1).

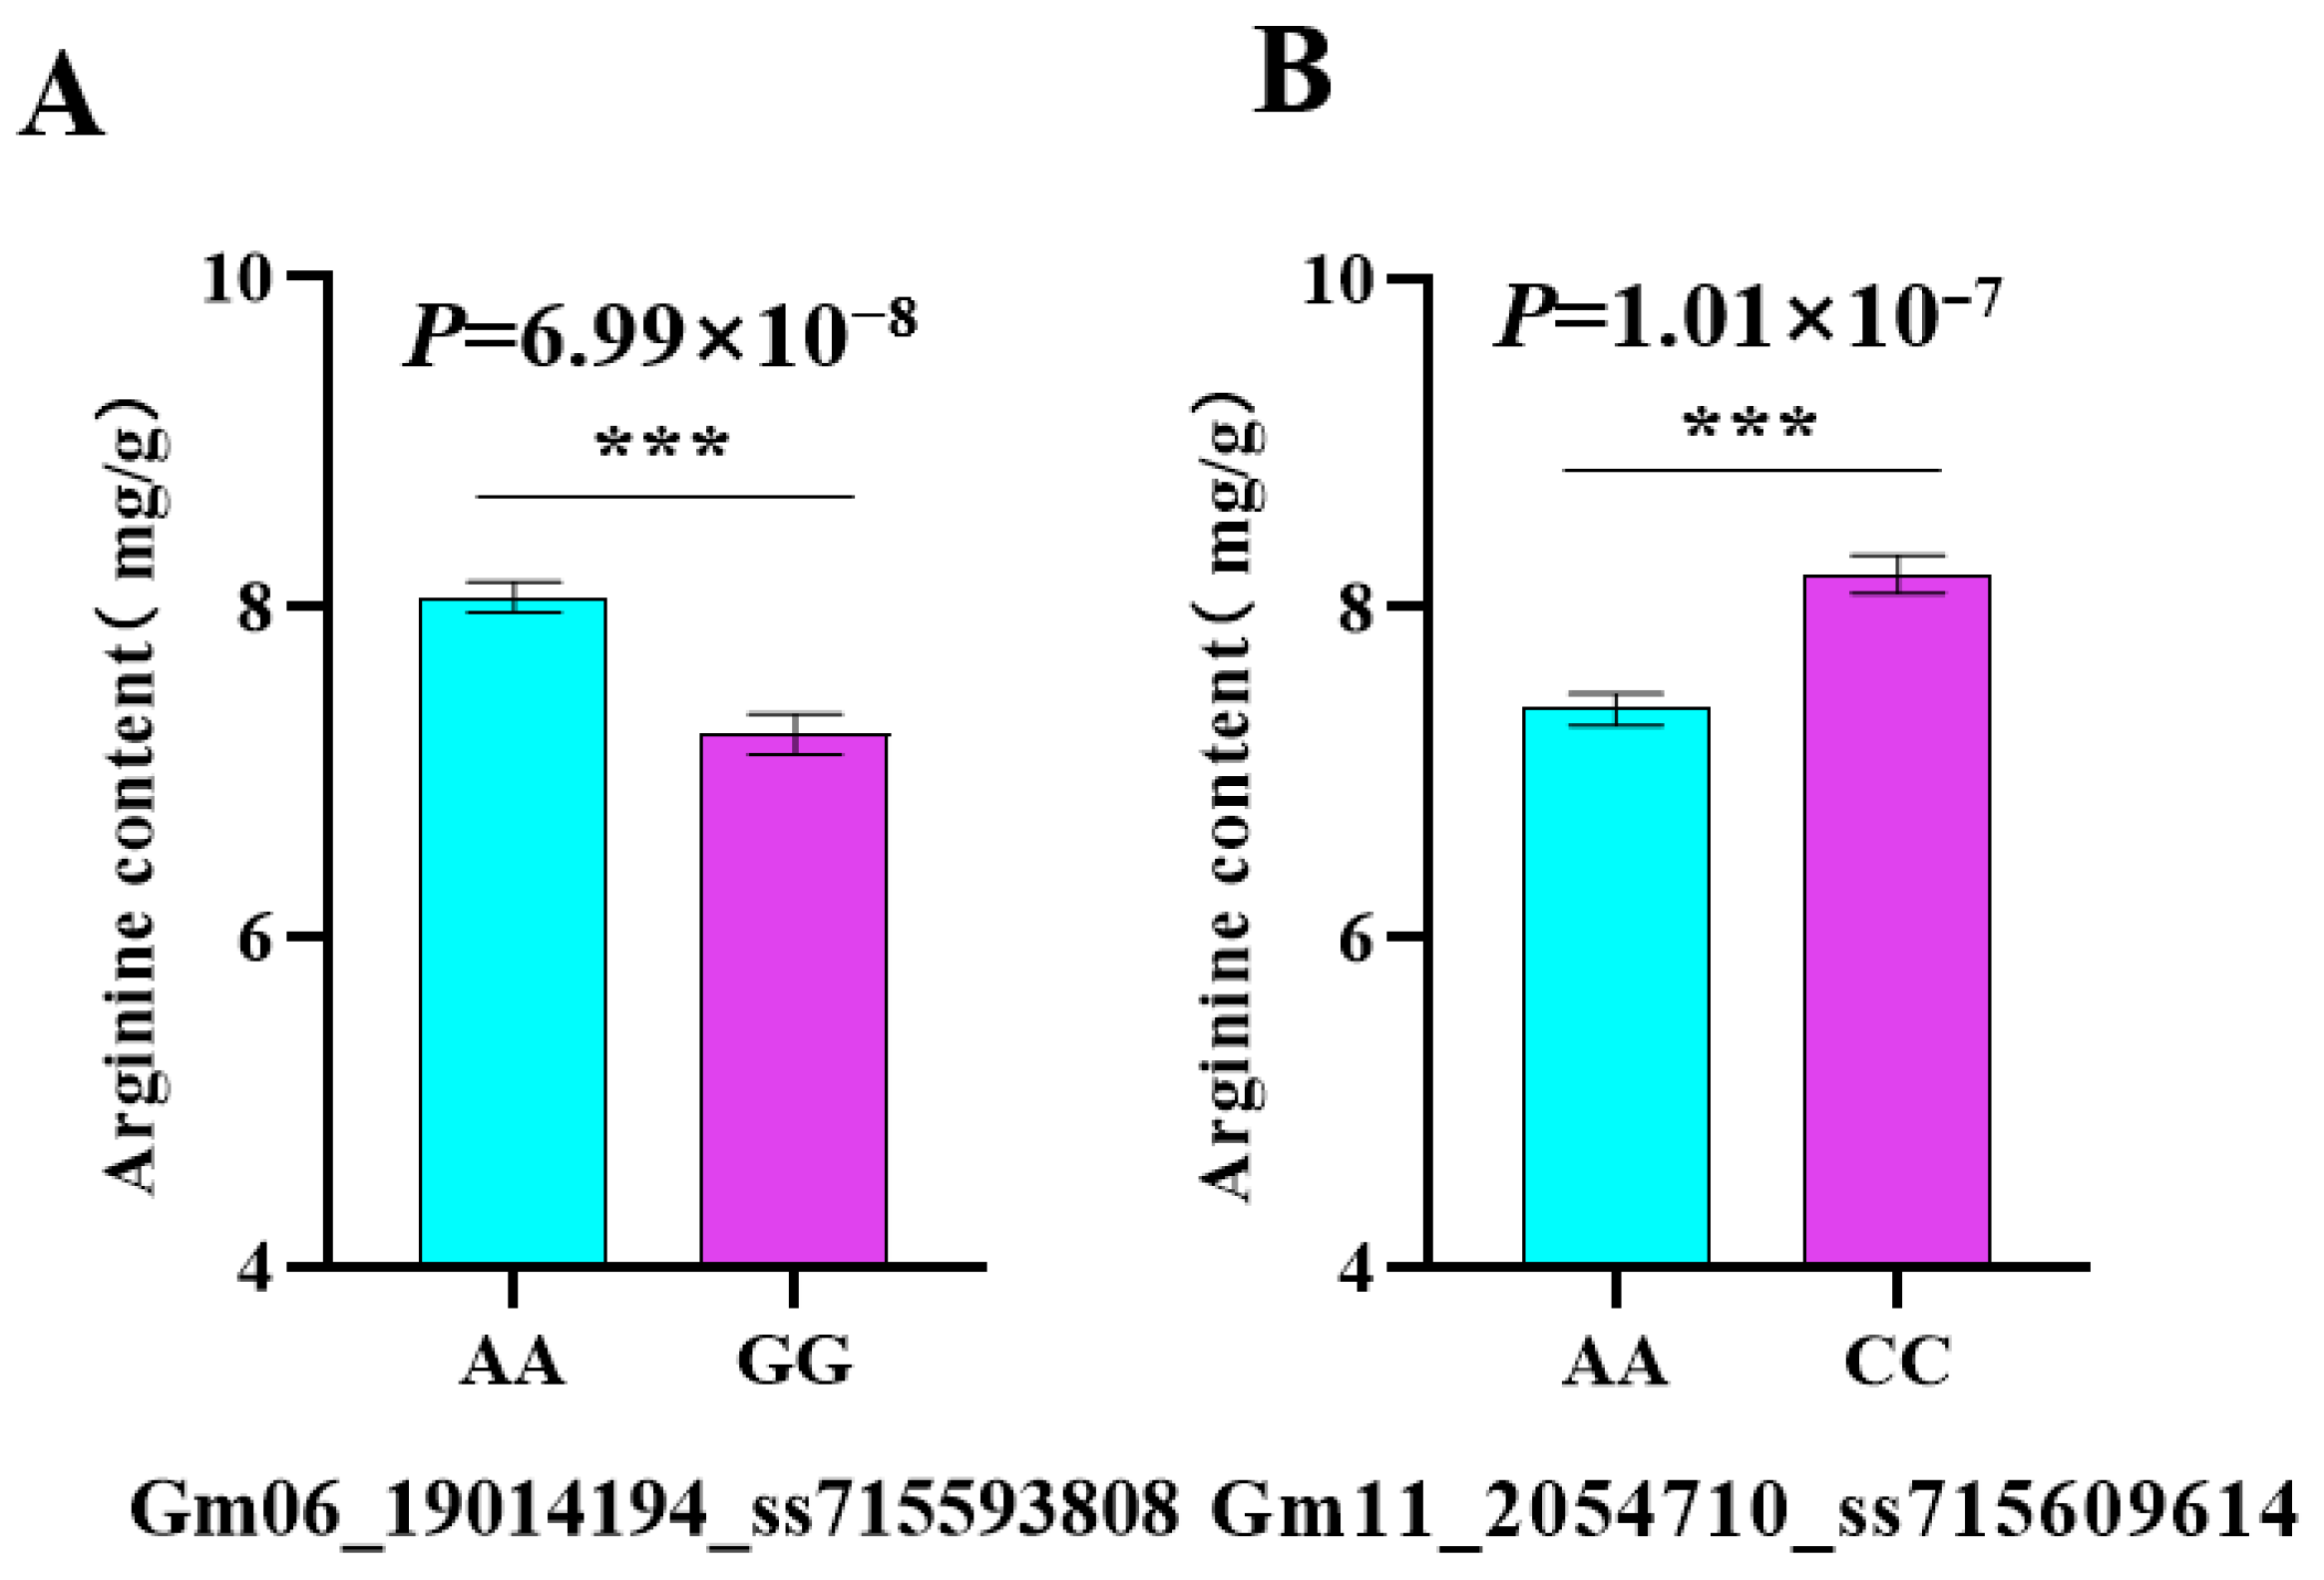
3.3. Haplotype Analysis

Genotyping was performed using the USDA Soybean Accessions Soy50K SNP Infinium chip, downloaded from SoyBase (https://www.soybase.org/snps/) (accessed on 23 April 2025). Based on the genotype data, the locus Gm06_19014194_ss715593808 contains two haplotypes: AA and GG. An Analysis of Variance (ANOVA), conducted using both the genotype and phenotypic data, revealed that the AA genotype significantly increased soybean arginine content by 11.48% compared to the GG genotype (p < 0.001). Similarly, the locus Gm11_2054710_ss715609614 contains two haplotypes: AA and CC. ANOVA analysis for the AA and CC genotypes showed that the CC genotype significantly increased soybean arginine content by 10% compared to the AA genotype (p < 0.001) (Figure 5).

3.4. Candidate Gene Detection

Within the 5 kb of the ten associated SNP markers, a total of 15 genes were identified, except for Glyma.06g203200, which is located approximately 15 kb from Gm06_19014194_ss715593808 (Table S3). Among these, the gene Glyma.06g203200 is closely linked to the SNP marker Gm06_19014194_ss715593808 on chromosome 6, located within a 15 kb distance. Gene annotation reveals that this gene encodes a mitochondrial ATPase (ATP synthase), which is essential for cellular energy metabolism. The metabolic products of arginine may indirectly regulate ATP synthase activity by influencing mitochondrial function. Furthermore, the gene Glyma.11G028600 is closely linked to the SNP marker Gm11_2054710_ss715609614 on chromosome 11, also within a 5 kb distance. Annotation suggests that this gene encodes the Ycf49 protein, which is putatively involved in regulating energy metabolism during photosynthesis, which may in turn influence amino acid biosynthesis. Given that arginine is a key amino acid in energy metabolism, it is likely to interact with Ycf49’s function by modulating relevant metabolic pathways.

3.5. Genomic Prediction Using Whole Panel to Predict Itself

The GP analysis conducted using the GAGBLUP (maBLUP), gBLUP, and sBLUP models yielded r-values of 0.95, 0.99, and 0.75, respectively (Figure 6). These estimates were obtained by predicting the arginine content of 290 soybean accessions, which were utilized as both the training and validation sets. The results highlight the effectiveness of Genomic Selection (GS) in identifying soybean accessions with high arginine content.

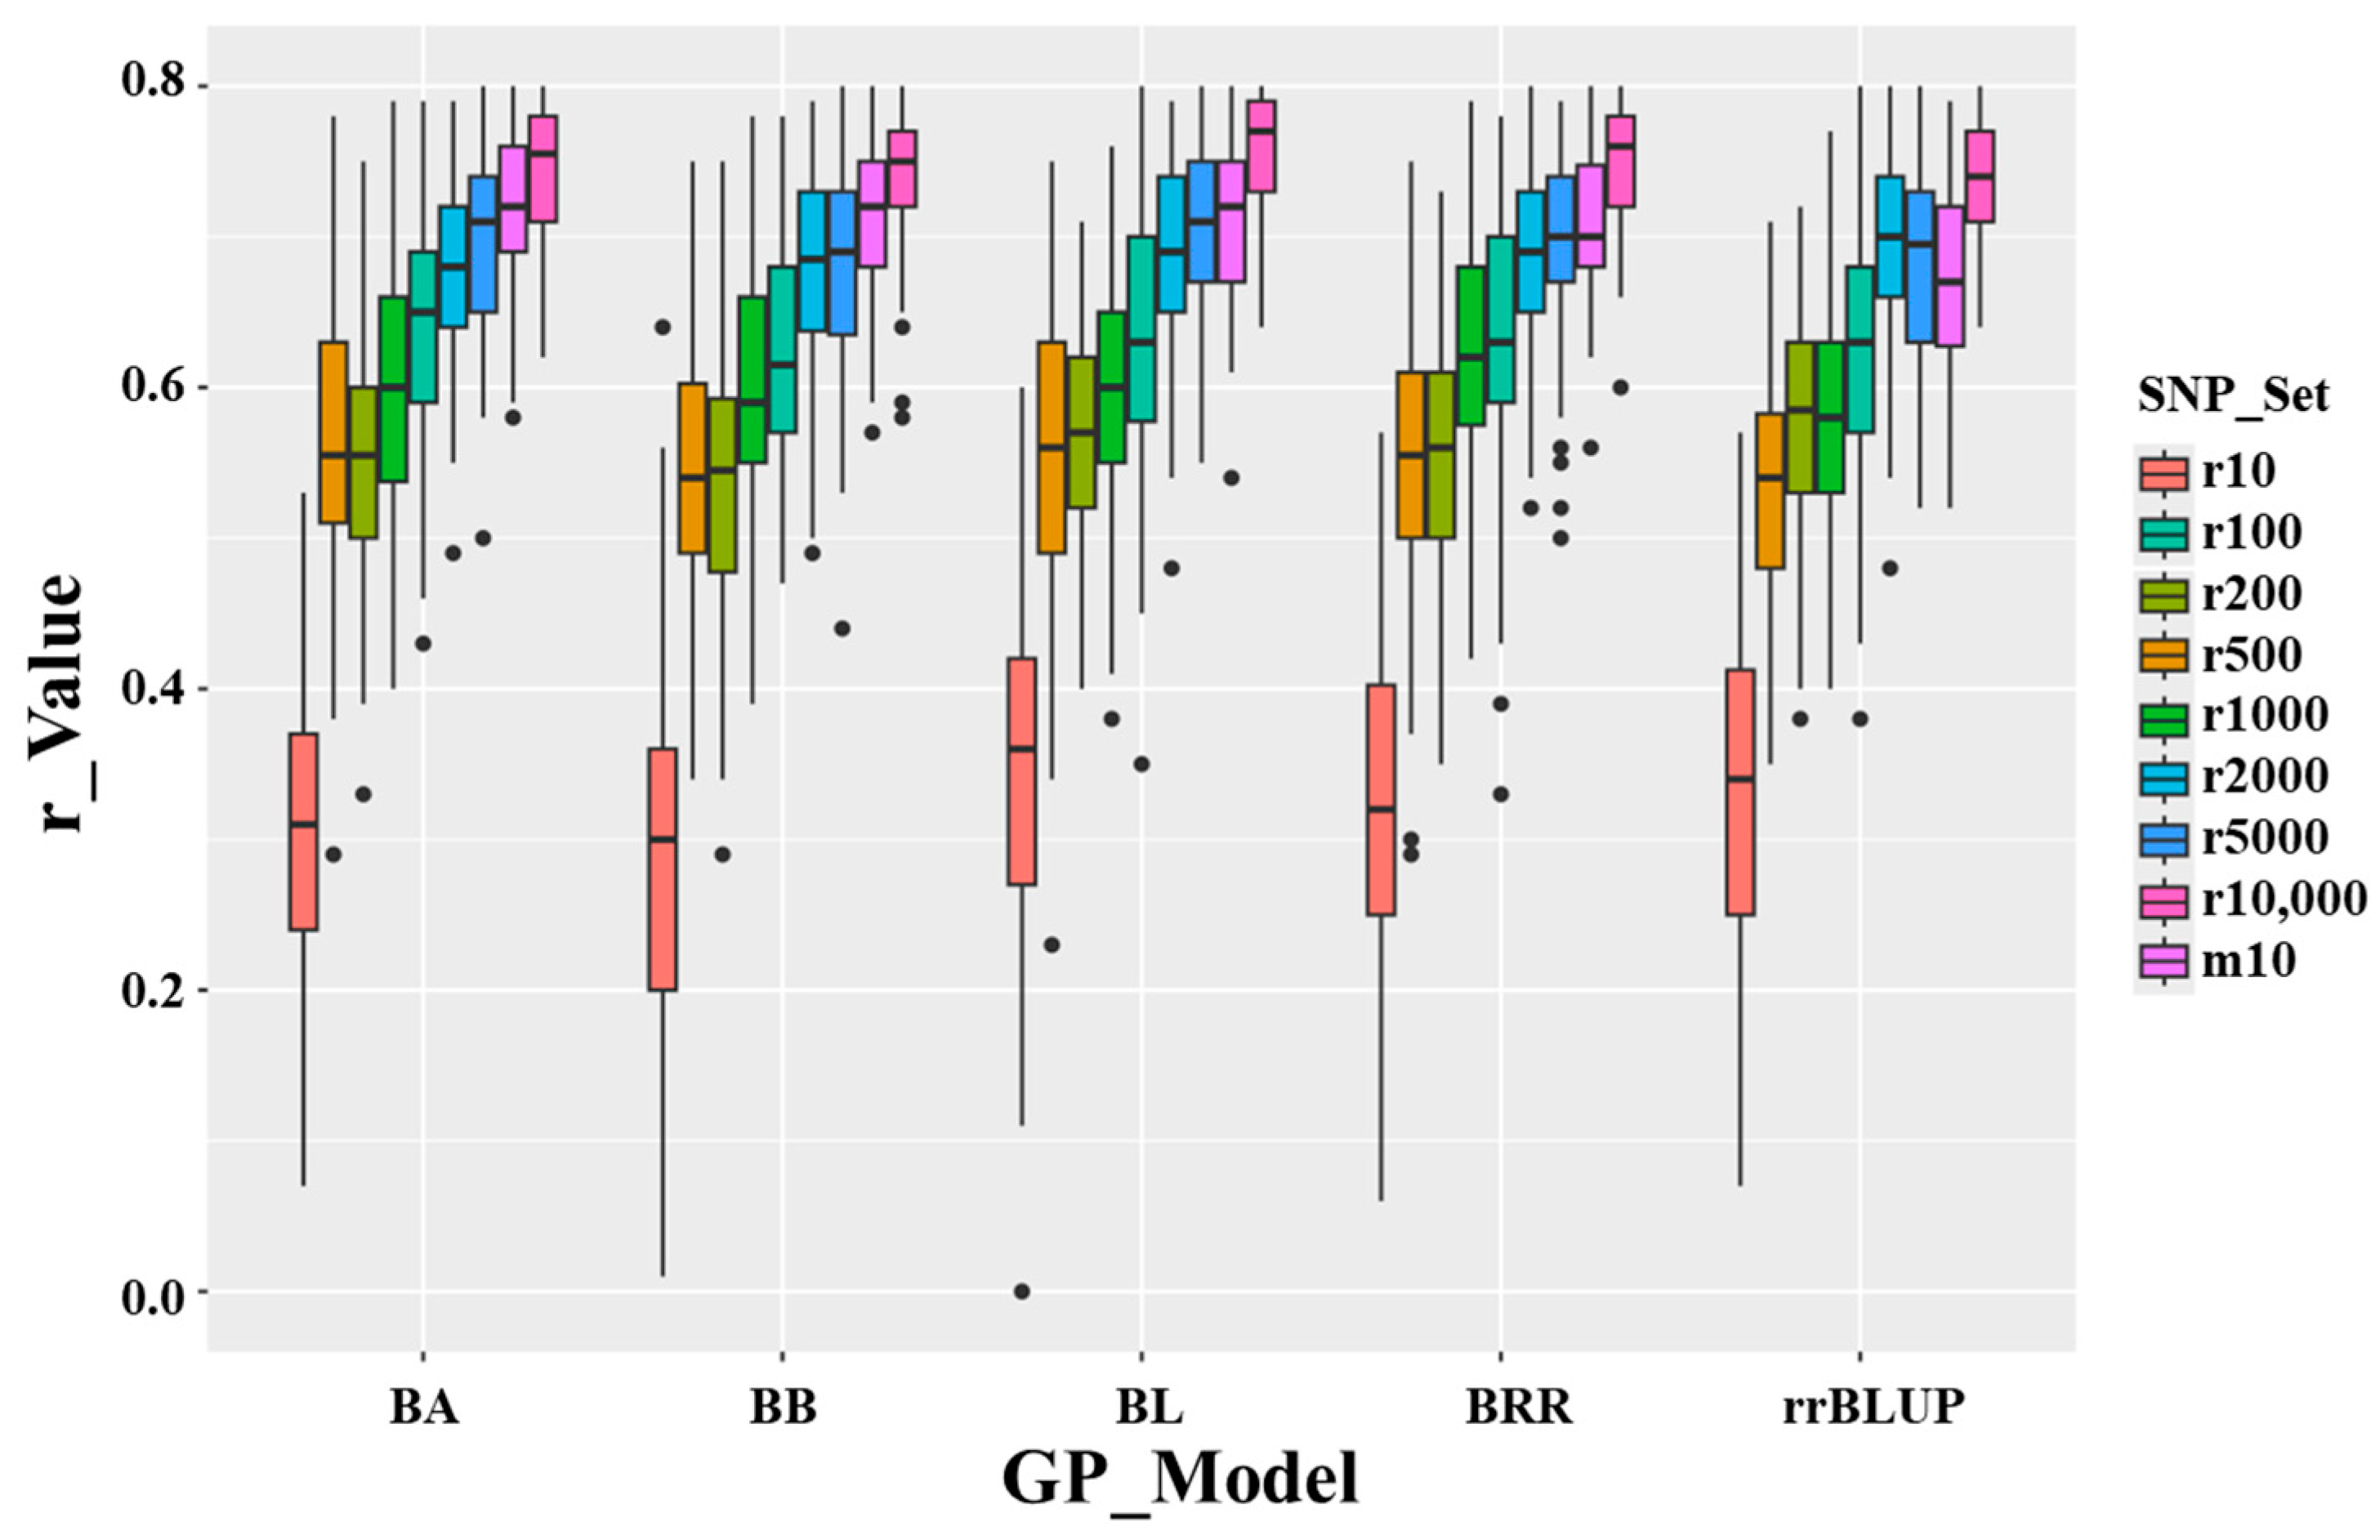
3.6. Genomic Prediction Using Randomly Selected SNPs for Cross-Prediction

The average r-values for GP based on randomly selected SNPs are as follows: r10 = 0.32 (range: 0.28–0.34); r100 = 0.63 (range: 0.62–0.64); r1000 = 0.60 (range: 0.58–0.62); r5000 = 0.69 (range: 0.68–0.71); r10,000 = 0.76 (range: 0.75–0.77) (Table 2, Figure 7). These results indicate that the r-value increases as the number of randomly selected SNPs rises, from an average of 0.32 for the 10-SNP set to an average of 0.76 for the 10,000-SNP set. This suggests that, for GS targeting high arginine content, a random SNP set requires ≥1000 SNPs to achieve an r-value of at least 0.48.

3.7. Genomic Prediction by GWAS-Derived SNP Markers

3.7.1. GWAS-Derived SNP Markers from the Whole Panel and Self-Prediction

GWAS-derived SNP markers were identified from a comprehensive GWAS panel consisting of 290 soybean accessions, which were used as both the Training Population (TP) and the Validation Population (VP). The m10 set, comprising 10 GWAS-derived SNP markers, demonstrated higher r-values (Figure 8, Supplementary Table S4), confirming their association with the arginine content trait in the panel. However, it is anticipated that these r-values will decrease when the markers are applied for across-population predictions from one population as training to predict another population.

3.7.2. GWAS-Derived SNP Markers from 80% of the Whole Panel

Across all scenarios, GWAS-derived SNP markers generally produced high prediction accuracies, with average r-values around 0.87, ranging from 0.83 in the RF model to 0.88 in the BL model for all (self) cross-population predictions (Table S4, Figure 9, middle panel). For cross-population predictions, the r-values averaged 0.76, ranging from 0.75 in the BB model to 0.79 in the SVM model (Table S4, Figure 9, right panel). However, the prediction accuracy dropped substantially but was still high in across-population scenarios, with an average r-value of 0.54, ranging from 0.52 in the BRR, BA, BB, and BL models to 0.59 in the two other Bayesian models (Table S4, Figure 9, left panel). These results confirm a strong association between GWAS-derived SNP markers and arginine content in soybean and indicate that GS is effective, though less efficient across populations, for improving arginine content in soybean breeding programs.

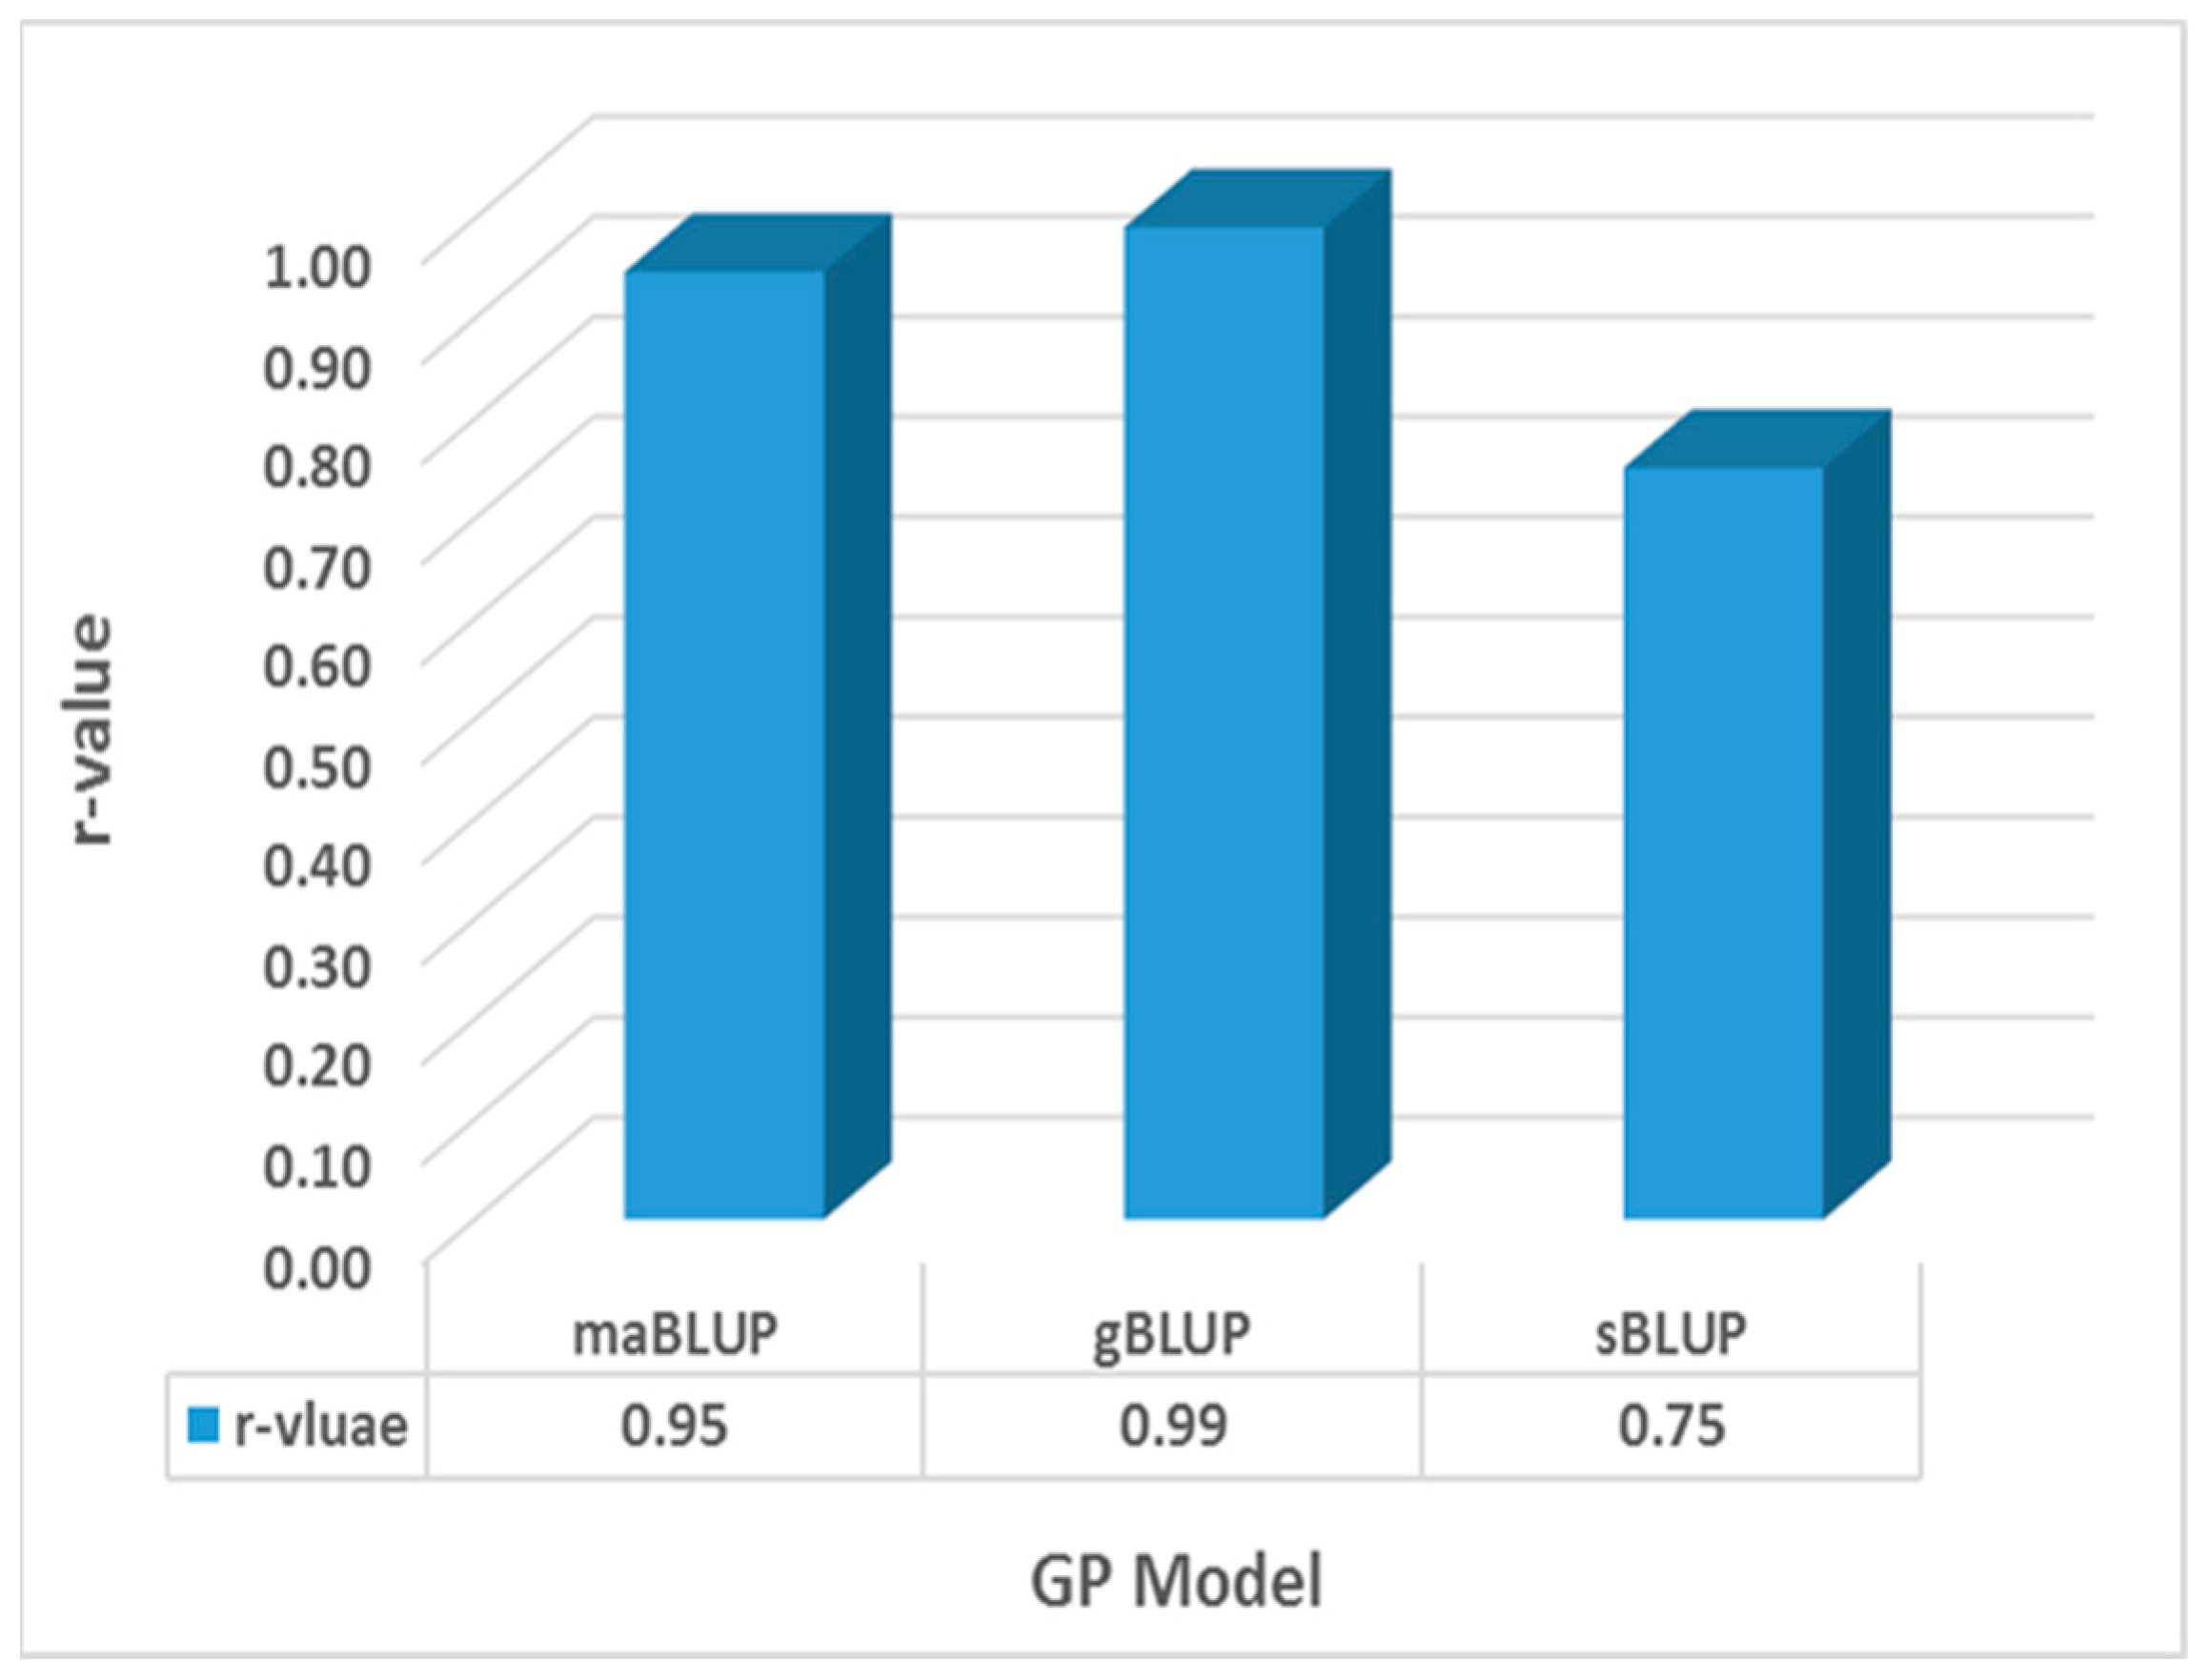
3.8. Genomic Prediction by GAGBLUP from 80% of the Whole Panel

GP was conducted using the GAGBLUP (BLINK) model in GAPIT version 3 (Figure 10). The reference prediction (self-prediction = ‘all. Blink_Cross’) and cross-population prediction (80%TP. self_Blink_Cross’) yielded very high r-values of 0.9 and 0.88, respectively (Figure 10). The across-population (here: ‘80%TP.to.20%VP. Blink_Across’) also had high r-value of 0.63. These findings suggest that GP using only the significant SNP markers identified by GAGBLUP will be highly effective for selecting the arginine content in soybean through GS across- and cross-populations.

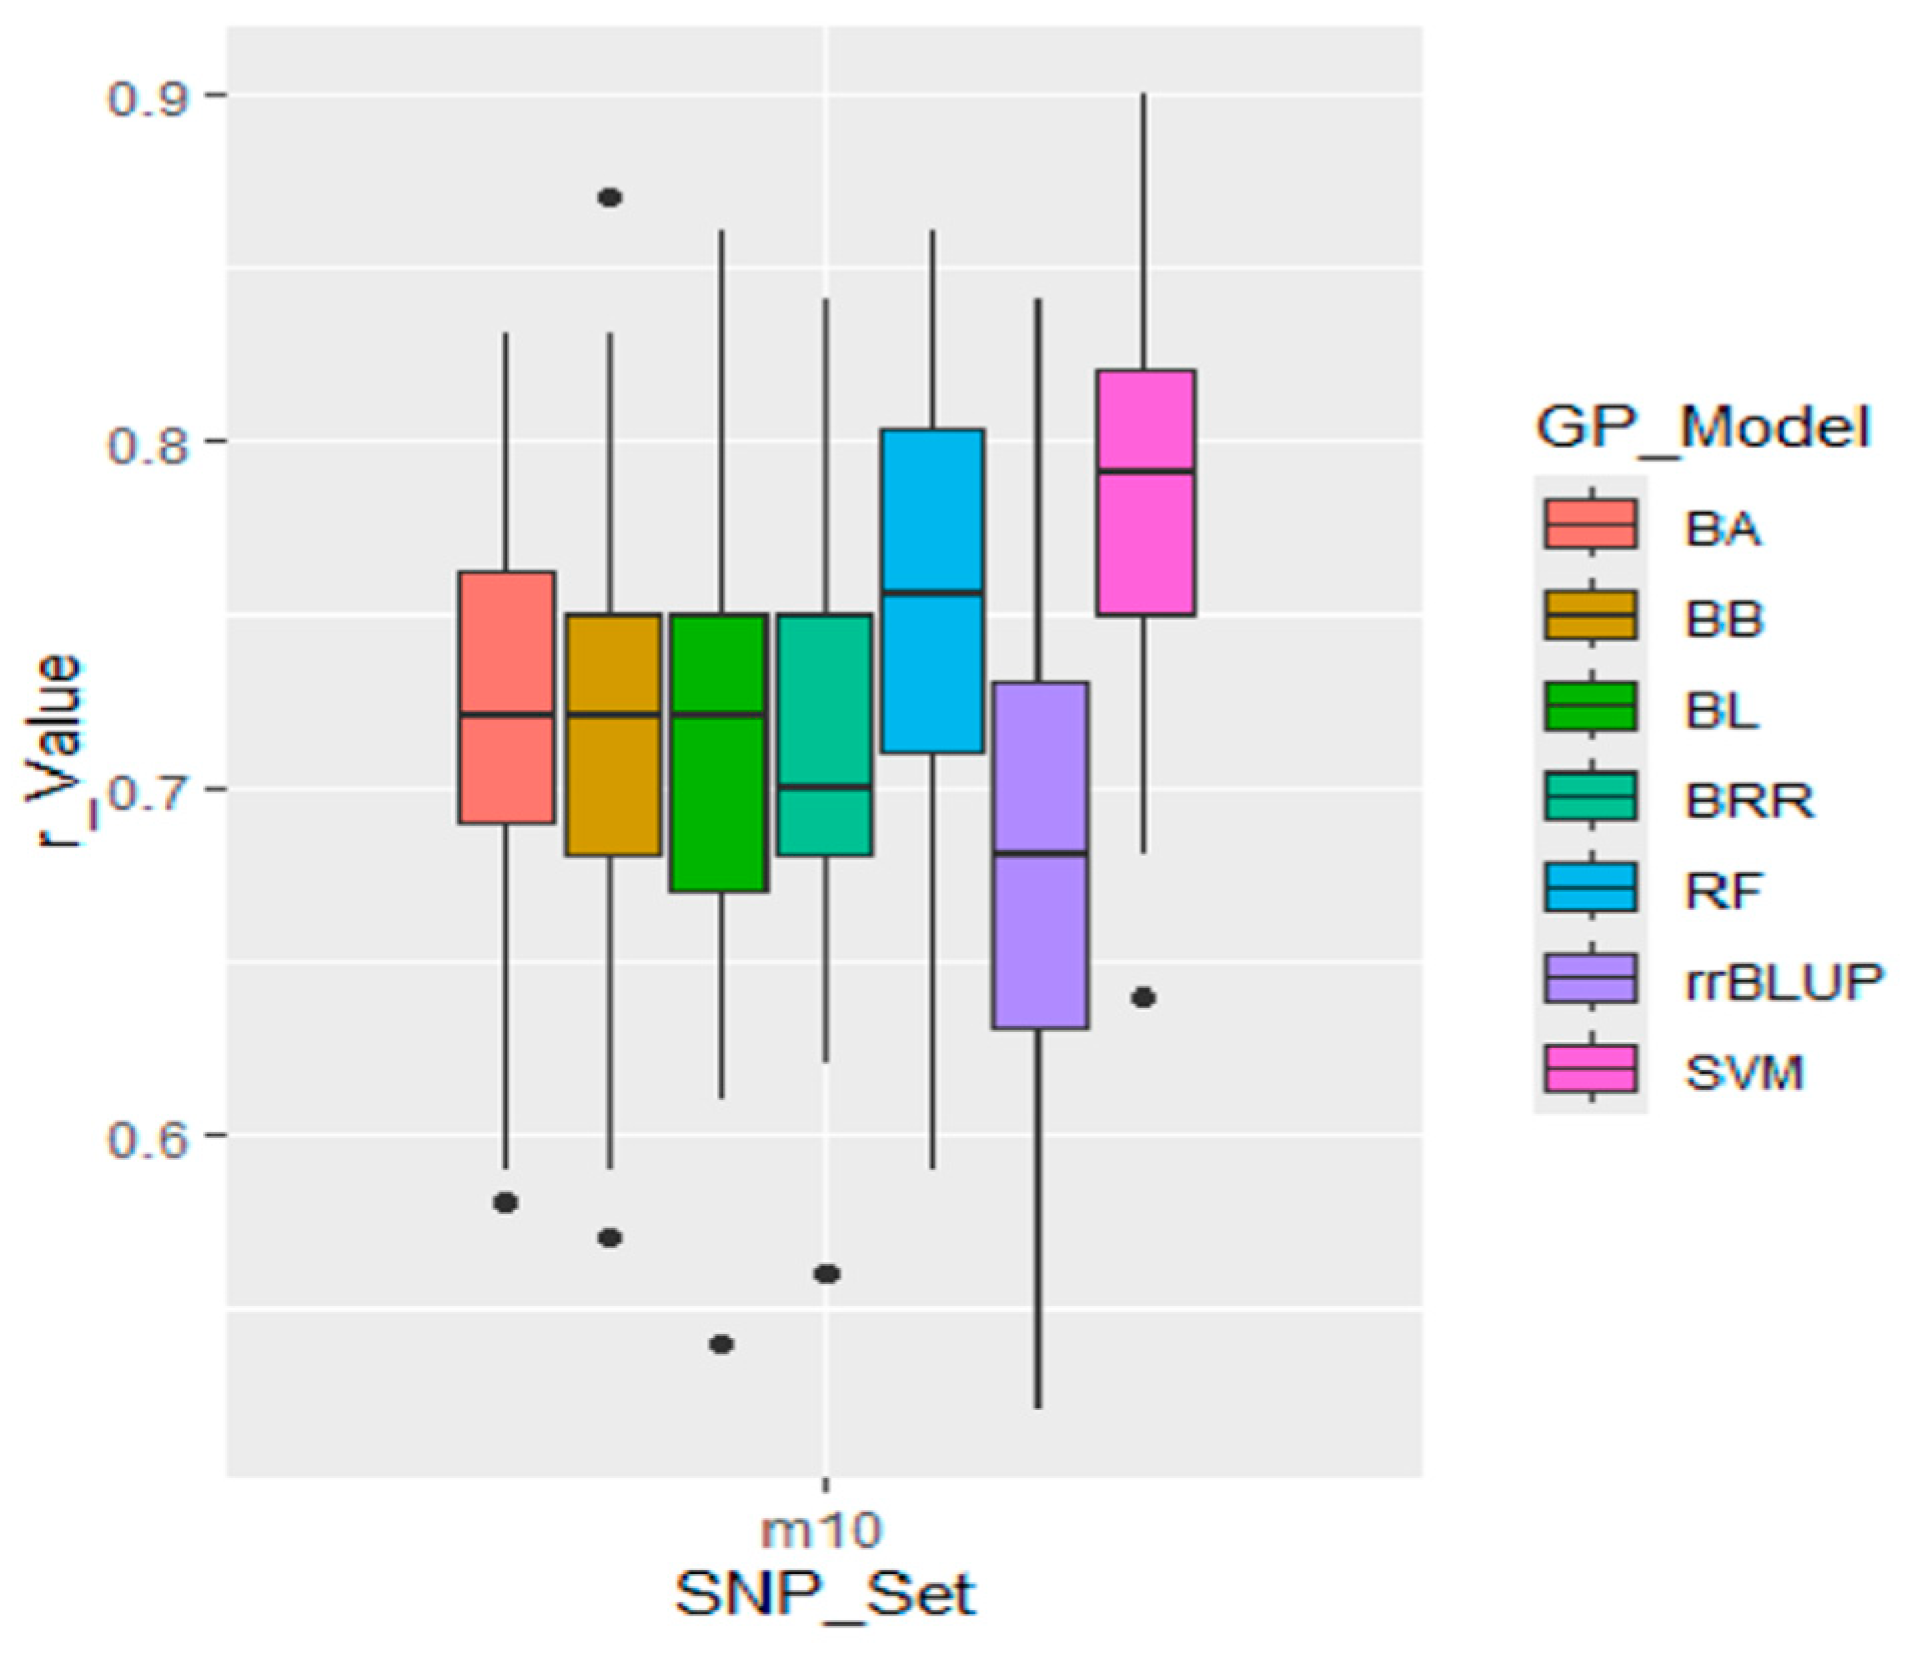
3.9. Genomic Prediction Using Difference Genomic Models

Seven GP models—BA, BB, BRR, BL, rrBLUP, cBLUP, and gBLUP—were employed to estimate r-values for both cross-population and across-population predictions. All seven models produced similar r-values (Table 2 and Table S4, Figure 7, Figure 8 and Figure 9), with several key observations: among the nine randomly selected SNP sets, all models yielded an average r-value of 0.59 (Table S4, Figure 7); when using the 10 associated SNP markers (m10), the average r-values were 0.72, 0.72, 0.72, 0.71, 0.68, 0.75, and 0.79 for the BA, BB, BL, BRR, rrBLUP, RF, and SVM models, respectively (Table 2, Figure 8), with the SVM model yielding the highest r-value of 0.79; and the SVM model also demonstrated the highest PA for arginine content when using the GWAS-derived SNP markers (Table S4; Figure 9). These findings suggest that the SVM model is particularly effective for predicting arginine content in soybean, and it is therefore recommended for use in Genomic Selection (GS) for arginine content traits in soybean molecular breeding programs.

4. Discussion

4.1. Importance of Studying Arginine Content

Arginine is a conditionally essential amino acid for humans and a key component of the free and protein-bound amino acid pool in soybean seeds. It is involved not only in protein synthesis but also in nitrogen metabolism, energy metabolism, and signal transduction [31]. Enhancing arginine content in soybeans is essential for improving their nutritional quality and functionality, particularly for the feed and food industries. Thus, this study aims to identify genetic loci associated with arginine content through GWAS and GP methods, providing a theoretical foundation and molecular marker resources for soybean breeding.

4.2. Research Background of the Identified Loci

This study conducted a GWAS on 33,858 SNP markers, identifying 10 SNPs associated with arginine content, located on chromosomes 5, 6, 8, 11, 12, 13, 16, and 17 (Table S3). In both GAPIT models (BLINK and FarmCPU), a locus on chromosome 6 showed LOD scores exceeding 5.78 and t-test values greater than 7.23, indicating a robust QTL for arginine content. One gene—Glyma.06g203200—is closely linked to SNP markers Gm06_19014194_ss715593808 within 15 kb. Previous studies have also identified arginine content genes in this region [32]. In both GAPIT models (MLM, MLMM) a locus on chromosome 11 showed LOD scores exceeding 5.78 and t-test values greater than 21.24, indicating a robust QTL for arginine content. One gene—Glyma.11G028600—is closely linked to SNP markers Gm11_2054710_ss715609614 within 5 kb. A literature review revealed that these loci have not been previously reported as being directly related to arginine content. The gene Glyma.06g203200, located near Gm06_19014194 _ss715593808 on chromosome 6, encodes mitochondrial ATPase (ATP synthase), which plays a crucial role in energy metabolism. Arginine metabolites may indirectly affect ATP synthase by regulating mitochondrial function, thus influencing arginine accumulation. Additionally, the gene Glyma.11G028600, located near Gm11_2054710_ss715609614 on chromosome 11, encodes the Ycf49 protein, which may affect energy metabolism during photosynthesis. As arginine is a crucial amino acid in energy metabolism, it may interact with the function of Ycf49 by regulating related metabolic pathways.

4.3. Rationale for Selecting These Two Candidate Genes

The selection of Glyma.06g203200 and Glyma.11G028600 as candidate genes is primarily based on the following two points. First, these two genes are located within 5 kb of the significant SNP loci and are closely related to energy metabolism, which is intricately linked to amino acid synthesis and accumulation. Second, gene function annotation and literature support indicate that their functions are highly relevant to the potential regulatory mechanisms of arginine metabolism. For example, mitochondrial ATPase (ATP synthase) plays a central role in cellular energy supply, while the Ycf49 protein may indirectly affect arginine synthesis and accumulation by regulating energy metabolism during photosynthesis.
Although the Gm06_19014194_ss715593808 locus had a higher LOD value, it explained a smaller proportion of the phenotypic variation compared to Gm11_2054710_ss715609614. This discrepancy may be due to the complex genetic architecture of arginine content, where multiple loci with smaller effects collectively contribute to the trait.

4.4. Harnessing GP for the Efficient Selection of Arginine Content in Soybean Breeding Programs

In this study, the accuracy of GP was evaluated by assessing the correlation coefficient (r) between the GEBV and the observed values. Despite the presence of major-effect loci, arginine content remains a complex trait governed by multiple minor-effect genes. GP methods can integrate these minor effects to enhance selection efficiency, particularly for applications across diverse populations. Initially, arginine content of 290 soybean accessions were predicted using three different GP models,—maBLUP, gBLUP, and sBLUP, —by cross-population prediction. The r-values obtained from these models were 0.95, 0.99, and 0.75, respectively, indicating that genomic selection for arginine content is effective. Subsequently, cross-prediction was conducted using randomly selected SNP markers and GWAS-derived SNP marker sets. The results showed that the r-values were relatively higher for the GWAS-derived SNP marker sets. All five GP models—BA, BB, BL, BRR, and rrBLUP—exhibited similar r-values, demonstrating that each model is effective for selecting salt tolerance through GS. These findings suggested that GP and arginine content selection can be effectively utilized in soybean breeding through MAS and GS. In summary, this study not only elucidates the genetic basis of arginine content but also identifies new candidate genes and molecular markers for soybean molecular breeding. Future research should further validate the functions of these genes and explore their specific regulatory mechanisms in arginine metabolism.

5. Conclusions

This study conducted a Genome-Wide Association Analysis (GWAS) on 290 soybean accessions with varying arginine content levels to investigate the genetic basis of arginine accumulation in soybean. By analyzing 33,858 SNP loci, two SNPs significantly associated with arginine content were identified: Gm06_19014194_ss715593808 and Gm11_2054710_ss715609614. Additionally, two candidate genes—Glyma.06g203200 and Glyma.11G028600—were identified, providing valuable insights into the molecular mechanisms regulating amino acid metabolism in soybean seeds.
At the Genomic Prediction (GP) level, the study assessed the effectiveness of various models, including rrBLUP, BA, BB, BL, and BRR. By examining the correlation coefficient (r) between Genomic Estimated Breeding Values (GEBV) and observed values, the analysis revealed that the r-value reached 0.72 when using GWAS-derived SNP markers. This was notably higher than the r-value obtained from randomly selected SNP sets, demonstrating the potential of these SNP markers in screening and breeding soybean lines with high arginine content. These findings establish a solid theoretical foundation for future soybean breeding programs aimed at enhancing arginine content.

Supplementary Materials

The following supporting information can be downloaded at: https://www.mdpi.com/article/10.3390/agronomy15061339/s1.

Author Contributions

J.M., writing—original draft, writing—review and editing, data organization and analyses, software, formal analysis; Q.Y., writing—original draft, writing—review and editing, software; C.Y., writing—original draft, writing—review and editing, formal analysis; Z.L., writing—review and editing, software; X.S., writing—review and editing, software; X.W., witing—review and editing, formal analysis; R.X., writing—review and editing, formal analysis; P.S.: writing—review and editing, formal analysis; A.S., conceptualization, writing—review and editing, supervision; Y.Z., writing—review and editing, conceptualization, supervision; L.Y., funding acquisition, writing—review and editing, conceptualization, supervision. All authors have read and agreed to the published version of the manuscript.

Funding

Natural Science Foundation of Hebei Province (C2024301125); China Agriculture Research System of MOF and MARA (CARS-04-PS06), Hebei Agriculture Research System (HBCT2023040101), HAAFS Agriculture Science and Technology Innovation Project (2022KJCXZX-LYS-7), National Key R&D Program of China (2023YFD2301505).

Data Availability Statement

The original contributions presented in this study are included in the article. Further inquiries can be directed to the corresponding author.

Acknowledgments

I would like to express my heartfelt gratitude to everyone who has supported and helped me throughout this research.

Conflicts of Interest

The authors declare no conflicts of interest. The funders had no role in the design of the study; in the collection, analyses, or interpretation of data; in the writing of the manuscript; or in the decision to publish the results.

Abbreviations

The following abbreviations are used in this manuscript:
GWASGenome-Wide Association Study
SNPSingle Nucleotide Polymorphism
GPGenomic Prediction
GSGenomic Selection
PAPredictive Accuracy
BLUPBest Linear Unbiased Prediction
BABayesian A
BBBayesian B
BRRBayesian Ridge Regression
SVMSupport Vector Machine
LODLogarithm of the Odds

References

  1. Wang, Y.; Wang, X.; Zhang, R.; Chen, T.; Xiao, J.; Li, Q.; Ding, X.; Sun, X. Genome-Scale Identification of Wild Soybean Serine/Arginine-Rich Protein Family Genes and Their Responses to Abiotic Stresses. Int. J. Mol. Sci. 2024, 25, 11175. [Google Scholar] [CrossRef] [PubMed]
  2. Xiong, Y.; Jia, Q.; Zhou, M.; Zhang, H.; Chen, H. Identification of excellent germplasm with high content of four free amino acids in soybean and GWAS analysis. J. Plant Genet. Resour. 2024, 25, 957–966. [Google Scholar]
  3. Winter, G.; Todd, C.D.; Trovato, M.; Forlani, G.; Funck, D. Physiological implications of arginine metabolism in plants. Front. Plant Sci. 2015, 6, 534. [Google Scholar] [CrossRef]
  4. King, J.E.; Gifford, D.J. Amino Acid Utilization in Seeds of Loblolly Pine during Germination and Early Seedling Growth (I. Arginine and Arginase Activity). Plant Physiol. 1997, 113, 1125–1135. [Google Scholar] [CrossRef] [PubMed]
  5. Siddappa, S.; Marathe, G.K. What we know about plant arginases? Plant Physiol. Biochem. 2020, 156, 600–610. [Google Scholar] [CrossRef]
  6. Pál, M.; Szalai, G.; Gondor, O.K.; Janda, T. Unfinished story of polyamines: Role of conjugation, transport and light-related regulation in the polyamine metabolism in plants. Plant Sci. 2021, 308, 110923. [Google Scholar] [CrossRef]
  7. Wu, G.; Bazer, F.W.; Davis, T.A.; Kim, S.W.; Li, P.; Rhoads, J.M.; Yin, Y. Arginine metabolism and nutrition in growth, health and disease. Amino Acids 2009, 37, 153–168. [Google Scholar] [CrossRef]
  8. Xu, Y.Q.; Guo, Y.; Shi, B.; Yan, S.; Guo, X. Dietary arginine supplementation enhances the growth performance and immune status of broiler chickens. Livest. Sci. 2018, 209, 8–13. [Google Scholar] [CrossRef]
  9. Böger, R.H. The emerging role of asymmetric dimethylarginine as a novel cardiovascular risk factor. Cardiovasc. Res. 2003, 59, 824–833. [Google Scholar] [CrossRef]
  10. Bronte, V.; Zanovello, P. Regulation of immune responses by L-arginine metabolism. Nat. Rev. Immunol. 2005, 5, 641–654. [Google Scholar] [CrossRef]
  11. Qin, J.; Shi, A.; Song, Q.; Li, S.; Wang, F.; Cao, Y.; Ravelombola, W.; Song, Q.; Yang, C.; Zhang, M. Genome Wide Association Study and Genomic Selection of Amino Acid Concentrations in Soybean Seeds. Front. Plant Sci. 2019, 10, 1445. [Google Scholar] [CrossRef] [PubMed]
  12. Fallen, B.; Hatcher, C.; Allen, F.; Kopsell, D.; Saxton, A.; Chen, P.; Kantartzi, S.; Cregan, P.; Hyten, D.; Pantalone, V. Soybean Seed Amino Acid Content QTL Detected Using the Universal Soy Linkage Panel 1.0 with 1,536 SNPs. J. Plant Genome Sci. 2013, 1, 68–79. [Google Scholar] [CrossRef]
  13. Warrington, C.V.; Abdel-Haleem, H.; Hyten, D.L.; Cregan, P.B.; Orf, J.H.; Killam, A.S.; Bajjalieh, N.; Li, Z.; Boerma, H.R. QTL for seed protein and amino acids in the Benning × Danbaekkong soybean population. Theor. Appl. Genet. Theor. Angew. Genet. 2015, 128, 839–850. [Google Scholar] [CrossRef]
  14. Ravelombola, W.; Qin, J.; Shi, A.; Song, Q.; Yuan, J.; Wang, F.; Chen, P.; Yan, L.; Feng, Y.; Zhao, T.; et al. Genome-wide association study and genomic selection for yield and related traits in soybean. PLoS ONE 2021, 16, e0255761. [Google Scholar] [CrossRef]
  15. Yang, J.; Benyamin, B.; McEvoy, B.P.; Gordon, S.; Henders, A.K.; Nyholt, D.R.; Madden, P.A.; Heath, A.C.; Martin, N.G.; Montgomery, G.W.; et al. Common SNPs explain a large proportion of the heritability for human height. Nat. Genet. 2010, 42, 565–569. [Google Scholar] [CrossRef]
  16. Goddard, M.E.; Hayes, B.J.; Meuwissen, T.H. Using the genomic relationship matrix to predict the accuracy of genomic selection. J. Anim. Breed. Genet. Z. Tierz. Zucht. 2011, 128, 409–421. [Google Scholar] [CrossRef]
  17. Zhang, J.; Song, Q.; Cregan, P.B.; Jiang, G.L. Genome-wide association study, genomic prediction and marker-assisted selection for seed weight in soybean (Glycine max). Theor. Appl. Genet. Theor. Angew. Genet. 2016, 129, 117–130. [Google Scholar] [CrossRef]
  18. Spindel, J.; Begum, H.; Akdemir, D.; Virk, P.; Collard, B.; Redoña, E.; Atlin, G.; Jannink, J.L.; McCouch, S.R. Correction: Genomic Selection and Association Mapping in Rice (Oryza sativa): Effect of Trait Genetic Architecture, Training Population Composition, Marker Number and Statistical Model on Accuracy of Rice Genomic Selection in Elite, Tropical Rice Breeding Lines. PLoS Genet. 2015, 11, e1005350. [Google Scholar]
  19. Crossa, J.; Pérez-Rodríguez, P.; Cuevas, J.; Montesinos-López, O.; Jarquín, D.; de Los Campos, G.; Burgueño, J.; González-Camacho, J.M.; Pérez-Elizalde, S.; Beyene, Y. Genomic Selection in Plant Breeding: Methods, Models, and Perspectives. Trends Plant Sci. 2017, 22, 961–975. [Google Scholar] [CrossRef]
  20. Phung, N.T.; Mai, C.D.; Hoang, G.T.; Truong, H.T.; Lavarenne, J.; Gonin, M.; Nguyen, K.L.; Ha, T.T.; Do, V.N.; Gantet, P.; et al. Genome-wide association mapping for root traits in a panel of rice accessions from Vietnam. BMC Plant Biol. 2016, 16, 64. [Google Scholar] [CrossRef]
  21. Song, Q.; Hyten, D.L.; Jia, G.; Quigley, C.V.; Fickus, E.W.; Nelson, R.L.; Cregan, P.B. Development and evaluation of SoySNP50K, a high-density genotyping array for soybean. PLoS ONE 2013, 8, e54985. [Google Scholar] [CrossRef]
  22. Song, Q.; Hyten, D.L.; Jia, G.; Quigley, C.V.; Fickus, E.W.; Nelson, R.L.; Cregan, P.B. Fingerprinting Soybean Germplasm and Its Utility in Genomic Research. G3 Genes Genomes Genet. 2015, 5, 1999–2006. [Google Scholar] [CrossRef] [PubMed]
  23. Wang, J.; Zhang, Z. GAPIT Version 3: Boosting Power and Accuracy for Genomic Association and Prediction. Genom. Proteom. Bioinform. 2021, 19, 629–640. [Google Scholar] [CrossRef] [PubMed]
  24. Shi, A.; Gepts, P.; Song, Q.; Xiong, H.; Michaels, T.E.; Chen, S. Genome-Wide Association Study and Genomic Prediction for Soybean Cyst Nematode Resistance in USDA Common Bean (Phaseolus vulgaris) Core Collection. Front. Plant Sci. 2021, 12, 624156. [Google Scholar] [CrossRef]
  25. Zhang, X.; Sallam, A.; Gao, L.; Kantarski, T.; Poland, J.; DeHaan, L.R.; Wyse, D.L.; Anderson, J.A. Establishment and Optimization of Genomic Selection to Accelerate the Domestication and Improvement of Intermediate Wheatgrass. Plant Genome 2016, 9, plantgenome2015.07.0059. [Google Scholar] [CrossRef] [PubMed]
  26. Meher, P.K.; Rustgi, S.; Kumar, A. Performance of Bayesian and BLUP alphabets for genomic prediction: Analysis, comparison and results. Heredity 2022, 128, 519–530. [Google Scholar] [CrossRef]
  27. Pérez, P.; de los Campos, G. Genome-wide regression and prediction with the BGLR statistical package. Genetics 2014, 198, 483–495. [Google Scholar] [CrossRef]
  28. Jarquín, D.; Kocak, K.; Posadas, L.; Hyma, K.; Jedlicka, J.; Graef, G.; Lorenz, A. Genotyping by sequencing for genomic prediction in a soybean breeding population. BMC Genom. 2014, 15, 740. [Google Scholar] [CrossRef]
  29. Krishnappa, G.; Savadi, S.; Tyagi, B.S.; Singh, S.K.; Mamrutha, H.M.; Kumar, S.; Mishra, C.N.; Khan, H.; Gangadhara, K.; Uday, G.; et al. Integrated genomic selection for rapid improvement of crops. Genomics 2021, 113, 1070–1086. [Google Scholar] [CrossRef]
  30. Qu, S.; Lu, S.; Liu, Y.; Li, M.; Chen, S. Accurate genomic selection using low-density SNP panels preselected by maximum likelihood estimation. Aquaculture 2024, 579, 740154. [Google Scholar] [CrossRef]
  31. Funck, D.; Eckard, S.; Müller, G. Non-redundant functions of two proline dehydrogenase isoforms in Arabidopsis. BMC Plant Biol. 2010, 10, 70. [Google Scholar] [CrossRef] [PubMed]
  32. Zhang, J.; Wang, X.; Lu, Y.; Bhusal, S.J.; Song, Q.; Cregan, P.B.; Yen, Y.; Brown, M.; Jiang, G.L. Genome-wide Scan for Seed Composition Provides Insights into Soybean Quality Improvement and the Impacts of Domestication and Breeding. Mol. Plant 2018, 11, 460–472. [Google Scholar] [CrossRef] [PubMed]
Figure 1. The distribution arginine content reaction in 290 soybean accessions.
Agronomy 15 01339 g001
Figure 2. Genetic diversity analysis of an association panel composed of 290 soybean accessions from the USDA: (A) Three-dimensional plot of Principal Component Analysis (PCA), Among them, red represents one cluster, and blue represents another cluster. (B) PCA eigenvalue plot. (C) NeighborJoining (NJ) phylogenetic tree constructed using GAPIT version 3, depicting two subgroups (Q1, Q2). (D) Kinship analysis.
Agronomy 15 01339 g002
Figure 3. Manhattan plots of the GWAS results for soybean arginine content in 290 accessions. based on the MLM, BLINK, FarmCPU, and MLMM models using GAPIT version 3. In the Manhattan plots, the x-axis represents soybean chromosomes and the y-axis represents the LOD [−log(p-value)] values and the red line in the figure indicates that the LOD threshold is 5.78. Loci above this threshold are considered significant.
Agronomy 15 01339 g003
Figure 4. QQ plots (left) and Manhattan plots (right) of the GWAS results for arginine content in 290 accessions, based on the Mixed Linear Model (MLM) (A), Bayesian-information and Linkage-disequilibrium Iteratively Nested Keyway (BLINK) (B), Fixed and Random Model Circulating Probability Unification (FarmCPU) (C), and Multi-Locus Mixed Model (MLMM) (D) using GAPIT version 3. In the QQ plot (left), the x-axis represents the observed LOD [−log(p-value)] values, and the y-axis represents the expected LOD [−log(p-value)] values. In the Manhattan plot (right), the x-axis represents soybean chromosomes, and the y-axis represents the LOD [−log(p-value)] values. The red line in the figure indicates that the LOD threshold is 5.78. Loci above this threshold are considered significant and the brown and green straight lines respectively indicate that the loci on chromosome 6 and chromosome 11 are significant and identified by two models with stability.
Agronomy 15 01339 g004
Figure 5. Haplotype analysis of loci Gm06_19014194_ss715593808 (A) and Gm11_2054710 _ss715609614 (B) based on 290 soybean accessions from the USDA. *** indicates that p > 0.001 is at an extremely significant level.
Agronomy 15 01339 g005
Figure 6. The GP model r-values for the training set of arginine content in 290 soybean accessions were analyzed using 33,858 SNPs. Predictions were performed using three models: maBLUP (=GAGBLUP (GWAS-Assisted Genome BLUP, previously known as maBLUP), gBLUP (Genomic Best Linear Unbiased Prediction), and sBLUP (SUPER gBLUP) in GAPIT version 3.
Agronomy 15 01339 g006
Figure 7. The GP model r-values for arginine content using 9 SNP sets: 8 random SNP sets ranging from 10 to 10,000 SNPs, plus the ten GWAS-derived significant SNP marker set (m10). Predictions were performed using five Genomic Prediction (GP) models: BA (Bayesian A), BB (Bayesian B), BL (Bayesian LASSO), BRR (Bayesian Ridge Regression), and rrBLUP (Ridge Regression BLUP).
Agronomy 15 01339 g007
Figure 8. Genomic prediction (r-value) of the ten GWAS-derived SNP marker sets (listed in Table 1) in cross-prediction with 5-fold for arginine content trait in 290 soybean accessions estimated by seven models: BA, BB, BL, BRR, RF, rrBLUP, and SVM.
Agronomy 15 01339 g008
Figure 9. Genomic Prediction (GP) of arginine content using GWAS-derived SNP markers in 290 soybean accessions. Across. Prediction: GWAS-derived SNP markers from the training set (80% of the population; 232 accessions) were used to predict the validation set (20%; 58 accessions). Cross.Prediction: SNP markers from the training set (80%) were used to predict the same training set. All(self). Prediction: All GWAS-derived SNP markers from the training set (80%; 232 accessions) were applied in five replications to predict the entire population (290 accessions).
Agronomy 15 01339 g009
Figure 10. Genomic Prediction (GP) (r-value) for arginine content using the GAGBLUP (BLINK) model in GAPIT version 3. ‘all.Blink_Cross’: GWAS-derived SNP markers by BLINK to predict the entire population (290 accessions). ‘80%TP. self_ Blink_Cross’: GWAS-derived SNP markers from the Training Population (TP) were used to predict GEBVs within the same training set itself (232 accessions). ‘80%TP.to.20%VP. Blink_Across’: GWAS-derived SNP markers from the TP (80%; 232 accessions) were used to predict the VP (20%; 53 accessions).
Agronomy 15 01339 g010
Table 1. List of ten SNPs with LOD (−log(p-value)) greater than 5.78 detected by one or more models in GAPIT version 3, along with t-test results for arginine content.
SNPChr.PositionLODModelLODPVEBeneficial
_Allele
Unbeneficial
_Allele
Link Gene
(t-test)(%)(0–5 k)
Gm05_464582_ss71559256154645826.73FarmCPU7.872.58CTGlyma.05G005300
Gm06_19014194_ss7155938086190141949.91
8.02
BLINK,
FarmCPU
7.233.91AGGlyma.06g203200
Gm08_18566925_ss7156000878185669256.46FarmCPU1.501.16CTGlyma.08g227900
Gm11_2054710_ss7156096141120547106.38
9.05
MLM, MLMM21.2419ACGlyma.11G028600
Gm11_7143691_ss71561106911714369110.71BLINK10.4010.19CTGlyma.11g094000
Gm12_40011028_ss71561304812400110285.85BLINK1.783.81CTGlyma.12g241800
Gm13_27198365_ss71561442013271983656.06BLINK5.697.61AGGlyma.13g156700
Gm13_37091348_ss71561585913370913486.26FarmCPU5.370GTGlyma.13G268700
Gm16_3557974_ss7156247941635579745.93MLMM4.935.8CTGlyma.16g037600
Gm17_39308794_ss71562760317393087948.59FarmCPU3.050AGGlyma.17g237800
Table 2. Genomic prediction (r-value) of arginine content using nine SNP sets: eight randomly selected SNP sets ranging from 10 to 10,000 SNPs (r10 tor10000), plus the GWAS-derived SNP marker sets (10 markers-m10).
SNP_Setr-ValueSE of r-Value
rrBLUPBABBBLBRRSNP Set MeanrrBLUPBABBBLBRRSNP Set Mean
r100.340.300.280.340.320.320.110.100.130.110.110.12
r1000.630.640.620.630.640.630.080.080.070.080.090.08
r2000.580.550.540.570.560.560.070.080.090.070.080.08
r5000.320.320.320.330.320.320.080.090.080.100.090.09
r10000.580.600.600.600.620.600.080.090.080.080.080.08
r20000.700.680.680.690.690.690.060.070.070.060.070.07
r50000.680.690.680.710.700.690.070.060.070.060.060.06
r10,0000.750.760.760.770.760.760.050.050.050.050.050.05
m100.680.720.710.720.710.710.070.050.050.060.050.06
GP Model Mean0.580.580.580.600.590.590.070.070.080.070.080.08
Disclaimer/Publisher’s Note: The statements, opinions and data contained in all publications are solely those of the individual author(s) and contributor(s) and not of MDPI and/or the editor(s). MDPI and/or the editor(s) disclaim responsibility for any injury to people or property resulting from any ideas, methods, instructions or products referred to in the content.

