Article

Crop Residue Orientation Influences Soil Water and Wheat Growth Under Rainfed Mediterranean Conditions

1
UWA School of Agriculture and Environment, The University of Western Australia, 35 Stirling Highway, Crawley, WA 6009, Australia
2
The UWA Institute of Agriculture, The University of Western Australia, 35 Stirling Highway, Crawley, WA 6009, Australia
3
CSIRO Agriculture and Food, Private Bag No 5, Wembley, WA 6913, Australia
*
Author to whom correspondence should be addressed.
Agronomy 2025, 15(6), 1285; https://doi.org/10.3390/agronomy15061285
Submission received: 24 March 2025 / Revised: 14 May 2025 / Accepted: 19 May 2025 / Published: 23 May 2025
(This article belongs to the Section Soil and Plant Nutrition)

Abstract

Under rainfed Mediterranean-style conditions, crop growth and yield are largely determined by the availability of water. We investigated the role of residue orientation (standing or horizontal) and quantity on temperature, soil water, and wheat growth in two experiments with annual (winter) cropping. In the first trial at Shenton Park, tall (0.3 m) standing residues combined with thick (4 t ha−1) horizontal residues increased the soil water at sowing by more than 100 mm compared with the bare soil control, increasing the wheat yield by about 2 t ha−1. The average soil water storage was linearly related to the total residue quantity (r2 = 0.86). Both standing and horizontal residues reduced the daily soil temperature fluctuations, but increased the air temperature fluctuations. Tall-cut residues had higher maximum and lower minimum air temperatures 0.05 m above the ground than short-cut residues with more horizontal material. Under field conditions, more soil water was stored in the growing season with the residues cut relatively tall with less on the ground compared with an equivalent residue amount consisting of shorter residues with more on the ground, although the differences were not great. Tall stubble was also associated with greater green leaf area and PAR interception. At the Cunderdin trial, the residue was greater between the harvester wheel tracks than at the outer edge of the cutting front. Under the very dry seasonal conditions experienced during the trial, greater residue resulted in increased soil water storage, particularly in the top 0.5 m of soil (up to 29 mm), greater green leaf area index, and higher crop yields (up to 300 kg ha−1) behind the harvester, associated with greater spike m−2, greater spikelets spike−1, and lower root:shoot ratio. These results demonstrate the importance of considering residue orientation to maximise crop water use efficiency and yield.

1. Introduction

Residue orientation and the amount of ground cover changes the microclimate near the soil, which could impact the water relations [1]. Residues on the soil surface will decrease evaporation from the soil through shading and reducing windspeed [2]. Indeed, maintaining crop residues has generally, but not always, preserved soil water [3]. When crop residues are standing, solar radiation at the soil surface is decreased, as is the wind speed and soil temperature. Therefore, more soil water is available for transpiration, rather than evaporation, and this increases the crop yield and water use efficiency (WUE) [4,5].
The amount of additional water derived from reduced tillage and residue retention depends on the soil type, rainfall pattern, and evaporative demand [6,7,8,9,10,11,12,13]. Liu and Lobb [14] reported reduced rainfall runoff with increased ground cover; conversely, snowmelt runoff increased in high residue loads. In their long-term trials, Zhao et al. [15] found that residue return was beneficial for soil water storage. The combination of modelling and field trials in Europe found that reduced tillage increased and stratified soil organic carbon in the top 0.3 m, which led to greater soil water retention [16]. The yield of crops grown under no-tillage systems in rainfed systems is often greater than those with conventional tillage systems, particularly where sub-optimal rainfall limits yield [17,18]. In Western Australia and other regions with a Mediterranean-type climate, water conservation is important in terms of both crop productivity and sustainability [19]. In these conditions, summer rainfall is often minimal, with little stored soil water for the crop to use, and the winter growing season is often cut short by terminal drought.
Water stress is the major constraint to grain yield in Western Australia, especially during stem elongation, flowering, and grain-fill [20]. Consequently, it is crucial to minimise soil water loss through residue management in no-tillage (NT) systems [11]. Therefore, further research is needed to understand the impact of residue management and its orientation on soil water storage and evaporation [21]. Tripathi et al. [22] showed that crop residue retention in summer mung bean saved irrigation water due to less evapotranspiration. This could minimise water use and increase crop water productivity. The combination of cover crops and tall standing residue (0.3–0.4 m) resulted in 29% higher crop yields compared with soybeans (Glycine max) with no cover crops or residue retention. The higher soybean productivity was partly due to differences in water use. However, cover crops have also been shown to reduce subsequent crop yields due to drying out the soil profile, particularly under drought conditions [23,24]. Such research should identify whether cutting residues tall in Mediterranean conditions is the best way of reducing soil evaporation in terms of protecting the soil from direct irradiation [25]. Swella et al. [26] investigated the effect of residue height (0.1–0.3 m) and amount of horizontal residue (0–4 t ha−1) on soil water and found that soil water increased with the height of the standing residue and amount of horizontal residue. Most water was stored with 0.3 m high standing residues combined with 4 t ha−1 horizontal residues, with the greatest water storage under and adjacent to the residue row. Increased research in this area is important for the adoption of NT systems in Australia [17].
Spreading residues evenly during harvest improves the subsequent seeding efficiency [27]. However, in many NT systems harvested by large machinery, there is more residue accumulation directly behind the harvester (within wheel tracks), and less towards the edge of the harvester cutting front [28]. At the field scale, uneven residue distribution can also increase the soil water variability, impact the soil physical and chemical properties leading to variability in the soil nutrients, and negatively impact weed management strategies in areas with high amounts of residue due to reduced efficacy of pre-emergence herbicides [29].
The aim of this study was to determine the effect of residue amount and architecture (i.e., standing or horizontal residue) on the soil water storage, near-surface soil and air temperature, wheat (Triticum aestivum) growth, and WUE. The focus of this research was on field trials for winter crop production in a Mediterranean environment. The hypotheses were: (1) retention of large amounts of residue in NT systems improves the soil water levels, wheat establishment, WUE and grain yield; and (2) tall standing crop residues in NT systems increase water retention under Mediterranean-type conditions more than shorter residues and large amounts of horizontal material. This research will provide farmers with the knowledge to alter their crop residue management practices in order to maximise soil water retention, which will improve the wheat WUE and grain yield in semi-arid conditions.

2. Materials and Methods

Two experiments were conducted in 2010: one at Shenton Park in Perth, where the residues were manipulated to achieve the required amounts and architecture, and the other in the wheatbelt of Western Australia at the College of Agriculture in Cunderdin, where the residues were left in situ after harvesting with a commercial machine.

2.1. Shenton Park Experiment

2.1.1. Soil and Site

The experiment was conducted from 21 May to 25 December 2010 at the Shenton Park Field Station at The University of Western Australia (115°38′ E, 32°13′ S). The long-term average rainfall (80 years) is 710 mm for the May–November growing season with the mean daily maximum and minimum temperatures of 24.0 and 12.9 °C, respectively. The climate is Mediterranean-type, characterised by mild, rainy winters and hot, dry summers, with high solar radiation and high rates of evaporation. Climate details were recorded at a weather station approximately 500 m from the site and rainfall measured in a rain gauge at the site. The soil is classified in the Dystric Xeropsamments subgroup [30], commonly called ‘Karrakatta sand’ [31]. The topsoil (0–150 mm) had 920 g kg−1 coarse sand, 20 g kg−1 fine sand, 20 g kg−1 silt, and 40 g kg−1 clay [32]. The topsoil pH was 4.7 (CaCl2) and the subsoil pH 5.6.

2.1.2. Treatments

The experiment had a factorial design of three standing residue heights (0.10, 0.20, and 0.30 m) by three horizontal residue amounts (0, 1, and 4 t ha−1) with a bare soil control (3 × 3 + 1) arranged in four randomised blocks. Plots were 1.8 m wide (8 crop rows) by 5 m long, and wheat was seeded between the residue rows. The standing residue was established in 2009 by sowing wheat (cultivar Bonnie Rock) at a rate of 90 kg ha−1 in 0.22 m-wide rows. The wheat was harvested on 6 December with a plot harvester, and all residue was cut to 0.3 m in height. In the week following harvest, a hedge clipper was used to cut the standing wheat residue to the required heights. The designated horizontal residue amounts were obtained by randomly scattering straw collected from bare plots or by raking to remove excess straw. In plots with 4 t ha−1 horizontal residue, residue was removed immediately prior to seeding, leaving strips of bare soil in the inter-row for easy seeding and to ensure good seed germination. When 90% of the seedlings had emerged, the required amount of crop residue was re-spread in the inter-row, avoiding the crop.
The dry mass of standing residue for the different heights was subsequently estimated from the work of Khalil et al. [33], who worked at the same location (Shenton Park). The 0.1 m high residue weighed 0.6 t ha−1, the 0.2 m residue was 1 t ha−1, and the 0.3 m was 1.6 t ha−1 (i.e., each additional 0.1 m of standing residue weighed ~0.5–0.6 t ha−1).

2.1.3. Inputs and Field Operations

Bonnie Rock wheat was sown on 21 May 2010 between the standing residue rows (0.22 m apart) (i.e., in the inter-row position of the previous year’s crop residue) at a depth of 0.02–0.05 m with an Earthway precision garden seeder (Model-1001-B) at a seeding rate of 80 kg ha−1.
Approximately 350 kg ha−1 of super potash (P 5.5%; K 20.0%; S 6.3%; Ca 12.0%) was broadcast and left on the soil surface in March 2010. The same fertiliser was also broadcast at 400 kg ha−1 just before sowing on 20 May 2010 and was then incorporated by the sowing operation. Nitrogen fertiliser was applied as three urea (N 46.0%) top-dressings, two at 100 kg urea ha−1 applied on 15 July 2010 and 18 August 2010, and a final top-dressing of 20 kg urea ha−1 on 22 September 2010. The plots were hand weeded throughout the growing season.

2.1.4. Plant Growth

Crop biomass samples were taken on 9 July, 17 August, and 15 September 2010 in a one-metre row length at ground level from each plot. At the same time, before biomass sampling, ten plants were randomly selected and uprooted to record the tiller number, growth stage (Zadok), plant height, and green leaf area.
The area of the leaf laminae (one side) of the ten plants was measured with a portable area meter (Model LI-3000, Li-Cor Environmental, Lincoln, NE, USA). Senesced and yellow leaves were excluded from the measurement. Stem length and diameter of the ten plants were measured for green (photosynthetic) area calculations using a ruler and vernier calliper, respectively. The total green area was calculated by adding the area of leaf laminae, stems, and emerged spikes. Stem and leaf dry matter was determined by combining the respective parts of the 10 plants.
The time to 50% flowering in wheat was determined when half the plants in a plot had at least one dehisced anther [34]. At final harvest, 1 m of row from an undisturbed area in the middle of each plot was harvested at ground level using secateurs. From the harvested sample, the number of spikes m−2 was determined, and ten spikes were randomly selected from the main sample to determine the spikelet number per spike, grain number per spike, and grain number per m2. The sample from each plot was manually threshed, dried in the greenhouse to 14% moisture content, and the seed yield determined. The grain moisture content was assessed in two independently drawn samples of 5 g each, which were weighed to three decimal places before oven drying at 70 °C for 6 h, then reweighed. The 1000-grain weight was determined from subsamples of the main grain yield samples. The rest of the straw was oven dried at 70 °C for 6 h to determine the total biomass at harvest.

2.1.5. Soil Water

Near-surface (0–0.2 m) soil water was measured with a Campbell Scientific CS620 Hyrdosense® (Campbell Scientific Australia, Townsville, QLD, Australia) frequency domain reflectometry probe. One access tube (Vinidex series1 50 PVCU PN, Perth, WA, Australia) was also installed in the centre of each plot before sowing, and the soil water content measured using a neutron moisture meter (Wallingford-Pitman soil water probe, model 225, Weybridge, UK) at 0.2 m intervals from 0.1 m to 2.9 m. The maximum depth of root extraction was observed to be 2.3 m, and the total soil water was calculated to a depth of 2.4 m. Calibration models from Ward et al. [35] were used to calculate the soil water content. Soil water was measured prior to planting and then monthly, however, if a dry spell was forecast after a rainfall event, additional soil measurements were taken every 24 h for 4 days, then at seven days after the event, using the FDR probe. No runoff or drainage was observed at Shenton Park in 2010. The lack of drainage was apparent by the absence of changes in soil water at and below 2.5 m. As a result, the total water use (ET) was estimated using the water balance equation:
ET = ΔS + P
where ET is the total water use (mm) during crop growth; P is the growing season precipitation; ΔS is the change in soil water content (to 2.4 m) from sowing to harvest.
Water use efficiency on a grain yield basis (WUEg; kg ha−1 mm−1) was defined as the grain yield divided by ET during the full growing season.

2.1.6. Soil and Air Temperatures

Soil and air temperature were measured every hour from 23 May 2010 at a 0.05 m soil depth and 0.05 m above the soil/residue surface, in the inter-row, using iButton® loggers (with radiation shields for air temperature) (Maxim Integrated Pty Ltd., San Jose, CA, USA).

2.1.7. Photosynthetically Active Radiation

Photosynthetically active radiation (PAR) intercepted by the crop residues was determined with a 1.0 m linear quantum sensor (LI-190SB line quantum sensor, LI-COR, Lincoln, NE, USA). The sensor was placed above the canopy or bare soil (both upright and upside down to determine incoming and reflected PAR), diagonally across the residue rows and on the seed zone (crop row). Light measurements on both sunny and cloudy days were split into early morning (10:00 h), midday (13:00 h), and early evening (16:00 h), with three replications per plot. Light measurements were conducted before sowing and at each crop biomass sampling until early grain filling, when most leaves senesced following severe water stress. The proportion of intercepted PAR was determined from the net incoming PAR (i.e., above crop incoming (total) minus reflected PAR) minus the amount of light measured under the wheat crop at the soil level across the row.

2.2. Cunderdin Experiment

2.2.1. Soil and Site

This experiment was conducted in a long-term NT system experiment, started in 2007, on the Western Australian No-Till Farming Association (WANTFA) experimental field at the College of Agriculture, Cunderdin (117°14′ E, 31°38′ S). This is in the central grain belt of Western Australia, approximately 150 km east of Perth. Cunderdin has a long-term average rainfall of 365 mm (1914–2008), which mainly falls during winter (June–August), a mean daily maximum temperature of 25.1 °C (range, 23.5–26.3 °C; 1951–2007), and a mean daily minimum temperature of 11.4 °C (10.2–12.2 °C; 1951–2007) (Commonwealth Bureau of Meteorology, http://www.bom.gov.au/climate, accessed on 1 June 2013). Rainfall was recorded by a tipping bucket rain gauge at the site and other climate details were recorded at a Bureau of Meteorology site within 5 km of this trial. The soil is a red sandy clay loam with about 700 g kg−1 sand and 220 g kg−1 clay, 10 g kg−1 organic carbon, 0.8 g kg−1 total nitrogen, and 29 mg kg−1 phosphorus in the top 0.1 m of soil [36]. The soil is alkaline at depth, with calcium carbonate concretions visible below about 0.4 m. The soil pH at Cunderdin increased from 6.6 in the top 0.1 m to 7.9 at 0.6 m.

2.2.2. Treatments

Selected treatments from the long-term NT trial were used for this experiment and assessments were carried out from 20 May 2010 to 13 April 2011. The chosen treatments were based on two 3-year rotations. The first was continuous cereal (CC) with oats (Avena strigosa)/barley (Hordeum vulgare L.)/barley from 2007 to 2009, which transitioned to wheat in 2010. Every phase of the rotation was presented each year, giving three treatments, labelled S1–S3, representing the three rotational phases/sequences of continuous cereal (Table 1). The second rotation was a farmer control (FC) with wheat/barley/lupin (Lupinus angustifolius L.) from 2007 to 2009, followed by wheat in 2010. Although this rotation also had three phases, only one phase was selected for this study, labelled (FC). Each treatment had three replications, arranged in a randomised complete block design.
The trial had 12 plots, each 80 m by 36 m, with a 2 m wide buffer along each side of the plots, and a 4 m guard between plots. Crops were sown with a 4.5 m wide seeder and harvested using a controlled traffic (tramline) system with 9 m between sets of harvester wheel-tracks. A farm-scale 9.1 m wide harvester was used to harvest the various crops after experimental hand-harvest cuts were taken. Crops were harvested to leave the standing residue about 0.2 m high. There was still a distinct increase (‘windrow’) in horizontal residue left directly behind the harvester after passing, with less horizontal residue thrown towards the extremities of the harvester front/cutter. More details of the agronomic aspects were reported by Flower et al. [36].
For this research, an area 10 m by 4.5 m within each main plot was selected to include the centre location (directly behind the harvester wheel-tracks with high residue) through to the region of low residue at the outside of the harvester front. This area was divided into three residue subplot treatments 2.25 m apart. The first being in the centre, between the wheel tracks (i.e., thick residue with a combination of standing and high levels of horizontal residue); the next, designated as intermediate (standing with less horizontal residue), was 2.25 m away from the centre (at right angles to the direction of the rows); and the third plot was in the outer position 4.5 m from the centre (standing residue with virtually no horizontal residue).

2.2.3. Inputs and Field Operations

A tractor fitted with 0.02 m GPS guidance was used to sow the Magenta wheat cultivar between the standing rows of residue (i.e., from the previous year). The continuous cereal (CC) (S1, S2, and S3) was sown on 25 May with an NDF single disc planter with press wheels; farmer control (FC) was sown on 27 May 2010 using tines with the Agmaster NT11 flexi boot kit with 16 mm knifepoints and press wheels fitted behind.
Recommended practices were used for sowing, fertiliser, herbicide, and additive management. A seeding rate of 85 kg ha−1 was used with a 0.03–0.05 m sowing depth and 0.3 m row spacing. Agstar Zn fertiliser (N 13.9%, P 14%, S 9%, CU 1.1%, Zn 0.8%) was applied with the seed at 100 kg ha−1. Further liquid Flex-N (N 42.2% as urea ammonium nitrate) fertiliser was applied on 1 July 2010 at 78 L ha−1. Chemical weed control was achieved by applying glyphosate (450 g L−1 glyphosate) at 2.0 L ha−1 before sowing with flat-fan nozzles on a 9 m boom. Avadex Xtra (500 g L ha−1 tri-allate) and Trifluralin (480 g L−1 trifluralin) were applied as a mixture at sowing at 1.6 and 2.0 L ha−1, respectively.

2.2.4. Plant Growth

Crop biomass samples were taken on 30 July 2010, using a spade to excavate plants from four 0.25 m lengths of crop row per subplot, which were combined to give one sample per subplot. Ten plants were selected from each subplot to determine the plant height, leaf area and green area, tiller number, and growth stage (Zadok). Plants were then combined and the root system for all plants separated by cutting at the junction between green and non-green stem. Leaves and stems were separated, and the dry matter (DM) of the roots, stems, and leaves determined by oven-drying samples at 70 °C for 48 h before weighing. On 13 November 2010, the trial was harvested by cutting the crop at ground level. The number of spikes per m2, spikelets per spike, grains per unit area, seed yield, and harvest index were determined. The details of these assessments were similar to those described in the Shenton Park experiment.

2.2.5. Soil Water

One access tube was installed in the centre of each of the three subplots: one in the centre, between the harvester wheel tracks, where the horizontal residue was thickest; one 2.25 m from the access tube in the centre, where the residue was of medium thickness; and a third tube a further 2.25 m (half-way between two wheel tracks) where most of the residue was standing, with little horizontal residue. Soil water content in all plots was measured prior to planting and then once a month using a neutron moisture meter, as described previously, at 0.2 m intervals down to 1.6 m. The neutron moisture meter calibration data for the Cunderdin site were obtained from Ward et al. [35]. Surface runoff and drainage below 1.6 m at Cunderdin were assumed to be negligible due to the heavy soil and relatively low rainfall in 2010. ET for WUE estimation was calculated from the water balance using Equation (1).

2.3. Statistical Analysis

Two-way analysis of variance (ANOVA) of the Shenton Park data was performed using Gen-stat (12th edition), with the standing and horizontal residue treatments as the two factors and bare soil as an additional treatment/control. The crop sequences in the Cunderdin experiment were treated as main plots for the ANOVA, with the different positions relative to the centre position (directly behind the harvester) behind as subplots. The data were checked for normality and homogeneity of variances. Repeated measures ANOVA was conducted on volumetric soil water, soil/air temperatures, and plant growth parameters that were measured over time. Linear regression was used to determine the effect of aggregate residue amount (standing and horizontal) on the total soil water at Shenton Park, averaged across the growing season.

3. Results

3.1. Weather

During the wheat growing season (May–November) at Shenton Park, 353 mm rainfall was received, which was below the long-term annual average of 710 mm. However, 80% (279 mm) of this rainfall was received before flowering (average May–September rainfall is 545 mm), with only 20% (74 mm) from anthesis to harvest.
The 2010 growing season at Cunderdin was very dry with a total rainfall of 96 mm (May–November), which was well below the long-term annual growing season average of 260 mm. The crop received 88 mm before flowering (average May–September rainfall is 238 mm). The mean daily maximum soil temperatures were warmer, and the minimum soil temperatures were cooler than the long-term average temperatures during the growing season, particularly from flowering to harvest.

3.2. Soil and Air Temperature Measurements

At Shenton Park, taller-cut residue had lower maximum and higher minimum soil temperatures, the reverse occurred with air temperature, and the effects were greater with increasing amounts of horizontal residue (Table 2). The differences were more marked from seeding to anthesis and less evident from anthesis to harvest (data not presented). Generally, growing wheat on bare soil resulted in higher maximum and lower minimum soil temperatures and the opposite for air temperatures compared with the other residue combinations (Table 2), although the differences from the bare soil were less marked with residue cut to 0.1 m and no horizontal residue present. Averaged over the wheat growing cycle, tall-cut (0.3 m) residue combined with 4 t ha−1 horizontal residue had maximum soil temperatures 2.0 °C lower than the short-cut (0.1 m) residue combined with 4 t ha−1 horizontal residue, 3.3 °C lower than the tall-cut residue with nil horizontal residue, and 5.6 °C lower than bare soil. For the same comparisons, tall-cut residue with 4 t ha−1 horizontal residue had minimum air temperatures 1.6 °C higher than the short-cut (0.1 m) residue with 4 t ha−1 horizontal residue, 1.7 °C higher than the tall-cut residue with nil horizontal residue, and 3.8 °C higher than bare soil.

3.3. Soil Water

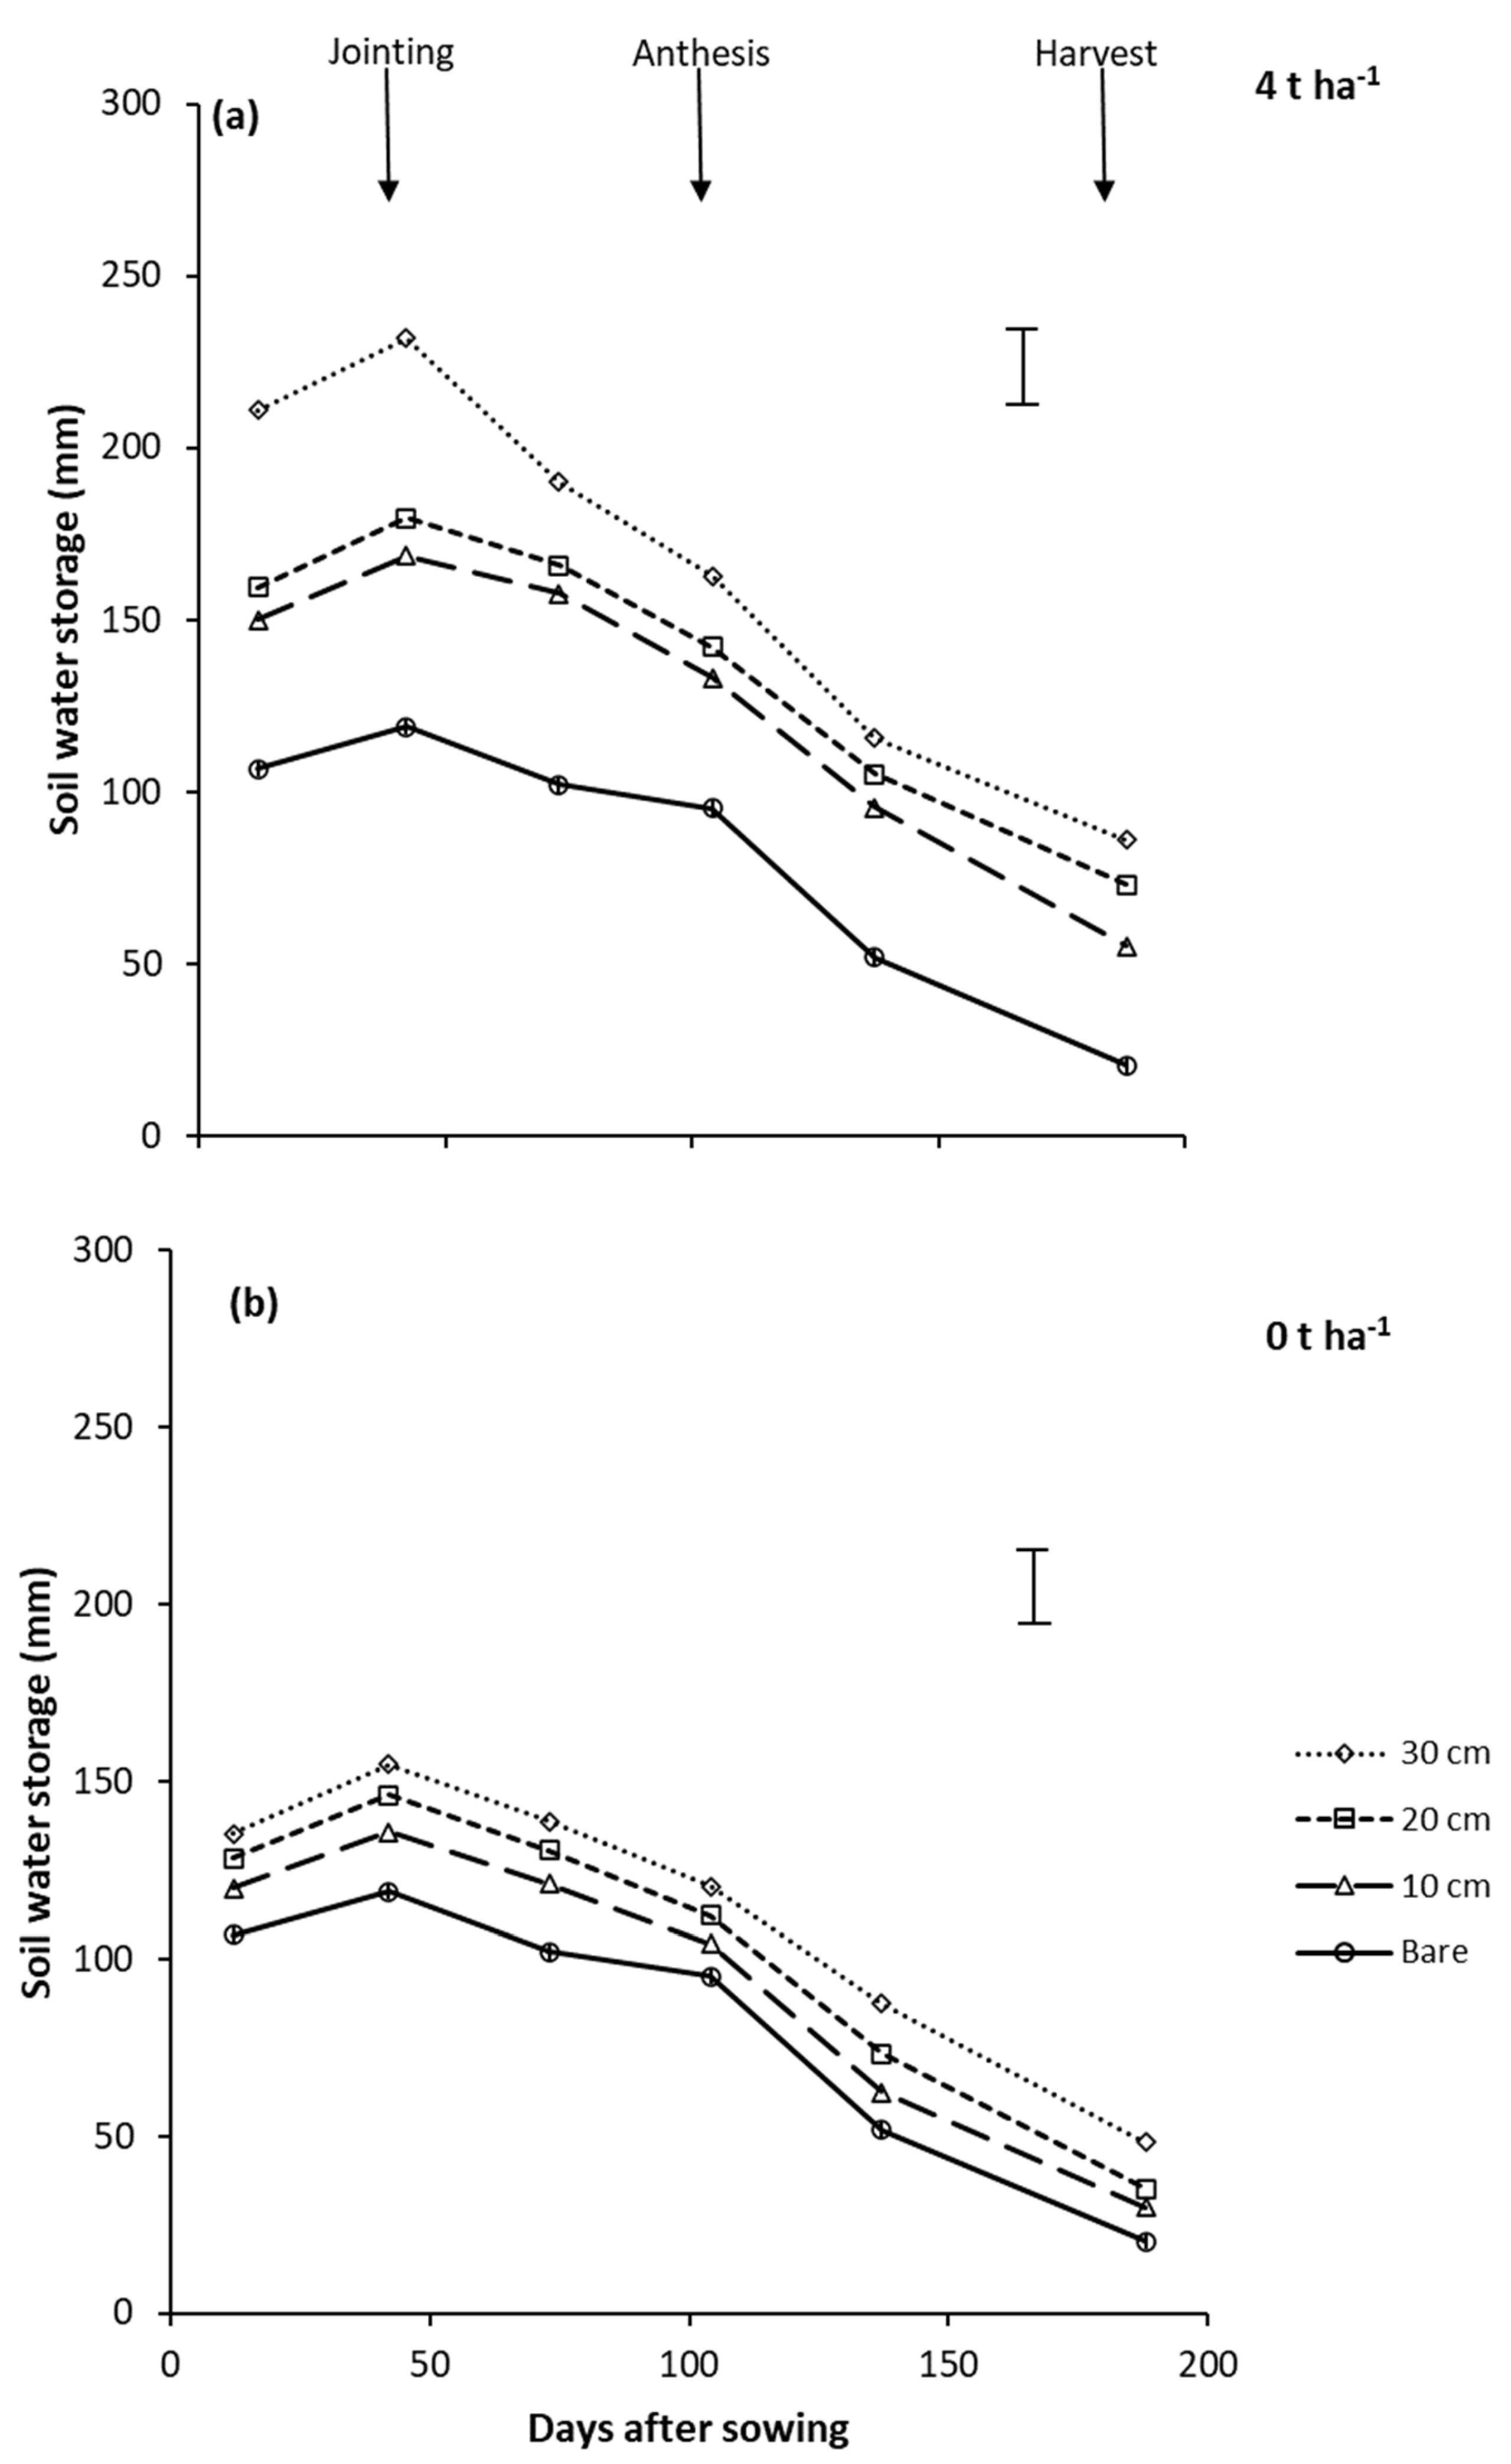
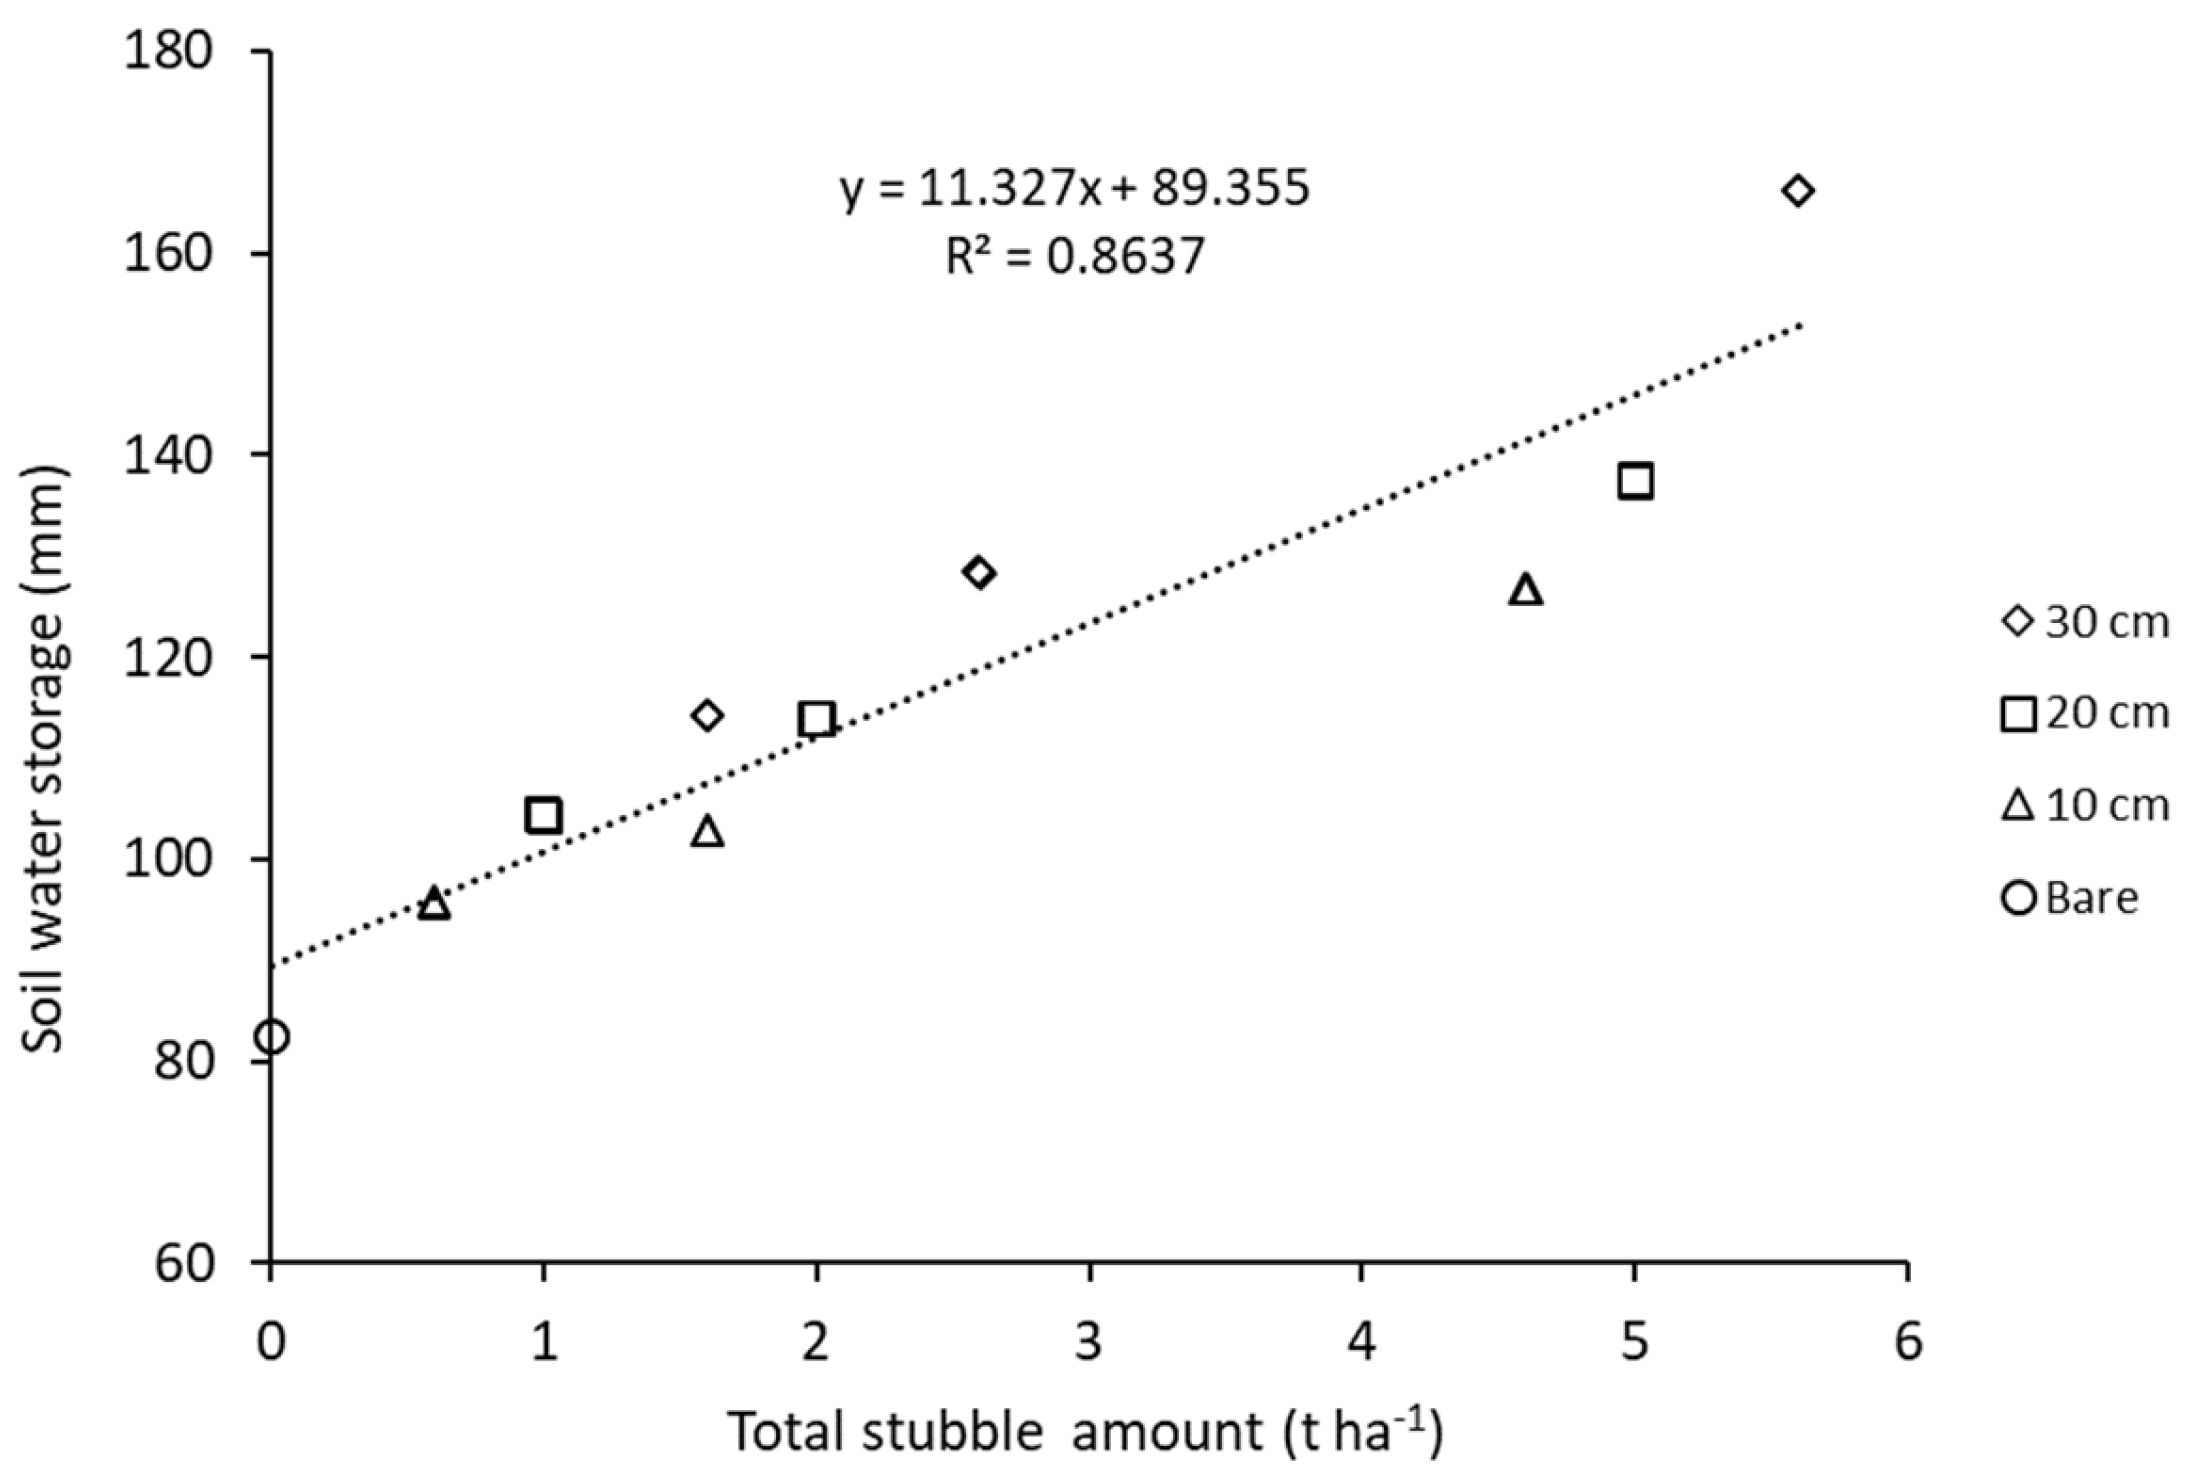
3.3.1. Shenton Park Experiment

The total soil water (0–2.4 m depth) increased up to 42 DAS and then decreased for the remainder of the wheat growing season (Figure 1), which coincided with rapid canopy development. Generally, from sowing to harvest, the total water in the soil profile was higher in wheat grown on tall-cut (0.3 m) residue combined with 4 t ha−1 horizontal residue compared with wheat on other residue combinations including bare soil (Figure 1a). During sowing (21 May 2010), wheat on this treatment combination had 60.9 mm more total soil water compared with wheat under shorter-cut (0.1 m) residue combined with 4 t ha−1 horizontal residue and 104.3 mm more than bare soil. At harvest, this treatment combination had 30.7 and 65.5 mm more soil water than wheat grown on shorter-cut residue with 4 t ha−1 horizontal residue and bare soil, respectively (Figure 1a). Wheat grown on bare soil always had less soil water than other residue combinations, but this difference was reduced when the residue-cut height decreased, combined with nil horizontal residue (Figure 1b). The trends in soil water for the 1 t ha−1 horizontal residue were intermediate to nil and 4 t ha−1 horizontal residue, and therefore the data are not presented. Overall, there was a strong positive relationship between the total residue amount (standing and horizontal) and total soil water averaged over the growing season, although taller standing residue appeared to be slightly more effective in conserving the soil water than the equivalent amount of horizontal residue (Figure 2).
Wheat grown with tall-cut (0.3 m) residue and 4 t ha−1 of horizontal residue had higher soil water contents over all depths and times compared with wheat under the other combinations and bare soil (Figure 3). The amount of soil water in the profile increased with the residue height and amount of horizontal residue. Differences between the different treatments decreased progressively from sowing through to harvest and were most apparent below about 0.5 m in soil depth. Soil water extraction occurred at all depths down to 2.4 m over the growing season.

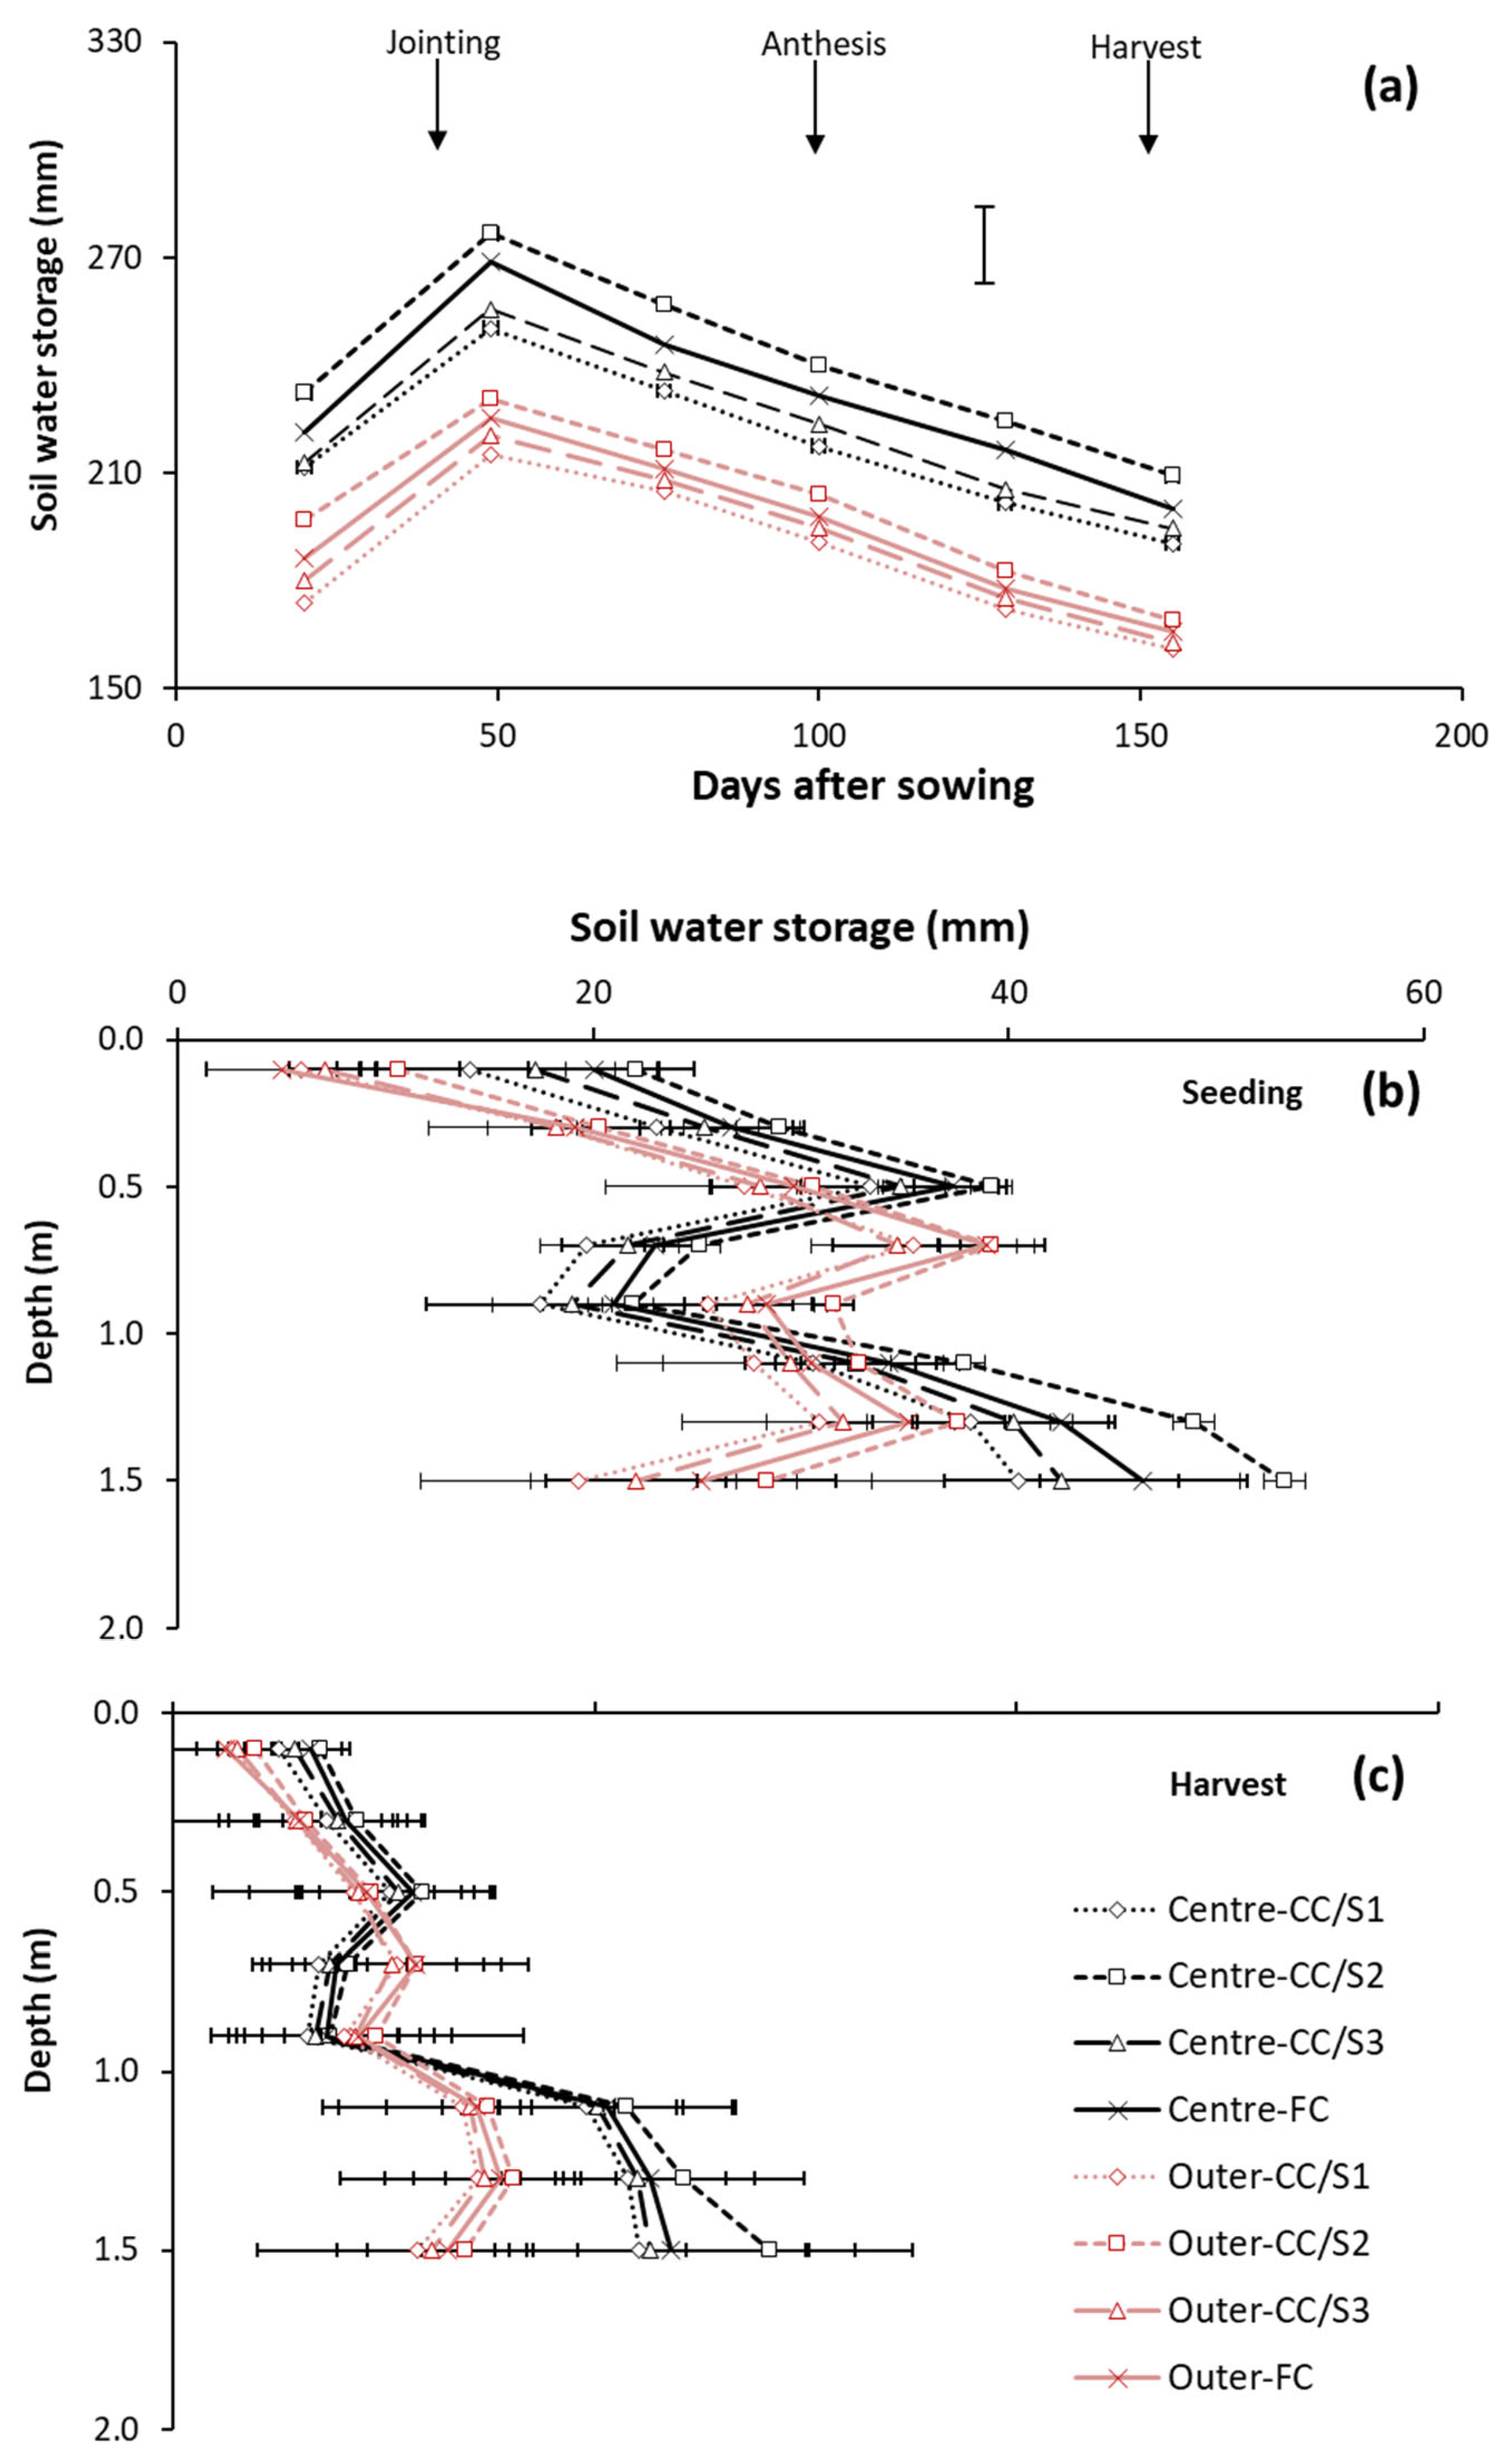
3.3.2. Cunderdin Experiment

The total soil water in the profile increased up to about 50 DAS and then decreased for the rest of the growing season (Figure 4a). The crop sequence S2 had a higher total soil water in all row positions compared with other sequences, and the effect was more evident in the centre position. Across all crop sequences, there was more soil water in the centre compared with the outer row positions. The total profile soil water for the intermediate row position was between the centre and outer positions, and for clarity, the data are not presented.
There were significant interactions (p < 0.001) for the soil water distribution in the profile between the crop sequence and row position. Detailed soil water profiles to a 1.6 m depth at seedling and harvest are shown in Figure 4b and Figure 4c, respectively. The patterns were the same at the two measurement times and anthesis (data not presented), with the centre positions for all sequences having higher soil water than the outer row position from the surface to about a 0.5–0.6 m depth and then again from about 1.0–1.6 m. The largest difference between row positions was in the deepest part of the profile (1.1–1.6 m). Overall, S2 had higher soil water than the other treatment sequences, followed by FC and then S3 and S1. In the upper (0–0.5 m) layer of S2, the centre had 29 and 8 mm more soil water than the outer row position at seeding and harvest, respectively. For the same comparison in the middle soil layer (0.7–0.9 m), the centre had 24 and 5 mm less soil water than the outer row position, while for the deeper layer (1.1–1.5 m), the centre had 41 and 29 mm more soil water than the outer row position. Overall, the centre in S2 had 46 and 32 mm more soil water in the 1.6 m profile than the outer row position at seeding (Figure 4b) and harvest (Figure 4c), respectively. In the upper part of the soil profile, the differences in soil water between sequences, described previously, were more evident in the centre compared with the outer row position, especially at seeding (Figure 4b). By harvest, the soil water had depleted further throughout the profile, and the largest differences were below about 1.2 m.

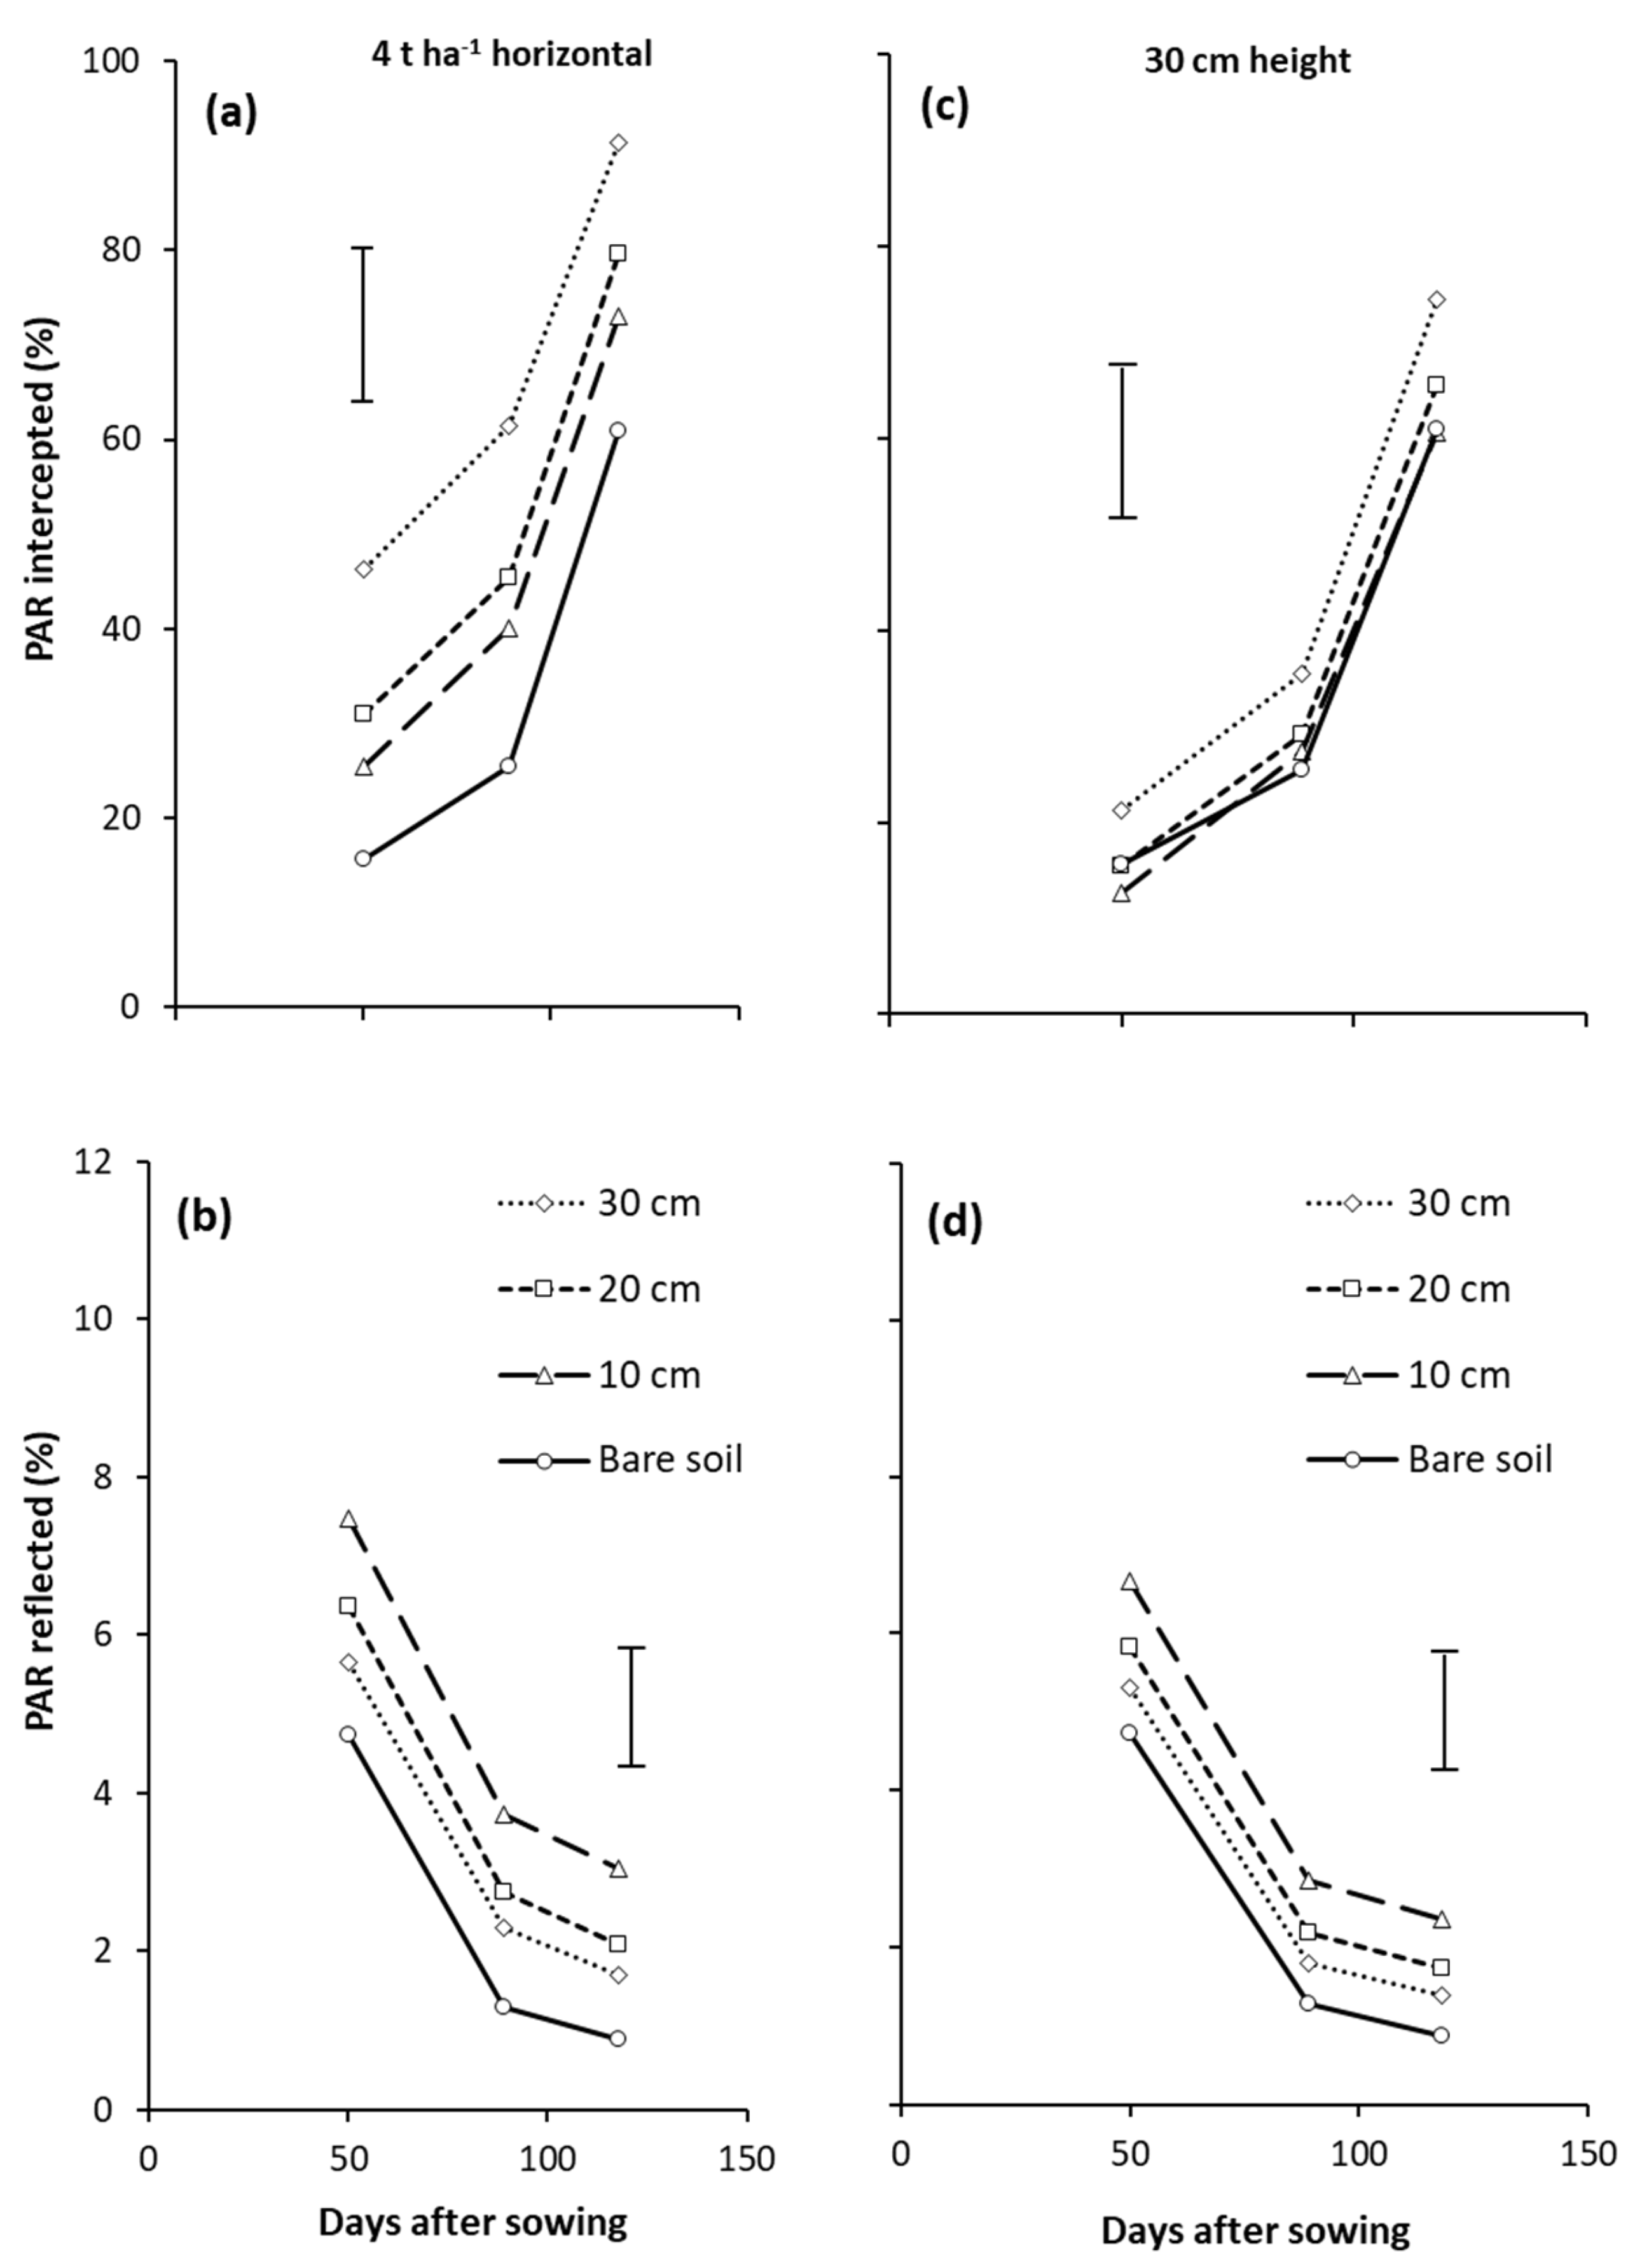
3.4. Photosynthetically Active Radiation (PAR) at Shenton Park

As expected, the fraction of intercepted PAR increased (Figure 5a,c) and reflected PAR decreased (Figure 5b,d) over time in all treatments, especially at anthesis (120 DAS). Overall, the magnitude of the differences in intercepted PAR were much greater than those of reflected PAR. The proportion of PAR intercepted by the crop generally increased with the residue-cut height and was lowest for bare soil. The opposite occurred for the proportion of PAR reflected by the canopy, where it decreased with taller-cut residue, except for bare soil, which had the lowest reflection. More PAR was both intercepted by the crop and reflected with the 4 t ha−1 horizontal residue (Figure 5a and Figure 5b, respectively) compared with the 1 t ha−1 (data not presented) and nil residue (Figure 5c and Figure 5d, respectively).

3.5. Plant Growth

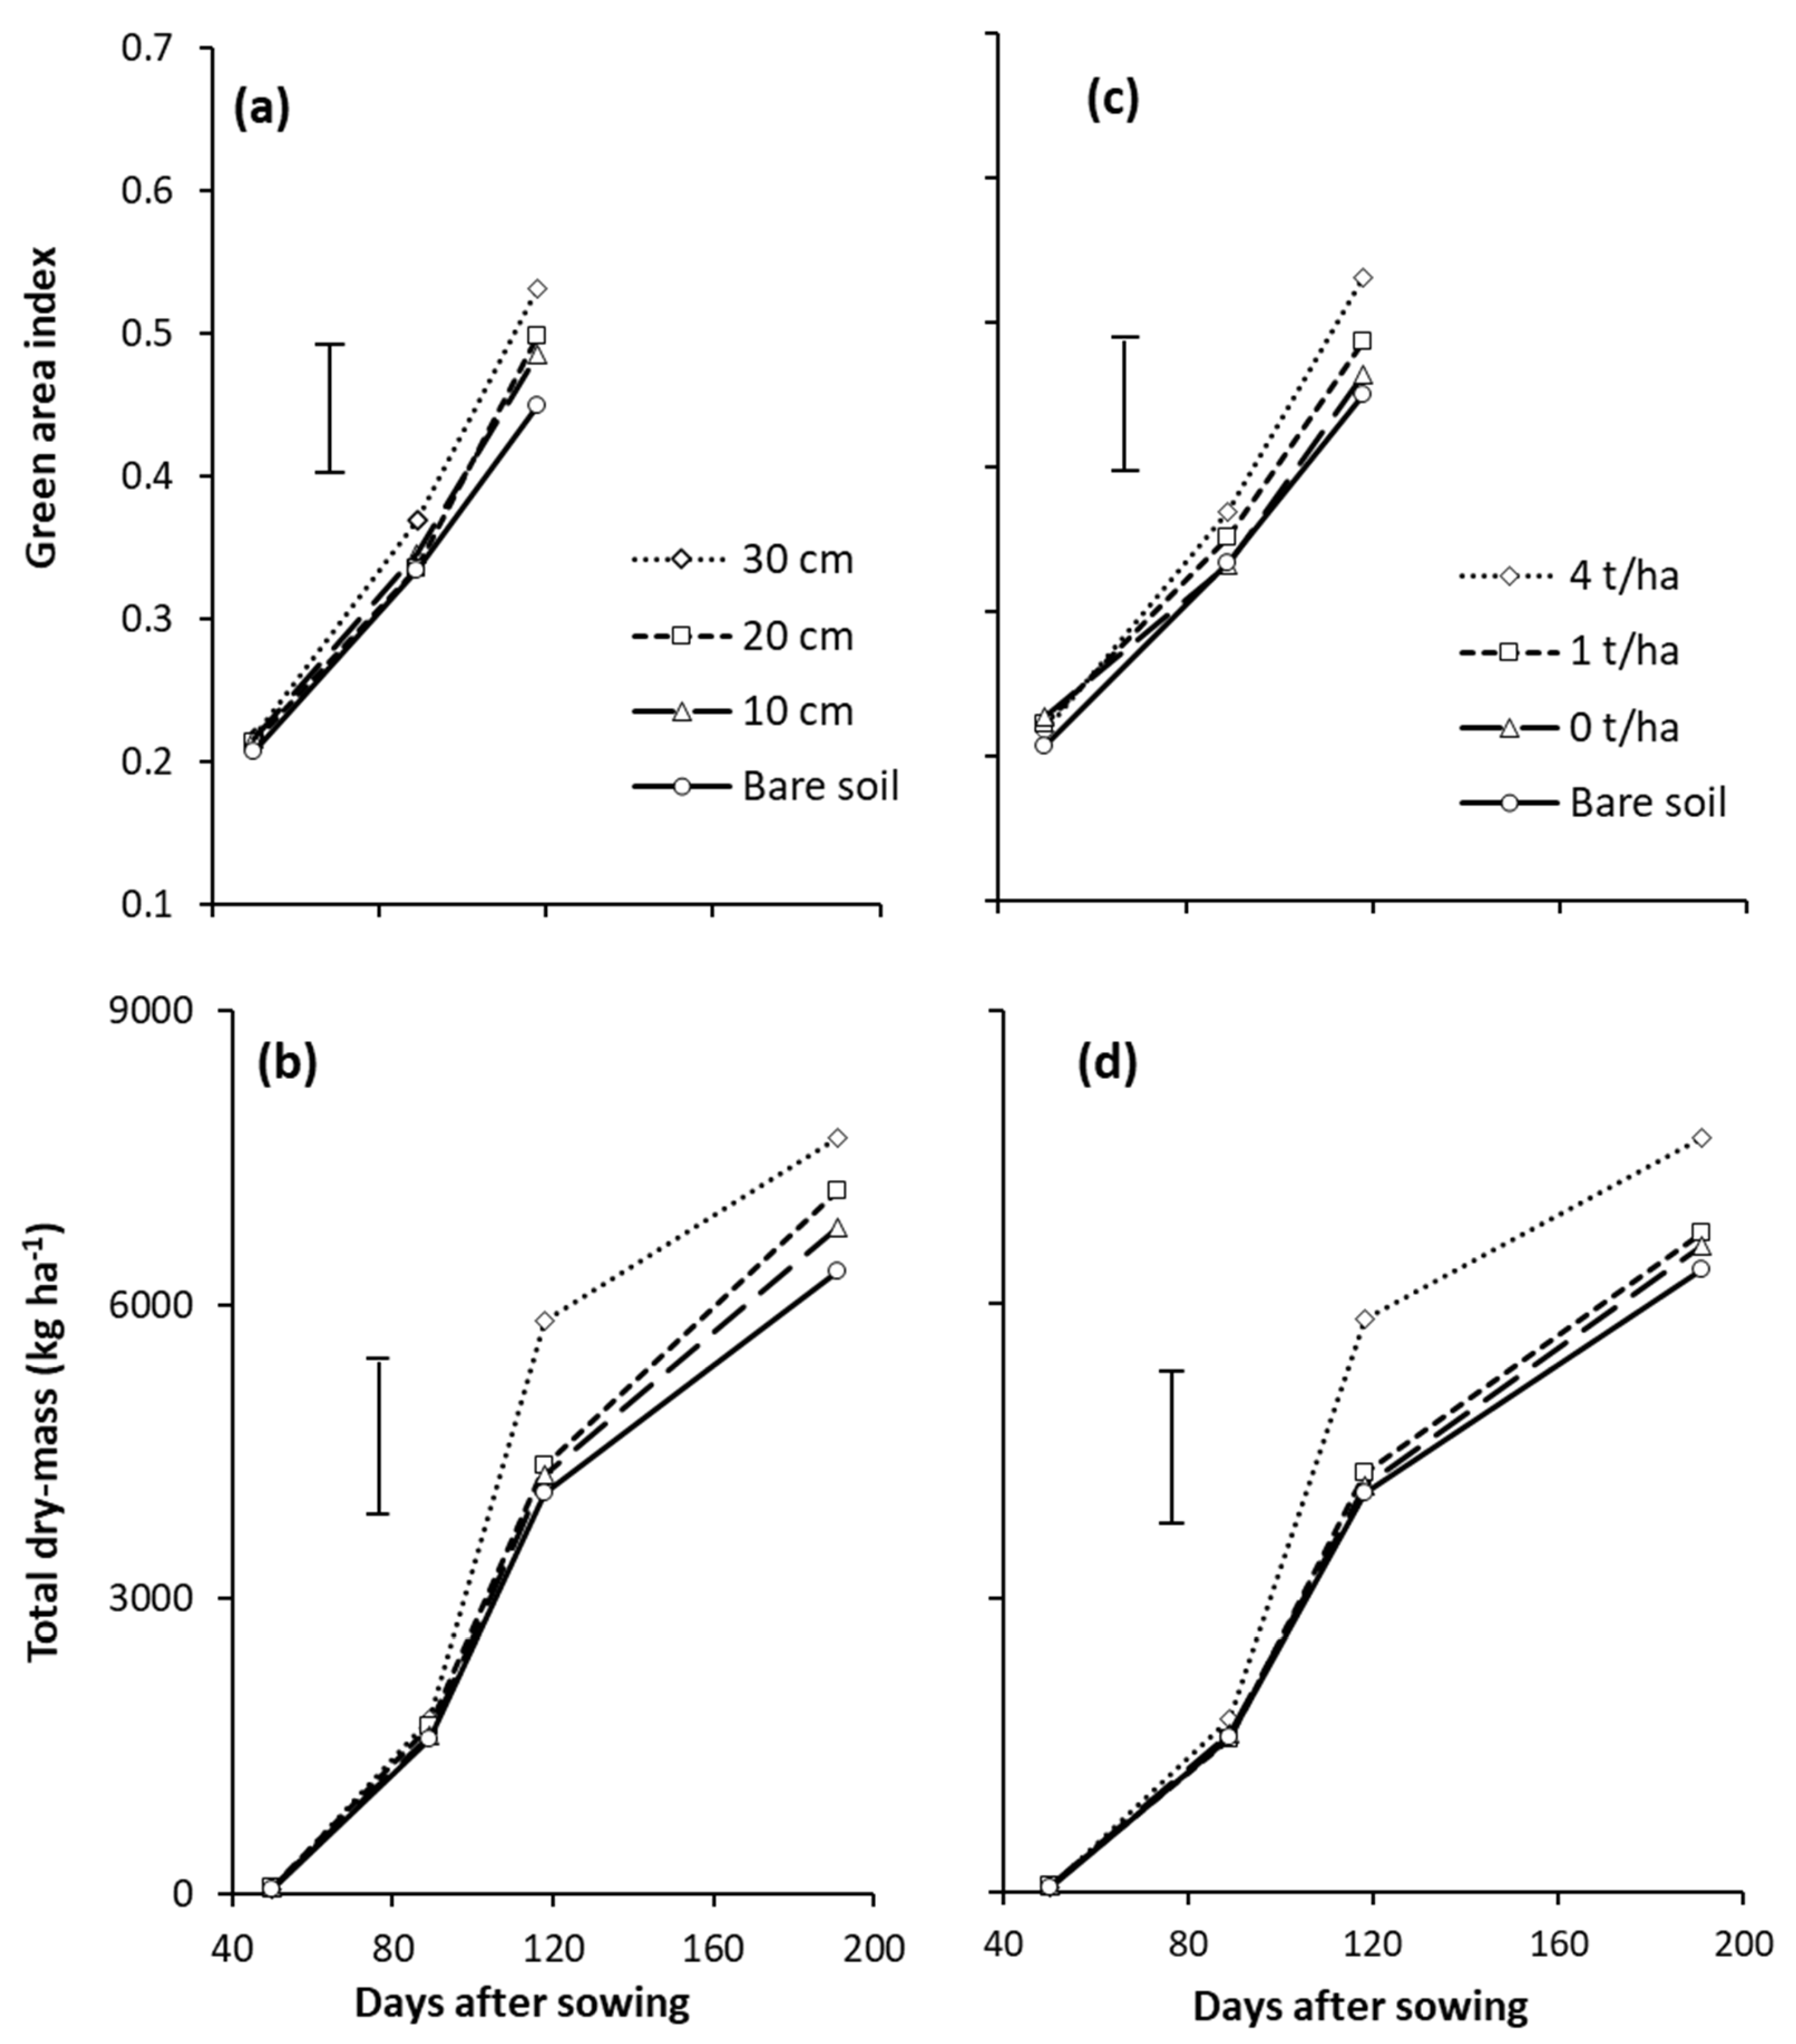
3.5.1. Shenton Park Experiment

From the seedling to jointing stages, the wheat height increased with the residue-cut height, and plants were also taller when combined with 4 t ha−1 compared with the 1 t ha−1 and nil horizontal residue. After anthesis, the plant height did not differ among the residue combinations (data not presented). There were no significant differences in green area index (GAI) at 50 DAS; however, at 89 and 118 DAS, wheat grown on tall-cut residue combined with 4 t ha−1 horizontal residue had a higher GAI than wheat grown in other treatment combinations and bare soil, which was the lowest, although the differences were only significant at the latter time (p = 0.039) (Figure 6a,c). Over the entire wheat growth cycle, the GAI of wheat grown on shorter-cut residue combined with 4 t ha−1 horizontal residue and on tall-cut residue with nil horizontal residue did not differ (Figure 6a,c). However, due to severe water stress, no further GAI was measured after 118 DAS. Residue management did not affect the proportion of aboveground dry matter (stems and leaves) on the first two sampling dates; by 118 and 191 DAS, wheat grown on tall-cut residue combined with 4 t ha−1 horizontal residue had a significantly (p = 0.042) higher total DM than wheat on other treatment combinations and bare soil (Figure 6b,d). The effect was more evident at anthesis (118 DAS) than when the crop was harvested (191 DAS). However, there was no significant difference in the total DM between wheat under tall-cut residue combined with nil horizontal residue and wheat under shorter-cut residue with 4 t ha−1 horizontal residue from 50 to 118 DAS (Figure 6d).

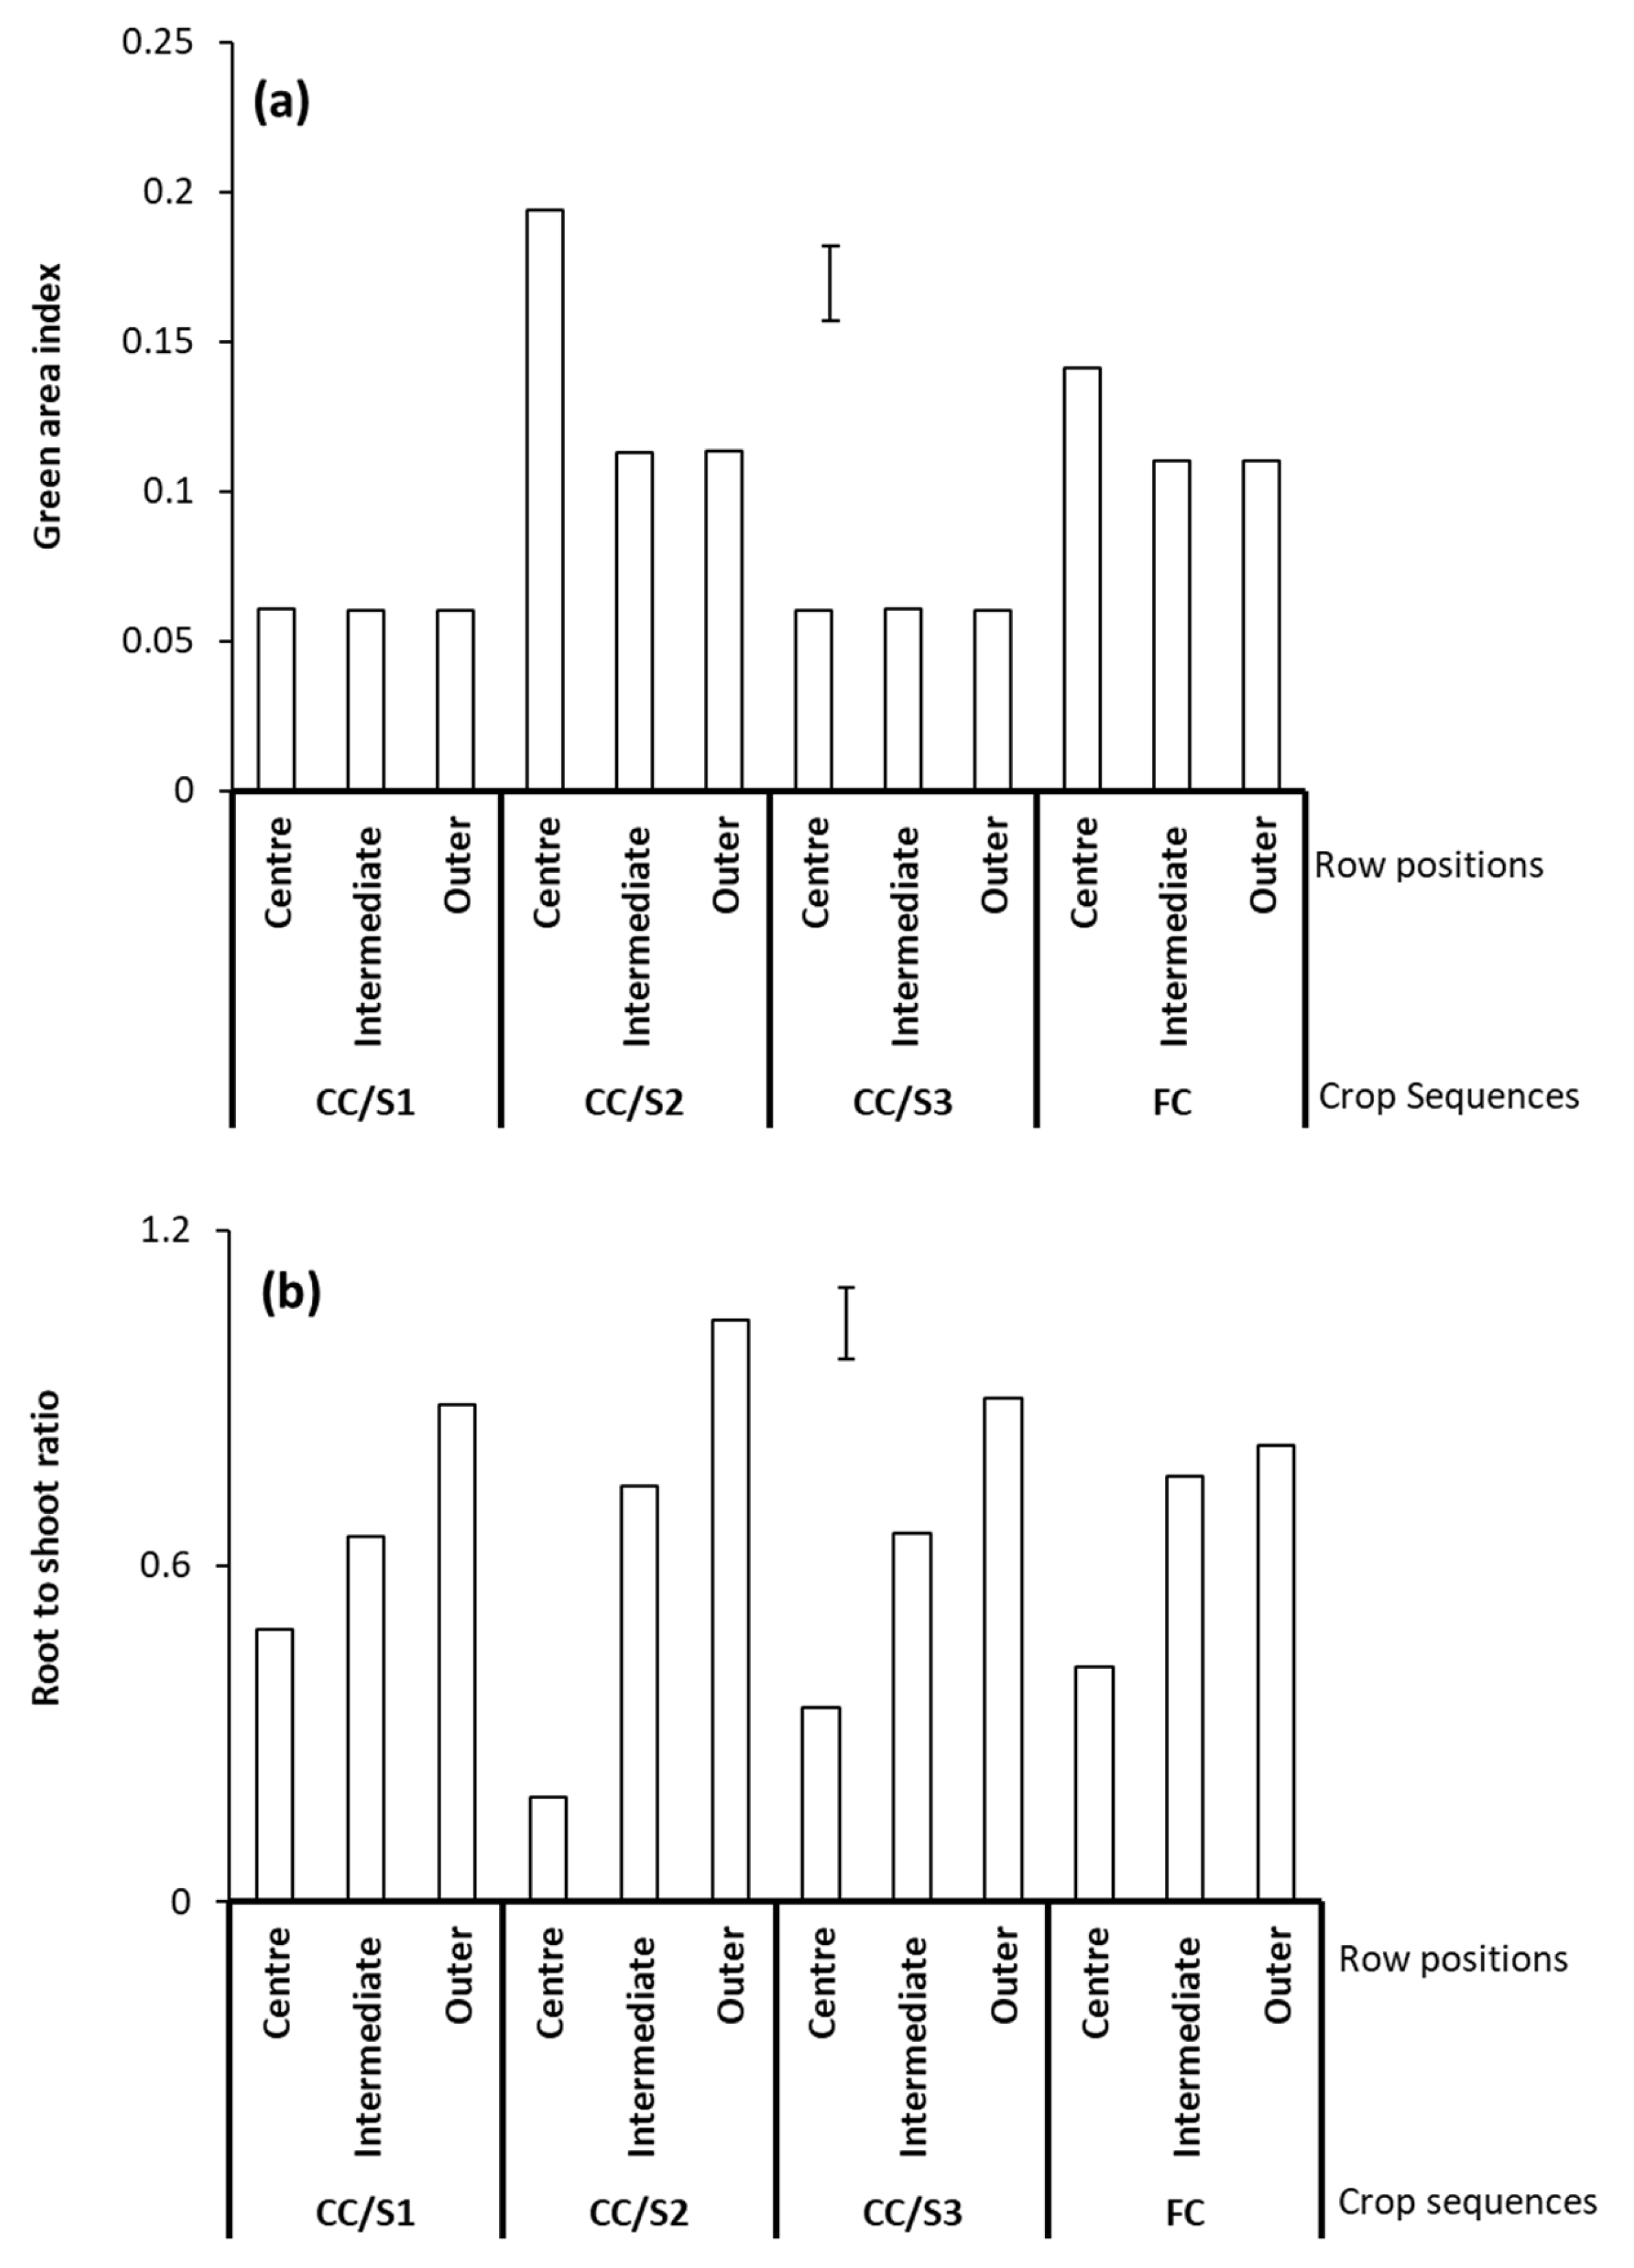
3.5.2. Cunderdin Experiment

There was a significant interaction between crop sequence and row position for the GAI at 63 DAS (p = 0.025) (Figure 7a). In S2 and FC, wheat grown on the centre position had a significantly higher GAI than wheat on other row positions while in S1 and S3, the wheat GAI did not differ among row positions. Generally, wheat in the outer row position had the highest root to shoot ratio, while the centre had the lowest (Figure 7b).
Total DM at 63 DAS decreased progressively from the centre to the outer position (Figure 8a). There was a significant crop sequence and row position interaction for wheat total DM at 63 DAS (p = 0.002). The centre position of S2 had a significantly greater DM than the other row positions, while for the other sequences, the centre was only significantly different from the outer position (Figure 8a). Overall, S2 had the highest and S1 the lowest DM, and these differences continued through to harvest (Figure 8a,b). Additionally, the differences in crop DM between crop sequences and row positions were greater as the season progressed (Figure 8b).

3.6. Yield Components and Crop Water Use Efficiency

3.6.1. Shenton Park Experiment

The number of seeds per spikelet was not significantly different among the residue combinations but the tiller number, spikes per unit area, and spikelets per spike were significantly higher in wheat grown in the tall-cut residue combined with 4 t ha−1 horizontal residue than in the other residue combinations, and there were no other differences between treatments. The residue-cut height and amount of horizontal residue did not affect the number of seeds per spikelet or thousand seed weight. Wheat grown in tall-cut (0.3 m) residue combined with 4 t ha−1 horizontal residue had a significantly higher (30%) seed yield (p = 0.011), harvest index (p = 0.040), and WUE (37%) (p = 0.035) than wheat grown under other treatment combinations and bare soil (Table 3). The yield and WUE of wheat with shorter-cut residue combined with 4 t ha−1 was similar to that of the 0.3 m cut height with 1 t ha−1 horizontal residue, which was higher than the other treatments, but these differences were not significant at p ≤ 0.05 (Table 3).

3.6.2. Cunderdin Experiment

Overall, the number of wheat tillers and spikes per unit area was highest in the centre and decreased to the outer row position. Differences between sequences in tiller number, spikes per unit area, and spikelets per spike were greatest in the centre position, where S2 recorded more tillers, spikes per unit area, and spikelets per spike compared with other sequences (p ≤ 0.05), and there was little difference between the other sequences (Table 4). There were no significant differences in seeds per spike and thousand seed weight, although the seed weights were very low with an average of 0.028 g seed−1.
Generally, the wheat yields were very low with an average for the site of 479 kg ha−1. Grain yield and WUE generally decreased from the centre to the outer row positions for all crop sequences, although some of the differences were not significant. S2 had a significantly higher yield and WUE than the other sequences in the centre, but not in the other row positions (Table 4).

4. Discussion

4.1. Effect of Residue Architecture on Soil Temperature

This study showed that NT systems retaining large amounts of standing and horizontal residue under WA conditions had a substantial effect on soil temperature. High levels of residue on the soil surface consistently reduced the maximum and increased the minimum soil temperatures. Increased residue coverage has been shown to reduce soil temperatures under both soybean and maize, with a greater reduction under maize, which was largely due to increased soil coverage [37]. The amount of horizontal residue and standing residue height had a greater effect on the maximum soil temperature from seeding to booting than for the remainder of the growth; this was probably due to increasing shade as the crop developed. As the crop leaf area and daily radiation increased from July to August, maximum soil temperature in wheat under thick residue was lower than that under nil horizontal residue. However, at full crop canopy, around August/September, the effect of the amount of horizontal residue decreased. Similar results were reported in north-west India on wheat [38,39,40,41], where increased amounts of horizontal residue was more effective at reducing soil temperatures than taller-cut residue, which had less on the ground.
In the current study with thick horizontal residue (4 t ha−1), the daily maximum soil temperatures were 2 °C lower and minimum 1.6 °C higher when the crop was grown on tall-cut compared with short-cut residue during early wheat growth.
Cutforth et al. [4,42] noted that tall-cut wheat residue (0.25–0.36 m) reduced the average soil temperature more than shorter-cut wheat residue (0.15–0.18 m) throughout the life cycles of pulse crops and canola in the Canadian prairie. Conversely, in central Alberta, Canada, Malhi et al. [43], working in lower temperatures, observed that the average soil temperatures increased with taller residue; temperatures were higher at a residue height of 0.15 or 0.3 m than at 0.075 m. Similarly, Schillinger and Wuest [44] found that soil temperatures averaged 1 °C cooler with short compared with medium- and tall-height residue in the Pacific Northwest USA. According to Zhang et al. [45], the magnitude of the changes in soil temperature due to crop residue varies between studies, which can perhaps be attributed to the amounts of standing and horizontal residue or the climate conditions, location, row orientation, methodology applied, and management factors.

4.2. Effect of Residue Architecture on Air Temperature

This study showed that both the residue-cut height and amount of horizontal residue affected air temperatures 0.05 m above the ground in wheat, but the effect was more apparent early in growth than in subsequent growth stages. Tall-cut residue had higher maximum and lower minimum air temperatures than shorter-cut residue, and the same pattern occurred with heavier horizontal residue compared with lighter or nil horizontal residue. The higher maximum temperatures with tall-cut residue and 4 t ha−1 horizontal residue suggests that turbulence in this residue combination was reduced and may trap or conserve heat from long wave radiation emanating from the soil surface [46]. Cutforth et al. [4] found air temperatures measured 0.15 m above the soil surface in the Canadian prairies before pulse crop flowering tended to be lowest in cultivated residue and highest in tall residue (0.25–0.36 m).
The present research found that residue management may be used to reduce the risk of frost under Western Australian conditions. Frost damage at anthesis is an important factor affecting crop production in southern Australia [27,47]. It appears that tall-cut (0.3 m) residue may have a higher frost risk than short-cut residue, as this treatment with the 1 t ha−1 horizontal residue had lower minimum air temperatures than the short-cut (0.1 m) residue with 4 t ha−1 spread on the ground; therefore it may be best for farmers in frost-prone areas to cut the residue low and have more spread on the ground for frost reduction. Bare soil had the highest air temperatures. The current study demonstrated that the best conditions for yield potential are not necessarily best for frost-prone conditions, although further work on air temperatures higher in the canopy under different residue conditions, particularly for very high-cut residue, is required, rather than just above the ground as was the case in this research.

4.3. Effect of Crop Residue Management on Soil Water Storage

It has been demonstrated that crop residues along with NT can improve the soil water retention under Mediterranean-type conditions by improving the plant-available soil water [25]. However, it is not clear how much residue is needed and whether standing or horizontal residue is optimal [48]. Under the particularly dry conditions experienced during the current study, the soil water storage increased with the cutting height and amount of horizontal residue. NT systems that include cover crops (S2) that are killed early to preserve soil water in the rotation can increase the soil water storage (>20–35%) more than those without a cover crop. Similar results were obtained by including a pasture or fallow in the rotation with plants/weeds killed in August or early September [36,49]. Varying the amounts of standing and horizontal residue will alter the effectiveness to reduce soil evaporation, as described by Steiner [50,51] and Steiner et al. [52]. According to Sommer et al. [25], horizontal residue decreases evaporation the most due to greater soil cover (higher area: mass ratio); however, keeping tall residue in conservation cropping can be beneficial in terms of lowering the wind speed at the soil surface and maintaining a more favourable microclimate for plants [46,53]. Smika [54] observed that the taller the standing residue (0.30–0.61 m), the lower the wind speed at the soil surface for any given wind speed above the residue. In a 4-year study, Schillinger and Wuest [44] showed that tall- (0.75 m) and medium-height (0.25 m) residue captured more overwinter precipitation than short residue (0.08 m), by 34 and 32 mm, respectively, and the effect was marked with snow drifting. However, tall residue lost more soil water in the following dry, warm, period. It is notable that the tall residue was obtained using a stripper front, which would leave little material on the ground, and the authors thought that this may have influenced the rate of water loss to be due to less soil shading. In Kansas, USA, there was less available soil water in standing wheat residue that was cut with a stripper front (average height 0.64 m) compared with shorter residue (average height 0.43 m) before planting corn (Zea mays L.), although there were no differences in subsequent yield between these residue heights. The wheat residue height had no effect on the available soil water at the planting of grain sorghum [55].
This research indicates that for the equivalent amount of residue, it would be better to cut residue relatively tall (~0.3 m) with less on the ground compared with short with more on the ground, although the differences were not great. Rainfall in this area often occurs in light showers, in which case tall-cut residue is likely to be more effective at soil water capture than thick layers of horizontal residue [26], especially if the seed is placed near to the standing residue row. The differences in infiltration and evaporation due to stubble orientation resulted in relatively large differences in the soil water storage to a depth of 2.4 m, becoming apparent shortly after sowing at both Shenton Park and Cunderdin. Despite the very low rainfall received in the current experiments, the results of this research are consistent with the findings of Smika [54], where increased soil water storage was associated with an increased proportion of standing residue (0.46 m). Moreover, in the USA, standing wheat residue reduced the convective components of evaporation more effectively than horizontal residue [56]. Similarly, in the Great Plains, USA, Klocke et al. [57] showed that evaporation from soil with standing wheat residue or horizontal corn (Zea mays) residue was related to the residue amount and surface cover. Under drought conditions, the benefit of tall standing residue (0.3–0.4 m from a stripper front), in combination with cover crops, was also demonstrated by Whippo et al. [23], who reported improved soybean yields, largely from greater water uptake by the crop. However, Hu et al. [58] found little difference in soil water storage between 0.15 m and 0.3 m residue heights in the Canadian prairies, although the taller residue generally increased the soil water content for the surface (0–0.3 m) soil depth.
The greater soil water retention with tall residue may be coupled with greater interception and infiltration of rainfall. This implies that the intercepted rainwater improved the soil water storage through penetration to deeper soil profile layers that are less prone to evaporation, as observed in this research. However, this was seen most during high rainfall events (during the early part of crop growth) than periods of less or no rain (after flowering). Although increased crop residue resulted in higher soil water content at depth, some of this additional stored water remained at harvest, suggesting poor root development at depth. Additional research is needed on the incomplete extraction of water from deeper in the profile, as discussed by Passioura and Angus [18]. These findings are also consistent with simulations studies of Verburg et al. [48] and Gregory et al. [10], who showed that increased water storage occurred with the combination of frequent rainfall and low evaporative demand.
This research also determined that the variability in soil water in NT fields, with crop residue retention, can be relatively high due to poor residue distribution, with more residue and soil water behind the harvester than near the edges of the harvester cutting front. Despite the potential benefits of improved soil water storage with high amounts of residue, there are other considerations such as the impact on crop nutrition and the need for improved knowledge on handling heavy residue loads at seeding. According to Flower et al. [29], more than 85% of NT systems in WA use seeders fitted with tines and knife points. In some situations, these seeders are not set up sufficiently well to handle high levels of crop residue, which was also noted by Scillinger and Wuest [44] in the Pacific Northwest USA. Poor residue distribution within a paddock impacts the physical and chemical soil properties, leading to variability in soil nutrients. This would particularly be the case for cereal residue, where the temporary immobilisation of nitrogen or phosphorus is likely to occur [59,60]. In contrast, legume residues, as a likely contributor of nitrogen (having a low carbon to nitrogen ratio), would be less variable, with most of the nitrogen derived from below ground residuals [61]. Additionally, with light rain showers, a significant amount of water can be intercepted with high levels of residue and lost without reaching the soil [18,25]. Furthermore, the efficacy of pre-emergence herbicides, aimed to limit weed development under NT systems, can be significantly reduced in fields with high amounts of residue [62]. Khalil et al. [33] also showed that spray coverage and weed control efficacy with the pre-emergent herbicide pyroxasulfone was greater in standing residue compared with shorter residue, with more material on the ground.

4.4. Effect of Crop Residue Management on Wheat Growth, Yield, and WUE

In a Mediterranean-type climate, water availability is the primary factor controlling crop productivity; therefore, soil and crop management practices that enhance soil water storage and availability are likely to increase the yield and overall productivity [63]. In the present study, tall standing residue with large amounts of horizontal residue created a favourable microclimate for optimum wheat growth, with more intercepted PAR and soil water with reduced maximum and increased minimum soil temperatures [64,65]. This produced higher GAI and DM at anthesis compared with wheat on other residue combinations and bare soil. In broadacre cropping scenarios, there is a trade-off between standing and horizontal residue quantity, in which higher cut stubble will result in a smaller quantity of horizontal residue. Furthermore, there is limited scope for farmers to manipulate residue levels to any level greater than the residue from the previous crop. Under the conditions experienced during these experiments, there was little difference between treatments such as 0.3 m cut height with 1.0 t ha−1 horizontal residue, and 0.1 m cut height with 4.0 t ha−1 horizontal residue.
Wheat grew better after an oat cover crop (S2) due to higher soil water following early termination of the cover crop the previous year. There was large variability in wheat growth perpendicular to the direction of the rows/harvester, with improved growth and yield behind the harvester, which had the highest levels of crop residue. The improved growth was due to increased soil water in a very dry season. According to Palta et al. [66], a deeper root system can increase the access to water and nitrogen early in the season, which may also result in additional water access for grain filling. However, a vigorous root system also increases the risk of depleting soil water before completing grain filling. Conversely, the current research showed that the rapid early growth of wheat, as observed through both dry matter accumulation and PAR interception, was associated with increased shoot DM rather than root DM. Increased PAR interception can also have the benefit of increased shading of the soil surface, which restricts soil evaporation, allowing for more crop transpiration.
In some cases, high residue loads can reduce crop emergence and growth [67,68], and the seeder setup is crucial for good crop growth in high residue systems. Sadras et al. [69] emphasised the importance for yield of having available resources for crop growth before flowering in Mediterranean-type environments, especially as the seed number has a major impact on yield in these environments, and this depends mostly on growing conditions before flowering [53,70,71,72]. In the current study, higher yields were due to an increased number of spikes and spikelets per spike, rather than the number of seeds per spikelet or seed weight, suggesting that the crop residue effects were mainly from emergence to anthesis [73]. Crop access to soil water stored deep in the profile is also important [74], especially as it is taken up after flowering, when the grain yield can be sensitive to water deficit; although, as mentioned previously, incomplete extraction of the water can occur [18,34,74,75].
With well-distributed rainfall, a water-limited yield potential of 20 kg ha−1 mm−1 in Mediterranean-type environments is often regarded as the benchmark [65,76]. However, the WUE of wheat crops can vary greatly, depending on the soil water-holding capacity, N management, rainfall amount, and in particular, seasonal rainfall distribution [77]; indeed, Angus et al. [78] reported between 4.0 and 15.8 kg ha−1 mm−1. In the current research, the WUE of wheat was generally higher with increasing residue amounts. The WUE ranged from 7.4 to 12.6 kg ha−1 mm−1 for the Shenton Park trial; however, at Cunderdin, the WUE was very low, with an of average 4.1 kg ha−1 mm−1 (i.e., approximately 11 kg ha−1 mm−1 transpiration efficiency), which was well below the water-limited potential and values reported by Zhang et al. [79]. This result was likely due to water stress at grain filling, as the growing-season rainfall at Cunderdin was close to the estimated evaporative losses for Western Australia of about 90 mm [80], leaving little remaining water for yield production. In contrast, at Shenton Park, a lower WUE was expected with higher rainfall and sandy soil [65,76]. The relatively high harvest index was likely due to the plants utilising the additional soil water deeper in the profile during grain fill.

5. Conclusions

This research confirmed that increased residue-cut height and amount of horizontal residue present from seeding to harvest improved the microclimate for wheat growth, especially the soil water availability, which resulted in increased yield under Mediterranean-type conditions. Furthermore, because rainfall in these climates often occurs in light showers, tall-cut residue is likely to be more effective at soil water capture than thick layers of residue, thereby increasing the soil water storage around the germinating seed.
Nonetheless, we caution that the yield benefit from increased residue is likely to vary according to seasonal conditions, as demonstrated by the differences between the two sites. Additionally, high levels of residue require good management at seeding and may also decrease yields in some situations such as with high rainfall or frost. The latter requires further research to determine the optimum residue management to minimise frost damage to crops.

Author Contributions

Conceptualisation, K.C.F., P.W., K.H.M.S. and G.S.; Methodology, K.C.F., P.W., K.H.M.S. and G.S.; Analysis, G.S. and K.C.F.; Data curation, G.S.; Writing—original draft preparation, G.S.; Writing—review and editing, K.C.F., P.W. and K.H.M.S.; Supervision, K.C.F., P.W. and K.H.M.S. All authors have read and agreed to the published version of the manuscript.

Funding

This research at Cunderdin was funded by the Grains Research and Development Corporation (GRDC). G.B. Swella was supported by The University of Western Australia for the SIRF Scholarship award to undertake his PhD studies.

Data Availability Statement

Further enquiries about the data supporting this study can be directed to the corresponding author.

Acknowledgments

The authors acknowledge support from the Western Australian No-Tillage Farmers Association.

Conflicts of Interest

The authors have no conflicts of interest.

Abbreviations

The following abbreviations are used in this manuscript:
NTNo-tillage
WUEWater use efficiency

References

  1. McMaster, G.S.; Aiken, R.M.; Nielsen, D.C. Optimizing wheat harvest cutting height for harvest efficiency and soil and water conservation. Agron. J. 2000, 92, 1104–1108. [Google Scholar] [CrossRef]
  2. Aiken, R.M.; Flerchinger, G.N.; Farahani, H.J.; Johnsen, K.E. Energy balance simulation for surface soil and residue temperatures with incomplete cover. Agron. J. 1997, 89, 404–415. [Google Scholar] [CrossRef]
  3. Smika, D.E.; Unger, P.W. Effect of surface residues on soil water storage. In Advances in Soil Science; Springer: New York, NY, USA, 1986; pp. 1–28. [Google Scholar]
  4. Cutforth, H.W.; McConkey, B.G.; Ulrich, D.; Miller, P.R.; Angadi, S.V. Yield and water use efficiency of pulses seeded directly into standing stubble in the semiarid Canadian Prairie. Can. J. Plant Sci. 2002, 82, 681–686. [Google Scholar] [CrossRef]
  5. Lascano, R.J.; Baumhardt, R.L.; Hicks, S.K.; Heilman, J.L. Soil and plant water evaporation from strip-tilled cotton: Measurement and simulation. Agron. J. 1994, 86, 987–999. [Google Scholar] [CrossRef]
  6. Abdallah, A.M.; Jat, H.S.; Choudhary, M.; Abdelaty, E.F.; Sharma, P.C.; Jat, M.L. Conservation agriculture effects on soil water holding capacity and water-saving varied with management practices and agroecological conditions: A review. Agronomy 2021, 11, 1681. [Google Scholar] [CrossRef]
  7. French, R.J. The effect of fallowing on the yield of wheat, I. The effect on soil water storage and nitrate supply. Aust. J. Agric. Res. 1978, 29, 653–668. [Google Scholar] [CrossRef]
  8. French, R.J. Effect of fallowing on yield of wheat.2. Effect on grain yield. Aust. J. Agric. Res. 1978, 29, 669–684. [Google Scholar] [CrossRef]
  9. Saffari, N.; Hajabbasi, M.A.; Shirani, H.; Mosaddeghi, M.R.; Owens, G. Influence of corn residue biochar on water retention and penetration resistance in a calcareous sandy loam soil. Geoderma 2021, 383, 114734. [Google Scholar] [CrossRef]
  10. Gregory, P.J.; Simmonds, L.P.; Pilbeam, C.J. Soil type, climatic regime, and the response of water use efficiency to crop management. Agron. J. 2000, 92, 814–820. [Google Scholar] [CrossRef]
  11. Monzon, J.P.; Sadras, V.O.; Andrade, F.H. Fallow soil evaporation and water storage as affected by stubble in sub-humid (Argentina) and semi-arid (Australia) environments. Field Crops Res. 2006, 98, 83–90. [Google Scholar] [CrossRef]
  12. Kirkegaard, J.A.; Hunt, J.R. Increasing productivity by matching farming system management and genotype in water-limited environments. J. Exp. Bot. 2011, 61, 4129–4143. [Google Scholar] [CrossRef]
  13. Barrett-Lennard, E.G.; George, N.; D’Antuono, M.; Holmes, K.W.; Ward, P.R. Rain and potential evapotranspiration are the main drivers of yield for wheat and barley in southern Australia: Insights from 12 years of National Variety Trials. Crop Pasture Sci. 2024, 75, CP23320. [Google Scholar] [CrossRef]
  14. Liu, J.; Lobb, D.A. Overview of crop and crop residue management impacts on crop water use and runoff in the Canadian Prairies. Water 2021, 13, 2929. [Google Scholar] [CrossRef]
  15. Zhao, H.; Qin, J.; Gao, T.; Zhang, M.; Sun, H.; Zhu, S.; Xu, C.; Ning, T. Immediate and long-term effects of tillage practices with crop residue on soil water and organic carbon storage changes under a wheat-maize cropping system. Soil Tillage Res. 2022, 218, 105309. [Google Scholar] [CrossRef]
  16. Delandmeter, M.; Colinet, G.; Pierreux, J.; Bindelle, J. Combining field measurements and process- based modelling to analyse soil tillage and crop residues management impacts on crop production and carbon balance in temperate areas. Soil Use Manag. 2023, 40, e13098. [Google Scholar] [CrossRef]
  17. Farooq, M.; Flower, K.C.; Jabran, K.; Wahid, A.; Siddique, K.H.M. Crop yield and weed management in rainfed conservation agriculture. Soil Tillage Res. 2011, 117, 172–183. [Google Scholar] [CrossRef]
  18. Passioura, J.B.; Angus, J.F. Improving productivity of crops in water-limited environments. In Advances in Agronomy; Sparks, D.L., Ed.; Academic Press: Barlington, MA, USA, 2010; Volume 106, pp. 37–75. [Google Scholar]
  19. Gregory, P.J.; Tennant, D.; Belford, R.K. Root and shoot growth, and water and light use efficiency, of barley and wheat crops grown on a shallow duplex soil in a Mediterranean environment. Aust. J. Agric. Res. 1992, 43, 555–573. [Google Scholar] [CrossRef]
  20. Hamblin, A.; Tennant, D.; Perry, M.W. Management of soil water for wheat production in Western Australia. Soil Use Manag. 1987, 3, 63–69. [Google Scholar] [CrossRef]
  21. Thomas, G.A.; Titmarsh, G.W.; Freebairn, D.M.; Radford, B.J. Non-tillage and conservation farming practices in grain growing areas of Queensland—A review of 40 years of development. Aust. J. Exp. Agric. 2007, 47, 887–898. [Google Scholar] [CrossRef]
  22. Tripathi, S.; Kaur, A.; Brar, A.S.; Sekhon, K.S.; Singh, S.; Kisi, O. Optimizing yield and water productivity in summer mung bean (Vigna radiata L.) through crop residue management and irrigation strategies. BMC Plant Biol. 2024, 24, 1012. [Google Scholar] [CrossRef]
  23. Whippo, C.W.; Saliendra, N.Z.; Liebig, M.A. Cover crop inclusion and residue retention improves soybean production and physiology in drought conditions. Heliyon 2024, 10, e29838. [Google Scholar] [CrossRef] [PubMed]
  24. Riedell, W.E.; Osborne, S.L.; Dagel, K.J. Maize residue removal and cover crop effects on subsequent soybean crops. Agron. J. 2017, 109, 2762–2770. [Google Scholar] [CrossRef]
  25. Sommer, R.; Piggin, C.; Haddad, A.; Hajdibo, A.; Hayek, P.; Khalil, Y. Simulating the effects of minimum tillage and crop residue retention on water relations and yield of wheat under rainfed semiarid Mediterranean conditions. Field Crop Res. 2012, 132, 40–52. [Google Scholar] [CrossRef]
  26. Swella, G.B.; Ward, P.R.; Siddique, K.H.M.; Flower, K.C. Combinations of tall standing and horizontal residues affect soil water dynamics in rainfed conservation agriculture systems. Soil Tillage Res. 2015, 147, 30–38. [Google Scholar] [CrossRef]
  27. GRDC. Stubble Management Fact Sheet: Strategies to Manage Winter Crop Stubbles Without Reaching for the Matches. 2011, pp. 1–8. Available online: https://grdc.com.au/resources-and-publications/all-publications/factsheets/2011/03/stubble-management (accessed on 1 June 2013).
  28. Collins, M.; Better Residue Management for More Sustainable Cropping. Taken from a Conference Paper Presented to the Fourth Crop Science Congress Held in Brisbane in 2004. 2004. Available online: https://www.agronomyaustraliaproceedings.org/index.php/home/26-2004-conference-information/168-2004-sustainability-conservation-and-reduced-tillage-systems (accessed on 20 March 2009).
  29. Flower, K.C.; Crabtree, B.; Butler, G. No-till cropping systems in Australia. In No-Till Farming Systems; Goddard, T., Zoebisch, M., Gan, Y., Ellis, W., Watson, A., Sombatpanit, S., Eds.; Special Publication No. 3; World Association of Soil and Water Conservation: Beijing, China, 2007; pp. 457–467. [Google Scholar]
  30. USDA. Keys to Soil Taxonomy, 5th ed.; Pocahontas Press: Blacksburg, VA, USA, 1992. [Google Scholar]
  31. McArthur, W.M.; Bettenay, E. Development and Distribution of Soils of the Swan Coastal Plain, Western Australia; CSIRO: Canberra, Australia, 1960. [Google Scholar]
  32. Pathan, S.M.; Alymore, L.A.G.; Colmer, T.D. Properties of several fly ash materials in relation to use as soil amendments. J. Environ. Qual. 2003, 32, 687–693. [Google Scholar] [CrossRef] [PubMed]
  33. Khalil, Y.; Flower, K.; Siddique, K.H.M.; Ward, P. Pyroxasulfone efficacy for annual ryegrass control is affected by wheat residue height, amount and orientation. Pest Manag. Sci. 2019, 76, 861–867. [Google Scholar] [CrossRef]
  34. Fischer, R.A. Growth and water limitation to dryland wheat yield in Australia: A physiological framework. J. Aust. Inst. Agric. Sci. 1979, 45, 83–94. [Google Scholar]
  35. Ward, P.R.; Hall, D.J.M.; Micin, S.F.; Whisson, K.; Willis, T.M.; Treble, K.; Tennant, D. Water use by annual crops. 1. Role of dry matter production. Aust. J. Agric. Res. 2007, 58, 1159–1166. [Google Scholar] [CrossRef]
  36. Flower, K.C.; Cordingley, N.; Ward, P.R.; Weeks, C. Nitrogen, weed management and economics with cover crops in conservation agriculture in a Mediterranean climate. Field Crop Res. 2012, 132, 63–75. [Google Scholar] [CrossRef]
  37. Shen, Y.; McLaughlin, N.; Zhang, X.; Xu, M.; Liang, A. Effect of tillage and crop residue on soil temperature following planting for a Black soil in Northeast China. Sci. Rep. 2018, 8, 4500. [Google Scholar] [CrossRef]
  38. Singh, B.; Humphrey, E.; Eberbach, P.L.; Katupitiyac, A.; Singh, Y.; Kukal, S.S. Growth, yield and water productivity of zero till wheat as affected by rice straw mulch and irrigation schedule. Field Crops Res. 2011, 121, 209–225. [Google Scholar] [CrossRef]
  39. Chakraborty, D.; Nagarajan, S.; Aggarwal, P.; Gupta, V.K.; Tomar, R.K.; Garg, R.N.; Sahoo, R.N.; Sarkar, A.; Chopra, U.K.; Sarma, K.S.S.; et al. Effect of mulching on soil and plant water status, and the growth and yield of wheat (Triticum aestivum L.) in a semi-arid environment. Agric. Water Manag. 2008, 95, 1323–1334. [Google Scholar] [CrossRef]
  40. Sidhu, H.S.; Manpreet, S.; Humphreys, E.; Singh, Y.; Singh, B.; Dhillon, S.S.; Blackwell, J.; Bector, V.; Malkeet, S.; Sarbjeet, S. The Happy Seeder enables direct drilling of wheat into rice stubble. Aust. J. Exp. Agric. 2007, 47, 844–854. [Google Scholar] [CrossRef]
  41. Singh, Y.; Humphreys, E.; Kukal, S.S.; Dhillon, S.S.; Singh, B.; Kaur, A.; Thaman, S.; Prashar, A.; Yadav, S.; Kaur, N.; et al. Crop performance in a permanent raised bed rice–wheat cropping system in Punjab, India. Field Crops Res. 2008, 111, 1–20. [Google Scholar] [CrossRef]
  42. Cutforth, H.W.; Angadi, S.V.; McConkey, B.G. Stubble management and microclimate, yield and water use efficiency of canola grown in the semiarid Canadian prairie. Can. J. Plant Sci. 2006, 86, 99–107. [Google Scholar] [CrossRef]
  43. Malhi, S.S.; Bhalla, M.K.; Piening, L.J.; Caldwell, C.D. Effect of stubble height and tillage on winter soil temperature in central Alberta. Soil Tillage Res. 1992, 22, 243–251. [Google Scholar] [CrossRef]
  44. Schillinger, W.F.; Wuest, S.B. Wheat stubble height effects on soil water capture and retention during long fallow. Agric. Water Manag. 2021, 256, 107117. [Google Scholar] [CrossRef]
  45. Zhang, S.; Lovdahl, L.; Grip, H.; Tong, Y.; Yang, X.; Wang, Q. Effects of mulching and catch cropping on soil temperature, soil moisture and wheat yield on the Loess Plateau of China. Soil Tillage Res. 2009, 102, 76–86. [Google Scholar] [CrossRef]
  46. Aase, J.K.; Siddoway, F.H. Stubble height effects on seasonal microclimate, water balance, and plant development of no-till winter wheat. Agric. Meteorol. 1980, 21, 1–20. [Google Scholar] [CrossRef]
  47. DAFWA. Frost Slashes $200m in Wheatbelt Crops. 2008. Available online: https://www.abc.net.au/news/2008-10-08/frost-slashes-200m-in-wheatbelt-crops/535084 (accessed on 31 August 2012).
  48. Verburg, K.; Bond, W.J.; Hunt, J.R. Fallow management in dryland agriculture: Explaining soil water accumulation using a pulse paradigm. Field Crops Res. 2012, 130, 68–79. [Google Scholar] [CrossRef]
  49. Ward, P.R.; Flower, K.C.; Cordingley, N.; Weeks, C.; Micin, S.F. Soil water balance with cover crops and conservation agriculture in a Mediterranean climate. Field Crop Res. 2012, 132, 33–39. [Google Scholar] [CrossRef]
  50. Steiner, J.L. Tillage and surface residue effects on evaporation from soils. Soil Sci. Soc. Am. J. 1989, 53, 911–916. [Google Scholar] [CrossRef]
  51. Steiner, J.L. Crop residue effect on water conservation. In Managing Agricultural Residues; Unger, P.W., Ed.; Lewis Publishers: Boca Raton, FL, USA, 1994; pp. 41–76. [Google Scholar]
  52. Steiner, J.L.; Schomberg, H.H.; Douglas, C.L.; Black, A.L. Standing stem persistence in no-tillage small-grain fields. Agron. J. 1994, 86, 76–81. [Google Scholar] [CrossRef]
  53. Cutforth, H.W.; McConkey, B.G. Stubble height effects on microclimate, yield and water use efficiency of spring wheat grown in a semiarid climate on the Canadian prairies. Can. J. Plant Sci. 1997, 77, 359–366. [Google Scholar] [CrossRef]
  54. Smika, D.E. Soil water change as related to position of wheat straw mulch on the soil surface. Soil Sci. Soc. Am. J. 1983, 47, 988–991. [Google Scholar] [CrossRef]
  55. Schlegel, A.; Haag, L.; Assefa, Y.; Holman, J. Wheat stubble height effects on subsequent corn and grain sorghum crops. Crop Sci. 2023, 63, 1494–1507. [Google Scholar] [CrossRef]
  56. Aiken, R.M.; Nielsen, D.C.; Ahuja, L.R. Scaling effects of standing crop residues on the wind profile. Agron. J. 2003, 95, 1041–1046. [Google Scholar] [CrossRef]
  57. Klocke, N.L.; Currie, R.S.; Aiken, R.M. Soil water evaporation and crop residues. Trans. ASABE 2009, 52, 103–110. [Google Scholar] [CrossRef]
  58. Hu, W.; Schoenau, J.J.; Cutforth, H.W.; Si, B.C. Effects of row-spacing and stubble height on soil water content and water use by canola and wheat in the dry prairie region of Canada. Agric. Water Manag. 2015, 153, 77–85. [Google Scholar] [CrossRef]
  59. Honvault, N.; Faucon, M.-P.; McLaren, T.; Houben, D.; Frossard, E.; Oberson, A. Influence of cover crop residue traits on phosphorus availability and subsequent uptake by plants. Nutr. Cycl. Agroecosyst. 2024, 128, 131–148. [Google Scholar] [CrossRef]
  60. Zhang, X.; Zhang, X.; Li, X.; Zhu, Y.; Lv, H.; Zhou, W. Microbial mechanism of crop residues addition in nitrogen leaching loss retention and soil ecosystem stability maintenance. Environ. Technol. Innov. 2023, 31, 103194. [Google Scholar] [CrossRef]
  61. Liu, L.; Knight, J.D.; Lemke, R.L.; Farrell, R.E. Quantifying the contribution of above- and below-ground residues of chickpea, faba bean, lentil, field pea and wheat to the nitrogen nutrition of a subsequent wheat crop. Field Crops Res. 2024, 313, 109412. [Google Scholar] [CrossRef]
  62. Warnemuende, E.A.; Patterson, J.P.; Smith, D.R.; Huang, C. Effects of tilling no-till soil on losses of atrazine and glyphosate to runoff water under variable intensity simulated rainfall. Soil Tillage Res. 2007, 95, 19–26. [Google Scholar] [CrossRef]
  63. Imaz, M.J.; Virto, I.; Bescansa, P.; Enrique, A.; Fernandez-Ugalde, O.; Karlen, D.L. Soil quality indicator response to tillage and residue management on semi-arid Mediterranean cropland. Soil Tillage Res. 2010, 107, 17–25. [Google Scholar] [CrossRef]
  64. Biscoe, P.V.; Gallagher, J.N. Weather dry matter production yield. In Environmental Effects on Crop Physiology; Landsberg, J.J., Cutting, C.V., Eds.; Academic Press: London, UK, 1977; pp. 75–100. [Google Scholar]
  65. French, R.J.; Schultz, J.E. Water use efficiency of wheat in a Mediterranean-type environment. II. Some limitations to efficiency. Aust. J. Agric. Res. 1984, 35, 765–775. [Google Scholar] [CrossRef]
  66. Palta, J.A.; Chen, X.; Milroy, S.P.; Rebetzke, G.J.; Fernanda Dreccer, M.; Watt, M. Large root systems: Are they useful in adapting wheat to dry environments? Funct. Plant Biol. 2011, 38, 347–354. [Google Scholar] [CrossRef]
  67. Morris, N.L.; Miller, P.C.H.; Orson, J.H. The effect of wheat straw residue on the emergence and early growth of sugar beet (Beta vulgaris) and oilseed rape (Brassica napus). Eur. J. Agron. 2009, 30, 151–162. [Google Scholar] [CrossRef]
  68. Altikat, S.; Celik, A.; Gozubuyuk, Z. Effects of various no-till seeders and stubble conditions on sowing performance and seed emergence of common vetch. Soil Tillage Res. 2013, 126, 72–77. [Google Scholar] [CrossRef]
  69. Sadras, V.O.; Lawson, C.; Hooper, P.; McDonald, G.K. Contribution of summer rainfall and nitrogen to the yield and water use efficiency of wheat in Mediterranean_type environments of South Australia. Eur. J. Agron. 2012, 36, 41–54. [Google Scholar] [CrossRef]
  70. Fischer, R.A. Number of kernels in wheat crops and the influence of solar radiation and temperature. J. Agric. Sci. 1985, 105, 447–461. [Google Scholar] [CrossRef]
  71. McCaig, T.N.; Clarke, J.M. Breeding durum wheat in western Canada: Historical trends in yield and related variables. Can. J. Plant Sci. 1995, 75, 55–60. [Google Scholar] [CrossRef]
  72. McCaig, T.N.; DePauw, R.M. Breeding hard red spring wheat in western Canada: Historical trends in yield and related variables. Can. J. Plant Sci. 1995, 75, 387–393. [Google Scholar] [CrossRef]
  73. Setter, T.; Carlton, G. Germination vegetative reproductive growth. In The Wheat Book: Principles Practice; Anderson, W.K., Garlinge, J.R., Eds.; Department of Agriculture of Western Australia: Perth, Australia, 2000. [Google Scholar]
  74. Kirkegaard, J.A.; Lilley, J.M.; Howe, G.N.; Graham, J.M. Impact of subsoil water use on wheat yield. Aust. J. Agric. Res. 2007, 58, 303–315. [Google Scholar] [CrossRef]
  75. Passioura, J.B. Roots and drought resistance. Agric. Water Manag. 1983, 7, 265–280. [Google Scholar] [CrossRef]
  76. French, R.J.; Shultz, J.E. Water use efficiency of wheat in a Mediterranean-type environment. I. The relation between yield, water use and climate. Aust. J. Agric. Res. 1984, 35, 743–764. [Google Scholar] [CrossRef]
  77. Asseng, S.; Turner, N.C.; Keating, B.A. Analysis of water_and nitrogen-use efficiency of wheat in a Mediterranean climate. Plant Soil 2001, 233, 127–143. [Google Scholar] [CrossRef]
  78. Angus, J.F.; Nix, H.A.; Russell, J.S.; Kruizinga, J.E. Water use, growth and yield of wheat in a subtropical environment. Aust. J. Agric. Res. 1980, 31, 873–886. [Google Scholar] [CrossRef]
  79. Zhang, H.; Turner, N.; Poole, M.L. Water use of wheat, barley, canola, and lucerne in the high rainfall zone of south-western Australia. Aust. J. Agric. Res. 2005, 56, 743–752. [Google Scholar] [CrossRef]
  80. Oliver, Y.M.; Robertson, M.J.; Stone, P.J.; Whitbread, A.M. Improving estimates of water-limited yield of wheat by accounting for soil type and within-season rainfall. Crop Pasture Sci. 2009, 60, 1137–1146. [Google Scholar] [CrossRef]
Figure 1. Total soil water in the rooting zone (0–2.4 m) after the sowing of wheat at Shenton Park in 2010 under three residue-cut heights (0.10, 0.20, 0.30 m) combined with either (a) 4 t ha−1 or (b) nil horizontal residue. The arrows indicate the wheat jointing, anthesis, and harvest stages. Error bar shows the LSD (p < 0.05) for the residue height × amount × time interaction (only one residue amount is shown in each graph for clarity, the bare soil is the same data in the two figures).
Agronomy 15 01285 g001
Figure 2. Relationship between the total residue amount (sum of standing and horizontal residue) and total soil water (0–2.4 m) at Shenton Park, averaged over the growing season, illustrating the different residue cutting heights.
Agronomy 15 01285 g002
Figure 3. Effect of residue management at Shenton Park with the 4 t ha−1 horizontal residue with different cut heights (ac), and a 0.3 m cut-height with different amounts of horizontal residue (df) on the soil water distribution (mm of soil water in a 0.2 m depth increment) down the profile under wheat at seeding (a,d), anthesis (b,e), and harvest (c,f). Error bars show ±SE (n = 4).
Agronomy 15 01285 g003
Figure 4. Effect of crop sequence (CC = continuous cereal; FC = farmer control, where CC/S1 = oats/barley/barley/wheat, CC/S2 = barley/barley/oats/wheat, CC/S3 = barley/oats/barley/wheat, FC = wheat/barley/lupin/wheat) and row position (centre and outer positions, relative to harvester cutting front) of wheat grown at Cunderdin in 2010 on (a) total soil water (0–1.6 m) over time (DAS), and soil water in the profile (mm/200 mm) (b) at seeding and (c) at harvest. The arrows in (a) indicate the wheat jointing, anthesis, and harvest stages. Error bar in (a) shows the LSD (p < 0.05) for the crop sequence × row position × time interaction. Error bars in (b,c) show ±SE (n = 3).
Agronomy 15 01285 g004
Figure 5. Fraction of photosynthetically active radiation (PAR) intercepted (a,c) and reflected (b,d) in wheat grown at Shenton Park in 2010 under three residue-cut heights combined with 4 t ha−1 (a,b) and 0 t ha−1 (c,d) horizontal residue from 50 to 118 DAS. Error bar shows the LSD (p < 0.05) for the residue height × amount × time interaction (only one residue amount is shown in each graph for clarity, the bare soil was the same data in the two figures). Note that PAR was measured morning, afternoon, and evening, and the average daily is shown.
Agronomy 15 01285 g005
Figure 6. Green area index (a,c) and total dry matter (b,d) over time in wheat grown at Shenton Park in 2010 with 4 t ha−1 horizontal residue and three residue-cut heights (a,b), and a 0.3 m cut-height with different amounts of horizontal residue (c,d). Error bar shows the LSD (p < 0.05) for the residue height × amount × time interaction (only one residue amount with different heights or one height with different amounts is shown in each graph for clarity, the bare soil was the same data in the two related figures).
Agronomy 15 01285 g006
Figure 7. Effect of crop sequence (CC = continuous cereal; FC = farmer control, where CC/S1 = oats/barley/barley/wheat, CC/S2 = barley/barley/oats/wheat, CC/S3 = barley/oats/barley/wheat, FC = wheat/barley/lupin/wheat) and row position (centre, intermediate, and outer, relative to harvester cutting front) on the green area index (a) and root to shoot ratio (b) of wheat at 63 DAS at Cunderdin in 2010. Error bar shows the LSD (p < 0.05) for the crop sequence × row position interaction.
Agronomy 15 01285 g007
Figure 8. Effect of crop sequence (CC = continuous cereal; FC = farmer control, where CC/S1 = oats/barley/barley/wheat, CC/S2 = barley/barley/oats/wheat, CC/S3 = barley/oats/barley/wheat, FC = wheat/barley/lupin/wheat) and row position (centre, intermediate, and outer, relative to harvester cutting front) on (a) wheat dry matter at 63 DAS (leaf, stem and root) and (b) from sowing to 195 DAS (total DM) at Cunderdin in 2010. Error bar shows LSD (p < 0.05) for (a) the crop sequence × row position interaction and (b) crop sequence × row position × time interaction.
Agronomy 15 01285 g008
Table 1. Treatments used at the Cunderdin long-term NT systems experiment.
Rotation/Sequence 2007200820092010Comment
CC/S1OatBarleyBarleyWheatLow crop diversity (continuous cereal) with maximum residue retention
CC/S2BarleyBarleyOatWheat
CC/S3BarleyOatBarleyWheat
FCWheatBarleyLupinWheatCurrent farmer practice with low residue. Rotation of cereal/cereal/legume
Rotations being CC = continuous cereal, FC = farmer control.
Table 2. Average daily maximum and minimum temperatures at 0.05 m soil depth and air temperature 0.05 m above the soil surface in wheat grown under different stubble-cut heights and amounts of horizontal residue at Shenton Park in 2010.
ResidueSoil Temperature (°C)Air Temperature (°C)
StandingHorizontalMaximumMinimumMaximumMinimum
Bare soil25.8a 11.1f24.1d10.7a
0.1 m0 t ha−124.8a12.0e26.8c9.6b
0.2 m 24.5ab12.6d27.4c8.9b
0.3 m 23.5bc13.2c29.3b8.8b
0.1 m1 t ha−124.6a13.1cd26.7c9.4b
0.2 m 23.5bc13.2c28.7b8.3c
0.3 m 23.7b14.1b29.3b7.3de
0.1 m4 t ha−122.2cd13.3c29.0b8.8b
0.2 m 21.5d13.9b29.6b8.1cd
0.3 m 20.2e14.9a30.9a7.0e
LSD (p < 0.05) 1.350.571.230.91
Letters show significance at p ≤ 0.05. LSD is for the interaction term.
Table 3. Effect of standing stubble-cut height and amount of horizontal stubble on the wheat seed yield, water use efficiency (WUE), and harvest index (HI) at Shenton Park in 2010.
StubbleSeed Yield
(kg ha−1)
WUE
(kg ha−1 mm−1)
HI
StandingFlat
Bare soil3400b 7.8b0.38b
0.1 m0 t ha−13476b7.9b0.39b
0.2 m 3515b7.8b0.39b
0.3 m 3332b7.4b0.39b
0.1 m1 t ha−13334b7.6b0.41b
0.2 m 3424b7.7b0.40b
0.3 m 3990b8.9b0.40b
0.1 m4 t ha−13950b8.8b0.38b
0.2 m 4097b9.1b0.35b
0.3 m 5943a12.6a0.53a
LSD (p < 0.05) 1046.32.180.084
Letters show significance at p ≤ 0.05. LSD is for the interaction term.
Table 4. Effect of crop sequence and row position on the wheat yield components and water use efficiency at Cunderdin in 2010.
Wheat
Component
Crop SequenceRow PositionMean
Sequence
WindrowIntermediateOuter
Tillers m−2CC/S1 742b 687b590b673
CC/S21138a754b712b868
CC/S3720b672b630b674
FC804b698b666b723
Mean851703650735
Spikes m−2CC/S1244b206b198b216
CC/S2367a234b217b273
CC/S3274b266b216b252
FC243b228b211b227
Mean282234211242
Spikelets per spikeCC/S119.3b18.5b17.9b18.6
CC/S237.7a19.7b18.1b25.2
CC/S319.7b15.7c14.7c16.7
FC22.5b18.6b17.2bc19.4
Mean24.818.117.020.0
Seed yield
(kg ha−1)
CC/S1528b430b370c439
CC/S2850a424b408b561
CC/S3519b429b422b457
FC522b444b398bc455
Mean605432400479
Water use efficiency
(kg ha−1 mm−1)
CC/S14.5b3.7b3.2b3.8
CC/S27.0a3.6b3.5b4.7
CC/S34.4b3.7b3.6b3.9
FC4.4b3.8b3.4b3.9
Mean5.13.73.44.1
Crops in the rotation (2007–2010) with CC = continuous cereal: S1—oats/barley/barley/wheat; S2—barley/barley/oats/wheat; S3—barley/oats/barley/wheat; FC = farmer control: wheat/barley/lupin/wheat. Letters show significance at p ≤ 0.05 for comparison across rows (within sequences) and columns (within positions).
Disclaimer/Publisher’s Note: The statements, opinions and data contained in all publications are solely those of the individual author(s) and contributor(s) and not of MDPI and/or the editor(s). MDPI and/or the editor(s) disclaim responsibility for any injury to people or property resulting from any ideas, methods, instructions or products referred to in the content.

