Article

Enhancing Dense-Scene Millet Appearance Quality Inspection Based on YOLO11s with Overlap-Partitioning Strategy for Procurement

by
Leilei He
1,
Ruiyang Wei
1,
Yusong Ding
1,
Juncai Huang
1,
Xin Wei
1,
Rui Li
1,
Shaojin Wang
1,2,* and
Longsheng Fu
1,3,4,5,*
1
College of Mechanical and Electronic Engineering, Northwest A&F University, Yangling 712100, China
2
Department of Biological Systems Engineering, Washington State University, 213 L.J. Smith Hall, Pullman, WA 99164-6120, USA
3
Key Laboratory of Agricultural Internet of Things, Ministry of Agriculture and Rural Affairs, Yangling 712100, China
4
Shaanxi Key Laboratory of Agricultural Information Perception and Intelligent Service, Yangling 712100, China
5
Northwest A&F University Shenzhen Research Institute, Shenzhen 518000, China
*
Authors to whom correspondence should be addressed.
Agronomy 2025, 15(6), 1284; https://doi.org/10.3390/agronomy15061284
Submission received: 21 April 2025 / Revised: 18 May 2025 / Accepted: 22 May 2025 / Published: 23 May 2025

Abstract

Accurate millet appearance quality assessment is critical for fair procurement pricing. Traditional manual inspection is time-consuming and subjective, necessitating an automated solution. This study proposes a machine-vision-based approach using deep learning for dense-scene millet detection and quality evaluation. High-resolution images of standardized millet samples were collected via smartphone and annotated into seven categories covering impurities, high-quality grains, and various defects. To address the challenges with small object detection and feature loss, the YOLO11s model with an overlap-partitioning strategy were introduced, dividing the high-resolution images into smaller patches for improved object representation. The experimental results show that the optimized model achieved a mean average precision (mAP) of 94.8%, significantly outperforming traditional whole-image detection with a mAP of 15.9%. The optimized model was deployed in a custom-developed mobile application, enabling low-cost, real-time millet inspection directly on smartphones. It can process full-resolution images (4608 × 3456 pixels) containing over 5000 kernels within 6.8 s. This work provides a practical solution for on-site quality evaluation in procurement and contributes to real-time agricultural inspection systems.

1. Introduction

Millet, as a representative coarse grain, plays an increasingly important role in ensuring food security and promoting dietary diversity. Originating in China, millet is valued for its high adaptability, short growth cycle, low cultivation requirements, and long shelf life, making it a crucial staple in many resource-constrained areas [1]. With the rising production and consumption, millet has evolved from a subsistence crop to a commercially traded and strategically reserved grain [2]. Its market value is closely related to its external appearance quality, which influences the pricing, processing efficiency, and consumer acceptance [3]. Therefore, reliable appearance-based quality assessment is essential for standardizing trade, informing storage and pricing in the grain supply chain [4,5].
For a long time, millet appearance quality inspection (MAQI) has been mainly performed by experienced inspectors through visual assessment of the kernel color, shape, and impurity content. The process is mainly performed by manually extracting a fixed volume of laboratory samples from larger batches using sampling probes (as shown in Figure 1), with each sample containing approximately 5000 kernels and weighing around 20 g. Due to the small kernel size and high particle density, this task is time-consuming, requiring over 120 min even for highly experienced personnel. Moreover, manual inspection is inherently subjective and vulnerable to inconsistencies caused by fatigue or experience differences [6], which can result in inconsistent evaluations and disputes over pricing between producers and buyers [7]. In this case, there is an urgent need for an efficient and cost-effective automated inspection system capable of performing accurate and consistent millet appearance quality assessments.
Machine vision technology has been widely adopted for the detection and quality assessment of cereal crops in numerous studies. Wan et al. (2002) [8] identified and classified rice grain quality by extracting the shape contours and color features from images, achieving a defect detection accuracy of 90.60%. Kaur and Singh (2013) [9] used a scanner to capture 20 rice grains per scan and employed the support vector machine (SVM) to classify them into head rice, broken rice, and brewers, reaching an accuracy of over 86.00%. Chen et al. (2012) [10] extracted the features of the area, perimeter, and surface roughness from single rice grains and used LSSVM to classify them, achieving 99.67% accuracy in distinguishing broken from milled rice. More recently, Harini et al. (2023) [11] developed an SVM model based on the width, height, aspect ratio, and contrast to predict the percentage of broken kernels in images containing around 40 rice grains, which obtained an accuracy of 98.00%. Although these approaches demonstrate high accuracy in terms of defect identification in rice grains, the effectiveness of impurity detection in millet samples is unclear. Furthermore, since a standard millet sample contains approximately 5000 kernels, these methods are not well suited for rapid, large-scale appearance quality inspection of millet.
As a powerful support for artificial intelligence (AI), deep learning is gaining popularity in agricultural product inspection and has achieved remarkable performance. Kundu et al. (2021) [12] applied YOLOv5 for the classification and quality assessment of pearl millet and maize mixed seeds, which obtained an average precision (AP) of 98.3%. Zhao et al. (2022) [13] utilized an improved YOLOv5 with a hybrid attention module for wheat quality detection, which achieved a mAP of 97.42% for germinated, flared, moldy, and normal wheat kernels. Fan et al. (2022) [14] proposed an improved YOLOv4 model that integrated with red–green–blue (RGB) and near-infrared (NIR) images as input to detect the appearance quality of corn seeds, which showed a mAP of 98.02% for qualified and defective kernels. Wonggasem et al. (2024) [15] developed an automated quality inspection system for baby corn to sort out unqualified kernels, achieving an accuracy of 99.1% using EfficientNetB5 in a single image with one object. Li et al. (2024) [16] proposed an improved YOLOv5s model to identify broken Hongshan buckwheat seeds, which achieved a detection precision of 99.7% with an average of six seeds per image. While deep learning technologies have demonstrated impressive accuracy and efficiency in grain particle detection and various agricultural applications [17,18], the practical deployment of most existing systems remains limited due to their dependence on specific hardware platforms and the need for high-performance computational resources [19,20].
With increasing computational capabilities, smartphones have become a practical platform for implementing deep learning-based detection and classification tasks. Andrianto et al. (2020) [21] developed an application (App) on smartphones for rice plant disease detection, which uploaded images to a remote cloud computer and achieved a detection accuracy value of 60.00% via the Visual Geometry Group with 16 layers (VGG16). Zhou et al. (2020) [22] proposed a low-cost yield estimation method for kiwifruit, which achieved a true detection rate of 90.80% on smartphones using a quantized and locally deployed MobileNetV2 model. Suharjito et al. (2023) [23] utilized a smartphone for the evaluation of the ripeness degree of oil palm fruit, which achieved a mAP of 99.89% on six set ripeness levels via a quantized YOLOv4 model. Despite the portability in terms of on-site objects detection that has been achieved on smartphones [5,24,25], performance strains occur in dense-scene scenarios with limited processing power, particularly for MAQI, where a sample of one image contains over 5000 kernels with a small pixel ratio.
In this study, a portable system for MAQI was developed for procurement applications. The advanced You Only Look Once version 11 small (YOLO11s) model was trained and quantized, enabling on-site millet detection on Android smartphones. To mitigate the performance loss caused by dense-scene millet samples, an overlap-partitioning strategy (OPS) was employed to increase the pixel ratio of millet kernels during both model training and testing. After processing, the inspection results were obtained by reassembling the individual patch detections of kernels. This study not only enhanced the overall detection accuracy but also enabled the MAQI task to be performed quickly and reliably by a portable device, making it a viable solution for efficient millet quality evaluation in procurement settings. The remaining sections of this article are organized as follows. Section 2 describes the materials and methods, including the dataset collection, detection framework, and OPS process. Section 3 discusses the experimental results, comparisons, and improvement studies. Section 4 concludes this paper and outlines future research directions.

2. Materials and Methods

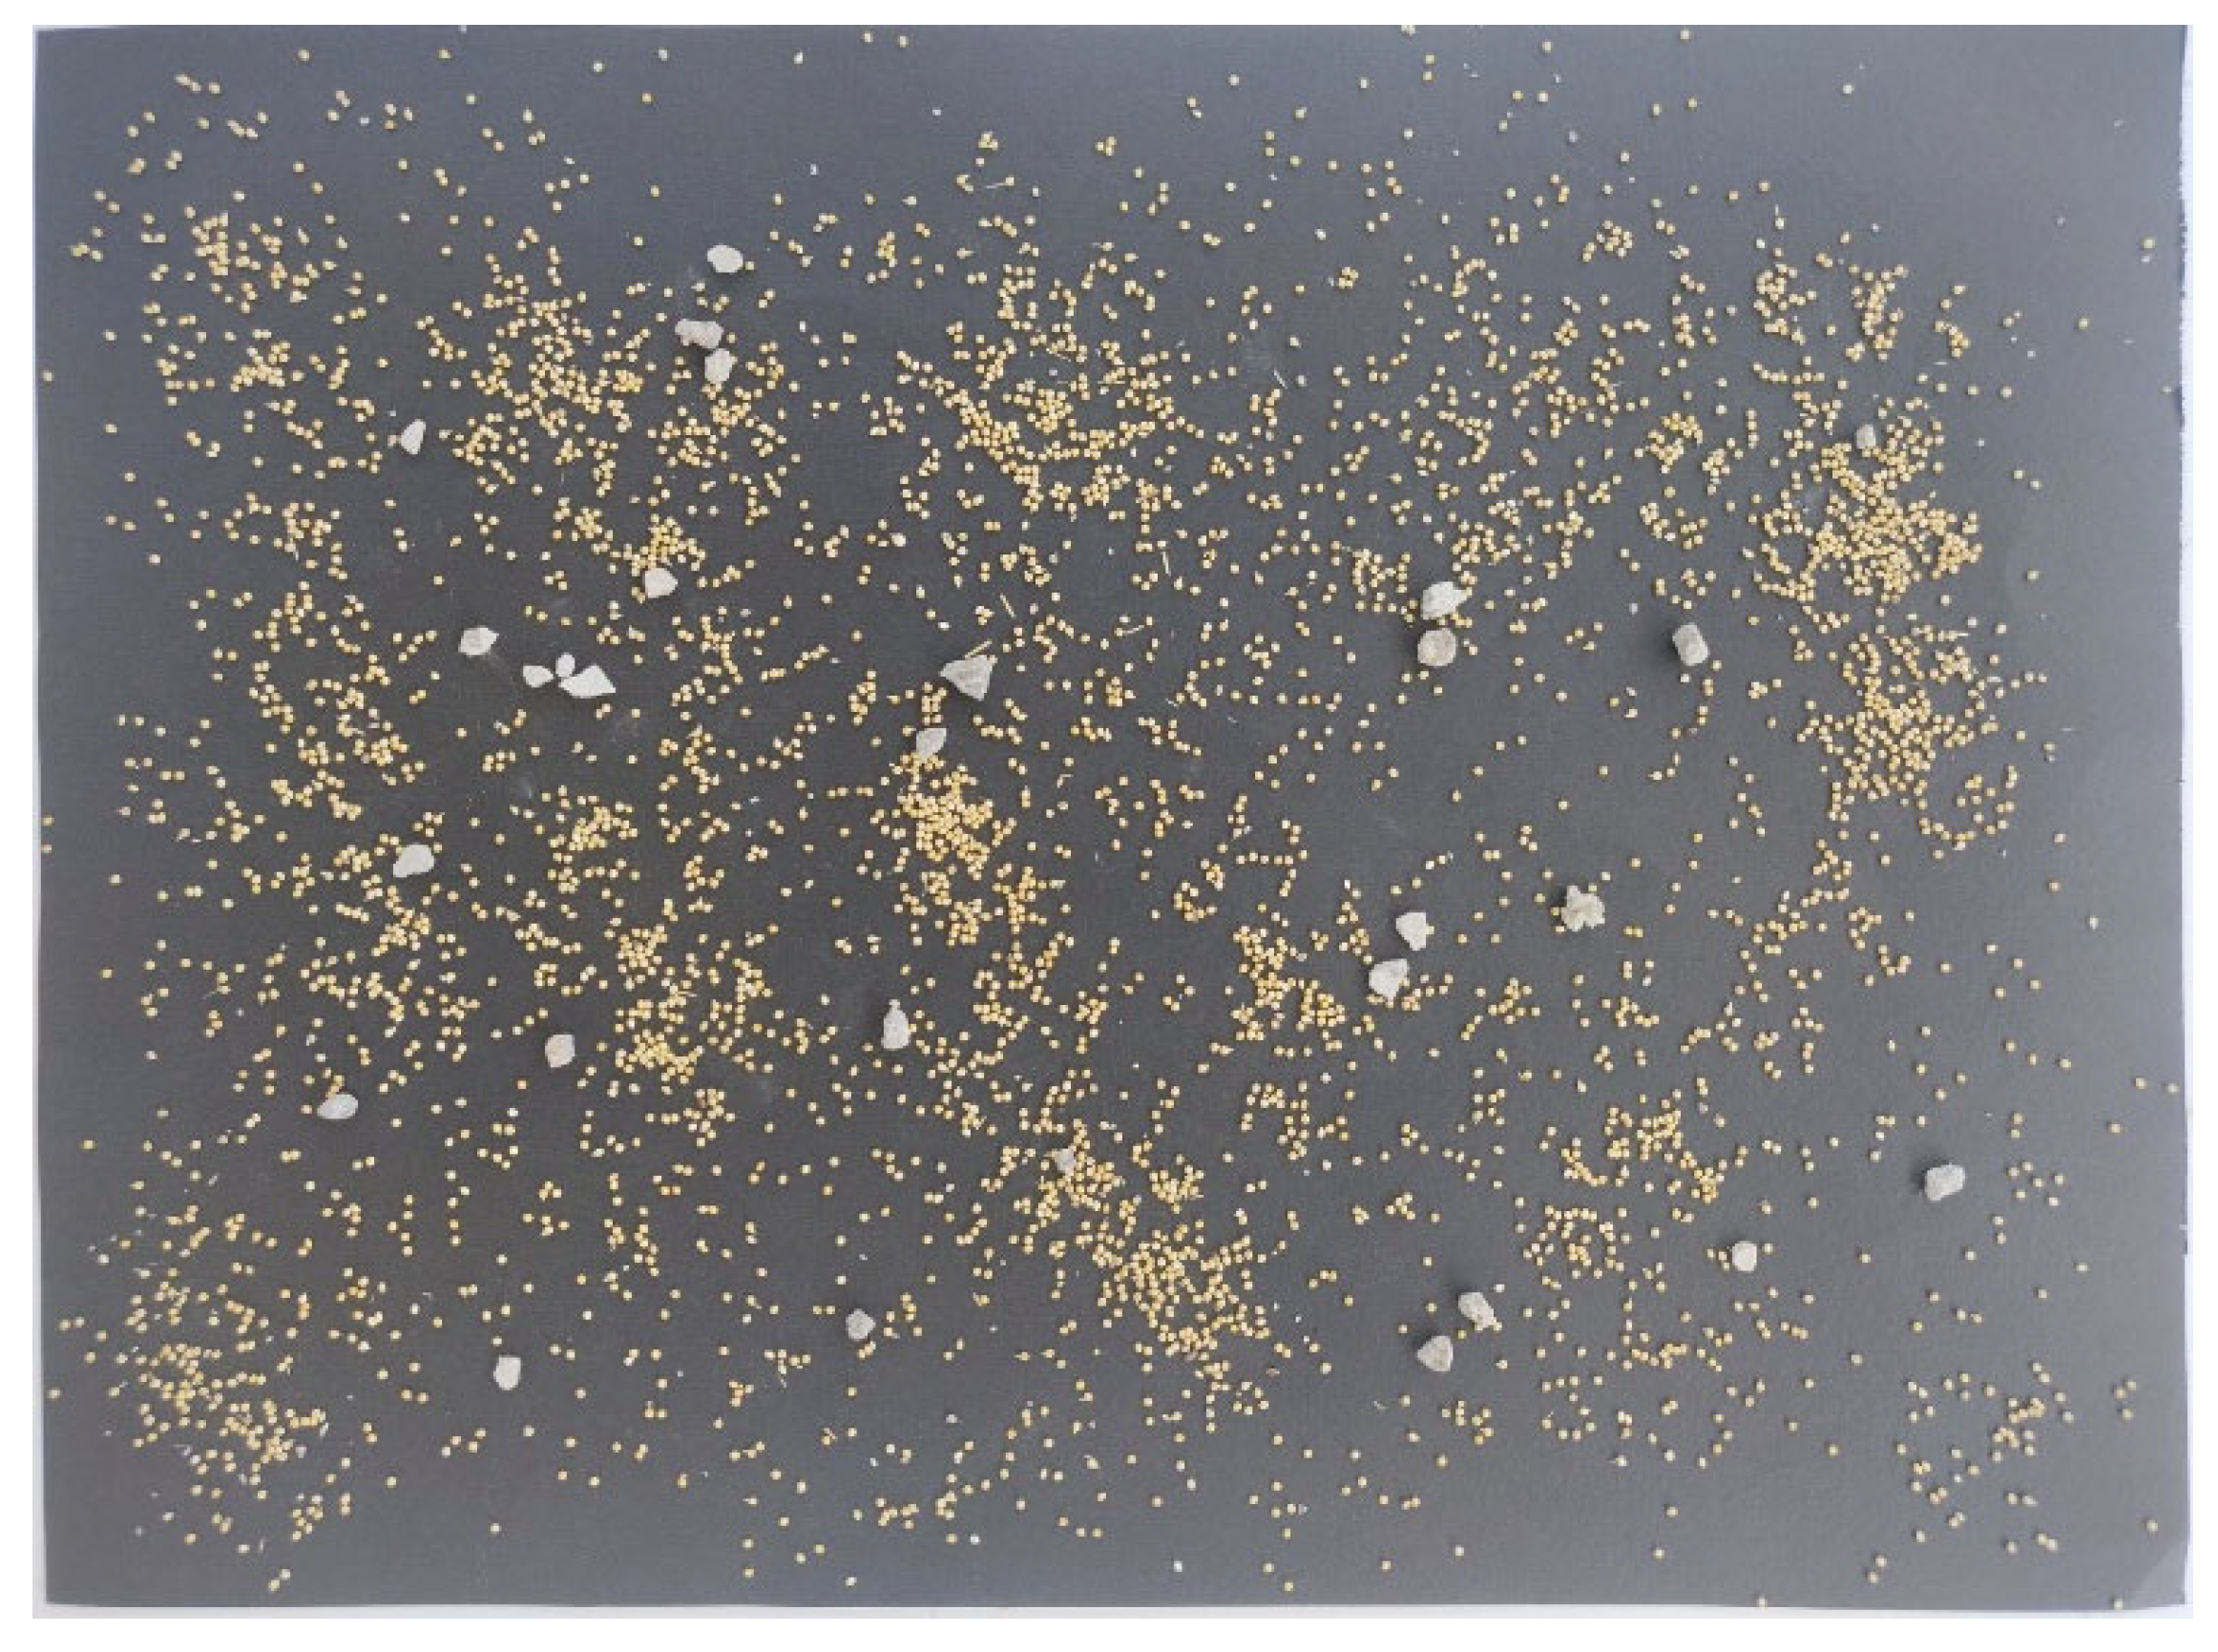
2.1. Image Acquisition

The image acquisition followed established sampling principles to ensure that the collected data could accurately reflect the actual operate scenarios of millet inspection. All the millet used in this study was acquired from Mizhi County, Shaanxi Province, which had not been evaluated and sorted for procurement. The millet was carefully sampled using a long cylindrical probe, which was inserted into a heap of millet to collect the necessary amount for each sample. Each sample consisted of approximately 20 g of millet, which corresponds to about 5000 kernels, with a uniform size of approximately 2 mm in length, width, and height. For the image acquisition, the sampled millet kernels were randomly arranged on a black background board measuring 50 cm in length and 37.5 cm in width, ensuring that there was no overlap between the millet kernels as much as possible. A smartphone (OnePlus 6, OnePlus Inc., Shenzhen, China) was utilized as the image acquisition equipment, which was mounted on a selfie stick and positioned perpendicular to the center of the board at a distance of approximately 60 cm. All the millet images were captured inside the barn to match the actual usage scenarios and ensure that the lighting conditions was controlled and consistent, while the field of view was adjusted to ensure that each image could capture the entire background plate. After independent sampling, a total of 60 high-resolution images were collected with a resolution of 4608 × 3456 pixels, allowing for detailed visual inspection and analysis of the millet kernels, as shown in Figure 2. The original and augmented images datasets are available at https://github.com/fu3lab/Millet_image (accessed on 18 May 2025).
Across a different property of the kernels, a multi-class annotation approach was employed to distinguish different objects in the sampled millet. Since the millet used in this study had not been sorted or processed for storage, it naturally contained various impurities. All the objects were initially divided into two main groups of millet kernels and impurities. Specifically, according to the morphological and color characteristics, the millet kernels were further divided into four categories of semi-mature kernels, mature kernels, shriveled kernels, and moldy kernels, respectively. Conversely, the impurities were divided into three categories of stem, stone, and chaff, and representative examples of all the categories are shown in Figure 3. For the sampled millet under evaluation, a lower proportion of impurities combined with a higher proportion of semi-mature kernels and mature kernels is indicative of superior overall quality and corresponds to a higher procurement price.
Each object in the images was annotated with a rectangular bounding box tangent to its contour by experienced operators. Among all of the kernel categories, semi-mature, mature, and moldy kernels all exhibit an elliptical shape but differ in color, presenting white, yellow, and brown, respectively. Shriveled grains, which are generally white or yellow, have a rugby ball shape that is narrower than the elliptical kernels and often appear with linear cracks on their surfaces. For the impurities, the categories of stone and stem are presented by distinguishable features according to their specific colors and shapes compared to millet kernels, while the chaff is translucent and lacks a consistent geometric structure, requiring careful identification. To facilitate efficient annotation and use by operators, the labels were named using Chinese pinyin, corresponding to their respective categories. The label definitions and associated visual features are presented in Table 1.

2.2. Data Augmentation

After annotation, an augmentation process was employed to mitigate overfitting and ensure that the model could generalize well to unseen data. Deep learning training requires a large and diverse set of images to prevent overfitting and ensure model convergence. The 60 captured images were split into a training set (48 images) and a validation set (12 images) with a ratio of 8:2. To further improve the generalization of the image data and simulate real-world variations, a series of data augmentation approaches were applied to the training dataset, including geometric transformation, sharpening, and blurring. Specifically, the training set was rotated by 90°, 180°, and 270° to introduce different orientations. Additionally, horizontal and vertical mirroring were performed, where horizontal mirroring reflected the image along its vertical axis and vertical mirroring reflected the image along its horizontal axis. In addition to the geometric transformations, Gaussian blur, motion blur and sharpening were introduced to simulate various noises and image defocus caused by possible jitters in the smartphone imaging process. As millet inspection is typically performed under stable illumination in controlled environments such as storage or inspection facilities, color-based augmentations were deliberately excluded to preserve the semantic integrity of the color features essential for accurate classification. After augmentation, the original training set was increased by a factor of nine, from 48 images to 432 images. The expended images of the training set and original validation set were collected as an augmented set, which provides the possibility of improving the model generalization ability on a much larger set of diverse examples.

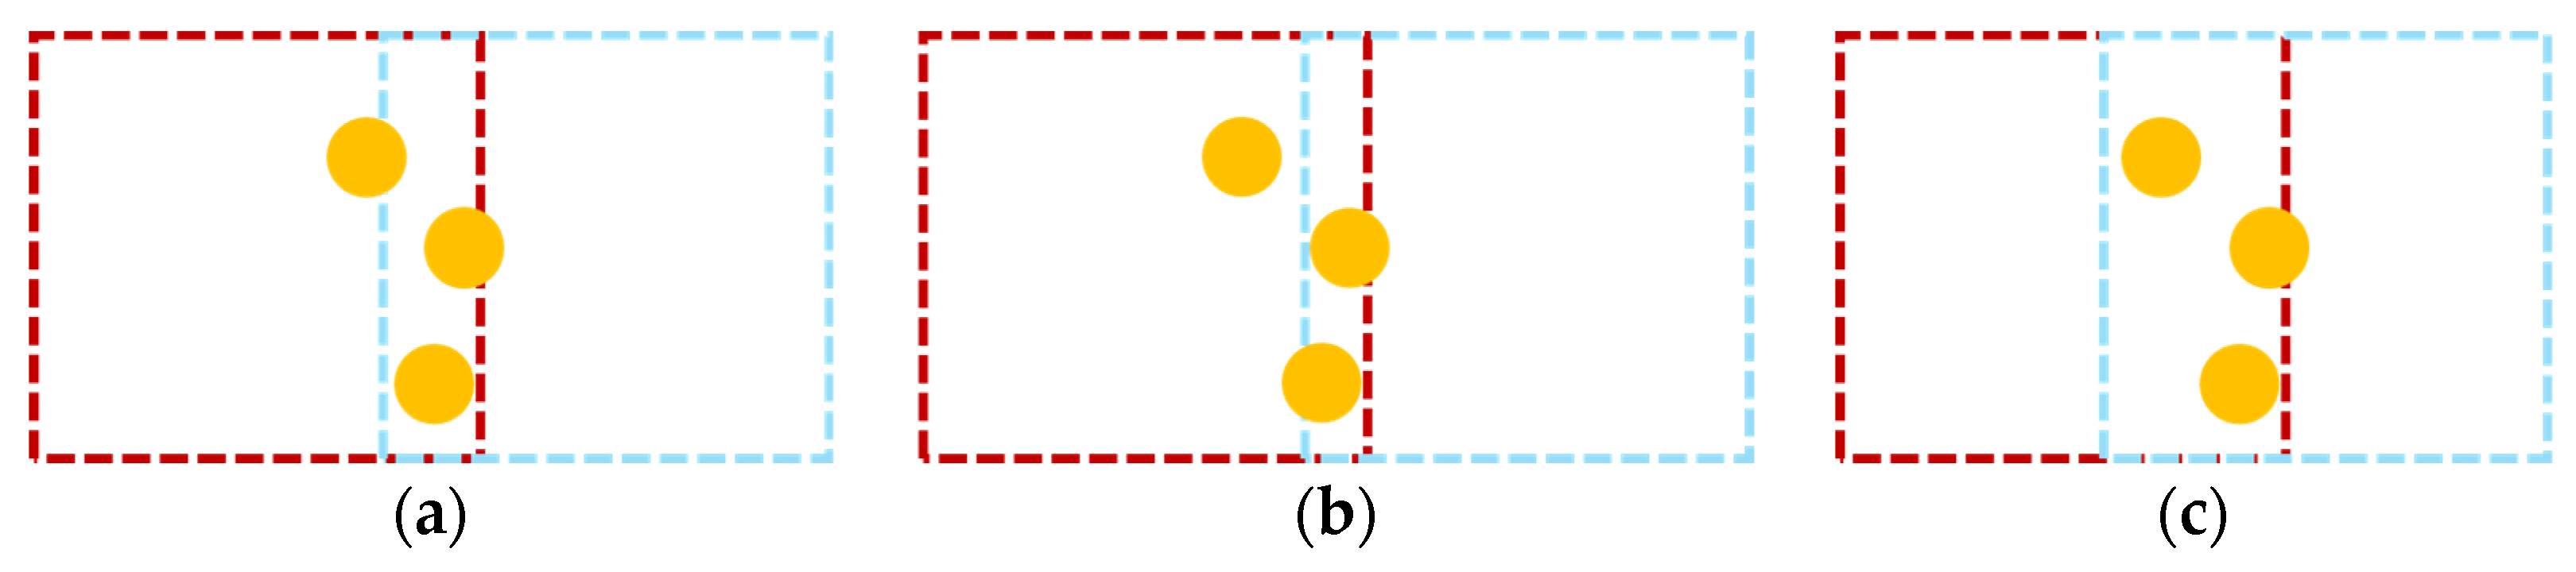
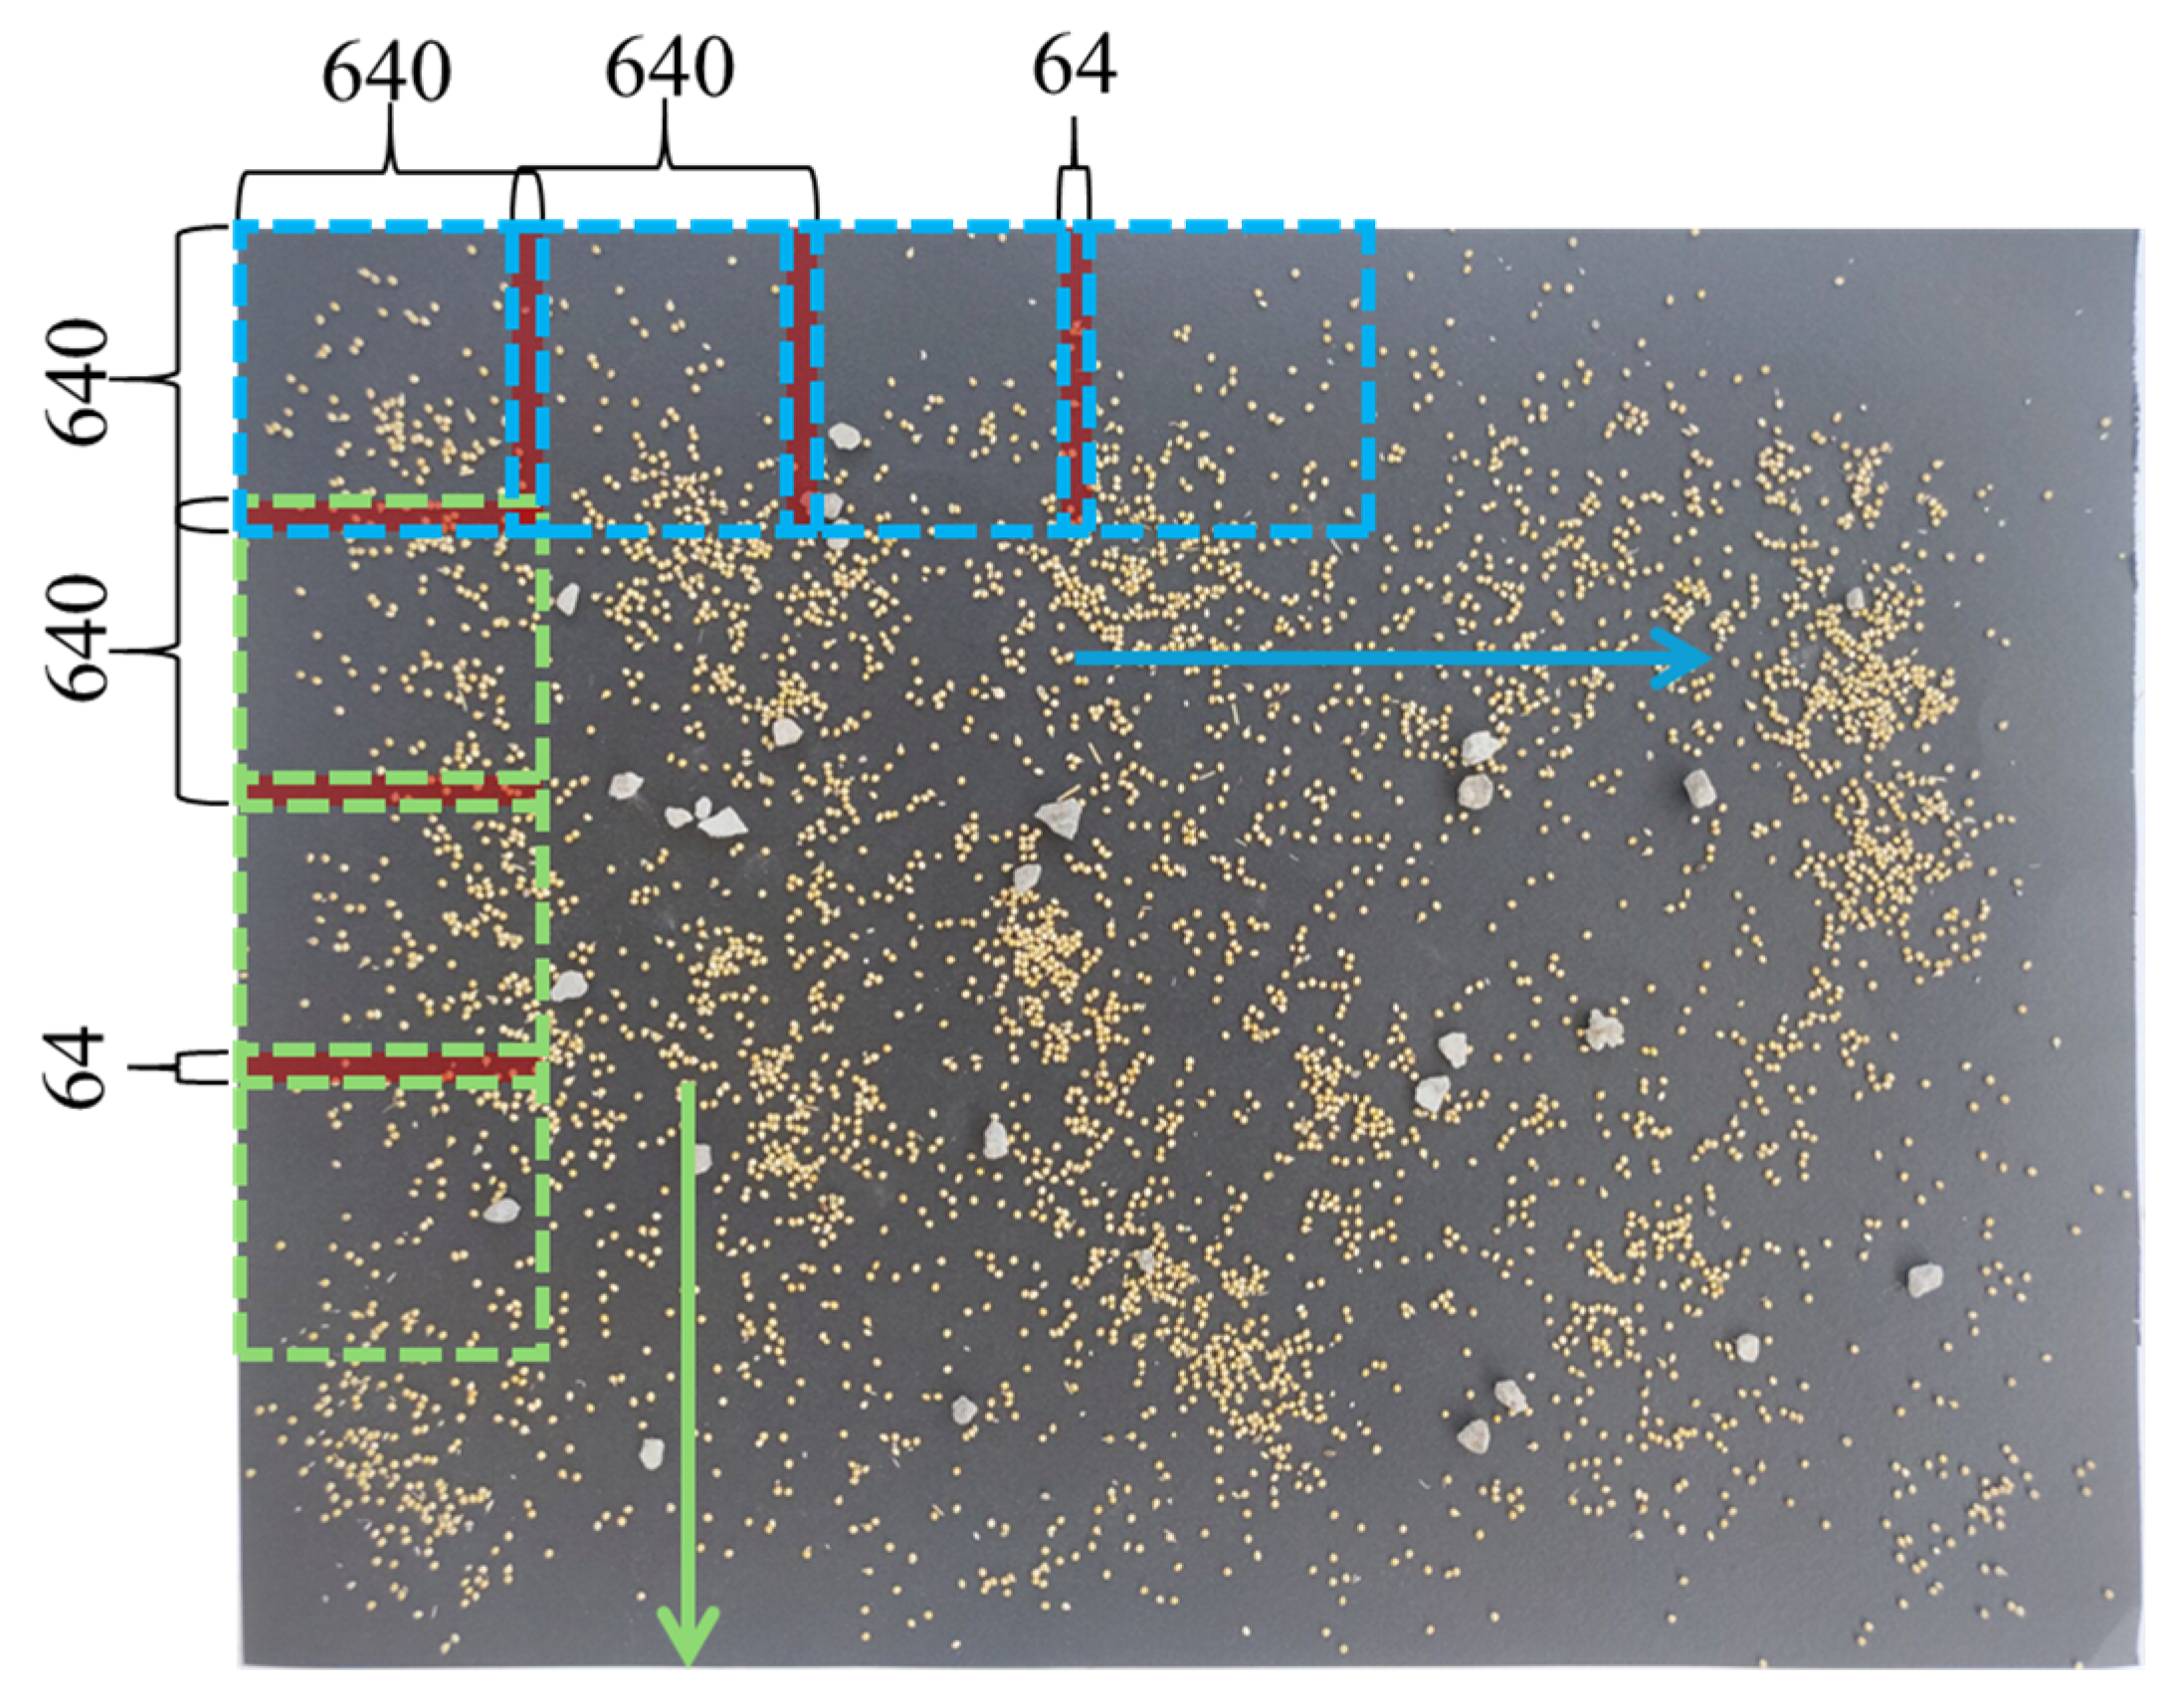
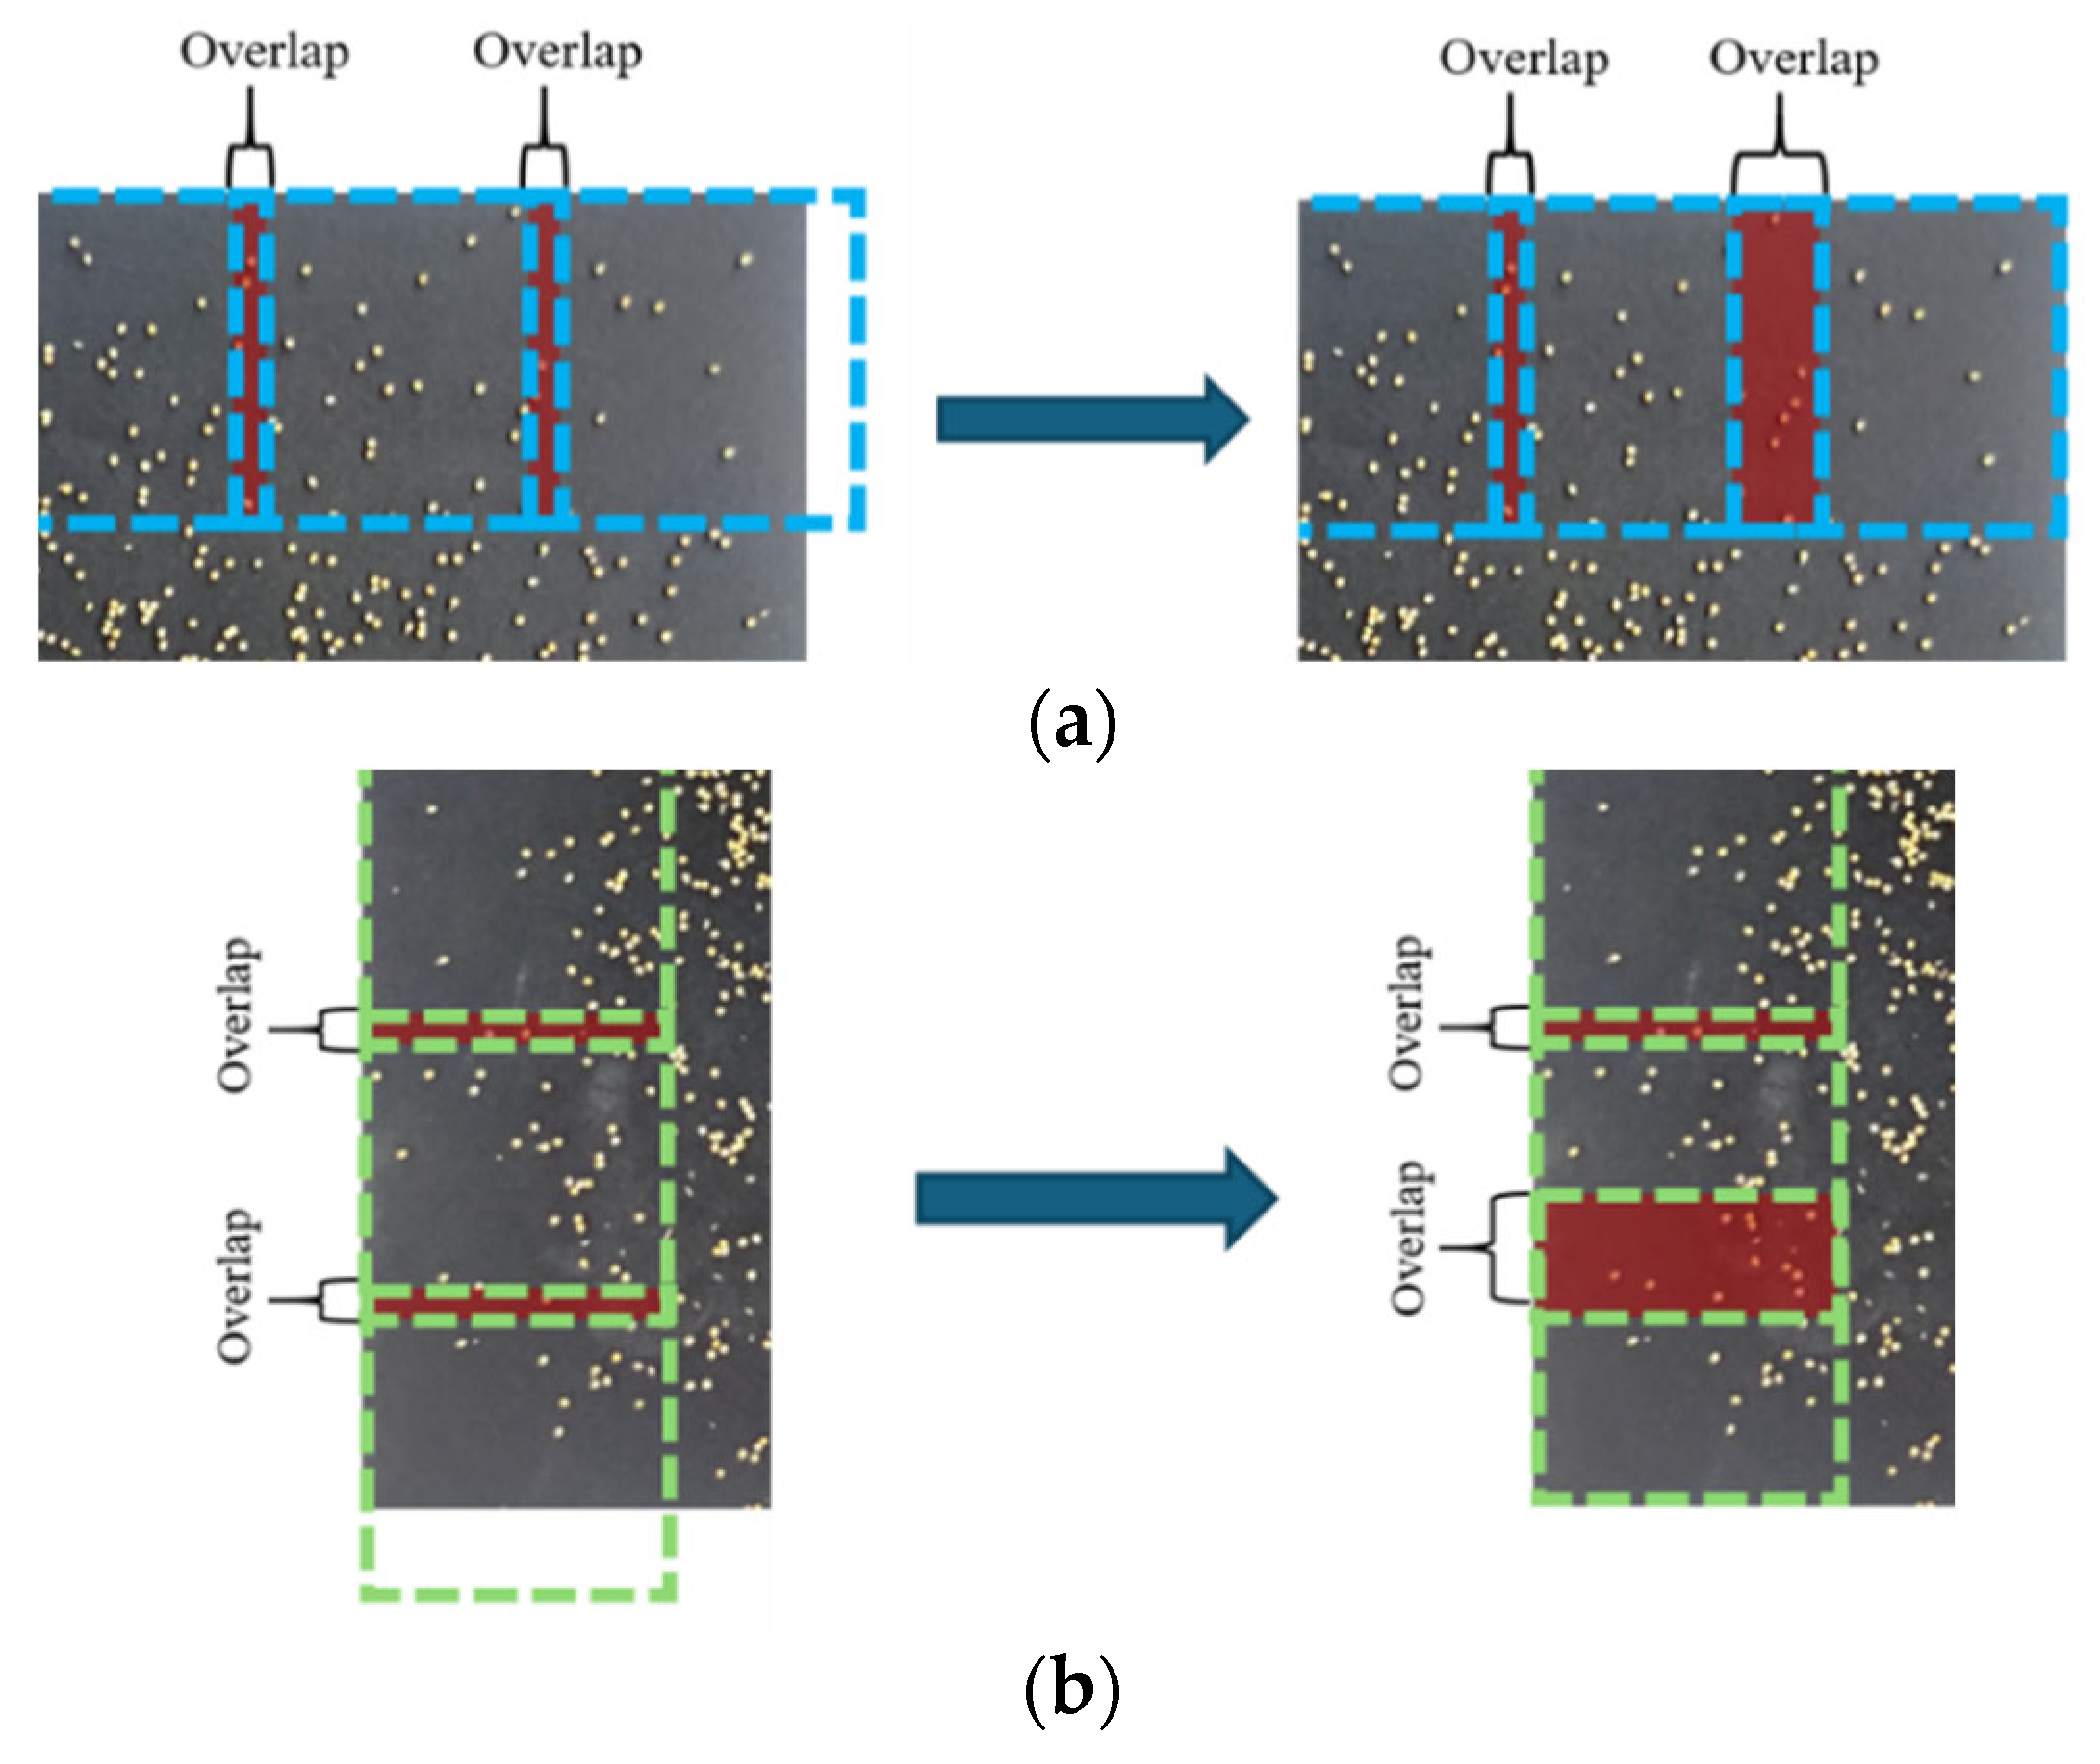
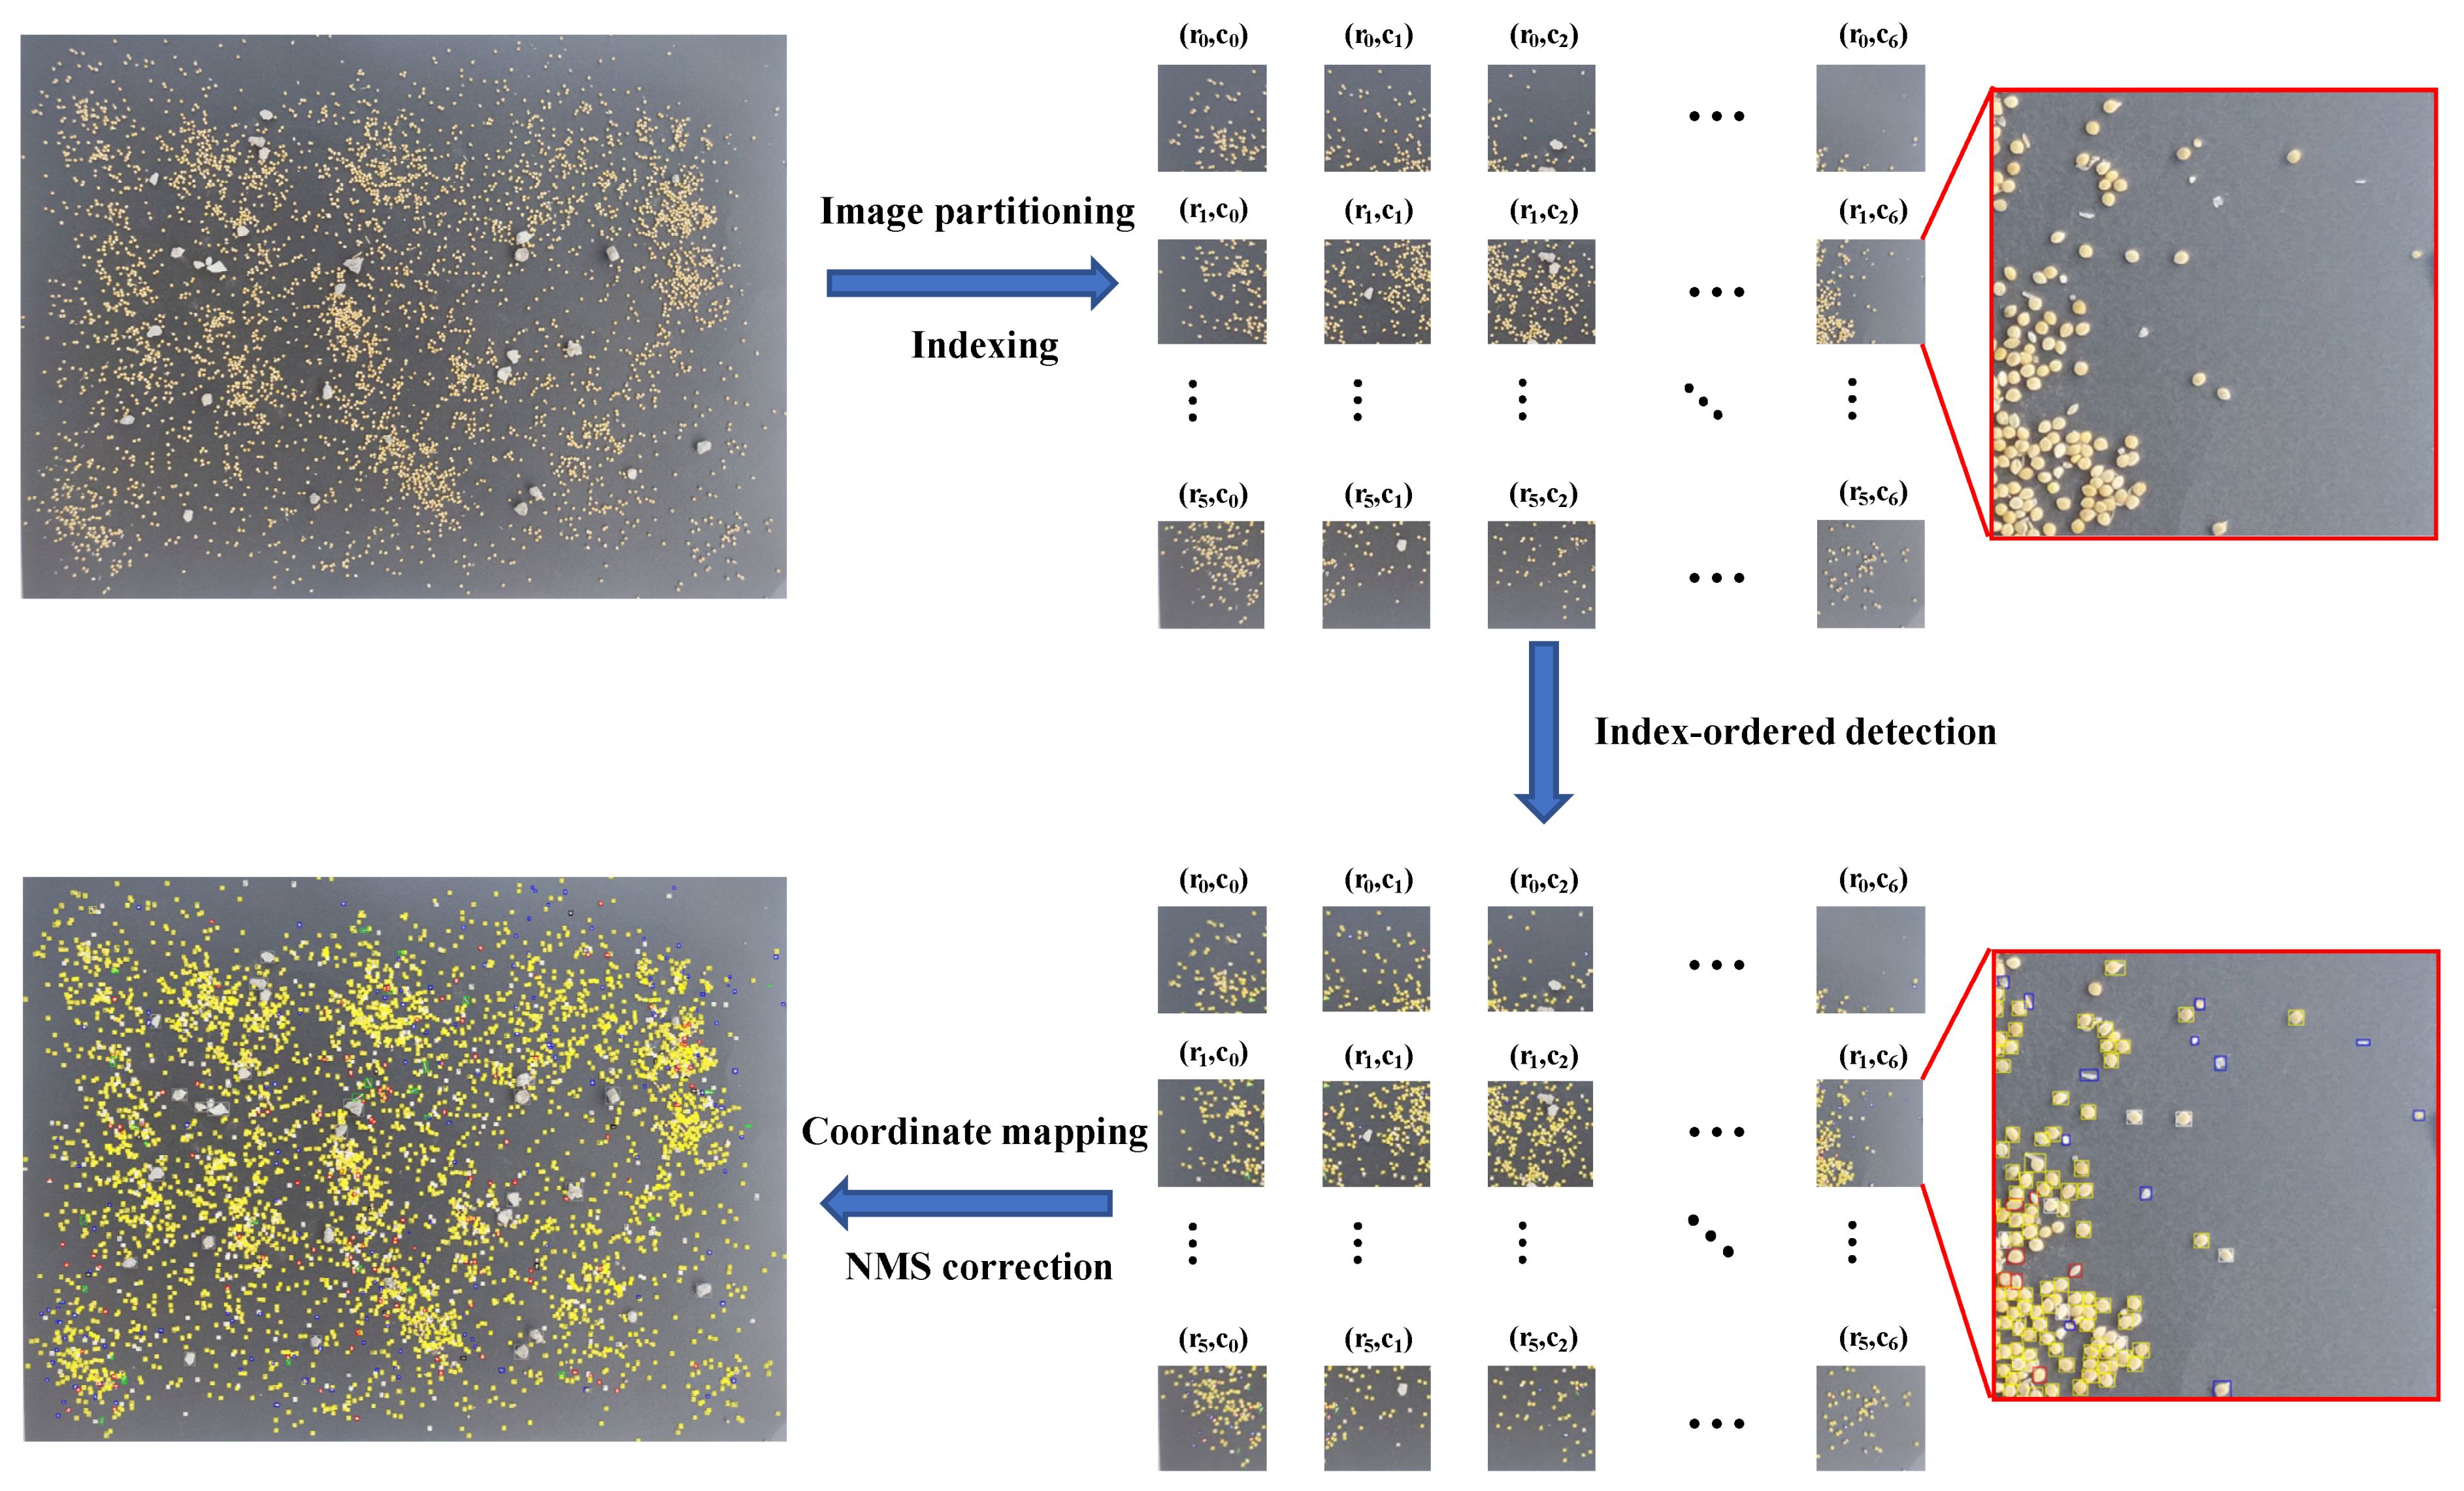
2.3. Overlap-Partitioning Strategy

High-resolution images are commonly resized during model training to match the predefined input dimensions required by deep learning networks. However, this resizing process would lead to significant challenges, particularly in dense-scene scenarios where the objects occupy only a small portion of the image. In these cases, resizing exacerbates the loss of critical details, which negatively impacts the detection accuracy [26,27]. For this study, the original images were captured with a resolution of 4608 × 3456 pixels with contained millet grains of approximately 20 × 30 pixels. During training, these images were resized to the default input size of 640 × 640 pixels, reducing the size of each millet kernel to just 3 × 4 pixels. The appearance comparison of the kernels before and after resizing is illustrated in Figure 4, which highlights the loss of fine details that could compromise the detection performance.
To balance the preservation of essential object details with the input requirements of the model, the OPS was proposed to mitigate the loss of important features during image resizing. The principle of the OPS is to use a fixed-size block that slides across the image with a certain overlap, partitioning the input image into multiple small patches. For this study, the size of the patches was set to 640 × 640 pixels to match the input size required by the object detection network. Considering the incomplete object at the edge of a single partitioned patch, the overlap rate was determined according to the pixel size of the largest objects to ensure the integrity of a single object in all the patches. A successful case of partitioned overlapping patches is show in Figure 5a, where the orange circular represents the object in the original image, while the red and cyan boxes represent the adjacent patches. The inappropriate overlap rate setting examples are shown in Figure 5b,c, where a small overlap rate causes the object to be incomplete across adjacent patches, while a large overlap rate retains the full object but increases the number of patches, thereby elevating the computational cost of a single detection task.
In order to ensure that all the objects could fully retained during the OPS processing, the overlap rate had to be determined based on the size of the largest object in the original image. Experimental statistics indicate that the pixel size of the largest object in the images was 60 pixels. Therefore, the overlap rate was set to 10% in the adapted OPS, which corresponds to an overlap width of 64 pixels. A schematic illustration of the OPS process is presented in Figure 6, where the blue boxes represent horizontally partitioned patches, the green boxes denote vertically partitioned patches, and the red areas highlight the overlapping regions.
Due to the dimensions of the original image, which cannot perfectly divide into equal patches, the last partitioned patches did not fully cover the image area. Specifically, the horizontal size (4068 pixels) and vertical size (3456 pixels) of the original image did not allow for an even division, leading to the final partitioned patches extending beyond the image boundaries. Therefore, the OPS process adjusted the latest patch to fit within the image boundary, ensuring that the entire image was covered, as shown in Figure 7. This ensured all the patches retained meaningful visual content and maintained consistency in terms of the data distribution, supporting stable and accurate model performance. Following the OPS, each image in the augmented set was divided into 42 partitioned patches, resulting in a total of 18,144 images for the training set and 504 images for the validation set, collectively referred to as the patches set.

2.4. Millet Detection Based on Deep Learning

2.4.1. YOLO11 Model

The advanced YOLO11 model represents a significant progression in object detection, offering substantial improvements in speed, accuracy, and adaptability, and it was adopted for millet detection in this study. The architecture of YOLO11 comprises the three primary components of the Backbone, the Neck, and the Head. In the Backbone, the model employs CSPDarknet, a pre-trained convolutional neural network, to efficiently extract image features. Utilizing pre-trained weights not only reduces the computational costs and accelerates the training but also enhances the model’s ability to transfer knowledge, enabling rapid adaptation to new tasks through fine-tuning. This strategy also mitigates the risk of overfitting, particularly when working with small datasets. The Neck incorporates an enhanced PANet structure, facilitating feature fusion across multiple scales for effective multi-scale object recognition. PANet enhances the information flow through the horizontal connections, allowing higher-level features to better utilize the detailed information from lower layers. Lastly, the Head is responsible for predicting the object classes and bounding boxes using a multi-branch prediction structure, enabling efficient handling of multi-scale detection tasks. Additionally, the inclusion of two depthwise separable convolutions (DWConvs) in the classification branch of the decoupled head reduces the parameter count and computational complexity without sacrificing the detection performance. Considering the speed and accuracy, the YOLO11 small (YOLO11s) version was selected for millet detection in this study [28].

2.4.2. Network Training

Two models were trained for millet detection based on YOLO11s, with the difference lying in the datasets adopted with the augmented set or patches set. The training was performed on a desktop computer equipped with an AMD Ryzen 7 5800X CPU, 64 GB of RAM, and an NVIDIA GTX 3080Ti GPU with 12 GB of memory, running on a 64-bit Windows 10 system. The software environment included CUDA 11.3, CUDNN 8.2, Python 3.8, PyTorch 2.2, and Microsoft Visual Studio 14.0. The initial learning rate was set to 0.01 and decayed by 0.0005 after each epoch. A batch size of 32 and input size of 640 × 640 pixels were set, with a total of 1000 training iterations and early stopping epochs of 100. The two models were trained on the pre-trained weights of YOLO11s from the Common Objects in Context (COCO) dataset to reduce the training time. Finally, the model trained on the augmented set was referred as the OPS Detection Model (OPSDM), while the model trained on the augmented dataset was referred as the High-Resolution Detection Model (HRDM).

2.5. Design for Android Platform

2.5.1. NCNN Framework

To facilitate efficient deployment of deep learning models on mobile devices, NCNN, a high-performance inference framework was developed by Tencent YouTu Lab (https://github.com/Tencent/ncnn, accessed on 2 December 2024), as utilized in this study. The OPSDM model was converted to the NCNN format for deployment on Android smartphones. This conversion involved simplifying and optimizing the model through the Open Neural Network Exchange (ONNX) format, an open-source framework developed by Facebook and Microsoft. ONNX enhances the interoperability across different deep learning platforms, ensuring its compatibility and efficient performance on mobile devices.

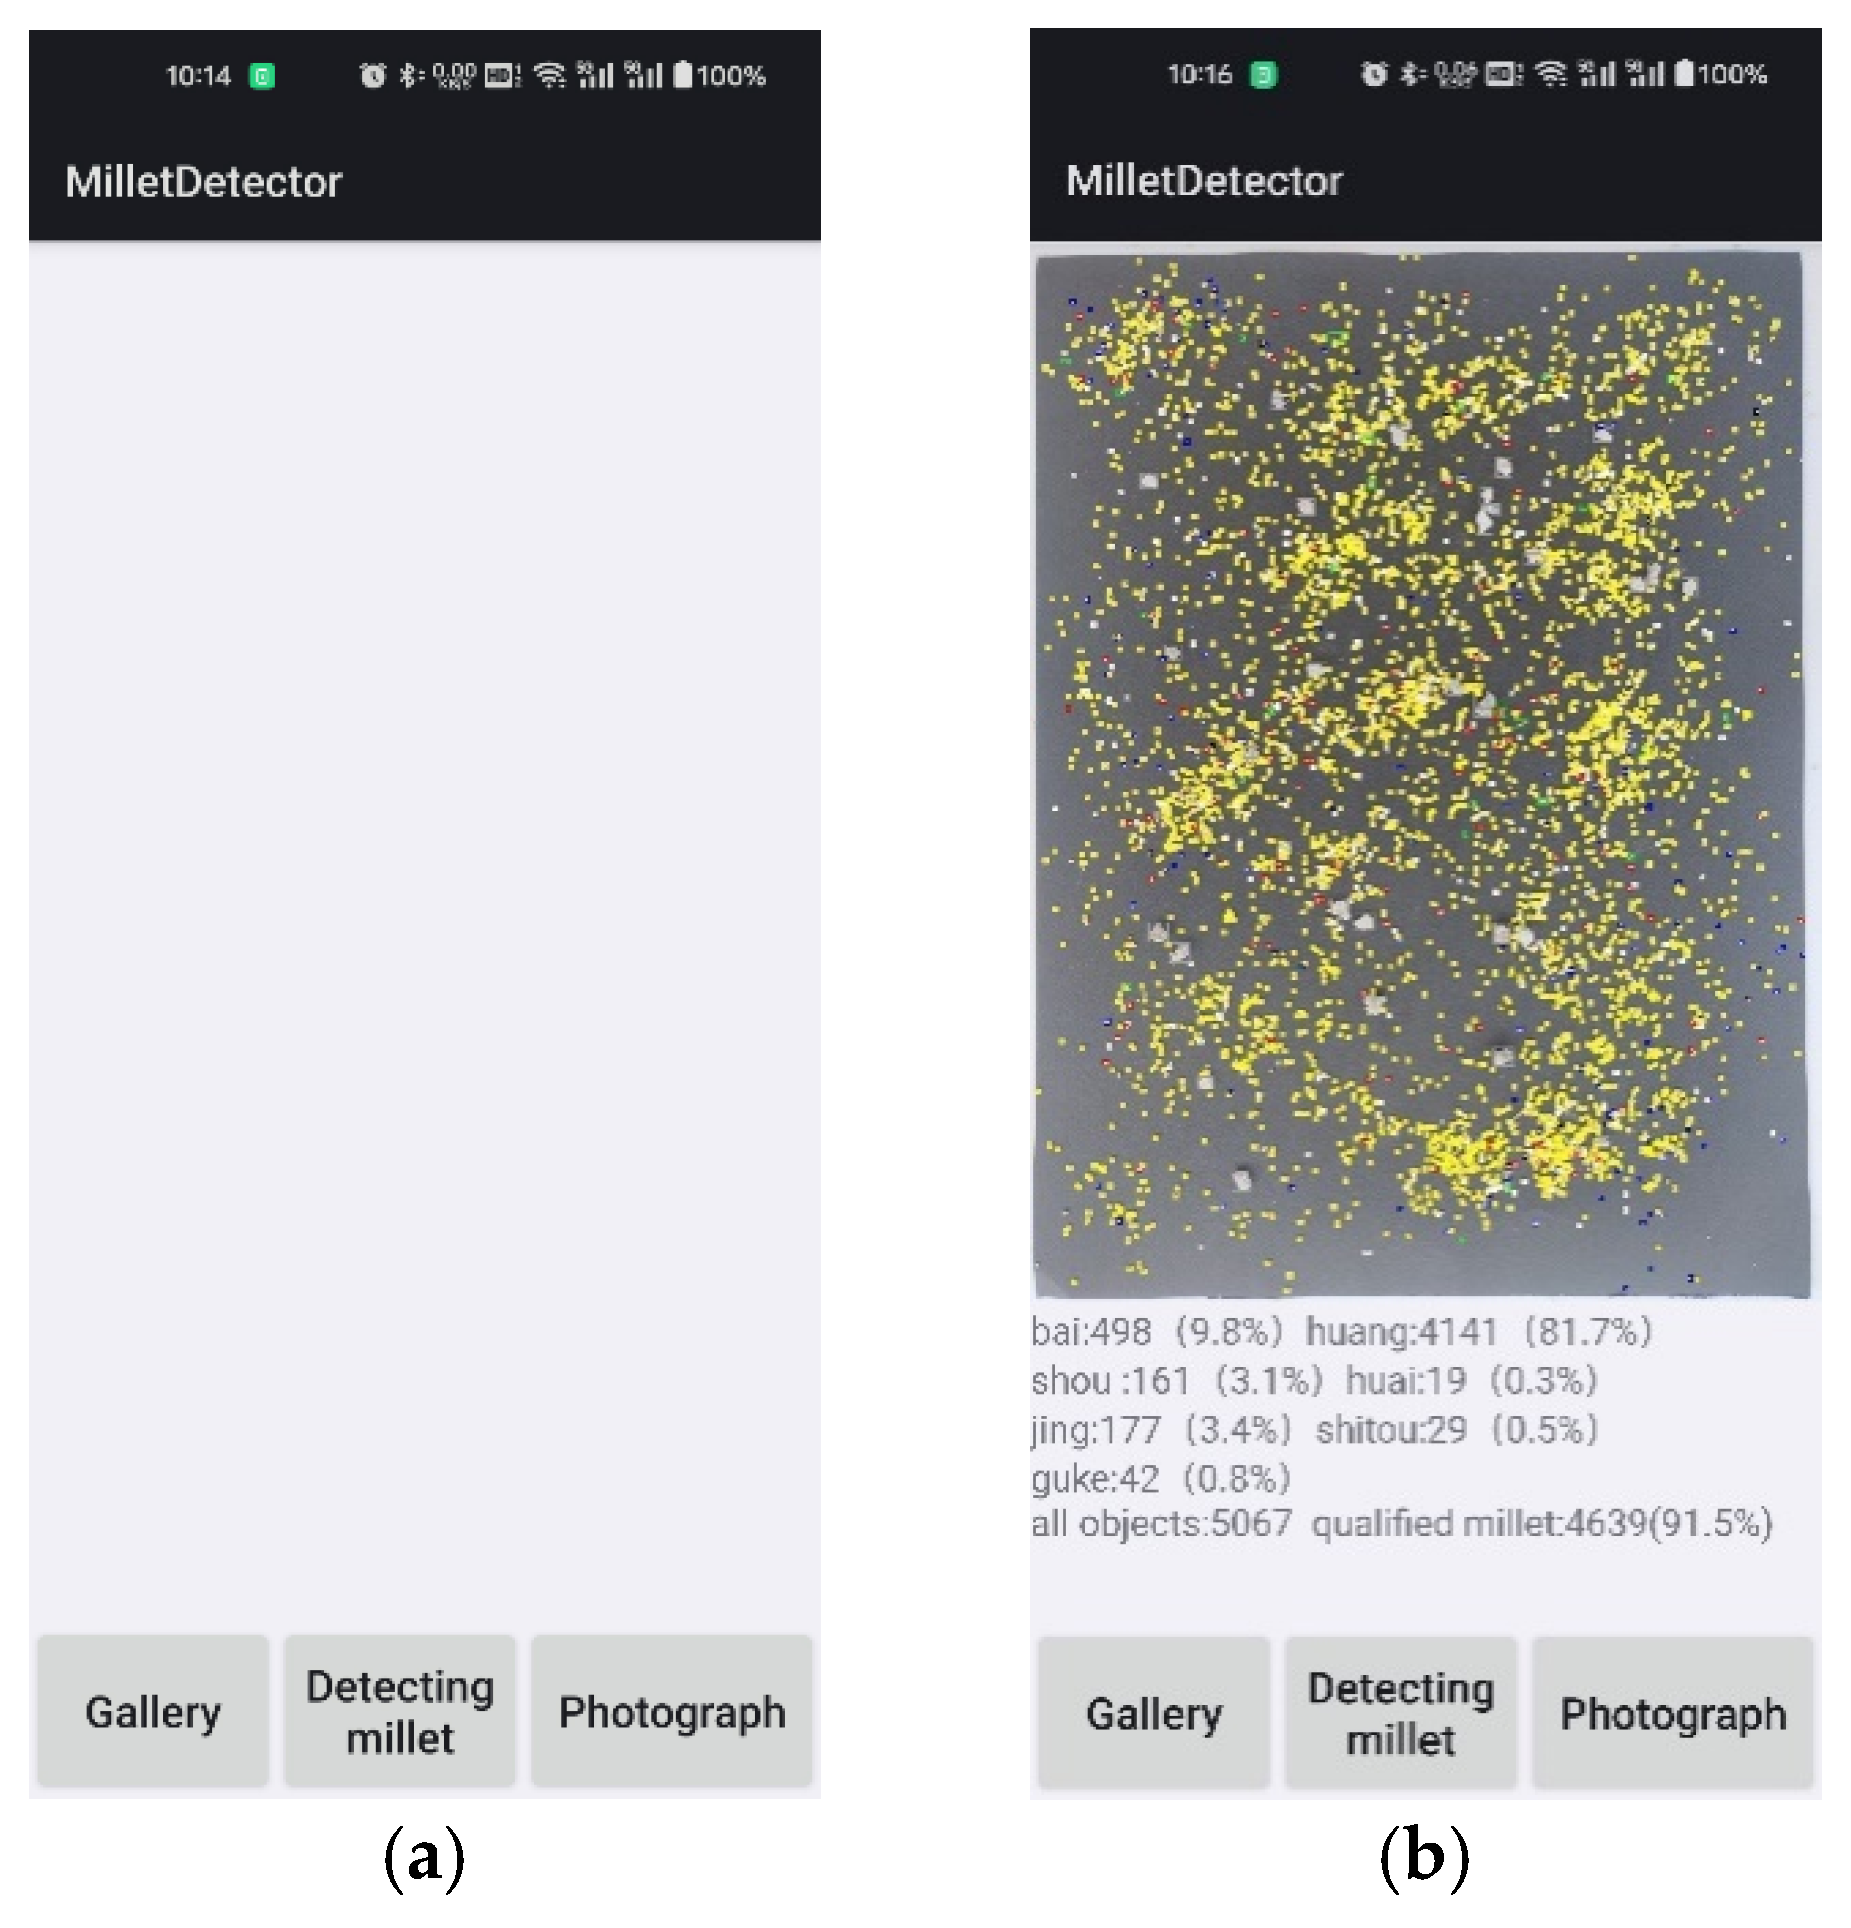
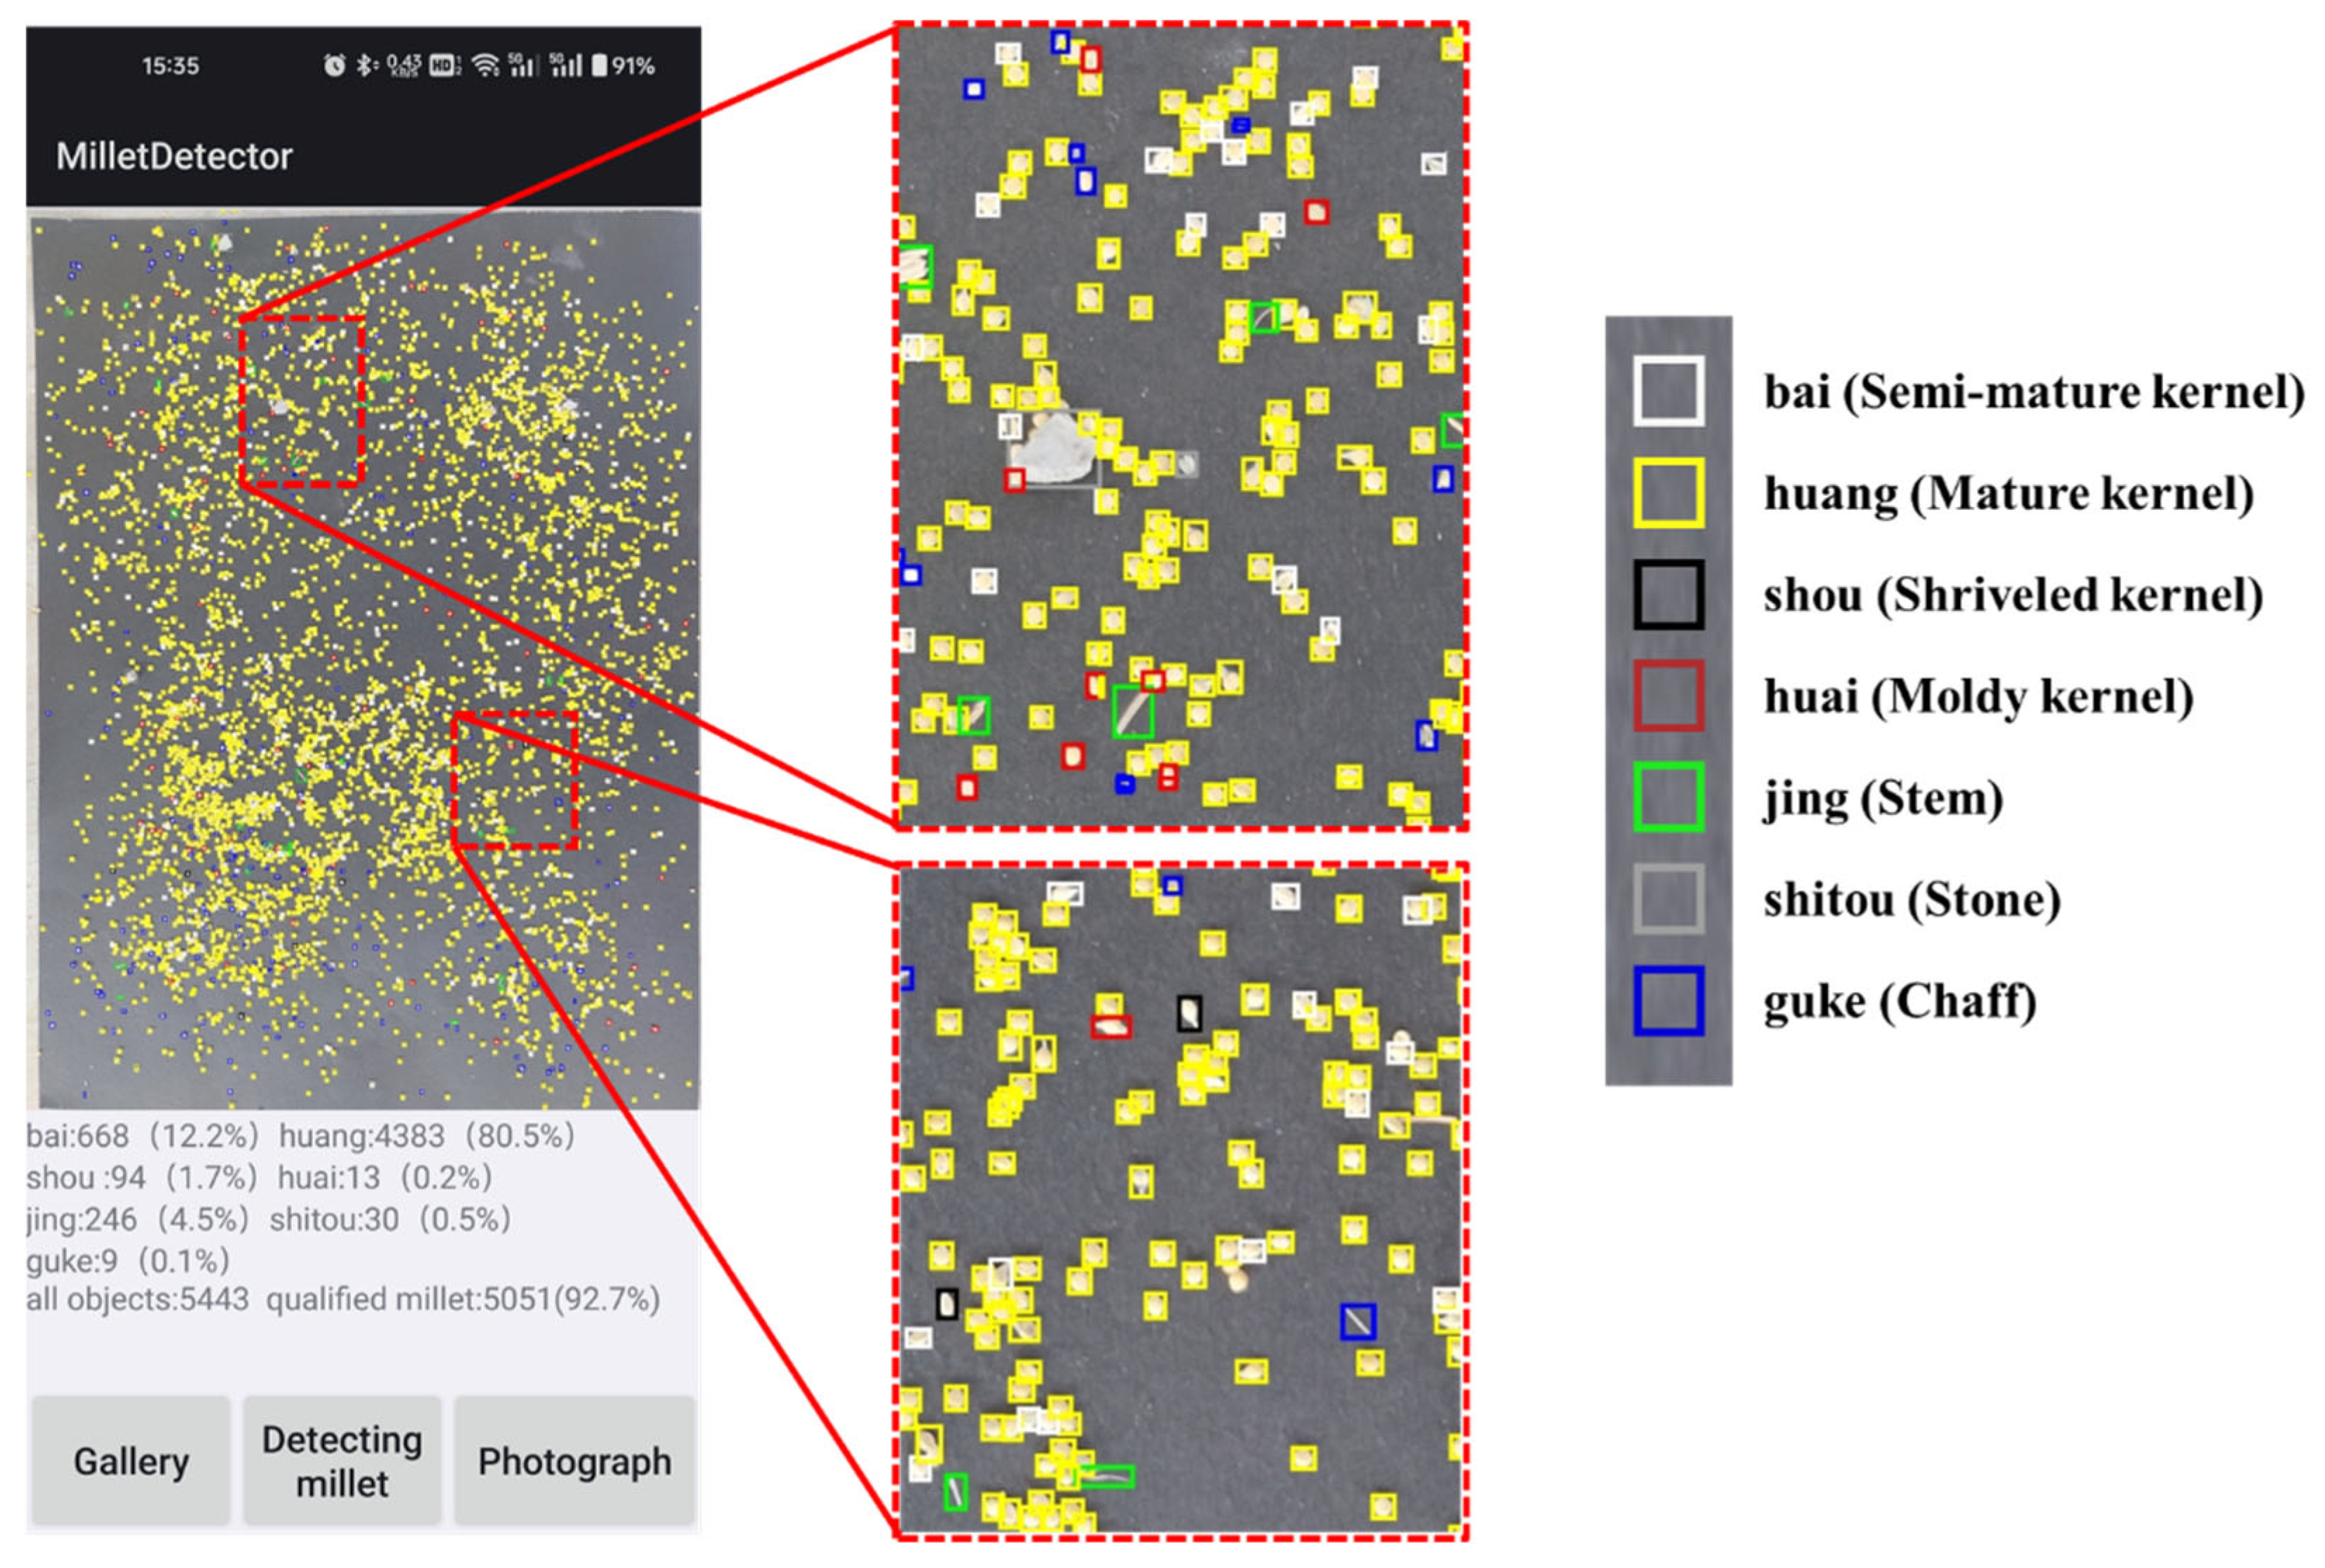
2.5.2. App Development for Millet Appearance Inspection

For achieving portability in terms of MAQI, a user-friendly millet detection App (MDApp, version 1.0) was developed to provide a low-cost solution available for smartphones. The design of the MDApp was driven by operational scenario requirements, aiming to address the constraints of the model functions and the practical requirements of mobile deployment. Notably, the OPSDM was trained to process partitioned images, but the images that were directly captured by smartphones were original high-resolution images without any processing. In this case, the necessary functions (as shown in Figure 8) were added to support the partitioned images and the detection results were reassembled, which allowed for providing accurate, real-time millet inspection servers.
The main workflow of the MDApp for millet inspection can be summarized into three key stages, including image partitioning and indexing, patch-independent inference, and coordinate mapping with results fusion. Specifically, the original high-resolution image was divided into 42 overlapping patches arranged in 7 columns and 6 rows by the proposed OPS. Each patch was assigned a unique index composed of its row and column identifiers (r0 to r5 and c0 to c6), and their center coordinates were recorded accordingly. The trained OPSDM was employed to process all the patches sequentially in a row-wise manner, where the output predicted the bounding boxes, category labels, and confidence scores of the predicted objects. These local predictions of the patches were then transformed and mapped onto the global coordinates of the original image based on the recorded corresponding center location.
After all the predictions were collected, a non-maximum suppression (NMS) algorithm was applied to remove redundant detections resulting from overlapping regions. All the bounding boxes of the predictions were first sorted in descending order of confidence scores to make the highest score the current reference. For each remaining box, its intersection over union (IoU) with the reference bounding box was computed. If the IoU exceeded a predefined threshold (0.5 in this study), the bounding box was discarded as a duplicate. This process was repeated until all the bounding boxes are either retained or removed, and the execution process is illustrated in Figure 9.
To support the above inspection workflow, several modules of the MDApp have been developed to ensure functional completeness, including image acquisition, preprocessing, detection, and result display. The image acquisition module allows users to import millet images by camera capture or gallery selection. The image-partitioning module is applied to create the desired patches by the OPS to make sure details of the kennels are retained. The image preprocessing module is used to further check the size of the input patches to meet the requirements of the set image size for the OPSDM with the ONNX format. The image detection module presents the objects for detection and reassembles the results, which adopt the non-maximum suppression (NMS) algorithm to refine all the results of the patches from one image. Finally, the result display module shows the detected objects with the overall categories ratio, as shown in Figure 10. The MDApp development environment was based on the Windows 10 operating system and Java language, configured by Android Studio 3.4.2, JDK 1.8.0, and JRE 1.8.0.

2.6. Evaluation Indicators

For the detection model evaluation, four indicators employed in this paper are introduced, encompassing the precision (P), recall (R), average precision (AP), and mean average precision (mAP). In object detection tasks, the results are classified as positive samples if the intersection over union (IoU) between the predicted bounding boxes and the ground truth labels exceeds a predefined threshold. Otherwise, the results are considered negative samples. Based on this classification, the detection results can be categorized into four groups of true positive (TP), false positive (FP), true negative (TN), and false negative (FN). P refers to the percentage of TP samples among all the predicted positive samples in the validation dataset. In contrast, R represents the proportion of TP samples in the validation dataset that are correctly identified by the model. The AP for each class is computed as the area under the precision–recall (P-R) curve for that class, while the mAP calculates the mean of the AP values for multiple categories. Specifically, the formulas in Equation (1) to Equation (4) for the adopted evaluation indicators are calculated as follows.
P = T P T P + F P × 100 %
R = T P T P + F N × 100 %
A P i = 0 1 P R i d R i
m A P = 1 n i = 0 n A P i
where n is the number of labeled classes, which is eleven in this study; APi is the average precision of a certain class, which is the area under the P-R curve of the ith class; and the mAP adopted in this study refers to mAP@50.
For the millet inspection results evaluation, the inspection coverage ratio (ICR) and qualified ration (QR) were applied to verify the stability and accuracy of the MDApp. The ICR is defined as the ratio of the number of detected objects to ground truth labels in the image. The QR is defined as the ratio of the number of desired millet kernels (semi-mature kernels and mature kernels) to the number of all the detected objects. Specifically, the formulas in Equation (5) to Equation (6) for the proposed indicators are calculated as follows.
I C R = D B G × 100 %
Q R = D B D D B × 100 %
where DB is the number of detected objects; G is the number of ground truth labels; and DBD is the desired millet kernels in the detected objects, which is the sum of the TP and FP for semi-mature kernels and mature kernels.

3. Results and Discussion

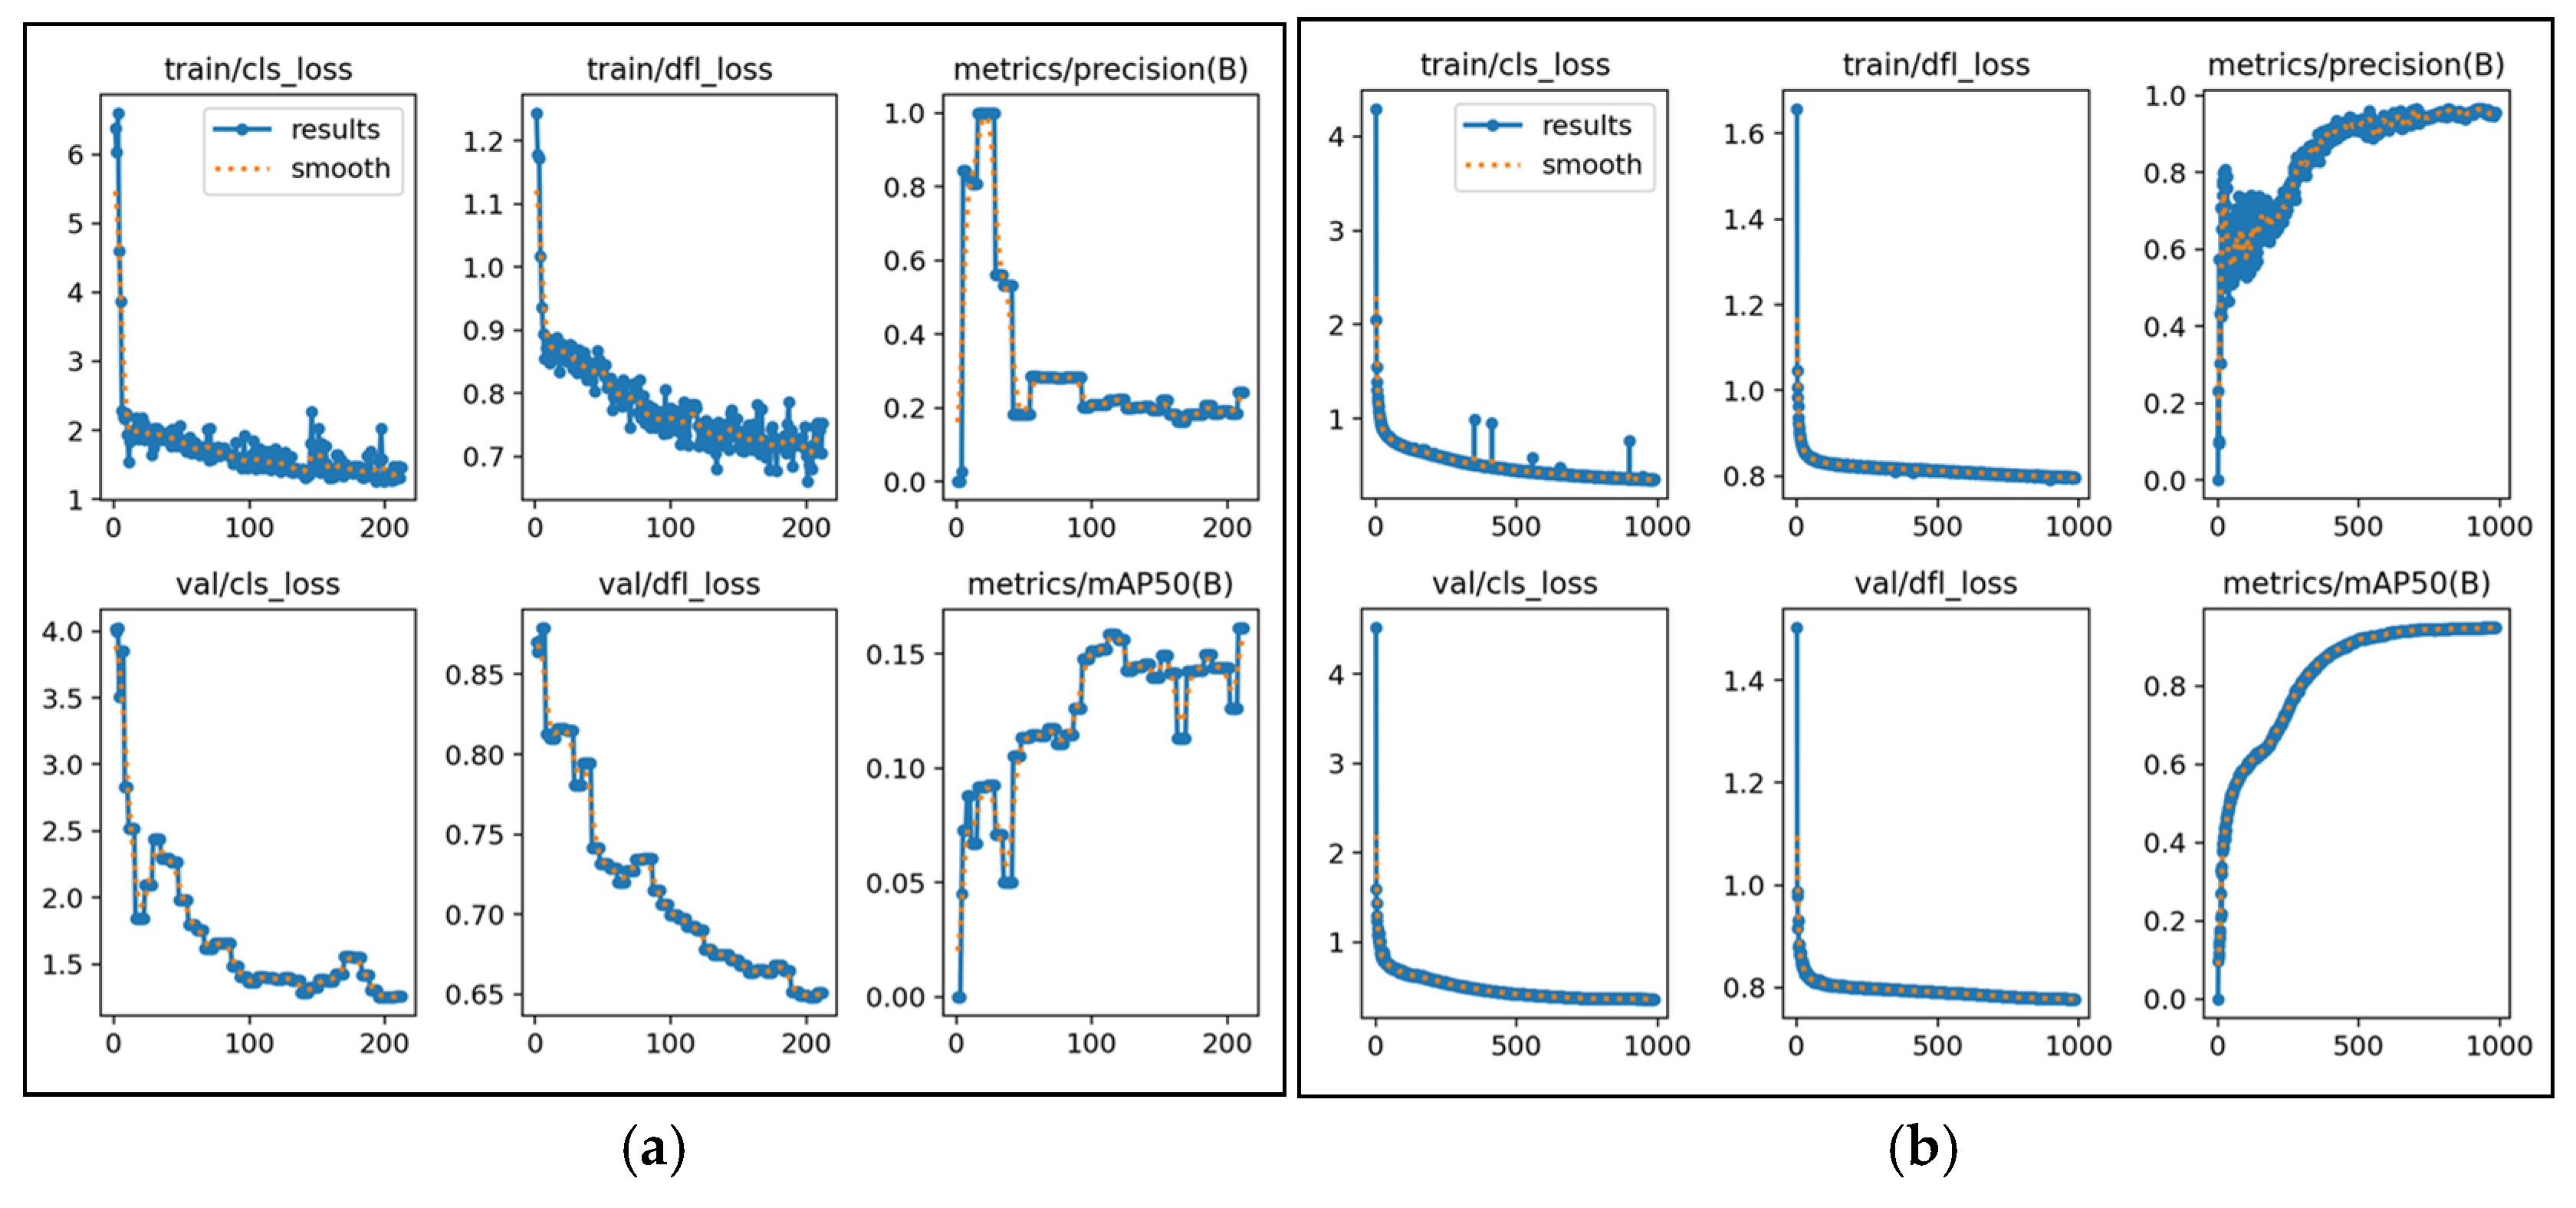
3.1. Training Evaluation of HRDM and OPSDM

Due to differences in the training strategies, the training and validation loss curves for the two models indicate distinct performance patterns. For the HRDM, the relatively low metric values of the precision and mAP, coupled with the fluctuating loss curves, indicate that the model struggled with detecting small objects in dense scenes (as shown in Figure 11a). During training, the precision and mAP remained relatively unchanged for a prolonged period, which suggests that the model was not able to effectively capture the fine details of millet kernels due to the limited pixel representation of each object. This plateau in performance led to the early stopping of the training process, as no significant improvements were observed despite continued iterations. The reason the HRDM failed to improve in accuracy during training can be attributed to the challenge posed by resizing large, high-resolution images, where small objects like millet kernels were underrepresented, making it difficult for the network to learn the necessary features.
In contrast, the introduction of the OPS significantly improved the learning ability of the OPSDM during the training process, with a smooth decrease in both the training and validation loss. The metrics of the precision and mAP from the loss curves showed steady improvement, reflecting the capacity to progressively learn and adapt (as shown in Figure 11b). This suggests that the OPSDM trained with the OPS benefits from a focused learning process, where the model is able to capture more granular details and achieve a higher level of precision in detecting millet kernels. This training method addresses the issue of small object sizes and low pixel ratios in dense scenes by improving the object representation and reducing the risk of feature loss due to image resizing.
A further analysis was conducted and focused on specific indicators for the two trained models. As shown in Table 2, the performance of the OPSDM significantly improved compared to the HRDM in various aspects according to the P, R, and mAP. The OPSDM obtained substantial improvements with a P of 95.5% and R of 89.5% compared to the HRDM, which achieved only 22.2% and 9.7%, respectively. The mAP of the OPSDM also reached an impressive 94.8%, significantly higher than the 15.9% of the HRDM, reflecting the enhanced ability of the OPS to detect small objects in dense scenes. Apart from this, there was no noticeable difference in the average detection speed of the two models, with 15.5 ms for the HRDM and 13.5 ms for the OPSDM. These metrics underscore the superior performance of the OPSDM in accurately detecting small millet kernels while minimizing false positives, thereby validating the effectiveness of the OPS in addressing the inherent challenges of dense-scene millet detection.

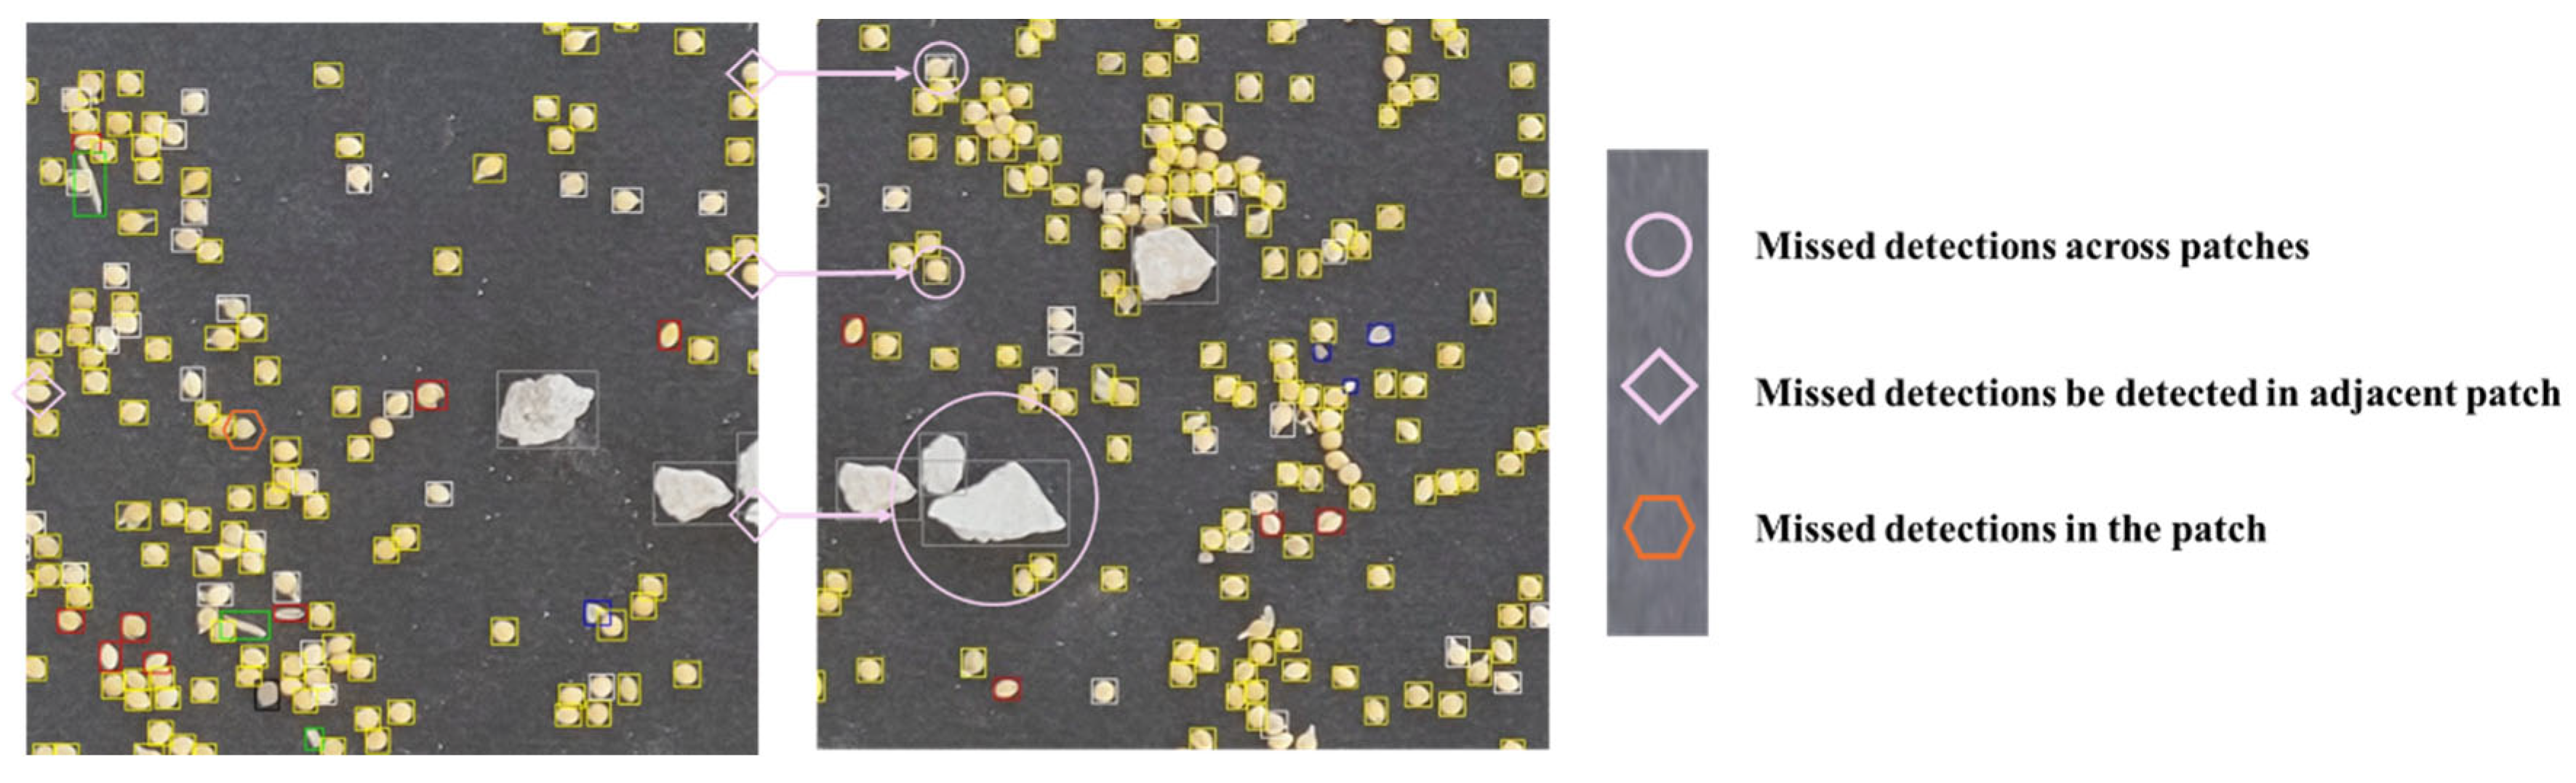
3.2. Overall Performance of OPSDM

The evaluation results of the OPSDM demonstrated a robust overall performance in millet detection. Except for stones, all the categories of objects achieved AP values over 90%, with a mAP of 94.8 (as shown in Table 3). The metrics of the P for all the categories further emphasized the overall detection accuracy, obtaining an average of 95.5% across all the categories, with P values of over 90% for each category. Compared with the higher P, the R for all the categories was relatively low at 89.5%, which indicated that the OPSDM has a problem of missed detection, resulting in a discrepancy between the proportion of correctly identified positive samples and the overall detection accuracy.
The majority of missed detections can be attributed to incomplete objects at the image edges. Since the original high-resolution images were partitioned into multiple patches by the OPS processing, objects located at the boundaries of these patches may not be fully displayed in a single patch. Incomplete objects lack sufficient visual features to characterize their categories, resulting in missed detections. The detection of stones could be impacted by the larger size across all the categories, as they are more likely to span across the image boundaries under OPS processing, which leads to the most missed detections with the lowest R value of 76.4% among all the categories. However, the carefully designed overlap rate, which utilized the pixel size exceeding the largest object as the principle for the overlapped patches partitioning, enabled objects at the edge to be fully captured in adjacent patches. As shown in Figure 12, the missed detections marked with pink diamonds mainly occur at the edges of the patch, which could be accurately detected in the adjacent patch that is marked with a pink circle. Except for this, the challenge of occlusion kernels with similar appearances leads to a small amount of missed detections (kernels marked with orange hexagons) that occur in the non-edge areas of the patches, which requires further refinement of the capability of the detection model by improving the feature extraction separation process.

3.3. Comparison with Different Grain Inspection Systems

The MDApp developed in this study presented a notable performance in the MAQI task, offering a practical and efficient solution for on-site, real-time quality assessments. The NMS was applied to deal with missed detections at the edge and repeated detections in the overlapped area, which acquired a high overall accuracy after reassembling the detection results and partitioned patches. As shown in Figure 13, by utilizing YOLO11s with the OPS, the MDApp could process high-resolution images swiftly, inspecting an average of 5326 objects per image within 6.8 s. All the detected objects were accurately located and marked with rectangles in the corresponding colors in the results display interface, which clearly showed the inspected categories, along with their respective quantities and proportions. Additionally, it provided the total number of objects and the proportion of qualified millet kernels. A further evaluation was conducted by comparison with experienced millet inspectors, and the results showed that the MDAPP obtained a high ICR of 96.6% with a comparable QR of 88.99% to that of 88.97% obtained by the experienced inspectors.
Compared to other inspection systems for grain crops, which rely heavily on powerful desktop computing systems, the developed MDApp offers competitive performance in terms of the portability and inspection speed. Zhao et al. (2022) [13] used WGNet to detect 2500 wheat kernels with an average detection time of 10 s, which obtained a mAP of 97.0%. Geng et al. (2023) [29] developed the BCK-CNN model with an average detection time of 12 s for 700 kernels, achieving 96.5% and 94.2% classification accuracies for intact and damaged corn kernels, respectively. Shen et al. (2023) [30] utilized an improved Mask-RCNN model for wheat kernel inspection, achieving an inference time of 7.8 s for about 200 objects. Fan et al. (2024) [31] proposed an automated system for grain appearance inspection based on machine vision, which obtained an average accuracy 98.3% for wheat, sorghum, and rice in 151.7 s for 1500 kernels. As shown in Table 4, although progress has been achieved, most of the constructed grain inspection system are based on desktop computers with powerful computing requirements.
A key advancement of the MDApp lies in its ability to accurately inspect a large number of small objects in a single inspection task. This capability is particularly significant given that most existing grain inspection systems are optimized for either larger grain kernels (e.g., wheat or corn) or smaller quantities under less complex conditions, where the inspection task is performed in scenarios that are inherently less challenging than millet. As millet kernels are smaller in size and have subtle visual features compared to other grains, they present unique challenges in appearance quality inspection. Despite these challenges, the robust design of the MDApp enables high precision in large-scale inspection, setting it apart from conventional approaches. By effectively addressing the intricacies of millet inspection, this study presents a system with superior adaptability and performance for grain-specific inspection tasks.

3.4. Further Works

Although the developed MDApp demonstrated strong performance under the current setup, its inspection precision and efficiency can be further improved. A key limitation of the current system is that it only captures images from the top of the millet sample, which restricts the ability to fully assess the complete appearance quality. As a result, quality attributes on the bottom surface remain unevaluated, creating a gap in the comprehensive assessment. To address this, future versions of the MDApp should incorporate multi-angle image acquisition. One promising solution is the integration of a vibrating flipping mechanism combined with sequential image capture, which has been shown to enhance the coverage in similar tasks [31].
While the MDApp presented promising results in terms of the MAQI task, there were occasional instances of missed and incorrect detections, which negatively affected the overall performance. Despite the proposed OPS ensuring that each partitioned patch retains critical information from the original high-resolution image, the difficulty lies in millet kernels, especially those with subtle differences in texture and shape. Future research should focus on improving the feature extraction techniques, possibly through multi-scale or multi-angle feature analysis, to better capture the minute differences between kernels and improve the classification accuracy in dense, homogenous scenes. By refining the sensitivity of the model to subtle distinctions, the inception system could handle the inherent challenges of feature similarity and enhance the overall detection performance.
Another limitation of the MDApp is the computing power constraints of smartphone hardware. The existing image detection process takes a considerable amount of time, which may reduce the practicality of the MDApp for high-throughput operation. With improvements in hardware performance, future smartphones will likely reduce the processing times significantly, enhancing the usability [32]. Looking forward, the evolution of smartphone hardware presents exciting possibilities. With more powerful processing capabilities, it will become feasible to conduct real-time video detection for millet quality evaluation. This shift to video-based detection could drastically improve the efficiency, enabling users to capture videos and receive immediate feedback on the millet quality, eliminating the need for multiple image captures and significantly enhancing the practicality of automated quality detection in agricultural applications.
Although the effectiveness of the proposed OPS for use in millet appearance quality inspection based on the YOLO series architecture has been validated, its performance may vary depending on the characteristics of different detection models. Considering the rapid advancement of object detection techniques, subsequent research will focus on evaluating the adaptability and effectiveness of the OPS across a range of mainstream detection architectures. This approach aims to verify the generalizability and robustness of the OPS in multi-model scenarios and facilitate its broader application in dense small-object detection tasks. Additionally, an adaptive parameter adjustment mechanism will be investigated to further enhance the universality and automation of the proposed strategy.

4. Conclusions

This study presented a practical and scalable solution for millet appearance quality inspection in procurement, offering valuable insights into developing portable, real-time visual detection systems for agricultural applications. By integrating YOLO11s with the proposed OPS, the system achieves a notable 94.8% mAP in detecting small millet kernels, significantly surpassing the 15.9% mAP for direct detection by high-resolution images. The OPS divides high-resolution images into overlapping patches, preserving the essential features of densely packed millet kernels. A user-friendly App in the form of the MDApp was developed, enabling the rapid processing of 4608 × 3456 pixels images with approximately 5000 kernels contained in 6.8 s, offering a cost-effective solution for on-site assessments. This design not only ensures rapid, reliable performance but also enables easy operation by non-expert users, eliminating subjectivity and reducing the reliance on specialized training, ensuring consistent and scalable millet inspection during procurement. However, the system has limitations, including the occasional missed detections in overlapping kernels and the inability to assess the bottom surface of millet kernels. Future research will focus on multi-angle imaging and improving the occlusion handling for more comprehensive quality evaluations. This study advances the MAQI technology and provides a framework for real-time, portable agricultural inspection systems, with potential applications in seed quality evaluation and pest detection, bridging the gap between AI-driven machine vision and practical solutions for agriculture scenarios.

Author Contributions

Conceptualization, L.H. and R.W.; data curation, L.H., R.W., Y.D., X.W. and R.L.; formal analysis, Y.D., J.H. and L.F.; funding acquisition, L.F.; investigation, R.L. and L.F.; methodology, L.H., R.W., J.H., X.W., S.W. and L.F.; project administration, S.W. and L.F.; resources, R.L.; software, X.W.; supervision, S.W. and L.F.; validation, Y.D., J.H. and R.L.; visualization, L.H.; writing—original draft, L.H. and R.W.; writing—review and editing, S.W. and L.F. All authors have read and agreed to the published version of the manuscript.

Funding

This work was supported by the Science and Technology Program of Yulin City, China (2023-CXY-181) and the National Foreign Expert Project, Ministry of Human Resources and Social Security, China (H20240238, Y20240046).

Data Availability Statement

Data are available upon request from researchers who meet the eligibility criteria. Kindly contact the corresponding author privately through e-mail.

Conflicts of Interest

The authors declare no conflicts of interest.

References

  1. Li, Y.; Wu, S. Traditional maintenance and multiplication of foxtail millet (Setaria italica (L.) P.Beauv.) landraces in China. Euphytica 1996, 87, 33–38. [Google Scholar] [CrossRef]
  2. Liu, J.; Chang, L.; Hong, Y.; Zhang, D.; Sun, H.; Duan, X. Correlation between the porridge eating quality, kernel sensory quality and nutrients of milled foxtail mille. J. Chin. Inst. Food Sci. Technol. 2023, 23, 406–416. [Google Scholar] [CrossRef]
  3. Feng, H.; Li, L.; Wang, D.; Zhang, K.; Feng, M.; Song, H.; Li, R.; Han, P. Progress of the application of MIR and NIR spectroscopies in qualitytesting of minor coarse cereals. Spectrosc. Spectr. Anal. 2023, 43, 16–24. [Google Scholar] [CrossRef]
  4. Liu, Y.; Zhang, J.; Yuan, H.; Song, M.; Zhu, Y.; Cao, W.; Jiang, X.; Ni, J. Non-Destructive quality-detection techniques for cereal grains: A systematic review. Agronomy 2022, 12, 3187. [Google Scholar] [CrossRef]
  5. Chen, J.; Lin, W.; Cheng, H.; Hung, C.; Lin, C.; Chen, S. A smartphone-based application for scale pest detection using multiple-object detection methods. Electronics 2021, 10, 372. [Google Scholar] [CrossRef]
  6. Nadimi, M.; Divyanth, L.G.; Paliwal, J. Automated detection of mechanical damage in flaxseeds using radiographic imaging and machine learning. Food Bioprocess Technol. 2023, 16, 526–536. [Google Scholar] [CrossRef]
  7. Wang, Y.; Su, W. Convolutional neural networks in computer vision for grain crop phenotyping: A Review. Agronomy 2022, 12, 2659. [Google Scholar] [CrossRef]
  8. Wan, Y.; Lin, M.; Chiou, J. Rice quality classification using an automatic grain quality inspection system. Trans. ASAE 2002, 45, 379–387. [Google Scholar] [CrossRef]
  9. Kaur, H.; Singh, B. Classification and grading rice using multi-class SVM. Int. J. Sci. Res. Publ. 2013, 3, 624–628. [Google Scholar]
  10. Chen, X.; Ke, S.; Wang, L.; Xu, H.; Chen, W. Classification of rice appearance quality based on LS-SVM using machine vision. In Information Computing and Applications; ICICA 2012; Communications in Computer and Information Science; Springer: Berlin/Heidelberg, Germany, 2021; Volume 307, pp. 104–109. [Google Scholar] [CrossRef]
  11. Harini, S.; Chakrasali, S.; Krishnamurthy, G.N. Analysis of Indian Rice Quality Using Multi-Class Support Vector Machine; Springer Nature: Singapore, 2023; Volume 968, ISBN 9789811973451. [Google Scholar]
  12. Kundu, N.; Rani, G.; Dhaka, V.S. Seeds classification and quality testing using deep learning and YOLOv5. In Proceedings of the International Conference on Data Science, Machine Learning and Artificial Intelligence, Windhoek, Namibia, 9–12 August 2021; Association for Computing Machinery: New York, NY, USA, 2021; pp. 153–160. [Google Scholar] [CrossRef]
  13. Zhao, W.; Liu, S.; Li, X.; Han, X.; Yang, H. Fast and accurate wheat grain quality detection based on improved YOLOv5. Comput. Electron. Agric. 2022, 202, 107426. [Google Scholar] [CrossRef]
  14. Fan, X.; Wang, L.; Liu, J.; Zhou, Y.; Zhang, J.; Suo, X. Corn seed appearance quality estimation based on improved YOLOv4. Trans. Chin. Soc. Agric. Mach. 2022, 53, 226–233. [Google Scholar] [CrossRef]
  15. Wonggasem, K.; Chakranon, P.; Wongchaisuwat, P. Automated quality inspection of baby corn using image processing and deep learning. Artif. Intell. Agric. 2024, 11, 61–69. [Google Scholar] [CrossRef]
  16. Li, X.; Niu, W.; Yan, Y.; Ma, S.; Huang, J.; Wang, Y.; Chang, R.; Song, H. Detection of broken hongshan buckwheat seeds based on improved YOLOv5s Model. Agronomy 2024, 14, 37. [Google Scholar] [CrossRef]
  17. Andrew, J.; Eunice, J.; Popescu, D.E.; Chowdary, M.K.; Hemanth, J. Deep learning-based leaf disease detection in crops using images for agricultural applications. Agronomy 2022, 12, 2395. [Google Scholar] [CrossRef]
  18. Wang, P.; Tan, J.; Yang, Y.; Zhang, T.; Wu, P.; Tang, X.; Li, H.; He, X.; Chen, X. Efficient and accurate identification of maize rust disease using deep learning model. Front. Plant Sci. 2024, 15, 1490026. [Google Scholar] [CrossRef]
  19. Deng, J.; Yang, C.; Huang, K.; Lei, L.; Ye, J.; Zeng, W.; Zhang, J.; Lan, Y.; Zhang, Y. Deep-learning-based rice disease and insect pest detection on a mobile phone. Agronomy 2023, 13, 2139. [Google Scholar] [CrossRef]
  20. Liang, J.; Chen, J.; Zhou, M.; Li, H.; Xu, Y.; Xu, F.; Yin, L.; Chai, X. An intelligent detection system for wheat appearance quality. Agronomy 2024, 14, 1057. [Google Scholar] [CrossRef]
  21. Andrianto, H.; Suhardi; Faizal, A.; Armandika, F. Smartphone Application for Deep learning-based rice plant disease detection. In Proceedings of the 2020 International Conference on Information Technology Systems and Innovation (ICITSI), Bandung, Indonesia, 19–23 October 2020; IEEE: New York, NY, USA, 2020; pp. 387–392. [Google Scholar] [CrossRef]
  22. Zhou, Z.; Song, Z.; Fu, L.; Gao, F.; Li, R.; Cui, Y. Real-time kiwifruit detection in orchard using deep learning on AndroidTM smartphones for yield estimation. Comput. Electron. Agric. 2020, 179, 105856. [Google Scholar] [CrossRef]
  23. Suharjito; Asrol, M.; Utama, D.N.; Junior, F.A. Marimin real-time oil palm fruit grading system using smartphone and modified YOLOv4. IEEE Access 2023, 11, 59758–59773. [Google Scholar] [CrossRef]
  24. Wu, W.; Zhou, L.; Chen, J.; Qiu, Z.; He, Y. GaintKW: A measurement system of thousand kernel weight based on the Android platform. Agronomy 2018, 8, 178. [Google Scholar] [CrossRef]
  25. Li, J.; Shi, L.; Mo, X.; Hu, X.; Su, C.; Han, J.; Deng, X.; Du, S.; Li, S. Self-correcting deep learning for estimating rice leaf nitrogen concentration with mobile phone images. Comput. Electron. Agric. 2024, 227, 109497. [Google Scholar] [CrossRef]
  26. Dang, H.; He, L.; Shi, Y.; Janneh, L.L.; Liu, X.; Chen, C.; Li, R.; Ye, H.; Chen, J.; Majeed, Y.; et al. Growth characteristics based multi-class kiwifruit bud detection with overlap-partitioning algorithm for robotic thinning. Comput. Electron. Agric. 2025, 229, 109715. [Google Scholar] [CrossRef]
  27. Liu, X.; Jing, X.; Jiang, H.; Younas, S.; Wei, R.; Dang, H.; Wu, Z.; Fu, L. Performance evaluation of newly released cameras for fruit detection and localization in complex kiwifruit orchard environments. J. Field Robot. 2024, 41, 881–894. [Google Scholar] [CrossRef]
  28. Jocher, G.; Chaurasia, A.; Qiu, J. Ultralytics YOLO11; GitHub: San Francisco, CA, USA, 2024; Available online: https://Github.Com/Ultralytics/Ultralytics (accessed on 5 November 2024).
  29. Geng, D.; Wang, Q.; Li, H.; He, Q.; Yue, D.; Ma, J.; Wang, Y.; Xu, H. Online detection technology for broken corn kernels based on deep learning. Trans. Chin. Soc. Agric. Eng. 2023, 39, 270–278. [Google Scholar] [CrossRef]
  30. Shen, R.; Zhen, T.; Li, Z. Segmentation of unsound wheat kernels based on improved Mask RCNN. Sensors 2023, 23, 3379. [Google Scholar] [CrossRef]
  31. Fan, L.; Fan, D.; Ding, Y.; Wu, Y.; Chu, H.; Pagnucco, M.; Song, Y. AV4GAInsp: An efficient dual-camera system for identifying defective kernels of cereal grains. IEEE Robot. Autom. Lett. 2024, 9, 851–858. [Google Scholar] [CrossRef]
  32. Fu, L.; Liu, Z.; Majeed, Y.; Cui, Y. Kiwifruit yield estimation using image processing by an Android mobile phone. IFAC-PapersOnLine 2018, 51, 185–190. [Google Scholar] [CrossRef]
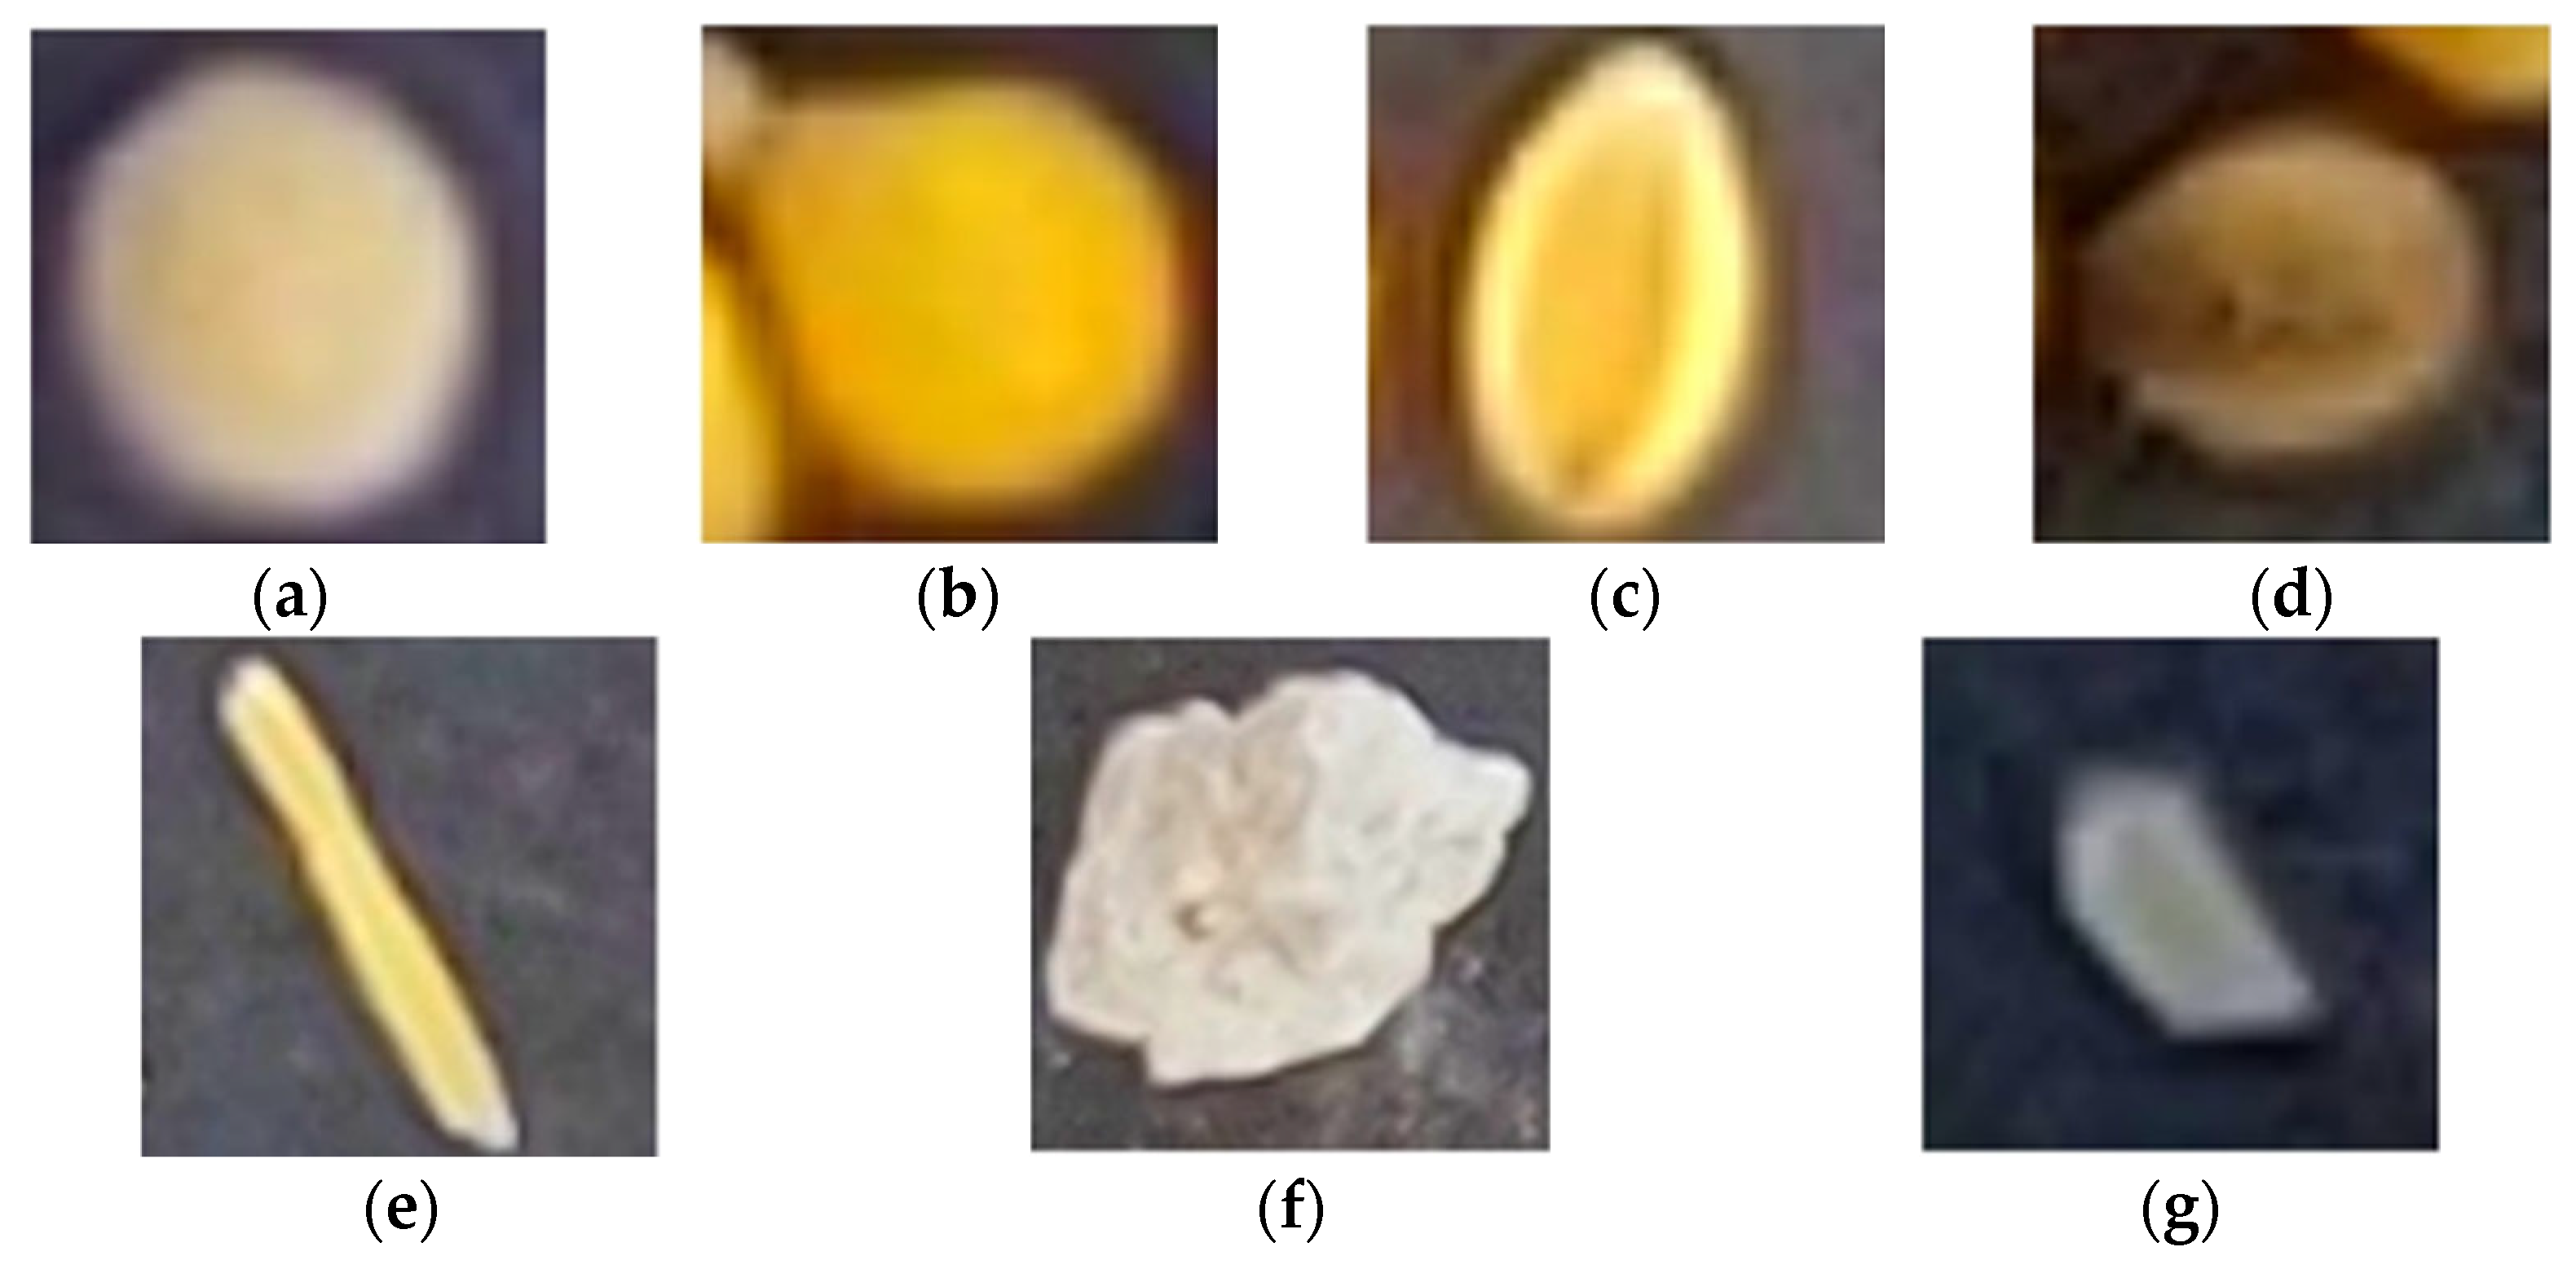
Figure 1. Millet kernel sampling for evaluation. (a) Bags of millet to be evaluated. (b) The millet sampled by the probe with approximately 5000 kernels.
Agronomy 15 01284 g001
Figure 2. Example image of sampled millet placed on the black background.
Agronomy 15 01284 g002
Figure 3. The categories and labels of the millet kernels and impurities. (a) Semi-mature kernel with the label of ‘bai’; (b) mature kernel with the label of ‘huang’; (c) shriveled kernel with the label of ‘shou’; (d) moldy kernel with the label of ‘huai’; (e) stem with the label of ‘jing’; (f) stone with the label of ‘shitou’; and (g) chaff with the label of ‘guke’.
Agronomy 15 01284 g003
Figure 4. Comparison of the kernels’ appearance at different resolutions. (a) Original millet image with a resolution of 4608 × 3456 pixels. (b) Resized millet image with a resolution of 640 × 480 pixels.
Agronomy 15 01284 g004
Figure 5. Schematic diagram of partitioned adjacent patches based on different overlap rates. (a) Adjacent patches partitioned with an appropriate overlap rate. (b) Adjacent patches partitioned with a small overlap rate. (c) Adjacent patches partitioned with a large overlap rate. The orange circular represents the largest object in the original image, while the red and cyan boxes represent the adjacent patches.
Agronomy 15 01284 g005
Figure 6. Schematic diagram of the OPS applied to the original millet images.
Agronomy 15 01284 g006
Figure 7. Schematic diagram of the overlapped area adjustment to the final patch. (a) Overlapped area adjustment to the horizontal. (b) Overlapped area adjustment to the vertical.
Agronomy 15 01284 g007
Figure 8. System architecture and functions of the MDApp.
Agronomy 15 01284 g008
Figure 9. Schematic diagram of the main workflow to the MDApp.
Agronomy 15 01284 g009
Figure 10. Interface of the MDApp. (a) Initial interface. (b) Detection results display interface.
Agronomy 15 01284 g010
Figure 11. Loss curves of the model training based on YOLO11s. (a) HRDM trained by the augmented set. (b) OPSDM trained by the patches set.
Agronomy 15 01284 g011
Figure 12. Example of missed detections by the OPSDM in patches with different marks.
Agronomy 15 01284 g012
Figure 13. Millet inspection by the MDApp with rectangles marked in different colors for all the categories.
Agronomy 15 01284 g013
Table 1. The pinyin labels and the corresponding features of the objects.
PropertyCategoriesLabelsFeatures
Millet kernelsSemi-mature kernelbaiWhite, ellipsoid
Mature kernelhuangYellow, ellipsoid
Shriveled kernelshouWhite or yellow, crackled
Moldy kernelhuaiBrown, ellipsoid
ImpuritiesStemjingYellow, rectangular
StoneshitouGray, irregular
ChaffgukeWhite, semi-transparent, irregular
Table 2. Evaluation results of the HRDM and OPSDM.
ModelImage Pixel Size
(Pixels)
Model Input Resize
(Pixels)
P
(%)
R
(%)
mAP
(%)
Average Speed
(ms)
HRDM4608 × 3456640 × 64022.29.715.915.5
OPSDM640 × 640640 × 64095.589.594.813.5
Table 3. Specific evaluation results of all the categories for the OPSDM.
CategoriesP (%)R (%)AP (%)mAP (%)
Semi-mature kernel96.696.198.494.8
Mature kernel97.696.398.2
Shriveled kernel95.382.691.6
Moldy kernel95.984.691.7
Stem93.992.497.1
Stone91.176.487.2
Chaff98.698.399.5
All95.589.5-
Table 4. Inspection systems for grain inspection performance.
Model or EquipmentGrainsDevices of the Computing
Platform
Average Number per InspectionAverage Inspection Time (s)
MDAppMilletSmartphone
(CPU: Qualcomm Snapdragon 845;
GPU: Adreno 630)
53266.8
AV4GAIsp [31]Wheat; Sorghum; RiceNvidia Jetson Xavier NX
(CPU: ARM Cortex-A57;
GPU: Nvidia Volta)
1500151.7
Improve Mask-RCNN [30]WheatDesktop computer
(CPU: -; GPU: 2 × Tesla T4)
2007.8
BCK-CNN [29]CornDesktop computer
(CPU: i7-1165G7; GPU: RTX3060)
70012.0
WGNet [13]WheatDesktop computer
(CPU: -; GPU: GTX1070)
250010.0
Note. -, not specified.
Disclaimer/Publisher’s Note: The statements, opinions and data contained in all publications are solely those of the individual author(s) and contributor(s) and not of MDPI and/or the editor(s). MDPI and/or the editor(s) disclaim responsibility for any injury to people or property resulting from any ideas, methods, instructions or products referred to in the content.

