Article

Enhancing Soil Phosphorus and Potassium Availability in Tea Plantation: The Role of Biochar, PGPR, and Phosphorus- and Potassium-Bearing Minerals

1
College of Resources, Sichuan Agricultural University, Chengdu 611130, China
2
Soil and Fertilizer Institute, Sichuan Academy of Agricultural Sciences, Chengdu 610066, China
3
College of Environmental Science, Sichuan Agricultural University, Chengdu 611130, China
*
Author to whom correspondence should be addressed.
Agronomy 2025, 15(6), 1287; https://doi.org/10.3390/agronomy15061287
Submission received: 21 April 2025 / Revised: 18 May 2025 / Accepted: 21 May 2025 / Published: 23 May 2025

Abstract

:
The co-application of biochar, plant growth-promoting rhizobacteria (PGPR), and phosphorus- and potassium-bearing minerals has emerged as a promising strategy for improving soil nutrient availability. However, the synergistic effects and impact factors that facilitate this optimization are yet to be fully elucidated. To address this knowledge gap, we conducted a pot experiment to evaluate the effects of these amendments on tea yield and phosphorus (P)/potassium (K) availability, while employing Random Forest (RF) and Partial Least Squares Structural Equation Modeling (PLS-SEM) to reveal the underlying mechanisms driving these improvements. The results demonstrated that the tripartite combination significantly enhanced tea yield, leaf P/K concentrations, and soil available P (AP)/available K (AK) levels compared to individual applications or pairwise combinations. Analytical modeling identified Chloroflexi bacteria containing pqqc functional genes as key drivers of AP enhancement. The AP was further modulated by β-glucosidase activity, NaHCO3-P, and AK levels. Critical determinants of AK dynamics included phosphorus-solubilizing bacterial populations, catalase activity, and fundamental soil chemical properties. In summary, our research conclusively shows that the co-application of phosphorus- and potassium-bearing minerals, PGPR, and biochar represents an effective approach to enhancing P and K accessibility in soil, thereby offering a viable alternative to conventional P and K fertilizers in tea cultivation.

1. Introduction

As a globally significant economic crop, tea (Camellia sinensis L.) is cultivated across 60 countries in tropical and subtropical regions, meeting economic and nutritional needs through the continuous harvesting of tender buds and leaves [1,2]. This unique cultivation practice not only requires a substantial nitrogen supply but also adequate and balanced phosphorus and potassium nutrition to ensure tea yield and quality [3,4]. However, traditional agricultural practices often favor excessive nitrogen fertilizer application while neglecting phosphorus and potassium provision, resulting in the rapid depletion of phosphorus and potassium reserves in tea plantation soils [5]. Concurrently, continuous chemical fertilizer use leads to soil acidification and compaction, undermining the long-term sustainability of tea cultivation. Thus, there is an urgent need to identify efficient and environmentally friendly phosphorus–potassium fertilizers to elevate soil phosphorus and potassium levels, meet the nutritional requirements of tea plants, and promote sustainable tea production.
Globally, approximately 95% of phosphorus and potassium reserves are bound in insoluble mineral forms such as apatite, feldspar, and mica [6,7], restricting transformation into plant-available forms. Plant growth-promoting rhizobacteria (PGPR) with dual phosphorus–potassium solubilization capabilities can enhance mineral weathering efficiency by secreting low molecular weight organic acids to chelate metal ions or enzymatically degrade mineral matrices [8,9], promoting the release of phosphorus and potassium elements. However, the acidic conditions, nutrient depletion, and competition from indigenous microorganisms in tea plantation soils restrict the survival and application efficacy of PGPR [10,11,12], necessitating urgent optimization strategies. Biochar, with its excellent physical structure and richness in organic matter and nutrients, can provide an effective protective space for PGPR. Therefore, the co-application of biochar-loaded PGPR with phosphorus- and potassium-bearing minerals not only addresses the limitations of PGPR utilization in soil but potentially overcomes the constraint of slow mineral dissolution rates.
The interactions among biochar, PGPR, minerals, and soil inherent attributes are dynamic [13,14]. Specifically, biochar induces alterations in soil physicochemical parameters, elevates soil pH, influences soil organic matter and cation exchange capacity, and enhances enzymatic activities [15,16]. Concurrently, organic acids and extracellular polymeric substances (EPS) secreted by microorganisms promote mineral bioweathering while releasing elements from minerals, further modifying the geochemical and mineralogical conditions of the surrounding soil [17,18]. Furthermore, the co-application of biochar and microorganisms significantly impacts soil bacterial community diversity, altering microbial community composition by increasing the relative abundance of beneficial bacterial genera such as Bacillus, Bacteroides, and Flavobacterium [19,20,21]. These bacteria not only solubilize phosphorus and potassium from minerals for plant uptake but also form complex interaction networks with phosphorus- and potassium-solubilizing bacteria, further influencing microbial metabolic capabilities and directions. However, the hierarchical significance of these environmental covariates, particularly the complex environmental changes induced by mineral addition, in driving phosphorus and potassium availability and their interaction pathways remain unclear. Systematically elucidating the environmental determinants influencing phosphorus and potassium bioavailability is critically important for sustainable nutrient management in tea plantations.
In this study, we hypothesized that the co-application of phosphorus- and potassium-bearing minerals, PGPR, and biochar can potentially enhance the availability of phosphorus and potassium in tea plantation soils by directly or indirectly influencing environmental factors. To test our hypothesis, the research aims to (1) evaluate the impact of a composite material, formulated from these constituents, on the growth of tea plants; (2) investigate how this composite material influences the accessibility of phosphorus and potassium in the tea-planting soil; and (3) employ RF analysis and PLS-SEM to pinpoint the crucial factors that contribute to the enhancement of soil phosphorus and potassium availability under the application of our composite material. Our research findings offer highly valuable insights into nutrient management within perennial cropping systems, demonstrating how biochar-supported rhizosphere engineering synergizes with microbial bioprocessing to overcome inherent mineral dissolution barriers. These results underscore the potential of bio-based solutions in promoting environmentally responsible agricultural practices, thereby advancing the field of sustainable agriculture and soil management.

2. Materials and Methods

2.1. Experiment Materials

In this study, a strain of Raoultella ornithinolytica P6 was utilized. The strain was originally isolated from the rhizosphere soil of cropland [22]. This particular strain was chosen for its remarkable capacity to decompose phosphorus- and potassium-bearing minerals, thereby enhancing the release and availability of these essential nutrients. The cultivation of Raoultella ornithinolytica P6 was conducted for a duration of 24 h at a temperature of 30 ± 1 °C in lysogeny broth (LB) liquid culture medium, resulting in a viable bacteria count of 7 × 10¹¹ Cfu mL−1.
The soil samples were collected from the top 20 cm depth of a typical tea plantation located in Mingshan County, Sichuan Province, China (coordinates: 30°10′34.3″ N, 103°17′53.5″ E), a region renowned globally for its exceptional tea production. The key properties of the soil are presented in Table 1.
The biochar utilized in this study was obtained from Zhejiang Yangtze River Delta Junong Technology Development Co., Ltd. (Shanghai, China). It was produced by pyrolyzing corn stalks (Zea mays L.) at 500 °C for 2 h in a nitrogen environment. This selection was grounded on our previous research findings, which highlighted its exceptional potential as a carrier for Raoultella ornithinolytica P6 [23]. Furthermore, recognizing that the ideal soil pH range is 4.5 to 5.5 for tea tree growth, as established by previous studies [24], we addressed the potential alkalinity issue of the biochar by subjecting it to a washing process using dilute hydrochloric acid. Specifically, the biochar was first immersed in 1 M HCl and oscillated for 24 h, after being filtered and washed with ultrapure water to neutral, and then dried at 60 °C [25]. The physicochemical properties of the treated biochar were analyzed and shown in Table 1.
Apatite and feldspar, serving as sources of phosphorus- and potassium-bearing minerals, were obtained from Shandong Qizhuo New Material Technology Co., Ltd. (Weifang, China) and Henan Platinum Casting Materials Co., Ltd. (Zhengzhou, China), respectively. Following the acquisition, the crushed minerals were sieved through a 200-mesh sieve (74 m), then mixed, shrunk, and compressed for X-ray fluorescence (XRF) analysis. The elemental composition of apatite (P2O5 33.82%) and feldspar (K2O 7.13%) are presented in Table S1, respectively.
The tea cultivar used in this context is “Fuding Bigwhite”, which adheres to national standards for green tea production.

2.2. Experimental Design

The pot experiment was conducted in a greenhouse at the Chengdu Campus of Sichuan Agricultural University, Chengdu, Sichuan Province, China (coordinates: 30°42′18.63″ N, 103°51′41.96″ E), lasting for 12 months (November 2021 to November 2022). The temperature ranged from 4 to 25 °C, and the relative humidity varied between 75 and 85%. The soil was air-dried, sieved to retain particles smaller than 4 mm, thoroughly homogenized, and subsequently packed into 23 × 21 cm pots, each containing 7 kg of soil. The pot experimental design encompassed nine treatments: (1) the original soil (CK); (2) conventional application of fertilizers (CF) with 160 kg hm−2 of P2O5 and K2O, respectively; (3) applications of biochar (B) at 1% of pot soil weight; (4) application of PGPR (P) at a concentration of 100 mL per pot (approximately 7 × 10¹¹ Cfu mL−1); (5) application of phosphorus- and potassium-bearing minerals (M) calibrated to match the phosphorus and potassium inputs of the CF treatment; (6) combinations of biochar with PGPR (BP); (7) application biochar with phosphorus- and potassium-bearing minerals (BM); (8) combinations of minerals with PGPR (PM); and (9) a comprehensive mix of all three amendments (BPM). Three replicates have been conducted for each, with three tea seedlings (approximately 30 cm in height) planted per pot. Biochar, PGPR, and conventional fertilizers were mixed with the soil at one time in November 2021. To maintain optimal nitrogen nutrition, each treatment received a standard supply of nitrogen fertilizer (urea, N 400 kg hm−2), with 60% administered as a winter base fertilizer and the remaining 40% evenly split between spring and summer applications for a two-week purification.

2.3. Plant and Soil Sample Collection

During the spring (21 March to 9 May 2022), summer (10 May to 19 July 2022), and autumn (20 July to 17 September 2022) tea seasons, fresh tea leaves consisting of one bud and two leaves were harvested weekly. The harvested leaves underwent a rigorous preprocessing regimen, including thorough cleaning under tap water, subsequent rinsing with distilled water to eliminate impurities, drying to remove excess moisture, microwave treatment for green killing, and finally achieving a constant weight prior to their utilization in the study.
To coincide with the distinct cultivation seasons, soil sampling was conducted specifically on 9 May 2022 (spring), 19 July 2022 (summer), and 17 September 2022 (autumn). To ensure the precision and representativeness of the samples, care was taken to avoid the roots of the tea seedlings. The soil samples were collected using the standardized five-point sampling method. In detail, a stainless steel soil auger (3.8 cm inner diameter) was employed to collect soil from 0 to 20 cm at five predetermined locations (the central point and four symmetrical peripheral points) [26]. Approximately 200 g of soil was extracted from each pot, ensuring a sufficient amount for subsequent analysis and experimentation.

2.4. Plant Analysis

Fresh tea leaves were dehydrated at 65 °C to a constant weight and then ground to a fine powder. This powder was then passed through a 100-mesh sieve. Phosphorus and potassium content in tea leaves (TP-L and TK-L, respectively) were analyzed by using the sieved tea granules digested with H2SO4-H2O2. Phosphorus content in the digested solution was quantitatively determined using a continuous flow analyzer, while potassium content was measured by flame photometry [27]. In order to reveal the mechanisms underlying the enhanced availability of phosphorus and potassium mediated by biochar, PGPR, and rock minerals, we evaluated the photosynthetic performance of tea plants on 17 September 2022, including the net photosynthetic rate (Pn), stomatal conductance (Gs), intercellular CO2 concentration (Ci), transpiration rate (Tr), and instantaneous water use efficiency (WUE). The photosynthetic attributes were assessed by employing the Li-6400XT portable photosynthetic instrument (manufactured by LI-COR in the United States). The light intensity was set at 1000 µmol m−2 s−1, temperature at 28 °C, and atmospheric CO2 concentrations were stable at 500 µmol mol−1. Water use efficiency (WUE) was calculated as the ratio of leaf photosynthesis and transpiration. The results were presented in Table S2 in Supplementary Materials.

2.5. Soil Chemical Properties Analysis

The soil’s chemical properties were assessed employing standardized protocols, as described by Lu [28]. Total phosphorus (TP) was quantified through perchloric acid digestion [29], whereas total potassium (TK) was extracted using a mixture of hydrofluoric acid, perchloric acid, and nitric acid. Available phosphorus (AP) was analyzed according to Olsen’s method, and available potassium (AK) was extracted with 1.0 mol L−1 neutral ammonium acetate [28]. Additionally, the soil pH was measured using a calibrated pH meter (Sartorius PB–10) with a soil-to-water ratio of 1:2.5 (w/v). Organic matter (OM) content was quantified via the potassium dichromate–sulfuric acid oxidation method [30]. The content of Alkaline Nitrogen (AN) was determined using the alkaline diffusion method and the Dumas nitrogen analyzer. Cation exchange capacity (CEC) was analyzed using 1 mol L−1 ammonium acetate (pH 7.0). The contents of exchangeable calcium (ExCa) and exchangeable magnesium (ExMg) were determined by atomic absorption flame photometry after extraction with ammonium acetate solution [28]. Furthermore, the forms of soil phosphorus, the abundance of phosphorus-solubilizing bacteria (PSB) and KSB, and a comprehensive examination of soil enzyme activities [31], specifically, sucrase, β-glucosidase, urease, acid phosphatase, and catalase, were conducted.

2.6. Microbial DNA Extraction, PCR Amplification, and Sequencing Analysis

Total genomic DNA was extracted from soil samples using the OMEGA Soil DNA Kit (D5635-02, Omega Bio-Tek, Norcross, GA, USA). The integrity of extracted DNA was assessed by 0.8% agarose gel electrophoresis, and DNA concentration was quantified using a Nanodrop spectrophotometer (Thermo Scientific, Waltham, MA, USA, NC2000). The hypervariable V3-V4 regions (468 bp) of the 16S rRNA gene were amplified using specific primers: 338F (5′-barcode+ACTCCTACGGGAGGCAGCA-3′) and 806R (5′-GGACTACHVGGGTWTCTAAT-3′). The PCR amplification was performed on an ABI 2720 thermal cycler (Applied Biosystems, Foster, CA, USA) with an initial denaturation at 98 °C for 5 min to ensure complete denaturation of template DNA, followed by amplification cycles. The PCR products were then subjected to 2% agarose gel electrophoresis, after which the target bands were excised and purified using the Axygen Gel Extraction Kit. Library preparation was performed using Illumina’s TruSeq Nano DNA LT Library Prep Kit, followed by paired-end sequencing (2 × 250 bp) on an Illumina NovaSeq platform (Illumina, San Diego, CA, USA) with the NovaSeq 6000 SP Reagent Kit (500 cycles) (Illumina, San Diego, CA, USA). The obtained sequences were clustered at a 100% similarity threshold to generate amplicon sequence variants (ASVs) and their abundance profiles. Using QIIME2 software (version 2019.4), this work calculated alpha diversity indices (Chao1, Shannon, and Simpson) for each sample and analyzed microbial community composition at six taxonomic levels: phylum, class, order, family, genus, and species.

2.7. Functional Gene Analysis of Pyrroloquinoline Quinone Biosynthesis Protein C (PqqC)

DNA was extracted using the Mag Beads Fast DNA Kit for Soil (116564384) (MP Biomedicals, Irvine, CA, USA). The extracted DNA was subjected to 0.8% agarose gel electrophoresis to assess the molecular size, followed by quantification using a Nanodrop NC2000 (Thermo Fisher Scientific, Waltham, MA, USA). The approximately 360 bp hypervariable region of the nifH functional gene was selected for sequencing. PCR amplification was performed using primers F: AACCGCTTCTACTACCAG and R: GCGAACAGCTCGGTCAG on an ABI 2720 PCR system with an initial denaturation at 98 °C for 5 min to ensure complete DNA template denaturation, followed by amplification cycles. The PCR products were separated by 2% agarose gel electrophoresis, and target bands were excised and purified using magnetic bead-based size selection. The PCR products were quantified using the Quant-iT PicoGreen dsDNA Assay Kit on a BioTek FLx800 microplate reader (Bio Tek Instruments Inc, Winooski, VT, USA), followed by pooling of samples according to the required sequencing depth per sample. Library preparation was performed using Illumina’s TruSeq Nano DNA LT Library Prep Kit, and paired-end sequencing (2 × 250 bp) was conducted on an Illumina NovaSeq platform using the NovaSeq 6000 SP Reagent Kit (500 cycles). Sequence data were processed using RDP FrameBot (https://github.com/rdpstaff/Framebot, accessed on 27 February 2023) with seed protein sequences of the target functional gene downloaded from the RDP database to correct insertion and deletion errors. An amino acid length filter threshold of 50 was applied, and de novo mode was enabled to incorporate qualified protein sequences meeting specific criteria into the reference database, while other parameters were kept as defaults. Following FrameBot analysis, sequences were aligned against nucleotide or protein sequences in the nt or nr databases, and annotation information was retrieved using the brocc.py script. Using QIIME2 (2019.4), alpha diversity indices (Chao1, Shannon, and Simpson) were calculated for non-rarefied OTUs by uniformly selecting 10 depth values between 95% of the minimum sequencing depth and the maximum depth, with 10 rarefactions performed at each depth. The average scores at the maximum rarefaction depth were used as the final alpha diversity indices. Additionally, taxonomic composition and abundance at six levels (phylum, class, order, family, genus, and species) were analyzed using QIIME2 (version 2019.4).

2.8. Statistical Analysis

All statistical analyses were performed using IBM SPSS Statistics 27 (IBM Corp, Armonk, NY, USA).The data are presented as mean ± standard deviation (SD) with a sample size of n = 3. To assess significant differences among treatment groups, an analysis of variance (ANOVA) was conducted at a significance level of p < 0.05. To identify the primary factors influencing AP and AK, we initially employed correlation heatmaps to screen for indicators significantly correlated with these parameters. Subsequently, we applied the R “Random Forest” package to quantify the relative importance of significant indicators on AP and AK by utilizing R version 4.2.1. Additionally, the “A3” package was utilized to assess the statistical significance of the model. Lastly, PLS-SEM was applied to explore the potential pathways that govern AP and AK, providing further insights into their underlying mechanisms. The ‘plspm’ package in R was used to carry out PLS-SEM analysis.

3. Results

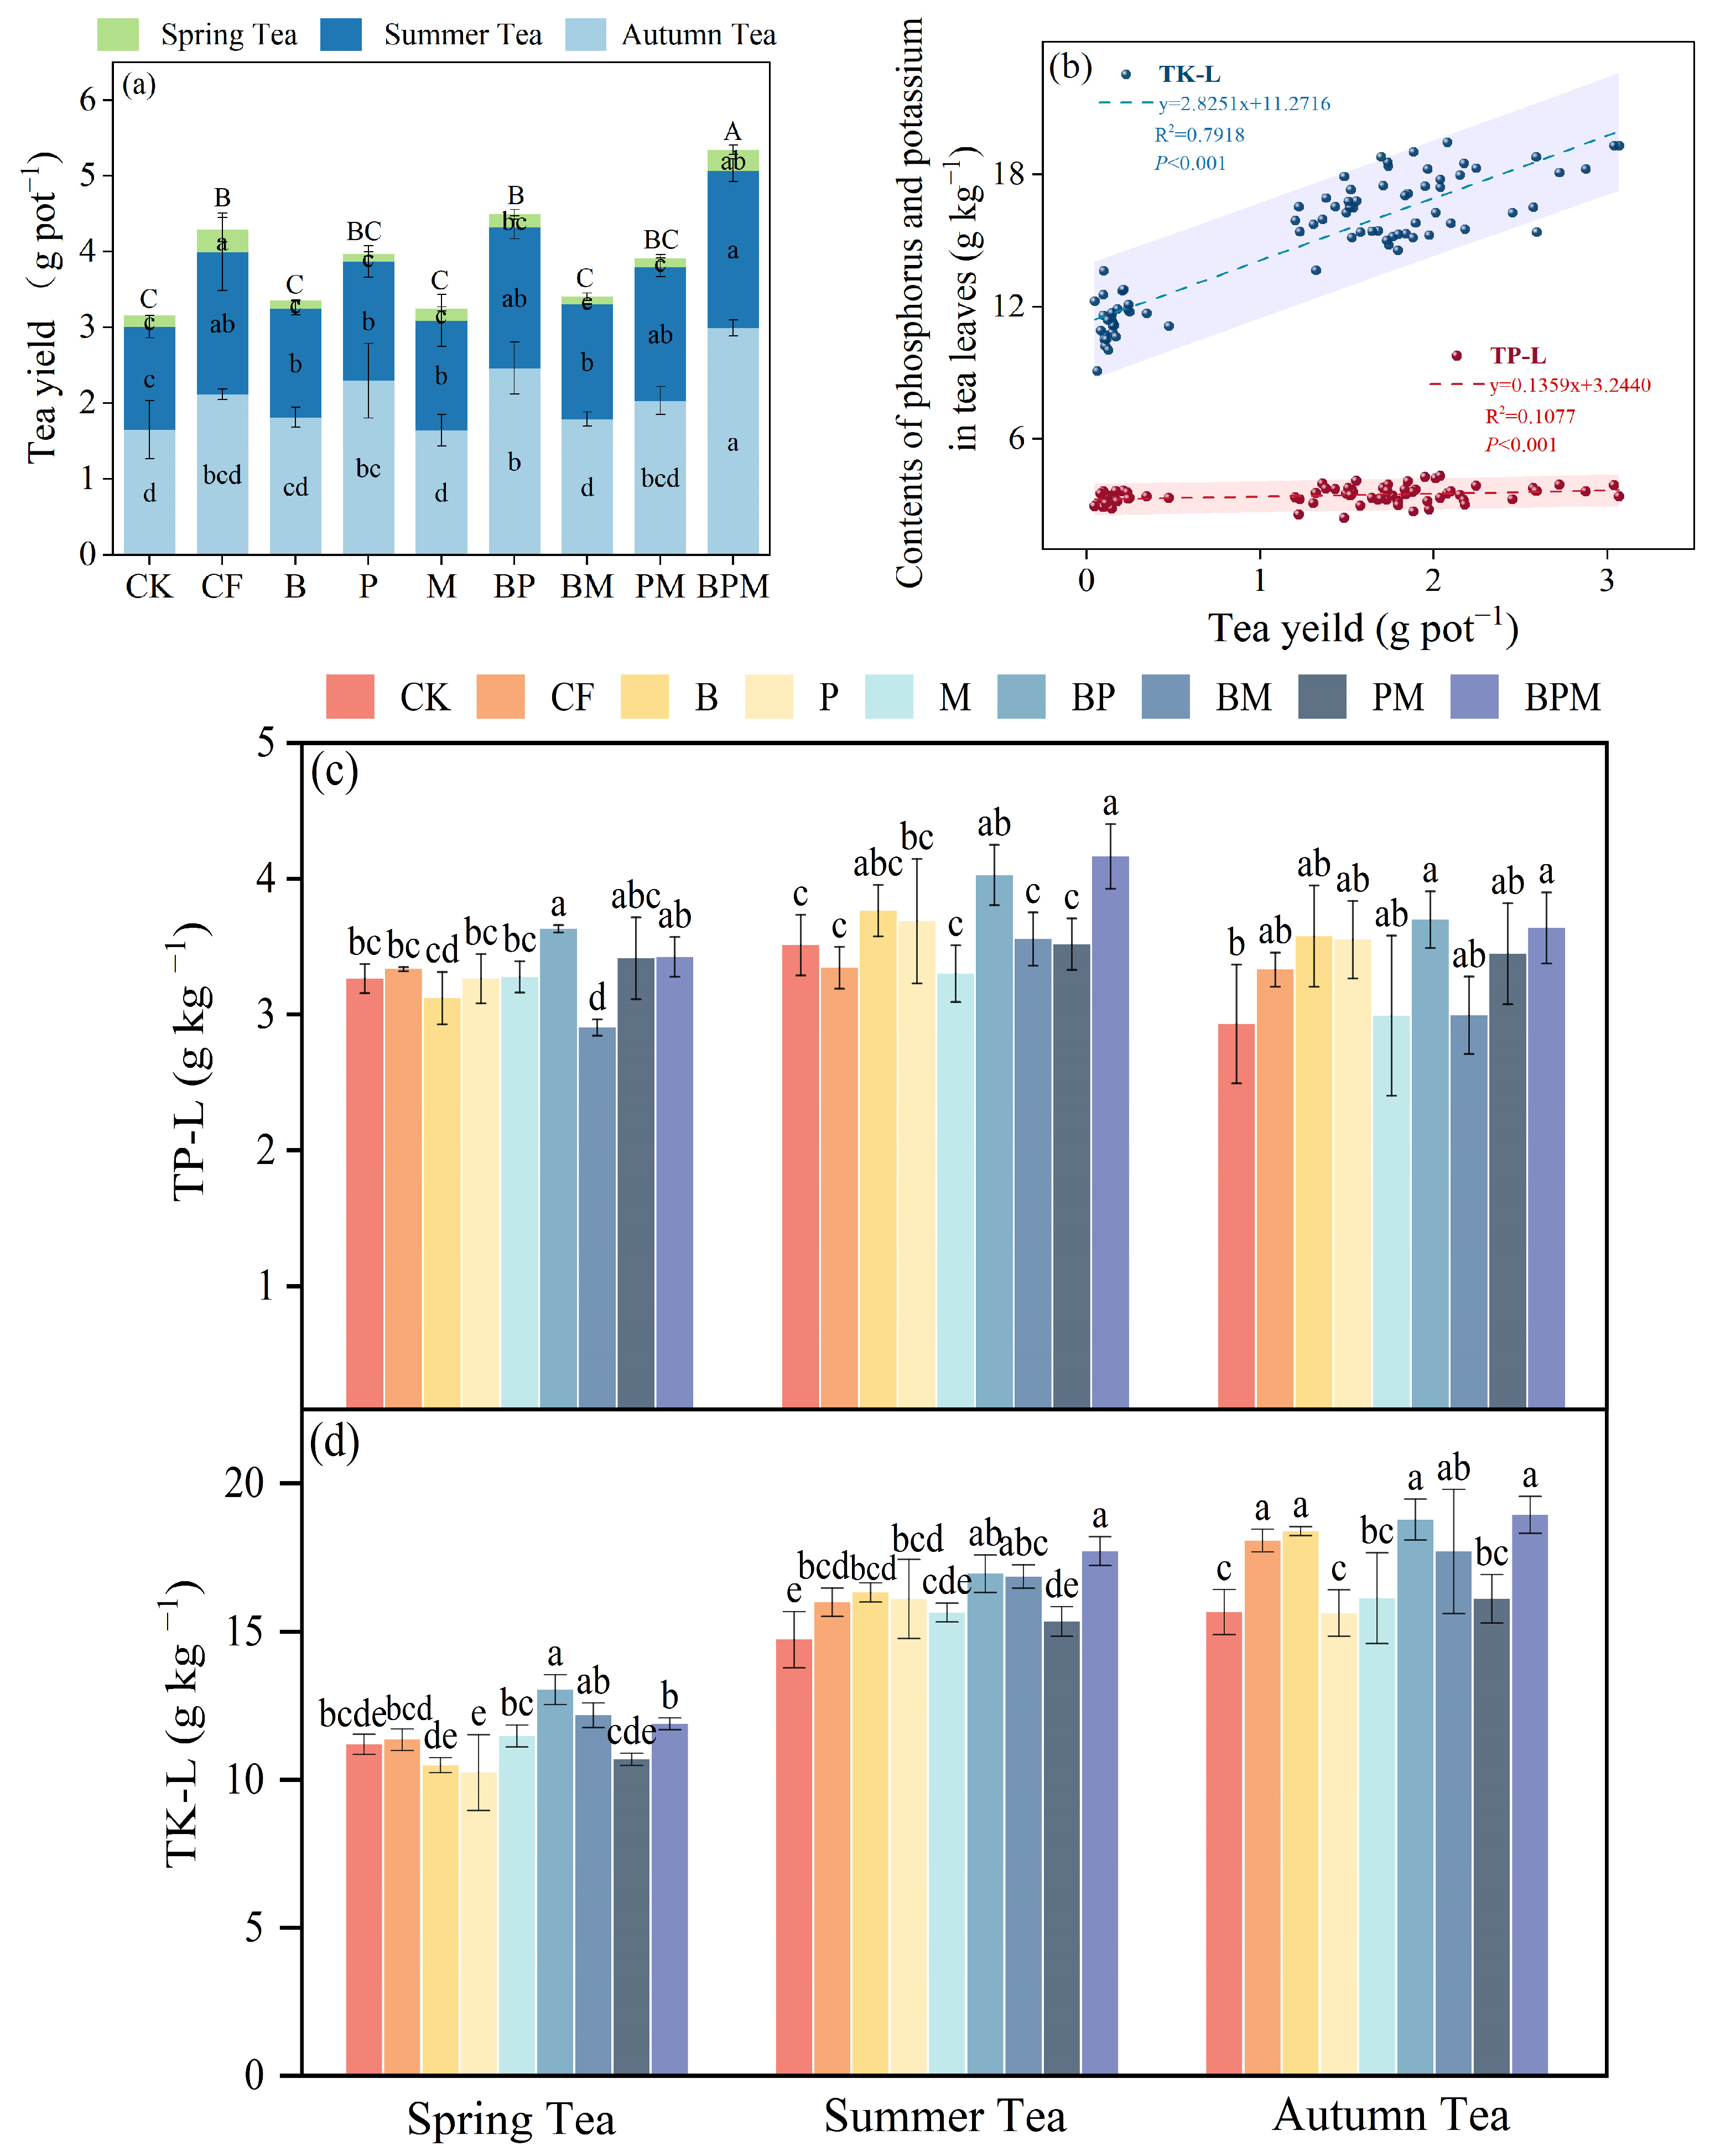
3.1. Tea Yield and Phosphorus and Potassium Content

Cumulative tea yield exhibited treatment-dependent variability (3.16–5.35 g pot−1), with biochar, PGPR, or mineral amendments generally stimulating tea growth relative to CK (Figure 1a). Notably, all amendments reduced spring tea yield compared to CF, likely reflecting transient adaptation to nutrient release patterns. The BPM treatment emerged as particularly effective during summer and autumn harvests, increasing yields by 10.75% (summer) and demonstrating consistent superiority in autumn. This temporal divergence suggests that conventional fertilization (CF) provides transient nutrient availability, whereas sustained P/K release from BP and BPM treatments better aligns with perennial tea phenology.
Regarding the phosphorus and potassium content in tea leaves, values ranged from 2.90 to 3.63 g kg−1 and 10.25 to 13.05 g kg−1, respectively. Compared with CK and CF, the BP, PM, and BPM treatments showed stable increases in TP-L, with increases of 2.37~8.87% over CF in the spring tea period, 5.30~24.52% in the summer tea period, and 3.40~10.85% in the autumn tea period (Figure 1c). For TK-L, BP and BPM treatments showed sustained increases, with increases of 14.86% and 4.73% over CF in the spring tea period, 6.04% and 10.83% in the summer tea period, and 3.88% and 4.76% in the autumn tea period, respectively (Figure 1d). These findings highlight the pronounced advantages of BP and BPM treatments in enhancing phosphorus and potassium content in tea leaves compared to other treatments. One-way ANOVA analysis revealed a statistically robust positive correlation between yield parameters and foliar P/K concentrations (Figure 1b), confirming the functional linkage between soil nutrient activation efficiency and tea plant nutritional status. These results demonstrate the multi-seasonal effectiveness of the synergistic mineral–microbe–biochar system in synchronizing nutrient release with plant demand rhythms, establishing a novel approach for sustained nutrient management in perennial cropping systems.

3.2. Soil Phosphorus and Potassium Availability

The experimental treatments induced distinct seasonal patterns in soil nutrient availability, with biochar-based composites demonstrating superior phosphorus and potassium activation capacity. Soil AP exhibited seasonal dynamics across treatments, ranging from 4.13 to 9.12 mg kg−1 (spring), 3.10–8.88 mg kg−1 (summer), to 3.02–9.43 mg kg−1 (autumn) (Figure 2a). While singular mineral or PGPR applications (P, M) reduced AP relative to CK in spring, the synergistic mineral–microbe–biochar composite (BPM) consistently outperformed chemical fertilizer (CF) across seasonal transitions. The biochar–PGPR combination (BP) selectively enhanced AP during the summer and autumn growth stages, revealing time-dependent activation mechanisms inherent to organic–inorganic interactions.
The various treatments significantly influenced soil AK content, as depicted in Figure 2b. In comparison to CK, both CF and biochar-based treatments (B, BP, BM, BPM) obviously increased soil AK levels across the tea seasons. Notably, treatment B, consisting solely of biochar, selectively enhanced AK in summer and autumn, whereas the combination of biochar and PGPR (BP) only increased AK during autumn. Interestingly, in autumn, the AK content of the biochar-based treatments did not significantly differ from that of CF. These findings explore the pivotal role of biochar in enhancing potassium availability in tea-planting soil.

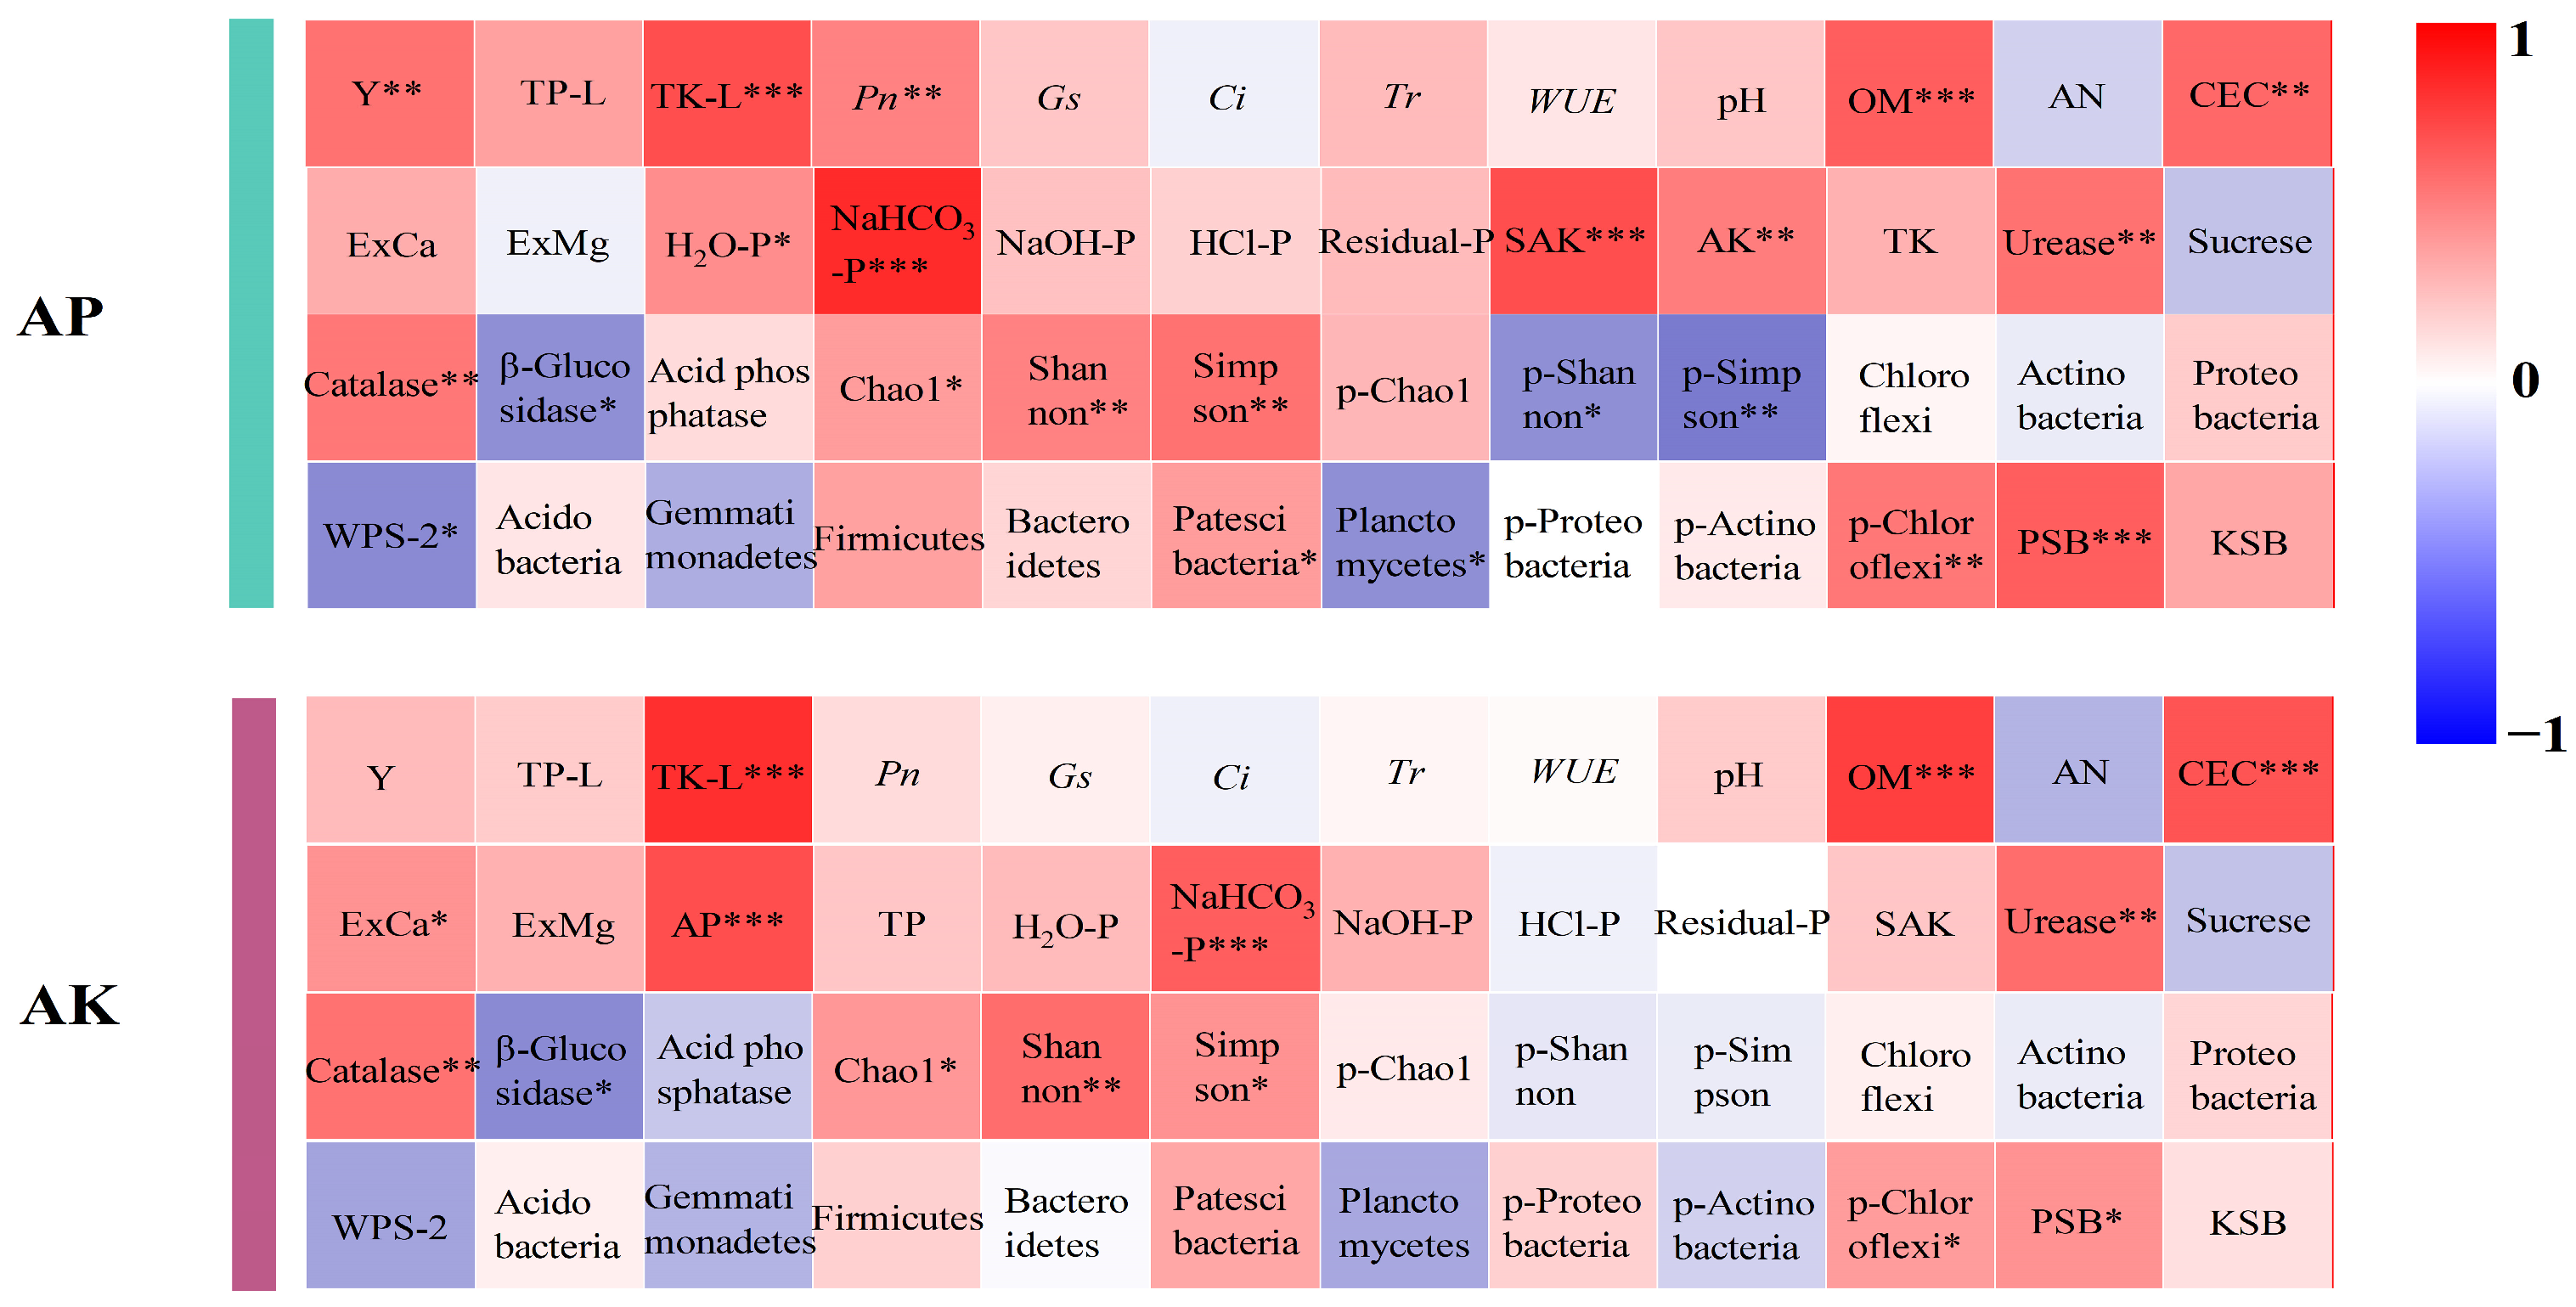
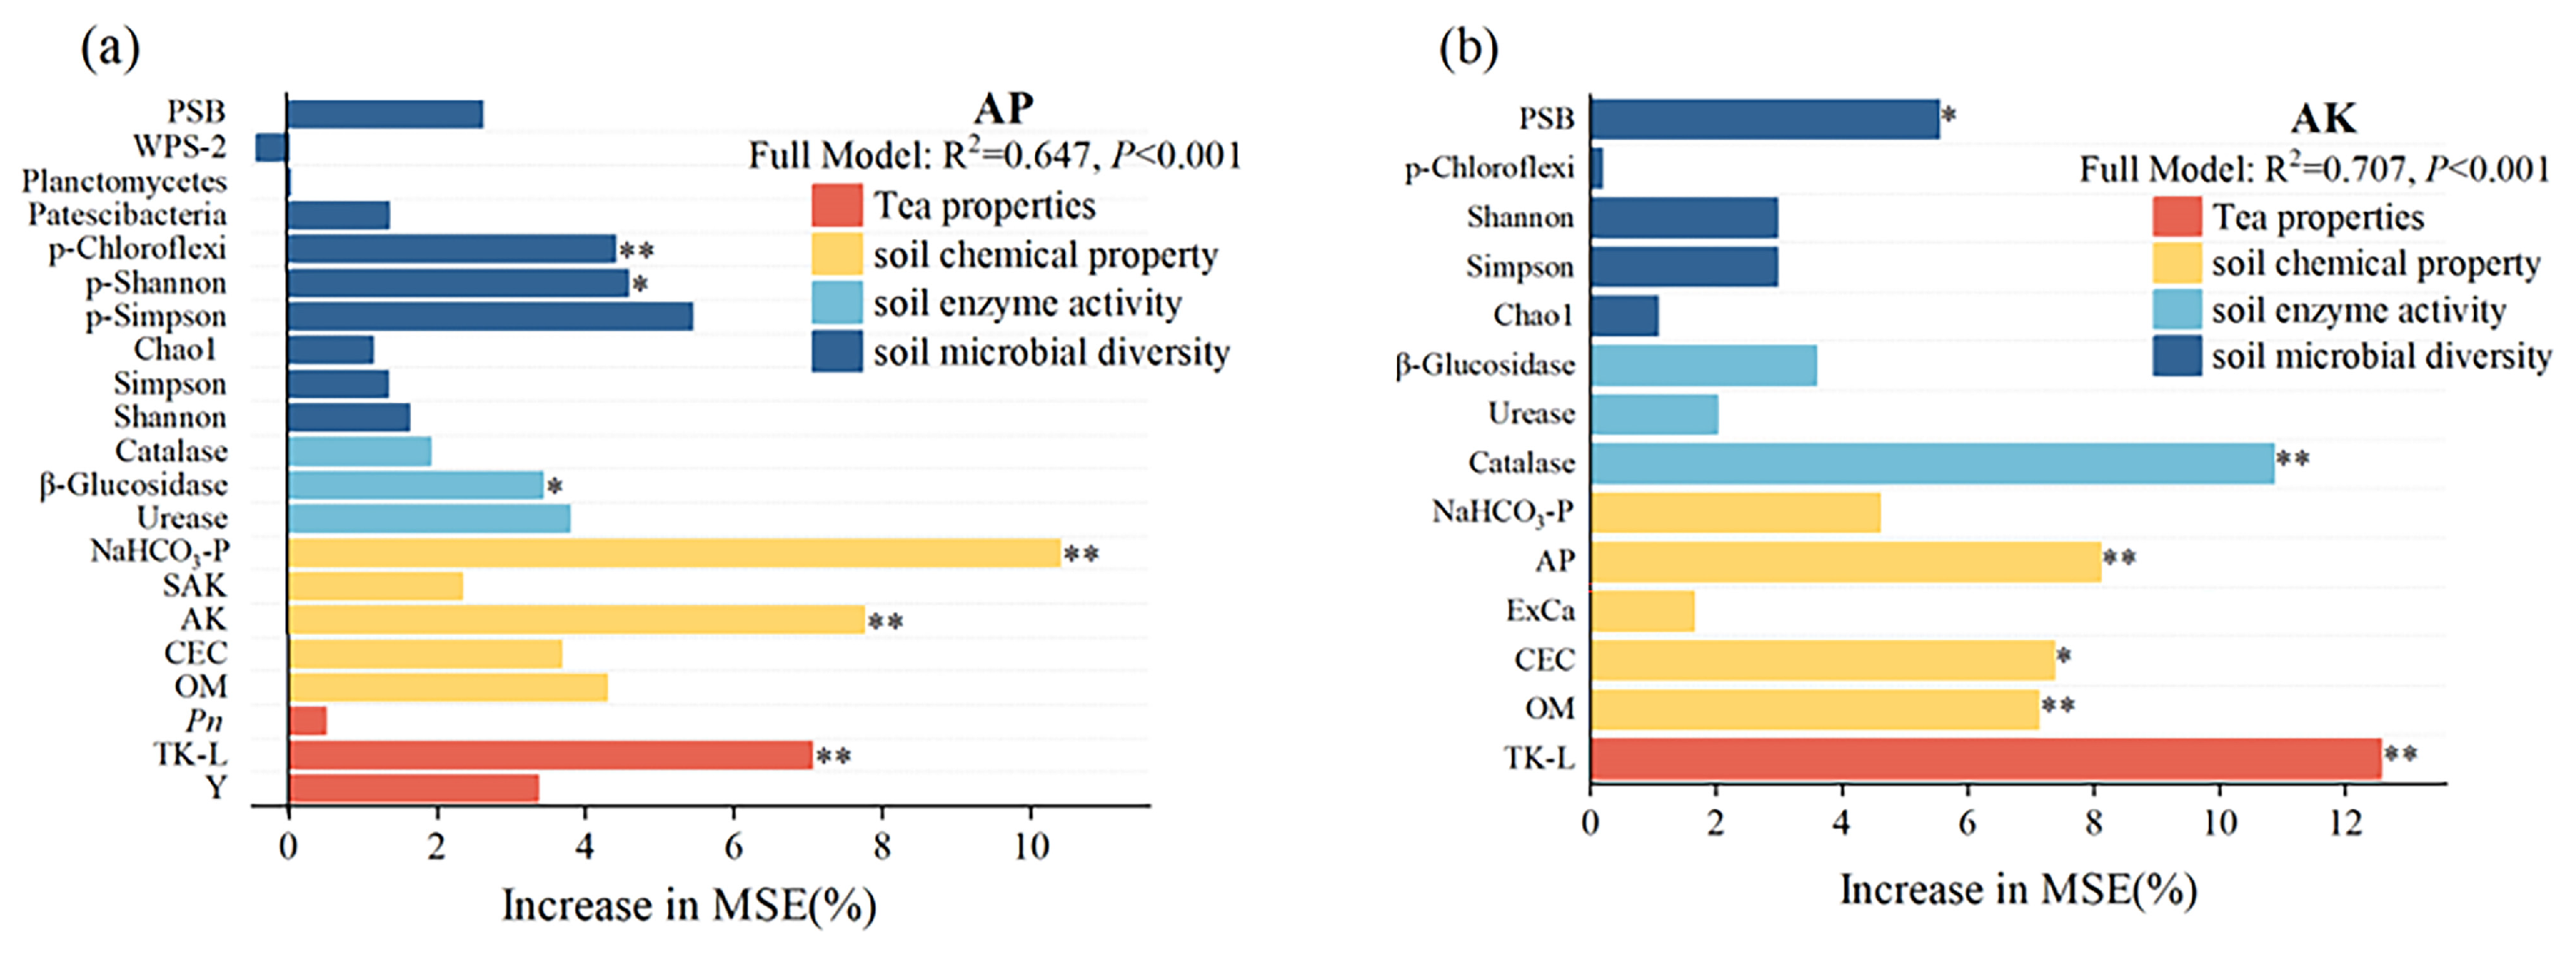
3.3. Effect of Soil Properties on the Availability of Soil Phosphorus and Potassium

In our analysis, a preliminary correlation assessment revealed a set of factors exhibiting either extremely significant (tea yield, TK-L, Pn, OM, CEC, NaHCO3-P, slowly available potassium, AK, the activities of urease and catalase, Shannon index, Simpson index, p-Simpson index, the relative abundance of p-Chloroflexi, the quantity of PSB) or significant (H2O-P, the activities of β-Glucosidase, Chao1 index, p-Shannon index, the relative abundance of WPS-2, Patescibacteria and Planctomycetes) correlations with AP (Figure 3). Based on this screening, RF analysis was employed to pinpoint the pivotal factors influencing AP (Figure 4a). The RF results highlighted NaHCO3-P as the foremost variable, with TK-L, AK, the activities of β-glucosidase, p-Shannon index, and p-Chloroflexi emerging as other critical predictors. Subsequently, we used these key predictive variables in a PLS-SEM framework to unravel the underlying pathways modulating AP (Figure 5a). Given that the α coefficient of the p-Shannon index falls significantly below 0.7, indicating a composite reliability value (CR index) for soil microorganisms that is less than 0.7, this metric has been excluded from our analysis. The PLS-SEM analysis indicated that AP is primarily governed by soil chemical attributes, NaHCO3-P and AK, alongside microbial characteristics encapsulated by p-Chloroflexi. Notably, soil chemistry exerts a direct and substantial positive influence on AP, with standardized path coefficients (pc) reaching 0.773 (p < 0.01; Figure 5b). Similarly, soil microbial characteristics directly and positively affect AP (pc = 0.246, p < 0.05). Furthermore, this model also illuminated a direct and robust positive effect of soil chemical properties on TK-L (pc = 0.696, p < 0.01), emphasizing the intricate interplay between soil chemistry, microbiology, and their cumulative implications for AP.
In terms of AK, the correlation analysis showed that TK-L, OM, CEC, AP, NaHCO3-P, the activities of urease and catalase, and the Shannon index had extremely significant associations with AK, whereas ExCa, the activities of β-Glucosidase, Chao 1, Simpson index, p-Chloroflexi, and the quantity of PSB exhibited significant correlations (Figure 3). Building upon this, RF results emphasized TK-L as the paramount variable, with the activities of catalase, OM, CEC, AP, and the quantity of PSB emerging as other crucial predictors (Figure 4b). The PLS-SEM outcomes indicated that AK is primarily and directly shaped by soil chemical properties, notably AP, CEC, and OM, with standardized path coefficients (pc) reaching 0.685 (p < 0.01; Figure 5c,d). In particular, the quantity of PSB exerts an indirect yet favorable influence on AK (indirect pc = 0.732) by modulating either soil chemical or enzyme attributes (the activity of catalase). TK-L, in particular, demonstrates a direct and positive effect on AK (pc = 0.454, p < 0.05), further underscoring its significance. Moreover, this model depicted a direct and positive impact of soil chemical properties on TK-L (pc = 0.794, p < 0.01), reinforcing the intricate network between soil chemistry, microbial characteristics, and their collective influence on AK.

4. Discussion

4.1. Co-Application of Biochar, PGPR, and Minerals Improved Tea Yield

Strategic fertilization in perennial tea cultivation requires innovative approaches to reconcile yield optimization with sustainable soil management [32]. Our study found that the individual application of biochar, PGPR, and minerals had positive effects on tea yield, but failed to achieve the yield potential attainable with chemical fertilizers (CF) (Figure 1a). This discrepancy may arise because chemical fertilizers, unlike phosphorus–potassium minerals and PGPR, supply rapidly available nutrients that can be immediately absorbed and utilized by plants after soil application. Bass et al.’s research similarly found that biochar alone had a limited increase in banana yield in the first year, aligning with our observations [33]. This may be due to the fact that biochar treatment enhanced leaf transpiration and reduced water use efficiency (Table S2). However, when evaluated across the entire growth period, the integrated application of biochar, PGPR, and phosphorus–potassium minerals (BPM) demonstrated superior efficacy in enhancing tea yield compared to other treatments. This superiority stems from the intricate interplay of complementary and synergistic mechanisms among the BPM components [9,34]. Specifically, the porous structure of biochar and its excellent electrical conductivity accelerate electron transfer rates, facilitating microbial adhesion to its surfaces and pores. Extracellular polymeric substances secreted by microorganisms act as bridging agents [35], forming chemical attractions and biofilms that induce bacterial adhesion to mineral surfaces [36,37]. This process enhances microbial activity and promotes mineral dissolution and nutrient release. The substantial increase in tea yield observed with BPM application is intimately linked to the enhanced nutrient acquisition capacity of tea plants [38]. Notably, Pn under BPM treatment was significantly higher than that of other treatments (p < 0.05) (Table S2). Importantly, the significant positive correlations among Pn, Gs, and Tr were further linked to tea yield enhancement, with Pn showing significant correlations with TP-L and TK-L (Figure S1). These relationships reveal the critical regulatory roles of these parameters in core physiological mechanisms, particularly photosynthesis and respiration. Specifically, elevated Gs and Tr facilitate enhanced CO2 and water vapor exchange between tea leaves and the external environment, which promotes greater accumulation of photosynthetic products, sustains the net photosynthetic rate of tea plants, and ultimately contributes to increased yield [39,40]. Collectively, the combined application of biochar, PGPR, and minerals demonstrates significant potential for sustainably improving tea production yields.

4.2. Co-Application of Biochar, PGPR, and Minerals Improves Phosphorus and Potassium Availability in Soil

This study delves into the synergistic effects of integrating biochar, PGPR, and phosphorus- and potassium-bearing minerals on soil nutrient dynamics, with a particular focus on AP and AK, two pivotal indicators of soil fertility. Notably, the biochar-amended treatments exhibited a more pronounced enhancement in AK compared to AP (Figure 2), a phenomenon that can be attributed to two key mechanisms. Firstly, biochar’s inherently higher potassium content relative to phosphorus, as evidenced in Table 1 and previous studies [41,42,43], makes it more effective in boosting soil AK levels, with some researchers even suggesting its potential to partially replace traditional potassium fertilizers [44]. Second, the propensity of phosphorus to form insoluble complexes with iron (Fe) and aluminum (Al) in acidic soils, resulting in Fe-P and Al-P formations that reduce phosphorus bioavailability [45], highlights the inherent challenges in enhancing AP through soil amendments alone. Intriguingly, the co-application of biochar, PGPR, and phosphorus- and potassium-bearing minerals (BPM) resulted in a less pronounced increase in AK compared to biochar alone or biochar with minerals. This finding may be attributed to the higher tea yield and potassium content achieved under BPM treatments (p < 0.05) (Figure 1a,b), indicating more efficient nutrient utilization rather than a mere accumulation in soil nutrient pools. In contrast, conventional fertilizer (CF) treatments, despite their short-term efficacy, exhibited a significant decline in soil AP and AK contents as tea trees matured, aligning with findings by Hu [46]. This explores the limitations of CF in sustaining long-term soil fertility. Conversely, BPM treatments maintained more stable AP and AK levels throughout the tea tree growth cycle, highlighting their potential for promoting sustainable tea cultivation. These findings collectively reveal the superiority of BPM strategies over CF in fostering sustainable tea production, offering a novel and integrated approach to soil nutrient management in tea plantations.

4.3. Key Factors Driving the Availability of Phosphorus and Potassium in Tea Plantations

The results of RF and PLS-SEM suggest that AP is primarily governed by soil chemical attributes, particularly NaHCO3-P and AK. NaHCO3-P, belonging to the labile phosphorus pool, is characterized by its rapid exchangeability with soil solution phosphorus, thereby facilitating efficient absorption and utilization by plant roots [47]. Given that potassium serves as a readily assimilated nutrient during plant growth stages and exhibits dynamic interactions with phosphorus that are closely associated with various plant physiological functions [48], potassium acts as a critical predictor of AP and exerts a direct positive effect on AP (Figure 4a and Figure 5a). Notably, our study further highlights that p-Chloroflexi exhibits strong positive effects on AP (Figure 5a,b), while microbial diversity indices (Shannon and Simpson) and the quantity of PSB also show substantial positive correlations with AP (Figure 3). P-Chloroflexi emerges as a pivotal predictor of AP with positive effects, as demonstrated by Chang et al.’s findings that Chloroflexi facilitates phosphorus availability by regulating phosphomonoesterase activity and creating favorable nutritional environments [49]. Additionally, a significant negative correlation is observed between β-glucosidase activity and AP. This may be because microorganisms, while decomposing soil organic matter, release extracellular enzymes to dissolve available phosphorus and immobilize it as microbial biomass phosphorus, thereby meeting their own metabolic demands and sustaining their physiological functions [50,51].
In delving deeper into the mechanisms governing AK dynamics in tea planting soils, the RF and PLS-SEM analyses underscored the extreme significance of soil chemical properties (OM, CEC, and AP) as primary determinants of AK content (Figure 5c,d). Notably, OM emerges as a pivotal player in maintaining the delicate balance of potassium within the soil matrix, augmenting its adsorptive capacity and mitigating losses [52,53]. The enrichment of OM fosters a favorable microbial environment, thereby accelerating potassium cycling and enhancing its overall bioavailability [54]. The direct and significant contribution of AP to AK illustrates the intricate interplay between nutrients in soil fertility. Phosphorus, by stimulating root proliferation, indirectly bolsters potassium uptake and utilization, highlighting the interdependence of these macronutrients [55]. Similarly, CEC emerges as a crucial predictor of AK, reflecting its pivotal role in regulating potassium content, transformation, and efficacy [56]. An increase in CEC translates to heightened soil adsorption capabilities, optimizing potassium’s effectiveness within the rhizosphere [57]. Moreover, our findings explore the pivotal role of soil microbial properties, particularly the quantity of PSB, in fine-tuning potassium nutrition. PSB not only modulates root exudate composition but also aids in solubilizing insoluble potassium forms, thereby enhancing plant uptake [58,59]. This microbial-mediated conversion highlights the intricacies of the soil–plant-microbe interface in regulating nutrient dynamics. Interestingly, TK-L (tea plant growth parameters) also emerges as a strong influential predictor of AK, directly and significantly impacting its availability. This illustrates the potential of plant growth indicators as proxies for assessing soil potassium status, reinforcing the interconnectedness of plant nutrition and soil health. The activity of catalase, as a soil enzyme, emerges as a key mediator influencing AK via its impact on soil chemistry. Its role in generating water and oxygen vital for microbial metabolism underscores the importance of microbial activity in maintaining potassium availability [60]. The strong positive correlations observed between soil microbial diversity indices and AK further validate the intricate relationship between microbial communities and potassium cycling in tea plantations.
This study primarily aimed to clarify how the co-application of phosphorus- and potassium-bearing minerals, PGPR, and biochar (BPM) enhances phosphorus and potassium availability in tea plantation soils through direct and indirect environmental interactions. Consequently, the experimental design relied on pot-controlled conditions, which inherently excluded field-scale investigations such as application rate optimization or economic feasibility analysis. These constraints limit the direct translation of our findings to practical agronomic operations, particularly in real-world farming systems with heterogeneous soil and climate conditions. Building on the confirmed efficacy of BPM in improving soil phosphorus and potassium availability, future research will focus on field validation and scalability assessment.

5. Conclusions

The study investigated the feasibility of augmenting tea tree growth and enhancing soil phosphorus and potassium availability through the synergistic effects of phosphorus- and potassium-bearing minerals, PGPR, and biochar. Our findings unmistakably demonstrate that the combined application of these amendments significantly enhances tea yield and the availability of both phosphorus and potassium in the soil, outperforming other treatment strategies. Through comprehensive analyses, including correlation analysis, random forest analysis, and structural equation modeling, we identified pivotal influencing factors that affect phosphorus and potassium availability. For phosphorus availability, factors such as p-Chloroflexi, β-Glucosidase, AK, NaHCO3-P, and TK-L were found to be significant. In the case of potassium availability, factors such as the quantity of PSB, the activity of catalase, AP, CEC, OM, and TK-L played crucial roles. These findings contribute to a more nuanced understanding of the drivers of phosphorus and potassium dynamics in tea plantations and offer valuable insights for future research and sustainable management practices aimed at optimizing nutrient availability and tea production quality. Although conventional fertilizers exhibit impressive performance in certain metrics, our results suggest the potential to explore optimal blends of biochar, PGPR, and minerals as partial replacements for chemical fertilizers. This emphasizes the importance of continued research to harness the full potential of these natural and sustainable amendments in enhancing soil fertility and tea productivity.

Supplementary Materials

The following supporting information can be downloaded at: https://www.mdpi.com/article/10.3390/agronomy15061287/s1, Table S1: The elemental composition of rock phosphorus and potassium minerals; Table S2: Photosynthetic characteristics of tea under different fertilization treatments; Figure S1: Correlations between tea photosynthetic indicators and tea yield and phosphorus and potassium content in tea leaves. TP-L, phosphorus content in tea leaves; TK-L, potassium content in tea leaves; Pn, Net photosynthetic rate; Gs, stomatal conductance; Ci, intercellular CO2 concentration; Tr, transpiration rate; WUE, instantaneous water use efficiency.

Author Contributions

Conceptualization, W.W., K.L. and C.L.; data Curation, W.W., C.L. and T.L.; formal analysis, L.L., J.X., T.L., Y.P., Y.J. and X.L.; funding acquisition, T.L.; investigation, S.W., L.L., Z.Z. and Y.P.; methodology, K.L., S.W., L.L., X.L. and G.W.; project administration, T.L. and X.X.; resources, T.L. and S.Z.; software, K.L., S.W., X.L. and G.W.; supervision, Z.Z., S.Z., Y.P., Y.J., X.X. and G.W.; validation, W.W., C.L., L.L., J.X., Z.Z. and Y.J.; visualization, S.W., T.L., S.Z., X.L. and X.X.; writing—original draft preparation, W.W., K.L. and C.L.; writing—review & editing, J.X., T.L., Z.Z., S.Z., Y.P., Y.J., X.L., X.X. and G.W. All authors have read and agreed to the published version of the manuscript.

Funding

This research was funded by the National Key Research and Development Program of China, grant number 2022YFD190140 and the Key Research and Development Projects of Sichuan Province, grant number 2021YFN0018.

Data Availability Statement

The original contributions presented in the study are included in the article and Supplementary Materials, further inquiries can be directed to the corresponding author.

Conflicts of Interest

The authors declare no conflicts of interest.

References

  1. Li, F.; Deng, X.; Huang, Z.; Zhao, Z.; Li, C.; Song, Q.; He, Y.; Niu, S. Integrated transcriptome and metabolome provide insights into flavonoid biosynthesis in ‘P113’, a new purple tea of Camellia tachangensis. Beverage Plant Res. 2023, 3, 3. [Google Scholar] [CrossRef]
  2. Moreira, J.; Aryal, J.; Guidry, L.; Adhikari, A.; Chen, Y.; Sriwattana, S.; Prinyawiwatkul, W. Tea Quality: An Overview of the Analytical Methods and Sensory Analyses Used in the Most Recent Studies. Foods 2024, 13, 3580. [Google Scholar] [CrossRef]
  3. Wang, Z.; Geng, Y.; Liang, T. Optimization of reduced chemical fertilizer use in tea gardens based on the assessment of related environmental and economic benefits. Sci. Total Environ. 2020, 713, 136439. [Google Scholar] [CrossRef]
  4. Ruan, L.; Li, X.; Song, Y.H.; Li, J.W.; Palansooriya, K.N. Effects of Tea Plant Varieties with High- and Low-Nutrient Efficiency on Nutrients in Degraded Soil. Plants 2023, 12, 905. [Google Scholar] [CrossRef]
  5. Tang, S.; Pan, W.K.; Tang, R.; Ma, Q.X.; Zhou, J.J.; Zheng, N.; Wang, J.; Sun, T.; Wu, L.H. Effects of balanced and unbalanced fertilisation on tea quality, yield, and soil bacterial community. Appl. Soil Ecol. 2022, 175, 104442. [Google Scholar] [CrossRef]
  6. Nishanth, D.; Biswas, D.R. Kinetics of phosphorus and potassium release from rock phosphate and waste mica enriched compost and their effect on yield and nutrient uptake by wheat (Triticum aestivum). Bioresour. Technol. 2008, 99, 3342–3353. [Google Scholar] [CrossRef]
  7. Basak, B.B.; Sarkar, B.; Maity, A.; Chari, M.S.; Banerjee, A.; Biswas, D.R. Low-grade silicate minerals as value-added natural potash fertilizer in deeply weathered tropical soil. Geoderma 2023, 433, 116433. [Google Scholar] [CrossRef]
  8. Jiang, B.; Long, C.M.; Xu, Y.; Han, L.Z. Molecular mechanism of Tsukamurella tyrosinosolvens strain P9 in response to root exudates of peanut. Arch. Microbiol. 2023, 205, 48. [Google Scholar] [CrossRef]
  9. Liu, M.W.; Liu, X.R.; Shi, Z.W.; Liu, L.; Fatima, M.; Wang, Z.G.; Li, Q.; Wang, Y.Y. Enhancement of the utilization of coal gangue as mineral fertilizers by the thermophilic bacterium. J. Environ. Chem. Eng. 2025, 13, 115850. [Google Scholar] [CrossRef]
  10. Kong, Z.Y.; Liu, H.G. Modification of Rhizosphere Microbial Communities: A Possible Mechanism of Plant Growth Promoting Rhizobacteria Enhancing Plant Growth and Fitness. Front. Plant Sci. 2022, 13, 920813. [Google Scholar] [CrossRef]
  11. Liu, W.B.; Tang, Y.X.; Ma, J.W.; Zhang, W.L.; Liao, S.Y.; Cui, S.Y.; Ye, Z.Q.; Liu, D. Effects of biochar and inorganic amendments on soil fertility, tea yield, and quality in both Pb-Cd-contaminated and acidified tea plantations. J. Soil. Sediment 2023, 23, 3275–3284. [Google Scholar] [CrossRef]
  12. Lin, S.X.; Liu, X.L.; Yan, Q.X.; Liang, G.Y.; Wang, D.P. Research on heavy metal enrichment and transportation in tea plant-soil systems of different varieties. Environ. Geochem. Health 2024, 46, 514. [Google Scholar] [CrossRef]
  13. Xia, H.; Riaz, M.; Tang, X.F.; Yan, L.; El-Desouki, Z.; Li, Y.X.; Wang, X.L.; Cuncang, J. Insight into mechanisms of biochar-fertilizer induced of microbial community and microbiology of nitrogen cycle in acidic soil. J. Environ. Manag. 2023, 336, 117602. [Google Scholar] [CrossRef] [PubMed]
  14. Lodi, L.A.; Klaic, R.; Bortoletto-Santos, R.; Ribeiro, C.; Farinas, C.S. Unveiling the Solubilization of Potassium Mineral Rocks in Organic Acids for Application as K-Fertilizer. Appl. Biochem. Biotech. 2022, 194, 2431–2447. [Google Scholar] [CrossRef]
  15. Huang, J.; Zhu, C.; Kong, Y.; Cao, X.; Zhu, L.; Zhang, Y.; Ning, Y.; Tian, W.; Zhang, H.; Yu, Y.; et al. Biochar Application Alleviated Rice Salt Stress via Modifying Soil Properties and Regulating Soil Bacterial Abundance and Community Structure. Agronomy 2022, 12, 409. [Google Scholar] [CrossRef]
  16. Wu, H.P.; Lai, C.; Zeng, G.M.; Liang, J.; Chen, J.; Xu, J.J.; Dai, J.; Li, X.D.; Liu, J.F.; Chen, M.; et al. The interactions of composting and biochar and their implications for soil amendment and pollution remediation: A review. Crit. Rev. Biotechnol. 2017, 37, 754–764. [Google Scholar] [CrossRef]
  17. Chen, Y.F.; Yang, H.; Shen, Z.Z.; Ye, J.R. Whole-Genome Sequencing and Potassium-Solubilizing Mechanism of Bacillus aryabhattai SK1-7. Front. Microbiol. 2022, 12, 722379. [Google Scholar] [CrossRef]
  18. Babar, S.; Baloch, A.; Qasim, M.; Wang, J.Y.; Wang, X.L.; Li, Y.X.; Khalid, S.; Jiang, C.C. Unearthing the soil-bacteria nexus to enhance potassium bioavailability for global sustainable agriculture: A mechanistic preview. Microbiol. Res. 2024, 288, 127885. [Google Scholar] [CrossRef]
  19. Yang, W.; Zhao, Y.; Yang, Y.; Zhang, M.; Mao, X.; Guo, Y.; Li, X.; Tao, B.; Qi, Y.; Ma, L.; et al. Co-application of biochar and microbial inoculants increases soil phosphorus and potassium fertility and improves soil health and tomato growth. J. Soil Sediment 2023, 23, 947–957. [Google Scholar] [CrossRef]
  20. Li, C.J.; Li, T.; Li, L.L.; Miao, L.; Wei, W.; Wang, Z.A. Effects of Potassium-Solubilizing Bacteria Loaded Biochar on Soil Enzyme Activity and Microbial Community Structure. Acta Pedol. Sin. 2023, 60, 1531–1542. [Google Scholar]
  21. Li, S.Q.; Chi, S.Q.; Lin, C.Q.; Cai, C.; Yang, L.H.; Peng, K.M.; Huang, X.F.; Liu, J. Combination of biochar and AMF promotes phosphorus utilization by stimulating rhizosphere microbial co-occurrence networks and lipid metabolites of Phragmites. Sci. Total Environ. 2022, 845, 157339. [Google Scholar] [CrossRef] [PubMed]
  22. Zhang, T.R.; Jin, W.; Li, T.; Wei, W.; Li, C.J.; Miao, L.; Li, L.L. Screening of affinity phosphate-solubilizing bacteria from typical purple soil and its growth promoting effect. Environ. Sci. Technol. 2021, 44, 21–26. [Google Scholar]
  23. Wei, W.; Li, T.; Zhang, T.R.; Jin, W.; Miao, L.; Li, C.J. Effect of Biochar lmmobilized Raoultella Ornithinolytica on the Availability of Phosphorus and Potassium in Purplish Soil. Chin. J. Soil. Sci. 2021, 52, 1330–1338. [Google Scholar]
  24. Yan, P.; Shen, C.; Zou, Z.H.; Fu, J.Y.; Li, X.; Zhang, L.P.; Zhang, L.; Han, W.Y.; Fan, L.C. Biochar stimulates tea growth by improving nutrients in acidic soil. Sci. Hortic. 2021, 283, 110078. [Google Scholar] [CrossRef]
  25. Chen, L.; Hu, J.; He, Y.; Wang, H.; Deng, Q.; Mi, B.; Wu, F. Microwave-assisted pyrolysis of waste lignin to prepare biochar for Cu2+ highly-efficient adsorption: Performance, kinetics and mechanism resolution. Sep. Purif. Technol. 2024, 342, 127070. [Google Scholar] [CrossRef]
  26. Shi, C.T.; Peng, J.Y.; Huang, Y.; He, B.; Wang, X.L.; Gu, M.H. Effects of Soil Amendments on Soil Zn and Pb Bioavailability and Their Accumulation in Maize. SW Chin. J. Agric. Sci. 2015, 28, 1689–1696. [Google Scholar]
  27. Wang, H.D.; Wu, L.F.; Wang, X.K.; Zhang, S.H.; Cheng, M.H.; Feng, H.; Fan, J.L.; Zhang, F.C.; Xiang, Y.Z. Optimization of water and fertilizer management improves yield, water, nitrogen, phosphorus and potassium uptake and use efficiency of cotton under drip fertigation. Agric. Water Manag. 2021, 245, 106662. [Google Scholar] [CrossRef]
  28. Lu, R. Methods of Soil Agricultural Chemical Analysis; China Agricultural Science and Technology Press: Beijing, China, 2000. [Google Scholar]
  29. Yang, C.; Chen, Y.T.; Sun, W.Y.; Zhang, Q.; Diao, M.M.; Sun, J. Extreme soil salinity reduces N and P metabolism and related microbial network complexity and community immigration rate. Environ. Res. 2025, 264, 120361. [Google Scholar] [CrossRef]
  30. Walkley, A.; Black, I.A. An examination of the degtjareff method for determining soil organic matter, and a proposed modification of the chromic acid titration method. Soil. Sci. 1934, 37, 29–38. [Google Scholar] [CrossRef]
  31. Sial, T.A.; Shaheen, S.M.; Lan, Z.; Korai, P.K.; Ghani, M.I.; Khan, M.N.; Syed, A.-u.-A.; Hussain Asghar Ali, M.N.; Rajpar, I.; Memon, M.; et al. Addition of walnut shells biochar to alkaline arable soil caused contradictory effects on CO2 and N2O emissions, nutrients availability, and enzymes activity. Chemosphere 2022, 293, 133476. [Google Scholar] [CrossRef]
  32. Tang, S.; Zhou, J.J.; Pan, W.K.; Sun, T.; Liu, M.J.; Tang, R.; Li, Z.J.; Ma, Q.X.; Wu, L.H. Effects of combined application of nitrogen, phosphorus, and potassium fertilizers on tea (Camellia sinensis) growth and fungal community. Appl. Soil Ecol. 2023, 181, 104661. [Google Scholar] [CrossRef]
  33. Bass, A.M.; Bird, M.I.; Kay, G.; Muirhead, B. Soil properties, greenhouse gas emissions and crop yield under compost, biochar and co-composted biochar in two tropical agronomic systems. Sci. Total Environ. 2016, 550, 459–470. [Google Scholar] [CrossRef] [PubMed]
  34. Zhang, M.Y.; Riaz, M.; Liu, B.; Xia, H.; El-desouki, Z.; Jiang, C.C. Two-year study of biochar: Achieving excellent capability of potassium supply via alter clay mineral composition and potassium-dissolving bacteria activity. Sci. Total Environ. 2020, 717, 137286. [Google Scholar] [CrossRef]
  35. Ajeng, A.A.; Abdullah, R.; Ling, T.C.; Ismail, S. Adhesion of Bacillus salmalaya and Bacillus amyloliquefaciens oil palm kernel shell biochar: A physicochemical approach. J. Environ. Chem. Eng. 2022, 10, 107115. [Google Scholar] [CrossRef]
  36. Zhang, S.N.; Wang, J.H. Removal of chlortetracycline from water by Bacillus cereus immobilized on Chinese medicine residues biochar. Environ. Technol. Innov. 2021, 24, 101930. [Google Scholar] [CrossRef]
  37. Sun, T.; Miao, J.B.; Saleem, M.; Zhang, H.N.; Yang, Y.; Zhang, Q.M. Bacterial compatibility and immobilization with biochar improved tebuconazole degradation, soil microbiome composition and functioning. J. Hazard. Mater. 2020, 398, 122941. [Google Scholar] [CrossRef]
  38. Zhang, S.X.; Li, F.M.; Chang, L.Y.; Zhang, Q.Y.; Zhang, Z.Y.; Wu, T.C.; Wu, Y.L.; Wang, Z.; Su, Y.L.; Yang, X.Y.; et al. Broad-spectrum applications of plant growth-promoting rhizobacteria (PGPR) across diverse crops and intricate planting systems. Microbiol. Spectr. 2025, 13, e01879-24. [Google Scholar] [CrossRef]
  39. Li, X.; Aharnmed, G.J.; Li, Z.X.; Zhang, L.; Wei, J.P.; Yan, P.; Zhang, L.P.; Han, W.Y. Freezing stress deteriorates tea quality of new flush by inducing photosynthetic inhibition and oxidative stress in mature leaves. Sci. Hortic. 2018, 230, 155–160. [Google Scholar] [CrossRef]
  40. Leakey, A.D.B.; Ferguson, J.N.; Pignon, C.P.; Wu, A.; Jin, Z.N.; Hammer, G.L.; Lobell, D.B. Water Use Efficiency as a Constraint and Target for Improving the Resilience and Productivity of C3 and C4 Crops. Annu. Rev. Plant Biol. 2019, 70, 781–808. [Google Scholar] [CrossRef] [PubMed]
  41. Hossain, M.Z.; Bahar, M.M.; Sarkar, B.; Donne, S.W.; Ok, Y.S.; Palansooriya, K.N.; Kirkham, M.B.; Chowdhury, S.; Bolan, N. Biochar and its importance on nutrient dynamics in soil and plant. Biochar 2020, 2, 379–420. [Google Scholar] [CrossRef]
  42. Bilias, F.; Kalderis, D.; Richardson, C.; Barbayiannis, N.; Gasparatos, D. Biochar application as a soil potassium management strategy: A review. Sci. Total Environ. 2023, 858, 159782. [Google Scholar] [CrossRef] [PubMed]
  43. Kabir, E.; Kim, K.H.; Kwon, E.E. Biochar as a tool for the improvement of soil and environment. Front. Environ. Sci. 2023, 11, 1324533. [Google Scholar] [CrossRef]
  44. Xiu, L.Q.; Gu, W.Q.; Sun, Y.Y.; Wu, D.; Wang, Y.N.; Zhang, H.G.; Zhang, W.M.; Chen, W.F. The fate and supply capacity of potassium in biochar used in agriculture. Sci. Total Environ. 2023, 902, 165969. [Google Scholar] [CrossRef]
  45. Gai, S.; Liu, B.; Lan, Y.B.; Han, L.; Hu, Y.X.; Dongye, G.; Cheng, K.; Liu, Z.Q.; Yang, F. Artificial humic acid coated ferrihydrite strengthens the adsorption of phosphate and increases soil phosphate retention. Sci. Total Environ. 2024, 915, 169870. [Google Scholar] [CrossRef] [PubMed]
  46. Hu, W.; Zhang, Y.P.; Rong, X.M.; Zhou, X.; Fei, J.C.; Peng, J.W.; Luo, G.W. Biochar and organic fertilizer applications enhance soil functional microbial abundance and agroecosystem multifunctionality. Biochar 2024, 6, 3. [Google Scholar] [CrossRef]
  47. Kunito, T.; Hiruta, N.; Miyagishi, Y.; Sumi, H.; Moro, H. Changes in phosphorus fractions caused by increased microbial activity in forest soil in a short-term incubation study. Chem. Spec. Bioavailab. 2018, 30, 9–13. [Google Scholar] [CrossRef]
  48. Kawamura, K.; Mackay, A.D.; Tuohy, M.P.; Betteridge, K.; Sanches, I.D.; Inoue, Y. Potential for spectral indices to remotely sense phosphorus and potassium content of legume-based pasture as a means of assessing soil phosphorus and potassium fertility status. Int. J. Remote Sens. 2011, 32, 103–124. [Google Scholar] [CrossRef]
  49. Chang, Y.; Wu, Z.; Peñuelas, J.; Sardans, J.; Chen, Y.; Jiang, F.; Wang, F. Organic management improves soil P availability via increasing inorganic P solubilization in tea plantations. Environ. Technol. Innov. 2025, 39, 104223. [Google Scholar] [CrossRef]
  50. Pan, C.C.; Liu, C.A.; Zhao, H.L.; Wang, Y. Changes of soil physico-chemical properties and enzyme activities in relation to grassland salinization. Eur. J. Soil. Biol. 2013, 55, 13–19. [Google Scholar] [CrossRef]
  51. Waring, B.G.; Averill, C.; Hawkes, C.V. Differences in fungal and bacterial physiology alter soil carbon and nitrogen cycling: Insights from meta-analysis and theoretical models. Ecol. Lett. 2013, 16, 887–894. [Google Scholar] [CrossRef]
  52. He, W.M.; Chen, F. Evaluating Status Change of Soil Potassium from Path Model. PLoS ONE 2013, 8, e76712. [Google Scholar] [CrossRef]
  53. Zhou, D.J.; Mou, R.; Wang, L.H.; Liu, J.R.; Tang, Y.X.; Chen, J.; Hedenec, P.; Xu, Z.F.; Tan, B.; Cui, X.L.; et al. Fertilization effects on soil organic matter chemistry. Soil Tillage Res. 2025, 246, 106346. [Google Scholar] [CrossRef]
  54. Zhang, M.Y.; Riaz, M.; Xia, H.; Li, Y.X.; Wang, X.L.; Jiang, C.C. Four-year biochar study: Positive response of acidic soil microenvironment and citrus growth to biochar under potassium deficiency conditions. Sci. Total Environ. 2022, 813, 152515. [Google Scholar] [CrossRef] [PubMed]
  55. Pérez-Fernández, M.; Míguez-Montero, A.; Valentine, A. Phosphorus and Nitrogen Modulate Plant Performance in Shrubby Legumes from the Iberian Peninsula. Plants 2019, 8, 334. [Google Scholar] [CrossRef]
  56. Bamagoos, A.A.; Alharby, H.F.; Belal, E.E.; Khalaf, A.E.A.; Abdelfattah, M.A.; Rady, M.M.; Ali, E.F.; Mersal, G.A.M. Phosphate-Solubilizing Bacteria as a Panacea to Alleviate Stress Effects of High Soil CaCO3 Content in Phaseolus vulgaris with Special Reference to P-Releasing Enzymes. Sustainability 2021, 13, 7063. [Google Scholar] [CrossRef]
  57. He, L.L.; Zhao, J.; Yang, S.M.; Zhou, H.; Wang, S.Q.; Zhao, X.; Xing, G.X. Successive biochar amendment improves soil productivity and aggregate microstructure of a red soil in a five-year wheat-millet rotation pot trial. Geoderma 2020, 376, 114570. [Google Scholar] [CrossRef]
  58. Chen, J.Q.; Zhao, G.Y.; Wei, Y.H.; Dong, Y.H.; Hou, L.Y.; Jiao, R.Z. Isolation and screening of multifunctional phosphate solubilizing bacteria and its growth-promoting effect on Chinese fir seedlings. Sci. Rep. 2021, 11, 9081. [Google Scholar] [CrossRef]
  59. Han, M.; Zhu, X.Y.; Ruan, C.J.; Wu, H.Q.; Chen, G.W.; Zhu, K.; Liu, Y.; Wang, G. Micro-biophysical interactions at bacterium-mineral interfaces determine potassium dissolution. Environ. Technol. Innov. 2024, 33, 103524. [Google Scholar] [CrossRef]
  60. Wang, G.S.; Gao, Q.; Yang, Y.F.; Hobbie, S.E.; Reich, P.B.; Zhou, J.Z. Soil enzymes as indicators of soil function: A step toward greater realism in microbial ecological modeling. Glob. Change Biol. 2022, 28, 1935–1950. [Google Scholar] [CrossRef]
Figure 1. Effects of fertilization treatments on tea yield, phosphorus and potassium uptake by tea leaves, and their linear relationships. (a) Tea yield, (b) Linear correlations between contents of phosphorus and potassium in tea leaves and tea yield, (c) Contents of phosphorus in tea leaves, (d) Contents of potassium in tea leaves. The shaded areas of different colors in the Figure 1b represent 95% confidence intervals. Capital letters represent significant differences (p < 0.05) of the cumulative amount among different fertilization treatments, and lowercase letters represent within-period treatment differences (p < 0.05).
Agronomy 15 01287 g001
Figure 2. Content of soil available phosphorus (a) and available potassium (b) under different fertilization treatments. Different lowercase letters represent significant differences between different treatments during the same tea period (p < 0.05).
Agronomy 15 01287 g002
Figure 3. Correlation analysis of soil environmental factors and tea tree growth indicators with soil available phosphorus (AP) and potassium (AK). Y, tea yield; TP-L and TK-L, phosphorus and potassium content in tea leaves; Pn, Net photosynthetic rate; Gs, stomatal conductance; Ci, intercellular CO2 concentration; Tr, transpiration rate; WUE, instantaneous water use efficiency; OM, organic matter; AN, alkali nitrogen; CEC, cation exchange capacity; ExCa, exchangeable calcium; ExMg, exchangeable magnesium; TP, total phosphorus; H2O-P, water extracted phosphorus; NaHCO3-P, NaHCO3 extracted phosphorus; NaOH-P, NaOH extracted phosphorus; HCl-P, HCl extracted phosphorus; Residual-P, Residual phosphorus; SAK, slowly available potassium; TK, total potassium; P-Chao1, Chao1 index of pqqc functional gene microbiota; P-Shannon, Shannon index of pqqc functional gene microbiota; P-Simpson, Simpson index of pqqc functional gene microbiota; P-Proteobacteria, Proteobacteria of pqqc functional genes; P-Actinobacteria, Actinobacteria of pqqc functional genes; P-Chloroflexi, Chloroflexi of pqqc functional genes; PSB, quantity of soil phosphate solubilizing bacteria; KSB, quantity of soil potassium solubilizing bacteria. Significance levels are as follows: * p < 0.05, ** p < 0.01 and *** p < 0.001.
Agronomy 15 01287 g003
Figure 4. The importance of predictors to soil available phosphorus (AP, (a)) and potassium (AK, (b)). Higher MSE (mean squared error) values imply more importance of the predictors. Significance levels are as follows: * p < 0.05 and ** p < 0.01.
Agronomy 15 01287 g004
Figure 5. The effects of tea growth, soil chemical properties, enzyme activity, and bacterial diversity on available phosphorus (AP, (a)) and potassium (AK, (c)). Each box represents a set of observed or potential variables. The blue and red arrows represent the positive and negative currents of causal relationships, respectively. Significance levels are as follows: * p < 0.05, ** p < 0.01. The bar chart represents the direct, indirect, and overall standardized effects of the variance separation of the AP (b) and AK (d) being explained.
Agronomy 15 01287 g005
Table 1. The key properties of soil and biochar utilized in the experiment.
ItemspHTotal Carbon
(g kg−1)
Organic Matter
(g kg−1)
Total Nitrogen
(g kg−1)
Total Phosphorus
(g kg−1)
Total Potassium
(g kg−1)
Available Phosphorus
(mg kg−1)
Available Potassium
(mg kg−1)
Soil4.20-9.920.380.1712.256.7145.97
Biochar7.21751.46-0.731.246.26169.745365.47
Disclaimer/Publisher’s Note: The statements, opinions and data contained in all publications are solely those of the individual author(s) and contributor(s) and not of MDPI and/or the editor(s). MDPI and/or the editor(s) disclaim responsibility for any injury to people or property resulting from any ideas, methods, instructions or products referred to in the content.

