Article

A Multimodal Parallel Transformer Framework for Apple Disease Detection and Severity Classification with Lightweight Optimization

1
China Agricultural University, Beijing 100083, China
2
School of International Education and Exchange, Beijing Sport University, Beijing 100084, China
*
Author to whom correspondence should be addressed.
These authors contributed equally to this work.
Agronomy 2025, 15(5), 1246; https://doi.org/10.3390/agronomy15051246
Submission received: 20 April 2025 / Revised: 15 May 2025 / Accepted: 19 May 2025 / Published: 21 May 2025

Abstract

:
One of the world’s most important economic crops, apples face numerous disease threats during their production process, posing significant challenges to orchard management and yield quality. To address the impact of complex disease characteristics and diverse environmental factors on detection accuracy, this study proposes a multimodal parallel transformer-based approach for apple disease detection and classification. By integrating multimodal data fusion and lightweight optimization techniques, the proposed method significantly enhances detection accuracy and robustness. Experimental results demonstrate that the method achieves an accuracy of 96%, precision of 97%, and recall of 94% in disease classification tasks. In severity classification, the model achieves a maximum accuracy of 94% for apple scab classification. Furthermore, the continuous frame diffusion generation module enhances the global representation of disease regions through high-dimensional feature modeling, with generated feature distributions closely aligning with real distributions. Additionally, by employing lightweight optimization techniques, the model is successfully deployed on mobile devices, achieving a frame rate of 46 FPS for efficient real-time detection. This research provides an efficient and accurate solution for orchard disease monitoring and lays a foundation for the advancement of intelligent agricultural technologies.

1. Introduction

Apples are among the most widely cultivated fruits worldwide, playing a significant role in economic development and social stability [1]. Globally, apple cultivation covers over 4.8 million hectares, with an annual production exceeding 86 million tons. China leads global production, accounting for approximately 45% of the total output, with over 3 million hectares under cultivation and a production value surpassing USD 35 billion annually [2]. However, apple diseases cause substantial losses. According to recent estimates, disease-related yield losses can reach 20–30% in unmanaged orchards, with quality-related losses further reducing market value by up to 50% in severely affected regions [3,4]. With the challenges posed by climate change, expanded cultivation areas, and increasingly complex farming environments, apple trees, Malus domestica (Suckow) (Rosales: Rosaceae), are increasingly threatened by a variety of fungal diseases that significantly reduce both yield and quality. These diseases not only result in direct economic losses but also facilitate the spread of pathogens, disrupting orchard ecosystems. Consequently, accurate and efficient apple disease detection technologies are critical for sustaining production and improving economic efficiency [4]. Major apple diseases include apple scab (Venturia inaequalis, Pleosporales: Venturiaceae), which produces olive-black lesions on leaves and fruit surfaces, leading to early defoliation and deformed fruits; black rot (Botryosphaeria obtusa, Botryosphaeriales: Botryosphaeriaceae), which infects branches, leaves, and fruits, causing frog-eye leaf spots and dry, rotted fruit tissue; gray mold (Botrytis cinerea, Helotiales: Sclerotiniaceae), which mainly attacks maturing fruit under humid conditions, resulting in soft rot and fuzzy gray mycelium; apple rot (primarily Penicillium expansum, Eurotiales: Trichocomaceae), a postharvest pathogen that causes blue-green mold on wounded fruits and produces patulin, a toxic mycotoxin; powdery mildew (Podosphaera leucotricha, Erysiphales: Erysiphaceae), which affects young leaves, buds, and shoots, forming a white powdery coating and reducing photosynthetic capacity; and anthracnose (Colletotrichum gloeosporioides, Glomerellales: Glomerellaceae), which can infect twigs, leaves, and fruits, causing sunken lesions and fruit rot [5,6]. However, significant challenges remain in detecting these diseases [7,8], as shown in Figure 1. First, some diseases exhibit highly similar phenotypic characteristics; for example, apple scab and black rot both manifest as black spots on leaves and fruits but require entirely different control strategies [3]. Second, disease co-occurrence is common—gray mold and apple rot frequently appear simultaneously during fruit maturation in humid conditions, accelerating decay. Third, the same disease can exhibit varied phenotypes across different regions and climates, hindering the effectiveness of conventional models in heterogeneous environments. Lastly, apple diseases often manifest in multi-angle and multi-organ symptoms that cannot be fully captured from single-view images, limiting the accuracy of automated grading systems and overall diagnostic reliability.
In recent years, Transformer architectures have demonstrated strong modeling capabilities and adaptability in the field of computer vision, emerging as promising alternatives to conventional convolutional neural networks (CNNs). Since the introduction of Vision Transformer (ViT) [9], which models images as sequences of fixed-size patches using self-attention, Transformer-based models have rapidly gained prominence in visual understanding tasks. ViT achieved comparable or superior performance to CNNs on large-scale datasets such as ImageNet-21k. However, due to its lack of inductive biases—such as locality and translation invariance—ViT requires significant data and computational resources, making it less suitable for small-scale or resource-constrained scenarios. To address these limitations, Swin Transformer [10] introduced a hierarchical architecture with shifted window-based self-attention, enabling multi-scale feature learning and improved contextual modeling with better efficiency. Segformer [11] further advanced the design by coupling a lightweight encoder with a multi-level decoder, striking a balance between structural simplicity and high segmentation accuracy. These architectural evolutions have made Transformer-based networks increasingly practical for dense prediction tasks. Alongside these developments, researchers have also explored parallel and multi-branch Transformer structures to enhance representation flexibility. Traditional visual Transformers generally rely on serial stacking of attention layers, which may limit the diversity of captured features and effective receptive field expansion. To mitigate these issues, Dual-Path Transformer [12] and CrossViT [13] introduced dual-branch and cross-scale mechanisms that independently process complementary features across different spatial resolutions or semantic levels before fusion. Parallel structures not only support feature diversity but also offer modularity and scalability, which are advantageous for multi-task learning and heterogeneous input modalities. Concurrently, the field has witnessed rapid progress in multimodal representation learning, particularly in tasks involving heterogeneous inputs such as images, text, and sensor data. Early-stage fusion methods typically relied on feature concatenation or shallow attention modules. More recently, contrastive learning frameworks such as CLIP [14] and ALIGN [15] have aligned visual and linguistic embeddings in shared latent spaces at scale. BEiT-3 [16] extended this idea by unifying vision, language, and structural data under a shared Transformer backbone, enabling semantic transfer across modalities. MMFormer [17] and Uni-Perceiver [18] proposed unified backbones capable of handling multiple input types through token-type adaptation, significantly improving generality and modality flexibility. However, few existing parallel Transformer architectures are tailored for multi-granular modeling of fine-grained agricultural targets, and most multimodal methods assume synchronized, noise-free input streams, which limits their applicability in field settings.
Traditional apple disease detection methods primarily rely on manual observation and basic image processing techniques. While manual detection can incorporate expert knowledge for intuitive judgment, it is labor-intensive, subjective, and unsuitable for large-scale orchard applications. Manual detection also exhibits significant limitations in distinguishing similar diseases, such as apple scab and black rot, leading to frequent misdiagnoses or omissions [19]. To improve detection efficiency, traditional image processing techniques have been employed, extracting features such as lesion color, shape, and texture for classification [20,21,22]. However, these methods have shown insufficient accuracy when faced with similar diseases, failing to meet practical production requirements [23,24]. With the rapid development of computer vision and deep learning technologies, increasing efforts have been made to apply machine learning and deep learning to agricultural disease detection [25]. For example, convolutional neural networks (CNNs) and their variants have achieved significant progress in disease recognition, improving detection automation and accuracy [26,27]. Mohit Agarwal proposed a simplified CNN model with eight hidden layers, achieving 98.4% accuracy on the PlantVillage dataset, which includes 39 crop categories such as apples, potatoes, maize, and grapes. Shrestha introduced a CNN-based plant disease detection method that used image processing techniques to analyze sample images and evaluate time complexity and infection region size, achieving a test accuracy of 88.80% across 12 diseases [28]. Zhang et al. developed the transformer-based TinySegformer for pest detection and compared it with the CNN-based Fully Convolutional Network (FCN), reporting a precision of 0.92 for TinySegformer compared to 0.81 for FCN, a difference of 0.11 [29]. These findings suggest that CNN models struggle to capture overlapping global features and fine details, showing sensitivity to input image quality and limitations in distinguishing similar diseases in complex environments. Transformer models, with their superior global feature extraction capabilities, have gained popularity in vision tasks and demonstrated promising potential for recognizing diverse phenotypic features under various environmental conditions in agricultural disease detection [30,31]. Borhani et al. employed a lightweight Vision transformer (ViT) for real-time automated plant disease classification across three resolutions— 50 × 50 , 100 × 100 , and 200 × 200 —achieving the best performance at 200 × 200 , with an accuracy of 0.99 on Model 1, while 100 × 100 and 50 × 50 achieved 0.98 and 0.97, respectively [32]. Guo et al. proposed a convolutional Swin transformer for plant disease degree and type recognition, achieving accuracies of 0.909 and 0.922 in natural environments and 0.975 in controlled conditions [33]. Multimodal data further enhance disease detection by integrating environmental sensor data, such as temperature, humidity, and light intensity, to capture regional and climatic influences on disease incidence, improving detection robustness [34]. Patle et al. developed a Long Short-Term Memory (LSTM)-based model using soil temperature (ST), relative humidity (RH), and ambient temperature (AT) for plant disease prediction, achieving a 96% accuracy with precision, recall, and F1-scores of 97%, 98%, and 99%, respectively [35]. Despite the progress achieved through deep learning and transformer-based models, existing detection methods still face critical limitations in real-world agricultural scenarios. Many models struggle to distinguish morphologically similar diseases such as apple scab and black rot, particularly under variable lighting, partial occlusions, or inconsistent viewing angles. Moreover, they often lack robustness against phenotypic variability caused by regional and climatic differences [36], resulting in poor generalization across orchard environments. While environmental sensor data provide valuable context, current multimodal approaches seldom account for asynchronous, noisy signals affected by factors such as strong light, rainfall, or sensor drift. Most rely on static fusion strategies and lack mechanisms for dynamic alignment or denoising, which compromises data reliability and downstream detection performance. These challenges highlight the absence of a unified, adaptive framework that can jointly address fine-grained disease differentiation, environmental variability, and real-world acquisition constraints.
To address these challenges, a multimodal apple disease detection and grading method based on parallel transformers is proposed, integrating image and sensor data through innovative network architectures and automated data acquisition workflows. This approach addresses key challenges as follows:
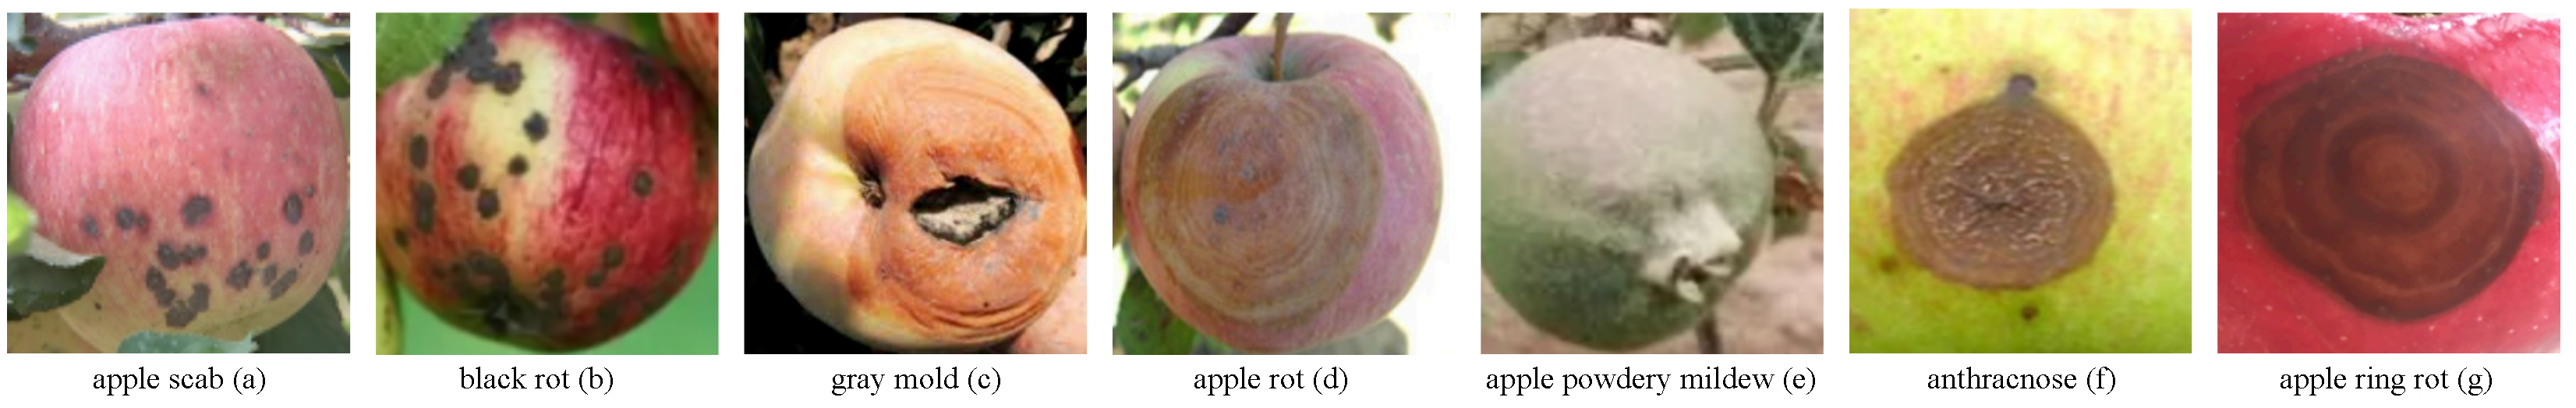
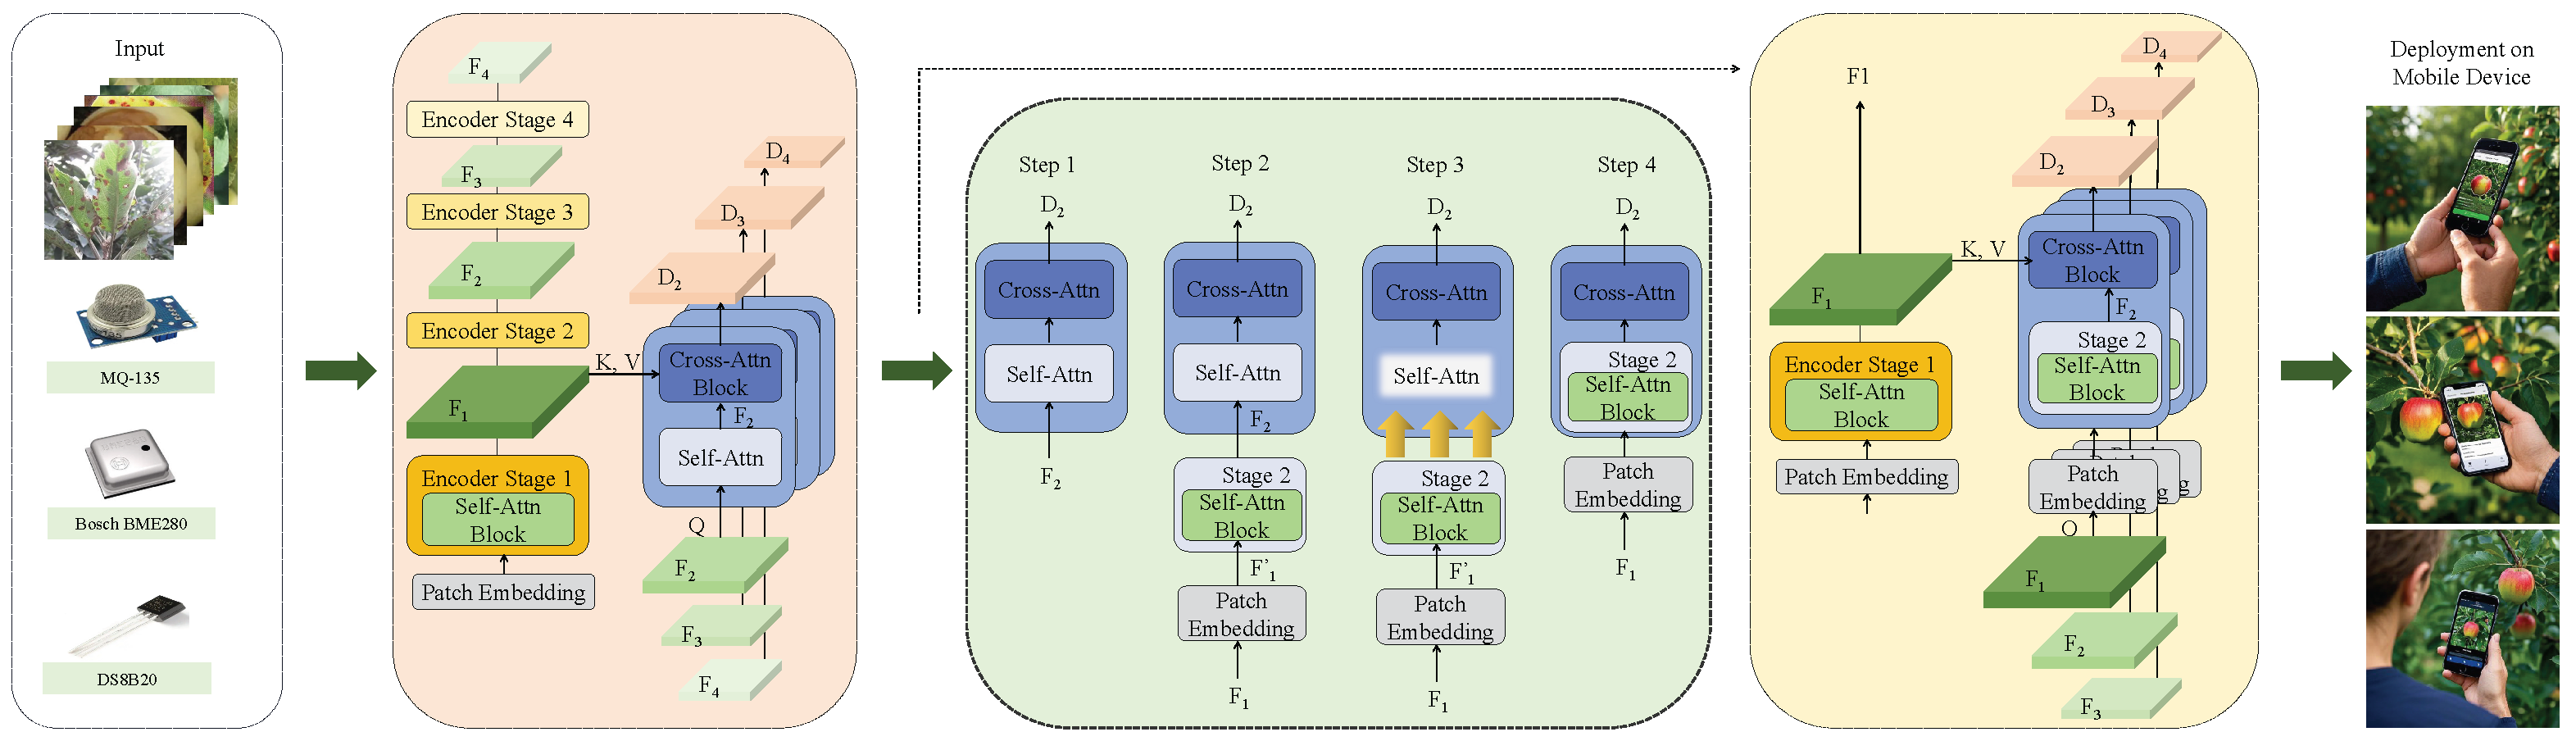
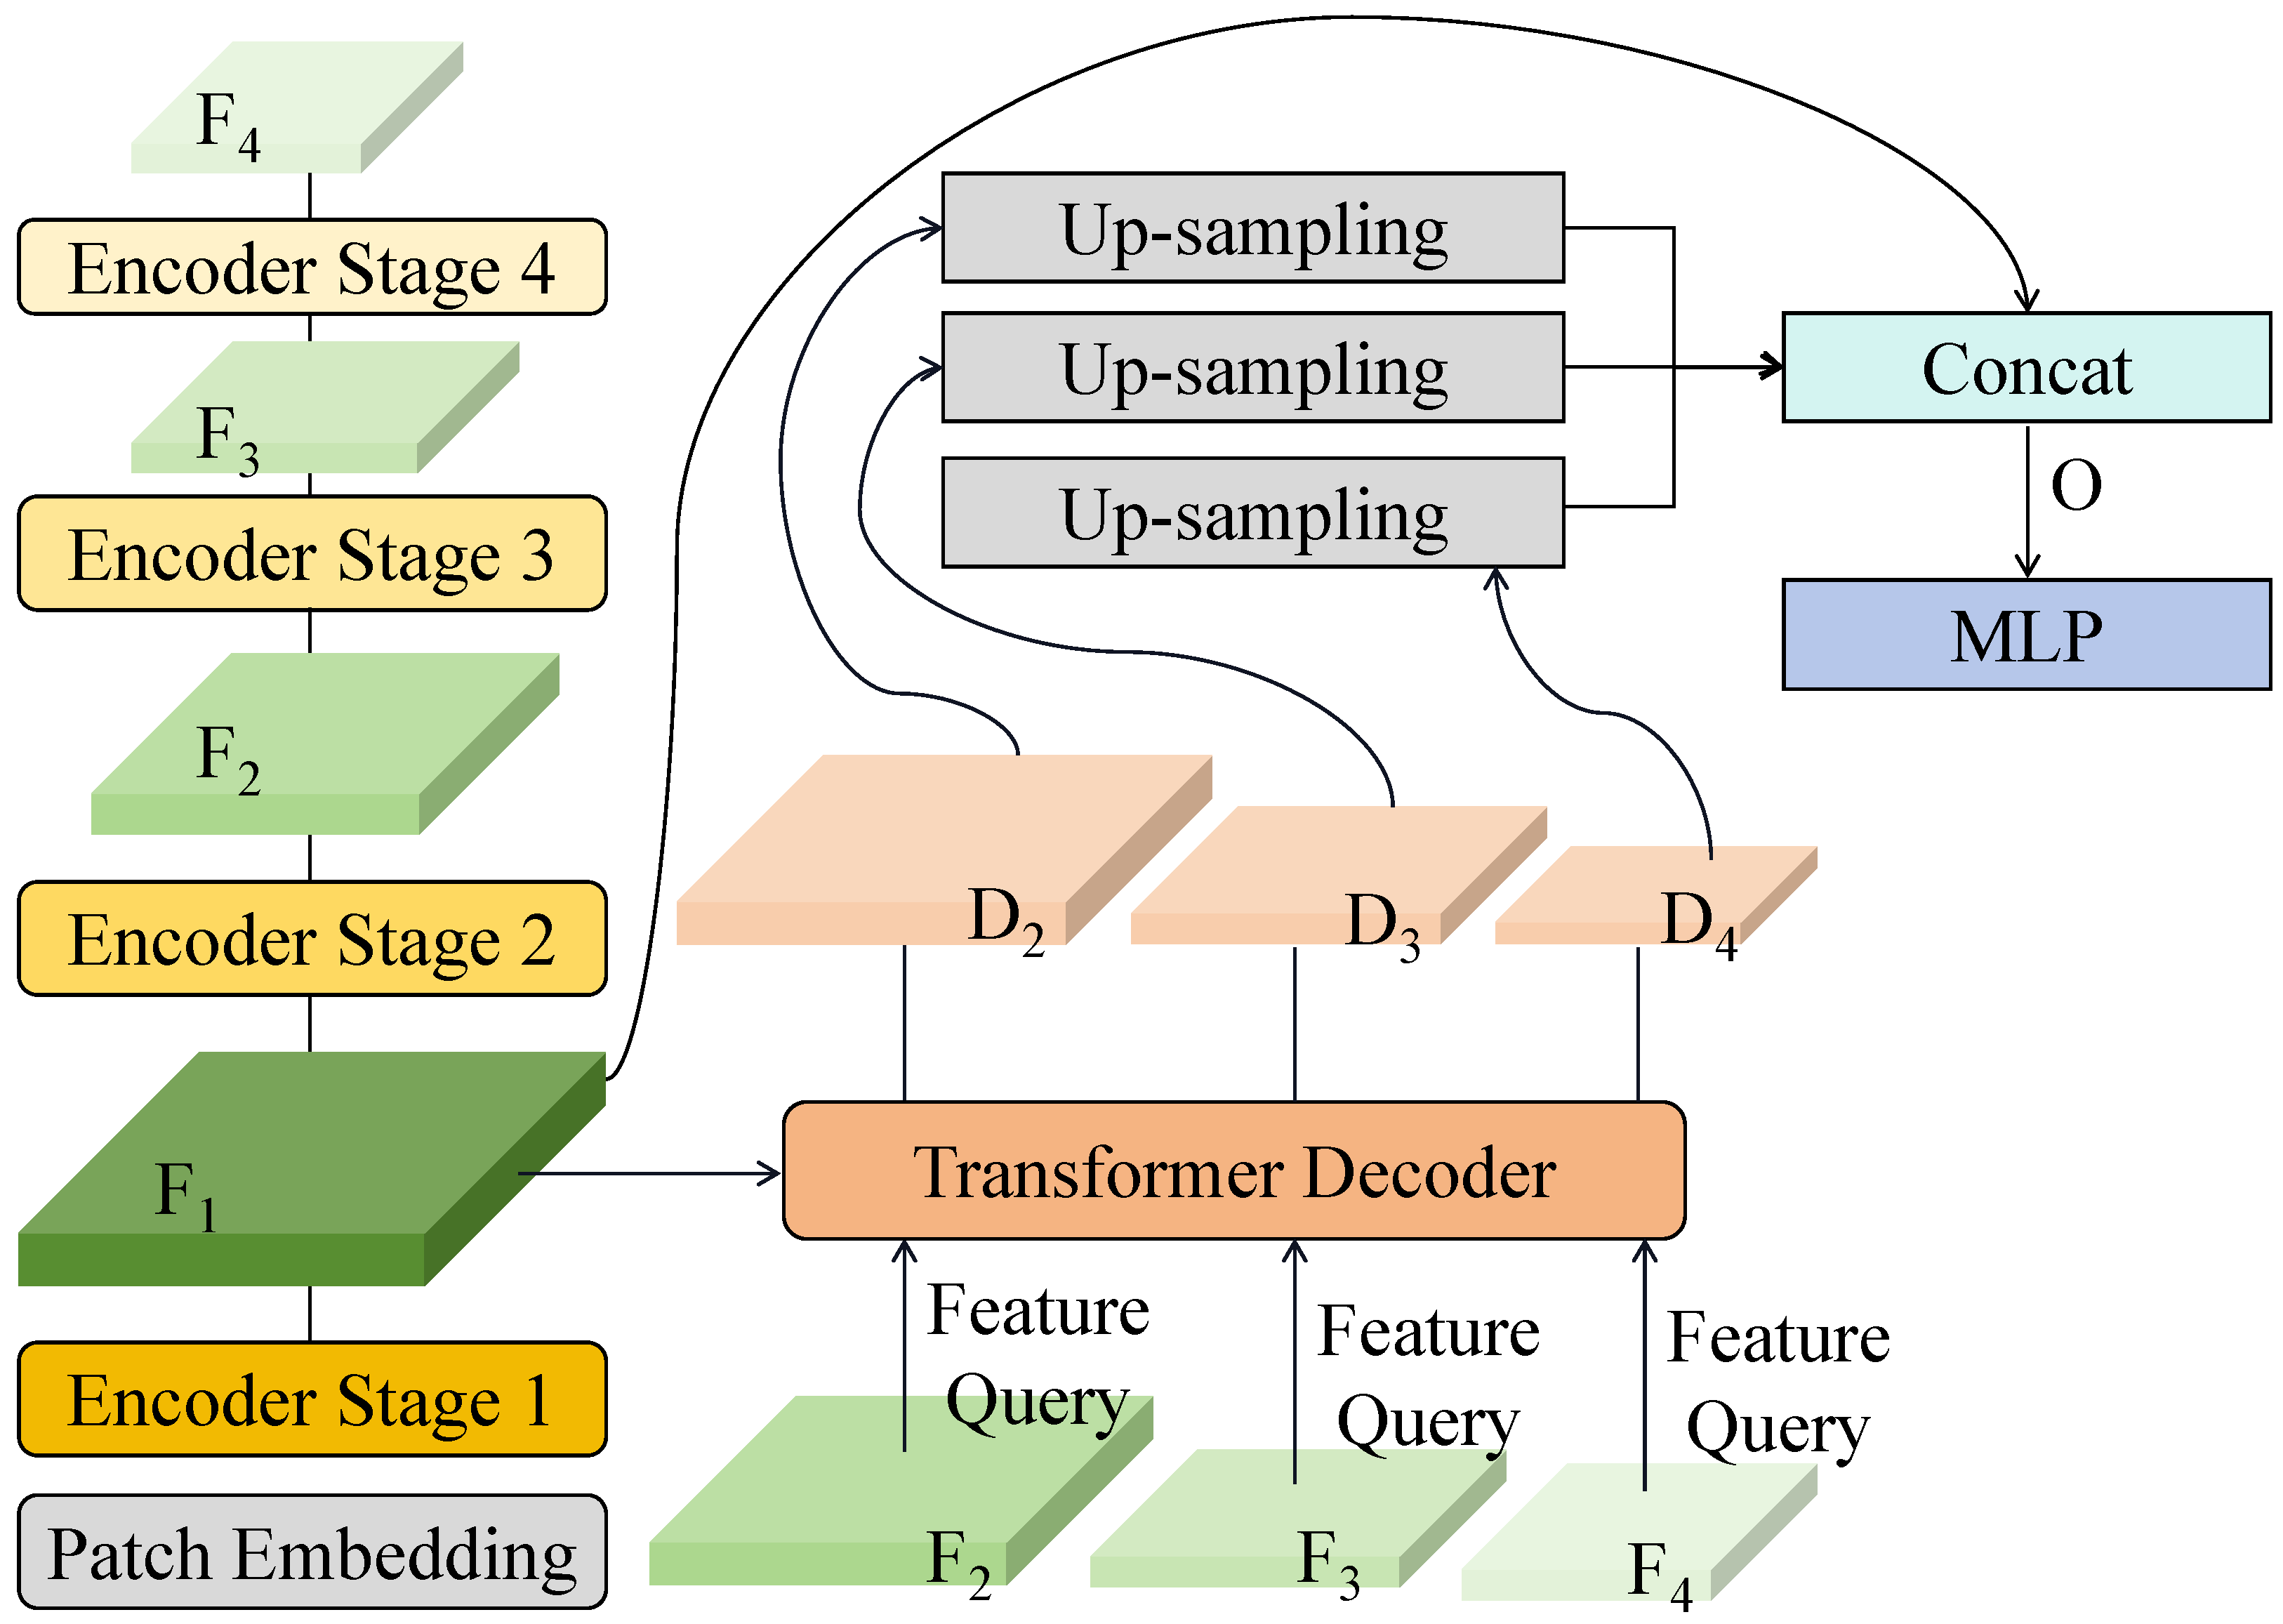
  • A parallel transformer lesion segmentation network is introduced to process feature maps at multiple scales, extracting multigranular lesion features to improve the accuracy of recognizing similar diseases, such as apple scab and black rot.
  • Multimodal data fusion leverages environmental data collected by sensors, enabling the model to account for variations in disease phenotypes across regions and climates, enhancing robustness in diverse environments.
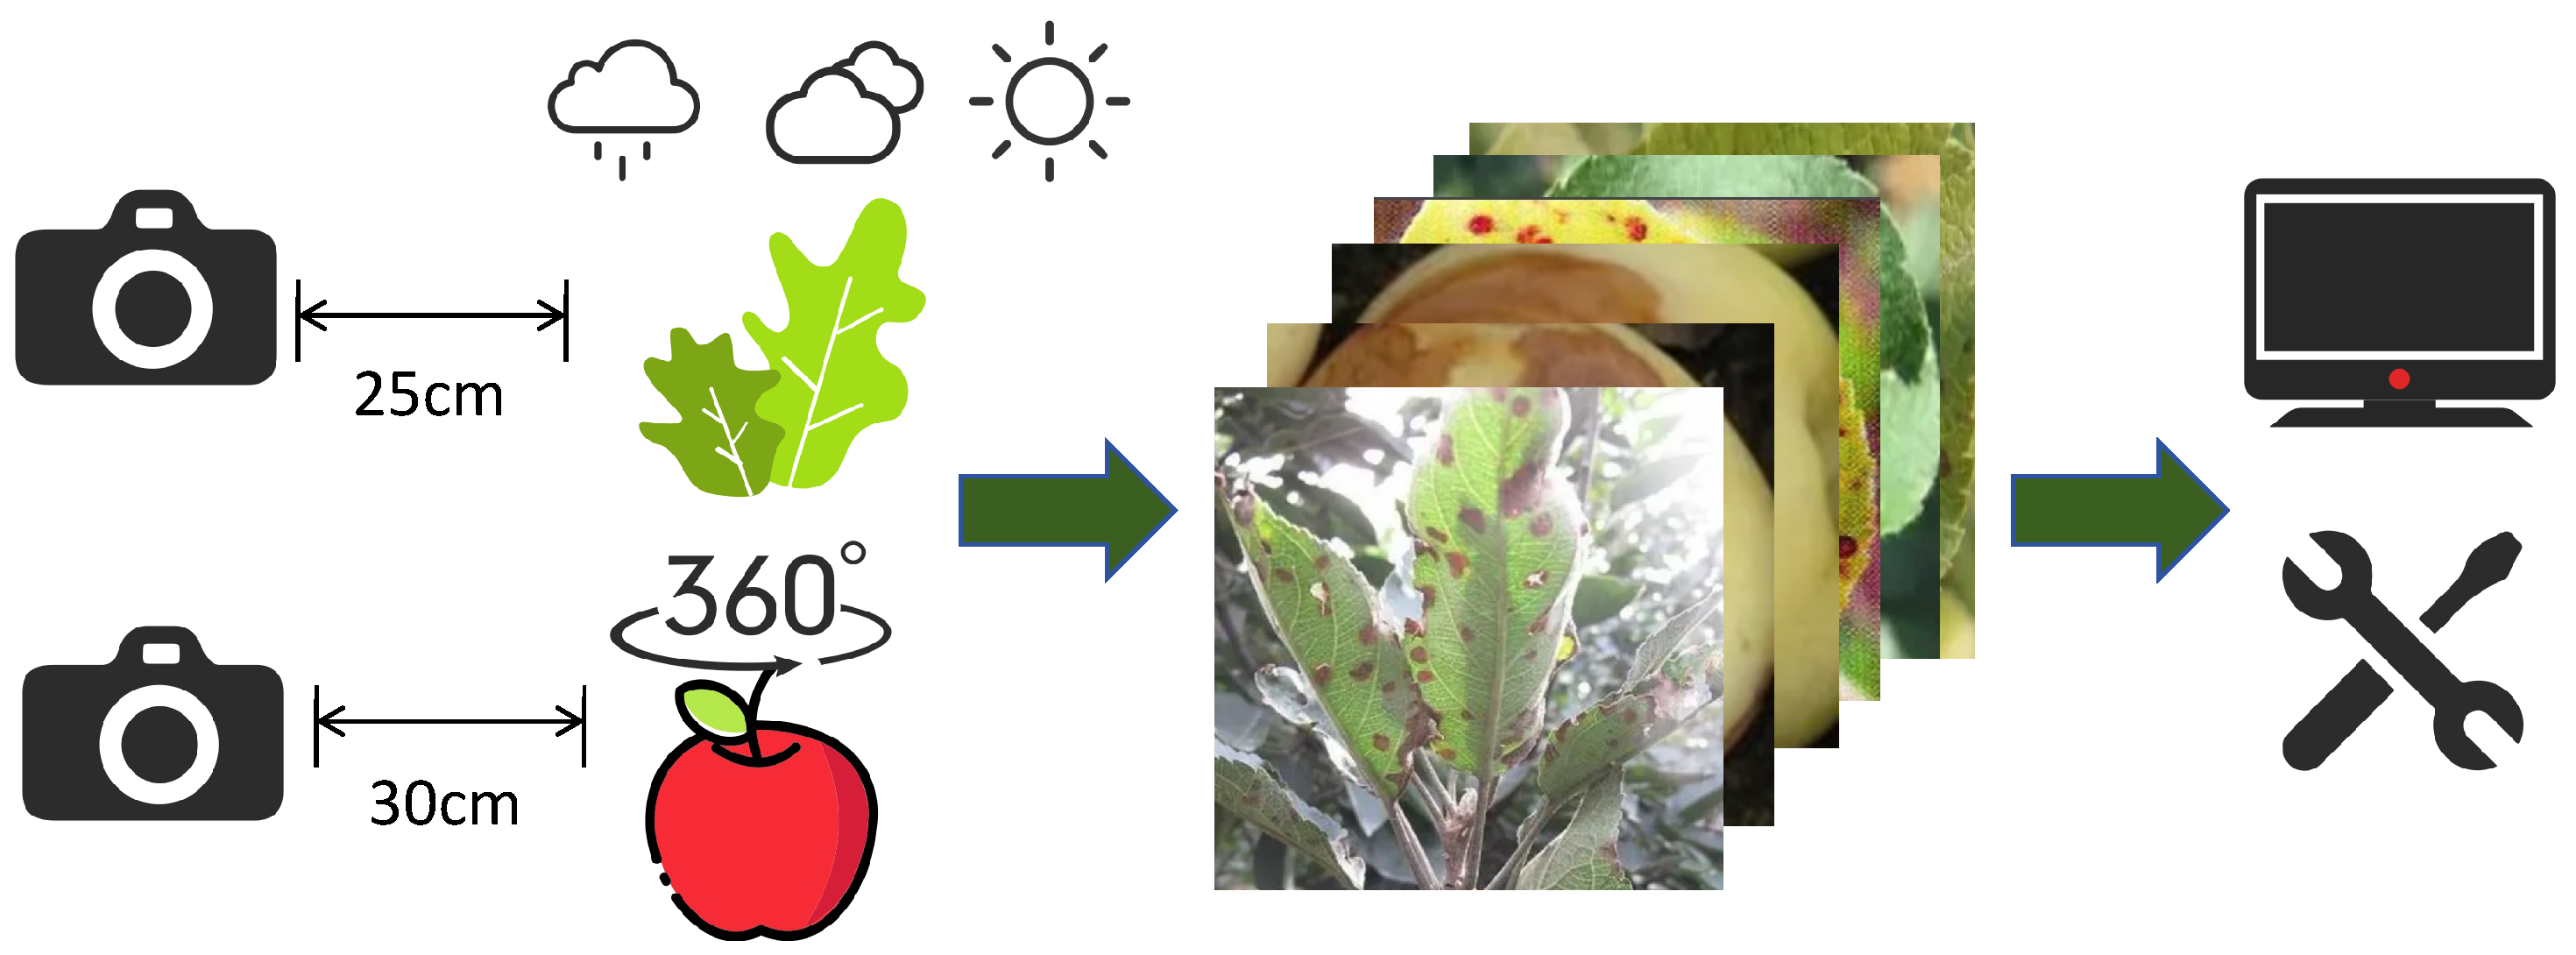
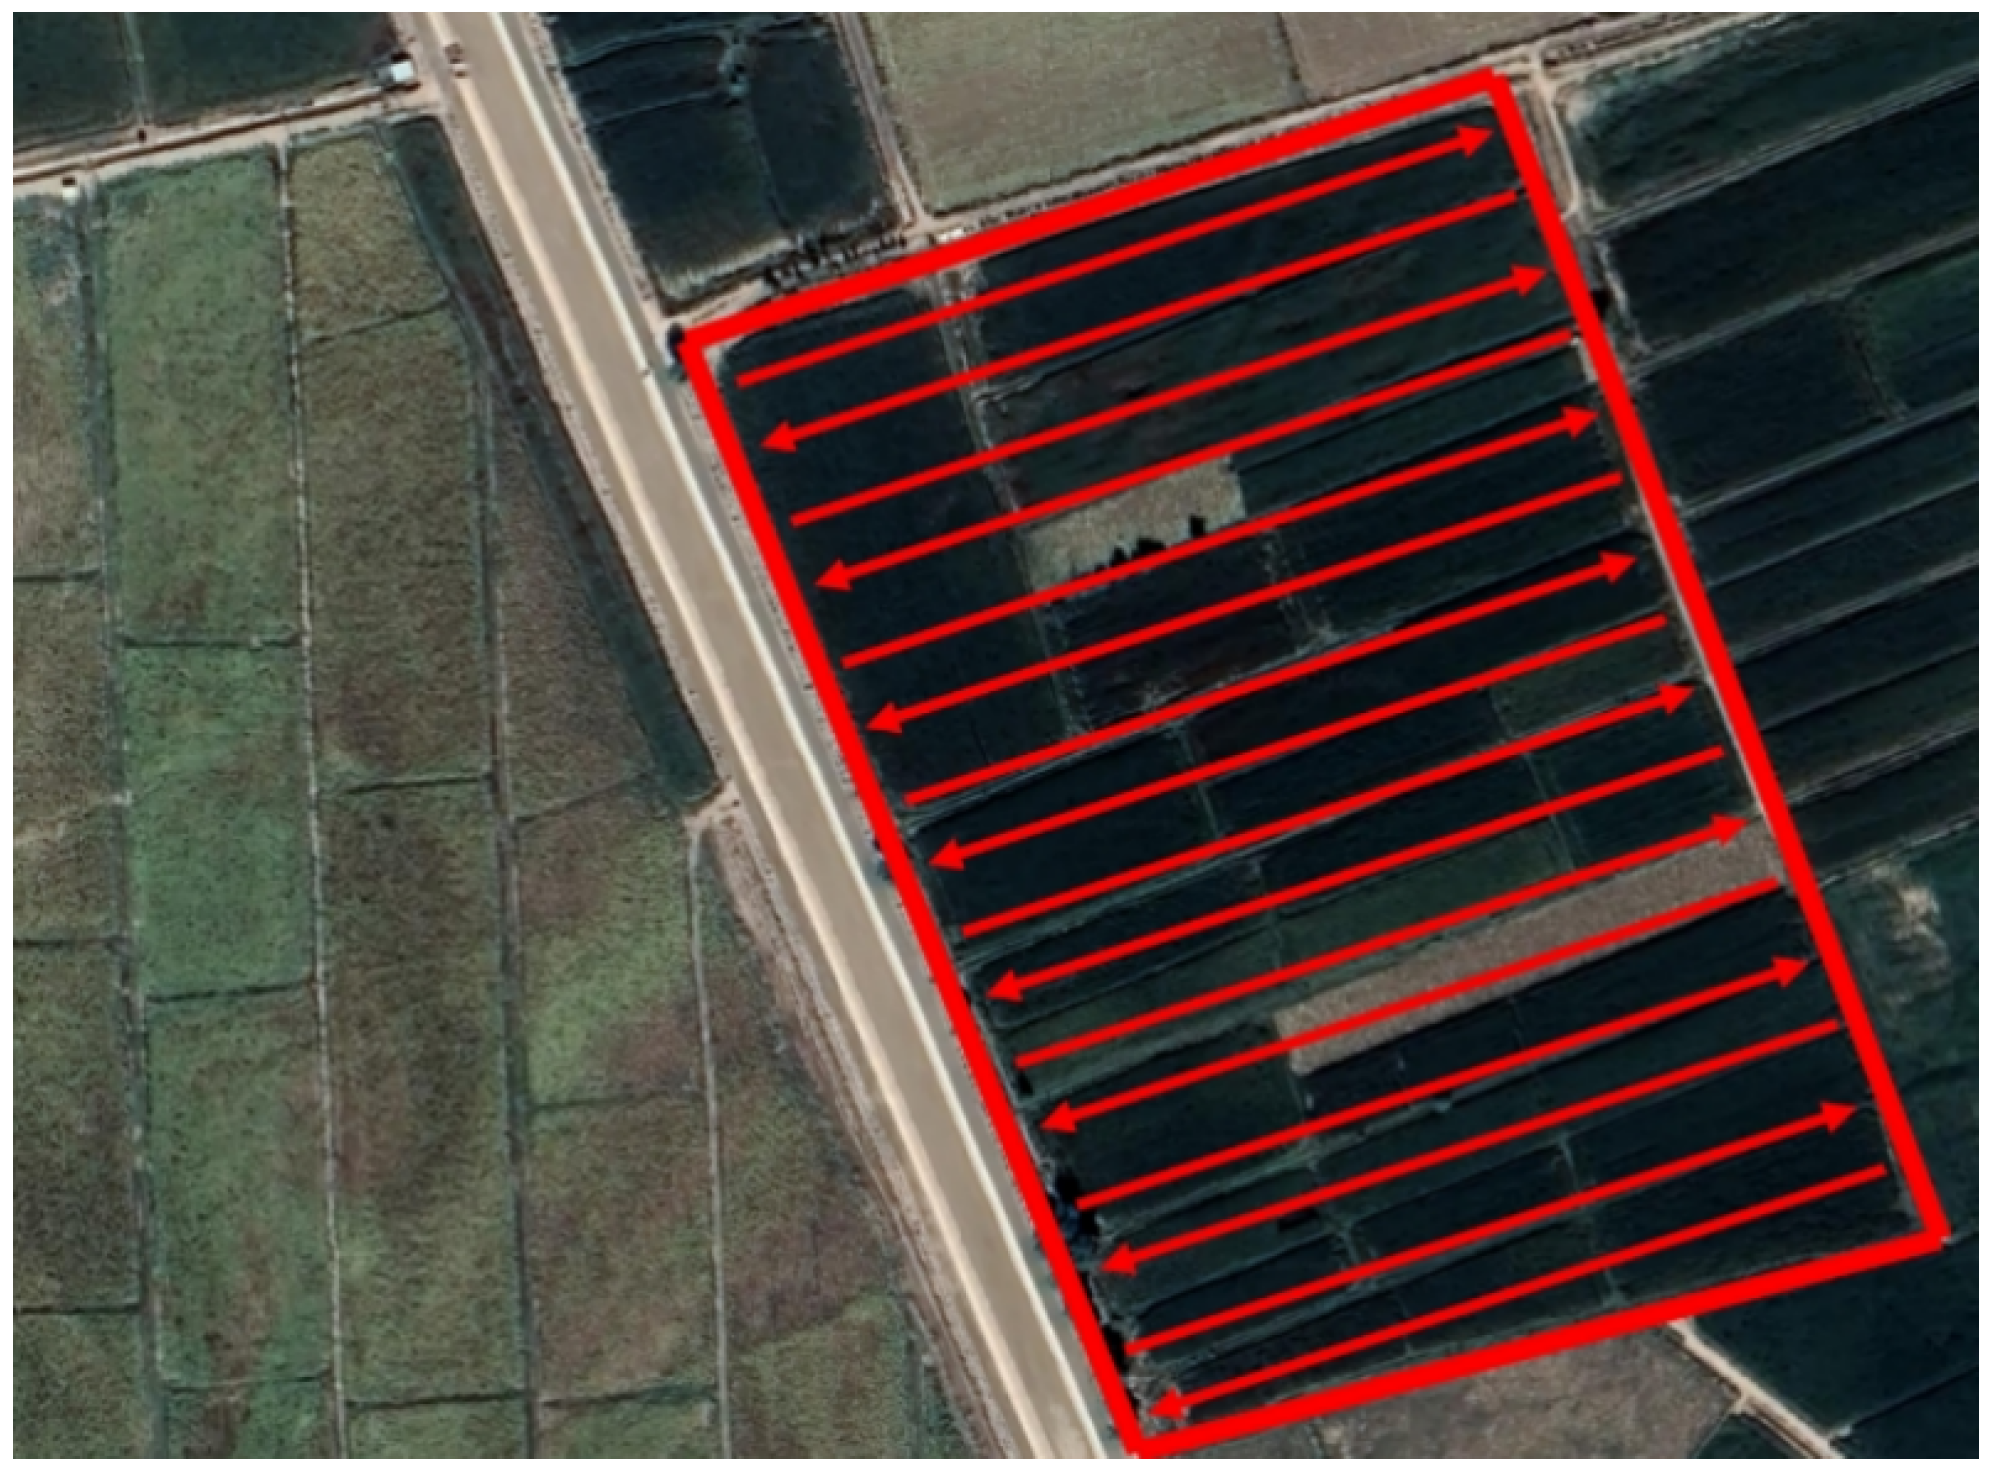
  • An automated acquisition workflow is designed to address the multidimensional and multi-angular characteristics of apple diseases. By extracting video frames from handheld devices and employing diffusion generation algorithms, complete apple surface image reconstruction is achieved, enabling comprehensive detection and precise grading.
The implementation code along with a representative sample dataset will be made publicly available on GitHub (https://github.com/user837498178/apple-agriculture (accessed on 18 May 2025)) upon acceptance, while the full dataset remains restricted due to industry partnerships.

2. Materials and Methods

2.1. Dataset Construction

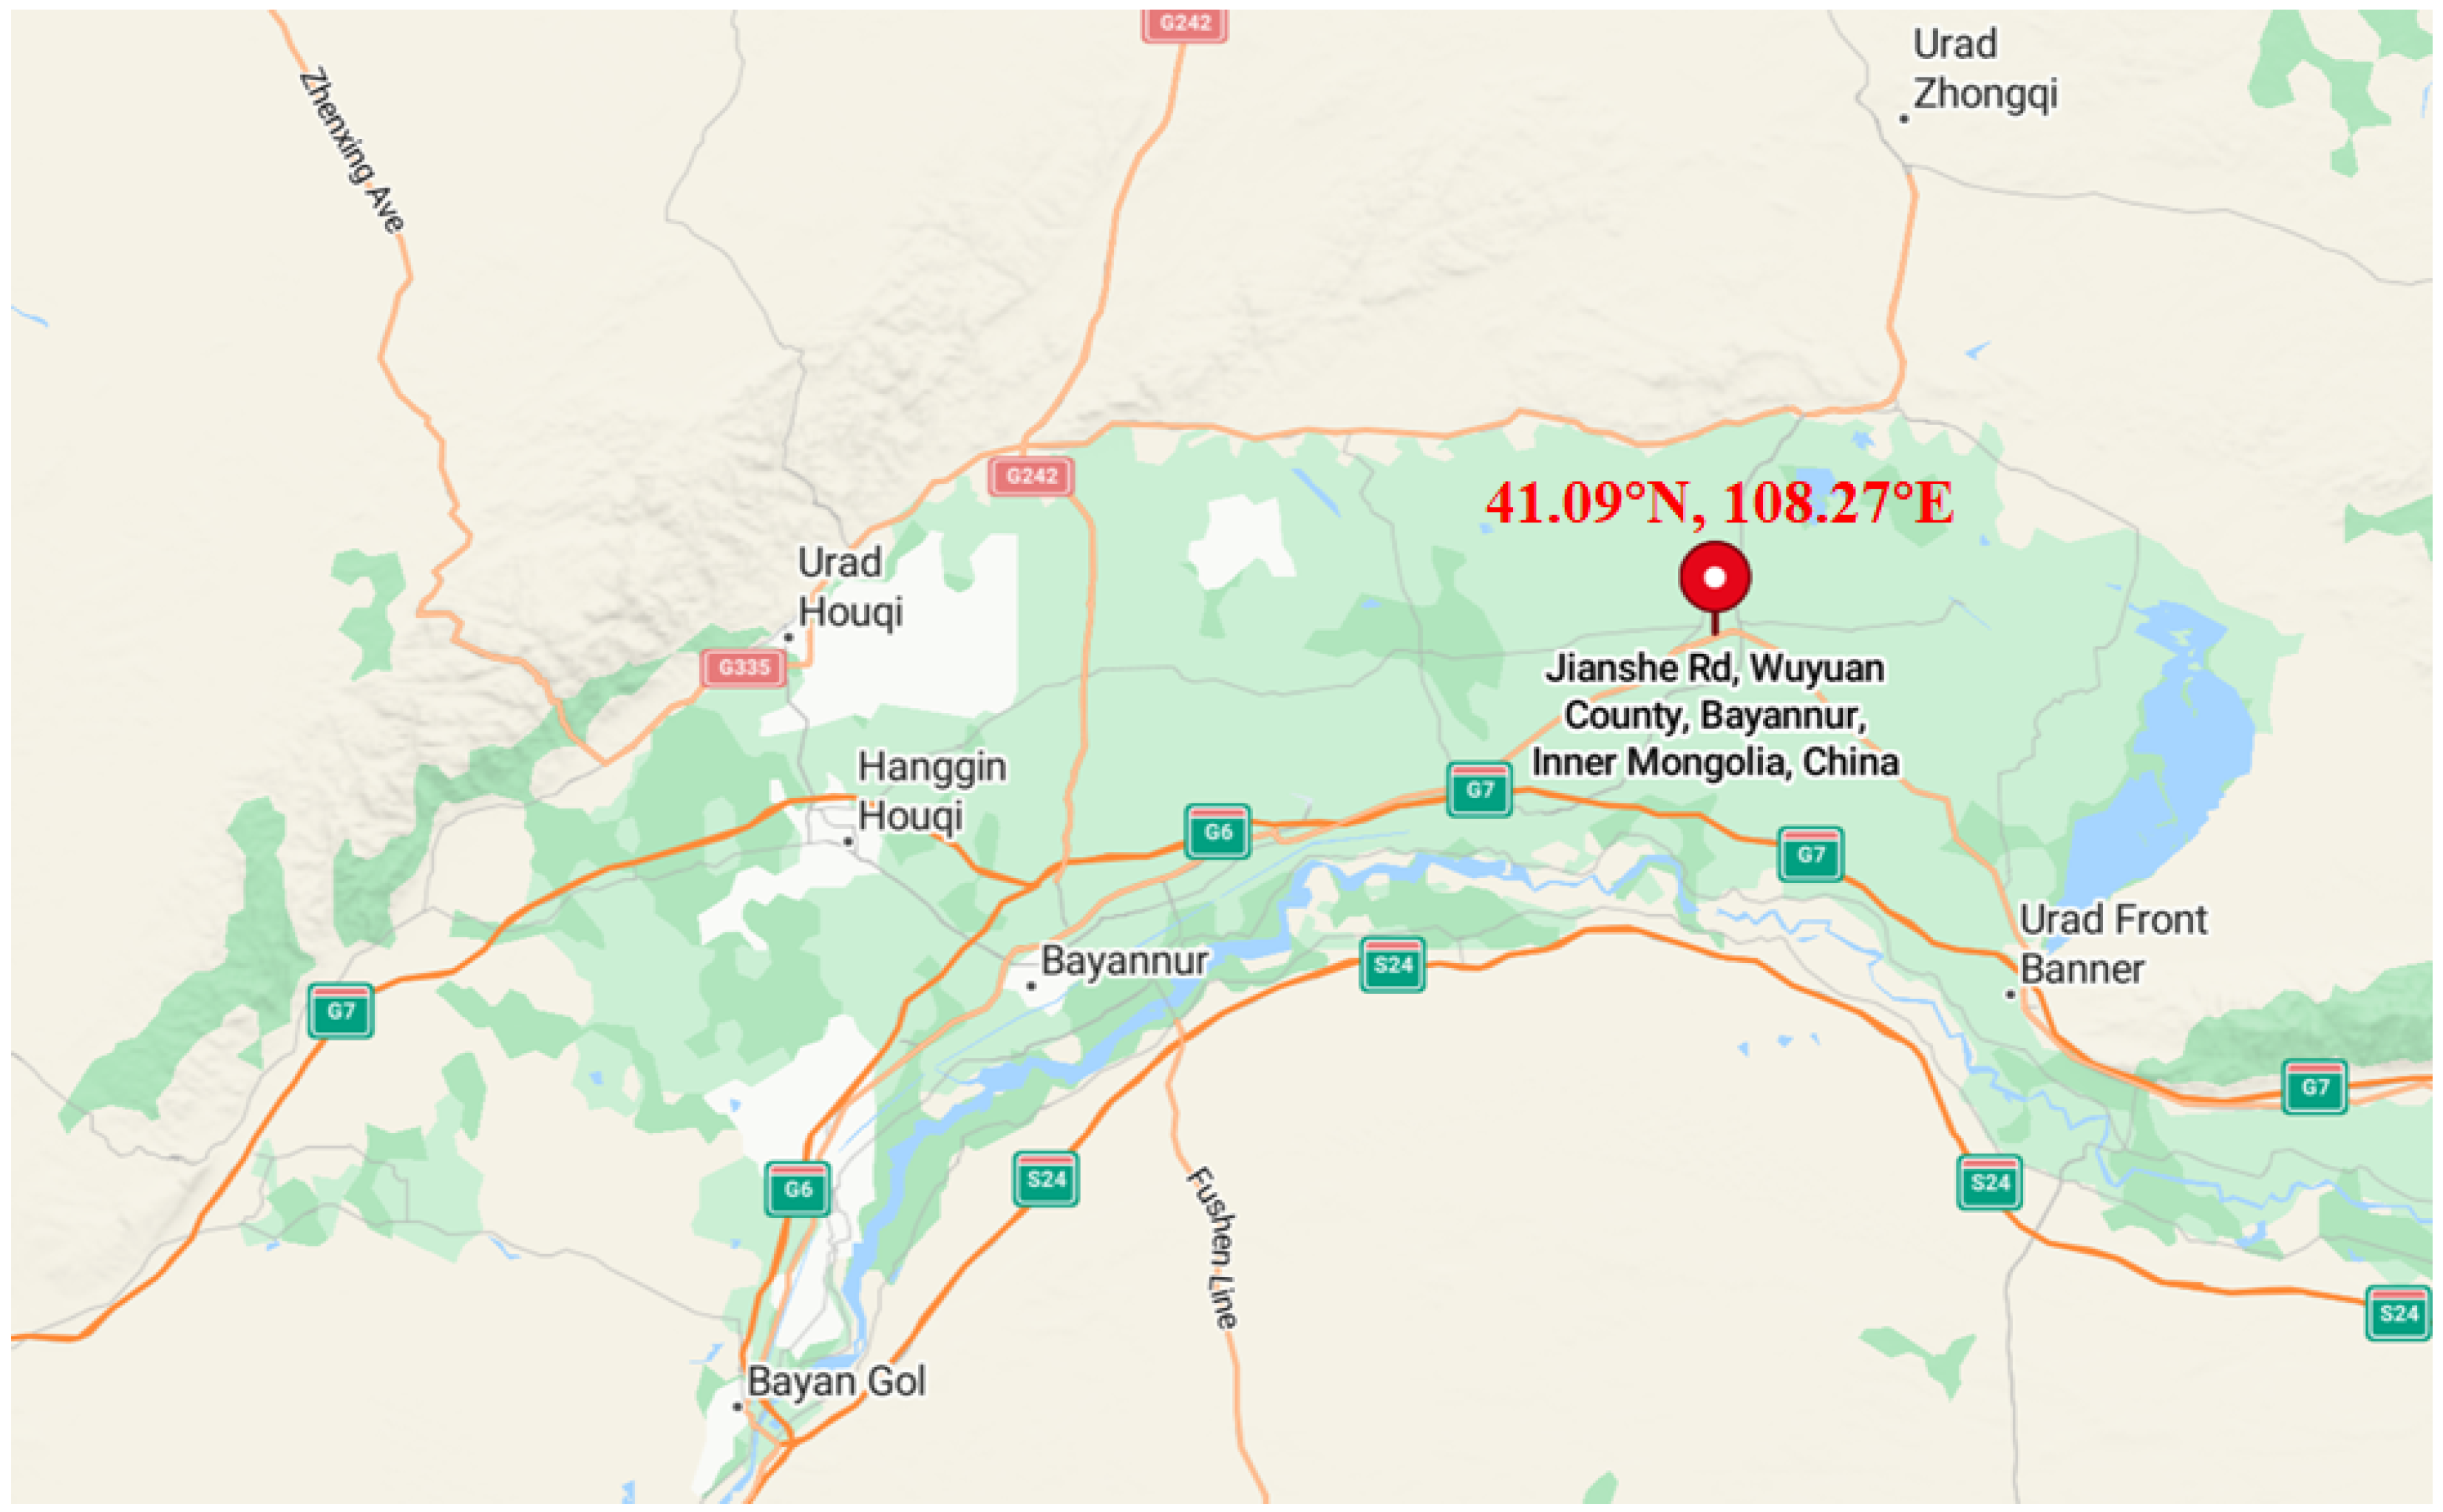
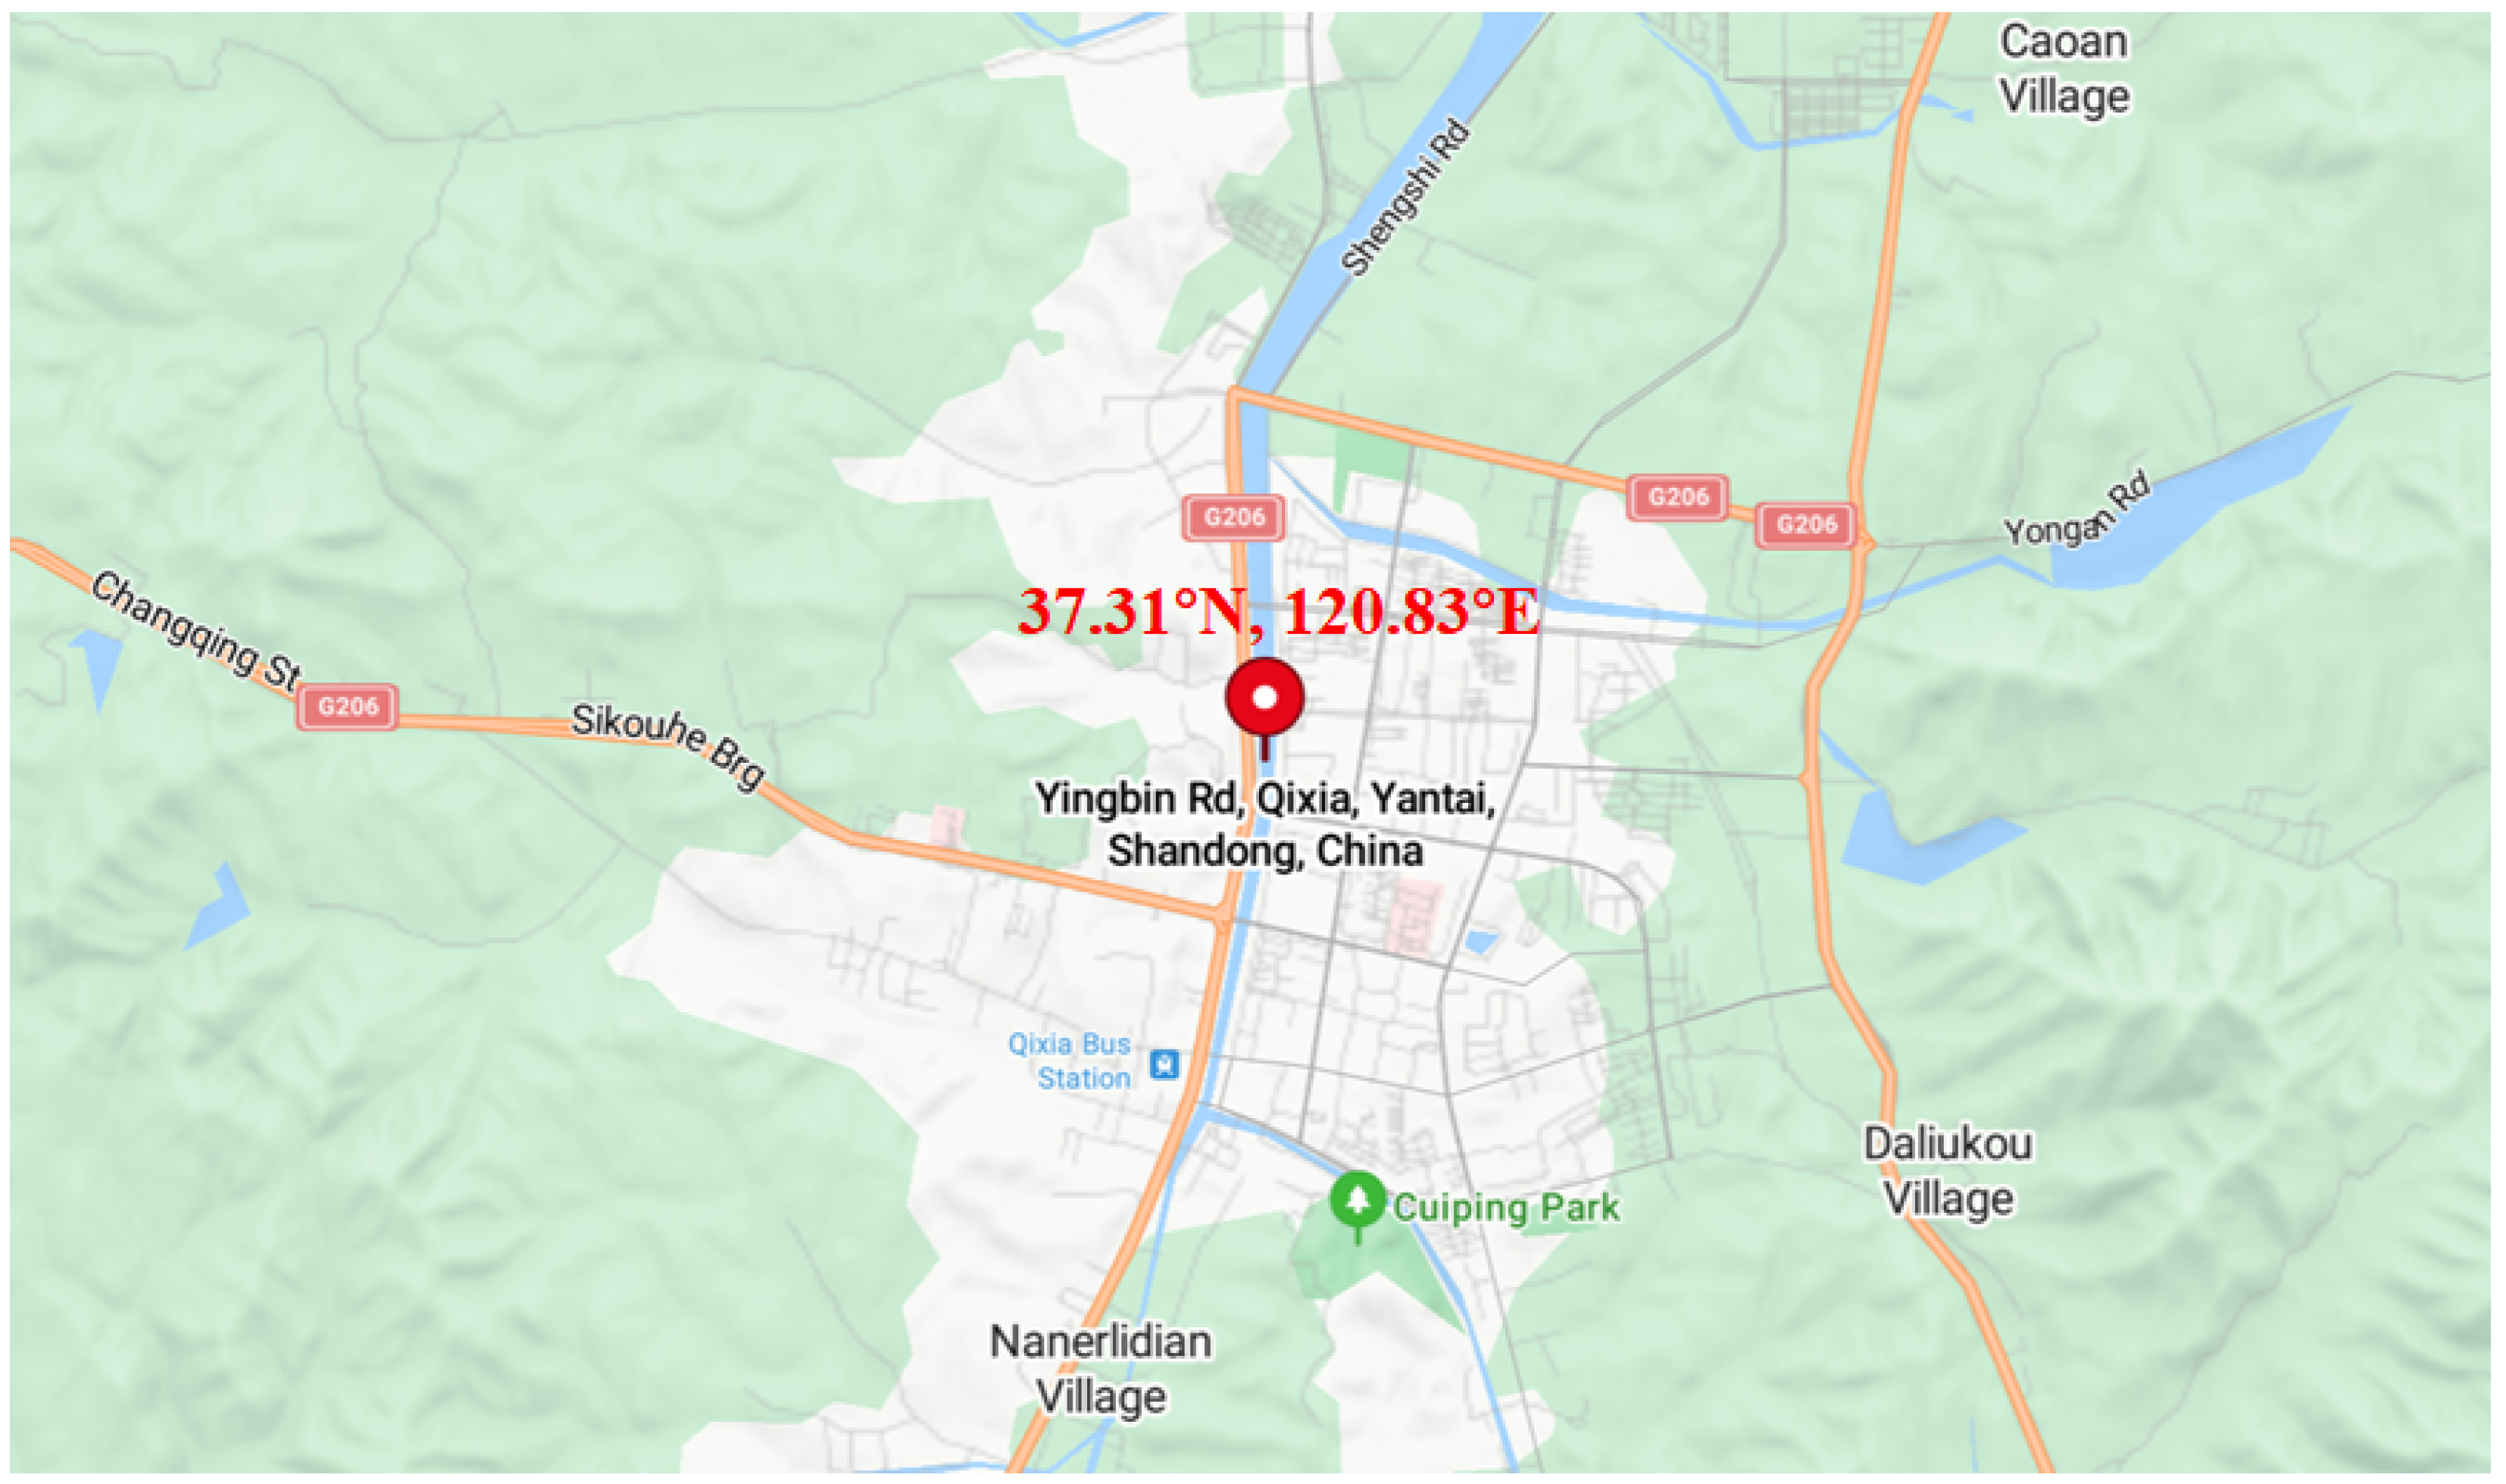
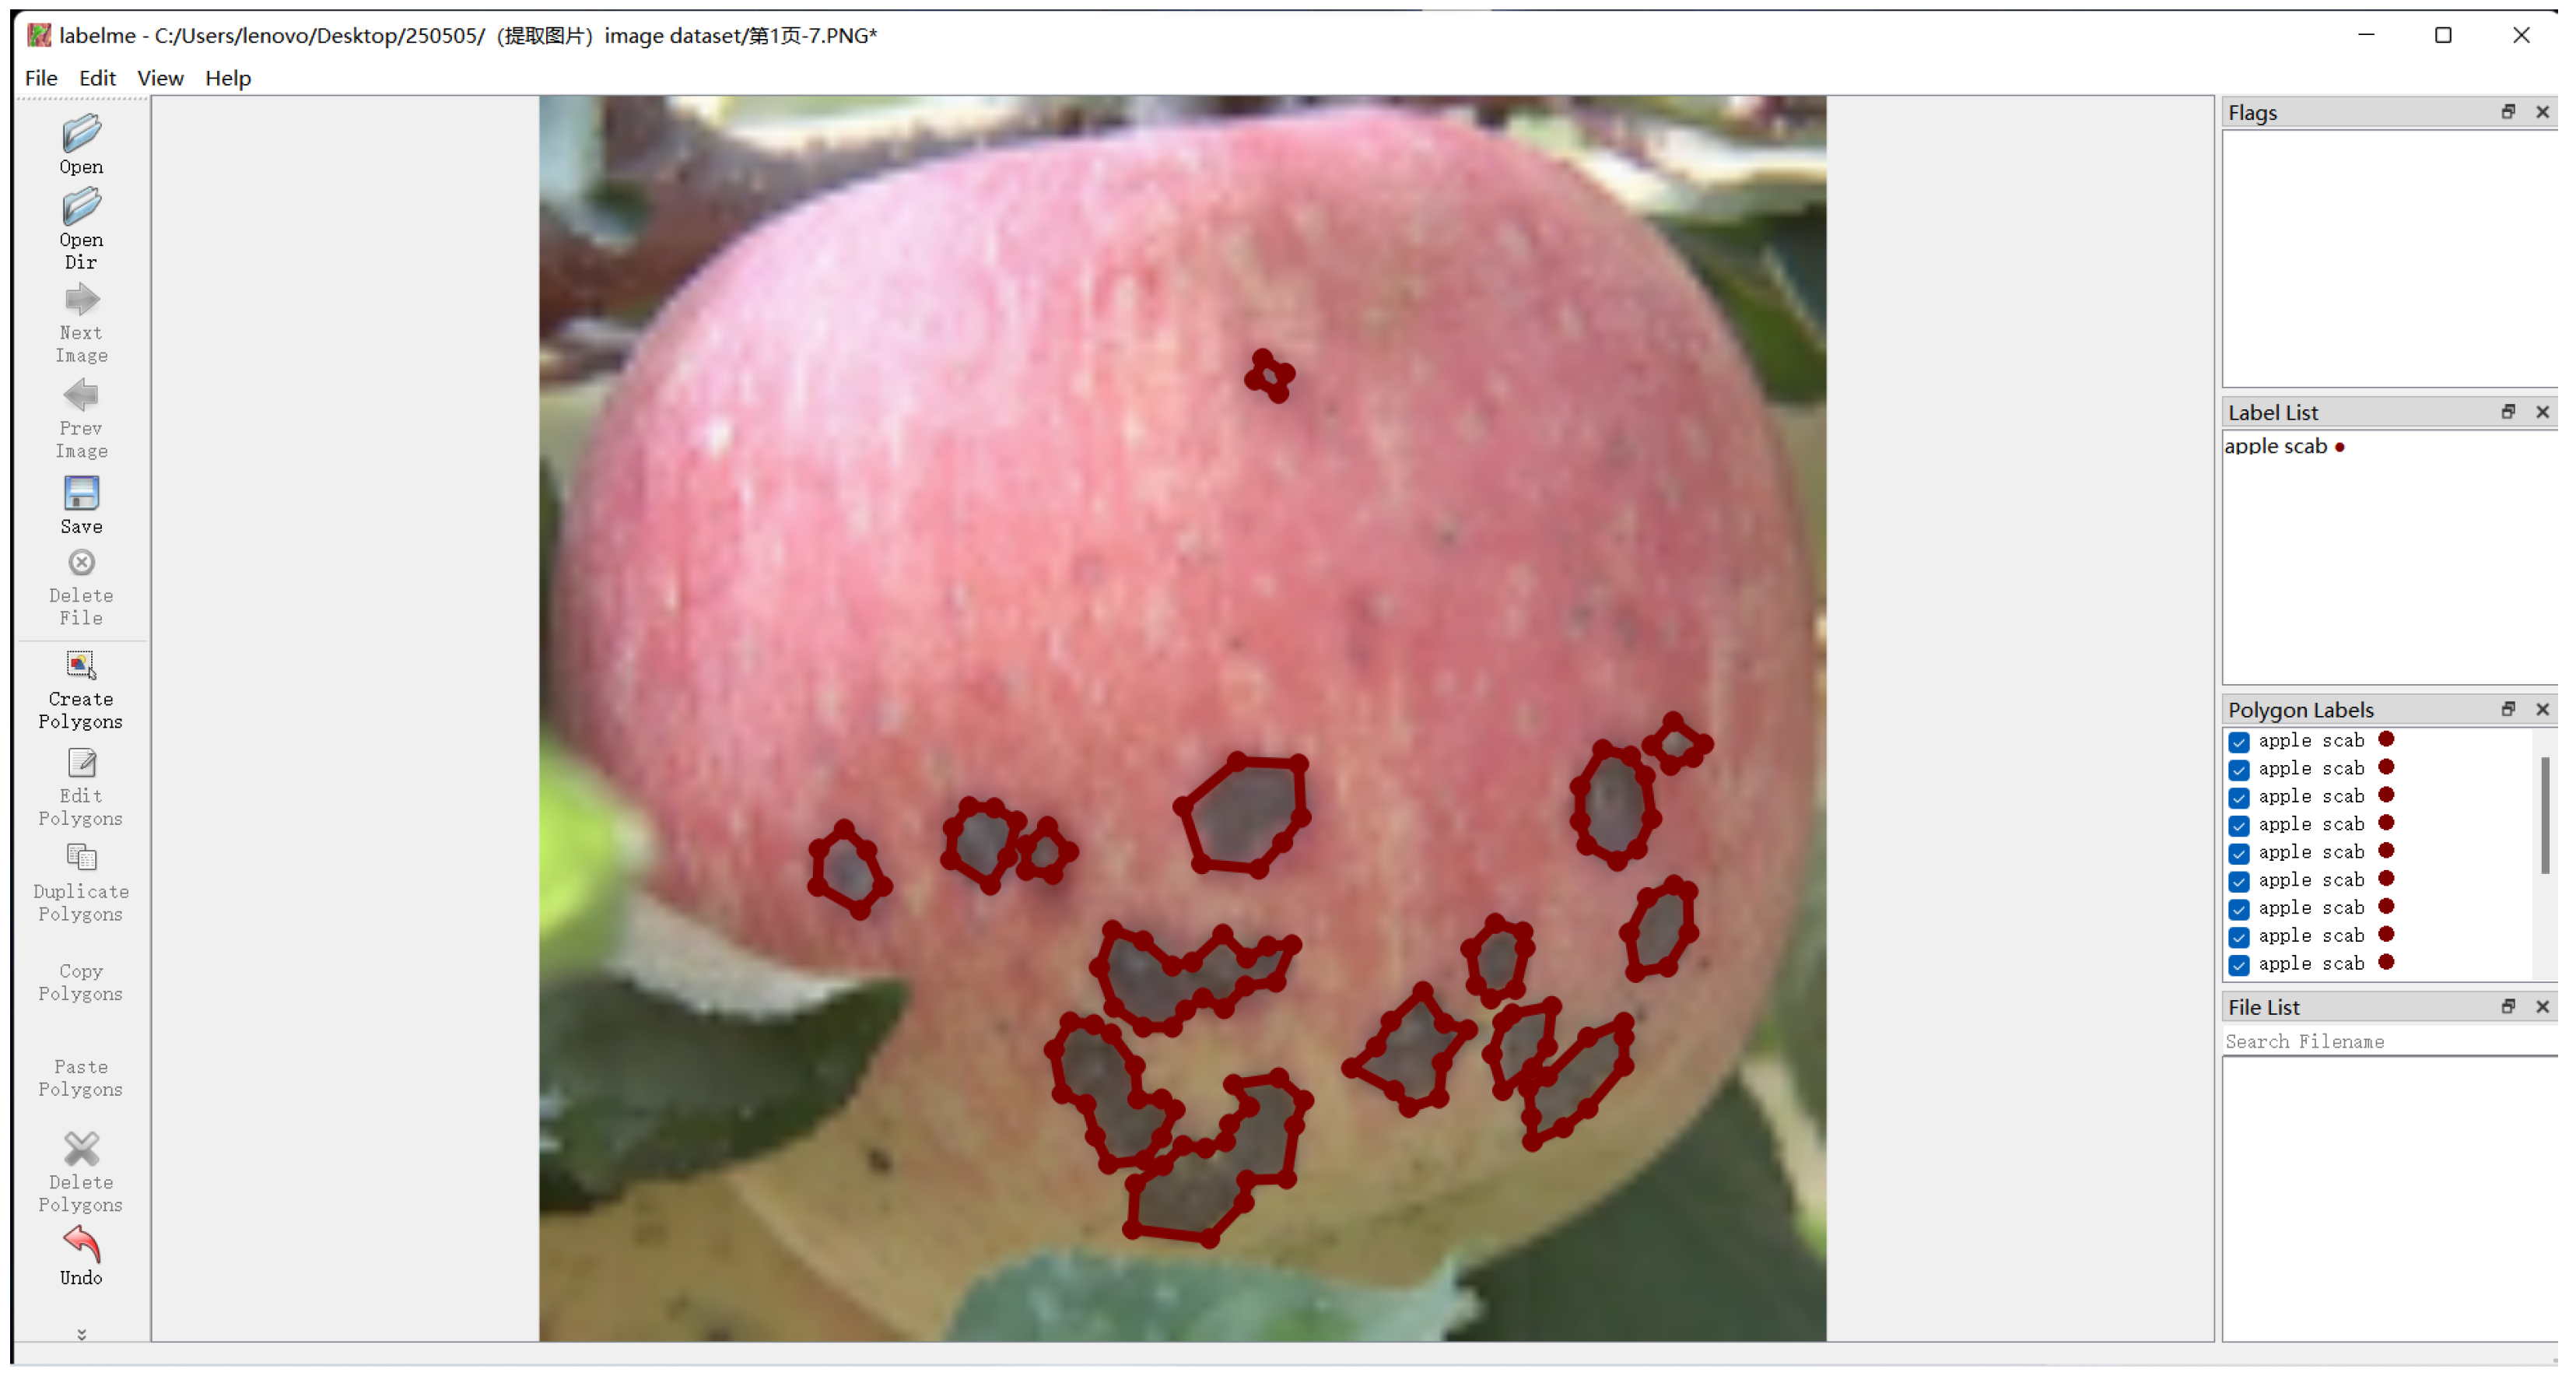
2.1.1. Image Dataset Collection

The construction of the apple disease image dataset involved both publicly available online resources and field data collection to comprehensively cover the diversity and complexity of common diseases observed during apple cultivation. Specifically, extensive disease-related image data were collected from apple orchards located in Wuyuan County, Bayannur City, Inner Mongolia, China, and Qixia District, Yantai City, Shandong Province, China, as shown in Figure 2 and Figure 3. These data were combined with publicly available online resources to build a high-quality multimodal apple disease image dataset. The dataset includes seven common diseases: apple scab, black rot, gray mold, apple rot, apple powdery mildew, anthracnose, and apple ring rot, as shown in Figure 4.
As detailed in Table 1, each disease category contains between 1500 and 2300 images, ensuring comprehensive and representative coverage of disease samples.
The field data collection was conducted between April and October 2024, covering the full growth cycle of apples from flowering to maturity. This period, characterized by variable climatic conditions, provided an ideal environment for capturing diverse disease phenotypes under different environmental influences. The Sony α 7 III full-frame digital camera (Sony Corporation, Tokyo, Japan), equipped with a 28–70 mm lens and a resolution of 6000 × 4000 pixels, was employed for high-resolution image acquisition. Such high resolution enabled the precise capture of disease details, providing ample information for subsequent image processing. To ensure data diversity, a multi-angle, multi-lighting condition shooting strategy was adopted during image acquisition.
As shown in Figure 5, image acquisition simulated the lighting conditions encountered during typical orchard harvests. Images were taken at different times of the day, including morning, noon, and evening, as well as under specific conditions such as post-rain or high humidity, to capture the impact of moist environments on disease characteristics. For example, the characteristic small black spots of apple scab were documented, which expanded during disease progression, sometimes accompanied by tissue desiccation in advanced stages [37]. Black rot was characterized by blackish-brown, well-defined lesions, often concentrated on leaf edges or the tops of fruits, with minimal distinction from apple scab [38]. Gray mold was observed forming gray mold layers on fruit surfaces, often associated with soft rot, while apple rot presented as water-soaked or desiccated lesions that emitted a distinct putrid odor in severe cases, often co-occurring with gray mold [39,40]. Apple powdery mildew appeared as white powdery substances, typically covering the surface of leaves and fruits [41]. Anthracnose was characterized by smooth, blackish-brown sunken lesions, and apple ring rot exhibited classic ring-like lesion patterns, usually occurring in the later stages of fruit development [42,43].
To ensure the scientific rigor and consistency of data annotation, all collected apple disease samples were meticulously labeled under the guidance of agricultural experts. The annotations included information on disease type, affected plant part, and the potential stage of disease progression. For each disease category, a detailed annotation protocol was established, specifying criteria such as lesion color, shape, distribution pattern, and diagnostic symptomatology to ensure clear distinctions between different disease types. Special attention was given to the collection and annotation of mixed infections and partially occluded fruit samples, in order to enhance dataset diversity and improve model robustness under complex real-world conditions. Representative annotated examples are shown in Figure 6.
Online resources supplemented the field data collection to address specific challenges, such as capturing rare disease stages or disease phenotypes under unique lighting conditions. These resources included publicly available agricultural datasets, such as the PlantVillage dataset, and other high-quality research platforms. To ensure the reliability and accuracy of the data, online images were subjected to rigorous screening. Images with complex backgrounds, indistinct disease characteristics, or ambiguous annotations were excluded, and expert knowledge was applied for re-annotation.
This dual-source approach ensured that the constructed dataset provides a comprehensive and reliable foundation for the development and evaluation of advanced apple disease detection and classification models.

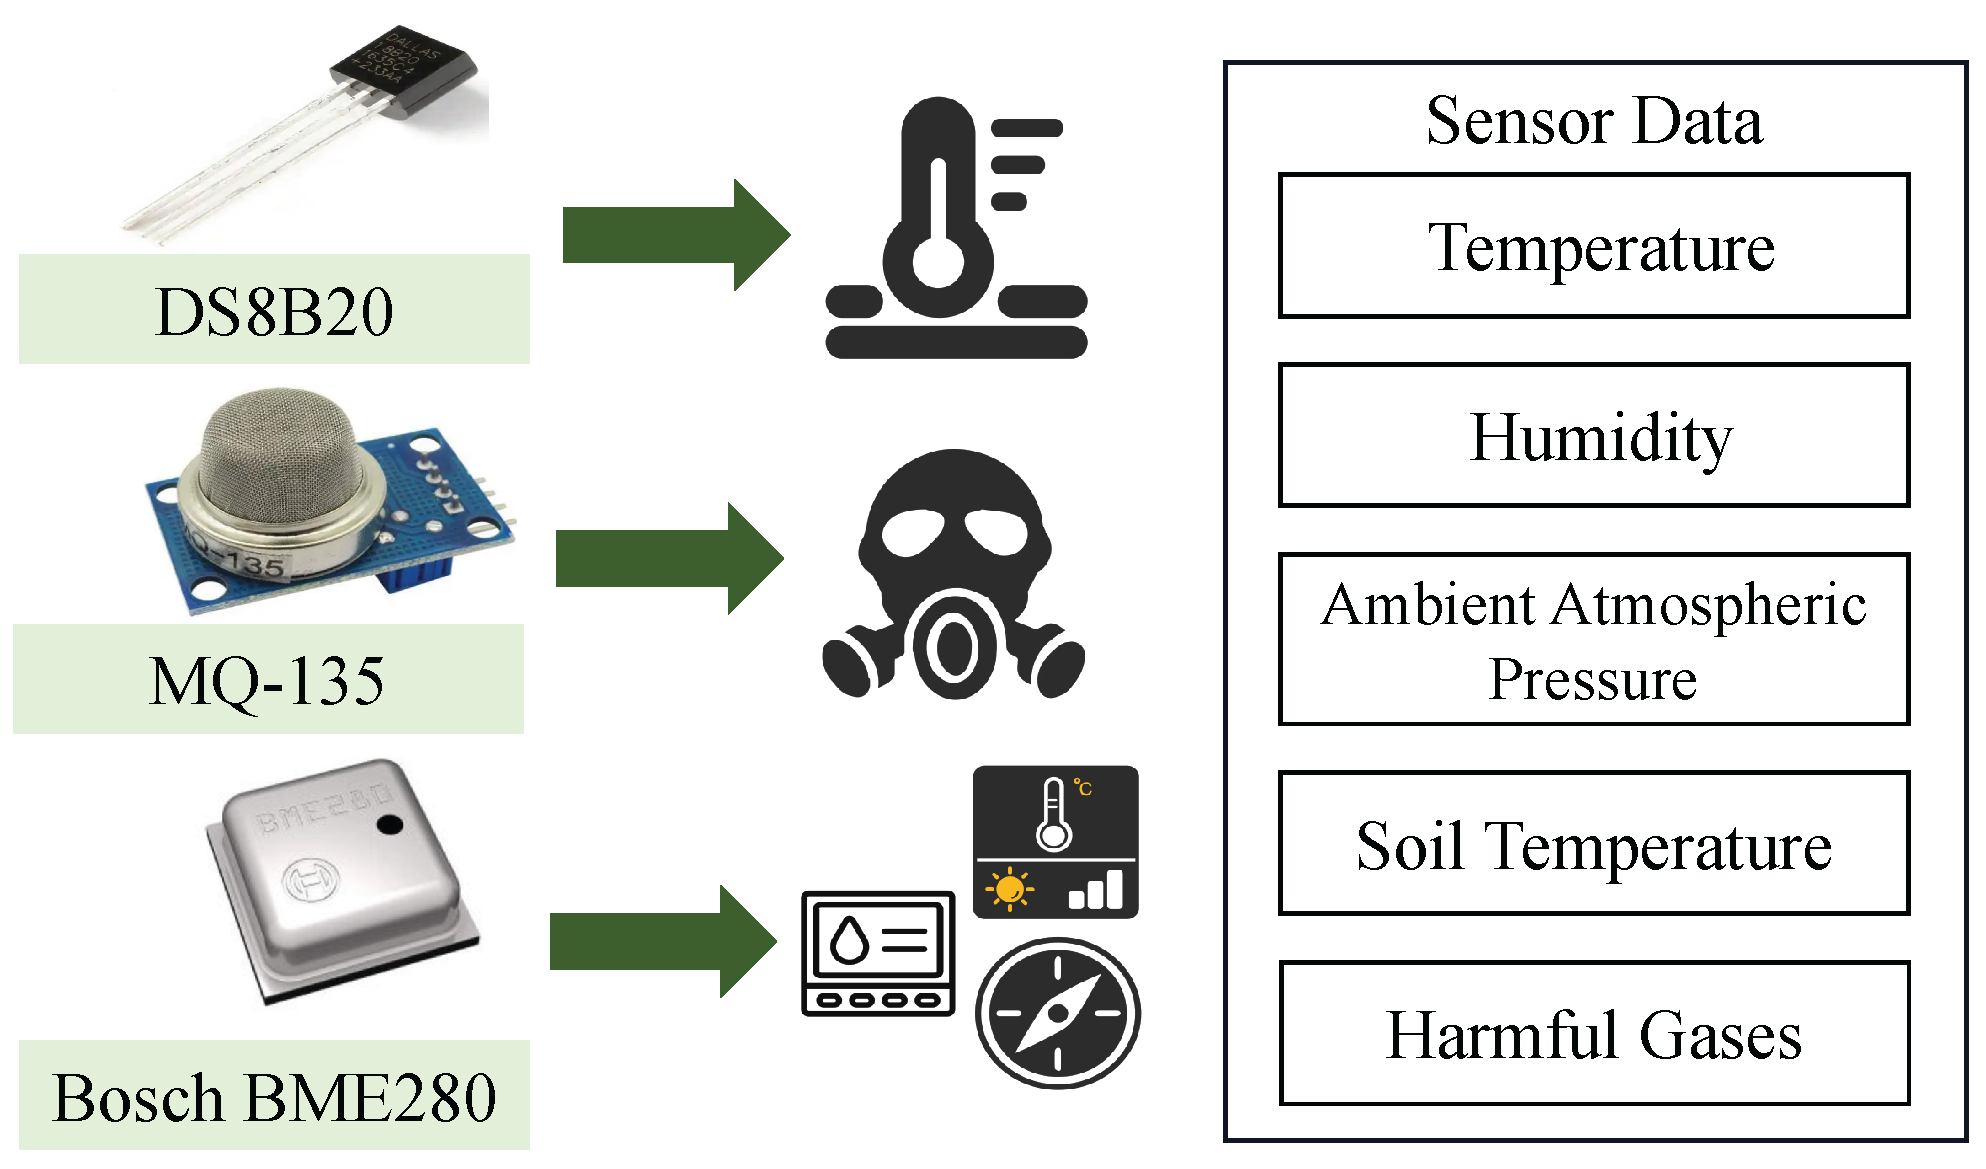
2.1.2. Sensors Dataset Collection

To address the challenges posed by phenotypic variations in the same disease under different climatic conditions and the similarity of certain disease phenotypes, a combination of image data and environmental data collected through sensors was employed. Environmental data collection was conducted in apple orchards located in Wuyuan County (41.09° N, 108.27° E), Bayannur City, Inner Mongolia, and Qixia District (37.31° N, 120.83° E), Yantai City, Shandong Province, covering diverse climatic conditions and cultivation environments, as shown in Figure 7. These regions were selected due to their large-scale apple production and significant environmental variability, providing an ideal setting for studying the phenotypic characteristics of apple diseases under different climatic conditions.
The data collection range included various orchard zones, such as elevated areas, regions near irrigation systems, and core areas with dense tree growth. This design aimed to capture the spatial heterogeneity of the environment comprehensively. For instance, elevated areas may experience greater diurnal temperature fluctuations, while regions near irrigation systems often exhibit higher humidity levels. These environmental differences significantly influence the occurrence of apple diseases. By recording such data, insights were gained into the specific effects of environmental conditions on different disease types, such as the rapid spread of gray mold in high-humidity environments or the pronounced intensification of apple scab under dry conditions.
The primary sensors used included Bosch BME280 (Bosch Sensortec GmbH, Reutlingen, Germany), DS18B20 (Maxim Integrated, San Jose, CA, USA), and MQ-135 (Winsen Electronics, Zhengzhou, China). Bosch BME280 is a high-precision environmental sensor capable of monitoring temperature, humidity, and atmospheric pressure in real time. DS18B20 is a digital temperature sensor specifically designed for soil temperature measurements. MQ-135 is a gas sensor that detects harmful gas concentrations in the air, reflecting the orchard’s air quality. These sensors were chosen based on their relevance to critical environmental factors affecting apple diseases, such as the influence of temperature and humidity on spore reproduction, soil temperature on root diseases, and air quality on the potential spread of pathogens.
The sensor deployment was meticulously designed to ensure data representativeness and accuracy. Data were collected from three major apple-growing regions in China: Qixia District (Shandong Province), Luochuan County (Shaanxi Province), and Jingning County (Gansu Province). In each orchard, five types of sensors were deployed to monitor key environmental parameters, including temperature, humidity, ambient atmospheric pressure, soil temperature, and harmful gas concentration. For each sensor type, three independent units were installed per region, resulting in a total of 15 sensors per orchard and 45 sensors across all sites. Sensors such as the Bosch BME280 and MQ-135 were mounted at mid-tree and canopy levels to capture air conditions, while the DS18B20 was embedded 10 cm below the soil surface to measure soil temperature near the root zone. The sensors were connected to data acquisition devices via wireless transmission modules, enabling real-time recording and remote access. To minimize environmental interference, all sensors were equipped with protective covers against rain, dust, and direct sunlight.
Special attention was given to capturing and recording extreme weather conditions during the data collection process. For example, during summer storms, humidity sensors frequently recorded near-saturation levels of 100%, while soil temperature sensors showed sharp decreases due to precipitation. Similarly, during autumn, with significant diurnal temperature fluctuations, temperature sensors recorded rapid variations. These extreme data points provided valuable references for studying the environmental sensitivity of disease occurrence. For instance, post-storm environmental changes were associated with a marked increase in the prevalence of gray mold and apple rot, while ring rot expanded more rapidly under large diurnal temperature differences.
The data recording strategy employed high-frequency sampling and segmented storage. Each sensor node was configured to collect data every 10 min, capturing dynamic changes in environmental parameters such as hourly variations in temperature and humidity and rapid changes under extreme weather conditions, while avoiding excessive data redundancy. To ensure data accuracy and continuity, each monitoring node transmitted data in real time to a central server for storage and backup via wireless modules. The central server timestamped the data and categorized it into daily, weekly, and monthly storage layers to facilitate subsequent analysis.
The data collection spanned from April to October 2024, encompassing the entire growth cycle of apples, from flowering to fruit maturity. Environmental changes during this period significantly influenced the occurrence and progression of apple diseases. For example, in high-humidity environments, the pathogens of gray mold and apple rot proliferated rapidly, whereas under dry conditions, the lesions of apple scab and black rot expanded more prominently. Real-time monitoring of environmental data allowed for a deeper understanding of the mechanisms by which environmental conditions impact apple diseases. Sudden changes in temperature and humidity often corresponded with the rapid spread of certain diseases, while soil temperature fluctuations could affect the onset of root diseases. Additionally, variations in harmful gas concentrations in the air could reflect the overall health of the orchard ecosystem, providing valuable references for early disease prediction. To offer a clearer overview of the environmental conditions during the observation period, Table 2 provides statistical summaries of the five sensor types, including temperature, humidity, atmospheric pressure, soil temperature, and harmful gases.
The integration of sensor data not only enhanced the robustness of disease detection models but also supported precise orchard management. During the data collection process, potential interference factors were considered, and appropriate measures were implemented. For instance, during extreme weather conditions such as heavy rain or strong winds, sensors might experience temporary functional abnormalities. Such outlier values were identified and corrected during subsequent data preprocessing. Additionally, missing data caused by sensor aging or external damage were interpolated using time-series methods to ensure data completeness and continuity.
The inclusion of sensor data in apple disease detection is critical because disease occurrence and progression are significantly influenced by environmental factors. Relying solely on image data may not capture these complex associations. For instance, the phenotypes of the same disease can differ significantly between humid and dry climates; some diseases spread easily under high humidity but remain relatively stable in low-temperature conditions. By incorporating environmental data collected through sensors, the relationship between environmental variables and disease characteristics can be better understood, thereby improving detection accuracy and adaptability. To ensure reproducibility, all UAV multispectral images underwent a series of preprocessing steps. Radiometric and atmospheric corrections were conducted using the FLAASH module. Spectral bands were selected based on Pearson correlation coefficients with SOM values and ranked by feature importance using a random forest algorithm. Edge artifacts and sensor-induced noise were eliminated using morphological masking and Gaussian smoothing. Spatial matching between UAV images and soil samples was achieved using RTK-GPS georeferenced coordinates, combined with orthorectified imagery, as shown in Figure 8. For each soil sample, average reflectance was calculated over a 3 × 3 pixel window to mitigate misalignment due to spatial resolution discrepancies. Correlation analysis indicated that red-edge (705–740 nm) and near-infrared (760–900 nm) bands exhibited the strongest negative correlation with SOM (r < −0.6), suggesting that high organic content leads to increased absorption and reduced reflectance in these regions. This aligns with prior studies that link SOM to changes in soil surface chemistry and texture, which affect NIR reflectance. Conversely, blue (450–520 nm) and green (520–590 nm) bands showed weak correlations due to higher sensitivity to surface moisture and noise.

2.1.3. Dataset Preprocessing

In this study, Cutout and Cutmix were employed as data augmentation techniques to process image data, simulating the diversity and complexity of apple diseases in real-world production environments [44]. These methods expanded the dataset from different perspectives, generating more representative samples to compensate for the limitations of actual data collection, as shown in Figure 9. Cutout randomly selects one or more rectangular regions in an image and fills them with black, simulating occlusions or physical damage that might occur in real-world scenarios. Apple fruits are often partially obscured by leaves, mechanically scratched, or impacted by external objects during transportation. Such occlusions or damage may obscure disease features, complicating disease detection. Without training on such samples, models may fail to detect or misclassify obscured or damaged fruits in practical applications. Cutmix, on the other hand, cuts a random region from one image and pastes it into another, adjusting the labels of both images accordingly. This approach simulates scenarios where multiple diseases simultaneously infect apple fruits. In real-world conditions, apple diseases often co-occur rather than appear in isolation. For instance, gray mold and apple rot frequently attack fruits simultaneously in humid environments, enlarging the affected area and complicating symptoms. Such multi-disease scenarios are common but complex, making it difficult to collect sufficient samples to cover all possible combinations. By employing Cutmix, synthetic multi-disease samples are created, significantly increasing the proportion of such samples in the training data. This allows models to better learn the compounded characteristics of multiple diseases, enhancing recognition capabilities in complex disease scenarios.
In sensor data preprocessing, outlier detection and missing value imputation were two critical steps [45]. Sensor data in this study included multiple environmental parameters, such as temperature, humidity, soil temperature, and air quality. Data were collected over several months, spanning multiple climatic phases from spring to autumn. The diverse climatic conditions in Wuyuan County, such as summer heat with heavy rainfall and large diurnal temperature variations in autumn, posed challenges to the stable operation of sensors. During heavy rain, Bosch BME280 humidity sensors could record near-saturation levels of 100% due to water droplet coverage, while DS18B20 soil temperature sensors might output abnormally high readings during prolonged heat exposure. Similarly, MQ-135 air quality sensors could register erratic fluctuations during strong winds or sandstorms due to particle blockage. If such outliers were not detected and handled, they could introduce noise, leading to biased learning of the relationship between diseases and environmental factors. A combination of statistical methods and rule-based detection strategies was applied to effectively detect outliers [46]. For time-series data, a mean and standard deviation-based method was utilized. For instance, soil temperature typically ranges between 15 °C and 25 °C within a given period. Any reading exceeding three standard deviations from the mean (>3 σ ) was flagged as an outlier. Additionally, physical constraints of sensors were incorporated to set upper and lower thresholds; for example, humidity values cannot be below 0 % or above 100 % . Readings outside these ranges were directly labeled as outliers. Outliers detected in this process were addressed using imputation methods, including mean imputation, time-series interpolation, and model-based prediction. Time-series interpolation was prioritized in this study due to its ability to leverage temporal trends in sensor data [47]. For instance, an anomalously high or low soil temperature at a specific time could be estimated based on preceding and succeeding normal readings through linear interpolation. This approach preserved data continuity while avoiding the introduction of bias. Handling missing values was another vital task in sensor data preprocessing. Missing data can result from hardware aging, power outages, or wireless transmission interference. If left unfilled, these gaps could disrupt subsequent analyses and compromise overall model training. Missing values were also imputed using time-series interpolation, with adjustments made for seasonal patterns.

2.2. Multimodal Apple Disease Detection System

The multimodal apple disease detection system establishes a complete closed-loop process from data collection to final deployment. Initially, the system collects high-resolution disease images and environmental parameter data (such as temperature, humidity, soil temperature, and air quality) through an image acquisition module and a sensor acquisition module, respectively. After preprocessing, these data are fed into the multimodal parallel transformer detection network. The image data are processed through the parallel transformer segmentation network, while the sensor data supplement environmental contextual information through a fusion module with image features. Subsequently, to address the multidimensional and multi-angular disease detection requirements, a continuous frame diffusion generation and stitching module extracts consecutive frames from video streams. This module utilizes a diffusion model to generate a complete surface-stitched image of the fruit, further enhancing the comprehensiveness and accuracy of disease region detection. Finally, the optimized detection model is deployed on lightweight mobile devices, enabling efficient and real-time apple disease detection and grading. This comprehensive process not only ensures the precision and robustness of disease detection but also offers high operational efficiency for field applications, as shown in Figure 10.

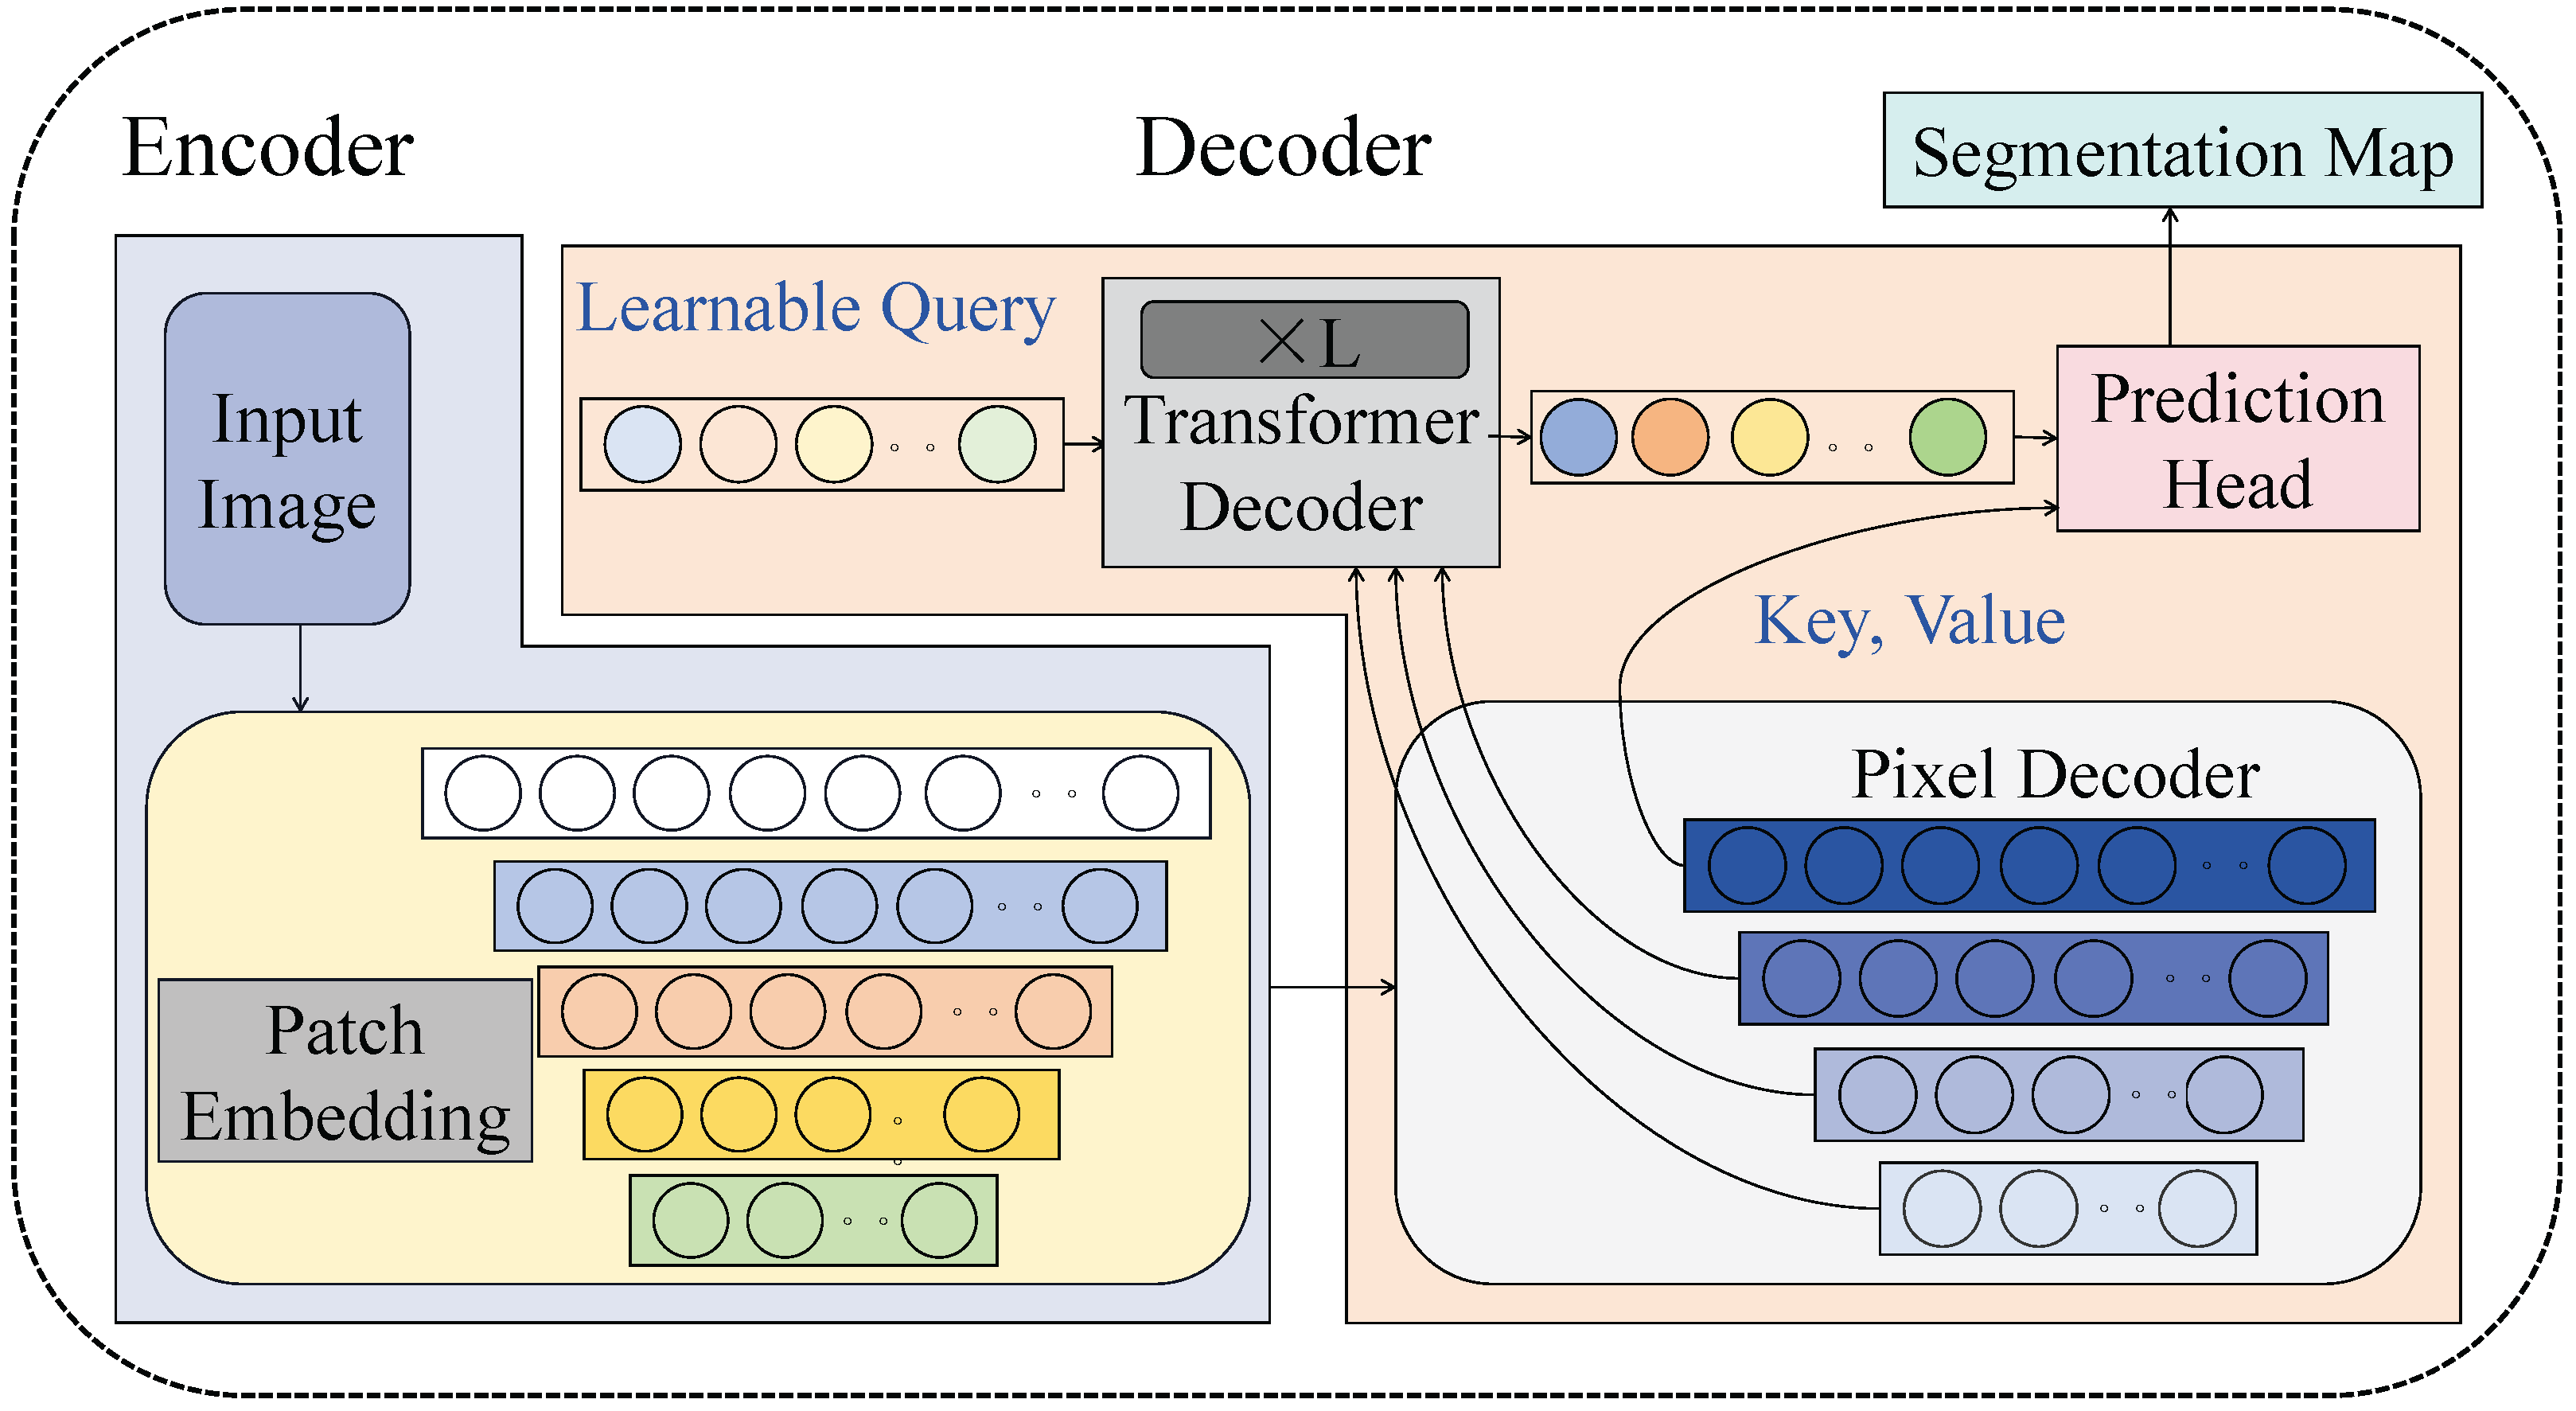
2.3. Multimodal Parallel Transformer Detection Network

The multimodal parallel transformer detection network, as shown in Figure 11, comprises an encoder and a decoder, which perform multimodal feature extraction, feature fusion, and the generation of segmentation outputs. The encoder is designed to extract multimodal features from input data, including image and sensor data, while the decoder utilizes a multi-layer transformer structure to process these features and generate disease segmentation maps.
Multimodal Feature Extraction and Fusion: The encoder processes image and sensor data through two independent data streams. Image data are first processed using a patch embedding module, which divides high-resolution images into fixed-size patches and embeds their features to produce low-dimensional feature vectors. Sensor data are normalized and temporally aligned before being embedded into a feature space with the same dimensions as the image features. To achieve multimodal feature fusion, a cross-attention module based on multi-head attention mechanisms is utilized. This module takes image features as queries (Q), and sensor features as keys (K) and values (V), dynamically allocating weights to integrate contextual environmental information. The fused multimodal feature matrix is then passed to the next stage of feature processing.
Parallel Transformer Structure: The parallel transformer structure is the core of the network. A hierarchical feature extraction strategy is employed, comprising four stages (Stage 1 to Stage 4), as illustrated in the figure. Each stage consists of self-attention (Self-Attn) and cross-attention (Cross-Attn) modules. The transformer in each stage calculates relationship matrices among features, extracting multi-scale and fine-grained feature information. For instance, input features F 1 are processed through the self-attention block in the first stage to generate higher-level feature representations F 2 . These are then further fused with sensor features via the cross-attention module, gradually constructing a hierarchical multimodal representation. The operation of the transformer at stage i can be expressed as [48]:
F i + 1 = CrossAttention ( SelfAttention ( F i ) , F sensor ) ,
where SelfAttention ( F i ) denotes the self-attention computation on the current stage features, and CrossAttention represents multimodal feature fusion.
Decoding and Segmentation: The decoder comprises multiple transformer decoder layers and a pixel decoder. The input features are refined through the decoder layers, ultimately generating segmentation maps. A learnable query module assigns learnable query vectors to each disease class, guiding feature separation and disease classification. The resulting segmentation maps accurately delineate disease regions and differentiate between various disease types.
Mathematical Analysis and Design Advantages: The pixel decoder further processes the high-dimensional features output by the transformer decoder through convolutional operations to produce high-resolution segmentation maps, which are finalized by the prediction head. The optimization objective for segmentation is based on the mean intersection over union (mIoU), calculated as follows:
IoU i = Area of Intersection i Area of Union i
mIoU = 1 N i = 1 N IoU i ,
where Area of Intersection i and Area of Union i denote the intersection and union areas between predicted and ground truth annotations for class i, and N is the total number of classes. In the continuous frame diffusion generation and stitching module, consecutive frames extracted from video streams are used to generate a complete surface view of the fruit. This module employs a diffusion model to reconstruct features and seamlessly stitch frames together, optimizing the completeness of whole-fruit detection. The diffusion model is optimized using the following loss function:
L diffusion = E x , ϵ N ( 0 , 1 ) f θ ( x + ϵ ) x 2 2 ,
where f θ represents the generative function of the diffusion model, x is the input feature, and ϵ is Gaussian noise. This multimodal parallel transformer network offers several advantages: (1) it effectively captures the diversity of disease features through parallel processing of multimodal data; (2) the cross-attention mechanism enhances the synergy between image and sensor data; and (3) the continuous frame stitching improves the comprehensiveness of disease detection on fruit surfaces. Ultimately, the network achieves high-precision disease detection and grading at a low computational cost, enabling deployment on lightweight devices and providing robust technical support for apple cultivation management.

2.4. Sensor-Image Data Fusion Module

The sensor-image data fusion module integrates image data and environmental sensor data through a hierarchical and multi-layer structure to enhance disease detection accuracy and robustness. This module, as illustrated in Figure 12, consists of multiple encoder layers, a transformer decoder, and a fusion module. Its design incorporates specific parameters for each layer, mathematical formulations, and justifications for its effectiveness in the proposed task.
The inputs to this module include image features and sensor features. Image features are extracted via a patch embedding module, which divides high-resolution images into fixed-size patches and embeds their representations to generate feature maps across four hierarchical stages: F 1 , F 2 , F 3 , and F 4 . The dimensions of these feature maps are as follows [49]:
F 1 : H 4 × W 4 × C 1 ,
F 2 : H 8 × W 8 × C 2 ,
F 3 : H 16 × W 16 × C 3 ,
F 4 : H 32 × W 32 × C 4 ,
where H and W denote the height and width of the input image, and C 1 , C 2 , C 3 , C 4 are the channel dimensions at each stage. Sensor data are normalized and aligned temporally before being embedded into the same feature space as the image data. The resulting sensor feature maps are denoted as D 2 , D 3 , and D 4 , with dimensions corresponding to their respective image features:
D 2 : H 8 × W 8 × C 2 ,
D 3 : H 16 × W 16 × C 3 ,
D 4 : H 32 × W 32 × C 4 .
The fusion of these multimodal features is accomplished through a transformer decoder employing cross-attention mechanisms. The hierarchical features F 2 , F 3 , and F 4 , processed by the transformer decoder, are upsampled to the same spatial resolution. These features are then concatenated to form a global feature representation O, computed as follows:
O = H 4 × W 4 × i = 1 4 C i .
Finally, O is passed through a multi-layer perceptron (MLP) to generate the final prediction map Y, with the following dimensions:
Y = H 4 × W 4 × C embed ,
where C embed corresponds to the number of target disease classes. The cross-attention mechanism facilitates the integration of multimodal features by dynamically capturing the relationships between sensor and image data. The attention matrix is computed as follows [50]:
Attention ( Q , K , V ) = Softmax Q K T d k V ,
where Q is the query matrix derived from image features, K and V are the key and value matrices derived from sensor features, and d k is the dimensionality of the key matrix. This operation ensures that sensor data provide contextual information to enhance the discriminative power of the image features. The hierarchical design of the module ensures that both fine-grained and global features are utilized effectively. The dynamic embedding of sensor data enriches the context for disease detection, accounting for environmental variations such as temperature, humidity, and soil conditions. The cross-attention mechanism enables robust integration of multimodal data, enhancing the detection of subtle disease characteristics. The upsampling and concatenation operations efficiently aggregate multi-scale information, facilitating precise segmentation and classification. This approach is particularly advantageous in the context of real-world agricultural applications, where diseases often exhibit significant environmental dependencies. The low computational overhead of the module ensures its suitability for deployment on lightweight devices, enabling real-time disease monitoring and management in apple orchards. Through this design, the module significantly enhances the accuracy and robustness of the proposed detection framework, making it a reliable tool for precision agriculture.

2.5. Experimental Design

2.5.1. Experimental Environment

To validate the effectiveness of the proposed multimodal apple disease detection and grading method, a high-performance experimental environment and carefully tuned hyperparameters were configured to ensure scientific rigor and reliability in the results. The hardware environment included a high-performance computing server equipped with an NVIDIA A100 GPU (80 GB memory), an Intel Xeon Gold 6248R processor, and 512 GB of RAM, supporting large-scale data processing and efficient training of deep learning models. The operating system was Ubuntu 20.04, and the deep learning framework was based on PyTorch 2.0, enabling full support for parallel processing and multimodal data fusion. NVIDIA CUDA 11.8 and cuDNN libraries were utilized to maximize the computational performance of the hardware, further enhancing model training speed and stability.
For software tools, Python 3.9 was employed as the primary programming language, supplemented by scientific computation and visualization libraries such as NumPy 1.26.4, Pandas 2.2.1, Matplotlib 3.8.4, and Seaborn 0.13.2, which were used for data preprocessing, result analysis, and visualization. The Scikit-learn library was also integrated to facilitate model evaluation and K-fold cross-validation, ensuring the statistical significance and stability of the experimental results. The AdamW optimizer [51] was selected for model training due to its improved weight decay control, enhancing convergence speed and model performance. The learning rate was set to 1 × 10 4 and managed using a cosine annealing schedule, enabling gradual decay during training to stabilize the model in later stages. The batch size was configured to 32, balancing computational resource usage and model performance. Mixed precision training techniques were employed to reduce memory consumption and accelerate training. To mitigate overfitting risks, the dropout rate was set to 0.1.
The dataset was divided into training, validation, and testing sets with a ratio of 6:2:2. The testing set was strictly held out and never involved in model training, hyperparameter tuning, or validation, ensuring an unbiased evaluation of the model’s generalization performance. To further enhance the robustness and statistical reliability of the experimental results, a 10-fold cross-validation approach was employed. Specifically, the training dataset was randomly partitioned into 10 subsets. In each iteration, one subset was used as the validation set, and the remaining nine subsets were used for training. This process was repeated 10 times, and the average performance metrics were taken as the final results. This approach effectively reduced the variability caused by different data splits, ensuring greater confidence in the experimental findings.

2.5.2. Baseline Methods

To comprehensively evaluate the performance of the proposed multimodal apple disease detection and grading method, five representative baseline models were selected for comparison, all of which are derived from research advancements in the field of disease detection. These models are widely applied in agricultural disease detection and classification, providing diverse technical solutions for disease recognition. By comparing these models, the strengths and areas for improvement of the proposed method can be clearly identified. The first baseline, AFU-Net, is an improved model based on U-Net [52]. By incorporating attention mechanisms and feature fusion modules, AFU-Net effectively enhances the segmentation capability for disease regions. The second baseline, Mask R-CNN, is a general-purpose object detection and instance segmentation model that has been extensively applied in smart agriculture [53]. Combining an RPN with an FCN, Mask R-CNN efficiently performs object detection and segmentation tasks. In the context of apple leaf disease recognition, it demonstrates strong accuracy and robustness, particularly excelling in multi-object detection tasks. The third baseline, U-Net++, is an advanced version of U-Net that incorporates dense skip connections and sub-network modules to enrich feature extraction and enhance model representation capabilities [54]. It has been applied in the classification and segmentation of leaf diseases in agriculture, showing superior performance in fine-grained feature extraction tasks. The fourth baseline, Deep Learning-based Classification, is a conventional fruit disease classification model based on CNNs [55]. This model is characterized by its simplicity, ease of implementation, and high accuracy in single-disease classification tasks. Lastly, TinySegformer, a lightweight visual segmentation model designed specifically for real-time disease detection in agricultural scenarios, was included as a baseline [29]. Its remarkable performance in resource-constrained environments makes it a suitable benchmark for evaluating mobile deployment scenarios. First, they represent a diverse set of learning paradigms in machine learning. KNN is a non-parametric, instance-based learning algorithm that captures local spatial patterns; Decision Trees are interpretable, rule-based models that serve as a foundation for ensemble techniques; Random Forests, as a bagging-based ensemble method, offer strong generalization capabilities and robustness to noise; SVM provides a high-performing, margin-based classifier that excels in small to medium-sized, high-dimensional datasets; XGBoost is a gradient-boosted decision tree model known for its high predictive accuracy and scalability, widely used in industry. Second, the diversity and complexity of UAV-based agricultural data, which include medium-sized datasets with high dimensionality and spatial heterogeneity, demand an evaluation of both simple and complex models. While KNN and Decision Trees are computationally efficient and easy to interpret—making them suitable for field deployment—more powerful models like XGBoost serve as benchmarks to validate performance ceilings under the same data constraints.

2.5.3. Evaluation Metrics

To evaluate the proposed apple disease detection and grading model, four metrics were used: Accuracy, Precision, Recall, and mIoU. These metrics assess both classification and grading performance. The calculation results are shown in the following equations.
Accuracy = T P + T N T P + T N + F P + F N
Precision = T P T P + F P
Recall = T P T P + F N
Here, T P , T N , F P , and F N represent true positives, true negatives, false positives, and false negatives, respectively.

3. Results and Discussion

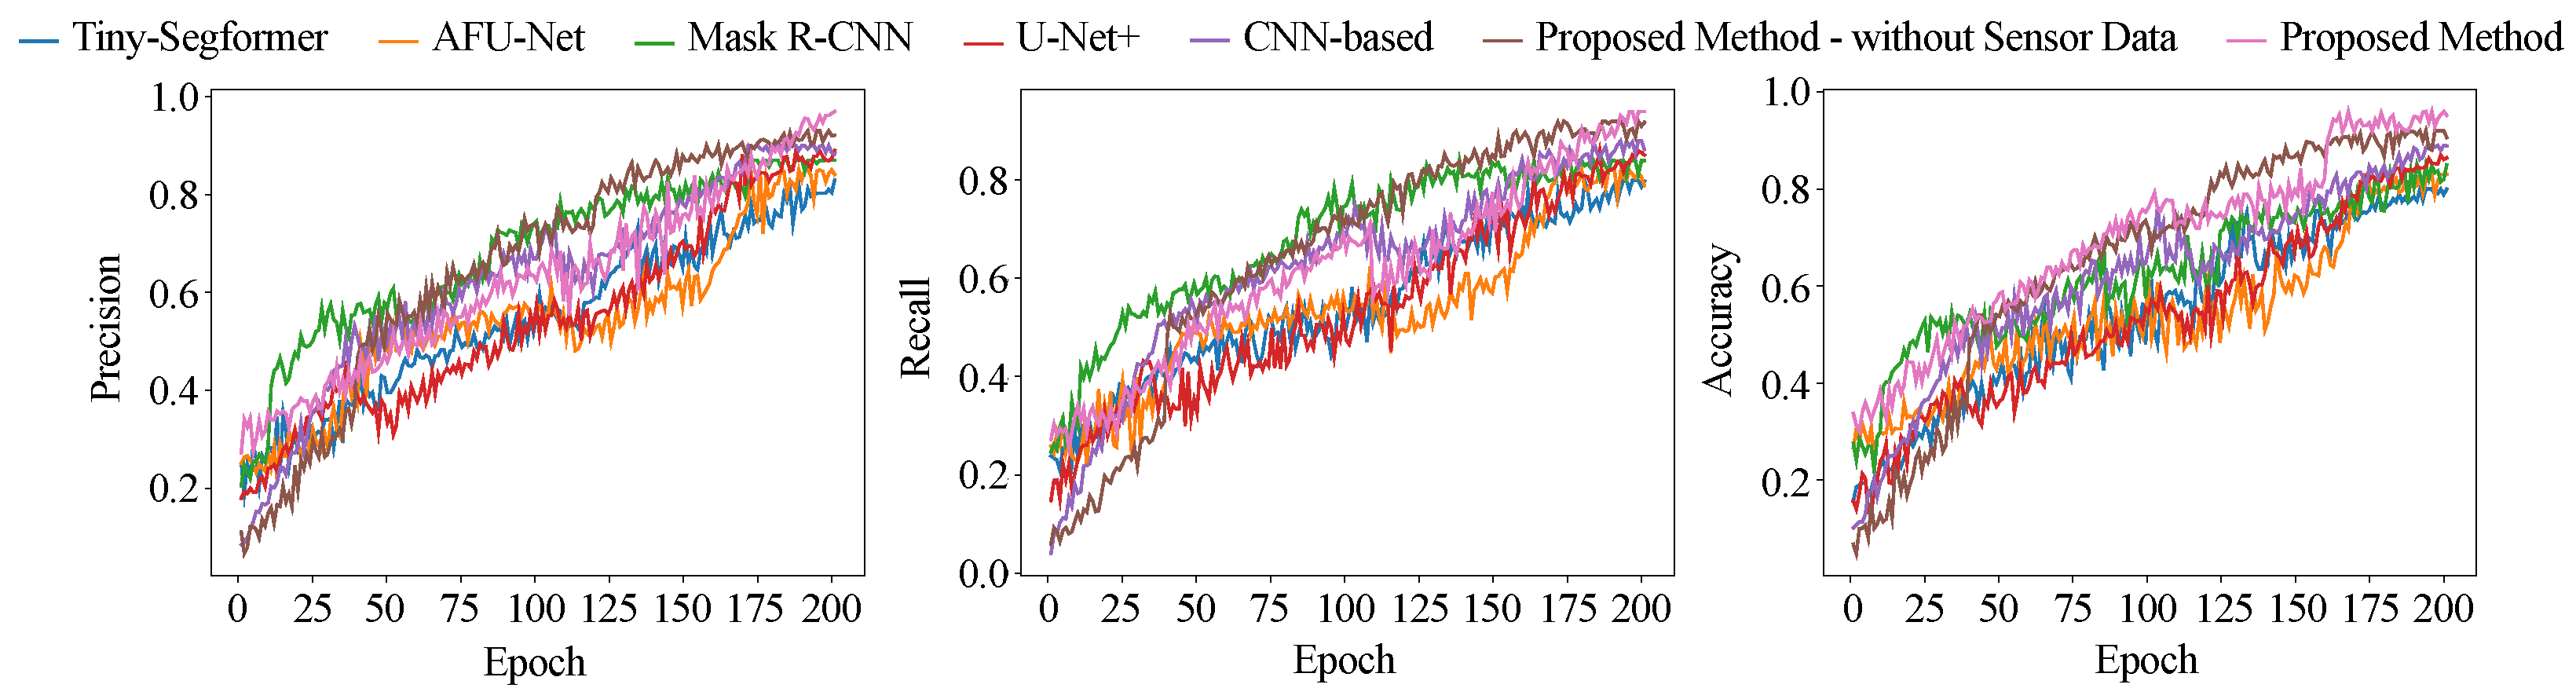
3.1. Apple Disease Classification Results

The apple disease classification experiment was designed to evaluate the detection and classification capabilities of different models across multiple metrics, including precision, recall, and accuracy. The purpose was to quantify the performance of the proposed method compared to existing approaches, particularly examining the impact of incorporating sensor data on model performance. This experiment validated the effectiveness of multimodal fusion techniques and demonstrated the superiority of the proposed method in complex disease detection scenarios. The experimental results, as shown in Table 3 and Figure 13, reveal significant differences in performance across the evaluated models. Tiny-Segformer, as a lightweight model, achieved precision, recall, and accuracy of 0.83, 0.80, and 0.81, respectively. While computationally efficient, its ability to handle complex disease scenarios was limited, particularly in cases involving overlapping or combined disease features. AFU-Net and Mask R-CNN, as classical segmentation models, demonstrated improved performance over Tiny-Segformer due to deeper feature extraction structures and instance segmentation capabilities. Mask R-CNN achieved an accuracy of 0.85 but remained constrained in modeling global contextual information, which limited its overall detection performance. U-Net+ and CNN models outperformed the aforementioned approaches, with recall values reaching 0.86 and 0.88, respectively, indicating a notable reduction in false negatives. These results reflect their stronger capabilities in capturing fine-grained features and reducing missed detections. However, their robustness to diverse disease types and environmental variations was still insufficient for more challenging disease classification tasks.
The proposed method exhibited significant advantages over all baseline models. Without sensor data, it achieved precision, recall, and accuracy of 0.93, 0.92, and 0.92, respectively, surpassing the best-performing existing methods. This improvement can be attributed to the parallel transformer architecture, which leverages multi-layer self-attention mechanisms to extract multi-scale image features and capture both global and local disease characteristics. For instance, in distinguishing between similar diseases such as apple scab and black rot, the proposed method effectively reduced misclassification rates through enhanced feature representations. Furthermore, the incorporation of sensor data further amplified the model’s performance, increasing precision, recall, and accuracy to 0.97, 0.94, and 0.96, respectively. This enhancement was driven by the integration of environmental context, such as humidity and temperature, which influence disease characteristics. Mathematically, this multimodal fusion was realized through a cross-attention mechanism, embedding sensor features into the image feature space and dynamically adjusting attention weights for different disease features.

3.2. Analysis of Detection Accuracy Across Different Apple Diseases

The purpose of this experiment was to evaluate the accuracy of various models in classifying different types of apple diseases, such as apple scab and black rot, and to comprehensively compare their performance in complex scenarios. Particular attention was given to assessing the proposed method under conditions where sensor data were not utilized. This setup was intended to simulate real-world scenarios where only image data are available, such as in orchards lacking environmental sensors or with incomplete data acquisition. The results are presented in Table 4 and Figure 14.
The results indicate significant differences in accuracy across models for various diseases. Tiny-Segformer, as a lightweight model, demonstrated relatively lower accuracy across all diseases, with values ranging from 0.81 to 0.86. Although computationally efficient, its limited ability to capture complex disease characteristics, particularly in scenarios involving overlapping or similar disease symptoms, constrained its performance. AFU-Net and Mask R-CNN, leveraging feature fusion modules and instance segmentation techniques, showed improved accuracy for certain diseases, such as black rot and gray mold, reaching 0.87 and 0.86, respectively. However, their overall performance remained restricted by the single-modality nature of their feature extraction. For example, Mask R-CNN achieved an accuracy of 0.85 for apple powdery mildew, slightly lower than U-Net+ and CNN models. U-Net+ outperformed the aforementioned models in both feature extraction and segmentation capabilities, achieving consistently higher accuracy across all diseases, with a peak value of 0.89. This performance is attributed to its use of dense skip connections, which effectively capture multi-scale features and improve the precision of disease boundary segmentation. CNN achieved the most balanced performance, demonstrating high accuracy for disease classification, particularly for apple rot and apple powdery mildew, with values of 0.90 and 0.91, respectively. These results highlight the strong local feature extraction capabilities of CNN models, enabled by their convolutional kernel design. However, their limitations in modeling global contextual information rendered them slightly less effective in handling complex disease scenarios compared to the proposed method. The proposed method, even without sensor data, exhibited clear advantages, achieving accuracy values that significantly surpassed all baseline models. Its accuracy ranged from 0.90 (anthracnose) to 0.93 (apple scab and gray mold).

3.3. Analysis of Apple Disease Severity Classification Results

This experiment aimed to explore the performance differences in various models in the task of classifying multiple apple diseases, such as Apple Scab and Black Rot, and to quantify the strengths and limitations of each model in specific disease scenarios by comparing their classification accuracy. Particular emphasis was placed on evaluating the overall performance of the proposed method in disease severity classification tasks, to verify whether it could achieve superior and stable performance across various disease characteristics. As shown in Figure 15, the experimental results reveal that while Tiny-Segformer offers advantages in lightweight design and real-time applicability, its ability to distinguish between multiple diseases is relatively weak, with classification accuracy ranging between 0.81 and 0.86. AFU-Net and Mask R-CNN demonstrate improved performance for certain diseases but struggle with complex boundaries in diseases such as Apple Powdery Mildew and Anthracnose. U-Net+ and CNN, benefiting from multi-layer feature extraction architectures, significantly enhance classification capabilities in complex scenarios, with uniformly distributed accuracy, excelling particularly in Apple Rot and Apple Powdery Mildew. However, the proposed method achieves significantly higher accuracy for all diseases compared to other models, with a classification accuracy of 0.94 for Apple Scab. This indicates that the proposed method not only captures the characteristics of individual diseases with precision but also adapts better to scenarios involving overlapping disease features and complex distributions.

3.4. Confidence Analysis of Experimental Results

The purpose of this experiment was to evaluate the robustness and performance stability of different models in disease detection tasks through statistical analysis of their distribution characteristics and confidence intervals. The experiment aimed to quantify whether the prediction results of each model exhibit statistical significance and to investigate their consistency across multiple runs. Particular attention was given to the proposed method to analyze its ability to maintain stable predictive performance in complex disease detection scenarios by comparing the dispersion of results across models. Such analysis holds significant importance for practical deployment, especially in dynamic and complex orchard environments, where model stability directly impacts the reliability of detection outcomes.
As shown in Figure 16, the violin plots intuitively illustrate the distribution and central tendencies of test scores across different models. The distribution of Tiny-Segformer is relatively concentrated but exhibits low overall test scores (approximately 80–82), indicating consistent performance in simple scenarios but limited capability in handling complex features. The test scores of AFU-Net and Mask R-CNN are concentrated in the ranges of 82–84 and 84–86, respectively, with relatively even distributions. This reflects their ability to recognize certain disease features but highlights their shortcomings in boundary feature extraction and global contextual modeling. U-Net+ and CNN are closer to the high-score range (86–89), with CNN showing particularly high peaks, indicating its strength in local feature extraction. However, these models still exhibit variability in extreme scenarios, such as overlapping diseases. In contrast, the proposed method demonstrated a distribution not only closer to the high-score range (90–94) but also with a narrower range of dispersion, indicating significantly greater stability in performance across multiple runs compared to other methods.

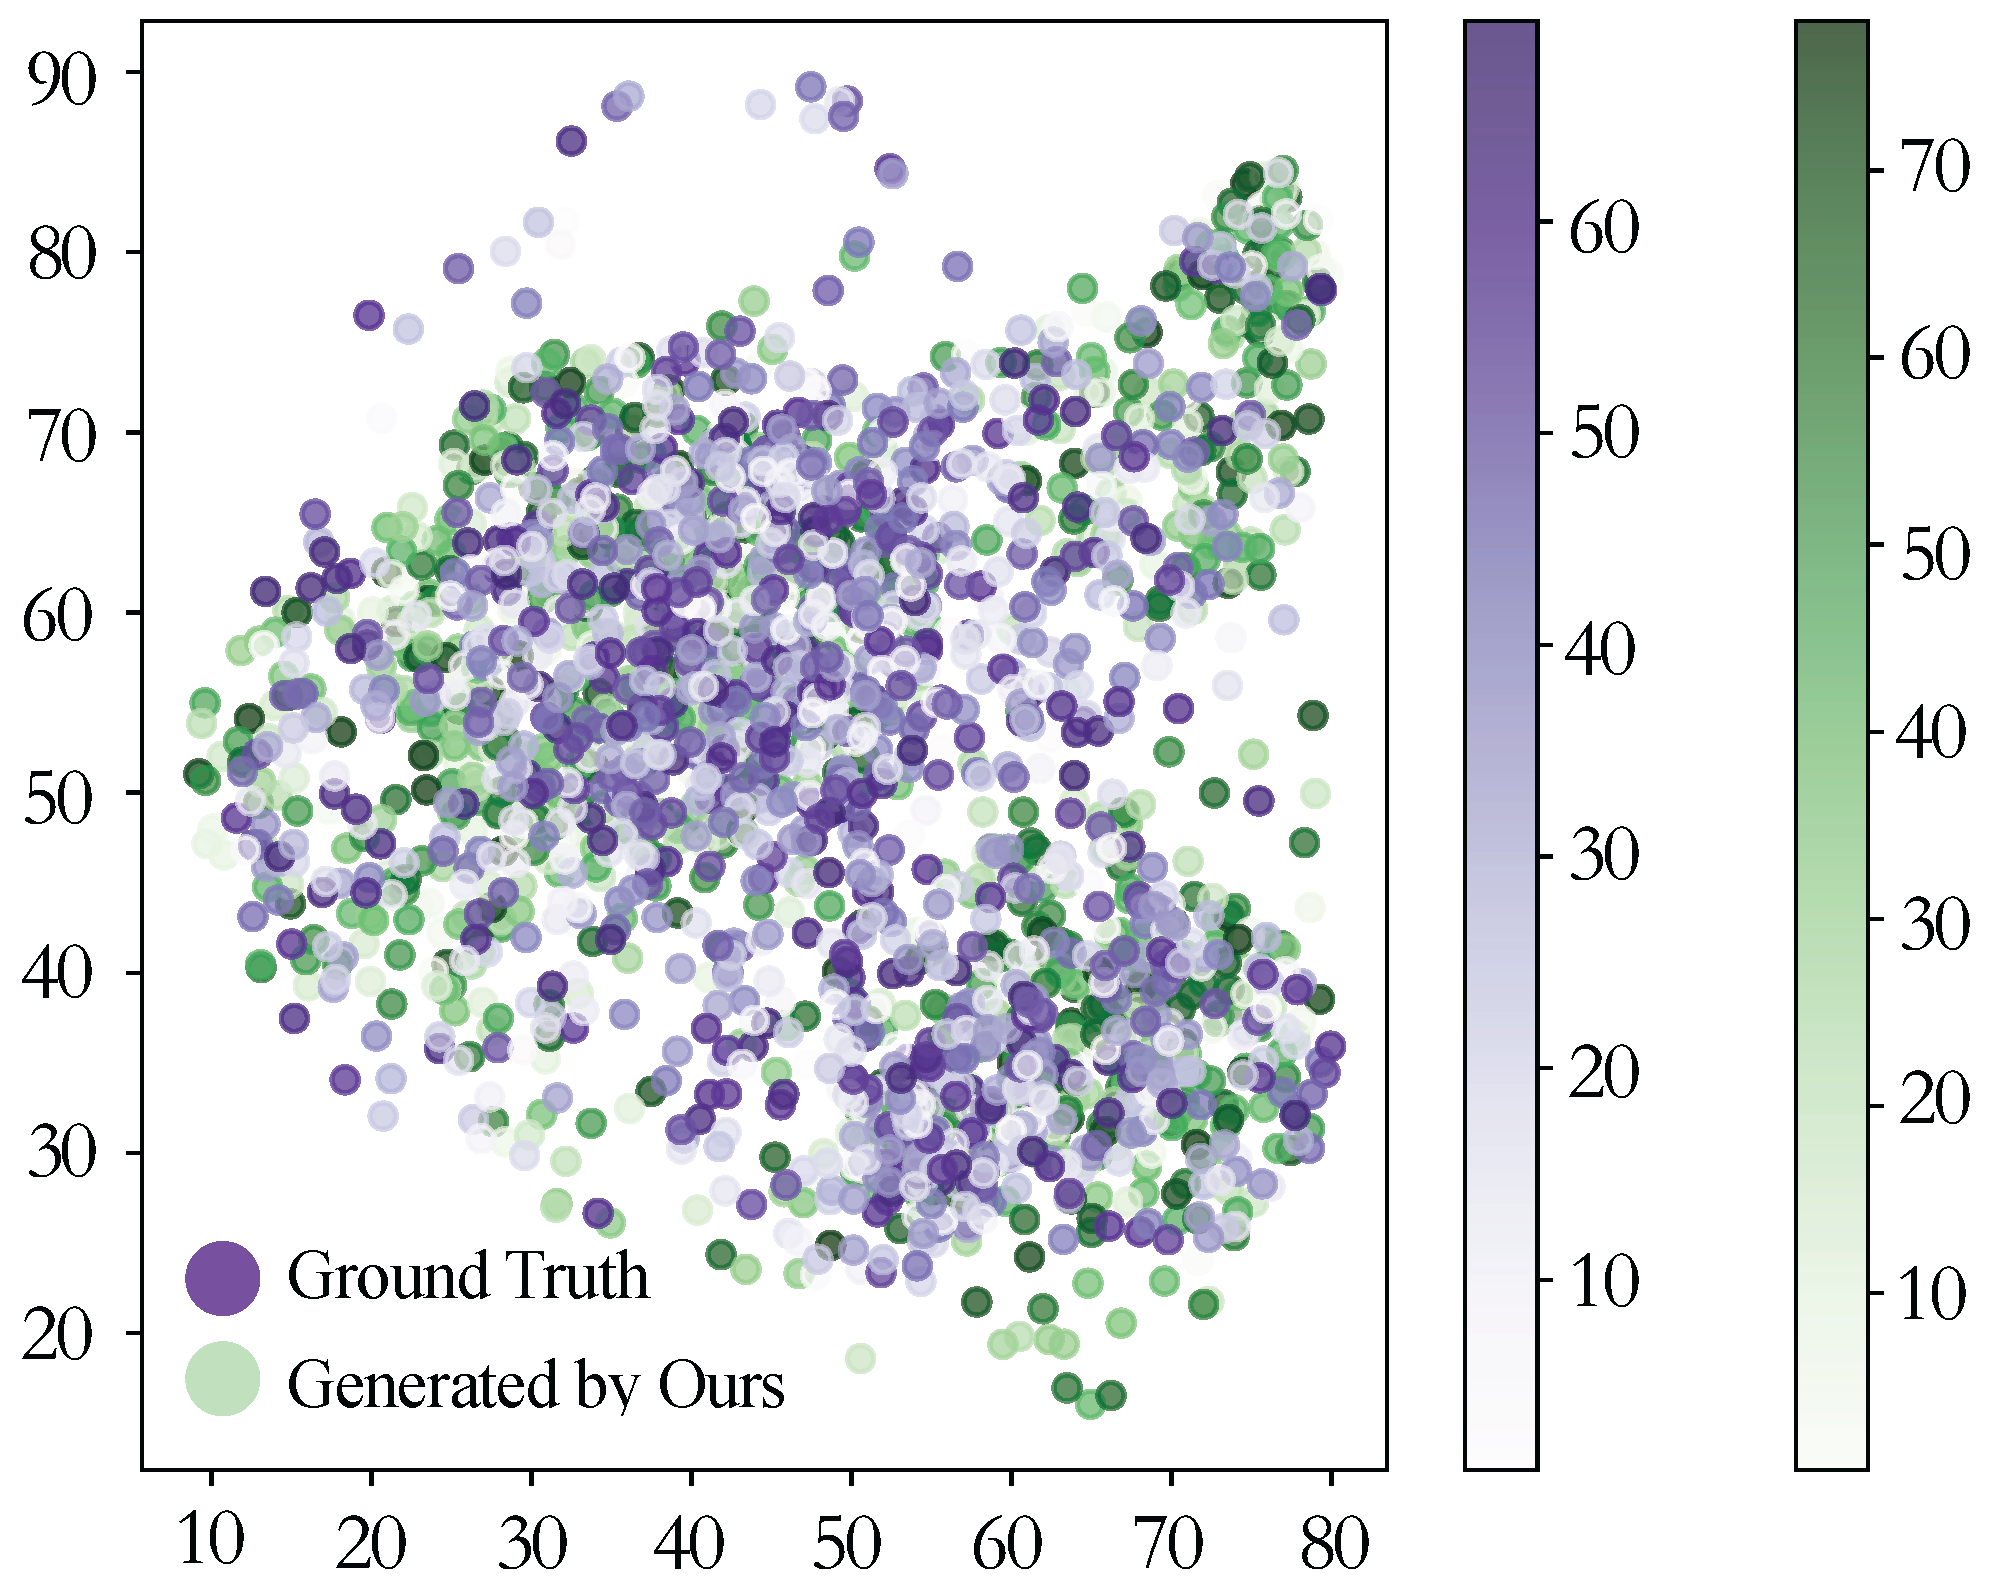
3.5. t-SNE Validation Experiment for Consecutive Frame Diffusion Generation

The t-SNE validation experiment for consecutive frame diffusion generation was designed to evaluate the capability of the proposed method in modeling the distribution of apple disease data in high-dimensional feature space, particularly focusing on the similarity between generated disease features and real feature distributions. By conducting dimensionality reduction and visual analysis of the generated and real features, the experiment validated the effectiveness of the consecutive frame diffusion generation module. The objective was to determine whether this module could approximate real features in spatial distribution, thereby enhancing the model’s global representation of disease regions.
As shown in Figure 17, the green points represent the real feature distribution, while the purple points represent the features generated by the proposed method. It can be observed that the generated features exhibit a distribution pattern highly consistent with the real features, with significant clustering alignment in most regions. This indicates that the diffusion generation module effectively captures the global characteristics of disease regions through frame-by-frame modeling and reconstructs spatial distributions with high realism. Theoretically, this capability stems from the iterative optimization mechanism of the diffusion model, which minimizes the distance between the generated and real distributions, gradually approximating the real data distribution in high-dimensional feature space. This mechanism is achieved through the loss function proposed in Section 2.3 and defined in Equation (1).

3.6. Validation of Deployment on Handheld Mobile Devices

This experiment was designed to evaluate the real-time performance and operational efficiency of the proposed disease detection method on handheld mobile devices, thereby verifying its feasibility and superiority in practical applications. The development process of the method involves a series of optimization steps from model design to deployment, ensuring its efficiency in resource-constrained mobile environments. Specifically, during the training phase, the model adopts a multimodal parallel transformer structure, leveraging self-attention and cross-attention mechanisms to extract both global and local features of diseases, while integrating environmental sensor data to enhance detection accuracy. During the deployment phase, various lightweight optimization techniques, including model pruning, quantization, and knowledge distillation, were applied to reduce computational complexity and storage requirements significantly without compromising detection accuracy.
The experimental results presented in Table 5 demonstrate that the proposed method achieves a frame rate (Frames Per Second, FPS) of 46 on handheld devices, significantly outperforming other methods. Tiny-Segformer, owing to its inherently lightweight design, achieved 41 FPS but fell short of the proposed method in detection accuracy. AFU-Net, Mask R-CNN, and U-Net+ achieved frame rates of 20, 19, and 21 FPS, respectively, highlighting their strong feature extraction capabilities but limited operational efficiency due to their complex network structures. The CNN-based model recorded 17 FPS, further illustrating the challenges traditional deep learning models face in mobile deployment. The superior efficiency of the proposed method is attributed to the hierarchical feature extraction in the transformer module and the efficient parameter-sharing design, combined with lightweight optimization techniques. This allows the model to maintain high accuracy while achieving real-time detection with reduced computational cost, providing a robust and efficient solution for smart agricultural applications.

3.7. Cross-Field Generalization Test

To evaluate the model’s ability to generalize across spatial domains, we conducted a leave-one-location-out cross-validation test. The dataset was split into three locations, and in each round, one field was used for testing while the other two were used for training. Table 6 shows that accuracy, precision, and recall remained highly stable across regions, with differences under 2%, indicating the model’s strong spatial generalization capacity.

3.8. Limitation and Feature Work

Despite the promising results achieved by the proposed method, several limitations remain to be addressed in future research. First, although the integration of sensor and image data enhances detection robustness, the model’s performance may still degrade in scenarios with incomplete or missing modalities, such as sensor failure or occlusion during image acquisition. Second, while the current approach demonstrates strong generalization across different regions, its adaptability to unseen climatic extremes or rare disease variants has not been fully validated. Third, the diffusion-based frame generation module, though effective in reconstructing continuous views, incurs additional computational overhead, which may limit deployment on ultra-low-power edge devices. Future work will focus on enhancing model robustness under missing modality conditions, incorporating larger-scale cross-regional datasets to improve generalizability, and exploring more efficient architectures for diffusion modeling to support ultra-lightweight deployment.

4. Conclusions

Apples, as one of the most widely cultivated and economically significant crops globally, face various disease threats during production, posing significant challenges to orchard management and economic efficiency. To address the complex characteristics of apple diseases and diverse environmental factors, this study proposed a multi-modal parallel transformer-based apple disease detection and classification method. By incorporating multi-modal data fusion and lightweight optimization techniques, the accuracy and robustness of disease detection were significantly improved. The proposed method outperformed mainstream models across multiple experiments. In disease classification tasks, the method achieved an accuracy of 92% and a precision of 93% without using sensor data. When sensor data were integrated, the accuracy further improved to 96%, with precision and recall reaching 97% and 94%, respectively, demonstrating the effectiveness of multi-modal data fusion. In disease severity classification tasks, the proposed method achieved a maximum classification accuracy of 94% for diseases such as apple scab and demonstrated stable performance across all disease categories. Moreover, through the t-SNE validation experiment using continuous frame diffusion generation, the generated feature distributions were highly consistent with the real features, showcasing the method’s outstanding ability to model high-dimensional features. The handheld device deployment experiment further validated the practicality of the proposed method. By integrating lightweight techniques such as model pruning and quantization, the method achieved a frame rate of 46 FPS on mobile devices, combining high precision with real-time performance. The main innovations of this study include the introduction of a parallel transformer architecture for multi-scale feature extraction and multi-modal data fusion, the design of a diffusion generation module to optimize disease representation, and the development of lightweight strategies to meet deployment requirements. These findings not only provide an efficient and accurate solution for orchard disease monitoring but also lay a solid technical foundation for the further development of smart agriculture.

Author Contributions

Conceptualization, C.Z., X.G., Y.C., and C.L.; data curation, M.W. and M.J.; formal analysis, Z.S. and T.W.; funding acquisition, C.L.; investigation, Z.S.; methodology, C.Z., X.G., and Y.C.; project administration, C.L.; resources, M.W., M.J., and T.W.; software, C.Z., X.G., and Y.C.; supervision, C.L.; validation, C.Z. and Z.S.; visualization, M.W., M.J., and T.W.; writing—original draft, X.G., Y.C., M.W., Z.S., M.J., T.W., and C.L. All authors have read and agreed to the published version of the manuscript.

Funding

The authors would like to express their sincere gratitude to the Computer Association of China Agricultural University (ECC) for their valuable technical support. Upon the acceptance of this paper, the project code and the dataset will be made publicly available to facilitate further research and development in this field.

Data Availability Statement

The data presented in this study are available on request from the corresponding author.

Conflicts of Interest

The authors declare no conflicts of interest.

References

  1. Mhamed, M.; Zhang, Z.; Yu, J.; Li, Y.; Zhang, M. Advances in apple’s automated orchard equipment: A comprehensive research. Comput. Electron. Agric. 2024, 221, 108926. [Google Scholar] [CrossRef]
  2. FAO. World Food and Agriculture—Statistical Yearbook; FAO: Rome, Italy, 2023. [Google Scholar] [CrossRef]
  3. Nabi, F.; Jamwal, S.; Padmanbh, K. Wireless sensor network in precision farming for forecasting and monitoring of apple disease: A survey. Int. J. Inf. Technol. 2022, 14, 769–780. [Google Scholar] [CrossRef]
  4. Zhang, W.; Zhou, G.; Chen, A.; Hu, Y. Deep multi-scale dual-channel convolutional neural network for Internet of Things apple disease detection. Comput. Electron. Agric. 2022, 194, 106749. [Google Scholar] [CrossRef]
  5. Shin, J.; Chang, Y.K.; Heung, B.; Nguyen-Quang, T.; Price, G.W.; Al-Mallahi, A. A deep learning approach for RGB image-based powdery mildew disease detection on strawberry leaves. Comput. Electron. Agric. 2021, 183, 106042. [Google Scholar] [CrossRef]
  6. Sharma, M.; Jindal, V. Approximation techniques for apple disease detection and prediction using computer enabled technologies: A review. Remote Sens. Appl. Soc. Environ. 2023, 32, 101038. [Google Scholar] [CrossRef]
  7. Logashov, D.; Shadrin, D.; Somov, A.; Pukalchik, M.; Uryasheva, A.; Gupta, H.P.; Rodichenko, N. Apple trees diseases detection through computer vision in embedded systems. In Proceedings of the 2021 IEEE 30th International Symposium on Industrial Electronics (ISIE), Kyoto, Japan, 20–23 June 2021; IEEE: New York, NY, USA, 2021; pp. 1–6. [Google Scholar]
  8. Zhang, Y.; Wa, S.; Zhang, L.; Lv, C. Automatic plant disease detection based on tranvolution detection network with GAN modules using leaf images. Front. Plant Sci. 2022, 13, 875693. [Google Scholar] [CrossRef]
  9. Dosovitskiy, A.; Beyer, L.; Kolesnikov, A.; Weissenborn, D.; Zhai, X.; Unterthiner, T.; Dehghani, M.; Minderer, M.; Heigold, G.; Gelly, S.; et al. An image is worth 16x16 words: Transformers for image recognition at scale. arXiv 2020, arXiv:2010.11929. [Google Scholar]
  10. Liu, Z.; Lin, Y.; Cao, Y.; Hu, H.; Wei, Y.; Zhang, Z.; Lin, S.; Guo, B. Swin Transformer: Hierarchical Vision Transformer using Shifted Windows. In Proceedings of the 2021 IEEE/CVF International Conference on Computer Vision (ICCV), Montreal, QC, Canada, 10–17 October 2021; pp. 9992–10002. [Google Scholar] [CrossRef]
  11. Xie, E.; Wang, W.; Yu, Z.; Anandkumar, A.; Álvarez, J.M.; Luo, P. SegFormer: Simple and Efficient Design for Semantic Segmentation with Transformers. Adv. Neural Inf. Process. Syst. 2021, 34, 12077–12090. [Google Scholar]
  12. Chen, J.; Mao, Q.; Liu, D. Dual-path transformer network: Direct context-aware modeling for end-to-end monaural speech separation. arXiv 2020, arXiv:2007.13975. [Google Scholar]
  13. Chen, C.; Fan, Q.; Panda, R. CrossViT: Cross-Attention Multi-Scale Vision Transformer for Image Classification. In Proceedings of the 2021 IEEE/CVF International Conference on Computer Vision Workshops (ICCVW), Montreal, BC, Canada, 11–17 October 2021. [Google Scholar]
  14. Radford, A.; Kim, J.W.; Hallacy, C.; Ramesh, A.; Goh, G.; Agarwal, S.; Sastry, G.; Askell, A.; Mishkin, P.; Clark, J.; et al. Learning Transferable Visual Models From Natural Language Supervision. In Proceedings of the 38th International Conference on Machine Learning, Online, 18–24 July 2021. [Google Scholar]
  15. Li, J.; Selvaraju, R.R.; Gotmare, A.D.; Joty, S.R.; Xiong, C.; Hoi, S.C.H. Align before Fuse: Vision and Language Representation Learning with Momentum Distillation. Adv. Neural Inf. Process. Syst. 2021, 34, 9694–9705. [Google Scholar]
  16. Wang, W.; Bao, H.; Dong, L.; Bjorck, J.; Peng, Z.; Liu, Q.; Aggarwal, K.; Mohammed, O.K.; Singhal, S.; Som, S.; et al. Image as a foreign language: Beit pretraining for vision and vision-language tasks. In Proceedings of the IEEE/CVF Conference on Computer Vision and Pattern Recognition, Vancouver, BC, Canada, 17–24 June 2023; pp. 19175–19186. [Google Scholar]
  17. Zhang, Y.; He, N.; Yang, J.; Li, Y.; Wei, D.; Huang, Y.; Zhang, Y.; He, Z.; Zheng, Y. mmformer: Multimodal medical transformer for incomplete multimodal learning of brain tumor segmentation. In International Conference on Medical Image Computing and Computer-Assisted Intervention; Springer: Cham, Switzerland, 2022; pp. 107–117. [Google Scholar]
  18. Zhu, X.; Zhu, J.; Li, H.; Wu, X.; Wang, X.; Li, H.; Wang, X.; Dai, J. Uni-Perceiver: Pre-training Unified Architecture for Generic Perception for Zero-shot and Few-shot Tasks. In Proceedings of the IEEE/CVF Conference on Computer Vision and Pattern Recognition, New Orleans, LA, USA, 18–24 June 2022. [Google Scholar]
  19. Uryasheva, A.; Kalashnikova, A.; Shadrin, D.; Evteeva, K.; Moskovtsev, E.; Rodichenko, N. Computer vision-based platform for apple leaves segmentation in field conditions to support digital phenotyping. Comput. Electron. Agric. 2022, 201, 107269. [Google Scholar] [CrossRef]
  20. Gongal, A.; Silwal, A.; Amatya, S.; Karkee, M.; Zhang, Q.; Lewis, K. Apple crop-load estimation with over-the-row machine vision system. Comput. Electron. Agric. 2016, 120, 26–35. [Google Scholar] [CrossRef]
  21. Zhou, X.; Chen, S.; Ren, Y.; Zhang, Y.; Fu, J.; Fan, D.; Lin, J.; Wang, Q. Atrous Pyramid GAN Segmentation Network for Fish Images with High Performance. Electronics 2022, 11, 911. [Google Scholar] [CrossRef]
  22. Zhang, Y.; Wa, S.; Liu, Y.; Zhou, X.; Sun, P.; Ma, Q. High-accuracy detection of maize leaf diseases CNN based on multi-pathway activation function module. Remote Sens. 2021, 13, 4218. [Google Scholar] [CrossRef]
  23. Zhang, J.; He, L.; Karkee, M.; Zhang, Q.; Zhang, X.; Gao, Z. Branch detection for apple trees trained in fruiting wall architecture using depth features and Regions-Convolutional Neural Network (R-CNN). Comput. Electron. Agric. 2018, 155, 386–393. [Google Scholar] [CrossRef]
  24. Gao, F.; Fu, L.; Zhang, X.; Majeed, Y.; Li, R.; Karkee, M.; Zhang, Q. Multi-class fruit-on-plant detection for apple in SNAP system using Faster R-CNN. Comput. Electron. Agric. 2020, 176, 105634. [Google Scholar] [CrossRef]
  25. Kutyrev, A.; Kiktev, N.A.; Kalivoshko, O.; Rakhmedov, R.S. Recognition and Classification Apple Fruits Based on a Convolutional Neural Network Model. In Proceedings of the Information Technology and Implementation, Kyiv, Ukraine, 30 November–2 December 2022; pp. 90–101. [Google Scholar]
  26. Patrício, D.I.; Rieder, R. Computer vision and artificial intelligence in precision agriculture for grain crops: A systematic review. Comput. Electron. Agric. 2018, 153, 69–81. [Google Scholar] [CrossRef]
  27. Majeed, Y.; Zhang, J.; Zhang, X.; Fu, L.; Karkee, M.; Zhang, Q.; Whiting, M.D. Deep learning based segmentation for automated training of apple trees on trellis wires. Comput. Electron. Agric. 2020, 170, 105277. [Google Scholar] [CrossRef]
  28. Shrestha, G.; Das, M.; Dey, N. Plant disease detection using CNN. In Proceedings of the 2020 IEEE applied signal processing conference (ASPCON), Kolkata, India, 7–9 October 2020; IEEE: New York, NY, USA, 2020; pp. 109–113. [Google Scholar]
  29. Zhang, Y.; Lv, C. TinySegformer: A lightweight visual segmentation model for real-time agricultural pest detection. Comput. Electron. Agric. 2024, 218, 108740. [Google Scholar] [CrossRef]
  30. Xiao, B.; Nguyen, M.; Yan, W.Q. Apple ripeness identification from digital images using transformers. Multimed. Tools Appl. 2024, 83, 7811–7825. [Google Scholar] [CrossRef]
  31. Aslan, E.; Özüpak, Y. Diagnosis and accurate classification of apple leaf diseases using Vision transformers. Comput. Decis. Making Int. J. 2024, 1, 1–12. [Google Scholar] [CrossRef]
  32. Borhani, Y.; Khoramdel, J.; Najafi, E. A deep learning based approach for automated plant disease classification using vision transformer. Sci. Rep. 2022, 12, 11554. [Google Scholar] [CrossRef] [PubMed]
  33. Guo, Y.; Lan, Y.; Chen, X. CST: Convolutional Swin Transformer for detecting the degree and types of plant diseases. Comput. Electron. Agric. 2022, 202, 107407. [Google Scholar] [CrossRef]
  34. Raza, A.; Safdar, M.; Ali, H.; Iftikhar, M.; Ishfaqe, Q.; Al Ansari, M.S.; Wang, P.; Khan, A.S. Automated Plant Disease Detection: A Convergence of Agriculture and Technology. In Agriculture and Aquaculture Applications of Biosensors and Bioelectronics; IGI Global: Hershey, PA, USA, 2024; pp. 266–295. [Google Scholar]
  35. Patle, K.S.; Saini, R.; Kumar, A.; Palaparthy, V.S. Field evaluation of smart sensor system for plant disease prediction using LSTM network. IEEE Sens. J. 2021, 22, 3715–3725. [Google Scholar] [CrossRef]
  36. Gui, P.; Dang, W.; Zhu, F.; Zhao, Q. Towards automatic field plant disease recognition. Comput. Electron. Agric. 2021, 191, 106523. [Google Scholar] [CrossRef]
  37. MacHardy, W.E. Apple Scab: Biology, Epidemiology, and Management; APS Press: St. Paul, MN, USA, 1996. [Google Scholar]
  38. Ji-Chuan, K.; Crous, P.W.; Mchau, G.R.; Serdani, M.; Shan-Mei, S. Phylogenetic analysis of Alternaria spp. associated with apple core rot and citrus black rot in South Africa. Mycol. Res. 2002, 106, 1151–1162. [Google Scholar]
  39. Roberts, R. Postharvest biological control of gray mold of apple by Cryptococcus laurentii. Phytopathology 1990, 80, 526–530. [Google Scholar] [CrossRef]
  40. Turechek, W.W. Apple diseases and their management. In Diseases of Fruits and Vegetables Volume I: Diagnosis and Management; Springer: Dordrecht, The Netherlands, 2004; pp. 1–108. [Google Scholar]
  41. Strickland, D.A.; Hodge, K.T.; Cox, K.D. An examination of apple powdery mildew and the biology of Podosphaera leucotricha from past to present. Plant Health Prog. 2021, 22, 421–432. [Google Scholar] [CrossRef]
  42. Kim, Y.S.; Balaraju, K.; Jeon, Y. Biological control of apple anthracnose by Paenibacillus polymyxa APEC128, an antagonistic rhizobacterium. Plant Pathol. J. 2016, 32, 251. [Google Scholar] [CrossRef]
  43. Tang, W.; Ding, Z.; Zhou, Z.; Wang, Y.; Guo, L. Phylogenetic and pathogenic analyses show that the causal agent of apple ring rot in China is Botryosphaeria dothidea. Plant Dis. 2012, 96, 486–496. [Google Scholar] [CrossRef]
  44. He, Y.; Zhang, N.; Ge, X.; Li, S.; Yang, L.; Kong, M.; Guo, Y.; Lv, C. Passion Fruit Disease Detection Using Sparse Parallel Attention Mechanism and Optical Sensing. Agriculture 2025, 15, 733. [Google Scholar] [CrossRef]
  45. Krishnamurthi, R.; Kumar, A.; Gopinathan, D.; Nayyar, A.; Qureshi, B. An overview of IoT sensor data processing, fusion, and analysis techniques. Sensors 2020, 20, 6076. [Google Scholar] [CrossRef] [PubMed]
  46. Zhou, Y.; Aryal, S.; Bouadjenek, M.R. A Comprehensive Review of Handling Missing Data: Exploring Special Missing Mechanisms. arXiv 2024, arXiv:2404.04905. [Google Scholar]
  47. Li, X.; Li, H.; Lu, H.; Jensen, C.S.; Pandey, V.; Markl, V. Missing Value Imputation for Multi-attribute Sensor Data Streams via Message Propagation (Extended Version). arXiv 2023, arXiv:2311.07344. [Google Scholar]
  48. Wei, X.; Zhang, T.; Li, Y.; Zhang, Y.; Wu, F. Multi-modality cross attention network for image and sentence matching. In Proceedings of the IEEE/CVF Conference on Computer Vision and Pattern Recognition, Seattle, WA, USA, 13–19 June 2020; pp. 10941–10950. [Google Scholar]
  49. Lan, X.; Liu, L.; Wang, X. Dal-yolo: A multi-target detection model for UAV-based road maintenance integrating feature pyramid and attention mechanisms. J. Real-Time Image Process. 2025, 22, 105. [Google Scholar] [CrossRef]
  50. Zhang, G.; Lu, Y.; Jiang, X.; Jin, S.; Li, S.; Xu, M. LGGFormer: A dual-branch local-guided global self-attention network for surface defect segmentation. Adv. Eng. Inform. 2025, 64, 103099. [Google Scholar] [CrossRef]
  51. Loshchilov, I. Decoupled weight decay regularization. arXiv 2017, arXiv:1711.05101. [Google Scholar]
  52. Yang, L.; Zhang, H.; Zuo, Z.; Peng, J.; Yu, X.; Long, H.; Liao, Y. AFU-Net: A novel U-Net network for rice leaf disease segmentation. Appl. Eng. Agric. 2023, 39, 519–528. [Google Scholar] [CrossRef]
  53. Rehman, Z.U.; Khan, M.A.; Ahmed, F.; Damaševičius, R.; Naqvi, S.R.; Nisar, W.; Javed, K. Recognizing apple leaf diseases using a novel parallel real-time processing framework based on MASK RCNN and transfer learning: An application for smart agriculture. IET Image Process. 2021, 15, 2157–2168. [Google Scholar] [CrossRef]
  54. Ronneberger, O.; Fischer, P.; Brox, T. U-Net: Convolutional Networks for Biomedical Image Segmentation. arXiv 2015, arXiv:1505.04597. [Google Scholar]
  55. Nasir, I.M.; Bibi, A.; Shah, J.H.; Khan, M.A.; Sharif, M.; Iqbal, K.; Nam, Y.; Kadry, S. Deep learning-based classification of fruit diseases: An application for precision agriculture. Comput. Mater. Contin 2021, 66, 1949–1962. [Google Scholar]
  56. Wang, P.; Wang, S.; Lin, J.; Bai, S.; Zhou, X.; Zhou, J.; Wang, X.; Zhou, C. One-peace: Exploring one general representation model toward unlimited modalities. arXiv 2023, arXiv:2305.11172. [Google Scholar]
  57. Bao, H.; Dong, L.; Piao, S.; Wei, F. Beit: Bert pre-training of image transformers. arXiv 2021, arXiv:2106.08254. [Google Scholar]
  58. Wang, W.; Dai, J.; Chen, Z.; Huang, Z.; Li, Z.; Zhu, X.; Hu, X.; Lu, T.; Lu, L.; Li, H.; et al. Internimage: Exploring large-scale vision foundation models with deformable convolutions. In Proceedings of the IEEE/CVF Conference on Computer Vision and Pattern Recognition, Vancouver, BC, Canada, 17–24 June 2023; pp. 14408–14419. [Google Scholar]
Figure 1. Challenges in apple disease detection and grading: A represents the phenotype of apple scab in a dry climate; B represents the phenotype of apple scab in a humid climate; C and D show diseased apples from different angles; E represents apple scab; F represents black rot (the two share similar phenotypes).
Agronomy 15 01246 g001
Figure 2. Geographical location of Wuyuan County, Inner Mongolia. The marked point indicates the primary site for fruit tree pruning and data collection experiments, located at 41.09° N, 108.27° E.
Agronomy 15 01246 g002
Figure 3. Geographical location of Qixia City, Shandong Province. The marked point indicates the primary site for fruit tree pruning experiments and multimodal data collection, located at 37.31° N, 120.83° E.
Agronomy 15 01246 g003
Figure 4. Image dataset samples: images (ag) correspond to apple scab, black rot, gray mold, apple rot, apple powdery mildew, anthracnose, and apple ring rot.
Agronomy 15 01246 g004
Figure 5. The image acquisition workflow involves capturing images of both apple leaves and fruits under varying lighting and weather conditions, including sunny and rainy scenarios. During the acquisition of leaf images, the camera is positioned at a distance of 25 cm from the leaf surface. For fruit images, the camera maintains a distance of 30 cm from the apple. After the images are captured, they are uniformly transferred to a computer for further processing, as illustrated in the image acquisition flowchart.
Agronomy 15 01246 g005
Figure 6. Representative annotated samples of apple diseases.
Agronomy 15 01246 g006
Figure 7. The flowchart for apple disease sensor data collection is illustrated. The Bosch BME280 sensor collects environmental temperature, humidity, and atmospheric pressure data. The DS18B20 sensor measures soil temperature, while the MQ-135 sensor detects the concentration of harmful gases in the air.
Agronomy 15 01246 g007
Figure 8. UAV flight path schematic over the orchard area. The red arrows indicate the pre-planned strip-wise back-and-forth flight route designed to ensure full coverage data acquisition of the target area.
Agronomy 15 01246 g008
Figure 9. Perform the Cutout operation on Part 1 to differentiate it from Parts 2 and 3; apply the Cutmix operation on Parts 6 and 5 to generate Part 4.
Agronomy 15 01246 g009
Figure 10. Detailed architecture of the multimodal parallel transformer for crop disease detection and classification. The input includes RGB images captured using a Mijia device, along with environmental sensor data such as light intensity (BH1750), temperature, and humidity (DHT22). The architecture consists of multiple encoder stages: the main branch (left) integrates image features F I , sensor features F S , and temporal features F T using stacked self-attention and cross-attention blocks. The middle module illustrates a sequence of multimodal interaction steps (Steps 1–3), where features are exchanged and fused across different streams. The final module on the right depicts a lightweight encoder variant optimized for deployment on mobile devices such as handheld terminals and smartphones, enabling real-time in-field disease detection and severity classification. (Different colors are solely used to distinguish between module nodes and carry no specific meaning).
Agronomy 15 01246 g010
Figure 11. Architecture of the disease segmentation network based on an encoder–decoder framework. The input image is first processed by a patch embedding module that converts it into tokenized feature representations. These features are then passed through a transformer encoder to extract multi-level contextual information. The decoder comprises two parallel components: a pixel decoder that reconstructs fine-grained spatial features using the encoded keys and values, and a transformer decoder driven by learnable queries that models global semantic relationships. Finally, the prediction head generates the disease segmentation map, enabling precise localization of infected regions. This hybrid architecture effectively integrates local detail reconstruction and global context reasoning, making it well-suited for accurate plant disease segmentation in complex environments.
Agronomy 15 01246 g011
Figure 12. Network structure of the multimodal fusion module. The architecture comprises four hierarchical encoder stages (Encoder Stages 1–4), each extracting features F 1 to F 4 at different semantic levels. The lowest-level feature F 1 is fed into a transformer decoder that performs feature querying over higher-level representations ( F 2 , F 3 , F 4 ), resulting in deep features D 2 to D 4 . These are then passed through individual upsampling layers to align their spatial resolutions. The upsampled features are concatenated and passed through a multi-layer perceptron (MLP) to produce the final output O for disease classification or segmentation. This structure integrates fine-grained local details with global context reasoning, enabling robust multimodal feature fusion for plant disease detection.
Agronomy 15 01246 g012
Figure 13. Training performance curves of three evaluation metrics (Precision, Recall, and Accuracy) across different methods. The left, middle, and right plots show the progression of precision, recall, and accuracy over 200 training epochs, respectively. Compared methods include Tiny-Segformer, AFU-Net, Mask R-CNN, U-Net+, CNN-based baseline, the proposed method without sensor data, and the full proposed method.
Agronomy 15 01246 g013
Figure 14. Confusion matrix analysis: images (a) to (g) correspond to apple scab, black rot, gray mold, apple rot, apple powdery mildew, anthracnose, and apple ring rot.
Agronomy 15 01246 g014
Figure 15. Performance differences in various models in apple disease severity classification tasks.
Agronomy 15 01246 g015
Figure 16. Comparison of test score distributions across different models. The violin plots illustrate the test score distribution for each model: Tiny-Segformer, AFU-Net, Mask R-CNN, U-Net+, CNN, and the proposed method. Each plot shows the distribution density and central tendency, with individual test instances marked as black dots.
Agronomy 15 01246 g016
Figure 17. t-SNE validation of the frame-by-frame diffusion generation module: the green points represent the real feature distribution, while the purple points represent the features generated by the proposed method. The generated features exhibit a distribution pattern highly consistent with the real features, demonstrating significant clustering alignment. This validates the effectiveness of the diffusion generation module in high-dimensional feature modeling and disease region representation.
Agronomy 15 01246 g017
Table 1. Number of images for different diseases.
DiseaseData
Apple Scab1791
Black Rot1802
Gray Mold1504
Apple Rot2179
Apple Powdery Mildew2253
Anthracnose2008
Apple Ring Rot1937
Table 2. Statistical summaries of five types of sensor data collected from April to October 2024.
Sensor TypeMeanMaxMinStd. Dev.
Temperature (°C)21.336.57.86.2
Humidity (%)67.4100.029.115.8
Atmospheric Pressure (hPa)1006.71023.4988.27.6
Soil Temperature (°C)19.231.710.64.3
Harmful Gases (ppm)132.6291.062.548.9
Table 3. Experimental results of disease detection models.
ModelPrecisionRecallAccuracyF1-ScoreModel Size (MB)FLOPs (G)
Tiny-Segformer [29]0.830.800.810.8115213.8
AFU-Net [52]0.850.820.830.8422424.5
Mask R-CNN [53]0.870.840.850.8644737.9
U-Net+ [54]0.890.860.870.8885232.2
CNN-based [55]0.900.880.890.8952812.4
ONE-PEACE [56]0.920.910.920.9162028.6
BEiT [57]0.910.890.900.9040045.2
InternImage [58]0.940.920.930.9393039.5
Proposed Method—without Sensor Data0.930.920.920.9319614.0
Proposed Method0.970.940.960.9520314.3
Table 4. Analysis of detection accuracy across different apple diseases.
ModelApple ScabBlack RotGray MoldApple RotApple Powdery MildewAnthracnoseApple Ring Rot
Tiny-Segformer0.810.820.830.820.840.840.86
AFU-Net0.850.870.860.840.850.860.87
Mask R-CNN0.840.820.840.860.850.830.86
U-Net+0.880.870.890.870.850.860.89
CNN-based0.890.880.870.900.910.880.89
ONE-PEACE0.910.890.920.900.910.890.90
BEiT0.900.880.890.880.900.870.88
InternImage0.920.910.930.910.920.900.92
Proposed Method0.930.920.930.910.920.900.91
Table 5. Efficiency validation on handheld mobile devices.
Model(Frames Per Second (FPS))
Tiny-Segformer [29]41
AFU-Net [52]20
Mask R-CNN [53]19
U-Net+ [54]21
CNN-based [55]17
Proposed Method—without Sensor Data46
Table 6. Cross-field generalization performance of the proposed method.
Test FieldPrecisionRecallAccuracyF1-Score
Wuyuan (trained on Qixia + Luochuan)0.960.930.950.94
Qixia (trained on Wuyuan + Luochuan)0.950.940.960.94
Luochuan (trained on Wuyuan + Qixia)0.960.920.950.94
Disclaimer/Publisher’s Note: The statements, opinions and data contained in all publications are solely those of the individual author(s) and contributor(s) and not of MDPI and/or the editor(s). MDPI and/or the editor(s) disclaim responsibility for any injury to people or property resulting from any ideas, methods, instructions or products referred to in the content.

