
A Deep Learning-Based Approach to Apple Tree Pruning and Evaluation with Multi-Modal Data for Enhanced Accuracy in Agricultural Practices

Abstract
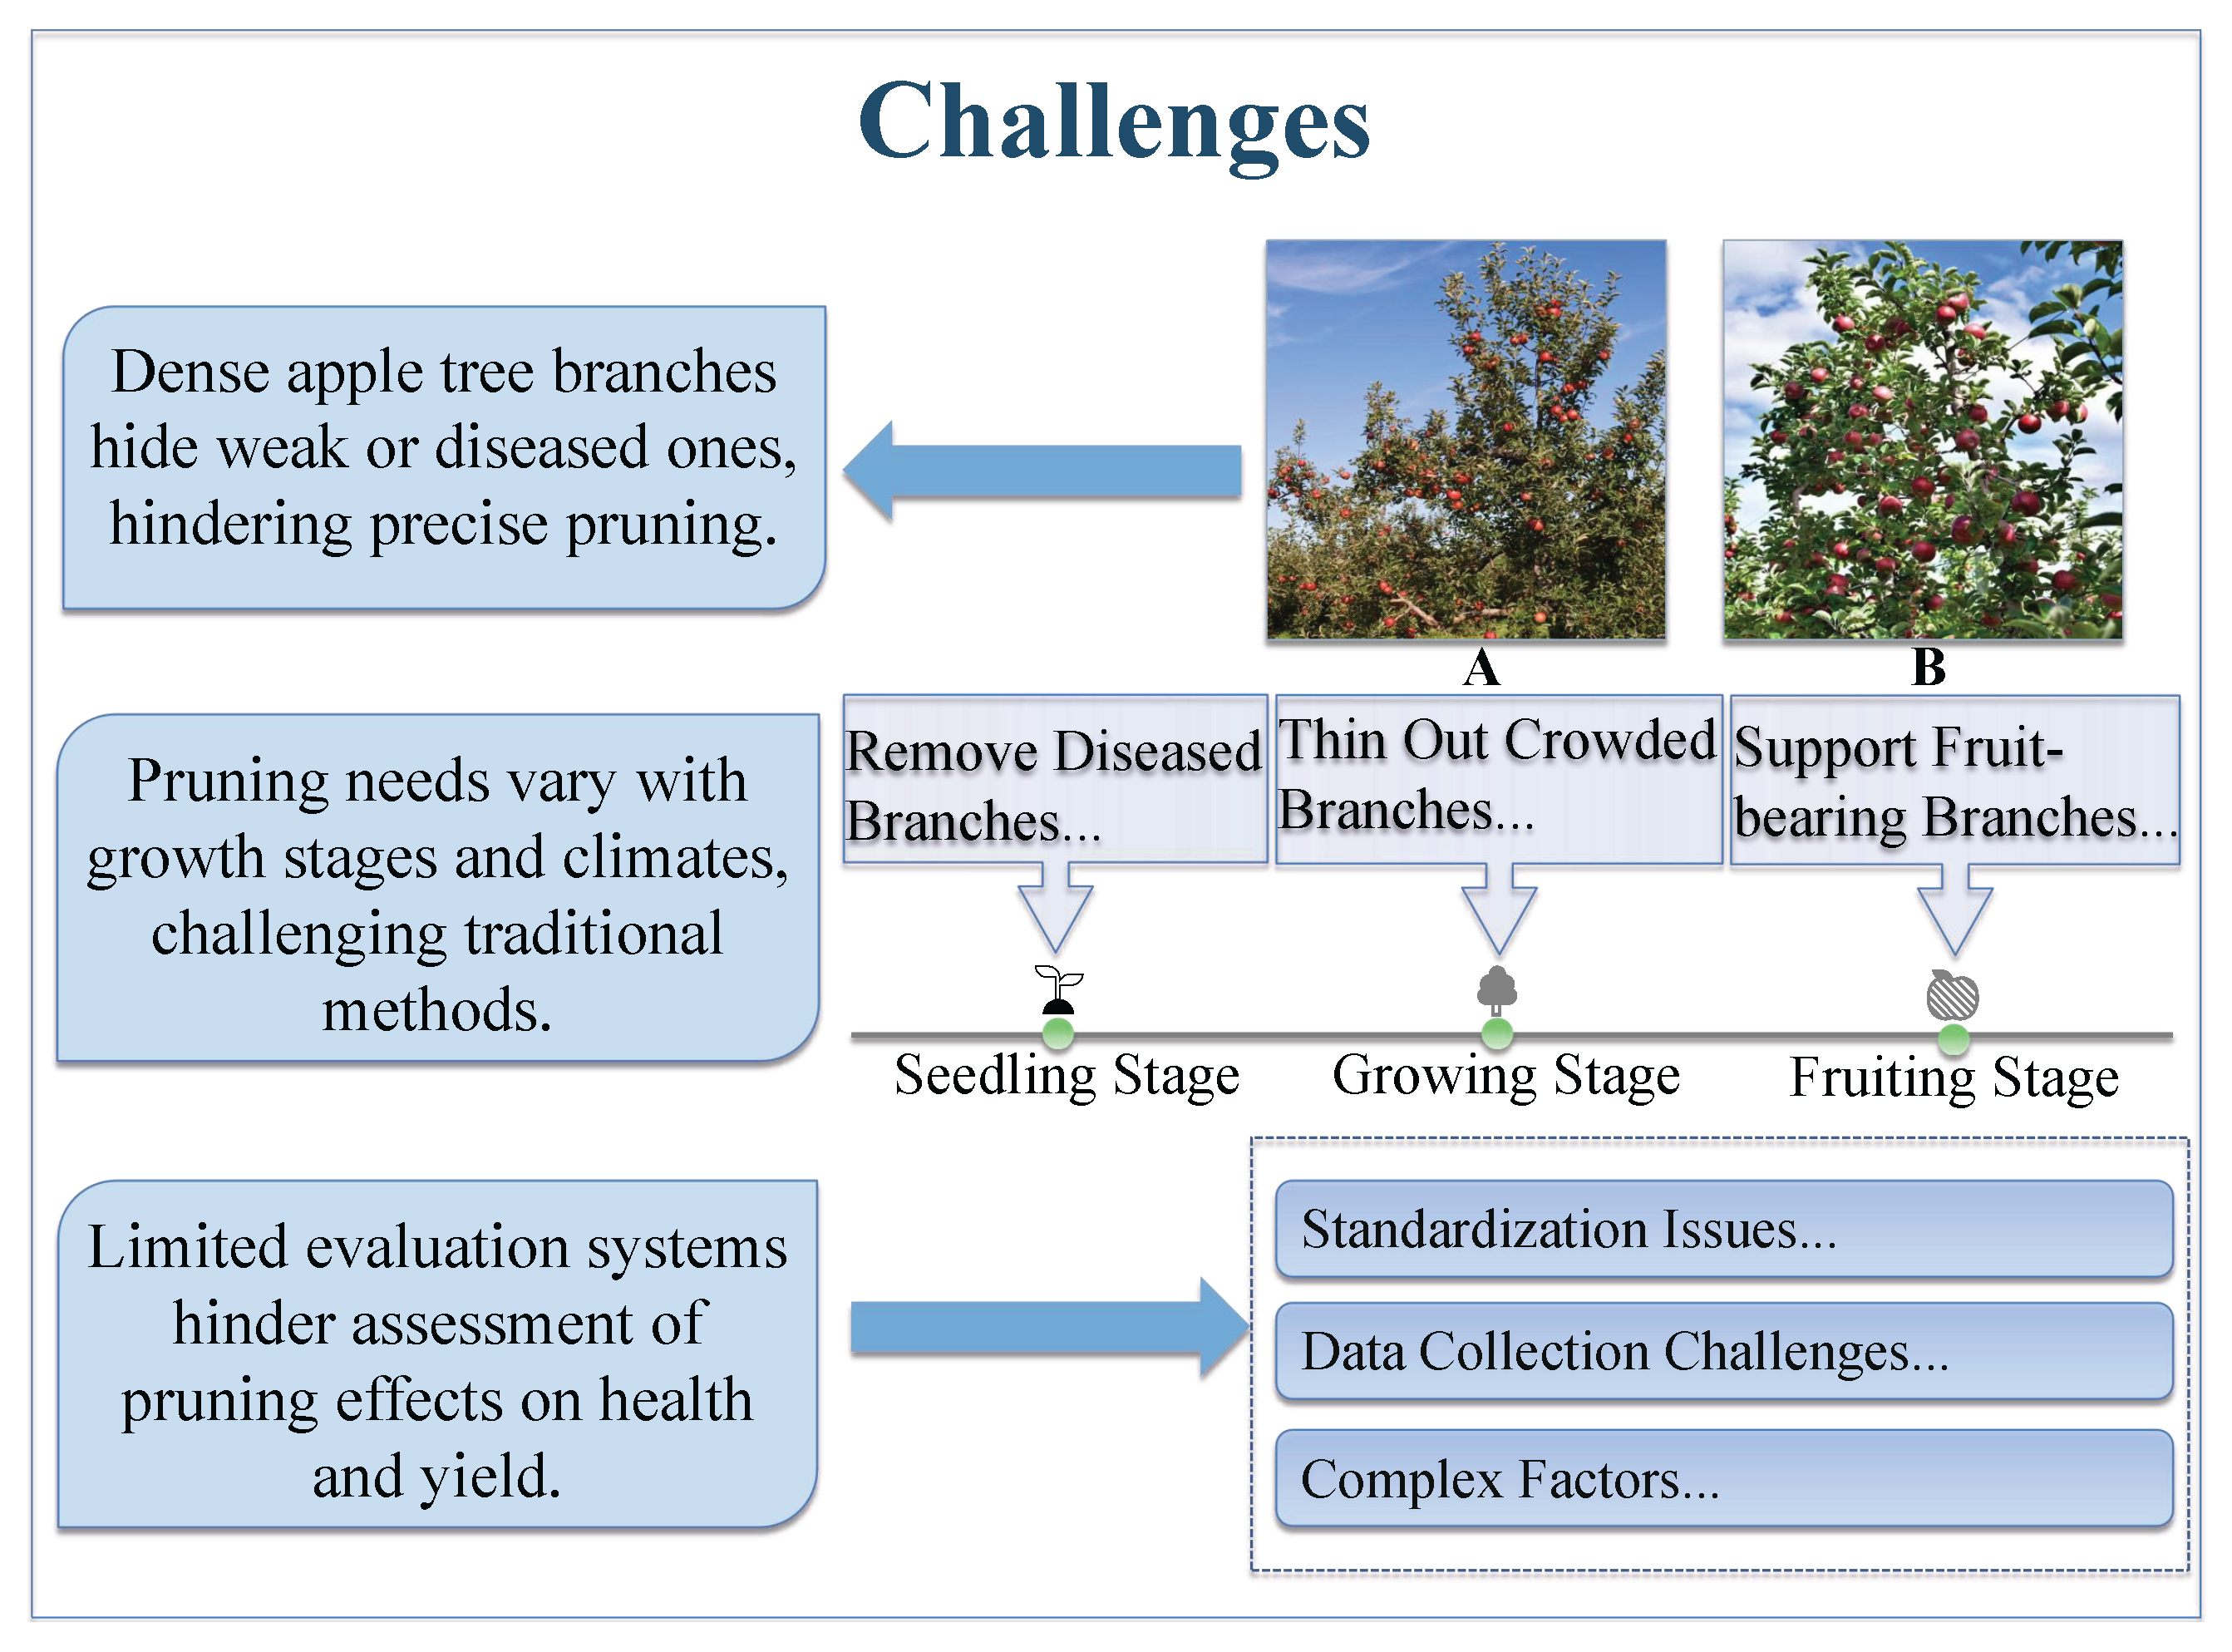
1. Introduction
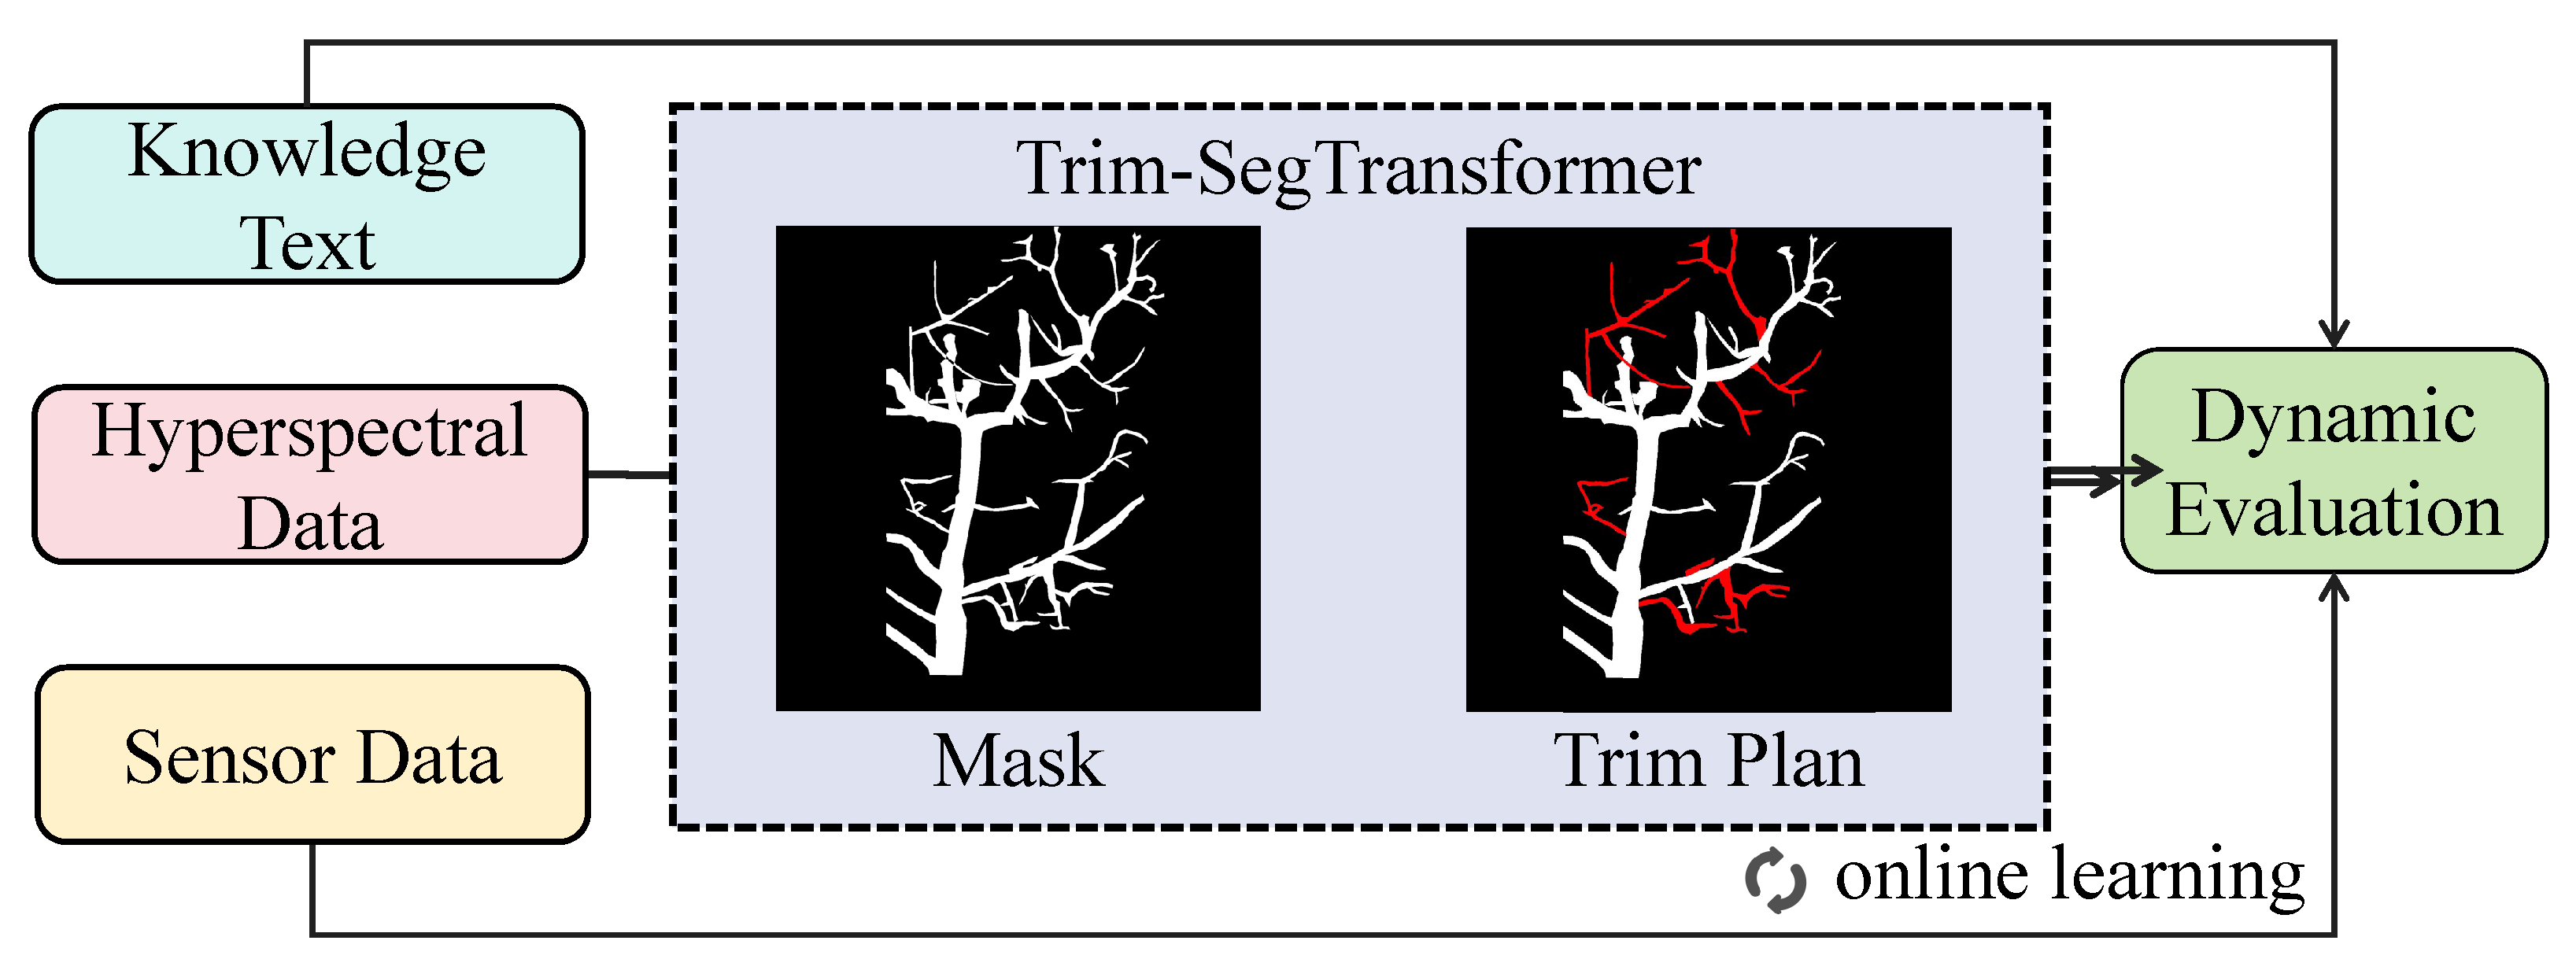
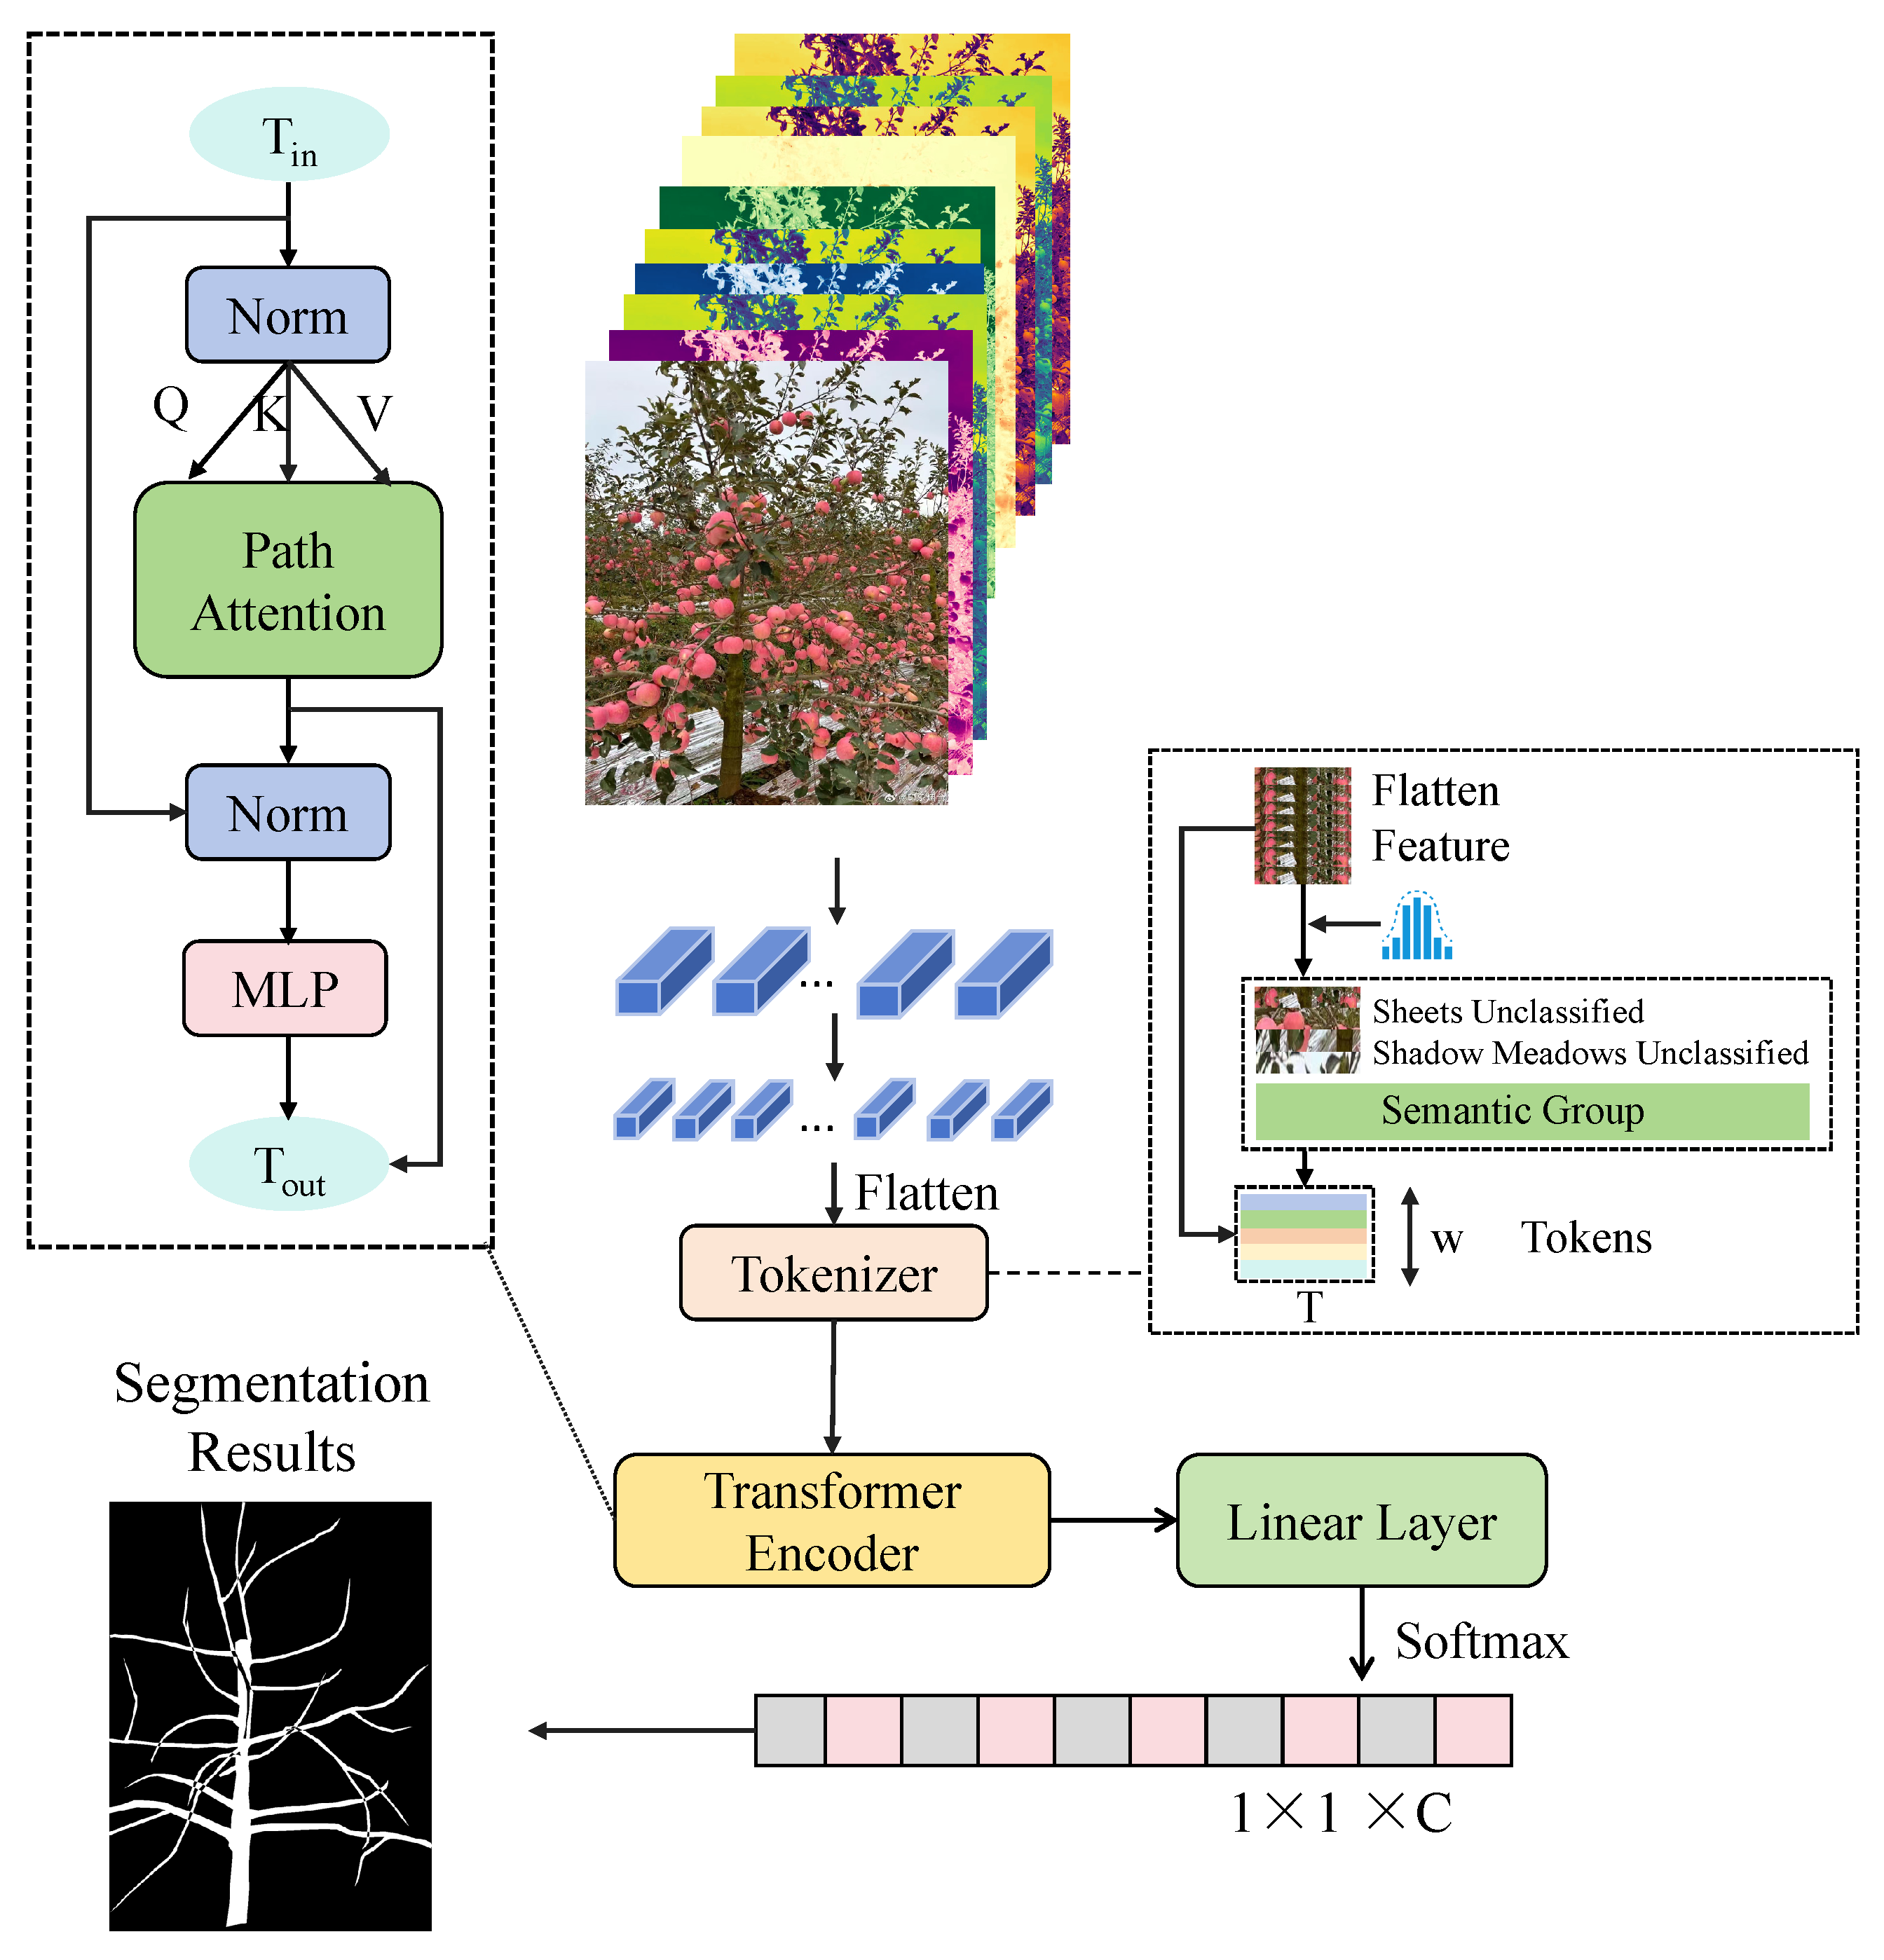
- By introducing hyperspectral data and the Trim-SegTransformer model, multispectral information is utilized to enhance the distinction between branches and background, improving instance segmentation accuracy. Combining the Path Attention Mechanism and multimodal Transformer for feature fusion enables the pruning model to accurately recognize tree structures even in complex environments, providing reliable input for subsequent pruning decisions.
- The Trim Scheme is proposed, integrating pruning rules provided by expert systems and historical scores from the pruning evaluation model to construct a Transformer-based multimodal fusion network for intelligent pruning strategy optimization. Initially, the model relies on expert rules, while later, it utilizes online learning through the Path–Trim Loss Function, allowing pruning strategies to continuously adapt to different tree growth environments, improving flexibility and accuracy.
- A pruning evaluation model based on a temporal Transformer is designed, incorporating sensor data (such as light intensity, temperature, humidity, and branch angles) along with pruning history to achieve a dynamic evaluation of pruning effectiveness. A weighted-time update strategy is employed to gradually increase the weight of historical data over time, ensuring a more scientifically sound evaluation of pruning schemes, optimizing future pruning strategies, and enhancing tree health and yield.
2. Materials and Methods
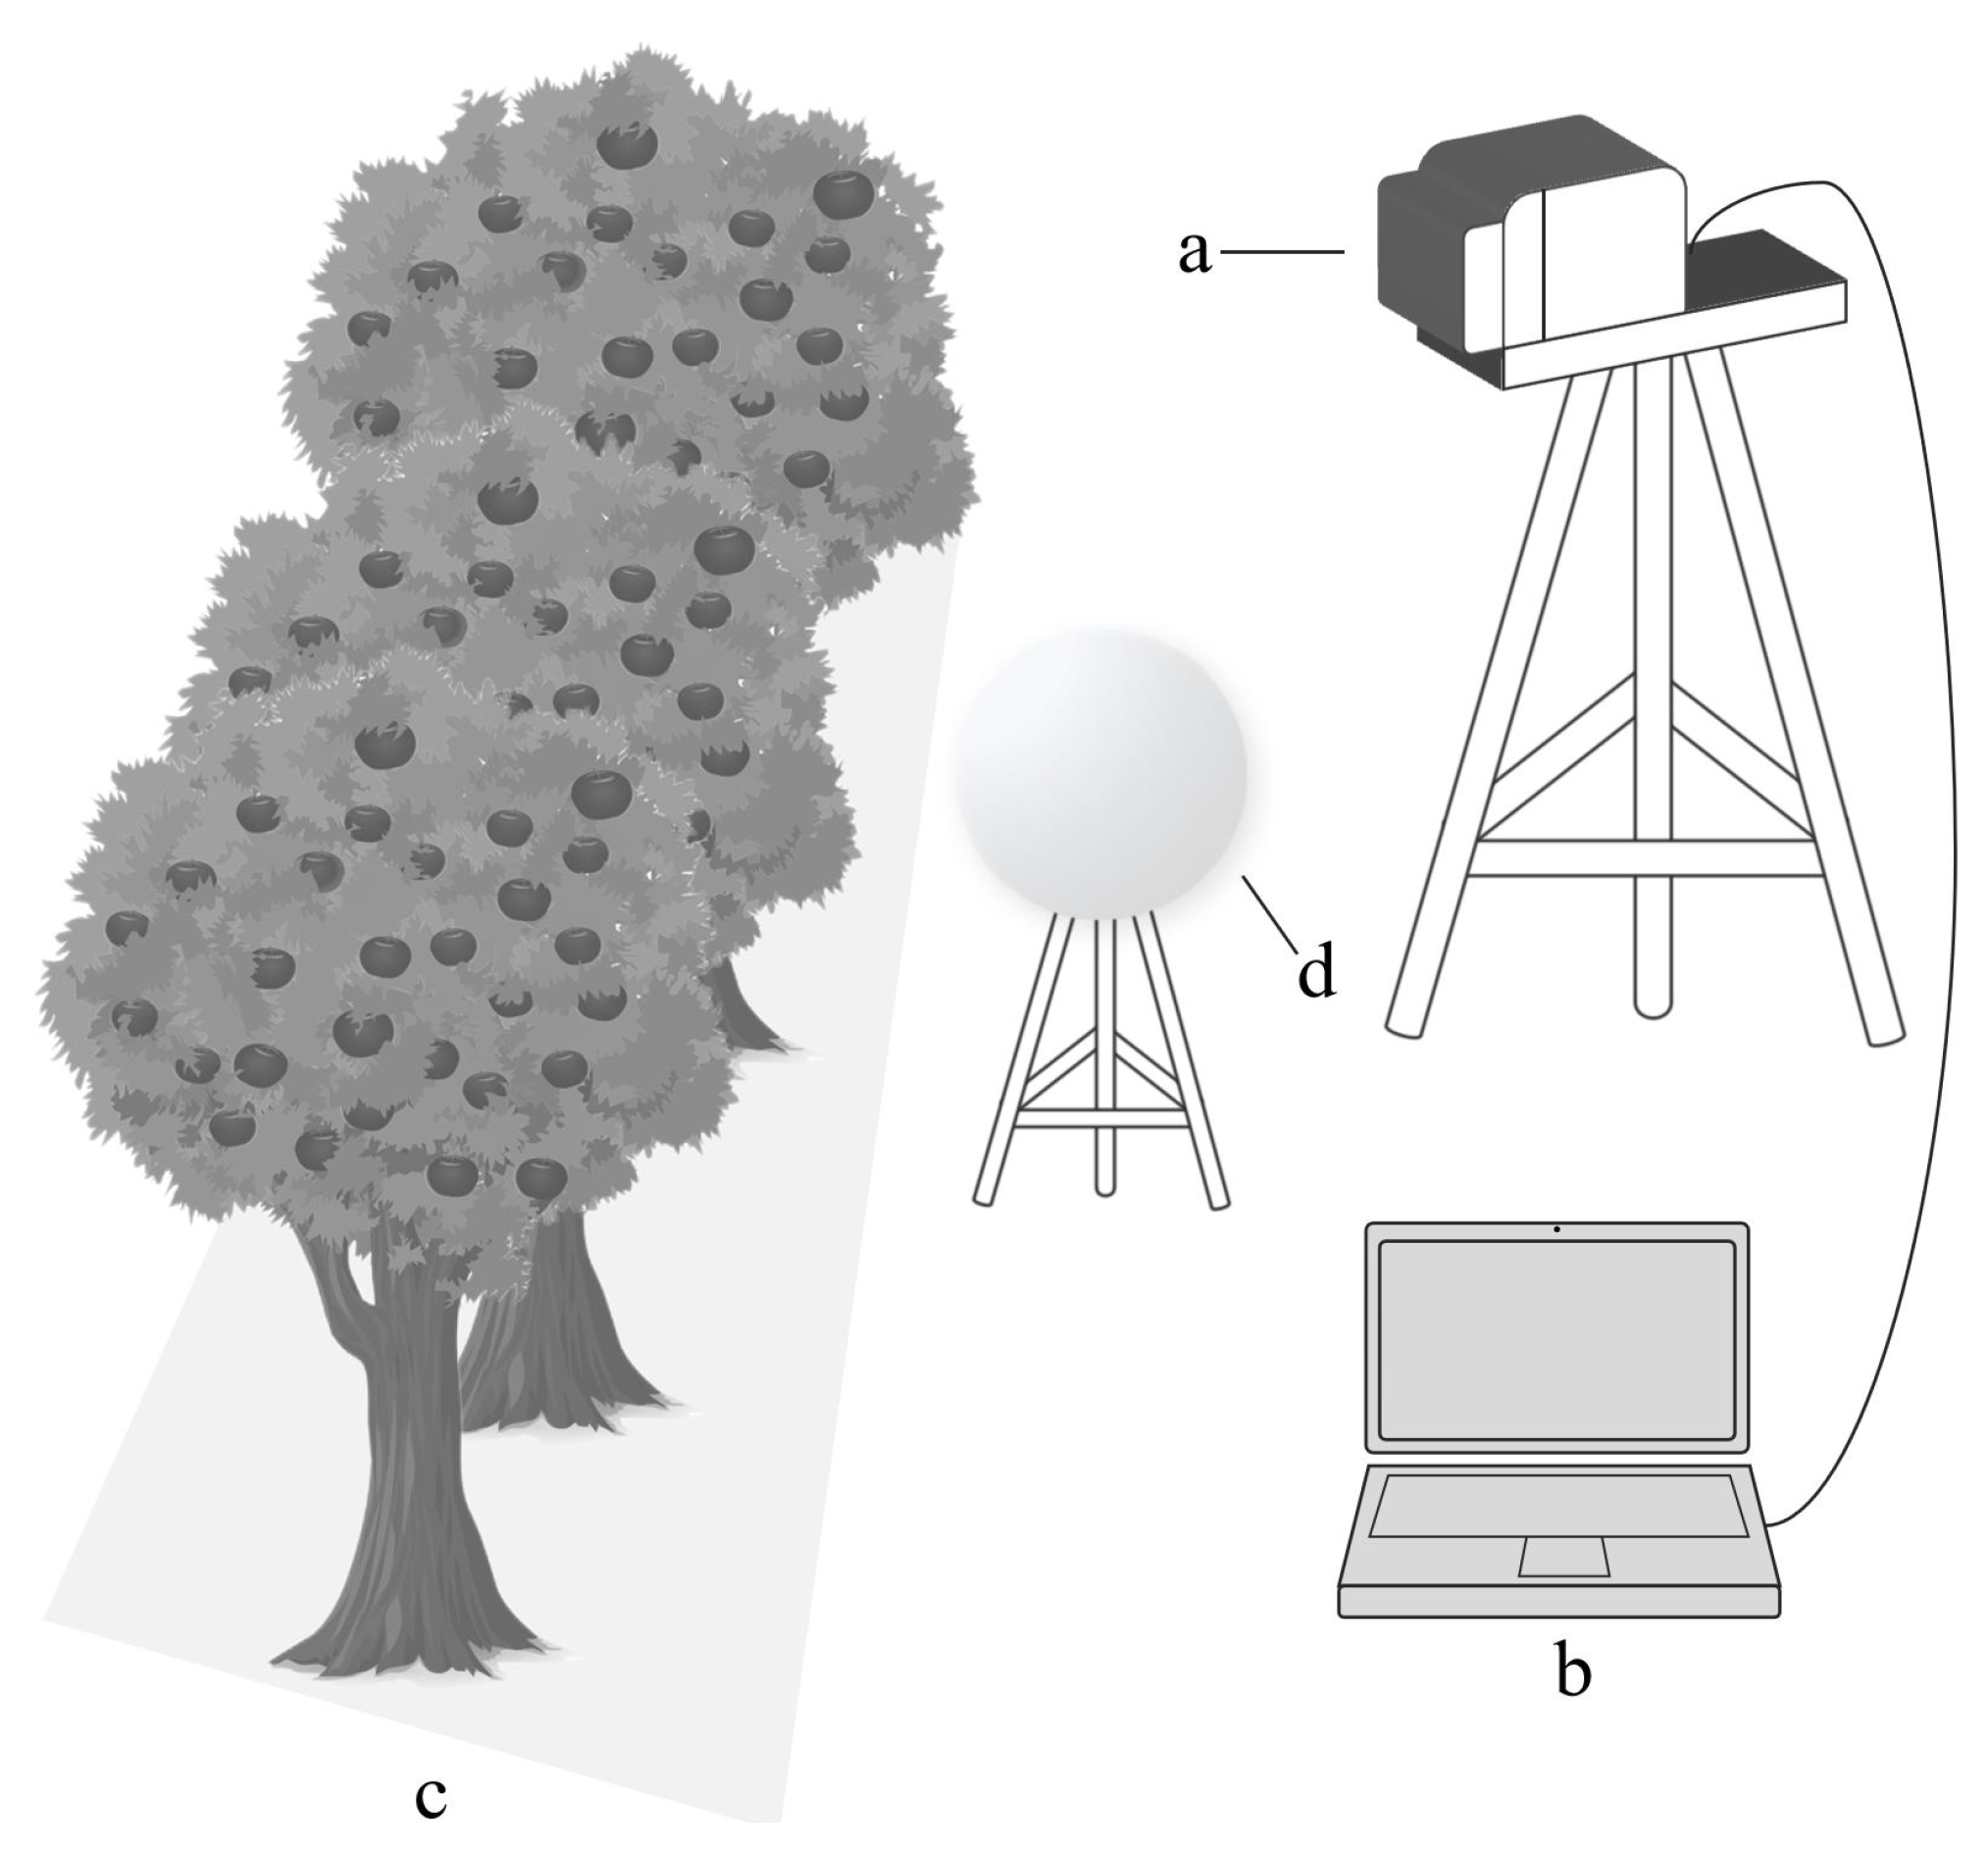
2.1. Hyperspectral Data Collection
2.2. Hyperspectral Data Annotation
2.3. Sensor Data Collection
2.4. Tree Pruning Strategy and Evaluation System
2.5. Trim-Segtransformer
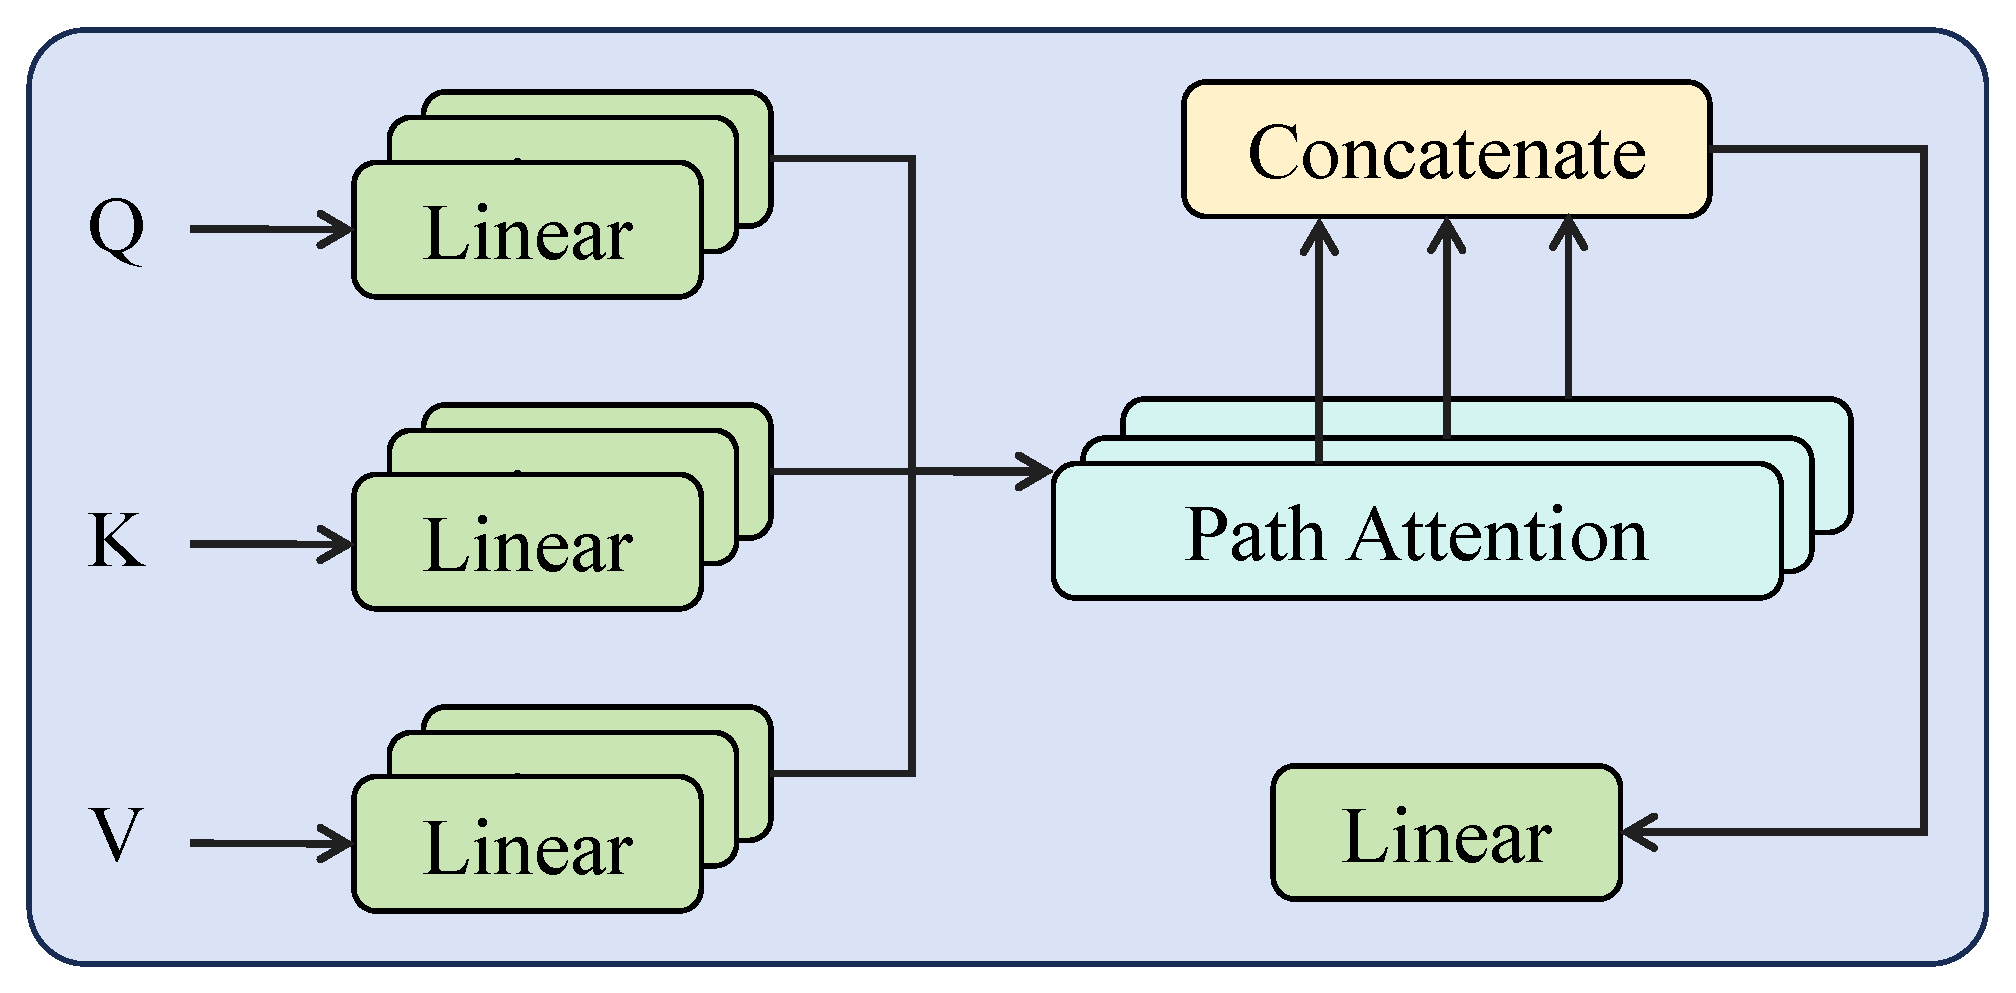
2.5.1. Path Attention Mechanism
2.5.2. Trim Scheme
2.5.3. Dynamic Evaluation Strategy
2.6. Experimental Design
2.6.1. Experimental Environment
2.6.2. Baseline Methods
2.6.3. Evaluation Metrics
3. Results and Discussion
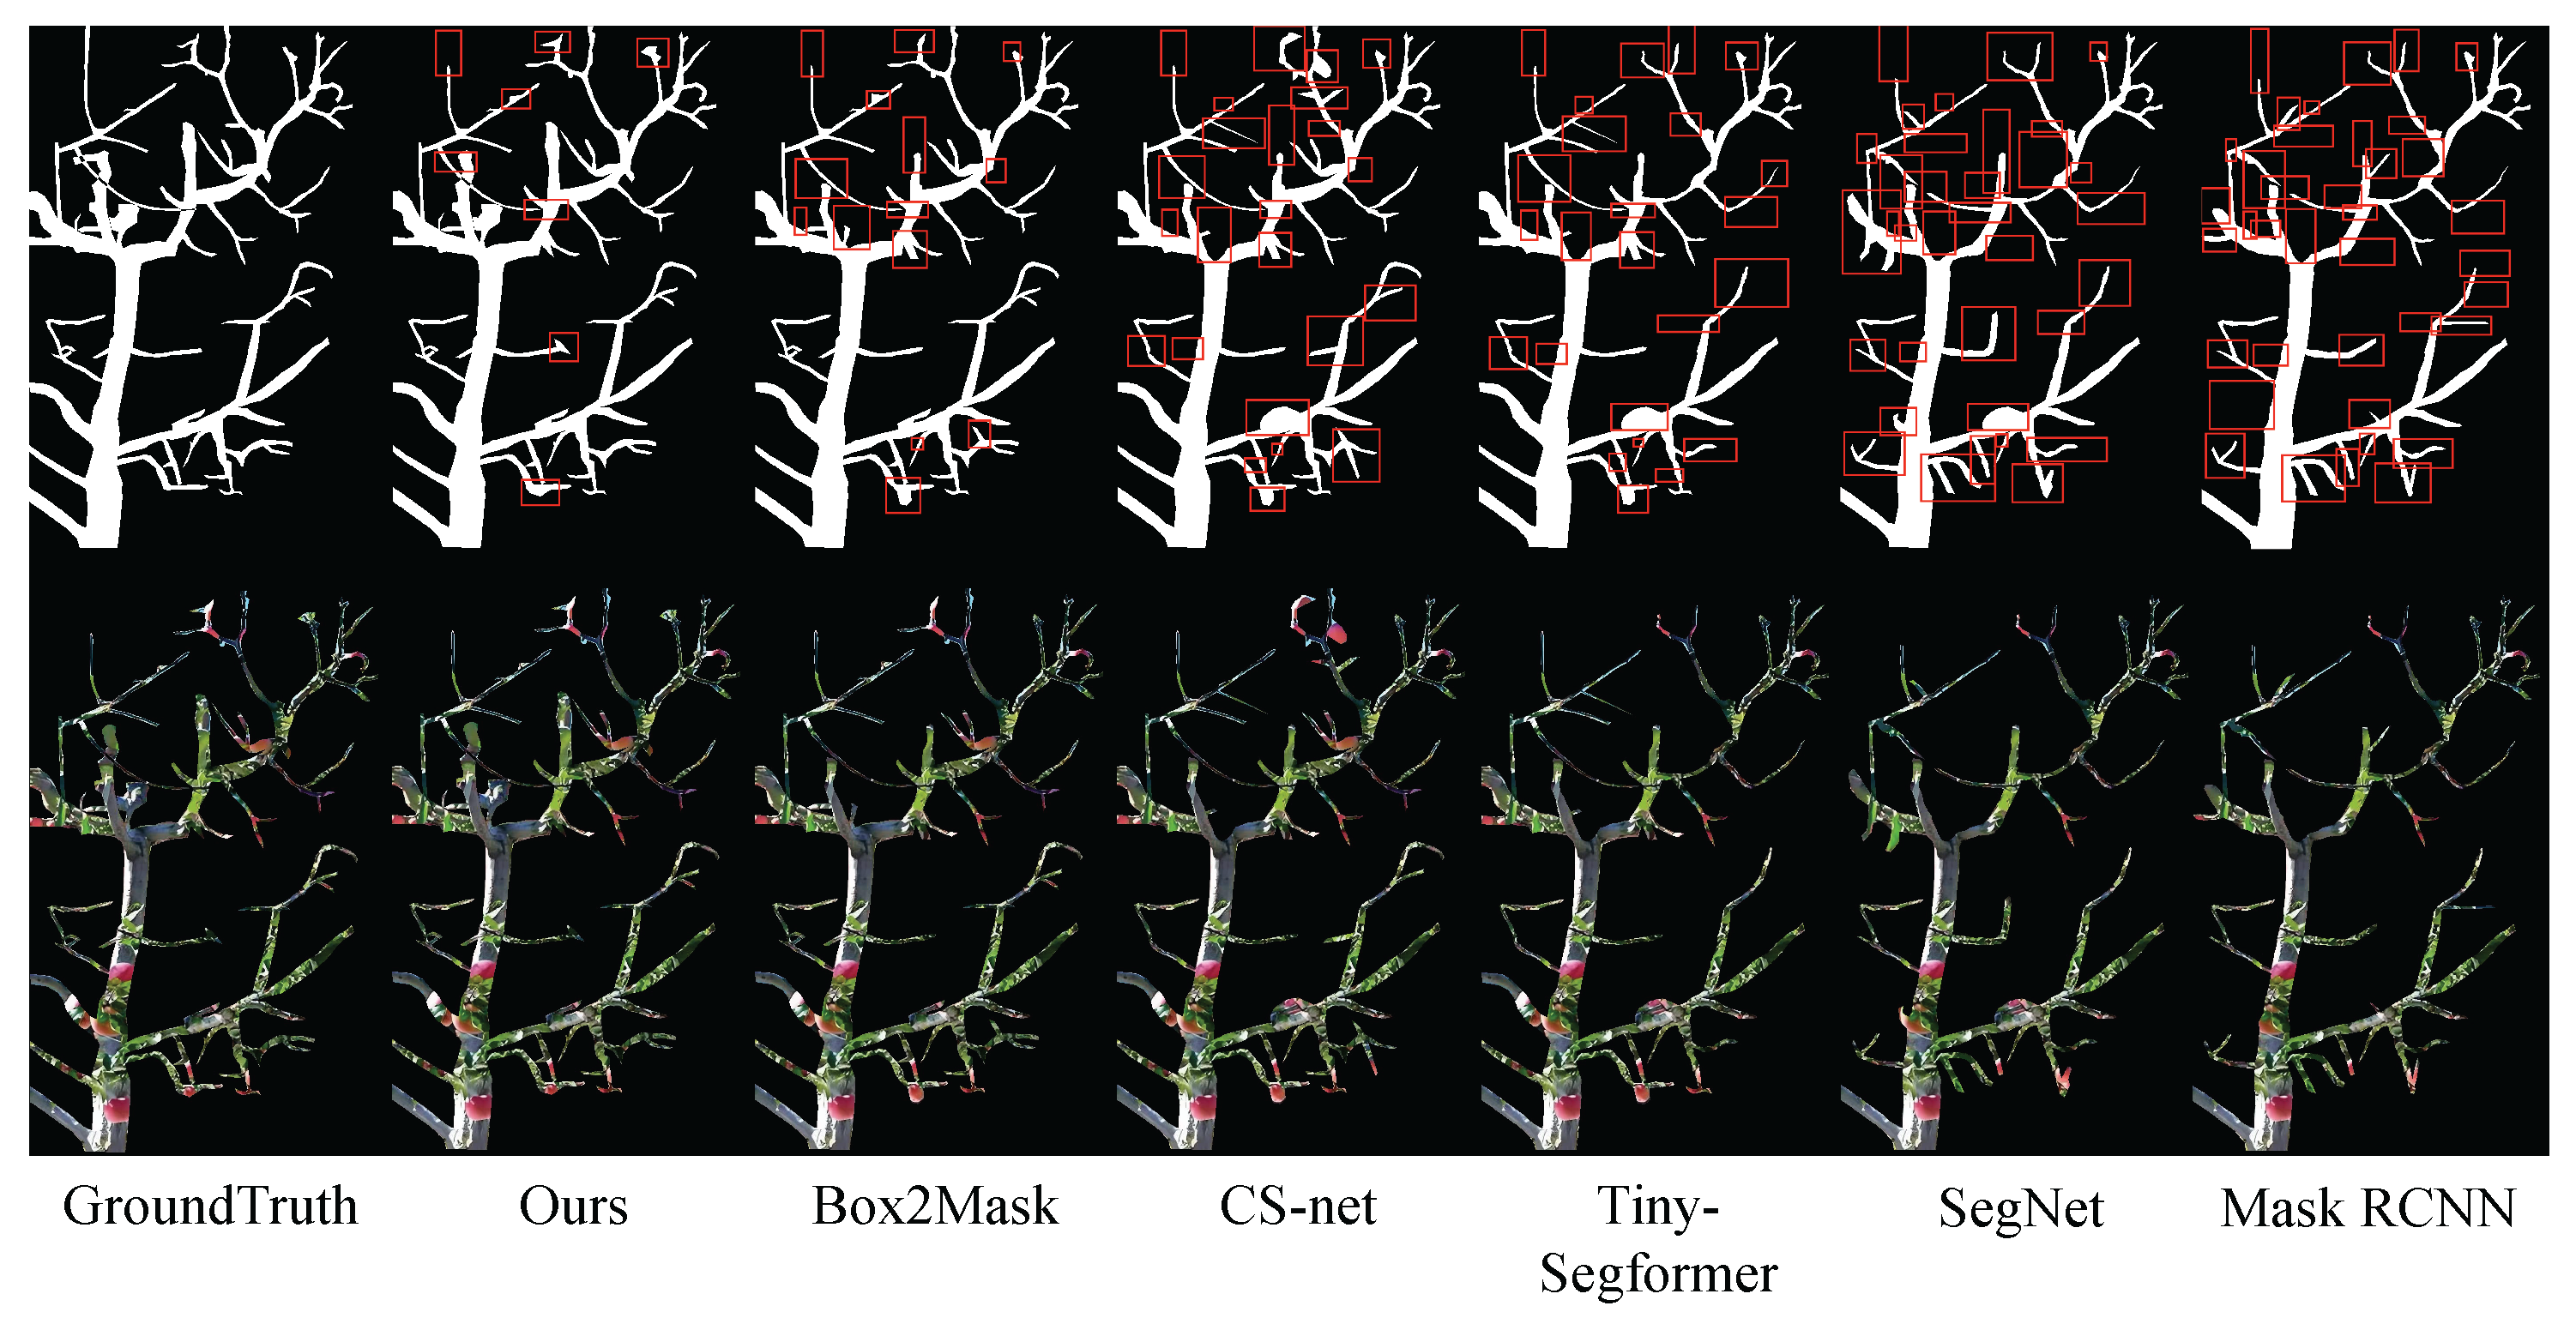
3.1. Tree Segmentation Detection Results
3.2. Pruning Evaluation Analysis
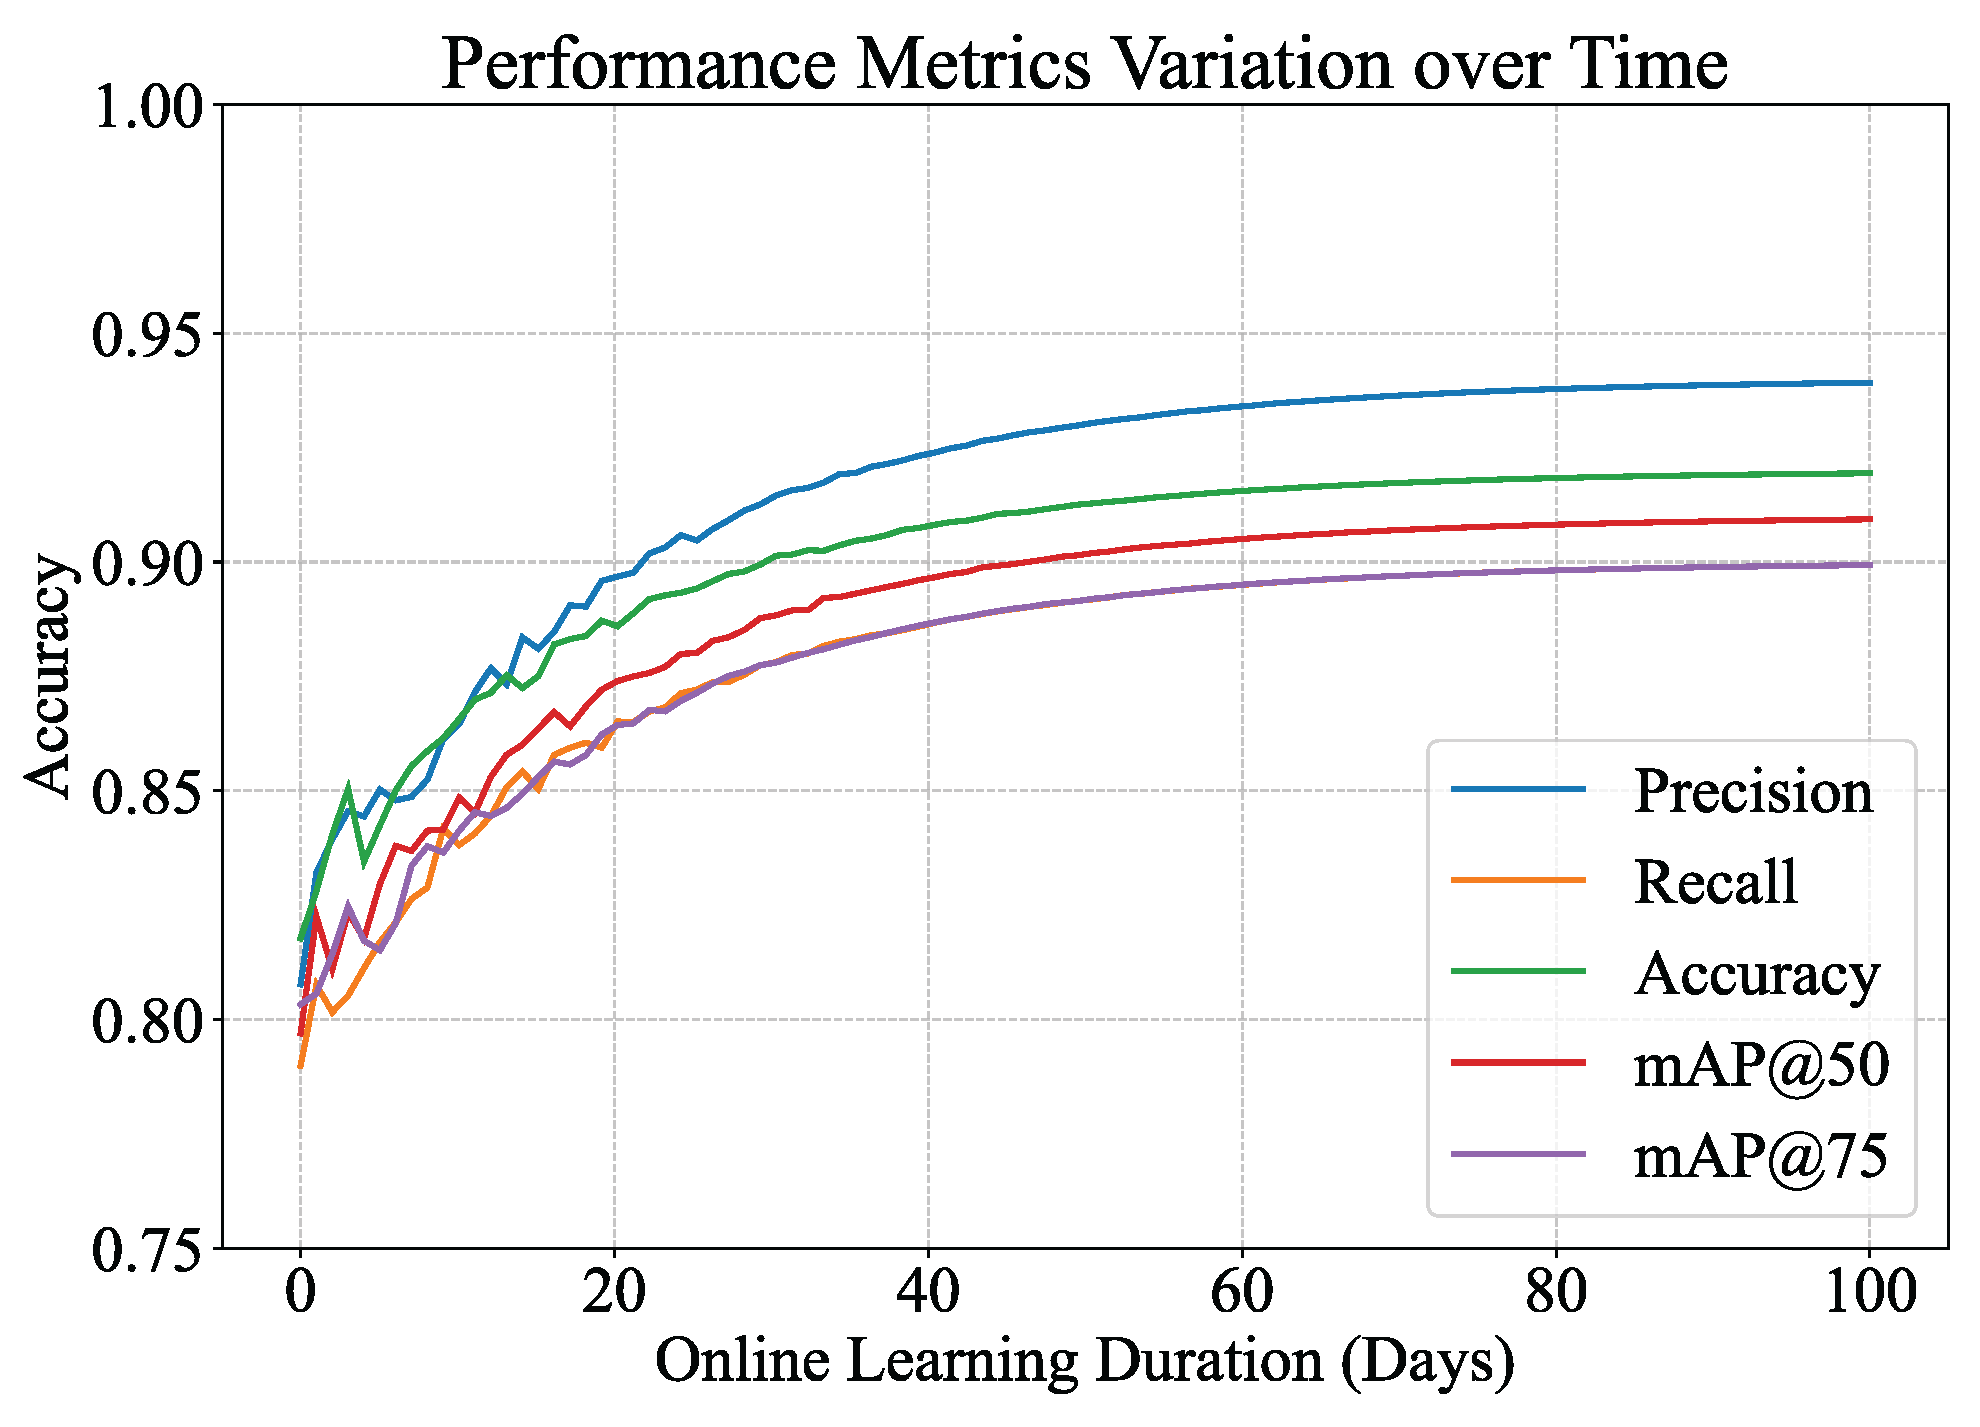
3.3. Online Learning Strategy Analysis
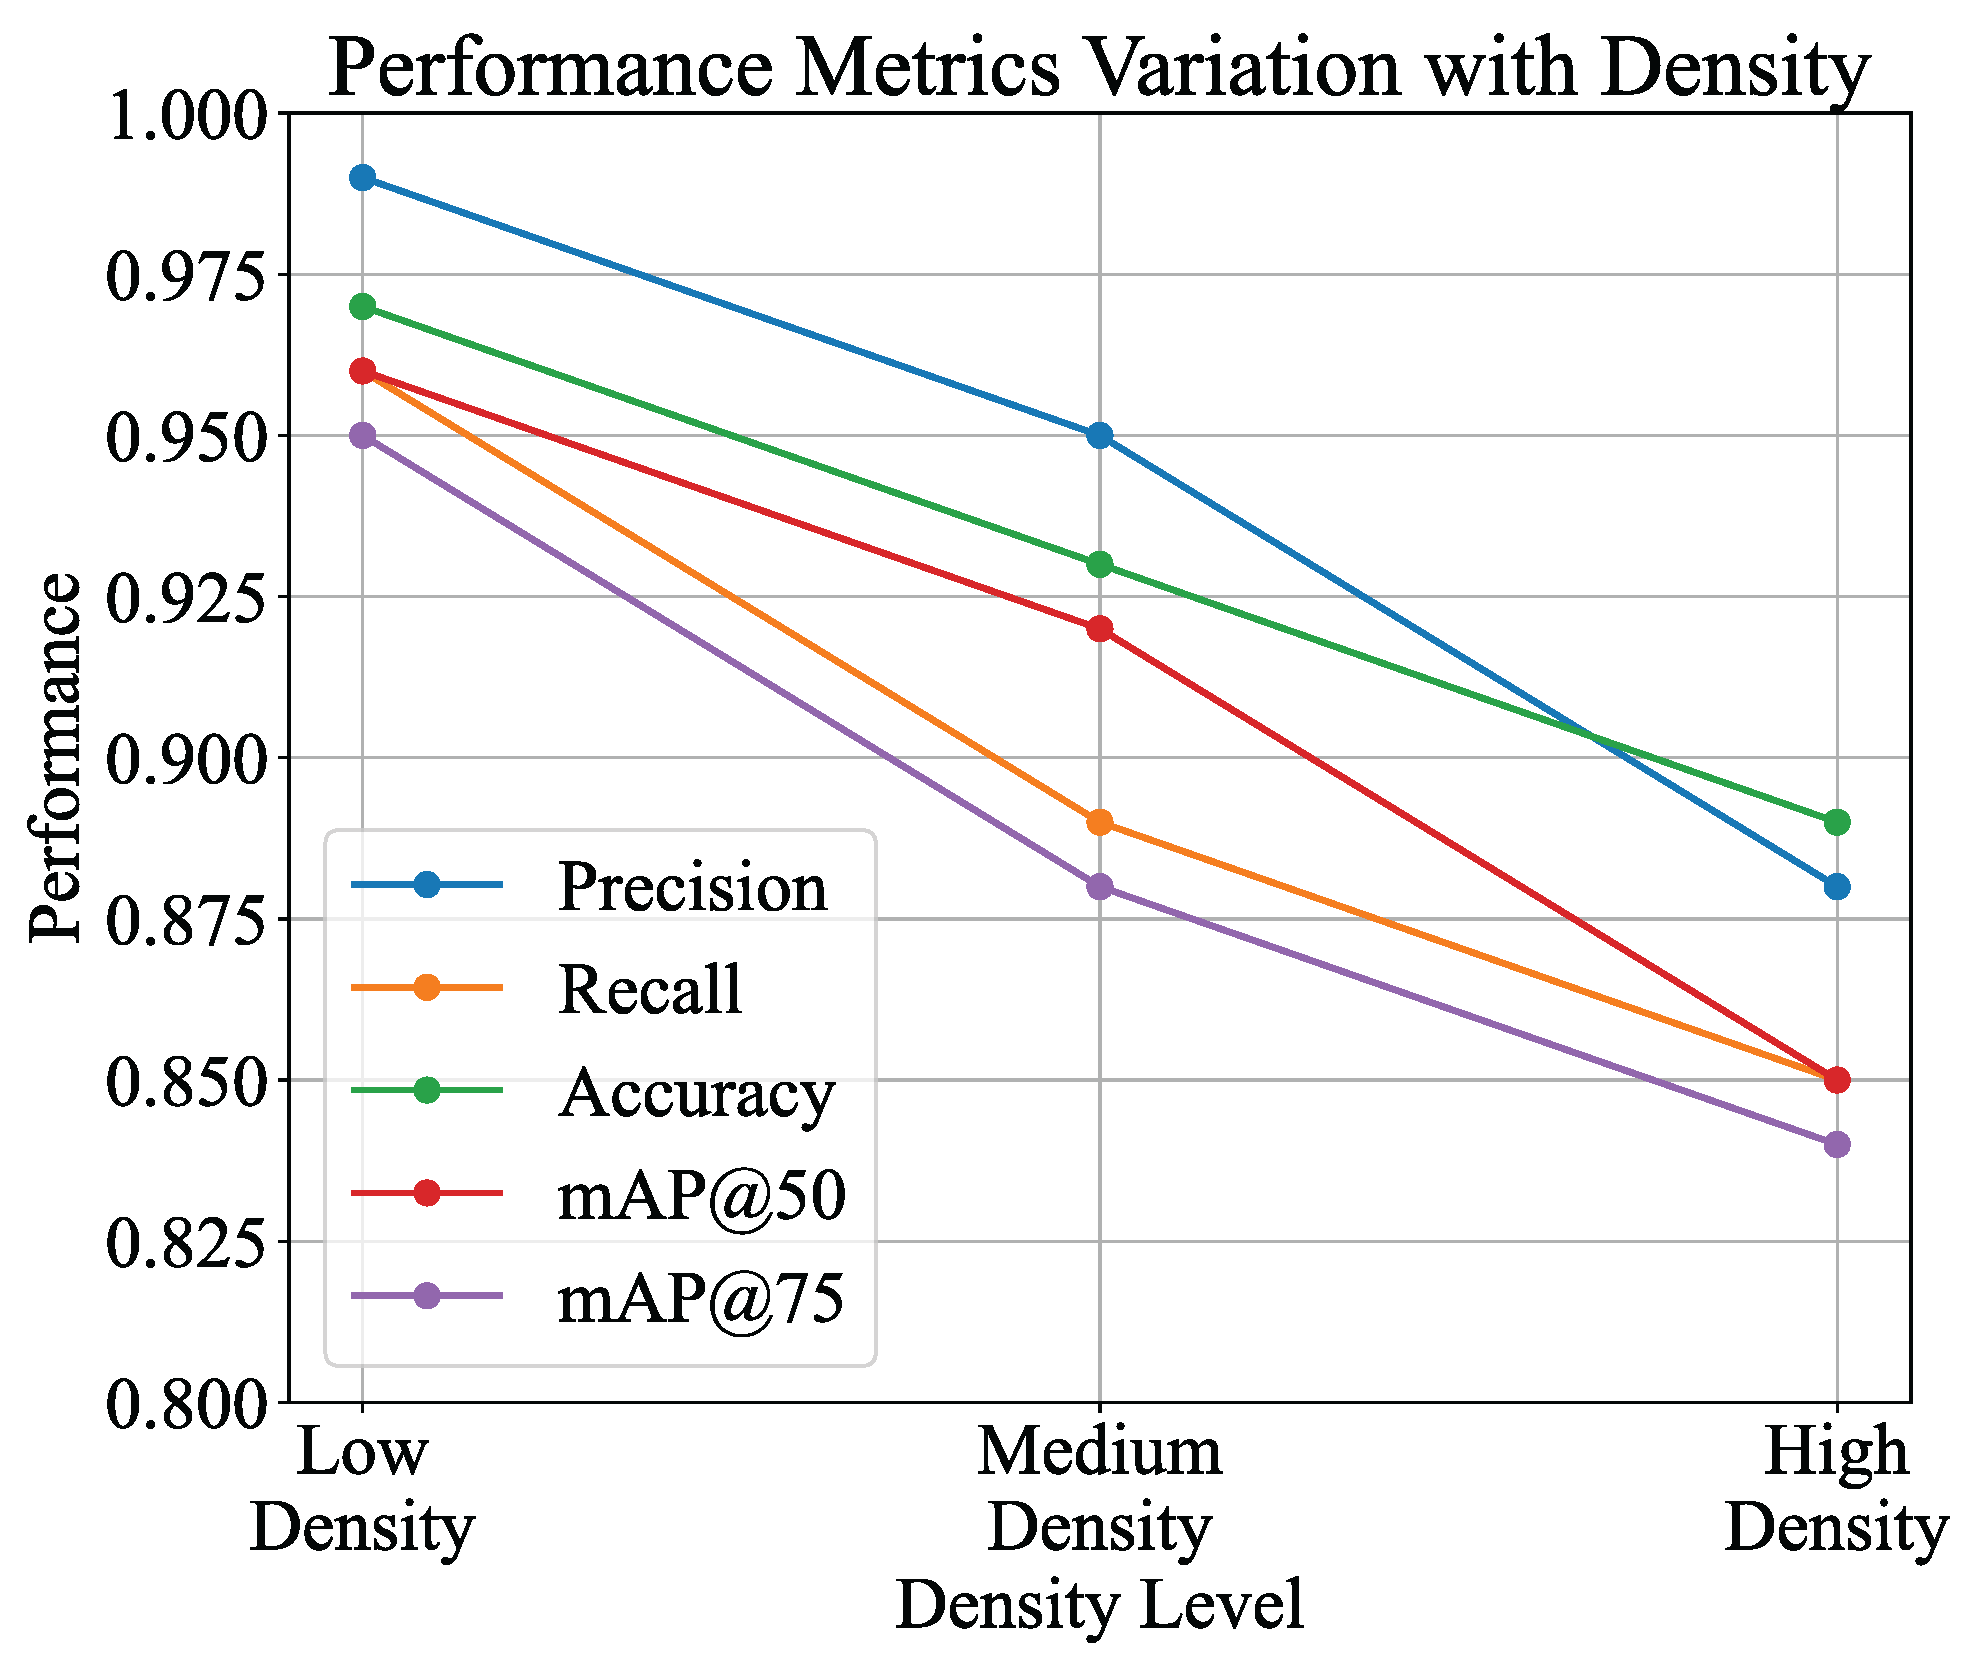
3.4. Performance Analysis Under Different Tree Density Levels
3.5. Ablation Experiment of Different Sensor Data for Evaluation
3.6. Discussion
3.7. Limitation and Future Work
4. Conclusions
Author Contributions
Funding
Data Availability Statement
Conflicts of Interest
References
- Majeed, Y.; Zhang, J.; Zhang, X.; Fu, L.; Karkee, M.; Zhang, Q.; Whiting, M.D. Deep learning based segmentation for automated training of apple trees on trellis wires. Comput. Electron. Agric. 2020, 170, 105277. [Google Scholar] [CrossRef]
- Tinoco, V.; Silva, M.F.; Santos, F.N.; Rocha, L.F.; Magalhães, S.; Santos, L.C. A Review of Pruning and Harvesting Manipulators. In Proceedings of the 2021 IEEE International Conference on Autonomous Robot Systems and Competitions (ICARSC), Santa Maria da Feira, Portugal, 28–29 April 2021; pp. 155–160. [Google Scholar]
- Borrenpohl, D.; Karkee, M. Automated pruning decisions in dormant sweet cherry canopies using instance segmentation. Comput. Electron. Agric. 2023, 207, 107716. [Google Scholar] [CrossRef]
- Kong, X.; Li, X.; Zhu, X.; Guo, Z.; Zeng, L. Detection model based on improved faster-RCNN in apple orchard environment. Intell. Syst. Appl. 2024, 21, 200325. [Google Scholar] [CrossRef]
- Li, Y.; Zhang, Z.; Wang, X.; Fu, W.; Li, J. Automatic reconstruction and modeling of dormant jujube trees using three-view image constraints for intelligent pruning applications. Comput. Electron. Agric. 2023, 212, 108149. [Google Scholar] [CrossRef]
- Lodolini, E.; Polverigiani, S.; Giorgi, V.; Famiani, F.; Neri, D. Time and type of pruning affect tree growth and yield in high-density olive orchards. Sci. Hortic. 2023, 311, 111831. [Google Scholar] [CrossRef]
- Tong, S.; Zhang, J.; Li, W.; Wang, Y.; Kang, F. An image-based system for locating pruning points in apple trees using instance segmentation and RGB-D images. Biosyst. Eng. 2023, 236, 277–286. [Google Scholar] [CrossRef]
- Ryalls, J.M.; Garratt, M.P.; Spadaro, D.; Mauchline, A.L. The benefits of integrated pest management for apple depend on pest type and production metrics. Front. Sustain. Food Syst. 2024, 8, 1321067. [Google Scholar] [CrossRef]
- Zahid, A.; Mahmud, M.S.; He, L.; Choi, D.; Heinemann, P.; Schupp, J. Development of an integrated 3R end-effector with a cartesian manipulator for pruning apple trees. Comput. Electron. Agric. 2020, 179, 105837. [Google Scholar] [CrossRef]
- Kolmanič, S.; Strnad, D.; Kohek, Š.; Benes, B.; Hirst, P. An algorithm for automatic dormant tree pruning. Appl. Soft Comput. 2021, 99, 106931. [Google Scholar] [CrossRef]
- Zahid, A.; Mahmud, M.S.; He, L.; Heinemann, P.; Choi, D.; Schupp, J. Technological advancements towards developing a robotic pruner for apple trees: A review. Comput. Electron. Agric. 2021, 189, 106383. [Google Scholar] [CrossRef]
- Sapkota, R.; Ahmed, D.; Karkee, M. Comparing YOLOv8 and Mask R-CNN for instance segmentation in complex orchard environments. Artif. Intell. Agric. 2024, 13, 84–99. [Google Scholar] [CrossRef]
- You, A.; Grimm, C.; Silwal, A.; Davidson, J.R. Semantics-guided skeletonization of upright fruiting offshoot trees for robotic pruning. Comput. Electron. Agric. 2022, 192, 106622. [Google Scholar] [CrossRef]
- Chen, Z.; Ting, D.; Newbury, R.; Chen, C. Semantic segmentation for partially occluded apple trees based on deep learning. Comput. Electron. Agric. 2021, 181, 105952. [Google Scholar] [CrossRef]
- Moriya, É.A.S.; Imai, N.N.; Tommaselli, A.M.G.; Berveglieri, A.; Santos, G.H.; Soares, M.A.; Marino, M.; Reis, T.T. Detection and mapping of trees infected with citrus gummosis using UAV hyperspectral data. Comput. Electron. Agric. 2021, 188, 106298. [Google Scholar] [CrossRef]
- Kang, H.; Chen, C. Fruit detection, segmentation and 3D visualisation of environments in apple orchards. Comput. Electron. Agric. 2020, 171, 105302. [Google Scholar] [CrossRef]
- Maheswari, P.; Raja, P.; Karkee, M.; Raja, M.; Baig, R.U.; Trung, K.T.; Hoang, V.T. Performance Analysis of Modified DeepLabv3+ Architecture for Fruit Detection and Localization in Apple Orchards. Smart Agric. Technol. 2024, 10, 100729. [Google Scholar] [CrossRef]
- Loshchilov, I. Decoupled weight decay regularization. arXiv 2017, arXiv:1711.05101. [Google Scholar]
- Li, W.; Liu, W.; Zhu, J.; Cui, M.; Hua, R.Y.X.; Zhang, L. Box2mask: Box-supervised instance segmentation via level-set evolution. IEEE Trans. Pattern Anal. Mach. Intell. 2024, 46, 5157–5173. [Google Scholar] [CrossRef]
- Liu, L.; Li, G.; Du, Y.; Li, X.; Wu, X.; Qiao, Z.; Wang, T. CS-net: Conv-simpleformer network for agricultural image segmentation. Pattern Recognit. 2024, 147, 110140. [Google Scholar] [CrossRef]
- He, K.; Gkioxari, G.; Dollár, P.; Girshick, R. Mask R-CNN. In Proceedings of the IEEE International Conference on Computer Vision, Venice, Italy, 22–29 October 2017; pp. 2961–2969. [Google Scholar]
- Badrinarayanan, V.; Kendall, A.; Cipolla, R. Segnet: A deep convolutional encoder-decoder architecture for image segmentation. IEEE Trans. Pattern Anal. Mach. Intell. 2017, 39, 2481–2495. [Google Scholar] [CrossRef]
- Zhang, Y.; Lv, C. TinySegformer: A lightweight visual segmentation model for real-time agricultural pest detection. Comput. Electron. Agric. 2024, 218, 108740. [Google Scholar] [CrossRef]
- Tagarakis, A.; Koundouras, S.; Fountas, S.; Gemtos, T. Evaluation of the use of LIDAR laser scanner to map pruning wood in vineyards and its potential for management zones delineation. Precis. Agric. 2018, 19, 334–347. [Google Scholar] [CrossRef]
- Strnad, D.; Kohek, Š.; Benes, B.; Kolmanič, S.; Žalik, B. A framework for multi-objective optimization of virtual tree pruning based on growth simulation. Expert Syst. Appl. 2020, 162, 113792. [Google Scholar] [CrossRef]
- Underwood, J.P.; Hung, C.; Whelan, B.; Sukkarieh, S. Mapping almond orchard canopy volume, flowers, fruit and yield using lidar and vision sensors. Comput. Electron. Agric. 2016, 130, 83–96. [Google Scholar] [CrossRef]
- Westling, F.; Underwood, J.; Örn, S. Light interception modelling using unstructured LiDAR data in avocado orchards. Comput. Electron. Agric. 2018, 153, 177–187. [Google Scholar] [CrossRef]
- Westling, F.; Bryson, M.; Underwood, J. SimTreeLS: Simulating aerial and terrestrial laser scans of trees. Comput. Electron. Agric. 2021, 187, 106277. [Google Scholar] [CrossRef]
- He, L.; Schupp, J. Sensing and automation in pruning of apple trees: A review. Agronomy 2018, 8, 211. [Google Scholar] [CrossRef]
- Robinson, T.L.; Lakso, A.N.; Ren, Z. Modifying apple tree canopies for improved production efficiency. HortScience 1991, 26, 1005–1012. [Google Scholar] [CrossRef]
- Zhang, X.; He, L.; Majeed, Y.; Whiting, M.D.; Karkee, M.; Zhang, Q. A precision pruning strategy for improving efficiency of vibratory mechanical harvesting of apples. Trans. ASABE 2018, 61, 1565–1576. [Google Scholar] [CrossRef]
- Mhamed, M.; Zhang, Z.; Yu, J.; Li, Y.; Zhang, M. Advances in apple’s automated orchard equipment: A comprehensive research. Comput. Electron. Agric. 2024, 221, 108926. [Google Scholar] [CrossRef]
- Dong, X.; Kim, W.Y.; Yu, Z.; Oh, J.Y.; Ehsani, R.; Lee, K.H. Improved voxel-based volume estimation and pruning severity mapping of apple trees during the pruning period. Comput. Electron. Agric. 2024, 219, 108834. [Google Scholar] [CrossRef]


| Spectral Band | Wavelength Range | Number of Samples |
|---|---|---|
| Blue | 450–520 nm | 2781 |
| Green | 520–590 nm | 2593 |
| Red | 620–760 nm | 2964 |
| Model | Precision | Recall | Accuracy | F1 Score | mAP@50 | mAP@75 | FPS |
|---|---|---|---|---|---|---|---|
| Mask R-CNN [21] | 0.83 | 0.79 | 0.81 | 0.81 | 0.80 | 0.79 | 18.2 |
| SegNet [22] | 0.86 | 0.82 | 0.84 | 0.84 | 0.85 | 0.83 | 22.1 |
| Tiny-Segformer [23] | 0.88 | 0.85 | 0.86 | 0.86 | 0.88 | 0.86 | 29.4 |
| CS-net [20] | 0.90 | 0.88 | 0.89 | 0.89 | 0.89 | 0.88 | 25.0 |
| Box2Mask [19] | 0.91 | 0.89 | 0.90 | 0.90 | 0.89 | 0.88 | 24.3 |
| Proposed Method | 0.94 | 0.90 | 0.92 | 0.92 | 0.91 | 0.90 | 31.2 |
| Model | Precision | Recall | Accuracy | F1 Score |
|---|---|---|---|---|
| SVM | 0.81 | 0.78 | 0.80 | 0.79 |
| MLP | 0.85 | 0.82 | 0.83 | 0.83 |
| Random Forest | 0.88 | 0.85 | 0.86 | 0.86 |
| Ours | 0.92 | 0.89 | 0.91 | 0.91 |
| Light | Temperature and Humidity | Branch Growth Angle | Precision | Recall | Accuracy | F1 Score |
|---|---|---|---|---|---|---|
| ✓ | ✕ | ✕ | 0.75 | 0.71 | 0.73 | 0.73 |
| ✕ | ✓ | ✕ | 0.73 | 0.70 | 0.71 | 0.71 |
| ✕ | ✕ | ✓ | 0.78 | 0.74 | 0.76 | 0.76 |
| ✕ | ✓ | ✓ | 0.86 | 0.83 | 0.84 | 0.84 |
| ✓ | ✓ | ✕ | 0.84 | 0.80 | 0.82 | 0.82 |
| ✓ | ✕ | ✓ | 0.81 | 0.78 | 0.80 | 0.79 |
| ✓ | ✓ | ✓ | 0.92 | 0.89 | 0.91 | 0.91 |
Disclaimer/Publisher’s Note: The statements, opinions and data contained in all publications are solely those of the individual author(s) and contributor(s) and not of MDPI and/or the editor(s). MDPI and/or the editor(s) disclaim responsibility for any injury to people or property resulting from any ideas, methods, instructions or products referred to in the content. |
© 2025 by the authors. Licensee MDPI, Basel, Switzerland. This article is an open access article distributed under the terms and conditions of the Creative Commons Attribution (CC BY) license (https://creativecommons.org/licenses/by/4.0/).
Share and Cite
Hai, T.; Wang, W.; Yan, F.; Liu, M.; Li, C.; Li, S.; Hu, R.; Lv, C. A Deep Learning-Based Approach to Apple Tree Pruning and Evaluation with Multi-Modal Data for Enhanced Accuracy in Agricultural Practices. Agronomy 2025, 15, 1242. https://doi.org/10.3390/agronomy15051242
Hai T, Wang W, Yan F, Liu M, Li C, Li S, Hu R, Lv C. A Deep Learning-Based Approach to Apple Tree Pruning and Evaluation with Multi-Modal Data for Enhanced Accuracy in Agricultural Practices. Agronomy. 2025; 15(5):1242. https://doi.org/10.3390/agronomy15051242
Chicago/Turabian StyleHai, Tong, Wuxiong Wang, Fengyi Yan, Mingyu Liu, Chengze Li, Shengrong Li, Ruojia Hu, and Chunli Lv. 2025. "A Deep Learning-Based Approach to Apple Tree Pruning and Evaluation with Multi-Modal Data for Enhanced Accuracy in Agricultural Practices" Agronomy 15, no. 5: 1242. https://doi.org/10.3390/agronomy15051242
APA StyleHai, T., Wang, W., Yan, F., Liu, M., Li, C., Li, S., Hu, R., & Lv, C. (2025). A Deep Learning-Based Approach to Apple Tree Pruning and Evaluation with Multi-Modal Data for Enhanced Accuracy in Agricultural Practices. Agronomy, 15(5), 1242. https://doi.org/10.3390/agronomy15051242