Article

Impact of Digestate-Derived Nitrogen on Nutrient Content Dynamics in Winter Oilseed Rape Before Flowering

by
Remigiusz Łukowiak
1,*,
Witold Szczepaniak
1 and
Dominik Młodecki
2
1
Department of Agricultural Chemistry and Environmental Biogeochemistry, Poznan University of Life Sciences, Wojska Polskiego 28, 60-637 Poznan, Poland
2
K+S Polska sp. z o.o. Poznań, Street 28 Czerwca 1956 r No. 404, 61-441 Poznań, Poland
*
Author to whom correspondence should be addressed.
Agronomy 2025, 15(5), 1241; https://doi.org/10.3390/agronomy15051241
Submission received: 28 March 2025 / Revised: 14 May 2025 / Accepted: 15 May 2025 / Published: 20 May 2025

Abstract

:
The increase in biogas production has caused a simultaneous increase in the production of digestate, which is a valuable carrier of nutrients in crop plant production. Digestate-derived nitrogen ensures the optimal nutritional status of winter oilseed plants at critical stages of yield formation. This hypothesis was verified in field experiments with winter oilseed rape (WOSR) conducted in the 2015/2016, 2016/2017, and 2017/2018 growing seasons. The experiment consisted of three nitrogen fertilization systems (FSs)—mineral ammonium nitrate (AN) (AN-FS), digestate-based (D-FS), and 2/3 digestate + 1/3 AN (DAN-FS)—and five Nf doses: 0, 80, 120, 160, and 240 kg N ha−1. Plants fertilized with digestate had higher yields than those fertilized with AN. The highest seed yield (SY) was recorded in the DAN-FS, which was 0.56 t ha−1 higher than that in the M-FS. The nitrogen fertilizer replacement value (NFRV), averaged over N doses, was 104% for the D-FS and reached 111% for the mixed DAN-FS system. The N content in WOSR leaves, which was within the range of 41–48 g kg−1 DM at the rosette stage and within 34–44 g kg−1 DM at the beginning of flowering, ensured optimal plant growth and seed yield. In WOSR plants fertilized with digestate, the nitrogen (N) content was significantly lower compared to that in plants fertilized with AN, but this difference did not have a negative impact on the seed yield (SY). The observed positive effect of the digestate on plant growth in the pre-flowering period of WOSR growth and on SY resulted from the impact of Mg, which effectively controlled Ca, especially in the third growing season (which was dry). Mg had a significant effect on the biomass of rosettes and on SY, but only when its content in leaves exceeded 2.0 g kg−1 DM. It is necessary to emphasize the specific role of the digestate, which significantly reduced the Ca content in the indicator WOSR organs. Increased Ca content during the vegetative period of WOSR growth reduced leaf N and Zn contents, which ultimately led to a decrease in SY. Therefore, the rosette phase of WOSR growth should be considered a reliable diagnostic phase for both the correction of plants’ nutritional status and the prediction of SY. It can be concluded that the fertilization value of digestate-derived N was the same as that of ammonium nitrate. This means that the mineral fertilizer can be replaced by digestate in WOSR production.

1. Introduction

The difference between potential and actual yields is known as the yield gap (YG) [1]. The key problem is not in quantifying the actual yield, which is essentially the yield harvested by the farmer, but in accurately estimating the first component of this equation (i.e., the potential yield). The yield potential in a well-defined geographical region is determined by two factors: climate and soil fertility [2]. Apparently, there are many methods for determining the potential yield under given environmental conditions, starting from yield records or yields obtained in agronomic formal units, which test crop varieties [3]. However, it is difficult to determine the yield gap by assuming the optimal effects of agrochemical factors synchronized with environmental factors. Maximum yields calculated in this way only cover a few percent of the field area (1–2%) [4]. It is much easier to estimate the so-called potentially available yield (PAY), in which both environmental and agronomic factors are taken into account. The procedure is based on determining and then transforming the N efficiency index, known as the Partial Factor Productivity of Fertilizer Nitrogen (PFPNf) [5,6]. In fact, the recorded yield gap results from the degree of N inefficiency in the soil/crop system in a given growing season. According to Anas et al. [7], the utilization of N from fertilizers ranges from 30% to 53%. Therefore, it is more appropriate to define the amount of unworkable nitrogen, or the nitrogen gap (NG), rather than the yield gap [8].
The increase in the global demand for food in the coming decades, estimated at a level of 50(75)%, requires an increase in plant production [9]. This requirement is expected to lead to an increase in the use of N fertilizers, which also constitutes an increase in the potential threat to the environment [10]. Therefore, in accordance with the latest scientific views on sustainable agricultural production, it is necessary to develop an optimal production system for a given crop grown in a well-defined geographical region [11]. Rational production rules aimed at the efficient use of N and other means of production should be consistent with the concept known as the sustainable intensification of agriculture [12].
Digestate is a byproduct of biogas plants that can be used in plant production, but only if the raw material is of agricultural origin. Its origin type (i.e., a main product or byproduct) is of secondary importance. Classic examples of main products include silage maize and farmyard manure, and cattle slurry and food waste are typical byproducts [13]. The main criterion affecting the fertilizing value of digestate in relation to N is the content of inorganic and organic N, including their proportions and the C/N ratio. However, the content of N is highly variable, ranging from about 3% to almost 14% DW [14]. The second criterion is the content of nutrients; this is often limited to P and K, but other nutrients cannot be omitted. Their contents are also highly variable depending on the type of raw material [15]. As recently reported by Häfner et al. [16], the mineral fertilizer equivalent of digestate assessed over two periods is in the range of 39–83%. Another criterion is the effect of the used digestate on the dynamics of microbiological activity in the soil, which, in turn, determines the soil fertility [17]. The key, final criterion determining the fertilizer value of the digestate is the crop yield. Generally, increases in the contents of available nutrients in the soil are observed [18,19,20].
The nitrogen fertilizer replacement value (NFRV) of digestate is best assessed in field experiments. In this procedure, the yields of plants fertilized with digestate are compared with those obtained with the same dose of mineral N fertilizer. The end effect (i.e., harvested yield) depends on numerous factors, including the origin of the digestate, the crop species, and the date and method of its application [21]. Danish studies have shown a significantly greater response of spring barley (47–173%) compared to winter wheat. The observed difference resulted from the method of digestate application: surface banding in wheat and injection in barley [22]. Field tests in Lithuania on the fertilization of spring cereals with surface-applied digestate showed that it had the same effect as mineral N fertilizer [23]. Maize is a plant in which digestate is often used [24]. The method of its application—which determines the efficient uptake of N and other nutrients by plants—is of secondary importance [25]. To date, published reports have shown that the response of sugar beets to the N carrier (mineral N, digestate), in fact, depends on the weather conditions during the growing season [26].
Winter oil seed rape (WOSR) is a key oil crop in the Northern Hemisphere [27]. Its growing season is very long, starting in September and ending in July of the following year. Seed yields are high but only if the soil fertility level and N fertilizer doses (Nf) are high [28,29,30]. The critical period of yield formation is long, starting in autumn, but the most sensitive period extends from the rosette stage (BBCH 30) to the stage of full inflorescence emergence (BBCH 50-59) [31]. The key factor influencing the rate of biomass growth is the supply of N [32,33]. Plant growth is determined by the mass of nitrate N in the 0–90 cm layer of the soil [34]. Efficient N uptake—and, thus, the dynamics of biomass growth—depends on the K supply in this period [35].
The fertilizing value of N present in digestate applied to WOSR should be equivalent to that of N in mineral fertilizers. We assumed that N from digestate, modulating the dynamics of nitrogen and nutrient uptake, significantly affects biomass accumulation before flowering of winter rape. In this study, it was hypothesized that using digestate as a nitrogen carrier could ensure the optimal nutritional status of winter oilseed rape in critical stages of yield formation. As a result, digestate-derived nitrogen can ensure optimal nutritional status of winter rapeseed in critical yield development phases. Based on this hypothesis, the following research objectives were formulated. The first was to evaluate the nutrient content in WOSR plants in two consecutive growth stages: rosettes (BBCH 30; leaves) and the beginning of flowering (BBCH 60; leaves and stems). The second was to predict the plant biomass and seed yield based on the nutrient content in plant parts in both critical stages of yield formation.

2. Materials and Methods

2.1. Site Description

The primary sources of data presented in this article are three series of field experiments with WOSR (Brassica napus L.). A two-factor field experiment was set up in a split-block design with four replications. It was carried out in the 2015/2016, 2016/2017, and 2017/2018 growing seasons in Baniewice (53°05′ N; 14°36′ E), Poland. The field experiment was conducted on loamy sand in the topsoil over loamy sand in the subsoil, classified as Albic Luvisol (Table S1). The soil pH was slightly acidic in the first growing season and neutral in the remaining two. This condition was the result of liming, which was always performed under the WOSR pre-crop, which was barley. The size of the cation-exchange complex (CEC) was typical for the soil type under study. Liming, especially in the 2016/2017 and 2017/2017 seasons, caused the saturation of CEC to over 90%, simultaneously leading to a decrease in the content of acid cations. Every year, just before applying the examined fertilizers, the contents of available nutrients were measured at three soil depths: 0.0–0.3, 0.3–0.6, and 0.3–0.9 m. The content of available nutrients, except for calcium (Ca), was favorable for moderately yielding WOSR (Table 1).
The local climate, classified as intermediate between Atlantic and Continental, is seasonally variable (Table 2). The average air temperature throughout the whole growing season in all studied seasons was higher than the long-term average. In all seasons, air temperatures during autumn vegetation were highly favorable. In the 2017/2018 growing season, at the beginning of WOSR plant regrowth in February, growth conditions worsened. A sudden drop in air temperature resulted in a disturbance in plant growth. Precipitation from January to July amounted to 332 mm in 2016, 622 mm in 2017 (237 in July), and only 281 mm in 2017/2018. The amount of rainfall in May and June, critical months for pod and seed growth [25], was 91.3, 162.7 mm, and 46.7 mm in the 2016, 2017, and 2018 growing seasons, respectively.

2.2. Experimental Design

The field experiment was arranged as a two-factorial design. The first factor was the nitrogen fertilization system (FS), related to the type of N fertilizer applied: (I) ammonium nitrate, 34-0-0 (acronym AN-FS); (II) digestate-based (D-FS); (III) mixed—2/3 digestate + 1/3 AN (DAN-FS). The rates of applied N were 0 (absolute N control), 60, 120, 180, and 240 kg ha−1. The total N content (N-NH4 + Norg) in the applied digestate was determined. The dose of the digestate was determined on this basis, assuming the same NFRV, regardless of the N carrier. The raw digestate was taken directly from a biogas plant, and its chemical composition is shown in Table S2. Each year, the digestate was applied at the end of November, and AN was applied in the 1st week of March of the following year. The composition of the digestate, on average, was as follows: DM—72; Nt—7.2; N-NH4—3.7; P2O5—2.85; K2O—5.45; Ca—0.32; Mg—1.13; and S—1.99 kg m−3. Winter barley was a forecrop for WOSR. The hybrid WOSR variety Impression Cl, characterized by a high yield potential for moderately fertile soils, was used as a test crop. The crop was sown at a rate of 3.0 kg ha−1 (40–45 plants per m2) at the end of August and harvested at the end of July from an area of 12 m2. The seeds were harvested at maturity when the moisture content was 8% dry weight.

2.3. Chemical Analysis and Indices

Soil samples were collected from three soil depths, 0–0.3, 0.3–0.6, and 0.6–0.9 m, before WOSR sowing. The soil contents of NH4-N and NO3-N were determined in field-fresh (not air-dried) soil samples within 24 h of sampling. The total content of inorganic nitrogen (Nin) was expressed in kg ha−1. The Nmin content in a given soil layer was calculated using indices constructed based on the soil textural class and soil bulk density [40]. Soil pH was measured in a 1 M KCl solution (soil/solution ratio of 1:2.5; m/v). The contents of plant-available nutrients, including P, K, Mg, and Ca, were determined using the Mehlich 3 method [30]. The P concentration in the extract was determined colorimetrically using the molybdenum blue method. The concentration of K in the collected extracts was determined using flame photometry, and those of Mg and Ca were determined using flame AAS.
Plant material used for the determination of dry matter and the measurement of nutrient content was collected from an area of 1.0 m2. Plants were sampled in two growth stages: BBCH 30 (rosette) and BBCH 60 (the beginning of flowering, i.e., when 10% of flowers are present on the main stem). Plant samples (30 plants) were taken from the same sowing rows across a particular experimental block. The N concentration in the plant material was determined using the standard macro-Kjeldahl procedure. For mineral nutrients, the harvested plant sample was dried at 65 °C and then mineralized at 550 °C. The obtained ash was then dissolved in 33% HNO3. The P concentration was measured with the vanadium–molybdenum method using a Specord 2XX/40 (Analytik Jena, Jena, Germany) at a wavelength of 436 nm. The concentrations of K, Mg, Fe, Mn, Zn, and Cu were determined using flame atomic absorption spectrometry. The contents of the examined nutrients are expressed on a dry matter basis.

2.4. Criteria for Assessment of WOSR Nutritional Status at Cardinal Stages of Growth

The nutritional status of winter rapeseed (WOSR) was assessed on the basis of published content numbers/ranges (Table 3 and Table 4). For the assessment of the nutrient content in the stems, the ranges published by Grzebisz et al. [41] were used: N: 25–33; P: 2–3; K: 30–38; Mg: 1.4–2.6; Ca: 11–15 mg kg−1 DM; Fe: 152–216; Mn: 19–24; Zn: 778–24; and Cu: 2.5–5.0 mg kg−1 DM.

2.5. Statistical Analyses

The effects of individual research factors (year, N fertilization system, and N rate) and the interaction between them were assessed using two-way ANOVA. Differences between mean values were compared using the HSD test, according to the Tukey method, where the significance level was assessed at 0.05. STATISTICA 13® software was used to conduct all statistical analyses. The examined variables were evaluated based on the coefficient of variation (CV) using ranges proposed by Wilding and Drees [48]. According to the proposed ranges, CV < 15%, 15% < CV < 35%, and > 35% indicate low, moderate, and high variability in the obtained data, respectively. In the third step of the diagnostic procedure, the relationships between variables representing soil properties were analyzed using principal component analysis (PCA) (StatSoft, Inc., Tulsa, OK, USA, 2013). In the fourth step of the diagnostic procedure, stepwise regression was applied to define the optimal set of variables for a given plant characteristic. In the computational procedure, consecutive variables were removed from multiple linear regressions in a step-by-step manner. The best regression model was chosen based on the highest F-value for the model and the significance of all independent variables [49].

3. Results

3.1. Seed Yield of Winter Oilseed Rape

Seed yield (SY) was significantly dependent on the experimental factors and year (Table 5). The interactive effect of the fertilization system (FS) and nitrogen rate on SY was significant but highly variable in subsequent years of the study (Figure 1). The effect of the year on the variability of SY was the most evident in the AN-FS object. The coefficient of variation (CV) ranged from about 12% for the Nf plot with 240 kg N ha−1 to about 30% for the other fertilized plots. The CV for SY in the O-FS treatment, except for the absolute N control (ANC), was highly variable, exceeding 35% for the Nf plot with 60 kg N ha−1. A slightly lower but very stable CV (<30%) was recorded for the OM-FS. The effect of applied Nf on SY was the most apparent at a dose of 60 kg N ha−1. The increase in SY in this plot compared to the AC plot was 75% for the mineral FS (AN-FS), 87% for the organic FS (D-FS), and 71% for the DAN-FS. At higher N rates, a slight progressive trend of M ≤ O ≤ OM was observed. The developed regression models for each FS were used to calculate the maximum SY (STmax) for the well-defined Nf optimum (Nfop) (Figure S1). These cardinal values of SYmax were 3.05, 3.29, and 3.61 t ha−1 for the AN-FS, D-FS, and DAN-FS, respectively. These yields were obtained under the condition that Nfop reached 160, 184, and 188 kg N ha−1, respectively.

3.2. WOSR Nutritional Status—Rosettes

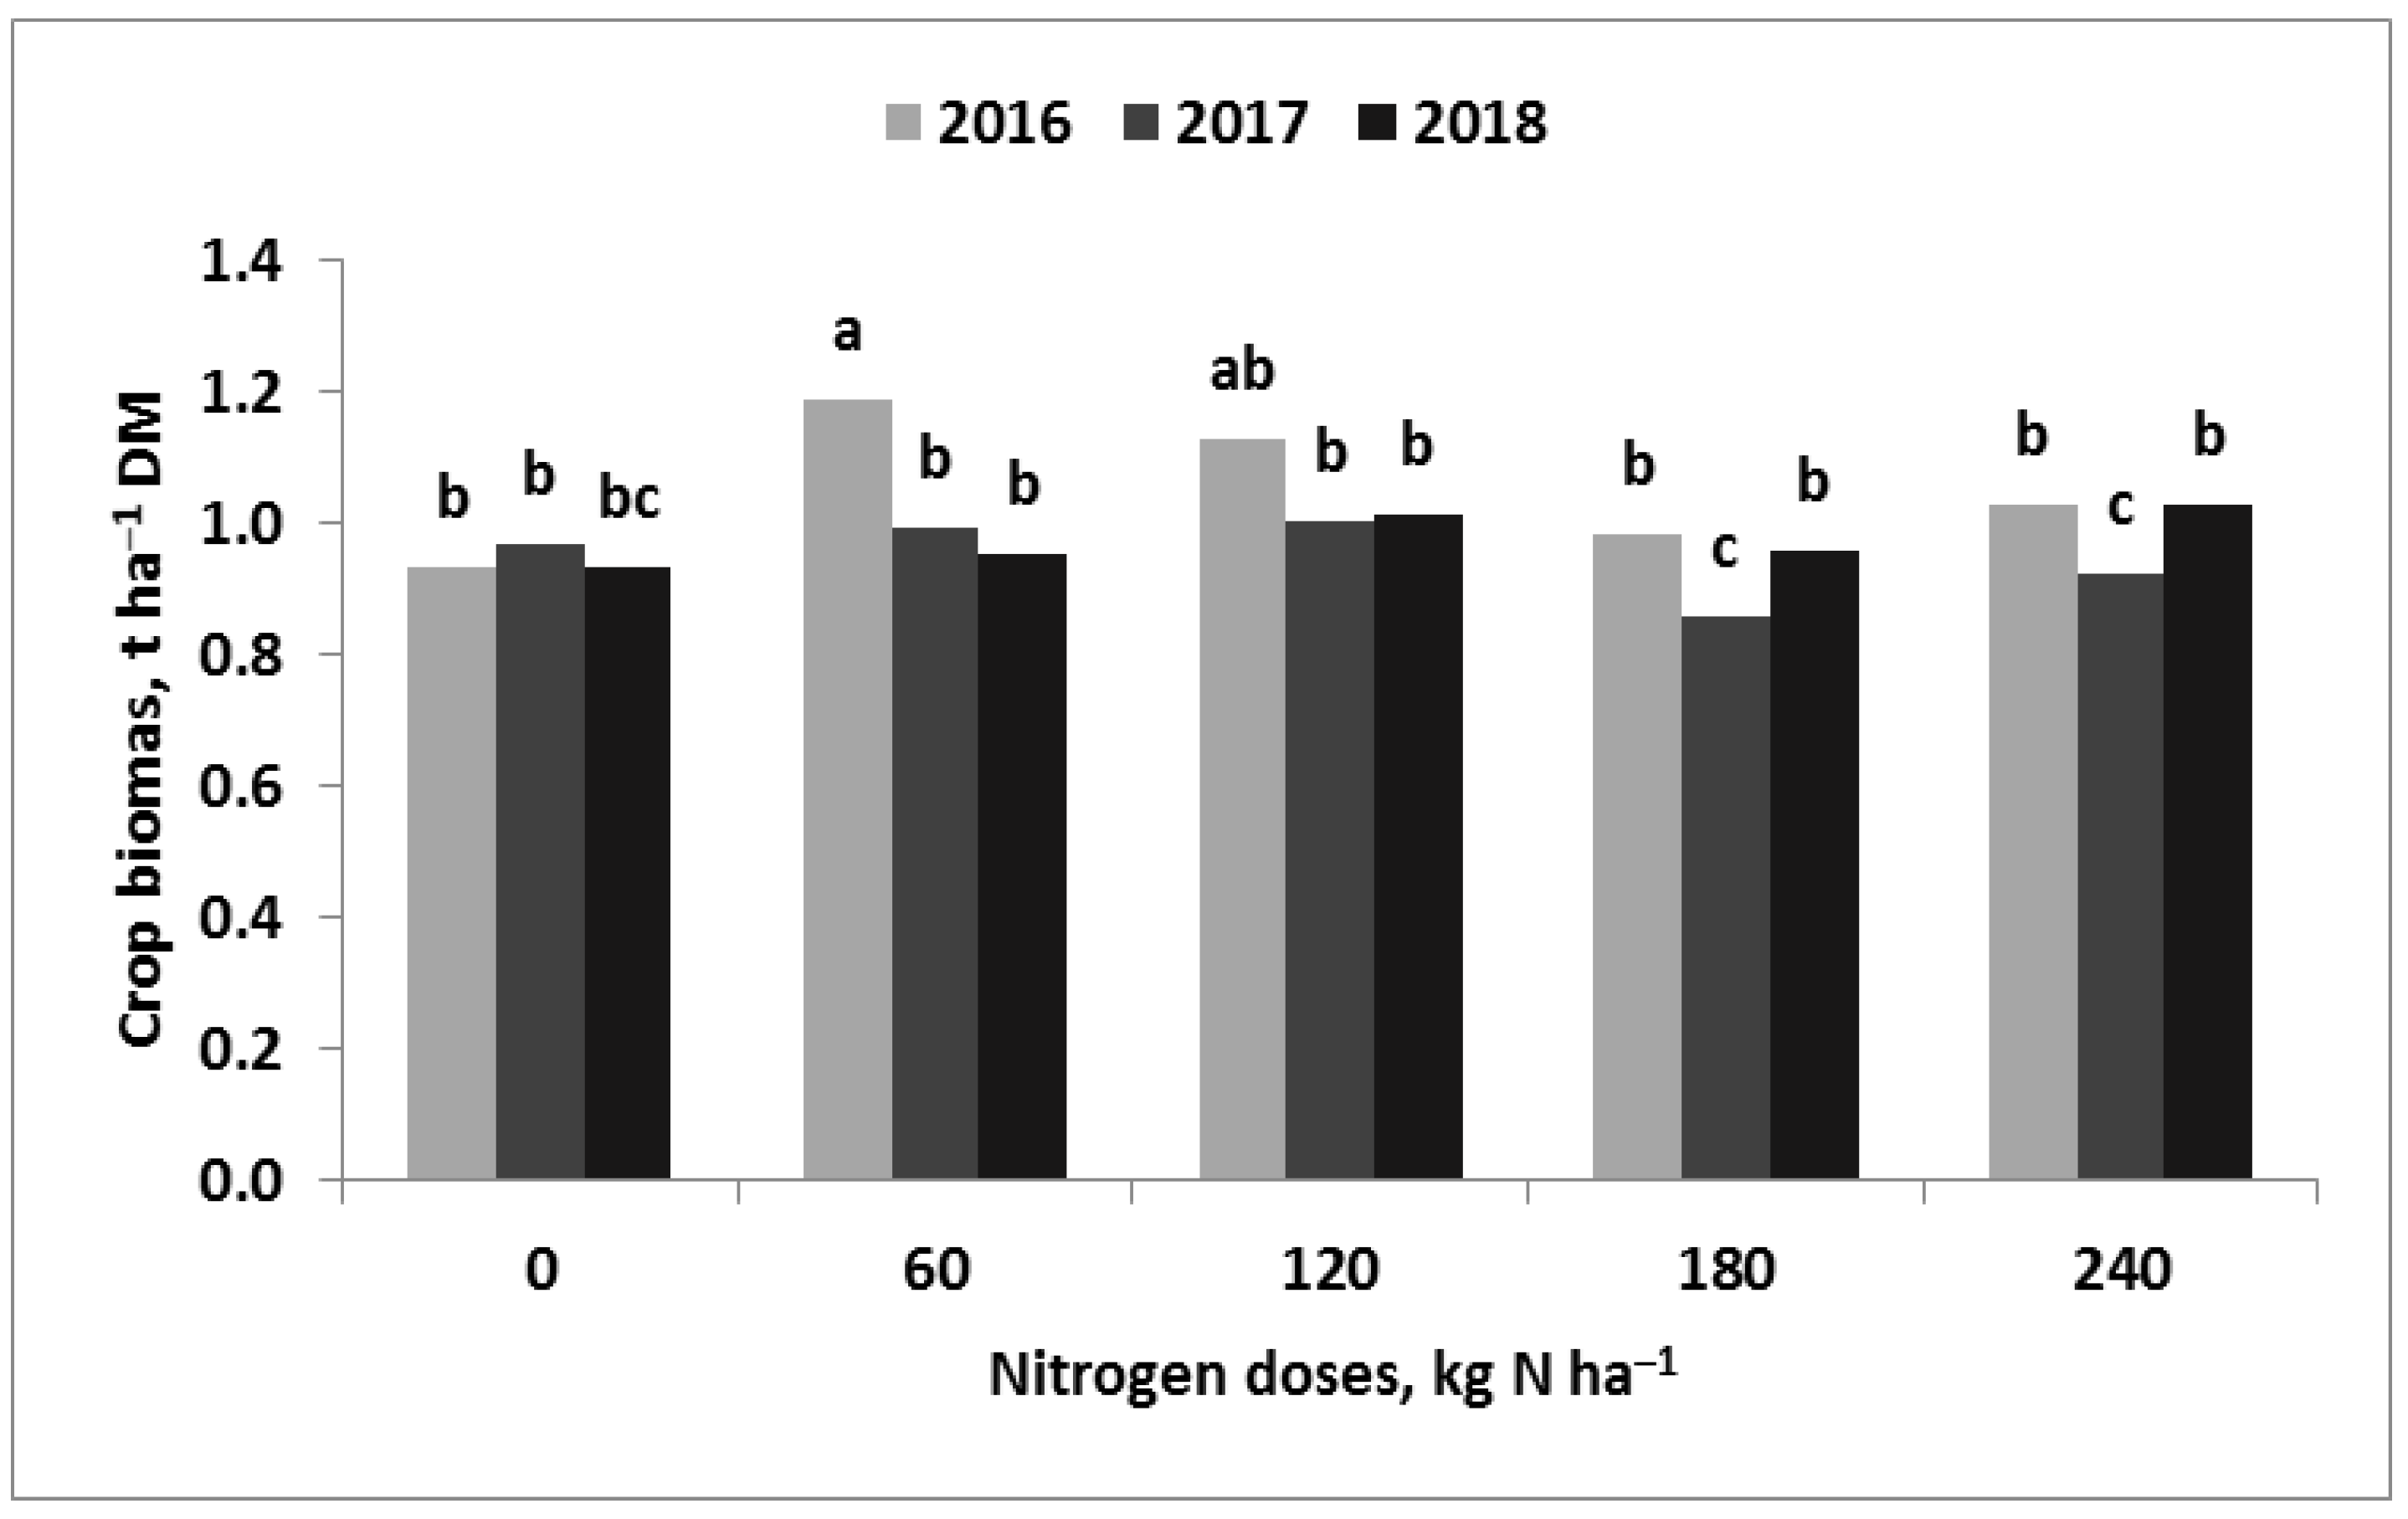
The biomass of WOSR rosette leaves at the BBCH 30 stage significantly depended on the interaction between the year and Nf dose (Figure A1). The highest crop biomass was produced by plants in the 2016/2017 season, while the lowest was in the 2017/2018 growing season (Table 5). The crop biomass at the rosette stage (BR) was clearly stable at the lowest Nf dose and unstable at the highest. In general, the yield increased linearly with the plant biomass, as can be seen from the obtained equation. It was mainly determined by the year factor and was the lowest in the dry 2017/2018 growing season. This relationship is as follows:
S Y = 2.43 B R + 0.57   f o r   n = 40 , R 2 = 0.42 , p 0.001
In the subsequent years of the study, weather conditions were a key factor affecting the nutrient content in the leaves of WOSR at the examined growth stage (Table 5). In the dry 2017/2018 season, there was a very large, significant increase in the contents of N, K, Ca, Mn, Zn, and Cu, but at the same time, there was a decrease in the content of Mg compared to the other growing seasons. The FS did not affect N, P, or Mg. K, Ca, and Mn contents were significantly lower with the use of the digestate compared to the M-FS. At the same time, Fe and Zn significantly increased. Increasing the Nf dose did not affect P, K, Ca, Mn, or Cu. In the case of N, its content increased with the Nf dose. The interaction between the year and FS was found to have a significant effect on Mg, Ca, Fe, Zn, and Mn. Among these five nutrients, Zn had a significant impact on the biomass of rosettes (BR), as discriminated by stepwise regression analysis, and Mg, Ca, and Fe significantly affected SY. The obtained equations are presented below:
B R = 0.51 + 0.22 P 0.0076 Z n   f o r   n = 45 , R 2 = 0.76 , p   0.001
S Y = 0.69 + 1.73 M g 008 C a + 0.008 F e   f o r   n = 45 , R 2 = 0.63 ,   p   0.001
The year was the only reason for variability in the content of P. The highest P content was recorded in the wet growing season of 2016/2017 (Table 5). The negative effect of Zn on BR is because of its extremely high content in leaves in the dry growing season of 2017/2018, in which plant biomass was the lowest. The effects of the experimental factors on Zn content are difficult to determine, although the highest Zn content was recorded for the plot fertilized with 60 kg N ha−1 in the D-FS treatment (Figure S2). In none of the examined FSs was there a significant trend in Zn content increase with increasing N dose (Figure S3). The content of Mg varied mainly due to weather conditions in subsequent years of the study. Increasing the dose of N applied as digestate led to a decrease in Mg content compared to the application of AN (Figure S4). The Fe content was weakly affected by both experimental factors, but it was significantly higher in plants fertilized with 60 kg N ha−1 as digestate. In general, the lowest Fe content was recorded in the wet season of 2016/2017. In addition, it was negatively correlated with the P content (Table A1). However, the key nutrient for SY prediction turned out to be Ca, whose content was sensitive to both experimental factors and the year. At the examined stage of WOSR growth, the experimental factors played a key role (Figure 2). A progressive downward trend in Ca content was recorded with increasing Nf dose. Although it was not significant for the AN-FS, it was highly significant for the FS with digestate as the key N carrier (Figure S5).
The average N content in the leaves of WOSR at the rosette stage was 43 ± 2.9 g kg−1 DM. This value is within the range given by Weichmann [43], which could be regarded as medium-yielding WOSR. It was also lower than the ranges indicated for high-yielding WOSR presented by Merrien [42] and Grzebisz [44] (Table 3). The same conclusion was drawn for the P content, which was 3.5 ± 0.8 g kg−1 DM. The value of CV for P was in the average range (15–35%). The average K content was 32.1 ± 4.7 g kg−1 DM. This value meets the accepted evaluation criteria, regardless of the standard range. In addition, the CV for K was small (<15%). Much greater variability was noted for Mg, Ca, Fe, and Mn, confirmed by CV values being in the moderate range. These four nutrients showed interactions with the experimental factors and the year. The average contents of Mg and Ca were 1.9 ± 0.4 and 15.8 ± 4.1 g kg−1 DM, respectively. The obtained ranges, similarly to those for N and P, met the requirements for medium-yielding but not for high-yielding rapeseed. The average contents of Fe and Mn were 185.5 ± 56.6 and 34.6 ± 10.4 mg kg−1 DM. The ranges obtained are within the standard ranges (Table 3). The average Zn content was 38.1 ± 17.8 mg kg−1 DM and was highly variable in subsequent years of the study (CV > 35%). This range seemingly met the requirements for high-yielding rapeseed because, in years with optimal weather conditions, the average Zn content was only 26 mg kg−1 DM. The average Cu content was 5.5 ± 0.5 mg kg−1 DM, indicating high stability to the examined factors throughout the study (CV < 15%).
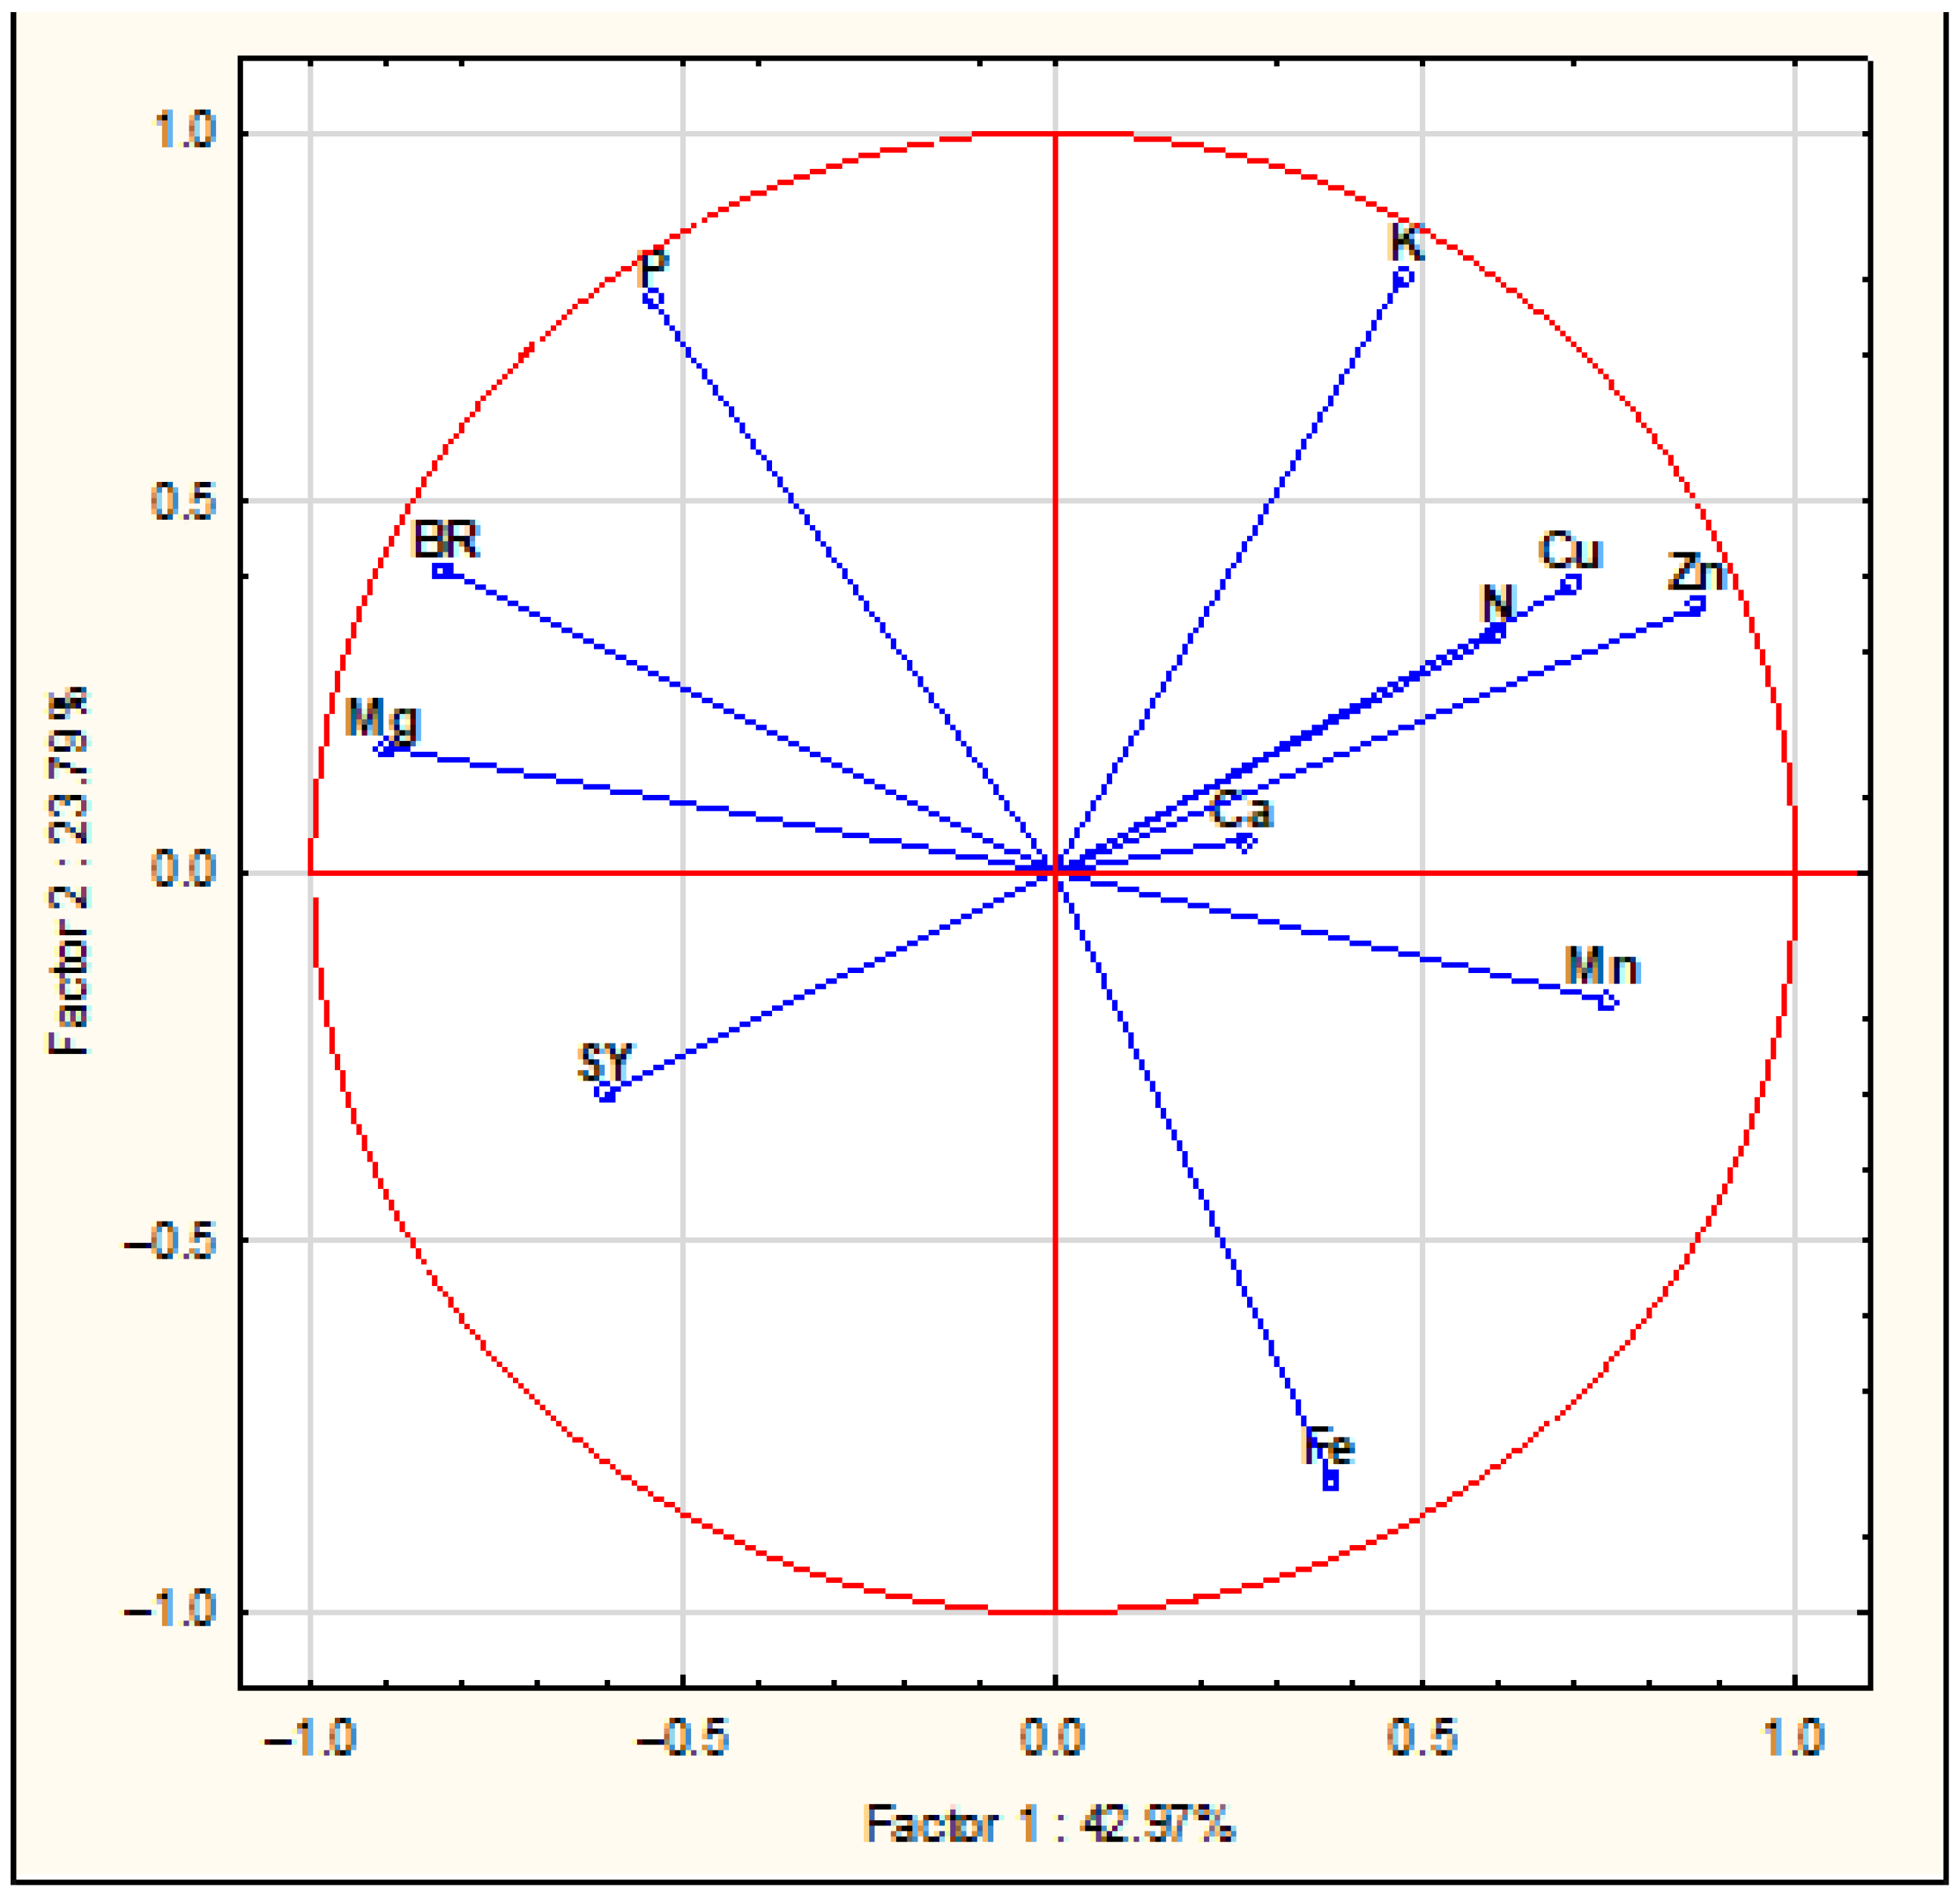
Principal component analysis (PCA) clearly revealed a distinct impact of the FSs on the strength of relationships between the nutrient content, SY, and biomass of rosettes. A PC eigenvalue greater than 1.0 was used as the primary criterion to determine the number of PCs. The first three principal components (PCs) accounted for 76.1% of the total variance in the data (Table 6). However, only variables with scores on PCs over 0.70 (R2 > 0.50) were taken into consideration. Overall, five of the eleven examined variables had loadings on PC1, meeting the chosen criterion. The highest loadings, based on absolute values in descending order (r), were recorded for Mg ≥ Zn > BR > Mn > Cu. The loading for SY was negative and low. The required criterion for PC2 was reached for Fe (negative) and for K and P (positive). On PC3, the required criterion was met only for Ca, and it was positive. The studied variable weight was evaluated using the eigenvector, which varies between −1 and +1. The eigenvectors for the examined variables were broadly scattered on the first two PCA axes (Figure A2).

3.3. WOSR Nutritional Status—Leaves

The biomass of WOSR leaves at the beginning of flowering was significantly dependent on the interactions of the experimental factors and the year (Table 7). In the 2017/2018 growing season, it was 65% of that recorded in both previous seasons. Despite such high variability in the studied years, SY depended on the biomass of leaves (BL) to a large extent:
S Y = 0.71 + 1.17 B L   f o r   n = 45 , R 2 = 0.55 ,   p   0.001
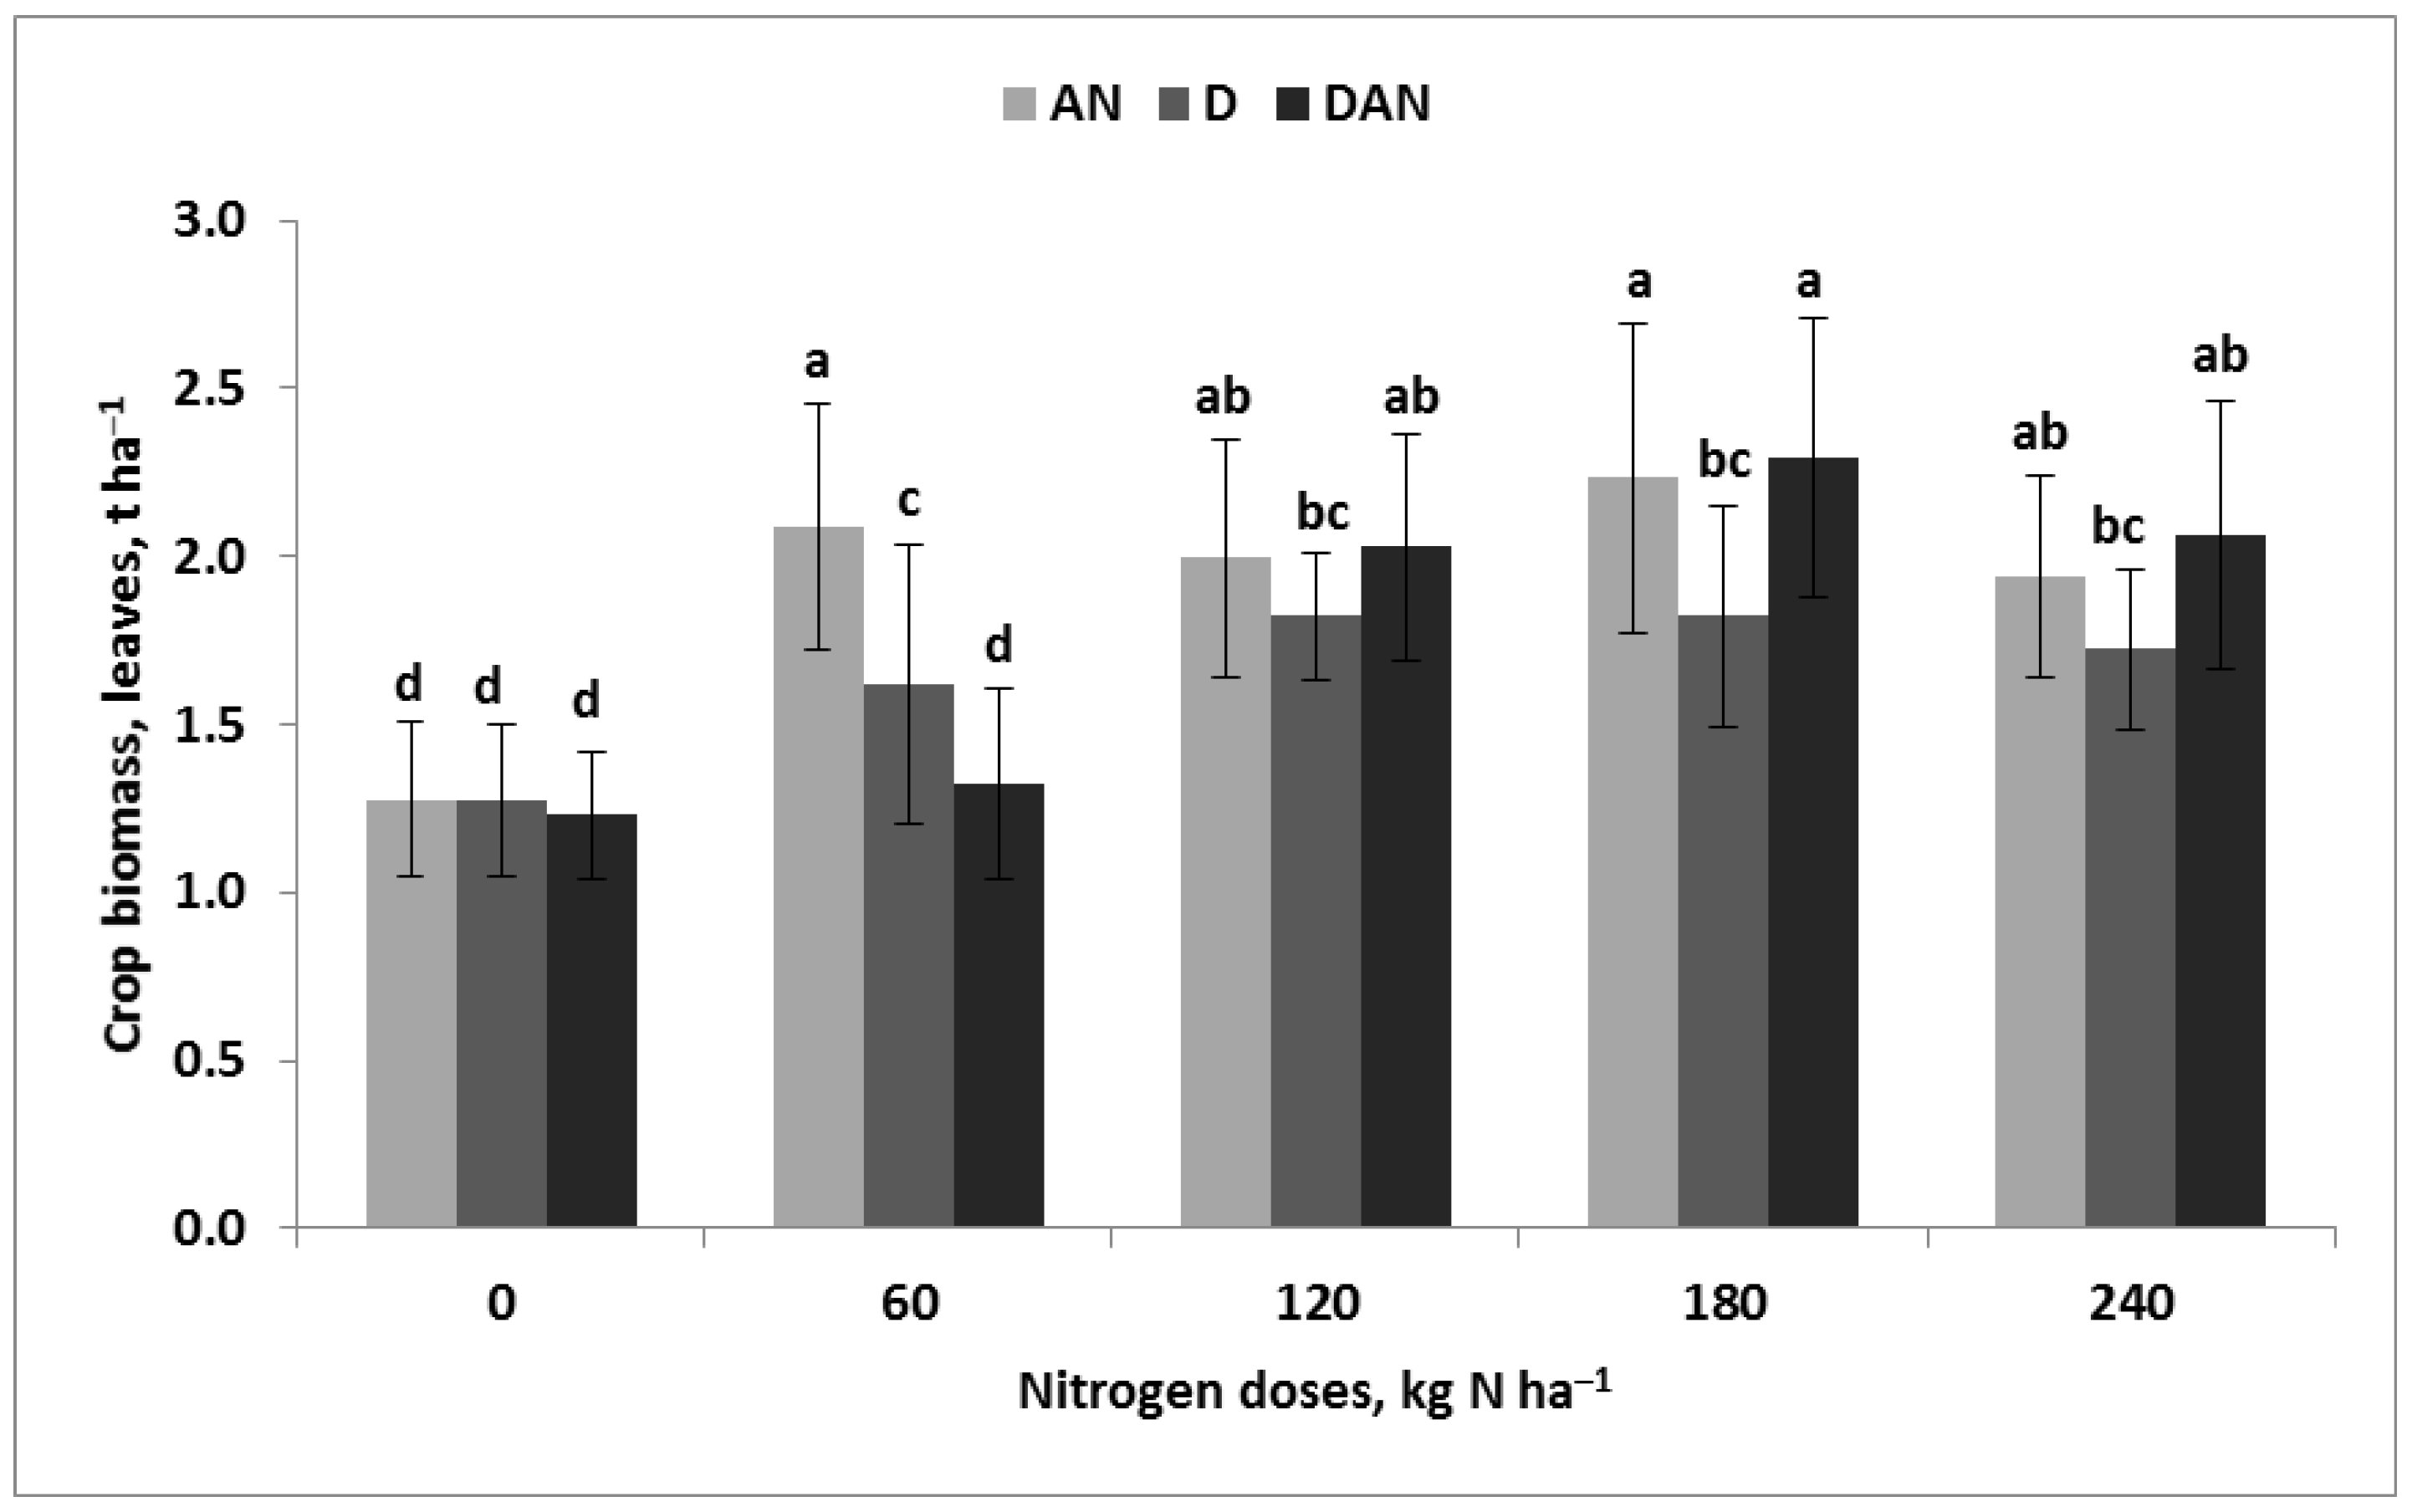
The effect of increasing Nf doses was progressive but varied depending on the FS (Figure 3). The significant advantage of the M-FS compared to the other FSs was noted only on the plot fertilized with 60 kg N ha−1. Increasing Nf doses caused a decrease in BL consistent with the order AN-FS = DAN-FS > D-FS. The developed regression models for each FS were used to determine the maximum BL (BLmax) at a well-defined Nf optimum (Nfop) (Figure S6). The cardinal values of SYmax were 2.22, 1.83, and 2.18 t ha−1 for AN-FS, D-FS, and DAN-FS, respectively. These yields were obtained under the condition that Nfop reached 154, 159, and 226 kg N ha−1, respectively.
The contents of the examined nutrients in the leaves of WOSR at the beginning of flowering significantly varied in the subsequent growing seasons (Table 7). P was the only nutrient whose content responded exclusively to the weather in a given growing season. Significantly lower P content was recorded in the 2016/2017 growing season. The biomass of leaves, as indicated by the stepwise regression analysis, was driven by Mg and Mn:
B L = 0.59 + 0.67 M g + 0.018 M n   f o r   n = 45 , R 2 = 0.36 ,   p   0.01
Mg content showed large seasonal variability. Its content in the wet 2016/2017 season was almost two-fold higher than in the dry 2017/2018 season. Nevertheless, it responded significantly to the FS × Nf interaction (Figure 4). The advantage of the AN-FS over the other FSs was significant at the tested Nf doses. As a rule, the Mg content increased with increasing Nf doses in the treatments with AN. In contrast, the trend in Mg in the D-FS followed a quadratic regression model, reaching a Mgmax of 2.24 g kg−1 DM for Nfop = 135 kg N ha−1 (Figure S7). The content of Mg was positively correlated with K and negatively with the other nutrients, including Mn (Table A2). Mn content was strongly dependent on the year and was the lowest in the wet growing season of 2016/2017. The impact of the FSs was much smaller compared to the effect of increasing Nf doses, which affected Mg content gradually, starting from 60 kg N ha−1 (Figure S8).
SY depended on five nutrients, as shown by the stepwise analysis. This relationship is presented by the equation below:
S Y = 3.66 + 0.09 N + 0.07 K 0.04 C a 0.03 Z n + 0.56 C 6 C u   f o r   n = 45 , R 2 = 0.68   f o r   p   0.01
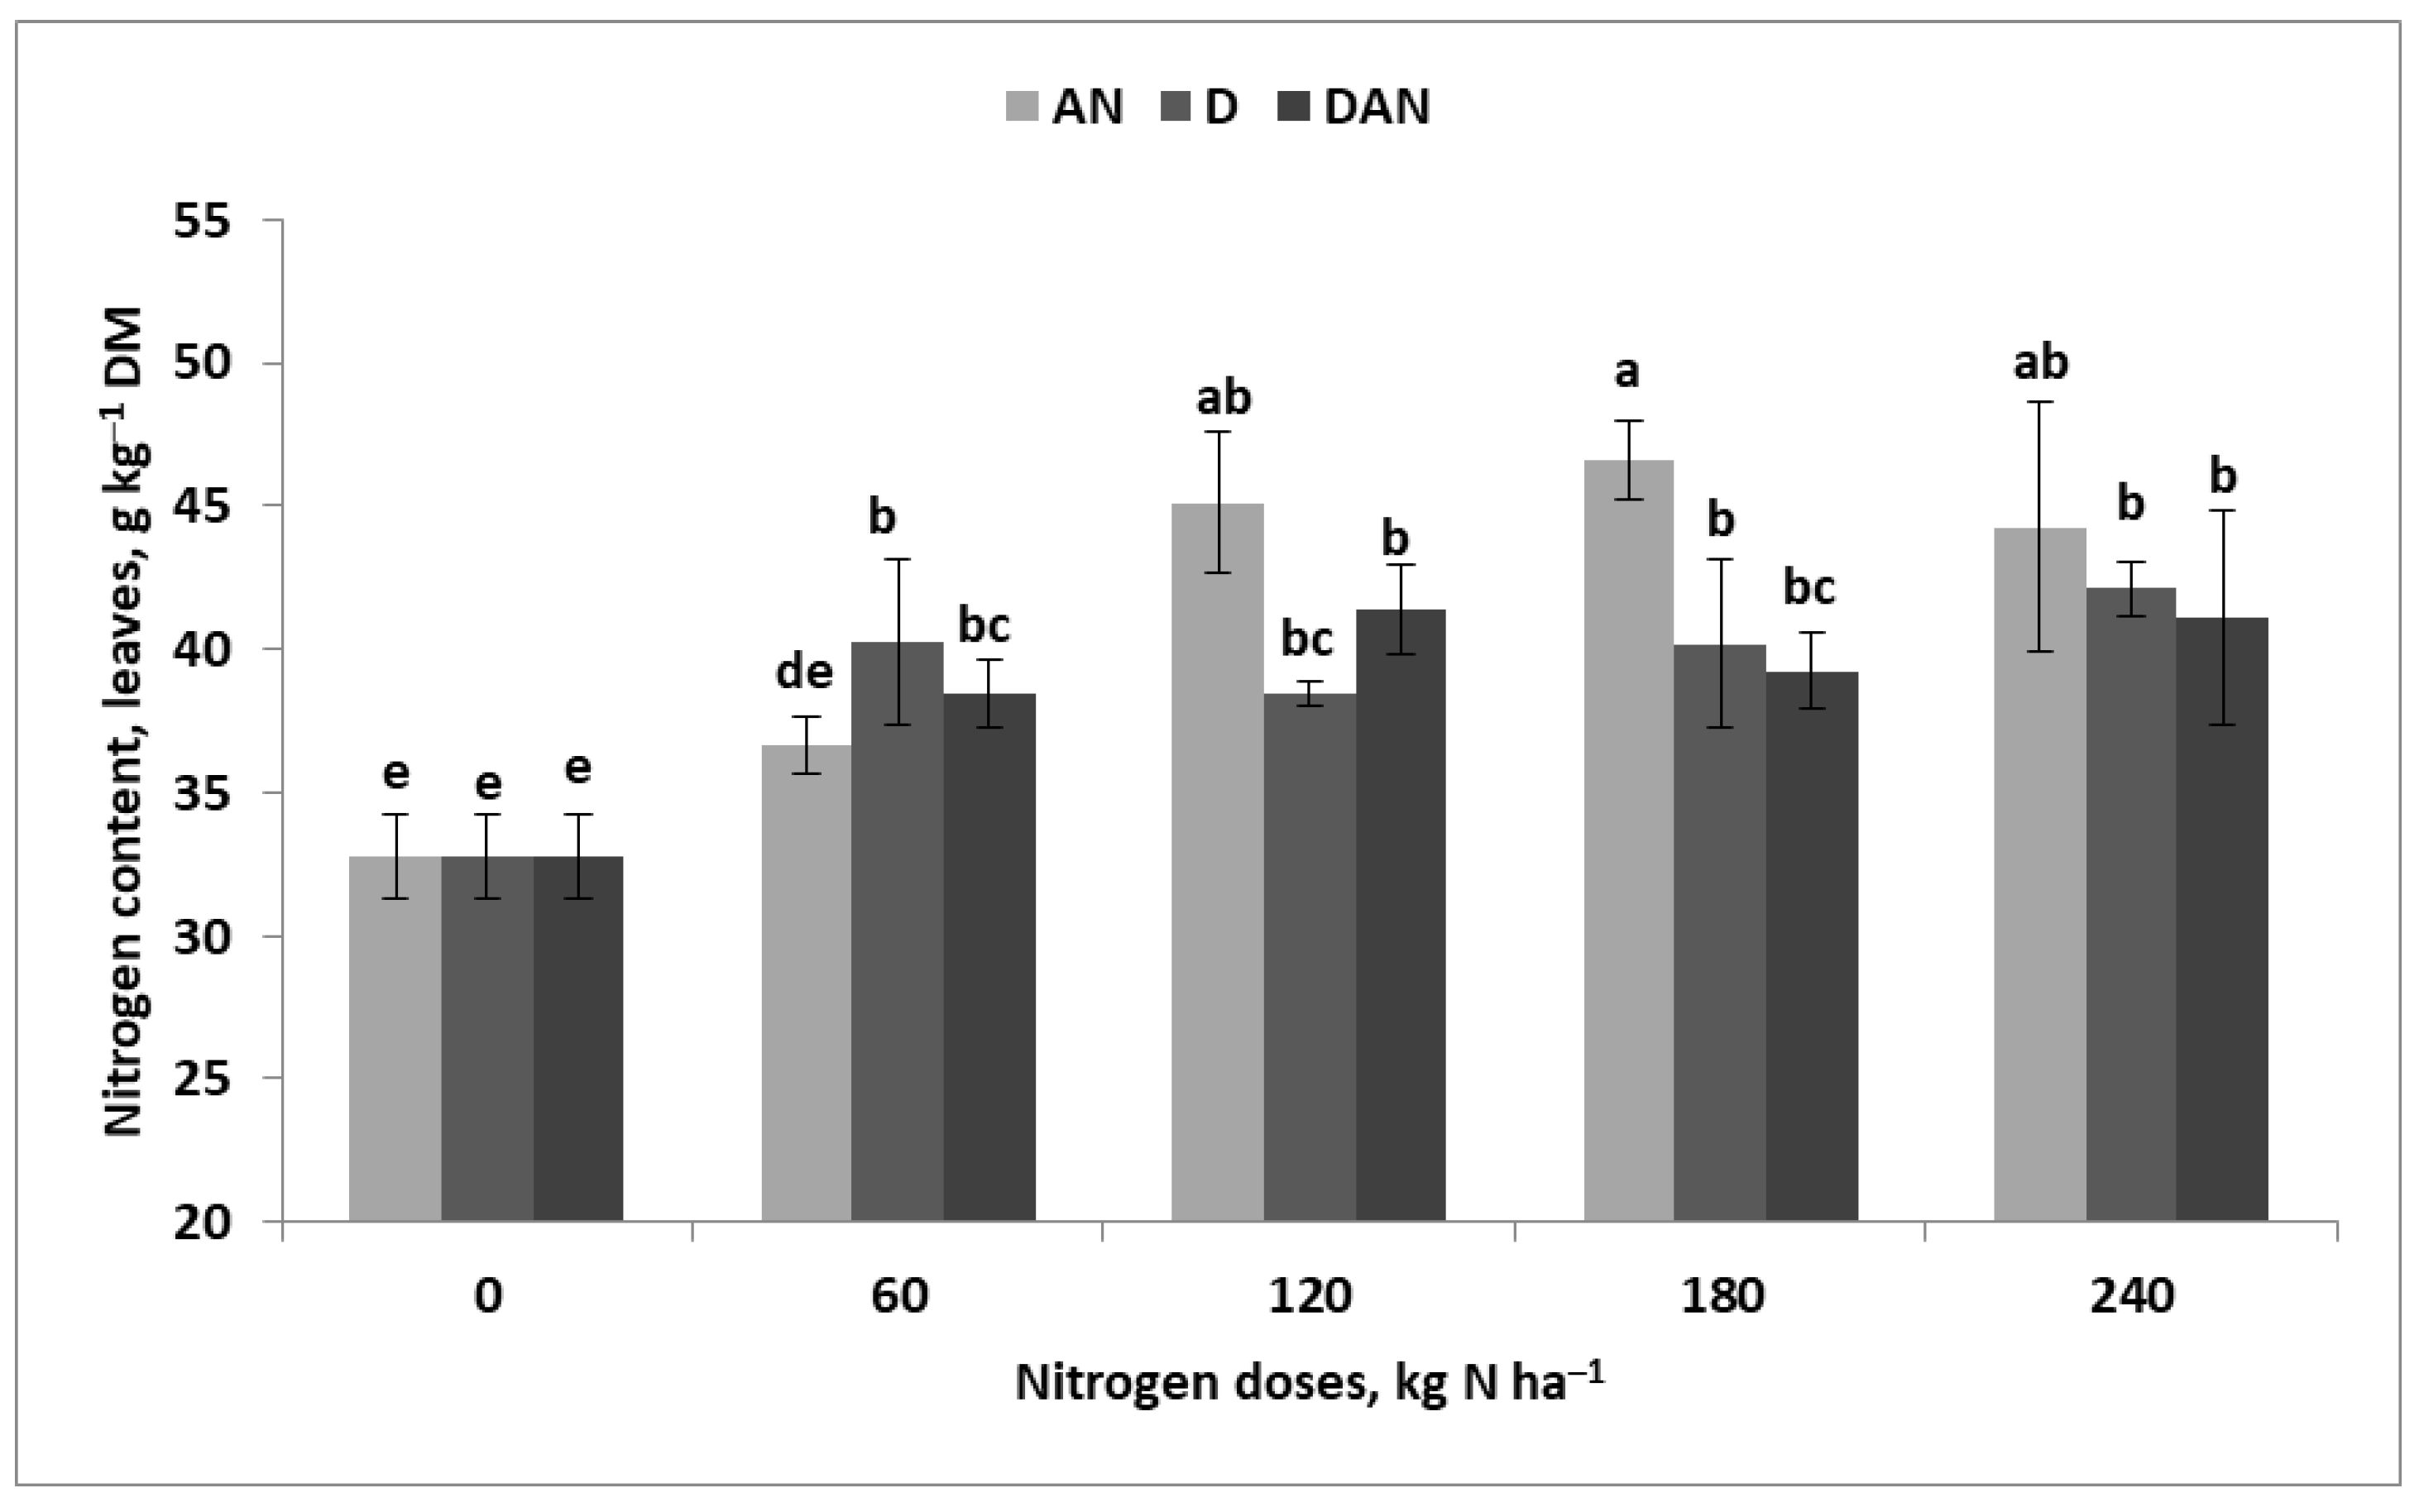
Three of the five nutrients that affected SY were increased in the leaf content in the dry 2017/2018 growing season and were significantly dependent on the Y × FS × Nj interaction. At the same time, the N and Ca contents were significantly lower in plants fertilized with digestate (Table 7). For the response of N content to the FS × Nj interaction, the OM-FS showed a significant advantage over the other FSs, except for the plot fertilized with 60 kg N ha−1. These differences were most evident in plots fertilized with 120 and 180 N ha−1 (Figure 5). The developed regression models for each FS were used to determine the maximum SY (SYmax) at a well-defined Nfop (Figure S9). These cardinal values of Nmax were 45.7, 41.4, and 41.3 g N kg−1 DM for the AN-FS, D-FS, and DAN-FS, respectively. These SYs were obtained under the condition that Nfop reached 192, 223, and 179 kg N ha−1, respectively. The N content was strongly correlated with Zn and had a much weaker correlation with Ca. No significant correlation was found between K and Cu (Table A2). The contents of both of these nutrients depended on the Nf dose in the subsequent years of the field study. Moreover, both nutrients were negatively correlated with each other (Table 7; Table A2).
The analysis of the nutritional status of WOSR based on optimal ranges showed a rather variable state (Table 4). The mean N content in WOSR leaves at the beginning of flowering was 39.5 ± 5.3 g kg−1 DM. This value is within the presented ranges while showing low variability, as indicated by a CV below 15% (Table 7). Similarly, low variability was noted for P (2.7 ± 0.4 g kg−1 DM), but its content was well below the standard ranges. The obtained range for K indicates a good nutritional status for a high-yielding crop (37.3 ± 6.8 g kg−1 DM). The average ranges of Mg and Ca contents were within the norm (Table 7 and Table 4). However, according to the standard norms, Mg content in the dry 2017/2018 season was too low, while Ca was too high. In addition, the CV values, especially for Ca, were very high (> 35%). Moreover, these nutrients were negatively related to each other (Table A2). The average Fe and Mn contents were within the standard ranges. The Zn content in wet and dry years was below and above the standard norm, respectively. The average Cu content (4.4 ± 0.9 mg kg−1 DM) was within the lower range of the standard (Table 4).
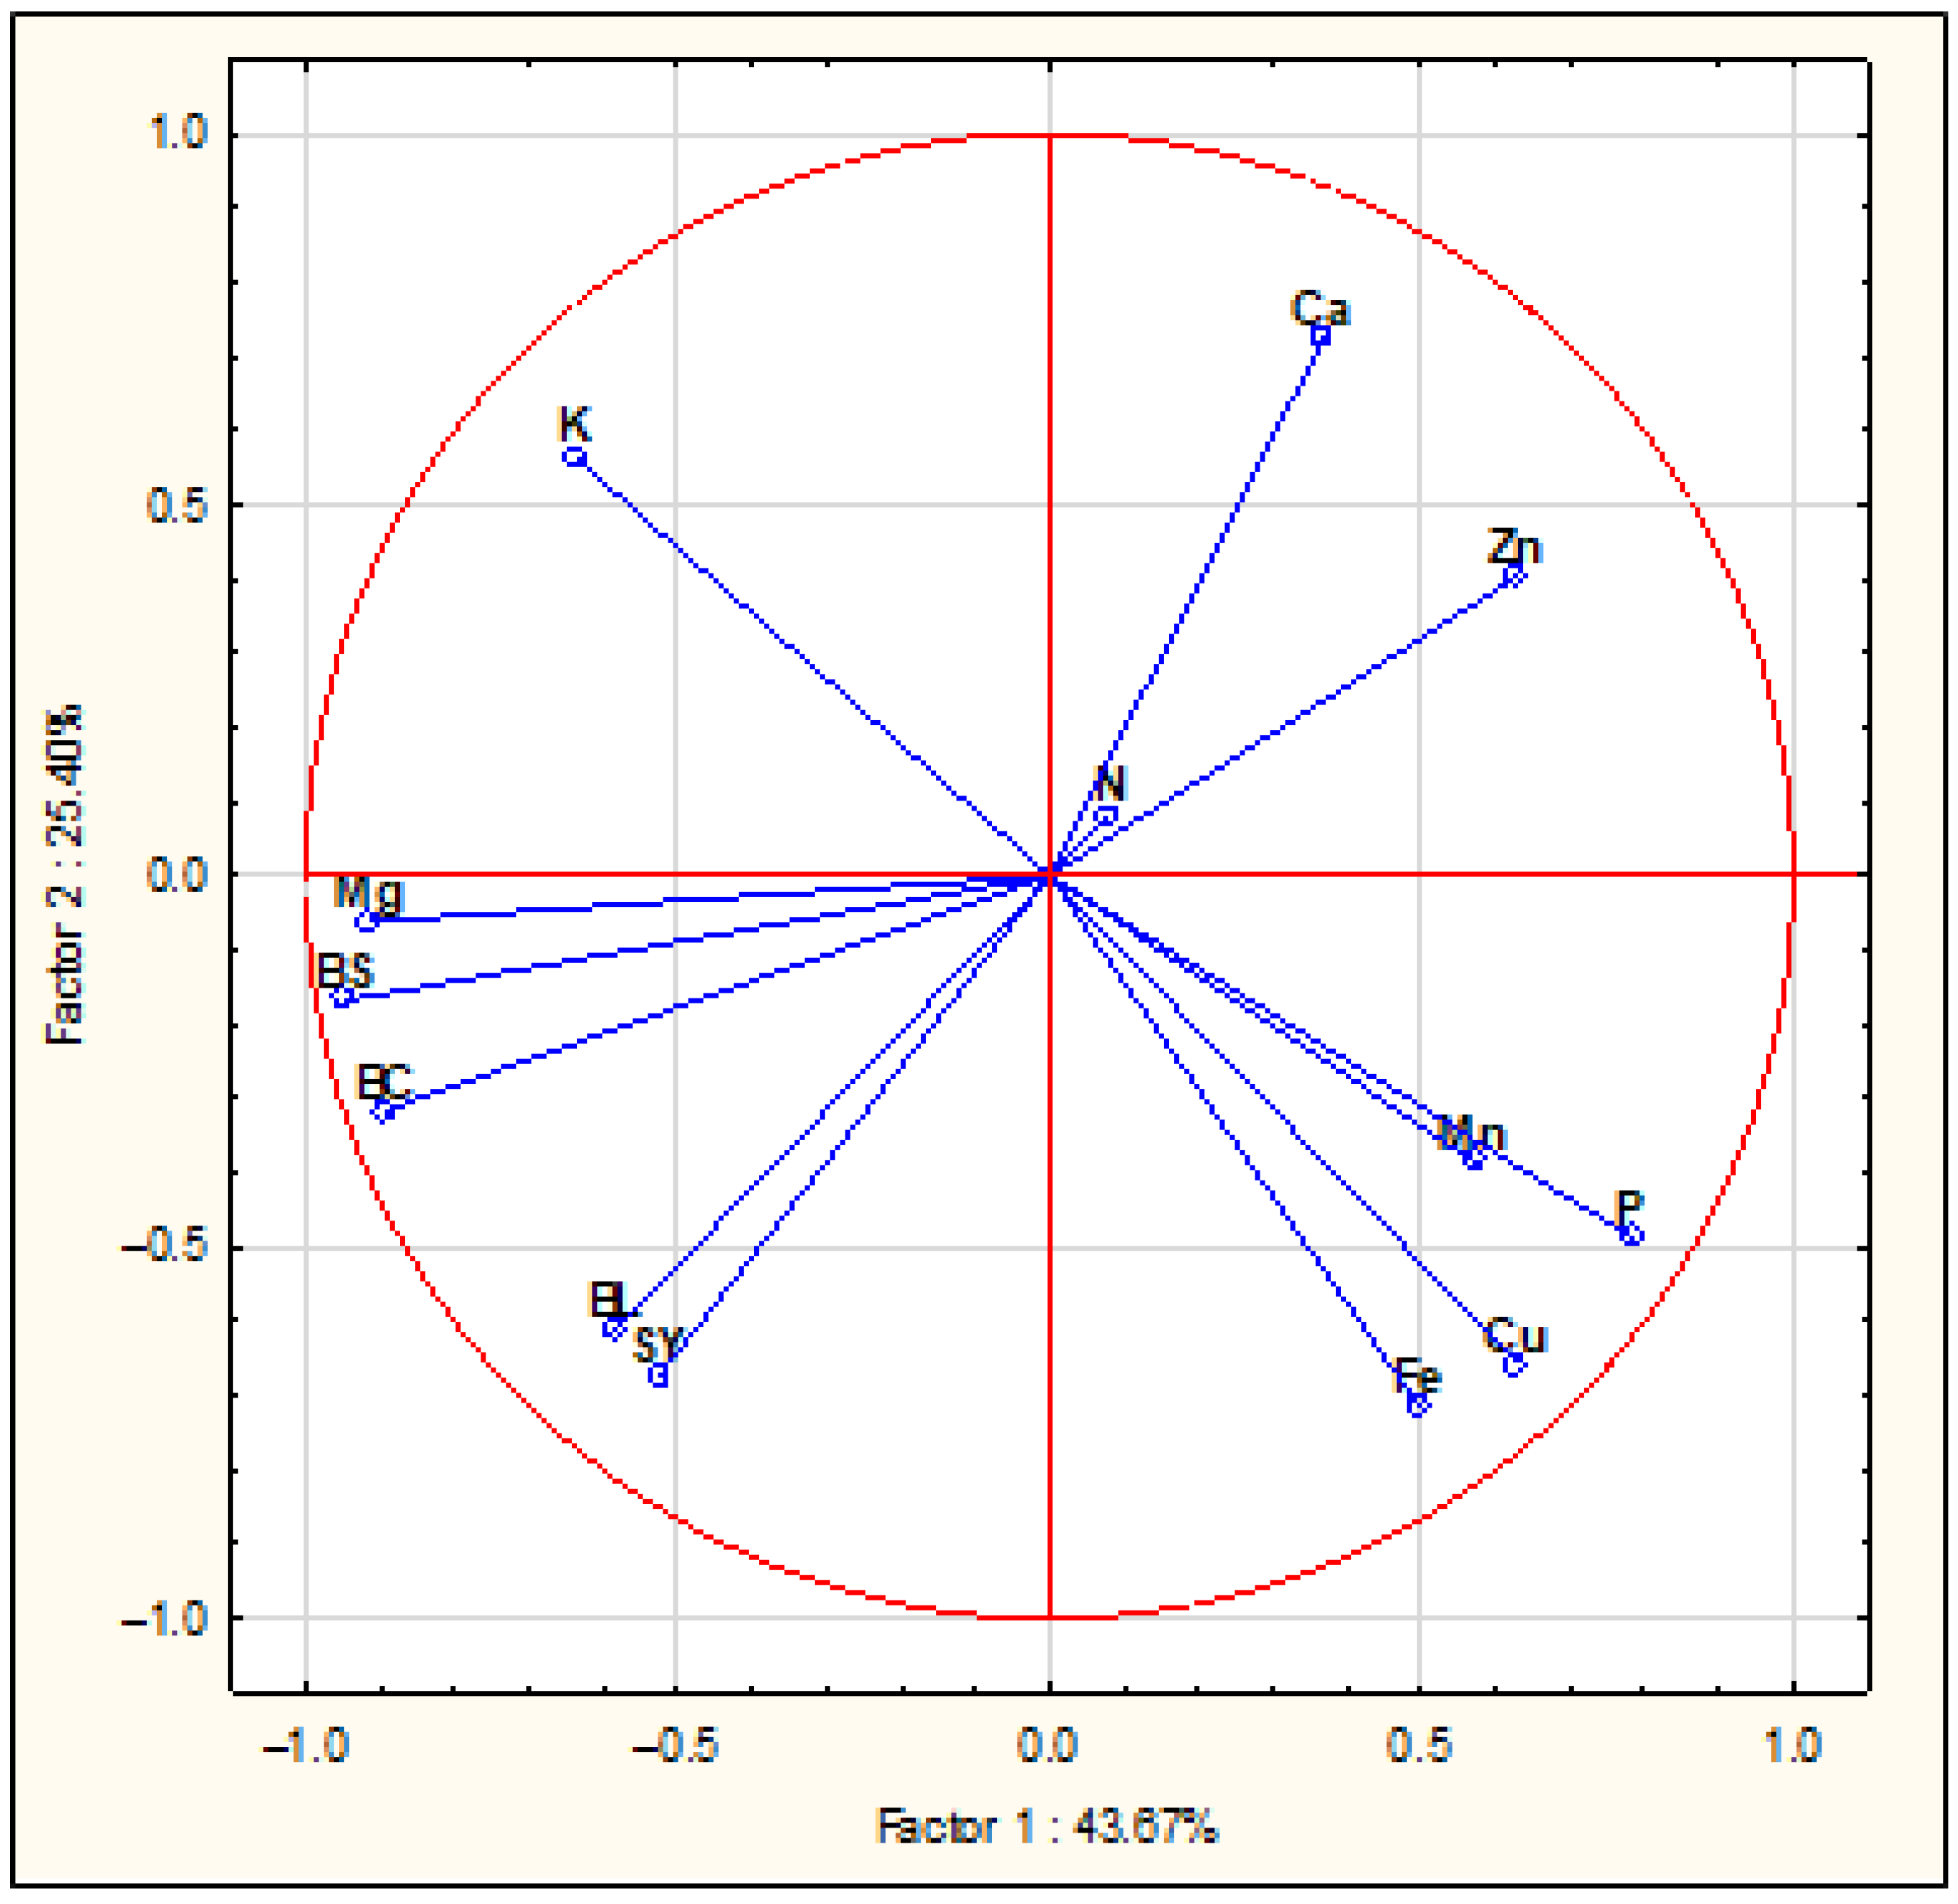
The first two principal components (PCs) with eigenvalues ≥1.0 accounted for 69.1% of the total variance in the data (Table 6). This value is at almost the same level as that recorded at the rosette stage. PC1 was significantly correlated with three of the twelve variables. The loadings were highest and negative for BS and Mg and positive for P. The required criterion for PC2 was reached only for Ca, which was positive. On PC3, only N met the required criterion and had a positive loading. The eigenvectors for the examined variables were grouped on the first two PCA axes (Figure A3). The values closest to absolute −1 on the PC1 axis were for Mg and BS, and the largest distances were found for SY, BL, and Ca, as well as between K and P. Mg and CA were in opposite quadrants.

3.4. WOSR Nutritional Status—Stems

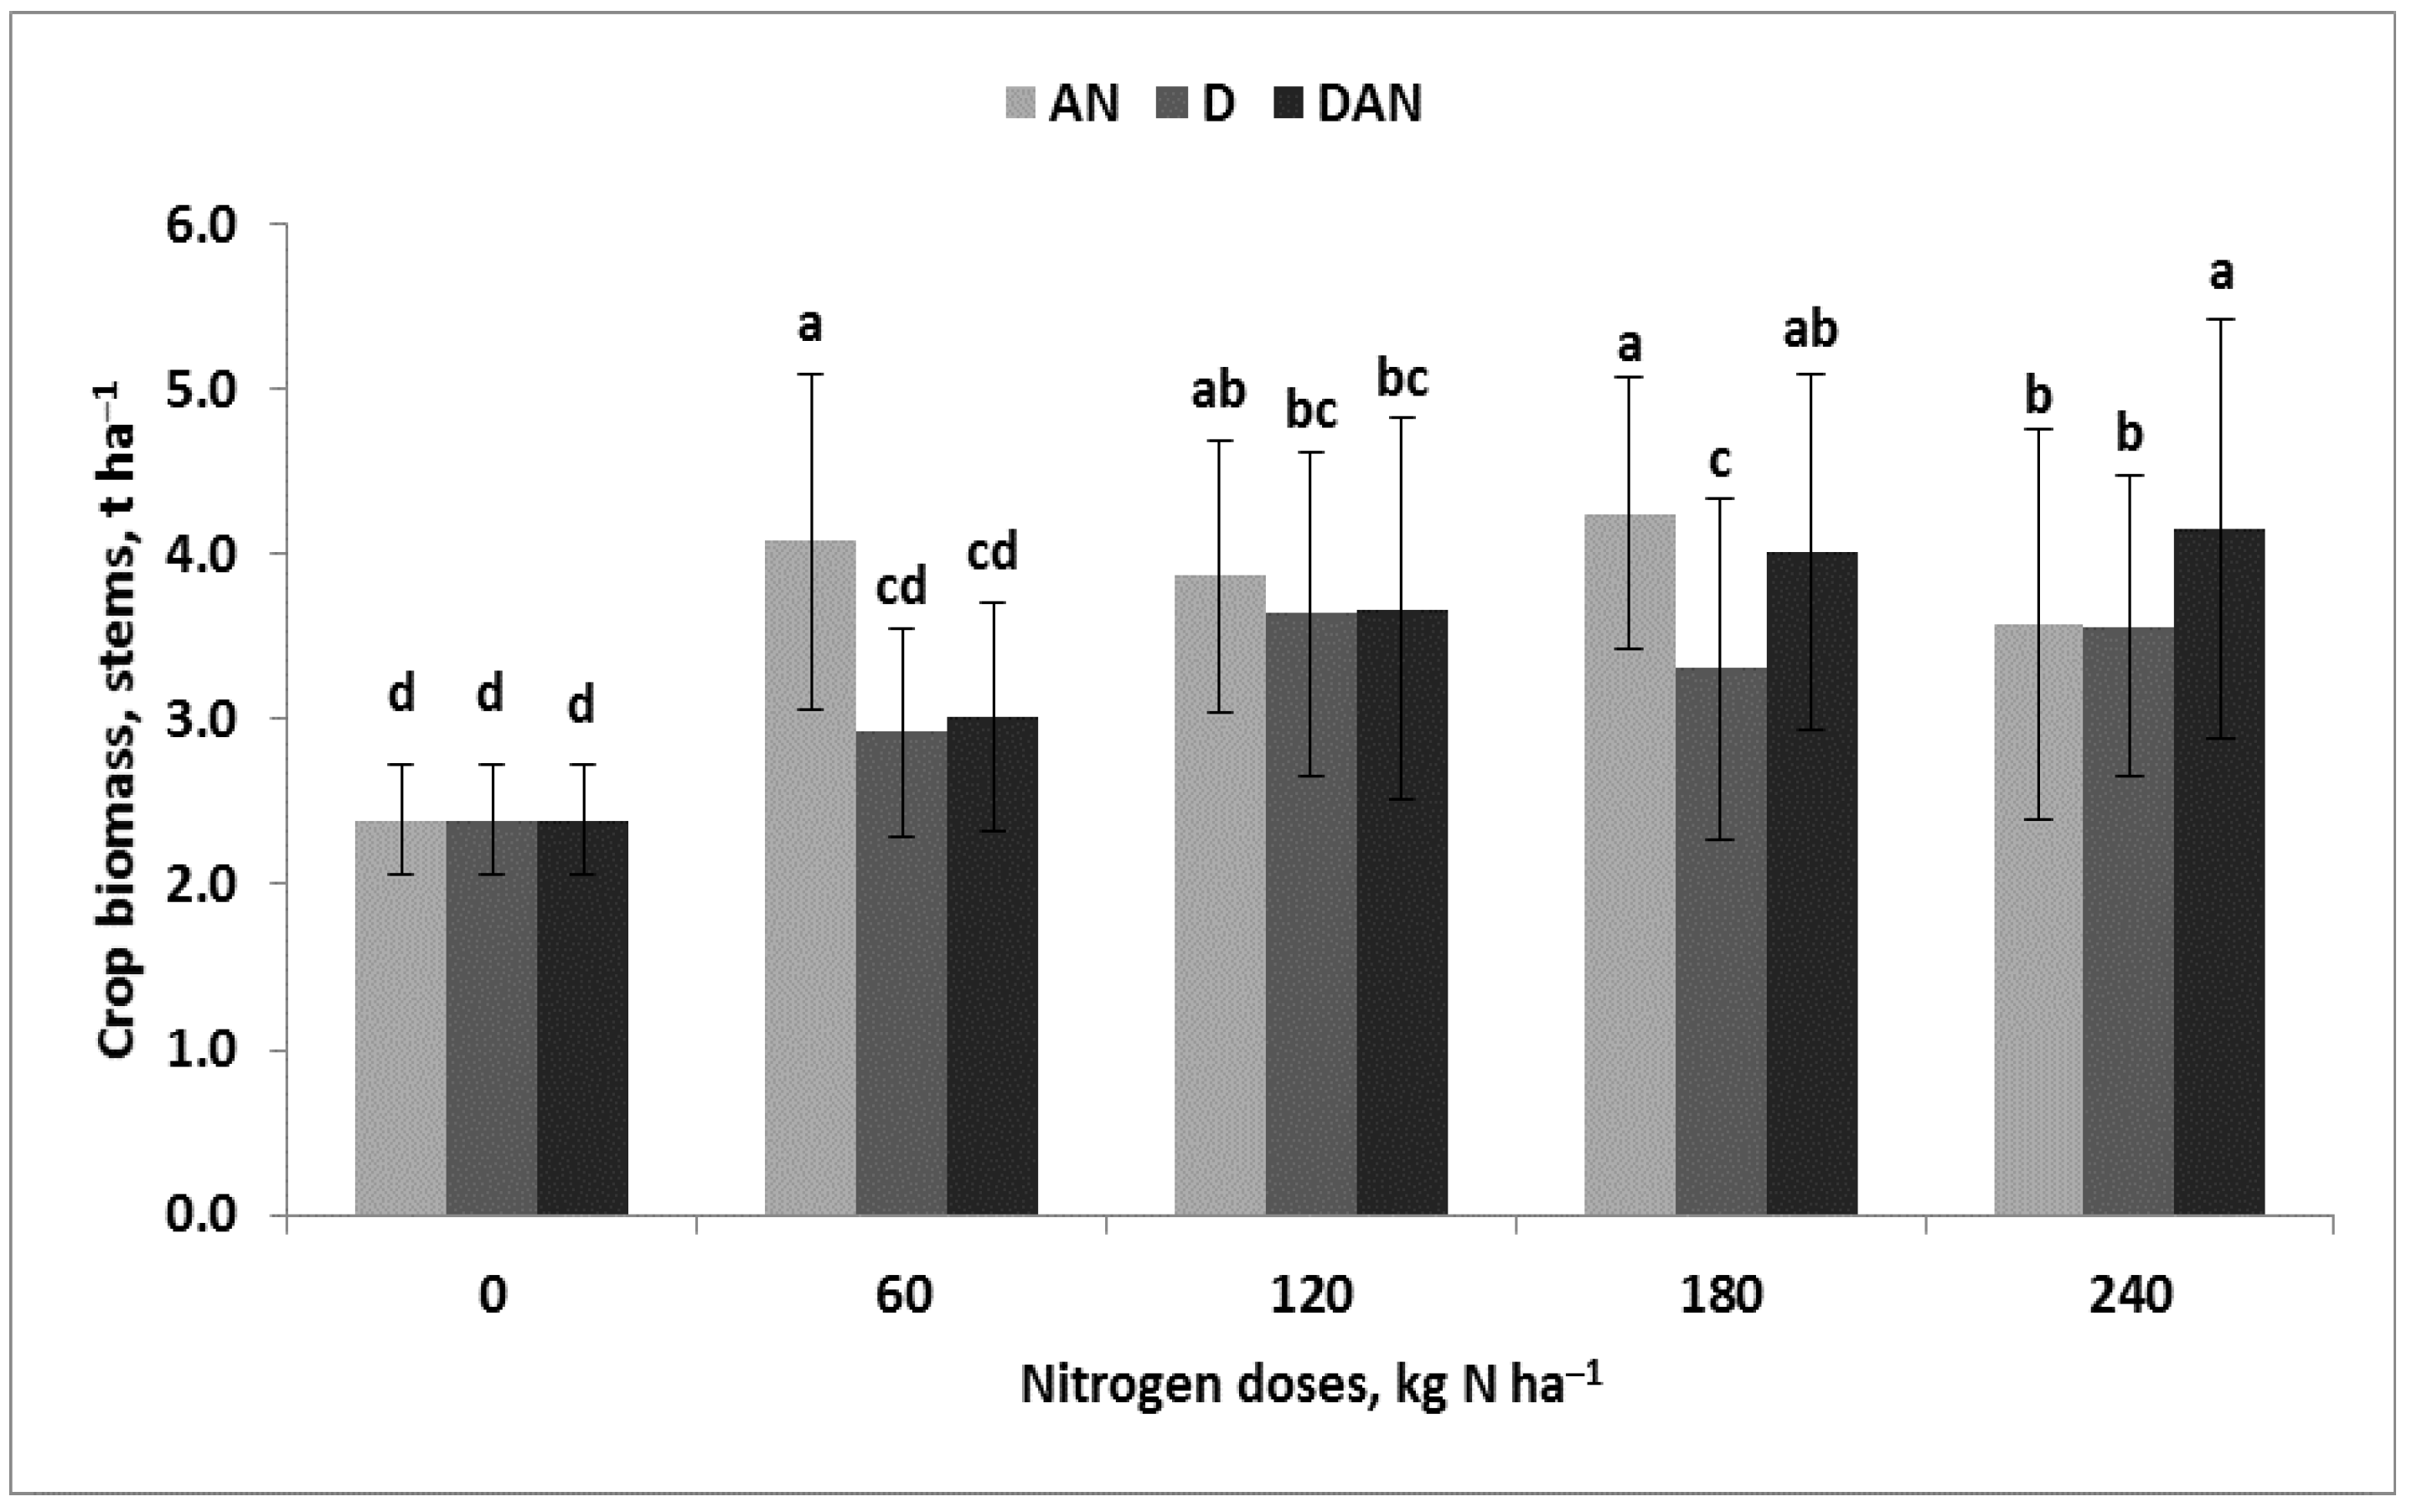
The biomass of WOSR stems was highly sensitive to the Y × FS × Nf interaction (Table 8). The key factor in the observed variability was weather. In the wet growing season of 2016/2017, the stem biomass was twice as high as that in the dry season of 2017/2018 (208%). The effect of the experimental factors was less pronounced but significant (Figure 6). The highest stem biomass was produced by plants in the AN-FS treatment. The obtained curve is consistent with the quadratic regression model, reaching a maximum of 4.3 t ha−1, provided that Nfop was 146 kg N ha−1 (Figure S10). Plants fertilized only with digestate produced significantly lower biomass, and the trend was in line with the quadratic regression model. The cardinal values were 3.6 t ha−1 and 191 kg N ha−1. In the case of the DAN-FS, this trend was consistent with the linear regression model. Stem biomass was predicted using stepwise regression analysis based on leaf and stem nutrient contents. The resulting equations are as follows:
Leaves :   B S = 4.7 + 0.2 K 0.07 Z n + 0.18 C u   f o r   n = 45 , R 2 = 0.76 ,   p   0.001
Stems :   B S = 1.3 + 0.19 K 0.1 Z n   f o r   n = 45 , R 2 = 0.69 ,   p   0.001
It should be clearly emphasized that, regardless of the plant part, the key indicators were the contents of K and Zn. In the leaves, the nutrients were not correlated with each other. In the stems, however, a positive correlation was revealed. Moreover, in the leaves, K was strongly and negatively correlated with Cu (Table A2).
The weather in subsequent growing seasons was a key factor affecting the nutrient content in WOSR stems (Table 8). An FS effect was revealed only for P, Mg, and Ca, while the effect of increasing Nf doses was observed for all tested nutrients except P and Mg. Five of the nine examined nutrients showed a significant response to the Y × FS × Nf interaction. The key indicators of the stem biomass were K and Zn, as shown in equation 8. K content varied with the weather and Nf rate. Zn variability was driven by the FS × Nf interaction and the year, and the trend in Zn content in the stems in response to increasing Nf doses differed among the tested FSs (Figure 7). For the AN-FS, Zn followed a quadratic regression model. Znmax was 38.3 mg kg−1 DM and was obtained for Nfop equal to 143 kg N ha−1 (Figure S11). In fact, the significant dominance of the AN-FS over the other FSs was observed only for plants fertilized with 120 kg N ha−1. The trend in Zn content in plants fertilized with digestate was different, consistent with the linear regression model. It was slightly steeper in the case of the DAN-FS (Figure S11).
The key nutrients determining SY were N and Ca, as shown by stepwise regression analysis. The developed model is as follows:
S Y = 1.07 + 0.11 N 0.07 C a   f o r   n = 45 , R 2 = 0.048 ,   p   0.001
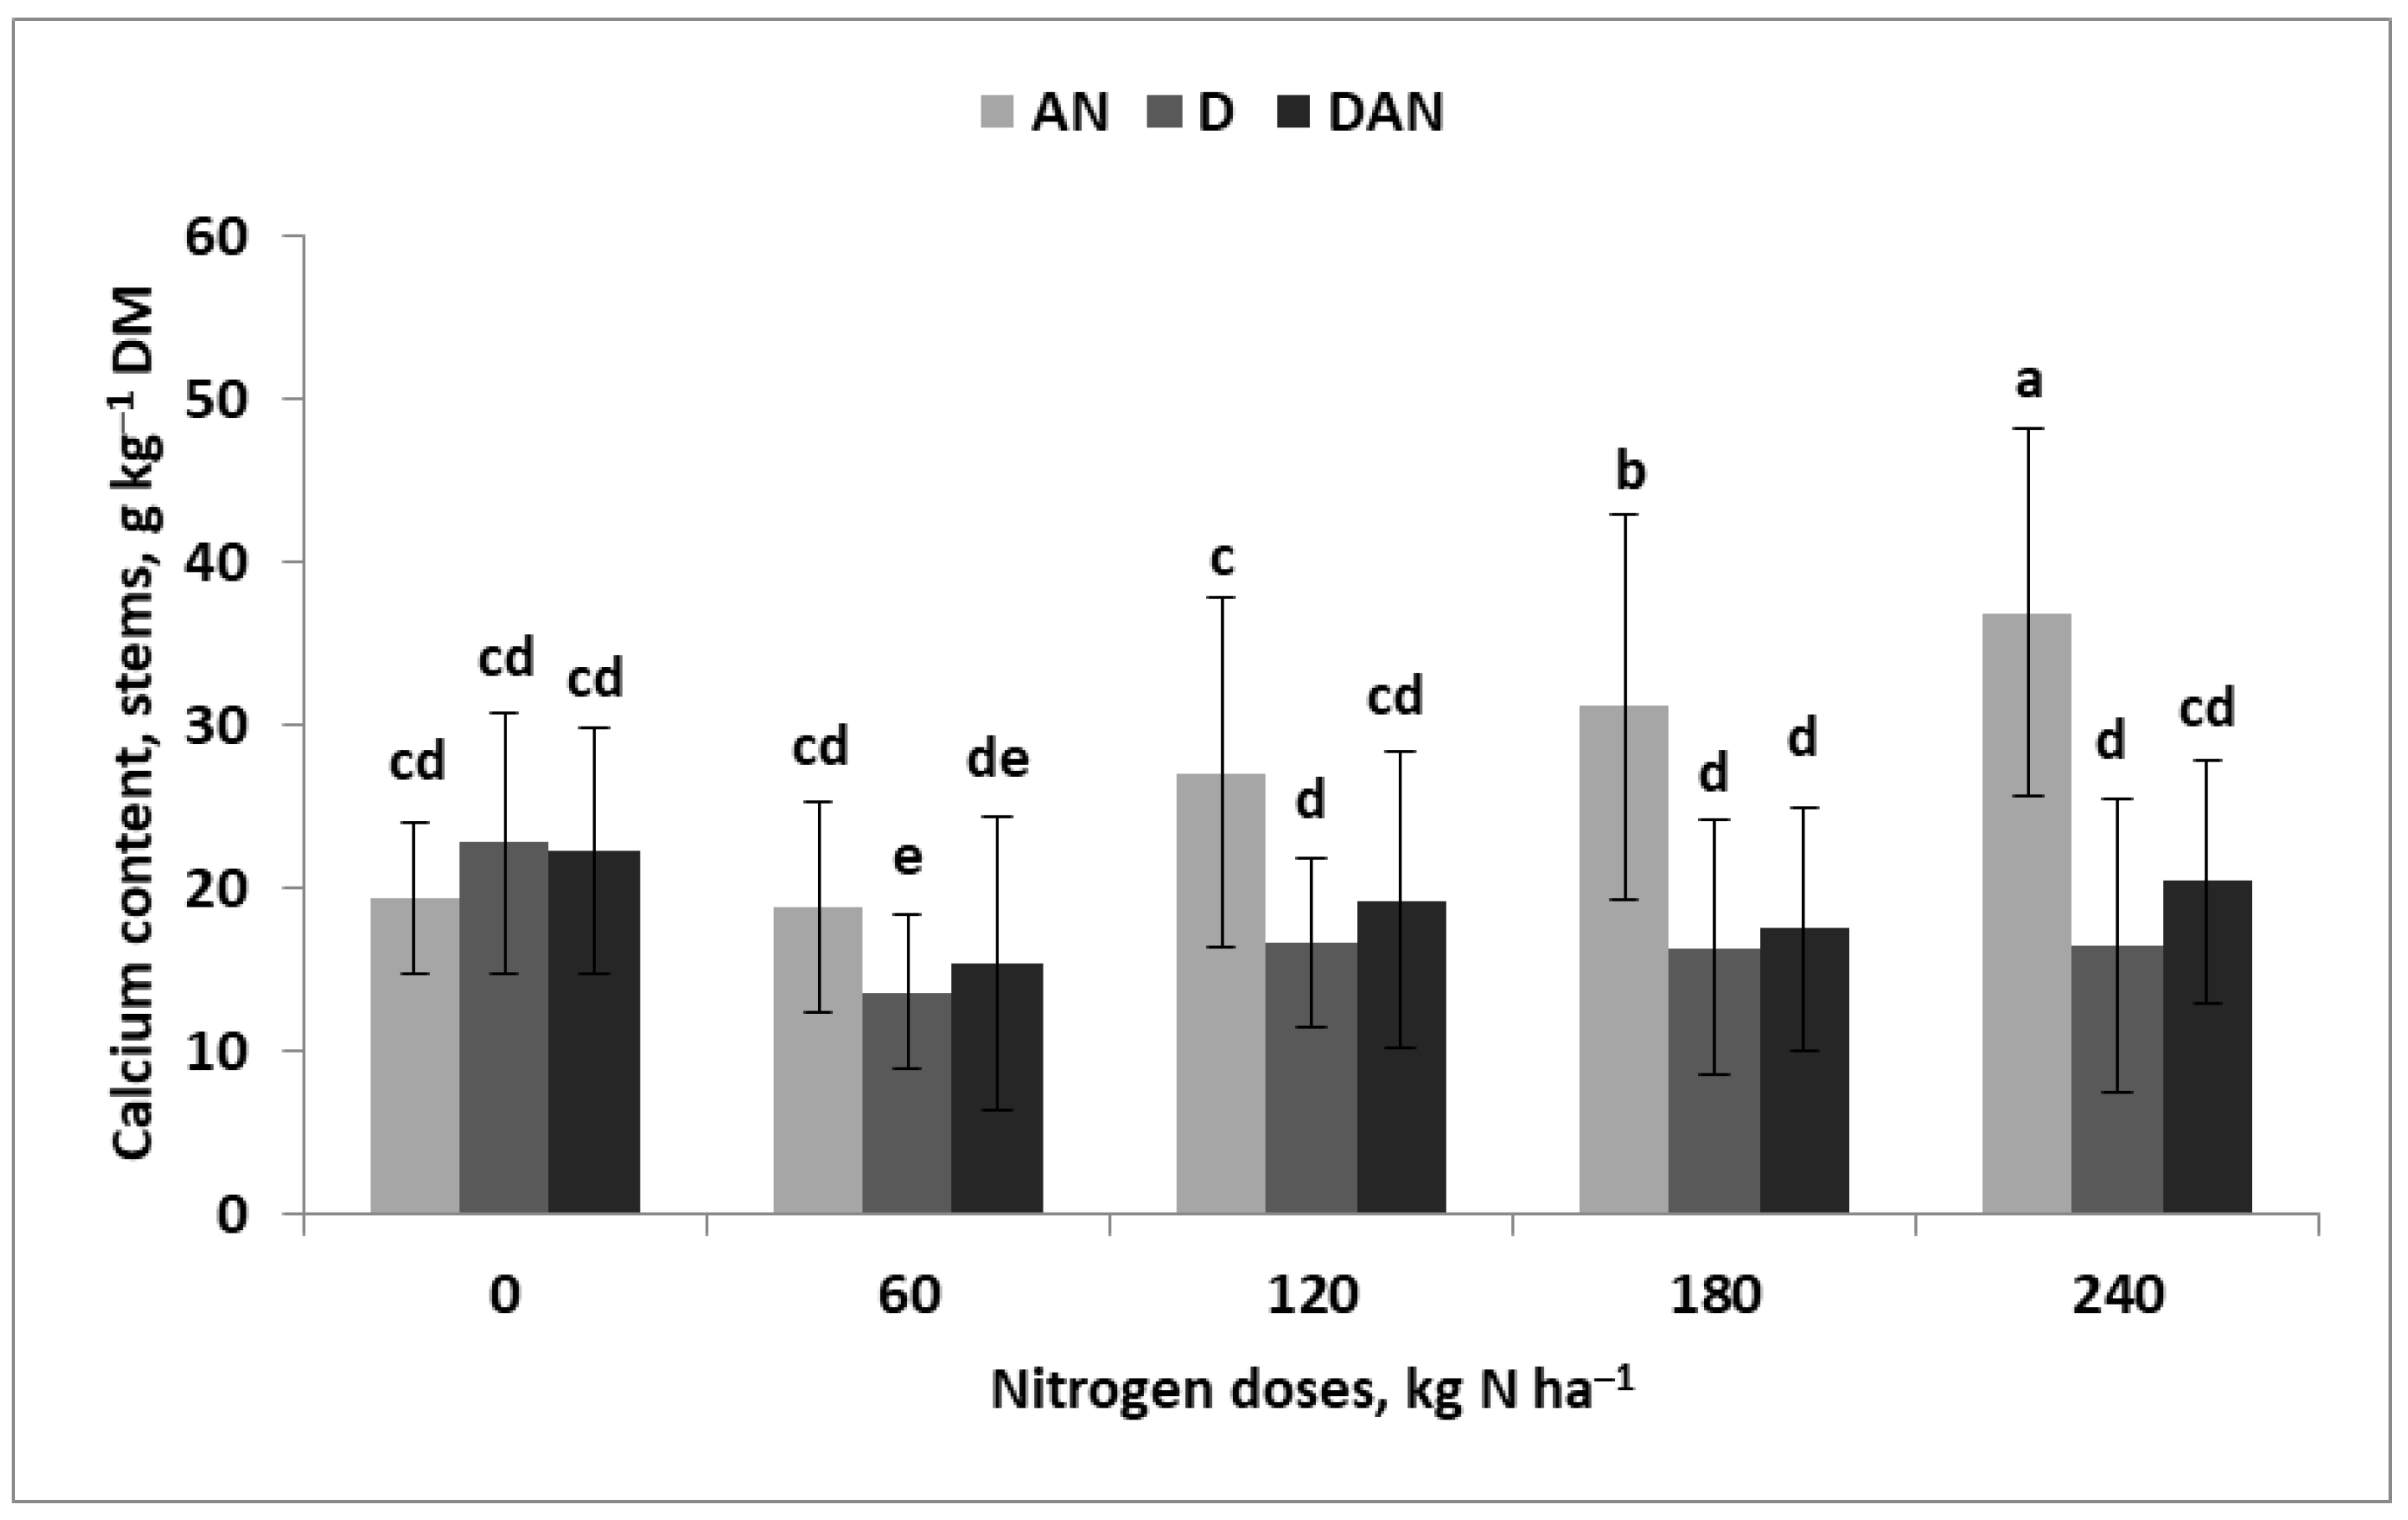
The N content significantly depended on the FS × Nf interaction (Table 8). Despite the gradual increase in the N content in WOSR stems, the effect of the FS varied with gradually increasing N doses (Figure A4). Regardless of the FS, the Nmax value ranged from 20.0 to 30.9 g kg−1 DM and was achieved for Nfop in the range from 209 to 217 kg N ha−1 (Figure S12). Ca content showed a response to the Y × FS × Nf interaction (Table 8). Almost three times higher content of this nutrient was recorded in the dry season of 2017/2018. Despite this, the effect of the applied digestate was visible (Figure 8). The superiority of the AN-FS over the other FSs was significant and gradually increased, in accordance with the linear regression model, with the Nf dose (Figure S13). A small, non-significant downward trend was observed for treatments with digestate.
So far, no standards have been developed to describe the optimal ranges of the contents of nutrients in WOSR shoots in the pre-flowering period. Data published by Grzebisz et al. [35] were used to evaluate the obtained results. The average ranges of N, P, K, Mg, and Cu are consistent with the ranges considered as a standard for the given nutrients. The most stable content was that of K (CV <15%), and slightly greater variability was found for the remaining nutrients (around or below 20%). The average Ca content and range were significantly higher than the reference values, but in wet years, they were within the reference range. The same was true for Fe and especially for Mn, mainly due to their unusually high values in the wet 2016/2017. The average Zn content was above the reference value but within the range in the wet 2016/2017 growing season. The entire set of these nutrients was characterized by an unusually high variability (CV > 60%).
Principal component analysis (PCA) clearly revealed the distinct impacts of particular nutrients on the strength of relationships between the nutrient content in stems and SY. The first three principal components (PCs) accounted for 81.74% of the total variance in the data (Table 6). However, only variables with scores on PCs over 0.70 (R2 > 0.50) were taken into consideration. PC1 and PC2 contributed 52.16% and 19.94% of the total variance, respectively (Figure A5). Overall, six of the twelve variables had loadings on PC1, meeting the chosen criteria. The highest loadings, based on absolute values in descending order, were for Mg ≥ Mn ≥ P ≥ Fe = BS > Zn (Table 6). The required criterion for PC2 was met for K > N > Ca but was negative. PC3 included only one variable, i.e., SY, with a positive loading. The studied variable weight was evaluated using the eigenvector, which varies between −1 and +1. The eigenvectors for the examined variables were broadly scattered on the first two PC axes. The closest to the absolute value of −1 were BS and Mg (Figure A5). At the same time, Mg had the biggest distance to Zn and Cu. The shortest distances were recorded for two pairs of examined traits: N and Ca and BS and Mg. Mg and CA were in other quadrants.

4. Discussion

Three criteria were used to conduct a multi-level evaluation of the effect of digestate-derived N on the nutritional status of winter oilseed rape plants in the cardinal stages of seed yield formation:
(1)
Formal, based on a statistical comparison of three fertilization systems (FSs), differing in the N carrier;
(2)
Formal, based on existing ranges of nutrient contents in indicator parts/organs of the tested crop;
(3)
Forecast of the crop biomass and seed yield based on nutrient content in respective parts/organs of the tested crop before flowering.

4.1. Seed Yield of Winter Oilseed Rape

The seed yield of WOSR is the first or, rather, key criterion for evaluating the impact of a given N carrier on plant growth and yield formation [50,51]. The obtained SYs were sufficiently high considering the natural fertility of soils in Poland [52,53]. The marked increase in SY in response to the N rate of 60 kg N ha−1 as compared to the absolute N control, independent of the Nf carrier, is typical for soils poor in inorganic N [54]. The highest yield (SYmax), 3.61 t ha−1, was recorded in the DAN-FS. In this system, 2/3 of the corresponding Nf was applied as digestate and 1/3 as ammonium nitrate. This yield was guaranteed with a Nf dose of 188 kg N ha−1. In this system, 1 kg of applied Nf produced 19.3 kg seeds kg−1 Nf. The SYmax in the D-FS was lower, amounting to 3.29 t ha−1, and rose to a Nfop of 184 kg N ha−1. The productivity of 1 kg of applied Nf was 17.9 kg seeds kg−1 Nf. The lowest yield was recorded in the AN-FS and amounted to 3.05 t ha−1, which is 15% and 7% lower than those in the DAN-FS and D-FS, respectively. At the same time, only 160 kg N ha−1 was needed to obtain this yield because its unit productivity was 19.1 kg seeds kg−1 Nf. This value is high and obtained at a relatively low Nf dose [55]. However, the unit productivity of N from the digestate confirms its high fertilizing value [56]. The nitrogen fertilizer replacement value (NFRV) in the digestate, averaged over N doses, was 104%. In the DAN system, this index increased to 111%. Therefore, it can be stated that the structure of the N carriers in the DAN-FS resulted in a significant increase in N productivity, which exceeded the level reached when using ammonium nitrate. The mass of inorganic N (N-NO3) in the soil profile down to a depth of 0.9 m in the DAN-FS was significantly smaller than in AN-FS [28]. Therefore, the higher efficiency of digestate-derived N must have resulted from the masses of nutrients other than N, P, and K, which were incorporated into the soil with the digestate. This group includes Mg, S, micronutrients, and some specific compounds present in the digestate [18,56].

4.2. WOSR Nutritional Status—Rosette Stage

The rosette stage of WOSR is the beginning of the most intensive growth in plant biomass [46]. The mass of inorganic N present in the soil during this period determines the dynamics of the formation of yield components [34,57,58]. The contents of key nutrients in WOSR leaves at the rosette stage, such as N, P, and K, did not show significant variation in response to the interaction between experimental factors in subsequent years of the study. The specific effect of the DAN-FS on the contents of the examined nutrients was greatest in the rosette stage. In fact, it resulted from the effect of the digestate. Plants fertilized with the digestate contained significantly less Ca, Mn, Zn, and Cu compared to those fertilized with ammonium nitrate. Despite that, the contents of these elements were not critical for yield. However, the obtained ranges guaranteed only a moderate yield level. In Poland, such yields are typical for light soils [54,59]. The N content in rosette leaves was within the very narrow range of 41–47 g kg−1 DM (CV < 7%), which indicates the very stable influence of the experimental factors on N management in the rapeseed canopy in subsequent years of the study. This is an indirect but clear indication that the nutritional status of WOSR plants at the BBCH 30 stage is consistent with the inorganic N supply from the soil [34]. The key nutrients conditioning SY turned out to be Mg, Ca, and Fe. The ranges obtained for these nutrients also refer to the moderate yield level [43,44]. The basis of their impact on SY was not the Nf source; the use of digestate-derived N caused a significant decrease in the contents of Ca and Mg compared to their status in plants fertilized with ammonium nitrate. The key factor was their year-to-year variability. An increase in the Ca content caused a decrease in the Mg content. The soil’s content of available Mg was optimal, i.e., the highest, considering the entire analyzed soil layer. Therefore, the only factor conditioning its uptake was weather conditions. The Ca content in WOSR leaves was lower in the wet seasons and higher in the dry seasons and vice versa. This type of relationship between these two nutrients is well recognized in cereals [60,61]. However, it should be emphasized that an increase in the N dose in the form of digestate led to a progressive decrease in the Ca content in the leaves. This phenomenon can only be explained by the competition between Ca2+ and the NH4+ cations introduced into the soil with the digestate [62]. Despite the above explanation, leaf Mg content should be considered a key predictor of both rosette biomass and SY (Figure 9). These two WOSR traits reached maximum values provided that the Mg content was at least 2.0 g kg−1 DM. In Poland, this level of Mg ensures yields of WOSR at the moderate level of 3.5–4.0 t ha−1 [63]. The observed limiting effect of Fe content on SY was directly due to its significantly lower content in WOSR leaves in the 2016/2017 growing season. The reason was not the content of available Fe in the soil because it was in the average range in all studied years; the only explanation for this relationship is the dilution effect because the rosette biomass in this particular season was significantly higher compared to other seasons.

4.3. The Beginning of Flowering—Leaves as Diagnostic Plant Parts

The critical period, responsible for the formation of the primary components of the WOSR yield, ends at the border growth stage, i.e., between the emergence of inflorescence formation (INFE) and the beginning of flowering [31,32]. In these two phases, any disturbance in plant growth, either abiotic or nutritional, leads to a reduction in yield [59,63]. The mass of vegetative organs in this period of WOSR canopy growth plays an important role in the formation of yield, which was clearly confirmed in this study. The key limiting nutrient was N. The diagnostic organ for forecasting SY turned out to be the mass of the leaves, explaining 54% of the variability in the biomass of leaves (BL). However, the relationship between the N content and the biomass of leaves was, in fact, not linear but quadratic:
B L = 0.49 N 2 + 3.03 N 0.87   f o r   n = 45 , R 2 = 0.59 , p 0.001
The trend of the curve obtained indicates an exponential slowdown in leaf mass growth in response to the N content in leaves. The critical N content for BLmax was 30.9 g N kg−1 DM, and the optimal N content was in the range of 34–44 g kg−1 DM. The biomass of both leaves and stems and, ultimately, the seed yield significantly depended on the Mg content in leaves. The critical Mg content was in the range of 1.6–2.8 g kg−1 DM. The key role of Mg was confirmed by PCA and the diagram presented below (Figure 10).
The critical role of Mg in the process of yield component formation by WOSR in Polish soil conditions is well recognized [63,64]. In both wet growing seasons, despite the high content of soil-available Mg, its content was deficient in the leaves. However, attention should be paid to the mutual relationship between Mg and Ca. The Ca content in the leaves was in the range of 13–30 g kg−1 DM and, in wet seasons, was close to the lower end of the range. An increase in the content of Ca in crop plant organs in proximity to reproductive organs generally leads to a decrease in Mg content [60,61]. The observed antagonism is illustrated by PCA analysis, as Ca and Mg were usually located in different quadrants. This phenomenon occurred drastically in the dry 2017/2018 growing season. It is, however, necessary to emphasize that the digestate reduced the content of both nutrients compared to ammonia nitrate-fertilized plants. This process was stronger for Ca. In the dry 2017/2018 growing season, the N content was significantly higher than that in either of the wet years. The same trend occurred for Ca and Zn. Therefore, it can be concluded that supplying WOSR plants with N at the beginning of flowering was not a critical factor for the yield. Therefore, it is worth paying attention to the trends in nutrient content changes in the period from the rosette stage to the beginning of flowering. The set of nutrients conditioning SY excluded Mg but included Ca, as well as N and Zn. The decrease in N content in rapeseed leaves during this period is a natural phenomenon [35,63]. The obtained results indicate that the observed changes were caused by the absolute increase in Ca content, which led to an accelerated decrease in N and Zn contents. The decrease in the Zn content was greater than that in N (Figure A6). The conducted experiments clearly show that the greater the decrease in N and Zn contents in WOSR leaves during this vegetation period, the greater the reduction in SY. At the same time, the greater the increase in Ca, the greater the decrease in yield. It can be concluded that the dynamics of these three elements in WOSR leaves during the critical period of yield formation were crucial for seed yield formation.

4.4. The Beginning of Flowering—Stems as Diagnostic Plant Parts

During the vegetative development period of seed plants, the stem is not usually treated as an indicator organ—diagnostic of the nutritional status—although there are exceptions [37,61]. The stems were included in the evaluation of the nutritional status of WOSR because flowering begins with the main shoot, while the side shoots are still in the process of gaining mass and forming flower buds [31].
The stem biomass of plants fertilized with digestate was slightly but significantly lower compared to those fertilized only with ammonium nitrate. This difference was most visible in the plot fertilized with digestate. The nutrient content in the stems compared to the leaves of WOSR turned out to be a weaker predictor of their biomass. The most interesting result for both parts of the plants is the fact that the key nutrients were K and Zn. The first one limited stem biomass, whereas the second was in excess. However, the obtained ranges for K did not indicate its shortage in either leaves or stems at the beginning of WOSR flowering. The excess of Zn resulted from its exceptionally high content in both plant parts in the dry growing season of 2017/2018, significantly exceeding the optimal ranges, especially in stems [37,47]. The Zn content, regardless of the WOSR organ, was strongly and positively correlated with Ca but, at the same time, negatively correlated with Mg. As for leaves, the observed antagonism is illustrated by PCA analysis, as CA and Mg were usually located in different quadrants. The Mg content in stems was in the range of 1.8–2.8 g kg−1 DM, and its importance for the mass of stems was fully confirmed by PCA. Moreover, it was negatively correlated with Fe and Mn. The obtained results unequivocally confirm the negative effect of excess Ca on seed yield. The Ca content in stems was in the range of 8–34 g kg−1 DM and, in wet seasons, was close to the lower end of the range. The role of Ca in the functioning of crop plants is significant. Excess Ca in the plant, resulting from the action of environmental factors, triggers a number of plant adaptation processes to upcoming stress [65,66]. In the studied case, the negative effect of Ca on SY could have resulted from the disturbance of Mg content. Mg deficiencies in the period between inflorescences are well recognized in other crops [67,68]. A practical solution is the foliar application of Mg, preferably with microelements, among which Fe is key [64].

5. Conclusions

The conducted field tests clearly showed that N present in the digestate can replace, to a large extent, mineral N (ammonium nitrate) as a carrier of N in the production of winter oilseed rape. The seed yield of WOSR in the tested nitrogen fertilization systems increased in the following order: mineral N ≤ digestate N < mixed N carriers (2/3 digestate N and 1/3 mineral N). The unit productivity of applied N in the OM-FS was at the same level as in the M-FS, but the seed yield was significantly higher. The nitrogen fertilizer replacement value (NFRV), averaged over N doses, was 104% for the digestate FS and 111% for the mixed FS. The N, P, and K contents in plants fertilized with the digestate were within standard ranges at critical stages of yield formation. These conditions indicate the optimal time for applying the digestate to WOSR and its appropriate proportion with ammonium nitrate. The only limitation is the N dose, which is determined by EU regulations, which limit the N dose to 170 kg ha−1. A significant response to the N carrier was observed for Mg and Ca and some microelements, with the strength of the crop response depending on the growth phase of WOSR. The key indicator nutrient for the biomass of WOSR organs in the studied growth stages, as well as seed yield, was Ca. Its negative effect on the nutritional status of plants was already evident at the rosette stage and lasted until the beginning of flowering. The increase in Ca content in the plant was revealed directly through the disturbance of N and Zn contents and indirectly through a decrease in Mg content. A significant Ca-controlling effect of Mg was observed only when its content exceeded 2.0 g kg−1 DM. Therefore, the best growth stage for effectively predicting the seed yield is the rosette stage. Leaf analysis at the onset of flowering of WOSR is better for indicating the ranges of critical nutrients, which have been reported. However, in the practice of WOSR production, plant testing at this stage is only useful for predicting the seed yield. Digestate can be used in winter oilseed rape in accordance with the principles of precision farming, for example, as established for the Urea–Ammonium Nitrate solution.

Supplementary Materials

The following supporting information can be downloaded at: https://www.mdpi.com/article/10.3390/agronomy15051241/s1, Figure S1: Regression of seed yield of winter oilseed rape against nitrogen doses on the background of nitrogen and fertilizing systems; Figure S2: The effect of the interaction of fertilizing system (FS) and increasing nitrogen doses on the content of zinc in leaves of winter oilseed rape at the rosette stage; Figure S3: Regression of the zinc content in leaves of winter oilseed rape at the stage of rosette against nitrogen doses on the background of nitrogen fertilizing systems; Figure S4: Regression of the magnesium content in leaves of winter oilseed rape at the stage of rosette against nitrogen doses on the background of nitrogen fertilizing systems; Figure S5: Regression of the calcium content in leaves of winter oilseed rape at the stage of rosette against nitrogen doses on the background of nitrogen fertilizing systems; Figure S6: Regression of on the leaf biomass of WOSR at the beginning of flowering against nitrogen doses on the background of nitrogen fertilizing systems; Figure S7: Regression of the magnesium content in leaves of winter oilseed rape at the beginning of flowering against nitrogen doses on the background of nitrogen fertilizing systems; Figure S8: Regression of the manganese content in leaves of winter oilseed rape at the beginning of flowering against nitrogen doses on the background of nitrogen fertilizing systems; Figure S9: Regression of the nitrogen content in leaves of winter oilseed rape at the beginning of flowering against nitrogen doses on the background of nitrogen fertilizing systems; Figure S10: Regression of on the stem biomass of WOSR at the beginning of flowering against nitrogen doses on the background of nitrogen fertilizing systems; Figure S11: Regression of the zinc content in stems of winter oilseed rape at the beginning of flowering against nitrogen doses on the background of nitrogen fertilizing systems; Figure S12: Regression of the nitrogen content in stems of winter oilseed rape at the beginning of flowering against nitrogen doses on the background of nitrogen fertilizing systems; Figure S13: Regression of the calcium content in stems of winter oilseed rape at the beginning of flowering against nitrogen doses on the background of nitrogen fertilizing systems; Table S1. Basic characteristics of the topsoil physical and chemical properties in subsequent growing seasons; Table S2. Chemical composition of digestate used as nitrogen fertilizer. References [69,70,71,72] are cited in the Supplementary Materials.

Author Contributions

Conceptualization, R.Ł. and W.S.; methodology, R.Ł.; software, D.M.; validation, R.Ł. and W.S.; formal analysis, W.S.; investigation, R.Ł., W.S., and D.M.; resources, D.M.; data curation, W.S.; writing—original draft preparation, W.S.; writing—review and editing, R.Ł.; visualization, D.M.; supervision, R.Ł.; project administration, D.M. All authors have read and agreed to the published version of the manuscript.

Funding

The publication was financed by the Polish Minister of Science and Higher Education as part of the Strategy of the Poznan University of Life Sciences for 2024–2026 in the field of improving scientific research and development work in priority research areas.

Data Availability Statement

The original contributions presented in the study are included in the article/Supplementary Material, and further inquiries can be directed to the corresponding author.

Conflicts of Interest

Author Dominik Młodecki was employed by the company K+S Polska sp. z o.o. Poznań, street 28 Czerwca 1956 r No. 404, 61-441 Poznań, Poland. The remaining authors declare that the research was conducted in the absence of any commercial or financial relationships that could be construed as a potential conflict of interest.

Abbreviations

ANAmmonium nitrate
CVCoefficient of variation
BBCH 30Rosette stage of WOSR growth
BBCH 60The beginning of WOSR flowering
BRBiomass of rosette leaves
BLBiomass of WOSR leaves at the beginning of flowering
BSBiomass WOSR stems at the beginning of flowering
DMDry matter
FSFertilization system
M-FSMineral-ammonium nitrate FS
O-FSOrganic-digestate FS
OM-FSMixed: organic-mineral FS
NfNitrogen fertilizer
NFRVNitrogen fertilizer replacement value
NGNitrogen gap
SYSeed yield
WOSRWinter oilseed rape
YGYield gap

Appendix A

Table A1. Correlation matrix of the content of available nutrients in leaves of the winter oilseed rape at the rosette stage and crop characteristics, n = 45.
VariablesPKMgCaFeMnZnCuBRSY
N−0.120.62 ***−0.37 *0.010.090.32 *0.66 ***0.46 **−0.36 *−0.10
P1.000.32 *0.59 ***−0.23−0.80 ***−0.48 **−0.20−0.010.74 ***0.10
K 1.00−0.290.10−0.41 **0.170.71 ***0.57 ***−0.03−0.41 **
Mg 1.00−0.13−0.43 **−0.66 ***−0.70 ***−0.52 ***0.81 ***0.57 ***
Ca 1.000.01−0.010.280.05−0.14−0.45 **
Fe 1.000.36 *0.060.01−0.58 ***0.16
Mn 1.000.47 **0.68 ***−0.58 ***−0.25
Zn 1.000.66 ***−0.61 ***−0.60 ***
Cu 1.00−0.31 *−0.42 **
BR 1.000.46 **
***, **, * indicate significant differences between nutrient traits at p < 0.001, p < 0.01, and p < 0.05, respectively. Legend: N, P, K, Mg, and Ca—macronutrients: nitrogen, phosphorus, potassium, magnesium, and calcium, respectively; Fe, Mn, Zn, and Cu—micronutrients: iron, manganese, zinc, and copper; SY—seed yield; BR—biomass of rosette.
Table A2. Correlation matrix of the content of available nutrients in leaves of the winter oilseed rape at the beginning of flowering and crop characteristics, n = 45.
VariablesPKMgCaFeMnZnCuSYBLBSBC
N0.140.210.070.31 *−0.120.270.51 ***0.120.280.03−0.02−0.01
P1.00−0.69 ***−0.68 ***−0.020.68 ***0.66 ***0.39 **0.82 **−0.03−0.10−0.63 ***−0.51 ***
K 1.000.55 ***0.23−0.71 ***−0.36 ***0.09−0.74 ***0.080.090.59 ***0.47 **
Mg 1.00−0.41 **−0.36 *−0.52 ***−0.60 ***−0.52 ***0.52 ***0.48 **0.85 ***0.79 ***
Ca 1.00−0.34 **0.080.69 ***−0.13−0.58 ***−0.44 **−0.37 *−0.42 **
Fe 1.000.46 **−0.030.72 ***0.160.03−0.36 *−0.27
Mn 1.000.47 **0.60 ***0.050.08−0.37 *−0.25
Zn 1.000.21−0.39 **−0.42 **−0.54 ***−0.54 **
Cu 1.000.160.07−0.44 **−0.31 *
SY 1.000.74 ***0.64 ***0.71 ***
BL 1.000.72 ***0.85 ***
BS 1.000.98 ***
***, **, * indicate significant differences between nutrient traits at p < 0.001, p < 0.01, and p < 0.05, respectively. Legend: N, P, K, Mg, and Ca—macronutrients: nitrogen, phosphorus, potassium, magnesium, and calcium, respectively; Fe, Mn, Zn, and Cu—micronutrients: iron, manganese, zinc, and copper; SY—seed yield; BL—biomass of leaves; BS—biomass of stems; BC—total biomass of WOSR canopy.
Table A3. Correlation matrix of the content of available nutrients in stems of the winter oilseed rape at the beginning of flowering and crop characteristics, n = 45.
Variables PKMgCaFeMnZnCuSYBLBSBC
N0.270.59 ***−0.33 *0.68 ***−0.27−0.33 *0.76 ***0.28−0.09−0.28−0.27−0.29
P1.00−0.39 **−0.88 ***0.24−0.89 ***−0.89 ***0.64 ***0.66 ***−0.31 *−0.31 *−0.78 ***−0.69 ***
K 1.000.260.37 *0.33 *0.32 *0.32 *−0.180.210.100.40 **0.33 *
Mg 1.00−0.35 *0.89 ***0.90 ***−0.73 ***−0.69 ***0.37 *0.31 *0.78 ***0.69 ***
Ca 1.00−0.29−0.33 *0.64 ***0.06−0.58 ***−0.46 **−0.40 **−0.44 **
Fe 1.000.95 ***−0.62 ***−0.67 ***0.230.200.71 ***0.59 ***
Mn 1.00−0.67 ***−0.68 ***0.32 *0.270.76 ***0.65 ***
Zn 1.000.56 ***−0.30 *−0.37 *−0.57 ***−0.55 ***
Cu 1.000.100.01−0.50 ***−0.38 *
***, **, * indicate significant differences between nutrient traits at p < 0.001, p < 0.01, and p < 0.05, respectively. Legend: N, P, K, Mg, and Ca—macronutrients: nitrogen, phosphorus, potassium, magnesium, and calcium, respectively; Fe, Mn, Zn, and Cu—micronutrients: iron, manganese, zinc, and copper; SY—seed yield; BL—biomass of leaves; BS—biomass of stems; BC—total biomass of WOSR canopy.

Appendix B

Figure A1. The effect of interaction of three fertilizing systems (FSs) and gradually increasing nitrogen doses on the leaf biomass of winter oilseed rape at the rosette stage. Similar letters indicate a lack of significant differences between years using Tukey’s test; the vertical bar in the column shows the standard error of the mean for fertilizing systems.
Agronomy 15 01241 g0a1
Figure A2. Score plot of winter oilseed rape (WOSR) biomass of rosette (BS), seed yield (SY), and the content of nutrients in WOSR leaves at the stage of rosette on PC1 and PC2 axes.
Agronomy 15 01241 g0a2
Figure A3. Score plot of winter oilseed rape (WOSR) biomass of leaves (BL), stems (BS), seed yield (SY), and the content of nutrients in WOSR leaves at the beginning of flowering on PC1 and PC2 axes.
Agronomy 15 01241 g0a3
Figure A4. The effect of the interaction of three fertilizing systems (FSs) and gradually increasing nitrogen doses on the nitrogen content in stems of winter oilseed rape at the beginning of flowering. Similar letters indicate a lack of significant differences between experimental treatments using Tukey’s test; the vertical bar in the column shows the standard error of the mean for the years. Legend: AN—AN-FS, nitrogen mineral fertilizing system (ammonium nitrate); D—D-FS, digestate-based (N) fertilizing system; DAN—DAN-FS, 2/3 of digestate N, 1/3 of ammonium nitrate, mixed fertilizing system.
Agronomy 15 01241 g0a4
Figure A5. Score plot of winter oilseed rape (WOSR) biomass of leaves (BL), stems (BS), seed yield (SY), and the content of nutrients in WOSR stems at the beginning of flowering on PC1 and PC2 axes.
Agronomy 15 01241 g0a5
Figure A6. The impact of the change in the content of calcium in leaves of winter oilseed rape during the period from the rosette stage to the beginning of flowering on the content of nitrogen and zinc.
Agronomy 15 01241 g0a6

References

  1. Van Ittersum, M.K.; Cassman, K.G.; Grassini, P.; Wolf, J.; Tittonell, P.; Hochman, Z. Yield gap analysis with local to global relevance—A review. Field Crops Res. 2013, 143, 4–17. [Google Scholar] [CrossRef]
  2. Licker, R.; Johnston, M.; Foley, J.A.; Barford, C.; Kucharik, C.J.; Monfreda, C.; Ramankutty, N. Mind the gap: How do climate and agricultural management explain the “yield gap” of croplands around the world? Glob. Ecol. Biogeogr. 2010, 19, 769–782. [Google Scholar] [CrossRef]
  3. Asseng, S.; Guarin, J.R.; Raman, M.; Monje, O.; Kiss, G.; Despomnier, D.D.; Meggers, F.M.; Gaither, P.P.G. Wheat yield potential in controlled–environment vertical farms. Proc. Natl. Acad. Sci. USA 2020, 117, 19131–19135. [Google Scholar] [CrossRef]
  4. Łukowiak, R.; Grzebisz, W.; Ceglarek, J.; Podolski, A.; Kaźmierowski, C.; Piekarczyk, J. Spatial variability of yield and nitrogen indicators-a crop rotation approach. Agronomy 2020, 10, 1959. [Google Scholar] [CrossRef]
  5. Barłóg, P.; Grzebisz, W.; Łukowiak, R. Fertilizers and fertilization strategies mitigating soil factors constraining efficiency of nitrogen in plant production. Plants 2022, 11, 1855. [Google Scholar] [CrossRef]
  6. Grzebisz, W.; Diatta, J.; Barłóg, P.; Biber, M.; Potarzycki, J.; Łukowiak, R.; Przygocka-Cyna, K.; Szczepaniak, W. Soil Fertility Clock—Crop rotation as a paradigm in nitrogen fertilizer productivity control. Plants 2022, 11, 2841. [Google Scholar] [CrossRef]
  7. Anas, M.; Liao, F.; Verma, K.K.; Sarwar, M.A.; Mahmood, A.; Chen, Z.-L.; Li, Q.; Zeng, X.-P.; Liu, Y.; Li, Y.-R. Fate of nitrogen in agriculture and environment: Agronomic, eco-physiological and molecular approaches to improve nitrogen use efficiency. Biol. Res. 2020, 53, 47. [Google Scholar] [CrossRef]
  8. Grzebisz, W.; Łukowiak, R. Nitrogen gap amelioration is a core for sustainable intensification of agriculture—A concept. Agronomy 2021, 11, 419. [Google Scholar] [CrossRef]
  9. Conijn, J.G.; Bindraban, P.S.; Schröder, J.J.; Jongschaap, R.E.E. Can our global food system meet food demand within planetary boundries? Agric. Ecosys. Environ. 2018, 251, 244–256. [Google Scholar] [CrossRef]
  10. Rockström, J.; Williams, J.; Daily, G.; Noble, A.; Matthews, N.; Gordon, L.; Wetterstrand, H.; DeClerck, F.; Shah, M.; Steduto, P.; et al. Sustainable intensification of agriculture for human prosperity and global sustainability. Ambio 2017, 46, 4–17. [Google Scholar] [CrossRef]
  11. Sattari, S.Z.; van Ittersum, M.K.; Bouwman, A.F.; Smit, A.L.; Janssen, B.H. Crop yield response to soil fertility and N, P, K inputs in different environments: Testing and improving the QEFTS model. Field Crops Res. 2014, 157, 35–46. [Google Scholar] [CrossRef]
  12. Pretty, J.; Bharucha, Z.P. Sustainable intensification in agricultural systems. Ann. Bot. 2014, 114, 1571–1596. [Google Scholar] [CrossRef]
  13. Alburquerque, J.A.; De la Fuente, C.; Ferre-Costa, A.; Carrasco, L.; Cegarra, J.; Abad, M.; Bernal, M.P. Assessment of the fertiliser potential of digestates from farm and agro-industrial residues. Biomass Bioenerg. 2012, 40, 181–189. [Google Scholar] [CrossRef]
  14. Nkoa, R. Agricultural benefits and environmental risks of soil fertilization with anaerobic digestates: A review. Agron. Sustain. Dev. 2014, 34, 473–492. [Google Scholar] [CrossRef]
  15. Sogn, T.A.; Dragicevic, I.; Linjordet, R.; Krogstad, T.; Eijsink, V.G.; Eich-Greatorex, S. Recycling of biogass digestates in plant production: NPK fertilizer value and risk of leaching. Int. J. Rec. Org. Wastes Agric. 2018, 7, 49–58. [Google Scholar] [CrossRef]
  16. Häfner, F.; Hartung, J.; Moller, K. Digestate composition affecting N fertilizer value and C mineralization. Waste Biomass Valirization 2022, 13, 3445–3462. [Google Scholar] [CrossRef]
  17. Van Midden, C.; Harris, J.; Shaw, L.; Sizmur, T.; Pawlett, M. The impact of anaerobic digestate on soil life; a review. Appl. Soil Ecol. 2023, 191, 105066. [Google Scholar] [CrossRef]
  18. Barłóg, P.; Hlisnikovský, L.; Kunzová, E. Effect of digestate on soil organic carbon and plant-available nutrient content compared to cattle slurry and mineral fertilization. Agronomy 2020, 10, 379. [Google Scholar] [CrossRef]
  19. Przygocka-Cyna, K.; Grzebisz, W. The multifactorial effect of digestate on the availability of soil elements and grain yield and its mineral profile—The case of maize. Agronomy 2020, 10, 275. [Google Scholar] [CrossRef]
  20. Garcia-López, A.M.; Delgado, A.; Anjos, O.; Horta, C. Digestate not only affects nutrient availability but also soil quality indicators. Agronomy 2023, 13, 1308. [Google Scholar] [CrossRef]
  21. Sieling, K.; Herrmann, A.; Wienforth, B.; Taube, F.; Ohl, S.; Hartung, E.; Kage, H. Biogas cropping systems: Short term response of yield performance and N use efficiency to biogas residue application. Europ. J. Agron. 2013, 47, 44–55. [Google Scholar] [CrossRef]
  22. De Notaris, C.; Sørensen, P.; Møller, H.B.; Wahid, R.; Eriksen, J. Nitrogen replacement value of digestate from three green manures. Nutr. Cycl. Agroecosyst. 2018, 112, 355–368. [Google Scholar] [CrossRef]
  23. Doyeni, M.O.; Stulpinaite, U.; Baksinskaite, A.; Supronienie, S.; Tilvikiene, V. The effectiveness of digestate use for fertilization in an agricultural cropping system. Plants 2021, 10, 1734. [Google Scholar] [CrossRef]
  24. Morris, D.R.; Lathwell, D.J. Anaerobically digested dairy manure as fertilizer for maize in acid and alkaline soils. Comm. Soil. Sci. Plant. Anal. 2004, 11–12, 1757–1771. [Google Scholar] [CrossRef]
  25. Przygocka-Cyna, K.; Grzebisz, W. Biogas digestate–benefits and risks for soil fertility and crop quality—An evaluation of grain response. Open Chem. 2018, 16, 258–271. [Google Scholar] [CrossRef]
  26. Baryga, A.; Połeć, B.; Klasa, A. Quality of sugar beets under efefcts of digestate application to the soil. Processes 2020, 8, 1402. [Google Scholar] [CrossRef]
  27. Pullens, J.W.M.; Sharif, B.; Trnka, M.; Balek, J.; Semenov, M.A.; Olesen, J.E. Risk factors for European winter oilseed rape production under climate change. Agric. For. Meteorol. 2019, 272–273, 30–39. [Google Scholar] [CrossRef]
  28. Szczepaniak, W.; Barłóg, P.; Łukowiak, R.; Przygocka-Cyna, K. Effect of balanced nitrogen fertilization in four-year rotation on plant productivity. J. Cent. Eur. Agric. 2013, 14, 64–77. [Google Scholar] [CrossRef]
  29. Szczepaniak, W.; Grzebisz, W.; Barłóg, P.; Przygocka-Cyna, K. Mineral composition of winter oilseed rape (Brassica napus L.) seeds as a tool for oil seed prognosis. J. Cen. Europ. Agric. 2017, 18, 196–213. [Google Scholar] [CrossRef]
  30. Lu, H.; Lu, J.; Ren, T.; Li, X.; Cong, R. Nutrient efficiency of winter oilseed rape in an intensive cropping system: A regional analysis. Podosphere 2017, 27, 364–370. [Google Scholar]
  31. Weymann, W.; Bottcher, U.; Sieling, K.; Kage, H. Effects of weather conditions during different growth phases on yield formation of winter oilseed rape. Field Crop. Res. 2015, 173, 41–48. [Google Scholar] [CrossRef]
  32. Barłóg, P.; Grzebisz, W. Effect of timing and nitrogen fertilizer application on winter oilseed rape (Brassica napus L.). I. Growth dynamics and seed yield. J. Agron. Crop Sci. 2004, 190, 305–313. [Google Scholar] [CrossRef]
  33. Barłóg, P.; Grzebisz, W. Effect of timing and nitrogen fertilizer application on winter oilseed rape (Brassica napus L.). II. Nitrogen uptake dynamics and fertilizer efficiency. J. Agron. Crop Sci. 2004, 190, 314–323. [Google Scholar] [CrossRef]
  34. Grzebisz, W.; Łukowiak, R.; Kotnis, K. Evaluation of nitrogen fertilization systems based on the in-season variability of nitrogenous growth factors and soil fertility factors: A case of winter oilseed rape (Brassica napus L.). Agronomy 2020, 10, 1701. [Google Scholar] [CrossRef]
  35. Szczepaniak, W. The mineral profile of winter oilseed rape in critical growth stages–potassium. J. Elem. 2014, 19, 203–215. [Google Scholar] [CrossRef]
  36. Mehlich, A. Mehlich 3 soil test extractant: A modification of Mehlich 2 extractant. Commun. Soil Sci. Plant Anal. 1984, 15, 1409–1416. [Google Scholar] [CrossRef]
  37. Kęsik, K. Application of the Mehlich 3 method in the fertilizer advisory system. Stud. I Rap. IUNG-PIB 2016, 48, 95–104. (In Polish) [Google Scholar]
  38. Trávník, K.; Zbíral, J.; Němec, P. Agrochemical Soil Testing—Mehlich III; Central Institute for Supervising and Testing in Agriculture: Brno, Czech, 1999. (In Czech) [Google Scholar]
  39. Zbíral, J. Determination of plant-available micronutrients by the Mehlich 3 soil extractant—A proposal of critical values. Plant Soil Environ. 2016, 62, 527–531. [Google Scholar] [CrossRef]
  40. Fotyma, E.; Fotyma, M.; Pietruch, C. The content of mineral N in arable soils in Poland. Fertil. Fertil. 2004, 3, 11–54. [Google Scholar]
  41. Grzebisz, W.; Przygocka-Cyna, K.; Szczepaniak, W.; Zawieja, A. Impact of winter oilseed rape nutritional status during vegetative growth on yield. Plant, Soil Environ. 2019, 65, 490–496. [Google Scholar] [CrossRef]
  42. Merrien, A. Winter oilseed rape–example Europe. In IFA World Fertilizer Use Manual; International Industry Association: Paris, France, 1992; pp. 215–219. [Google Scholar]
  43. Weichmann, W. World Fertilizer Use Manual; IFA: Riverton, UT, USA, 1992; 600p, Available online: http://www.fertilizer.org/ifa/home-page/Library/our-selectionw/2World-Fertilizer-Use-manual (accessed on 20 February 2025).
  44. Grzebisz, W. Part I. Oil crops, root and tuber crops, legumes. In Technology of Crop Plant Fertilization—Yielding Physiology; PWRiL: Poznań, Poland, 2009; p. 414. (In Polish) [Google Scholar]
  45. Bergmann, W. Nutritional Disorders of Plants; Verlag Gustav Fisher: Jena, Germany, 1992; 741p. [Google Scholar]
  46. Orlovius, K. Fertilizing for High Yield and Quality. Oilseed Rape; International Potash Institute Bulletin: Base, Switzerland, 1992; 130p. [Google Scholar]
  47. Barłóg, P.; Grzebisz, W.; Diatta, J. Effect of timing and nitrogen fertilizers on nutrients content and uptake of winter oilseed rape. Part I. Dry matter accumulation and nutrients content. In Chemistry for Agriculture; Górecki, H., Dobrzański, Z., Kafarski, P., Eds.; Czech-Pol Trade: Prague, Czech Republic, 2005; Volume 6, pp. 102–112. [Google Scholar]
  48. Wilding, L.P.; Dress, L.R. Spatial variability and pedology. In Pedogenesis and Soil Taxonomy; Wilding, L.P., Smeck, N., Hall, G.F., Eds.; Elsevier Science: Wageningen, The Netherlands, 1983; pp. 83–116. [Google Scholar]
  49. Smith, G. Step away from stepwise. J. Big Data 2018, 5, 32. [Google Scholar] [CrossRef]
  50. Bouchet, A.S.; Laperche, A.; Bissuel-Belaygue, C.; Snowdon, R.; Nesi, N.; Stahl, A. Nitrogen use efficiency in rapeseed. A review. Agron. Sustain. Dev. 2016, 36, 38. [Google Scholar] [CrossRef]
  51. Rathke, G.W.; Behrens, T.; Diepenbrock, W. Integrated nitrogen management strategies to improve seed yield, oil content and nitrogen efficiency of winter oilseed rape (Brassica napus L.): A review. Agric. Ecosyst. Environ. 2016, 117, 80–108. [Google Scholar] [CrossRef]
  52. Zając, T.; Klimek-Kopyra, A.; Oleksy, A.; Lorenc-Kozik, A.; Ratajczak, K. Analysis of yield and plant traits of oilseed rape (Brassica napus L.) cultivated in temperate region in light of the possibilities of sowing in arid areas. Acta Agrobot. 2016, 69, 1696. [Google Scholar] [CrossRef]
  53. Rutkowska, A. Productivity of winter oilseed rape depending on its nitrogen and water use efficiency. Polish J. Agron. 2019, 39, 39. [Google Scholar]
  54. Grzebisz, W.; Szczepaniak, W.; Grześ, S. Sources of nutrients for high-yielding winter oilseed rape (Brassica napus L.) during post-flowering growth. Agronomy 2020, 10, 626. [Google Scholar] [CrossRef]
  55. Łukowiak, R.; Grzebisz, W. Effect of site specific nitrogen management on seed nitrogen—A driving factor of winter oilseed rape (Brassica napus L.) yield. Agronomy 2020, 10, 1364. [Google Scholar] [CrossRef]
  56. Möller, K.; Stinner, W. Effects of different manuring systems with and without biogas digestion on soil mineral nitrogen content and on gaseous nitrogen losses (ammonia, nitrous oxides). Eur. J. Agron. 2009, 30, 1–16. [Google Scholar] [CrossRef]
  57. Malagoli, M.; Laine, P.; Rossato, L.; Ourry, A. Dynamics of nitrogen uptake and mobilization in field-grown winter oilseed rape (Brassica napus L.) from stem extension to harvest. I. Global N flows between vegetative and reproductive tissues in relations to leaf fall and their residual N. Ann. Bot. 2005, 95, 853–861. [Google Scholar] [CrossRef]
  58. Wang, X.; Mathieu, A.; Cournede, P.H.; Allirand, J.M.; Jullien, A.; de Reffye, P.; Zhang, B.G. Variability and regulation of the number of ovules, seeds, and pods according to assimilate availability in winter oilseed rape (Brassica napus L.). Field Crops Res. 2011, 122, 60–69. [Google Scholar] [CrossRef]
  59. Sokólski, M.; Jankowski, K.J.; Załuski, D.; Szatkowski, D. productivity, energy and economic balance in the production of different cultivars of winter oilseed rape. A case study in North-Eastern Poland. Agronomy 2020, 10, 508. [Google Scholar] [CrossRef]
  60. Grzebisz, W.; Barłóg, P.; Kryszak, J.; Łukowiak, R. Pre-anthesis nutritional status of spelt wheat as a tool for predicting the attainable grain yield. Agronomy 2019, 9, 558. [Google Scholar] [CrossRef]
  61. Grzebisz, W.; Szczepaniak, W.; Przygocka-Cyna, K.; Biber, M.; Spiżewski, T. Sources of nutrients for the growing ear of winter wheat in the Critical Cereal Window. Agronomy 2024, 14, 3018. [Google Scholar] [CrossRef]
  62. Marschner, H. Mineral Nutrition of Higher Plants, 2nd ed.; Elsevier Ltd.: London, UK, 1995; 899p. [Google Scholar]
  63. Szczepaniak, W.; Grzebisz, W.; Potarzycki, J.; Łukowiak, R.; Przygocka-Cyna, K. Nutritional status of winter oilseed rape in cardinal stages of growth as yield indicator. Plant Soil Environ. 2015, 61, 291–296. [Google Scholar] [CrossRef]
  64. Grzebisz, W.; Łukowiak, R.; Biber, M.; Przygocka-Cyna, K. Effect of multi-micronutrient fertilizers applied to foliage on nutritional status of winter oilseed rape and development of yield forming elements. J. Elem. 2010, 15, 477–491. [Google Scholar] [CrossRef]
  65. Thor, K. Calcium–nutrient and messanger. Front Plant Sci. 2019, 10, 440. [Google Scholar] [CrossRef]
  66. Wang, T.; Chen, X.; Ju, C.; Wang, C. Calcium signalling in plant mineral nutrition: From uptake to transport. Plant Comm. 2023, 4, 100678. [Google Scholar] [CrossRef]
  67. Szczepaniak, W.; Grzebisz, W.; Potarzycki, J.; Łukowiak, R.; Przygocka-Cyna, K. The magnesium and calcium mineral status of maize at physiological maturity as a tool for an evaluation of yield forming conditions. J. Elem. 2015, 21, 881–897. [Google Scholar] [CrossRef]
  68. Potarzycki, J.; Grzebisz, W. The in-season variability in the calcium concentration in potato organs and its relationships with the tuber yield. J. Elem. 2020, 25, 107–124. [Google Scholar] [CrossRef]
  69. ISO 11277; Soil Quality–Determination of Particle Size Distribution in Mineral Soil Material. Method by Sieving and Sedimentation. ISO: Geneva, Switzerland, 2009.
  70. PTGleb. Particle size distribution and textural classes of soils and mineral materials–classification of Polish Society of Soil Sciences (in Polish). Soil Sci. Ann. 2008, 60, 5–16. [Google Scholar]
  71. Sumner, M.E.; Miller, W.P. Cation exchange capacity and exchange coefficients. In Methods of Soil Analysis. Part 3—CHEMICAL Methods; Sparks, D.L., Page, A.L., Helmke, P.A., Loeppert, R.H., Soltanpour, P.N., Tabatabai, M.A., Johnston, C.T., Sumner, M.E., Bartels, J.M., Bigham, J.M., Eds.; Soil Science Society of America: Madison, WI, USA, 1996; pp. 1201–1229. [Google Scholar]
  72. Shuman, L.M.; Duncan, R.R. Soil exchangeable cations and aluminum measured by ammonium chloride, potassium chloride, and ammonium acetate. Comm. Soil Sci. Plant Anal. 1990, 21, 1217–1228. [Google Scholar] [CrossRef]
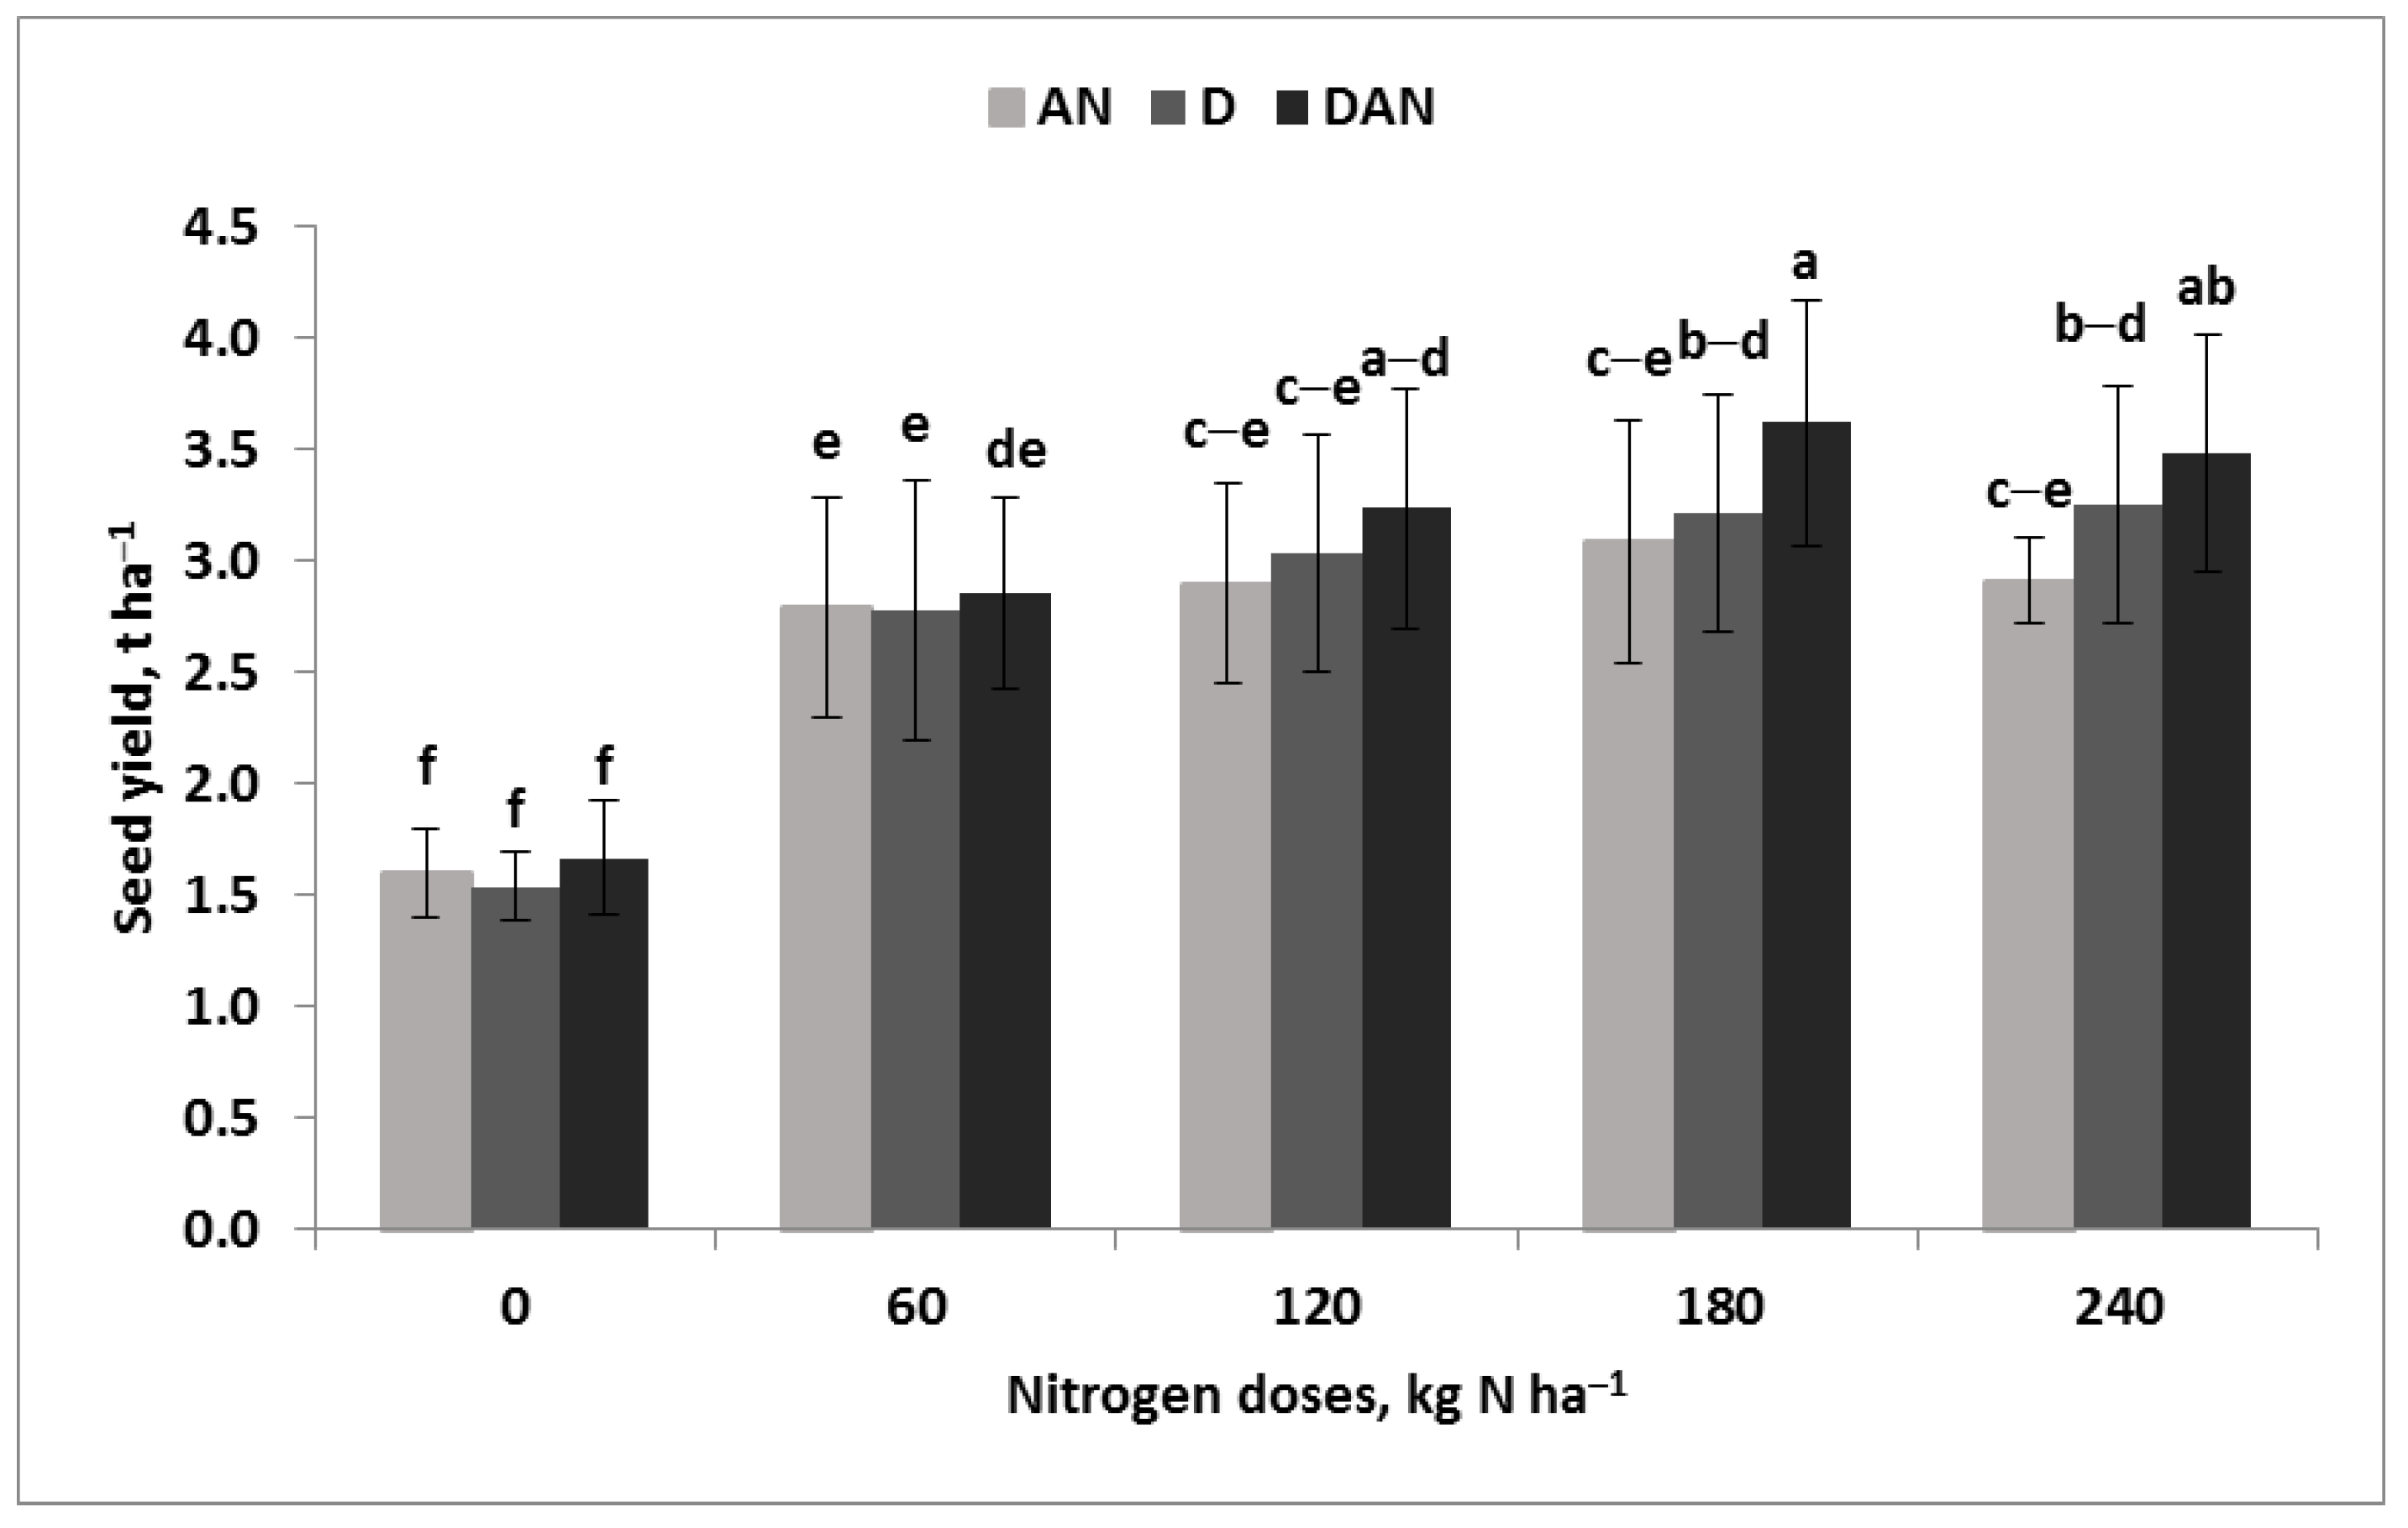
Figure 1. The effect of the interaction between three fertilization systems (FSs) and gradually increasing nitrogen doses on the seed yield of winter oilseed rape. Bars with the same letters indicate a lack of significant differences between experimental treatments using Tukey’s test; the vertical bar in each column shows the standard error of the mean for the year. Legend: AN-AN-FS, nitrogen mineral fertilization system (ammonium nitrate); D—D-FS, digestate-based (N) fertilization system; DAN—DAN-FS, mixed fertilization system consisting of 2/3 digestate N and 1/3 ammonium nitrate.
Agronomy 15 01241 g001
Figure 2. The effect of the interaction between three fertilization systems (FSs) and gradually increasing nitrogen doses on the calcium content in the leaves of winter oilseed rape at the rosette stage. Bars with the same letters indicate a lack of significant differences between experimental treatments using Tukey’s test; the vertical bar in each column shows the standard error of the mean for the year. Legend: AN—AN-FS, nitrogen mineral fertilization system (ammonium nitrate); D—D-FS, digestate-based (N) fertilization system; DAN—DAN-FS, mixed fertilization system consisting of 2/3 digestate N and 1/3 ammonium nitrate.
Agronomy 15 01241 g002
Figure 3. The effect of the interaction between three fertilization systems (FSs) and gradually increasing nitrogen doses on the leaf biomass of winter oilseed rape at the beginning of flowering. Bars with the same letters indicate a lack of significant differences between years using Tukey’s test; the vertical bar in each column shows the standard error of the mean for fertilization systems. Legend: AN—AN-FS, nitrogen mineral fertilization system (ammonium nitrate); D—D-FS, digestate-based (N) fertilization system; DAN—DAN-FS, mixed fertilization system consisting of 2/3 digestate N and 1/3 ammonium nitrate.
Agronomy 15 01241 g003
Figure 4. The effect of the interaction between three fertilization systems (FSs) and gradually increasing nitrogen doses on the magnesium content in the leaves of winter oilseed rape at the beginning of flowering. Bars with the same letters indicate a lack of significant differences between experimental treatments using Tukey’s test; the vertical bar in each column shows the standard error of the mean for the year. Legend: AN—AN-FS, nitrogen mineral fertilization system (ammonium nitrate); D—D-FS, digestate-based (N) fertilization system; DAN—DAN-FS, mixed fertilization system consisting of 2/3 digestate N and 1/3 ammonium nitrate.
Agronomy 15 01241 g004
Figure 5. The effect of the interaction between three fertilization systems (FSs) and gradually increasing nitrogen doses on the nitrogen content in the leaves of winter oilseed rape at the beginning of flowering. Bars with the same letters indicate a lack of significant differences between experimental treatments using Tukey’s test; the vertical bar in each column shows the standard error of the mean for the year. Legend: AN—AN-FS, nitrogen mineral fertilization system (ammonium nitrate); D—D-FS, digestate-based (N) fertilization system; DAN—DAN-FS, mixed fertilization system consisting of 2/3 digestate N and 1/3 ammonium nitrate.
Agronomy 15 01241 g005
Figure 6. The effect of the interaction between three fertilization systems (FSs) and gradually increasing nitrogen doses on the stem biomass of winter oilseed rape at the beginning of flowering. Bars with the same letters indicate a lack of significant differences between years using Tukey’s test; the vertical bar in each column shows the standard error of the mean for fertilization systems. Legend: AN—AN-FS, nitrogen mineral fertilization system (ammonium nitrate); D—D-FS, digestate-based (N) fertilization system; DAN—DAN-FS, mixed fertilization system consisting of 2/3 digestate N and 1/3 ammonium nitrate.
Agronomy 15 01241 g006
Figure 7. The effect of the interaction between three fertilization systems (FSs) and gradually increasing nitrogen doses on the zinc content in the stems of winter oilseed rape at the beginning of flowering. Bars with the same letters indicate a lack of significant differences between experimental treatments using Tukey’s test; the vertical bar in each column shows the standard error of the mean for the year. Legend: AN—AN-FS, nitrogen mineral fertilization system (ammonium nitrate); D—D-FS, digestate-based (N) fertilization system; DAN—DAN-FS, mixed fertilization system consisting of 2/3 digestate N and 1/3 ammonium nitrate.
Agronomy 15 01241 g007
Figure 8. The effect of the interaction between three fertilization systems (FSs) and gradually increasing nitrogen doses on the calcium content in the stems of winter oilseed rape at the beginning of flowering. Bars with the same letters indicate a lack of significant differences between experimental treatments using Tukey’s test; the vertical bar in each column shows the standard error of the mean for the year. Legend: AN—AN-FS, nitrogen mineral fertilization system (ammonium nitrate); D—D-FS, digestate-based (N) fertilization system; DAN—DAN-FS, mixed fertilization system consisting of 2/3 digestate N and 1/3 ammonium nitrate.
Agronomy 15 01241 g008
Figure 9. Magnesium content in the leaves of winter oilseed rape at the rosette stage as a significant predictor of both the biomass of rosettes and seed yield.
Agronomy 15 01241 g009
Figure 10. The effect of magnesium content in the leaves of winter oilseed rape at the beginning of flowering on the biomass of leaves (BL), biomass of stems (ST), and seed yield (SY).
Agronomy 15 01241 g010
Table 1. The content of available nutrients in soil layers in consecutive growing seasons 1, mg kg−1 soil.
Year/Soil Layer, cmGrowing Seasons and Nutrients
2015/20162016/20172017/2018
MacronutrientsPKCa 4MgPKCaMgPKCaMg
0–3080 ± 29 2
H 3
155 ± 38
H
390 ± 61
L 4
62 ± 6
H 3
88 ± 72
H
105 ± 37
M
430 ± 156
VL
72 ± 12
M
63 ± 24
M
157 ± 12
H
490 ± 156
L
61 ± 8
M
30–6030 ± 12
VL
96 ± 27
M
275 ± 100
VL
59 ± 11
H
53 ± 44
L
80 ± 22
M
369 ± 86
VL
65 ± 16
M
20 ± 5
VL
99 ± 28
L
342 ± 169
VL
84 ± 32
H
60–9017 ± 6
VL
71 ± 16
M
309 ± 299
VL
73 ± 20
H
53 ± 34
L
70 ± 23
L
298 ± 44
VL
62 ± 12
H
14 ± 2
VL
69 ± 19
L
553 ± 265
L
117 ± 18
VH
MicronutrientsFeMnZnCuFeMnZnCuFeMnZnCu
0–30238 ± 8
M 5
51 ± 12
M
2.4 ± 0.5
M
1.3 ± 0.2
L
187 ± 28
M
39 ± 12
M
2.8 ± 1.1
M
0.9 ± 0.6
L
212 ± 59
M
45 ± 9
M
2.7 ± 0.3
M
2.71 ± 1.9
M
30–60142 ± 29
M
40 ± 10
M
1.8 ± 0.2
L
1.2 ± 0.2
L
151 ± 48
M
25 ± 16
L
1.3 ± 0.7
L
0.7 ± 0.5
L
127 ± 17
M
24 ± 14
L
1.4 ± 0.4
L
2.4 ± 0.8
M
60–90118 ± 8
M
23 ± 7
L
1.4 ± 0.3
L
0.8 ± 0.2
L
146 ± 46
M
19 ± 9
L
1.1 ± 0.7
L
0.5 ± 0.3
L
105 ± 12
<
13 ± 3
L
1.1 ± 0.2
L
2.3 ± 0.9
M
1 Mehlich 3 extraction solution [36]; 2 average content ± standard deviation; 3 fertility class [37]; 4 Trawnik [38]; 5 Zbiral [39]. VL—very low; L—low; M—medium; H—high; VH—very high.
Table 2. Main meteorological characteristics during the WOSR growing season relative to long-term averages 1.
Growing Season Consecutive Months During the WOSR Growing Season
VIIIIXXXIXIIIIIIIIIVVVIVIIAverage
Temperature, °C
2015/201621.114.18.57.16.7−0.93.74.38.815.718.519.010.6
2016/201717.816.88.69.33.0−0.71.66.77.41417.217.710.0
2017/201818.213.611.25.83.42.7−1.80.512.316.618.520.010.1
1981–201023.013.99.44.41.10.20.94.08.613.616.218.69.5
Precipitation, mm
2015/201626.540.961.057.445.738.656.633.333.517.473.978.5563.3
2016/201769.00.054.049.057.866.758.051.247.056.7106.0236.6852.0
2017/201892.762.0120.5113.332.676.75.723.161.026.819.368.3683.5
1981–2010 80.662.052.253.050.157.530.235.636.965.657.993.8675.3
1 Meteorological station in Szczecin.
Table 3. Critical ranges of nutrient content in the leaves of winter oilseed seed rape at the rosette stage (BBCH 30).
Macronutrients NPKCaMgSource
g kg−1 DM555.825111.2[42]
40–473.5–5.030–4410–221.5–2.5[43]
48–556–836–4014–173.5–4.5[44]
MicronutrientsFeMnZnCu
mg kg−1 DM1254137.54.5[42]
60–8030–14030–384.9–6.2[43]
35–4525–3520–404.0–5.5[44]
Table 4. Critical ranges of nutrient content in the leaves of winter oilseed rape at the beginning of flowering (BBCH 60).
Macronutrients NPKCaMgSource
g kg−1 DM40–553.5–7.028–5010–202.5–4.0[45]
33–643.4–6.929–5114–302.1–6.2[46]
37–445–627–4327–331.7–3.0[47]
MicronutrientsFeMnZnCu
mg kg−1 DM-30–10025–705–12[45]
-30–14030–384.9–6.2[46]
129–21425–4828–514.3–7.4[47]
Table 5. Nutrient content in the leaves of winter oilseed rape at the rosette stage (BBCH 30) and the biomass of rosette and seed yield in subsequent years of the study for three fertilization systems (FSs) and gradually increasing nitrogen rates.
FactorLevel of
Factor
NPKMgCaFeMnZnCuSYBR
g kg−1mg kg−1t ha−1
Year/season2015/1642.2 b2.6 c26.7 c1.9 b15.9 b244.2 a36.5 b26.2 b5.2 b3.2 a0.9 b
(Y)2016/1742.7 b4.5 a32.7 b2.3 a14.3 a132.1 c26.2 c26.0 b5.3 b3.3 a1.3 a
2017/1846.7 a3.2 b37.0 a1.5 c17.2 b189.2 b41.1 a62.0 a6.0 a2.0 b0.7 b
F-value, p34.0 ***271 ***110 ***237 ***11.2 ***222 *66.3 ***744 ***17.1 ***402 **150 ***
FertilizationAN44.23.433.5 a1.918.2 a182.5 b37.2 a38.5 a5.6 a2.7 b1.1 a
systemD43.33.531.3 b1.914.1 b199.5 a33.7 b39.7 a5.6 a2.8 b0.9 b
(FS)DAN44.13.531.5 b1.915.0 b183.4 b33.0 c36.0 b5.3 b3.0 a1.0 ab
F-value, p1.2 ns0.5 ns6.3 **1.4 ns25.2 ***6.5 **5.7 **6.1 **3.7 *19.9 ***4.5 *
Nitrogen 041.3 c3.631.51.8 b17.5 ab153.7 b34.7 b35.7 b5.51.6 d0.9 a
doses6043.1 bc3.432.01.9 ab18.1 a200.6 a36.3 b40.8 a5.52.8 c1.0 a
(N)12044.7 ab3.533.11.9 ab15.5 bc188.7 a32.1 b36.7 b5.53.1 a1.0 a
18044.8 ab3.332.21.9 a14.2 c202.4 a33.5 ab39.1 ab5.43.3 a0.9 a
24045.4 a3.531.91.9 a13.7 c196.8 a36.4 ab38.1 ab5.53.2 a1.0 a
F-value, p9.6 ***2.1 ns0.9 ns3.0 *12.5 ***17.2 ***2.4 ns4.1 **0.1 ns221 ***2.7 *
F-values for interactions
Y × FSnsnsns***************ns
Y × Nnsnsnsns************ns*****
FS × Nnsnsns**ns****ns*ns
Y × FS × Nnsnsns*************ns***ns
Mean 43.83.532.11.915.8188.534.638.15.51.02.8
Standard deviation2.90.84.70.44.156.610.417.90.50.30.9
Coefficient of variation,%6.723.614.720.525.730.029.947.09.328.333.0
***, **, and * indicate significance at p < 0.001, < 0.01, and < 0.05, respectively; ns—not significant; a, b, c, d significance letters: a—the highest, d—the lowest. Means followed by the same letter within a column indicate the lack of a significant difference between the treatments. Legend: N, P, K, Mg, and Ca—macronutrients: nitrogen, phosphorus, potassium, magnesium, and calcium, respectively; Fe, Mn, Zn, and Cu—micronutrients: iron, manganese, zinc, and copper, respectively; SY—seed yield; BR—biomass of rosettes.
Table 6. Spearman correlation matrix between nutrient content, biomass, and seed yield components and PCA factors.
VariablesRosettesLeaves—FloweringSTEMS—FLOWERING
PC1PC2PC3PC1PC2PC3PC1PC2PC3
N0.590.32−0.400.080.080.850.490.720.36
P−0.540.77−0.100.78−0.490.150.900.290.08
K0.470.81−0.10−0.640.560.35−0.200.830.42
Mg0.900.17−0.030.91−0.060.030.93−0.17−0.11
Ca0.260.040.800.370.720.360.530.71−0.14
Fe0.370.82−0.170.50−0.72−0.160.88−0.29−0.18
Mn0.74−0.17−0.290.57−0.390.470.92−0.23−0.13
Zn0.870.360.040.630.400.590.81−0.420.29
Cu0.700.39−0.250.63−0.660.140.670.300.49
SY−0.60−0.30−0.60−0.53−0.670.37−0.500.240.77
BR0.820.41−0.07
BL−0.58−0.610.30−0.510.320.67
BS0.95−0.170.170.88−0.100.35
Bold—correlation coefficients for R2 ≥ 0.50. Legend: N, P, K, Mg, and Ca—macronutrients: nitrogen, phosphorus, potassium, magnesium, and calcium, respectively; Fe, Mn, Zn, and Cu—micronutrients: iron, manganese, zinc, and copper, respectively; SY—seed yield; BR—biomass of rosettes; BL—biomass of leaves; BS—biomass of stems.
Table 7. Nutrient content in the leaves of winter oilseed rape at the beginning of flowering (BBCH 60) and the biomass of leaves and stems in subsequent years of the study for three fertilization systems (FSs) and gradually increasing nitrogen rates.
FactorLevel of
Factor
NPKMgCaFeMnZnCuBLBSBC
g kg−1mg kg−1t ha−1
Year/season2015/1638.6 b3.1 a29.0 c1.9 b16.1 b169.9 a58.4 a31.4 b5.5 a2.0 a2.8 b4.9 b
(Y)2016/1738.22.3 b43.2 a3.0 a16.7 b108.7 b35.6 c21.9 c3.5 c2.0 a5.0 a7.0 a
2017/1841.6 a2.8 a39.6 b1.7 c32.7 a113.6 b52.5 b50.4 a4.2 b1.3 b2.4 c3.7 c
F, p-values12.3 ***82.9 ***176 ***359 ***464 ***242 ***242 ***505 ***138 ***118 ***434 ***331 ***
FertilizationAN41.1 a2.6 b37.82.3 a25.1 a123.1 b49.135.6 a4.41.9 a3.6 a5.5 a
systemD38.7 b2.9 a37.62.1 b19.8 b137.6 a49.335.3 a4.41.7 b3.2 b4.8 b
(FS)DAN38.6 b2.6 b36.52.1 b20.5 b131.5 a48.132.9 b4.31.8 a3.4 b5.2 a
F, p-values7.0 **7.3 **1.7 ns7.0 ***47.8 ***11.1 ***0.7 ns5.4 **0.9 ns10.9 ***12.8 ***15.3 ***
Nitrogen 032.7 c2.733.9 c1.9 b21.5 ab133.745.7 b30.94.2 b1.3 d2.4 c3.7 c
doses6038.4 b2.736.3 bc2.2 a21.4 b125.740.6 d31.54.4 b1.7 c3.3 b5.0 b
(ND)12041.6 a2.837.4 ab2.3 a20.6 b134.952.1 ab33.14.3 b1.9 ab3.7 a5.7 a
18042.0 a2.839.5 a2.3 a22.0 ab131.250.3 b38.54.5 a2.1 a3.9 a6.0 a
24042.5 a2.639.4 a2.3 a23.6 a128.255.3 a38.84.5 a1.9 b3.8 a5.7 a
F, p-values35.6 ***1.1 ns10.7 ***11.8 ***3.8 **1.9 ns34.3 ***21.2 ***0.2 ns44.0 **49.4 ***60.5 ***
F-values for interactions
Y × FSnsnsnsnsns*******************
Y × N***ns*ns************************
FS × N***nsns**********ns*********
Y × FS × N*nsnsns************ns*********
Mean 39.52.737.32.221.8130.848.834.64.41.83.45.2
Standard deviation5.30.46.80.69.134.214.514.00.90.61.41.9
Coefficient of variation,%13.314.018.328.741.526.229.640.521.032.941.736.3
***, **, * indicate significance at p < 0.001, <0.01, and <0.05, respectively; ns—not significant; a, b, c, d significance letters: a—the highest, d—the lowest; a means within a column followed by the same letter indicate a lack of significant difference between the treatments. Legend: N, P, K, Mg, and Ca—macronutrients: nitrogen, phosphorus, potassium, magnesium, and calcium, respectively; Fe, Mn, Zn, and Cu—micronutrients: iron, manganese, zinc, and copper, respectively; BL—biomass of leaves; BS—biomass of stems; BC—total biomass of the winter oilseed rape canopy.
Table 8. Nutrient content in the stems of winter oilseed rape at the beginning of flowering (BBCH 60) in subsequent years of the study for three fertilization systems (FSs) and gradually increasing nitrogen rates.
FactorLevel of
Factor
NPKMgCaFeMnZnCu
g kg−1mg kg−1
Year/season2015/1625.5 b3.3 a37.0 b2.1 b12.5 b56.8 c27.6 b34.3 b5.2 a
(Y)2016/1725.4 b2.3 b43.3 a3.0 a13.6 b216.0 a132.4 a22.3 c3.5 c
2017/1832.1 a3.2 a43.9 a2.0 b36.7 a72.2 b31.9 b46.5 a4.4 b
F. p-values71.2 ***176 ***59.3 ***195 ***279 ***1355 ***940 ***195 ***87.8 ***
FertilizationAN27.92.9 b41.42.4 a26.7 a115.560.134.64.5
systemD27.93.1 a41.42.3 ab17.2 b118.165.935.04.3
(FS)DAN27.22.9 b41.42.3 b18.9 b111.466.033.64.3
F. p-values0.8 ns5.8 **0.1 ns3.9 *37.9 ***2.0 ns3.0 ns0.7 ns0.9 ns
Nitrogen 023.5 c3.036.4 d2.321.5 a121.2 a66.0 ab28.6 c4.0 b
doses6026.4 b3.039.9 c2.415.9 b108.0 b54.3 c32.6 bc4.3 ab
(N)12028.9 a3.042.2 bc2.321.0 a118.4 a64.3 ab36.6 ab4.5 a
18029.7 a3.043.5 ab2.321.7 a107.3 b62.3 b36.2 ab4.4 ab
24029.8 a2.845.1 a2.424.6 a120.1 a73.0 a37.9 a4.5 a
F. p-values21.3 ***1.3 ns23.4 ***0.8 ns8.7 ***4.9 **7.4***11.3 ***2.9 *
F-values for interactions
Y × FSnsnsnsns***nsns
Y × N**nsnsnsns******ns***
FS × N***ns***********ns
Y × FS × Nnsnsnsns***********
Mean 27.73.041.42.320.9115.064.034.44.4
Standard deviation4.60.54.80.513.475.551.311.60.9
Coefficient of variation,%16.817.011.620.263.965.780.233.820.6
***, **, and * indicate significance at p < 0.001, < 0.01, and < 0.05, respectively; ns—not significant; a, b, c, d significance letters: a—the highest, d—the lowest; a means within a column followed by the same letter indicate a lack of significant difference between the treatments. Legend: N, P, K, Mg, and Ca—macronutrients: nitrogen, phosphorus, potassium, magnesium, and calcium, respectively; Fe, Mn, Zn, and Cu—micronutrients: iron, manganese, zinc, and copper, respectively.
Disclaimer/Publisher’s Note: The statements, opinions and data contained in all publications are solely those of the individual author(s) and contributor(s) and not of MDPI and/or the editor(s). MDPI and/or the editor(s) disclaim responsibility for any injury to people or property resulting from any ideas, methods, instructions or products referred to in the content.