Research on Monitoring Nitrogen Content of Soybean Based on Hyperspectral Imagery

 ,
,  , and
, and
Abstract
1. Introduction
2. Materials and Methods
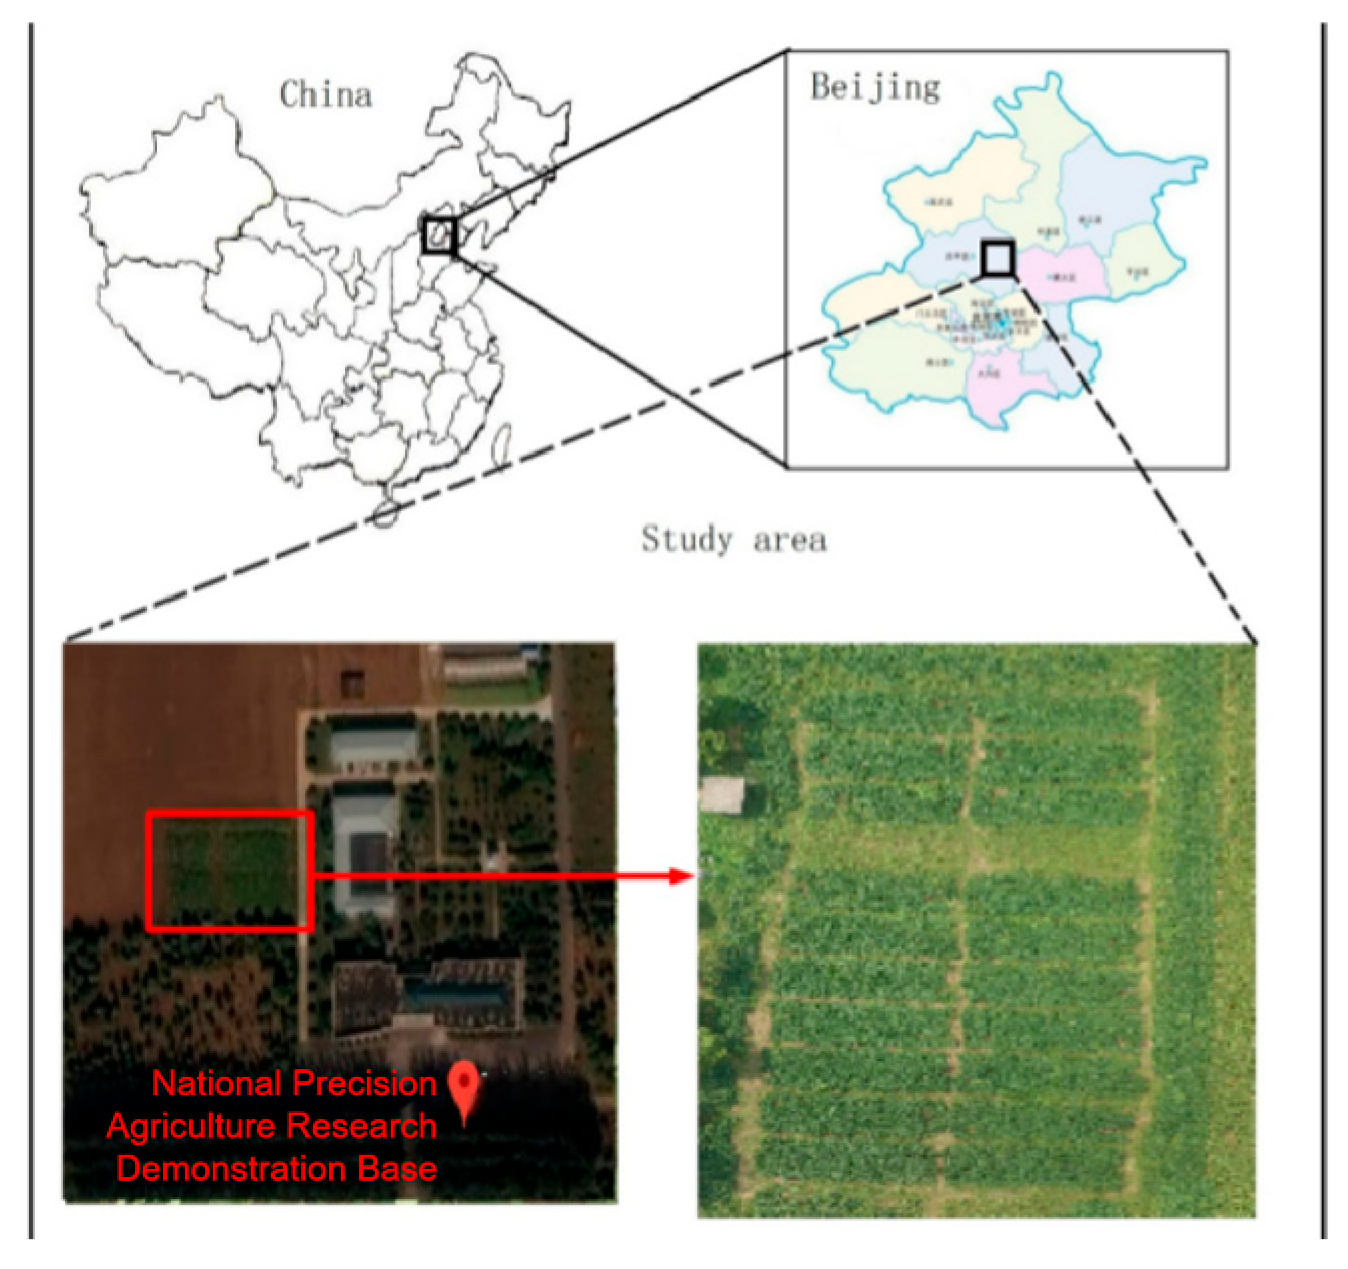
2.1. Experimental Materials
2.2. Hyperspectral Imaging Data Acquisition
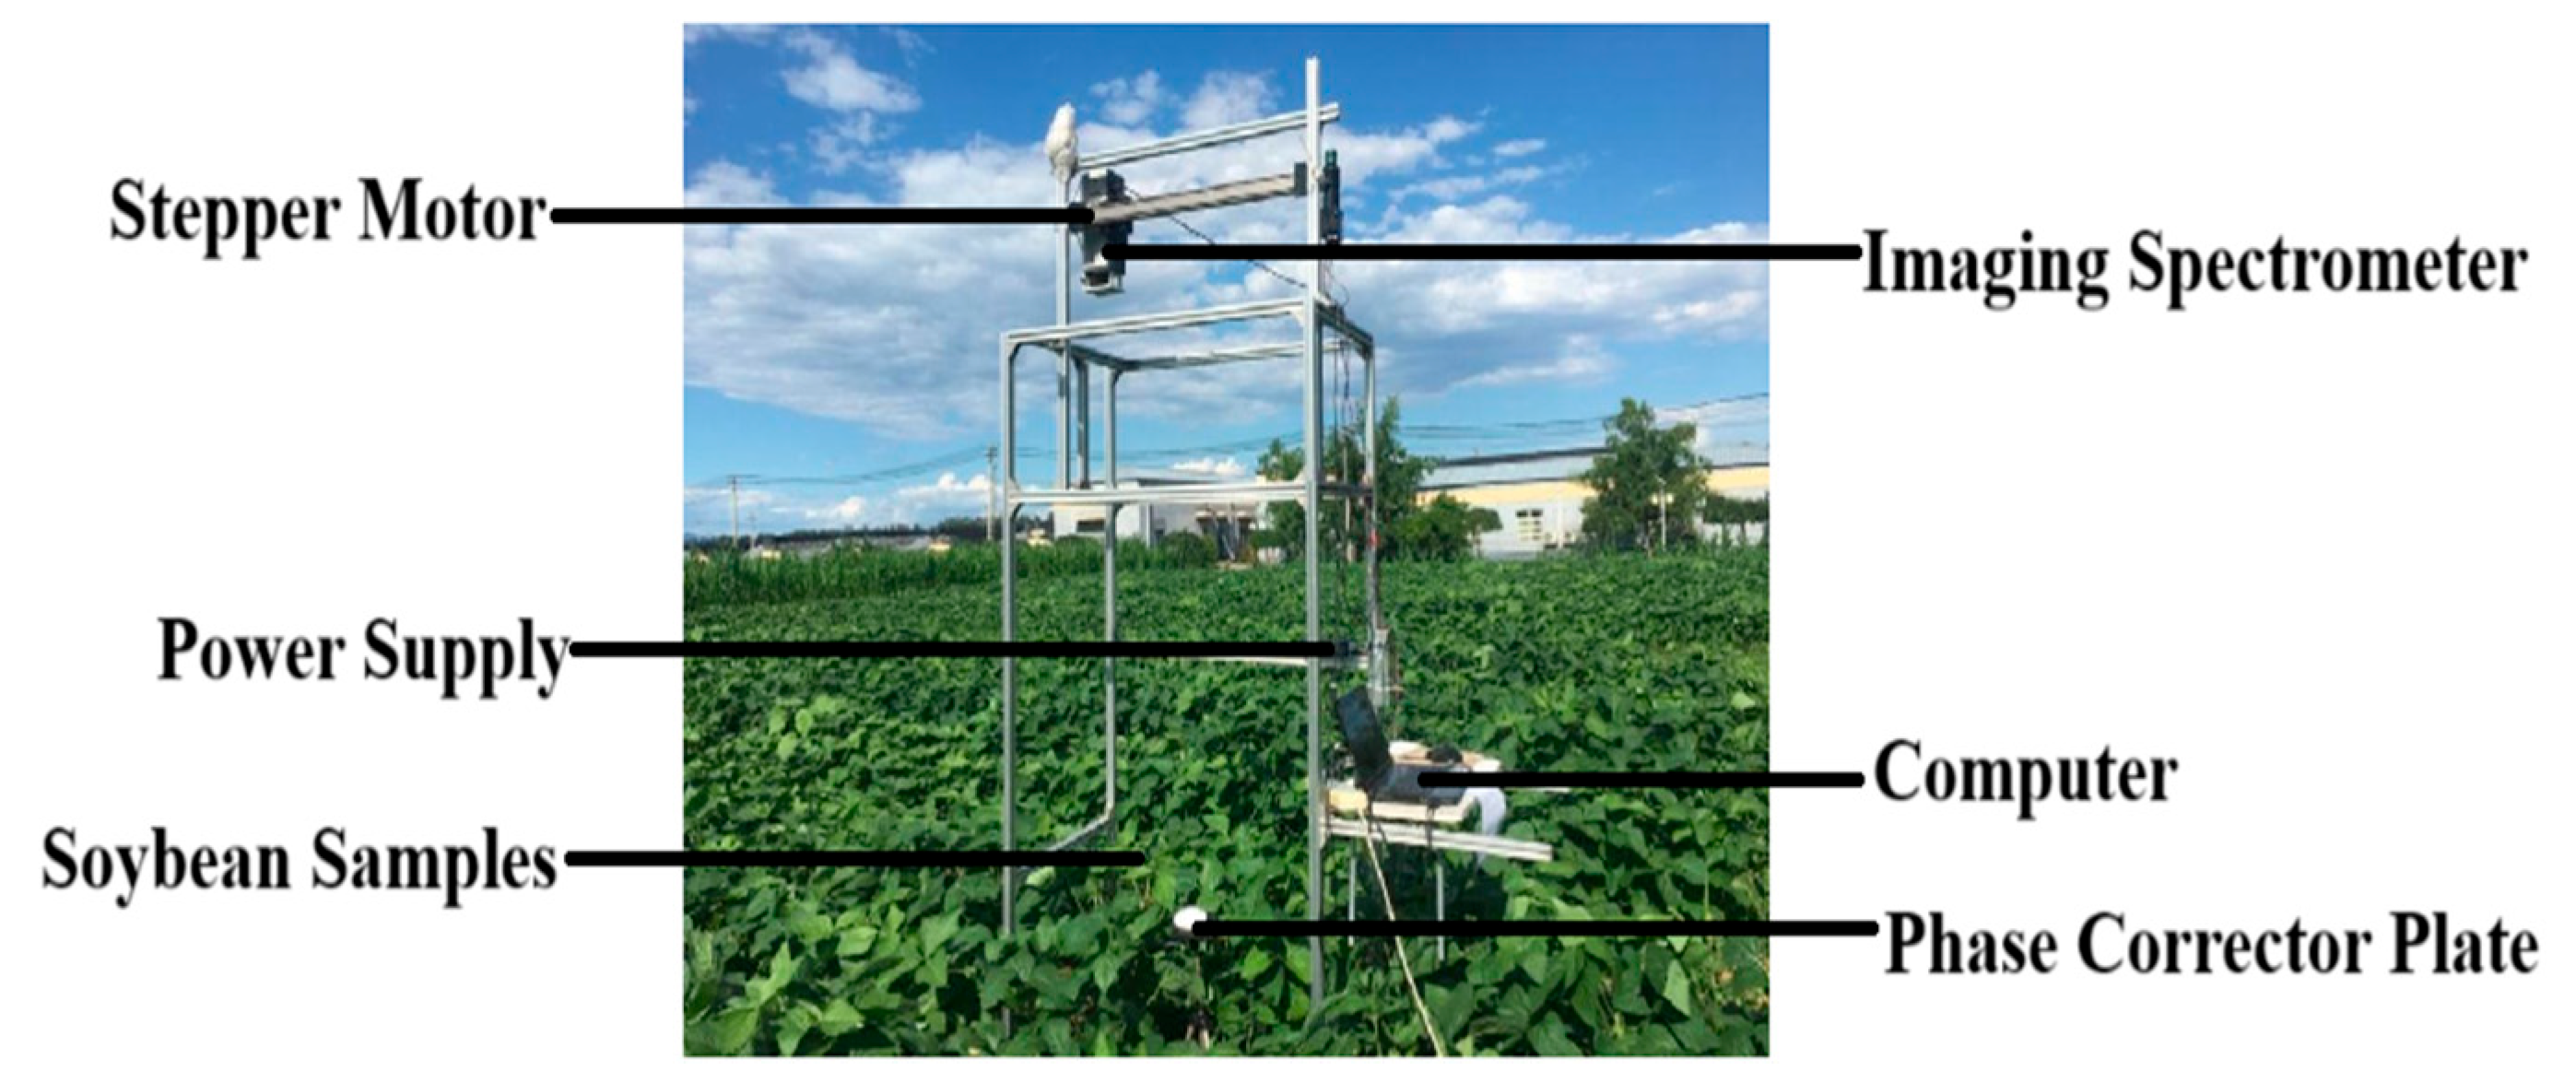
2.2.1. Hyperspectral Imaging Data Acquisition of Soybean at Canopy Scale
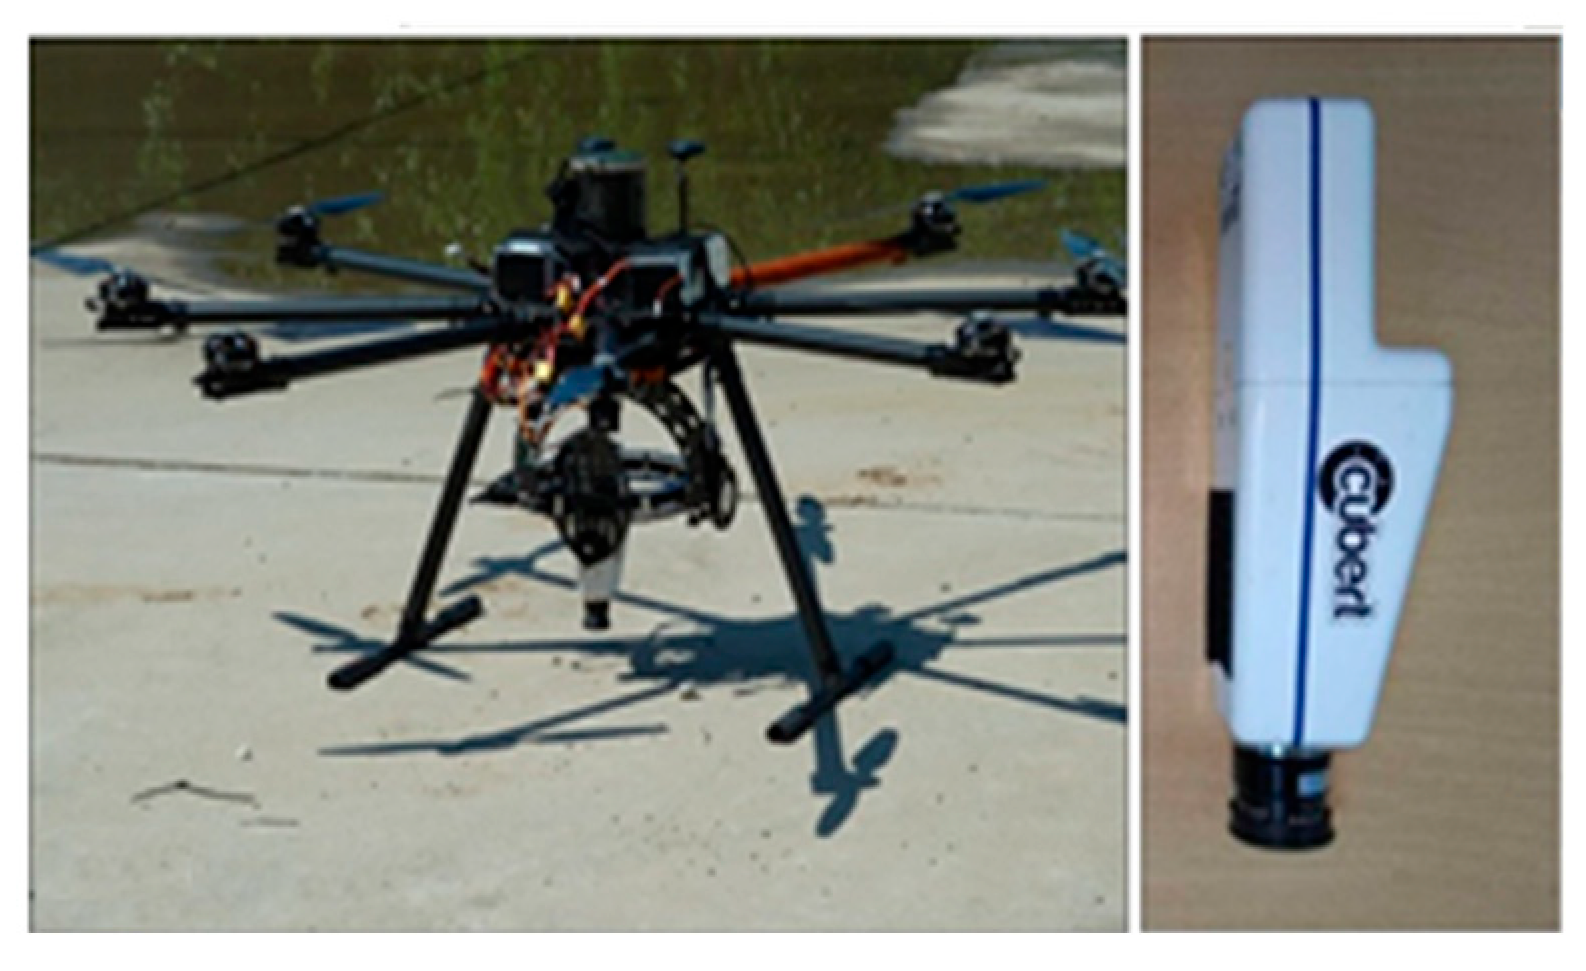
2.2.2. UAV Hyperspectral Imaging Data Acquisition
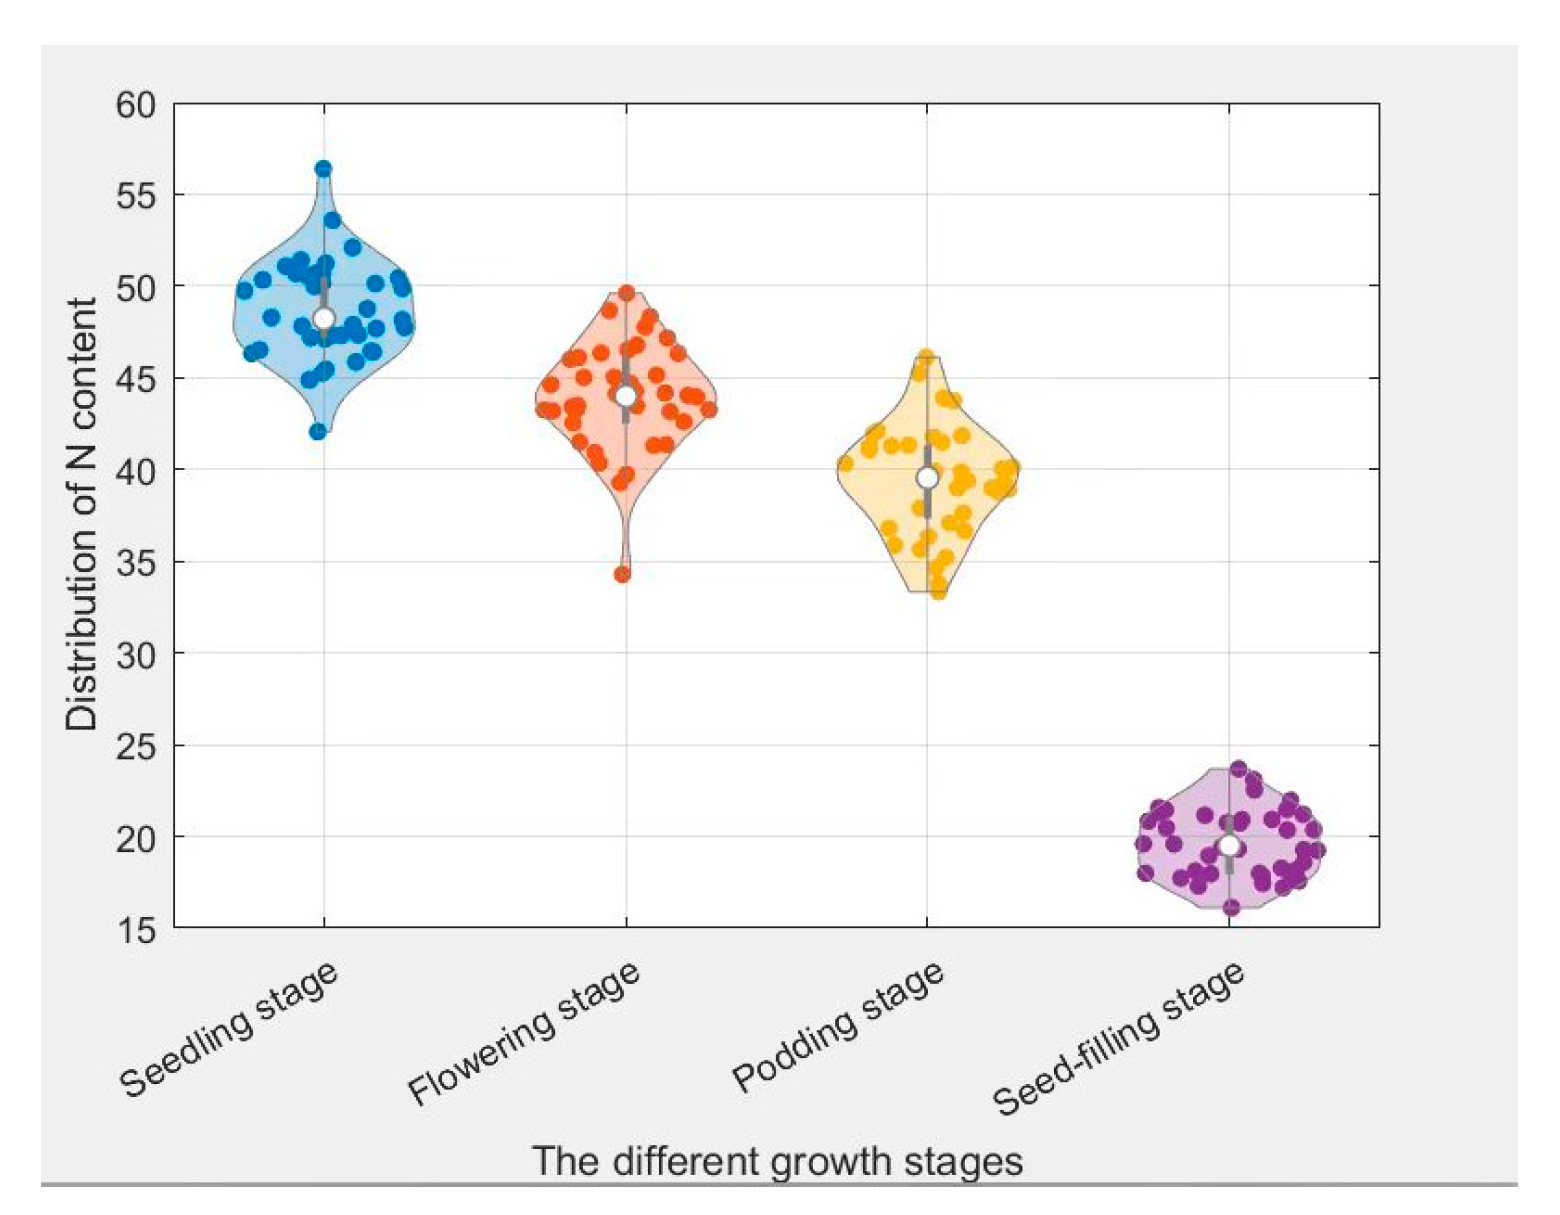
2.3. Determination and Data Division of Soybean Nitrogen Content
2.4. Selection Method of Spectral Characteristic Variables
2.5. Model Construction
2.6. Model Evaluation
3. Results
3.1. Correlation Analysis Between Spectral Reflectance and Soybean Canopy Nitrogen Content
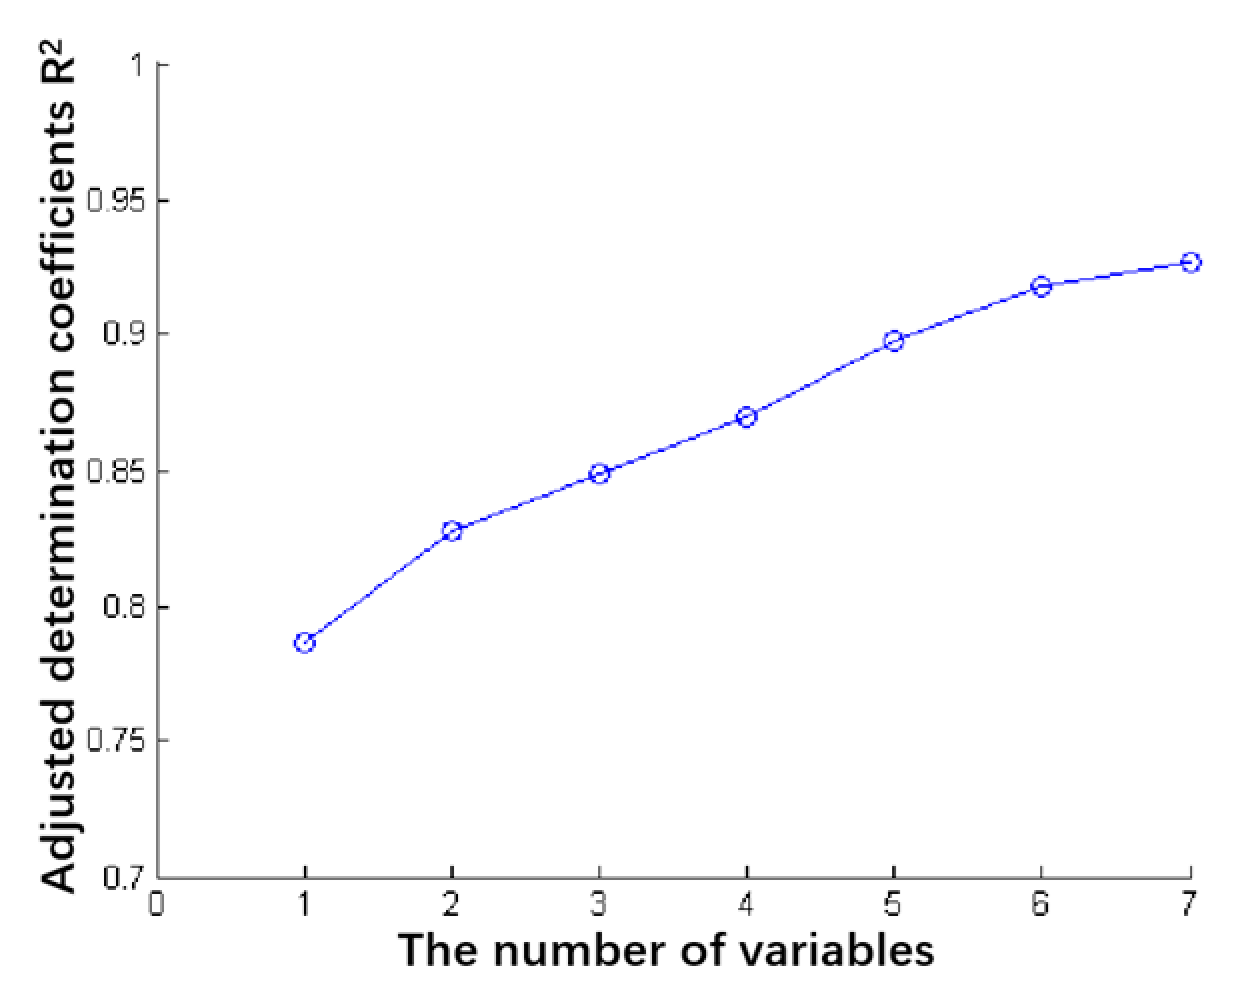
3.2. Stepwise Regression Analysis Between Spectral Reflectance and Soybean Canopy Nitrogen Content
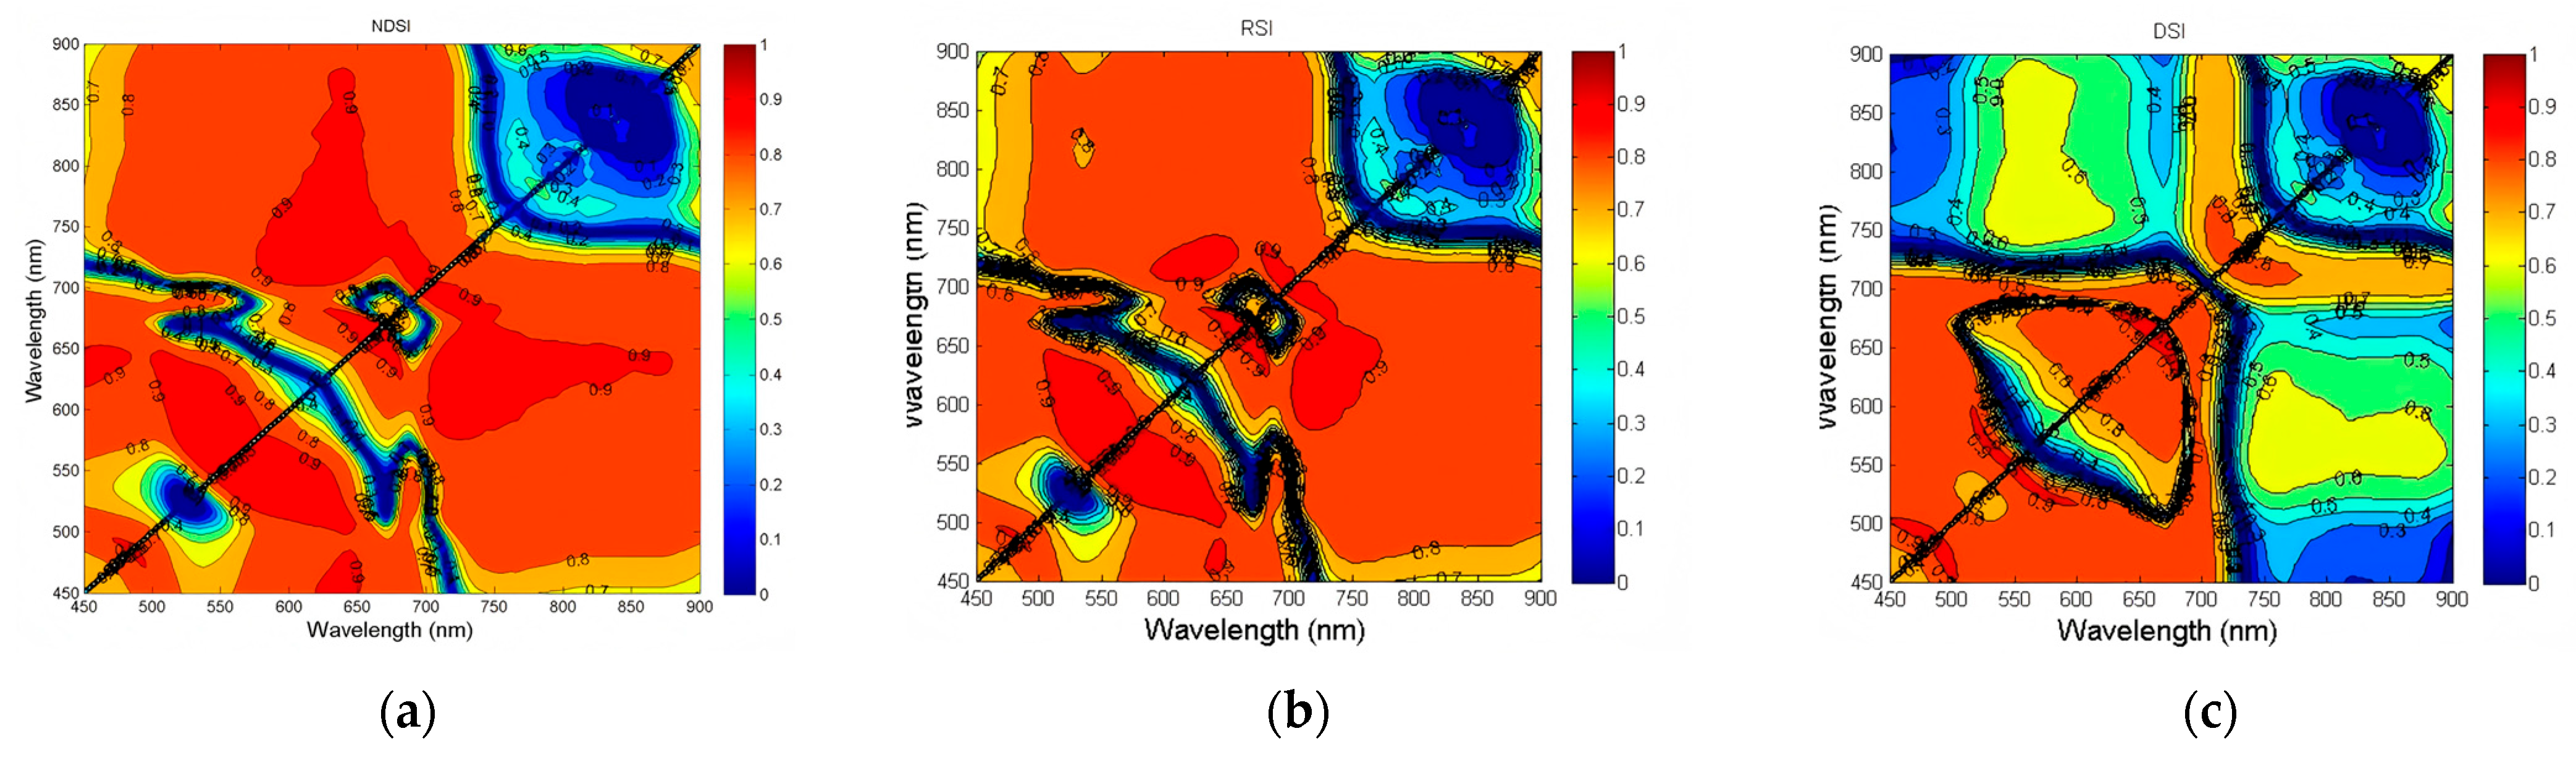
3.3. Spectral Index Construction and Correlation Analysis for Soybean Canopy Nitrogen Content
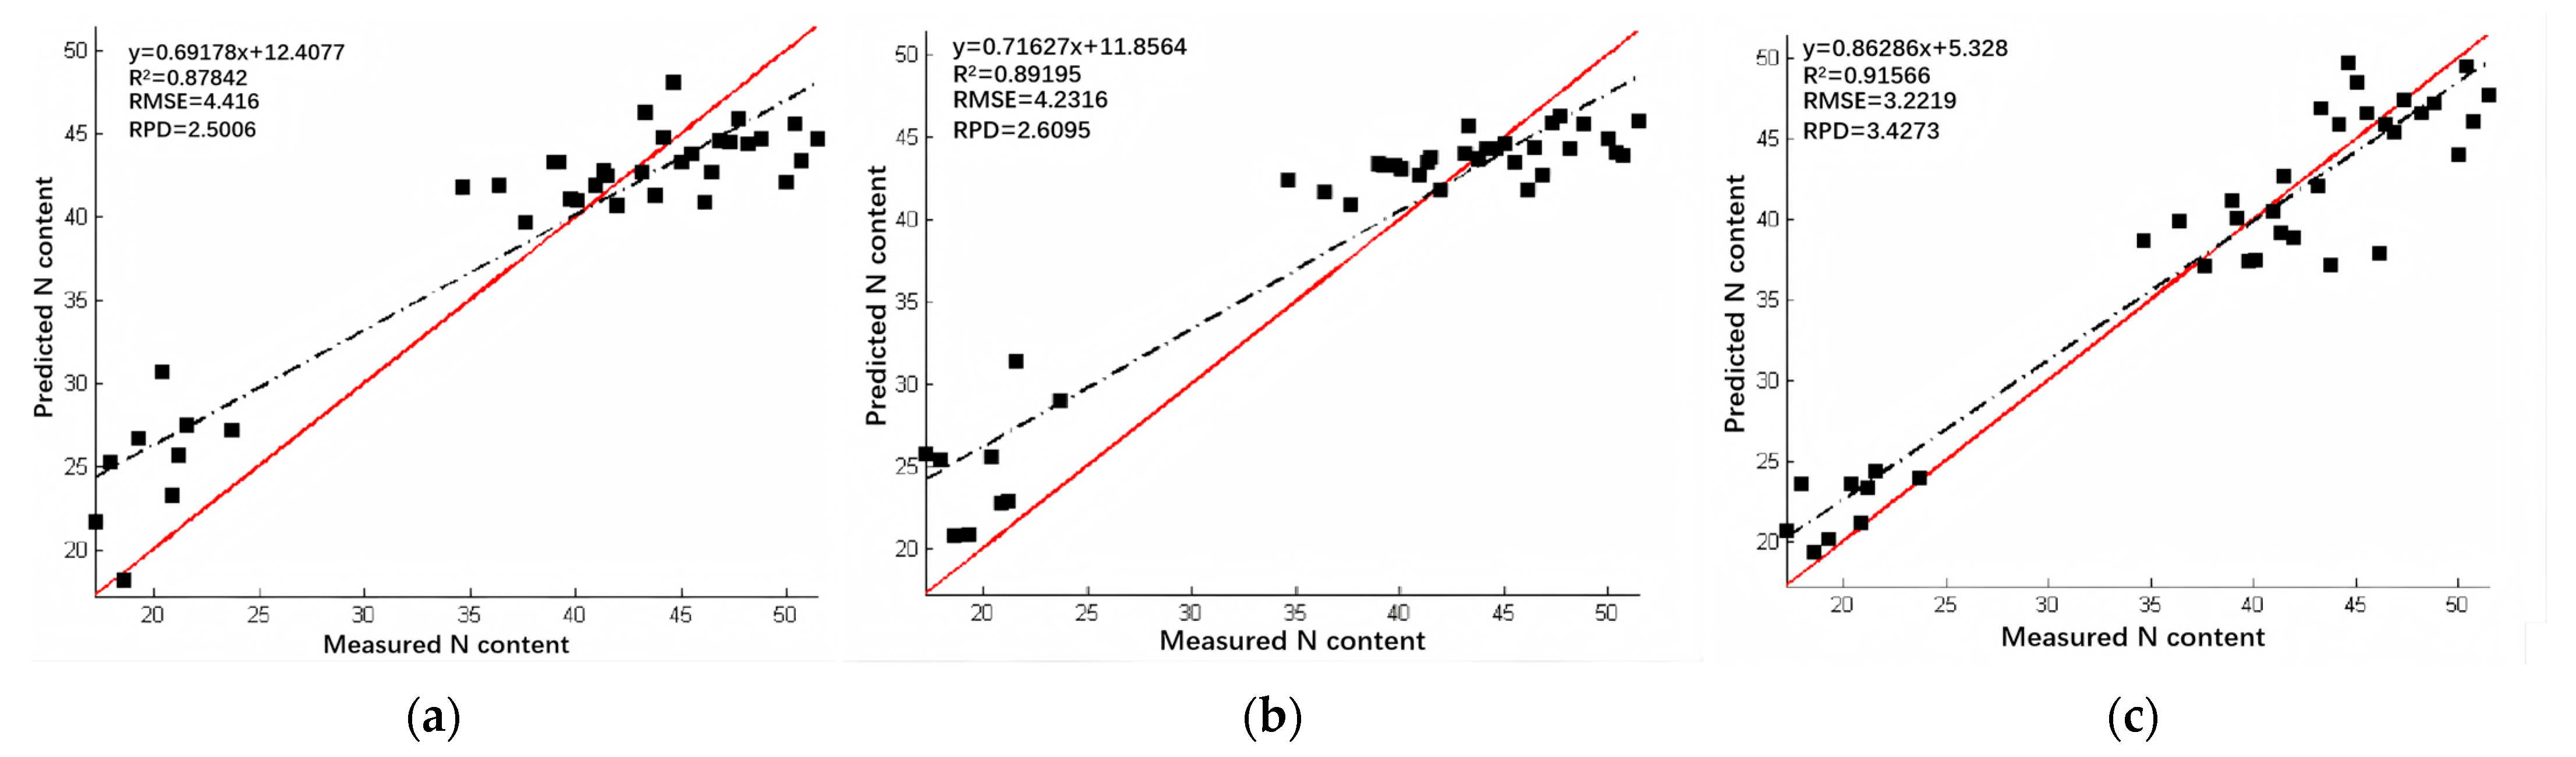
3.4. Construction and Validation of Prediction Model for Soybean Canopy Nitrogen Content
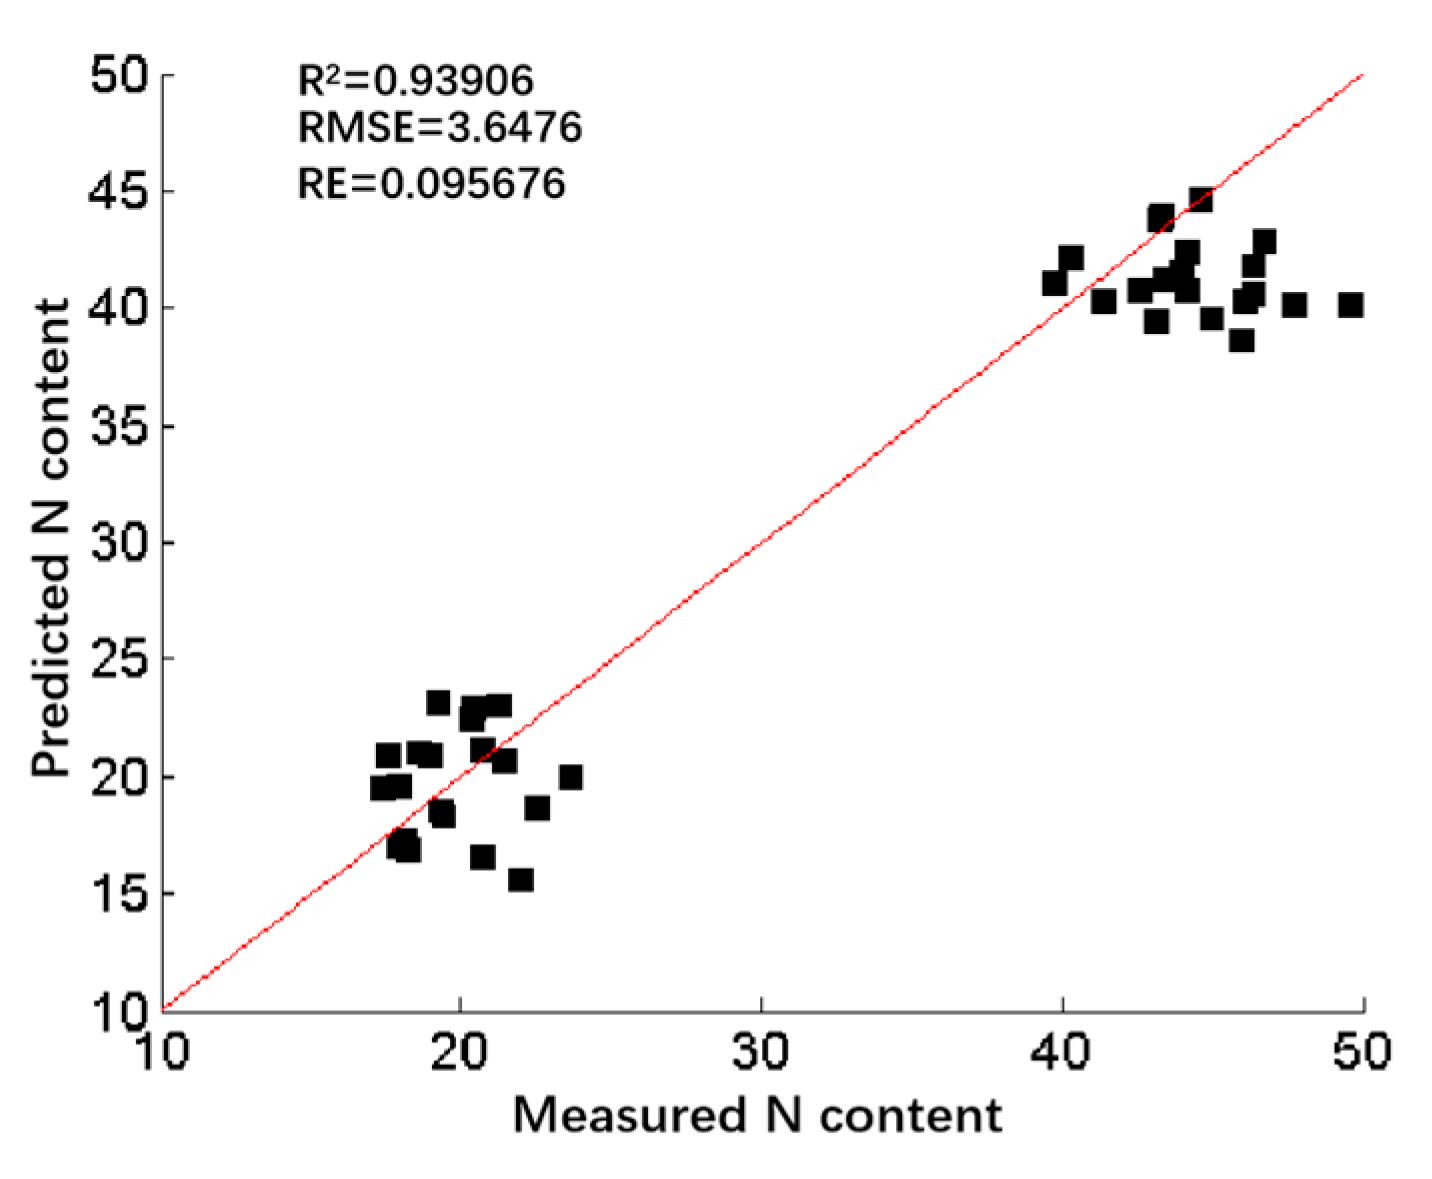
3.5. Spatial Inversion and Accuracy Evaluation of Soybean Nitrogen Content Based on UAV Hyperspectral Imagery
4. Discussion
5. Conclusions
- (1)
- In this study, the correlation between soybean canopy spectral reflectance and soybean canopy nitrogen content was analyzed. It was found that the soybean canopy spectral reflectance was significantly negatively correlated with the soybean canopy nitrogen content in the spectral range of 450~738 nm (p < 0.01), and the soybean canopy spectral reflectance was significantly positively correlated with the soybean canopy nitrogen content in the spectral range of 756~774 nm (p < 0.01). The negative correlation coefficients achieved extreme values at 513 nm, 630 nm, and 678 nm, which were −0.8364, −0.8908, and −0.8790, respectively.
- (2)
- After comparing the performance of the correlation coefficient method, stepwise regression method, and spectral index method in selecting the spectral characteristic variables closely related to soybean canopy nitrogen content, it was found that the spectral characteristic variables of NDSI(R552,R555), RSI(R537,R573), and DSI(R540,R555) were closely related to the soybean canopy nitrogen content. The prediction model for soybean canopy nitrogen content based on NDSI(R552,R555), RSI(R537,R573), and DSI(R540,R555) was optimal, with a determination coefficient and root mean square error of 0.9063 and 3.3229 for the calibration set, respectively, and of 0.91566 and 3.2219 for the prediction set, respectively.
- (3)
- To demonstrate the adaptability of the established prediction model with few parameters and a simple structure for soybean canopy nitrogen content, spatial distribution maps for soybean nitrogen content at the flowering and seed filling stages were generated based on the UAV hyperspectral image. Forty measurements of soybean nitrogen content in the field were used to compare with the predicted values at the corresponding locations in the distribution map of soybean nitrogen content. It was found that the predicted values of the spatial distribution map of soybean nitrogen content had good consistency with the measured values, with a coefficient of determination, root mean square error, and mean relative error of 0.93906, 3.6476, and 9.5676%, respectively. This shows that the established prediction model for soybean canopy nitrogen content had high prediction accuracy and reliability. In addition, the results of spatial calculation for soybean nitrogen content in UAV images were basically consistent with the measured nitrogen content on the ground. This shows that the soybean nitrogen content model established in this study could be used for the inversion of nitrogen content at the UAV scale, which is of great significance for realizing the rapid, dynamic, and non-destructive monitoring of soybean nitrogen nutrient nutritional status at regional scale, and provides a research foundation for the fine management of nitrogen fertilizer during the growth process of soybean.
Author Contributions
Funding
Data Availability Statement
Acknowledgments
Conflicts of Interest
References
- Ma, Y.; Kan, G.; Zhang, X.; Wang, Y.; Zhang, W.; Du, H.; Yu, D. Quantitative Trait Loci (QTL) Mapping for Glycinin and β-Conglycinin Contents in Soybean (Glycine max L. Merr.). J. Agric. Food Chem. 2016, 64, 3473–3483. [Google Scholar] [CrossRef] [PubMed]
- Li, Y.; Sun, J.; Wu, X.; Chen, Q.; Lu, B.; Dai, C. Detection of viability of soybean seed based on fluorescence hyperspectra and CARS-SVM-AdaBoost model. J. Food Process. Preserv. 2019, 43, e14238. [Google Scholar] [CrossRef]
- Bureau of Statistics of the China. China Statistical Yearbook; China Statistics Press: Beijing, China, 2022.
- Hong, G.; Han, M.; Ikram, U. Analysis of Metabolomic Changes in Lettuce Leaves under Low Nitrogen and Phosphorus Deficiencies Stresses. Agriculture 2020, 10, 406. [Google Scholar] [CrossRef]
- Zhang, L.; Song, X.; Niu, Y.; Zhang, H.; Wang, A.; Zhu, Y.; Zhu, X.; Chen, L.; Zhu, Q. Estimating Winter Wheat Plant Nitrogen Content by Combining Spectral and Texture Features Based on a Low-Cost UAV RGB System throughout the Growing Season. Agriculture 2024, 14, 456. [Google Scholar] [CrossRef]
- Zhang, Y.K.; Luo, B.; Pan, D.Y.; Song, P.; Lu, W.C.; Wang, C.; Zhao, C.J. Estimation of Canopy Nitrogen Content of Soybean Crops Based on Fractional Differential Algorithm. Spectrosc. Spectr. Anal. 2018, 38, 3221–3230. [Google Scholar]
- Lu, W.Z.; Yuan, H.F.; Xu, G.T. Modern Techniques of Near Infrared Spectroscopy; China Petrochemical Press: Beijing, China, 2000. [Google Scholar]
- Wu, X.; Liang, X.; Wang, Y.; Wu, B.; Sun, J. Non-Destructive Techniques for the Analysis and Evaluation of Meat Quality and Safety: A Review. Foods 2022, 11, 3713. [Google Scholar] [CrossRef]
- Zhang, Y.; Sun, J.; Li, J.; Wu, X.; Dai, C. Quantitative Analysis of Cadmium Content in Tomato Leaves Based on Hyperspectral Image and Feature Selection. Appl. Eng. Agric. 2018, 34, 789–798. [Google Scholar] [CrossRef]
- Wang, F.; Lin, H.; Xu, P.; Bi, X.; Sun, L. Egg Freshness Evaluation Using Transmission and Reflection of NIR Spectroscopy Coupled Multivariate Analysis. Foods 2021, 10, 2176. [Google Scholar] [CrossRef]
- Muhammad, Z.; Muhammad, A.; Md, H.M.; Shujat, A.; Ou, Q.; Huan, L. Application of benchtop NIR spectroscopy coupled with multivariate analysis for rapid prediction of antioxidant properties of walnut (Juglans regia). Food Chem. 2021, 359, 129928. [Google Scholar]
- Guo, Z.; Wang, M.; Wu, J.; Tao, F.; Chen, Q.; Wang, Q.; Zou, X. Quantitative assessment of zearalenone in maize using multivariate algorithms coupled to Raman spectroscopy. Food Chem. 2019, 286, 282–288. [Google Scholar] [CrossRef]
- Zhang, J.; Wu, X.; He, C.; Wu, B.; Zhang, S.; Sun, J. Near-infrared spectroscopy combined with fuzzy improved direct linear discriminant analysis for nondestructive discrimination of chrysanthemum tea varieties. Foods 2024, 13, 1439. [Google Scholar] [CrossRef]
- Shi, J.; Wang, Y.; Li, Z.; Huang, X.; Shen, T.; Zou, X. Simultaneous and nondestructive diagnostics of nitrogen/magnesium/potassium-deficient cucumber leaf based on chlorophyll density distribution features. Biosyst. Eng. 2021, 212, 458–467. [Google Scholar] [CrossRef]
- Sun, X.; Wang, F.; Zhao, X.; Xie, W.; Guo, X. The estimation modeI of rice leaf nitrogen concentration based on canopy spectrum and BP neural network. Chin. J. Agric. Resour. Reg. Plan. 2019, 40, 35–44. [Google Scholar]
- Yu, H.; Qian, X. Study on the lag time of nitrogen efficiency of maize under different water and fertilizer coupling modes. Tillage Cultiv. 2012, 3–4. Available online: https://link.cnki.net/doi/10.13605/j.cnki.52-1065/s.2012.01.006 (accessed on 25 April 2025).
- Schlemmer, M.; Gitelson, A.; Schepers, J.; Ferguson, R.; Peng, Y.; Shanahan, J.; Rundquist, D. Remote estimation of nitrogen and chlorophyll contents in maize at leaf and canopy levels. Int. J. Appl. Earth Obs. Geoinf. 2013, 25, 47–54. [Google Scholar] [CrossRef]
- Tang, Y.; Li, F.; Hu, Y.; Yu, K. NTRI: A novel spectral index for developing a precise nitrogen diagnosis model across pre- and post-anthesis stages of maize plants. Field Crops Res. 2025, 325, 109829. [Google Scholar] [CrossRef]
- Liu, C.; Yu, H.; Liu, Y.; Zhang, L.; Li, D.; Zhang, J.; Sui, Y. Prediction of anthocyanin content in purple-leaf lettuce based on spectral features and optimized extreme learning machine algorithm. Agronomy 2024, 14, 2915. [Google Scholar] [CrossRef]
- Zhang, Y.; Guan, M.; Wang, L.; Cui, X.; Li, T.; Zhang, F. In Situ Nondestructive Detection of Nitrogen Content in Soybean Leaves Based on Hyperspectral Imaging Technology. Agronomy 2024, 14, 806. [Google Scholar] [CrossRef]
- Tang, Z.; Wang, X.; Xiang, Y.; Liang, J.; Guo, J.; Li, W.; Zhang, F. Application of hyperspectral technology for leaf function monitoring and nitrogen nutrient diagnosis in soybean (Glycine max L.) production systems on the Loess Plateau of China. Eur. J. Agron. 2024, 154, 127098. [Google Scholar] [CrossRef]
- Chen, J.; Li, F.; Wang, R.; Fan, Y.; Raza, M.A.; Liu, Q.; Yang, W. Estimation of nitrogen and carbon content from soybean leaf reflectance spectra using wavelet analysis under shade stress. Comput. Electron. Agric. 2019, 156, 482–489. [Google Scholar] [CrossRef]
- Zheng, W.; Rui, G.; Wen, L.; Yong, N.; De, J. Effects of nitrogen, phosphorus and potassium fertilizers on dry matter accumulation and yield of soybean. Soybean Sci. 2008, 27, 588–592+598. [Google Scholar]
- Limin, H. Effects of formula application of nitrogen, phosphorus and potassium fertilizers on soybean yield and economic benefits. Misc. Crops 2003, 174–175. [Google Scholar]
- Shan, H. Research on Spectral Estimation of Soybean Nitrogen Nutrition Under Different Nitrogen Levels and Cropping Patterns. Ph.D. Thesis, Sichuan Agricultural University, Sichuan, China, 2015. [Google Scholar]
- Shu, W.; Yong, M.; Yong, J. Effect of optimized fertilization of nitrogen, phosphorus and potassium on the yield of summer soybean. Soybean Sci. Technol. 2009, 37–41. [Google Scholar]
- Tsakiridis, N.L.; Samarinas, N.; Kokkas, S.; Kalopesa, E.; Tziolas, N.V.; Zalidis, G.C. In situ grape ripeness estimation via hyperspectral imaging and deep autoencoders. Comput. Electron. Agric. 2023, 212, 108098. [Google Scholar] [CrossRef]
- Herold, M.; Roberts, D.A.; Gardner, M.E.; Dennison, P.E. Spectrometry for urban area remote sensing—Development and analysis of a spectral library from 350 to 2400 nm. Remote Sens. Environ. 2004, 91, 304–319. [Google Scholar] [CrossRef]
- XU, X.G.; ZHAO, C.J.; WANG, J.H.; Li, C.J.; Yang, X.D. Nitrogen content monitoring of barley leaves based on new visible-near-infrared spectral characteristics and optimal combination principle. J. Infrared Millim. Waves 2013, 32, 351–358. [Google Scholar] [CrossRef]
- Chunrui, G.; Hao, L.; Jiachen, W.; Xin, Z.; Kunming, H.; Xiaoyan, S. Combined use of spectral resampling and machine learning algorithms to estimate soybean leaf chlorophyll. Comput. Electron. Agric. 2024, 218, 108675. [Google Scholar]
- Yachun, M.; Jie, W.; Wang, C.; Ruibo, D.; Shijia, W.; Yanhua, F.; Mengyuan, X. Research on fusion algorithm based on the imaging spectrum of saddle mountain type iron ore. Spectrosc. Spectr. Anal. 2024, 44, 2620–2625. [Google Scholar]
- Shuangya, W.; Nan, S.; Junwei, L.; Qianwen, G.; Huibing, Y.; Zhiqiang, G. Estimating Chlorophyll Fluorescence Parameters of Rice (Oryza sativa L.) Based on Spectrum Transformation and a Joint Feature Extraction Algorithm. Agronomy 2023, 13, 337. [Google Scholar] [CrossRef]
- Zhu, Y.L.; Li, P.P.; Sun, D.M.; Mao, H.P. Rapid detection method of total nitrogen content in organic matrix based on characteristic spectrum extraction. J. Agric. Mach. 2011, 42, 175–177+192. [Google Scholar]
- Hu, S.; Bao, Y. L. Phenotypic feature extraction of spring wheat based on UAV hyperspectral remote sensing. Agric. Technol. 2024, 44, 1–5. [Google Scholar]
- Liu, K.; Chen, X.; Li, L.; Chen, H.; Ruan, X.; Liu, W. A consensus successive projections algorithm–multiple linear regression method for analyzing near infrared spectra. Anal. Chim. Acta 2015, 858, 16–23. [Google Scholar] [CrossRef]
- Kamruzzaman, M.; Barbin, D.; Elmasry, G.; Sun, D.; Allen, P. Potential of hyperspectral imaging and pattern recognition for categorization and authentication of red meat. Innov. Food Sci. Emerg. Technol. 2012, 16, 316–325. [Google Scholar] [CrossRef]
- Du, Z.; Hu, Y.; Buttar, A.N. Analysis of mechanical properties for tea stem using grey relational analysis coupled with multiple linear regression. Sci. Hortic. 2020, 260, 108886. [Google Scholar] [CrossRef]
- Zeng, P.Z.; Wang, W.; Yuan, M.X.; Yang, F.Z. Inverse study on canopy nitrogen content of apple trees based on UAV remote sensing. Shandong Agric. Sci. 2024, 56, 167–173. [Google Scholar] [CrossRef]
- Sun, R. Research on Remote Sensing Monitoring of Wheat Leaf Rust Based on Near-Earth Hyperspectral and Unmanned Aerial Imagery. Ph.D. Thesis, Yangzhou University, Yangzhou, China. Available online: https://link.cnki.net/doi/10.27441/d.cnki.gyzdu.2021.000559 (accessed on 24 April 2025).
- Jianfu, C.; Yunkai, Y.; Hongyu, F.; Mingzhi, X.; Xin, J.; Liaoao, W. Estimation of nitrogen content in ramie leaves based on multi-scale hyperspectral technology. Shandong Agric. Sci. 2025, 57, 165–171. [Google Scholar]
- WenFeng, H.; WeiHao, T.; Chuang, L. Estimation of nitrogen content in rubber tree leaves based on near-infrared spectroscopy and hybrid learning framework. Spectrosc. Spectr. Anal. 2023, 43, 2050–2058. [Google Scholar]
- Faxu, G. Research on estimation of potato canopy water and nitrogen parameters based on UAV hyperspectral remote sensing. Ph.D. Thesis, Gansu Agricultural University, Gansu, China, 2024. [Google Scholar]
- Jinyang, L.; Meiqing, L.; Hanping, M.; Wenjing, Z. Diagnosis of potassium nutrition level in Solanum lycopersicum based on electrical impedance. Biosyst. Eng. 2016, 147, 130–138. [Google Scholar] [CrossRef]
- Zhu, W.; Li, J.; Li, L.; Wang, A.; Wei, X.; Mao, H. Nondestructive diagnostics of soluble sugar, total nitrogen and their ratio of tomato leaves in greenhouse by polarized spectra–hyperspectral data fusion. Int. J. Agric. Biol. Eng. 2020, 13, 189–197. [Google Scholar] [CrossRef]
- Xiao, Z.; Pei, W.; Han, M.; Hong, G.; Qing, L. Detection of the nutritional status of phosphorus in lettuce using THz time-domain spectroscopy. Eng. Agric. 2021, 41, 599–608. [Google Scholar]
- Jin, L.; Xu, Y.; Qiao, W.; Chu, Z.; Yong, H. Predictive modeling of nitrogen content in citrus plant leaves by hyperspectral imaging. Spectrosc. Spectr. Anal. 2014, 34, 212–216. [Google Scholar]
- Guo, F.; Feng, Q.; Yang, S.; Yang, W. Estimation of Potato Canopy Nitrogen Content Based on Hyperspectral Index Optimization. Agronomy 2023, 13, 1693. [Google Scholar] [CrossRef]
- Wang, Y.W.; Ma, X.; Tan, S.Y.; Jia, X.N.; Chen, J.Y.; Qin, Y.J.; Hu, X.H.; Zheng, H.W. Multimodal data fusion of unmanned aircraft remote sensing and ground observation for inversion of rice nitrogen content. J. Agric. Eng. 2024, 40, 100–109. [Google Scholar]
- Wang, B. Inversion of Nitrogen Content in Rice Canopy Based on UAV Hyperspectral Imagery. Ph.D. Thesis, Chengdu University of Technology, Chengdu, China, 2023. [Google Scholar]


| Total Nitrogen (%) | Organic Matter Content (%) | Rapidly Available Potassium (mg/kg) | Available Phosphorus (mg/kg) | Copper (mg/kg) | pH |
|---|---|---|---|---|---|
| 0.31 | 8.76 | 110 | 34.1 | 23.4 | 7.4 |
| Coding Space (X) | Z1 (N) kg/hm2 | Z2 (P) kg/hm2 | Z3 (K) kg/hm2 |
|---|---|---|---|
| 1 | 30 | 18.75 | 30 |
| 2 | 60 | 37.5 | 60 |
| 3 | 120 | 75 | 120 |
| Processing Number | N (kg/hm2) | P (kg/hm2) | K (kg/hm2) | Urea (kg) | Monocalcium Phosphate (kg) | Potassium Sulfate (kg) |
|---|---|---|---|---|---|---|
| 1 | 1 | 1 | 1 | 0.196 | 1.074 | 0.213 |
| 2 | 1 | 2 | 2 | 0.196 | 2.147 | 0.425 |
| 3 | 1 | 3 | 3 | 0.196 | 4.294 | 0.851 |
| 4 | 2 | 1 | 2 | 0.391 | 1.074 | 0.425 |
| 5 | 2 | 2 | 3 | 0.391 | 2.147 | 0.851 |
| 6 | 2 | 3 | 1 | 0.391 | 4.294 | 0.213 |
| 7 | 3 | 1 | 3 | 0.783 | 1.074 | 0.851 |
| 8 | 3 | 2 | 1 | 0.783 | 2.147 | 0.213 |
| 9 | 3 | 3 | 2 | 0.783 | 4.294 | 0.425 |
| 10 | 0 | 0 | 0 | 0.000 | 0.000 | 0.000 |
| Sample Sets | Number | Range (mg/g) | Mean (mg/g) | SD (mg/g) | CV (100%) |
|---|---|---|---|---|---|
| Calibration set | 115 | 16.111~56.389 | 39.330 | 10.944 | 27.825 |
| Prediction set | 38 | 18.111~49.986 | 36.601 | 10.652 | 29.104 |
| Selected Bands (nm) | Number of Characteristic Variables |
|---|---|
| 633, 531, 573, 513, 618, 690, 459 | 7 |
| Extraction Methods | Modeling Variables | Multiple Linear Regression Equation | Coefficient of Determination (R2) | Root Mean Squared Error (RMSE) | |
|---|---|---|---|---|---|
| correlation coefficient | R513, R630, R687, R765 | N = 39.314 + 137.3514 ∗ R513 − 898.6683 ∗ R630 + 411.4044 ∗ R687 + 19.8766 ∗ R765 | (5) | 0.8280 | 4.5012 |
| stepwise regression | R633, R531, R573, R513 | N = 41.2064 + 967.9506 ∗ R633 + 2199.7997 ∗ R531 − 2037.3879 ∗ R573 − 1477.7079 ∗ R5 | (6) | 0.8937 | 3.5391 |
| spectral index | NDSI(R552,R555) | N = 13.3809 − 3358.9052 ∗ NDSI(R552,R555) | (7) | 0.9026 | 3.3871 |
| RSI(R537,R573) | N = −105.9119 + 118.5089 ∗ RSI(R537,R573) | (8) | 0.9050 | 3.3451 | |
| DSI(R540,R555) | N = 40.6087 − 2829.669 ∗ RSI(R540,R555) | (9) | 0.8469 | 4.2468 | |
| NDSI(R552,R555), RSI(R537,R573), DSI(R540,R555) | N = −35.0402 − 2973.028 ∗ NDSI(R552,R555) + 41.6757 ∗ RSI(R537,R573) + 704.688 ∗ DSI(R540,R555) | (10) | 0.9063 | 3.3229 | |
Disclaimer/Publisher’s Note: The statements, opinions and data contained in all publications are solely those of the individual author(s) and contributor(s) and not of MDPI and/or the editor(s). MDPI and/or the editor(s) disclaim responsibility for any injury to people or property resulting from any ideas, methods, instructions or products referred to in the content. |
© 2025 by the authors. Licensee MDPI, Basel, Switzerland. This article is an open access article distributed under the terms and conditions of the Creative Commons Attribution (CC BY) license (https://creativecommons.org/licenses/by/4.0/).
Share and Cite
Zhang, Y.; Guan, M.; Wang, L.; Cui, X.; Wang, Y.; Li, P.; Ali, S.; Zhang, F. Research on Monitoring Nitrogen Content of Soybean Based on Hyperspectral Imagery. Agronomy 2025, 15, 1240. https://doi.org/10.3390/agronomy15051240
Zhang Y, Guan M, Wang L, Cui X, Wang Y, Li P, Ali S, Zhang F. Research on Monitoring Nitrogen Content of Soybean Based on Hyperspectral Imagery. Agronomy. 2025; 15(5):1240. https://doi.org/10.3390/agronomy15051240
Chicago/Turabian StyleZhang, Yakun, Mengxin Guan, Libo Wang, Xiahua Cui, Yafei Wang, Peng Li, Shaukat Ali, and Fu Zhang. 2025. "Research on Monitoring Nitrogen Content of Soybean Based on Hyperspectral Imagery" Agronomy 15, no. 5: 1240. https://doi.org/10.3390/agronomy15051240
APA StyleZhang, Y., Guan, M., Wang, L., Cui, X., Wang, Y., Li, P., Ali, S., & Zhang, F. (2025). Research on Monitoring Nitrogen Content of Soybean Based on Hyperspectral Imagery. Agronomy, 15(5), 1240. https://doi.org/10.3390/agronomy15051240