Article

CdGLK1 Transcription Factor Confers Low-Light Tolerance in Bermudagrass via Coordinated Upregulation of Photosynthetic Genes and Enhanced Antioxidant Enzyme Activity

College of Agro-Grassland Science, Nanjing Agricultural University, Nanjing 210095, China
*
Author to whom correspondence should be addressed.
Agronomy 2025, 15(5), 1225; https://doi.org/10.3390/agronomy15051225
Submission received: 13 April 2025 / Revised: 15 May 2025 / Accepted: 16 May 2025 / Published: 17 May 2025

Abstract

:
As a widely cultivated warm-season turfgrass, bermudagrass (Cynodon spp.) faces significant challenges in shaded environments due to its inherent low-light sensitivity. While improving photosynthetic adaptation represents a promising strategy to address this limitation, the associated regulatory mechanisms remain insufficiently characterized. In this study, we found that the overexpression of CdGLK1 significantly improved low-light tolerance in bermudagrass by increasing shoot weight, root weight, chlorophyll a, chlorophyll b, net photosynthetic rate (Pn), and maximum quantum yield of photosystem II (Fv/Fm). Furthermore, coordinated upregulation of both C3 and C4 pathway enzymes was observed under low-light stress, accompanied by enhanced antioxidant capacity and reduced photoxidative damage. Transcriptomic profiling further revealed CdGLK1-mediated activation of photosynthetic machinery components spanning light harvesting, electron transport, and carbon fixation modules. These findings establish CdGLK1 as a master integrator of photoprotection and metabolic adaptation under light-limiting conditions, providing both mechanistic insights and practical strategies for developing shade-resilient turfgrass cultivars.

1. Introduction

Bermudagrass (Cynodon spp.) is an important warm-season turfgrass, which is widely used in sports fields due to its low grass sward and fine texture [1,2]. However, compared with other warm-season turfgrasses, bermudagrass has the major drawback of poor low-light tolerance, which restricts its application and adversely affects turf quality [3,4]. Shading from tall buildings and trees in urban areas is a common source of low-light stress, leading to changes in photosynthetically active radiation (PAR) [5,6,7]. Under conditions of limited light availability, the cellular architecture of plants experiences compromised integrity, resulting in multiple physiological disturbances. These include the breakdown of light-absorbing pigments, suppressed production of chlorophyll molecules, diminished capacity for photon capture, altered gas-exchange patterns, and impaired functionality of photosynthetic enzymes, with ribulose-1,5-bisphosphate carboxylase/oxygenase (Rubisco) showing particular vulnerability to such light-deficient environments [7,8]. Furthermore, this stress triggers the accumulation of reactive oxygen species (ROS) and malondialdehyde (MDA) in turfgrass which, in turn, causes membrane lipid peroxidation and protein denaturation. Ultimately, these effects limit the growth of turfgrass and reduce its quality [4,5]. Additionally, Jiang et al. revealed that seashore paspalum (Paspalum vaginatum) exhibited superior turf quality and chlorophyll levels compared to bermudagrass under shaded conditions [9]. Notably, Mcbee et al. specifically identified bermudagrass as the least shade-tolerant species among five warm-season turfgrasses [10]. Given its marked deficiency in low-light adaptation, systematic research into the shade-response mechanisms of bermudagrass is urgently needed to advance its adaptability in the turfgrass industry.
Previous studies have indicated that upregulating the expression of chlorophyll biosynthesis genes to mitigate chloroplast structural damage and enhance the activity levels of photosynthetic seems to be an effective method to enhance the low-light tolerance of turfgrass [10]. The biogenesis and development of chloroplasts are determined by photosynthesis-associated plastid genes (PhAPGs) and photosynthesis-associated nuclear genes (PhANGs) [11,12]. GLKs are believed to determine chloroplast development and regulate PhANGs [13,14,15]. They act as core transcriptional activators of chloroplast development and biogenesis, typically occurring in pairs to ensure the proper function of photosynthesis. GLK1 and GLK2 exhibit redundant functions [5,11,16]. GLKs proteins directly bind to the promoter regions of PhANGs, promoting the biosynthesis of chlorophyll and the development of chloroplasts [11,13]. The function of GLKs is reflected in increasing chlorophyll content in leaves or fruits [17,18,19,20].
Under shading conditions, chlorophyll biosynthesis is impaired through a regulatory mechanism involving the transcription of GLK1 [19]. As shade induces the inactivation of Phytochrome B (PHYB), phytochrome-interacting factors (PIFs) are stabilized. These stabilized PIFs proteins transcriptionally repress GLK1 by directly binding to its promoter region. Concomitantly, PIFs exert dual regulatory functions by binding to promoter elements of repressors of Photosynthetic Genes 1 (RPGE1) and RPGE2, thereby inducing transcriptional activation of these negative regulators [21]. The accumulated RPGE1 and RPGE2 proteins subsequently repress the expression of photosynthetic genes. As a result, chlorophyll accumulation is reduced, compromising the efficiency of photosynthesis under shading conditions [19,21].
Although some studies have shown that GLK1 participates in leaf yellowing or senescence under low-light conditions, it remains unclear whether the overexpression of GLK1 can enhance low-light tolerance [19,22,23,24,25,26,27]. Therefore, this study aims to overexpress CdGLK1 in bermudagrass to determine whether its low-light tolerance can be improved. Specifically, we investigated whether overexpressing CdGLK1 could enhance the physiological response and photosynthetic capacity of bermudagrass under low-light stress. The findings of this study could provide new insights and approaches for improving the low-light tolerance of turfgrass.

2. Materials and Methods

2.1. Plant Materials and Growth Conditions

The wild-type (WT, cv. “tifdwarf”) and two CdGLK1-overexpressing lines (OE1 and OE2) of bermudagrass were planted in plastic containers measuring 35.0 cm in length, 35.0 cm in width, and 35.0 cm in height and filled with peat soil. The grass was cultivated in a greenhouse with 65% relative humidity, 800 μmol/m2/s of photosynthetically active radiation, a 16 h photoperiod, and an average temperature of 30 °C (day)/25 °C (night). During cultivation, the plants were clipped to about 5.0 cm every week, fully watered every three days, and fertilized once a week with water-soluble fertilizer (Scotts Miracle-Gro Co., Marysville, OH, USA).
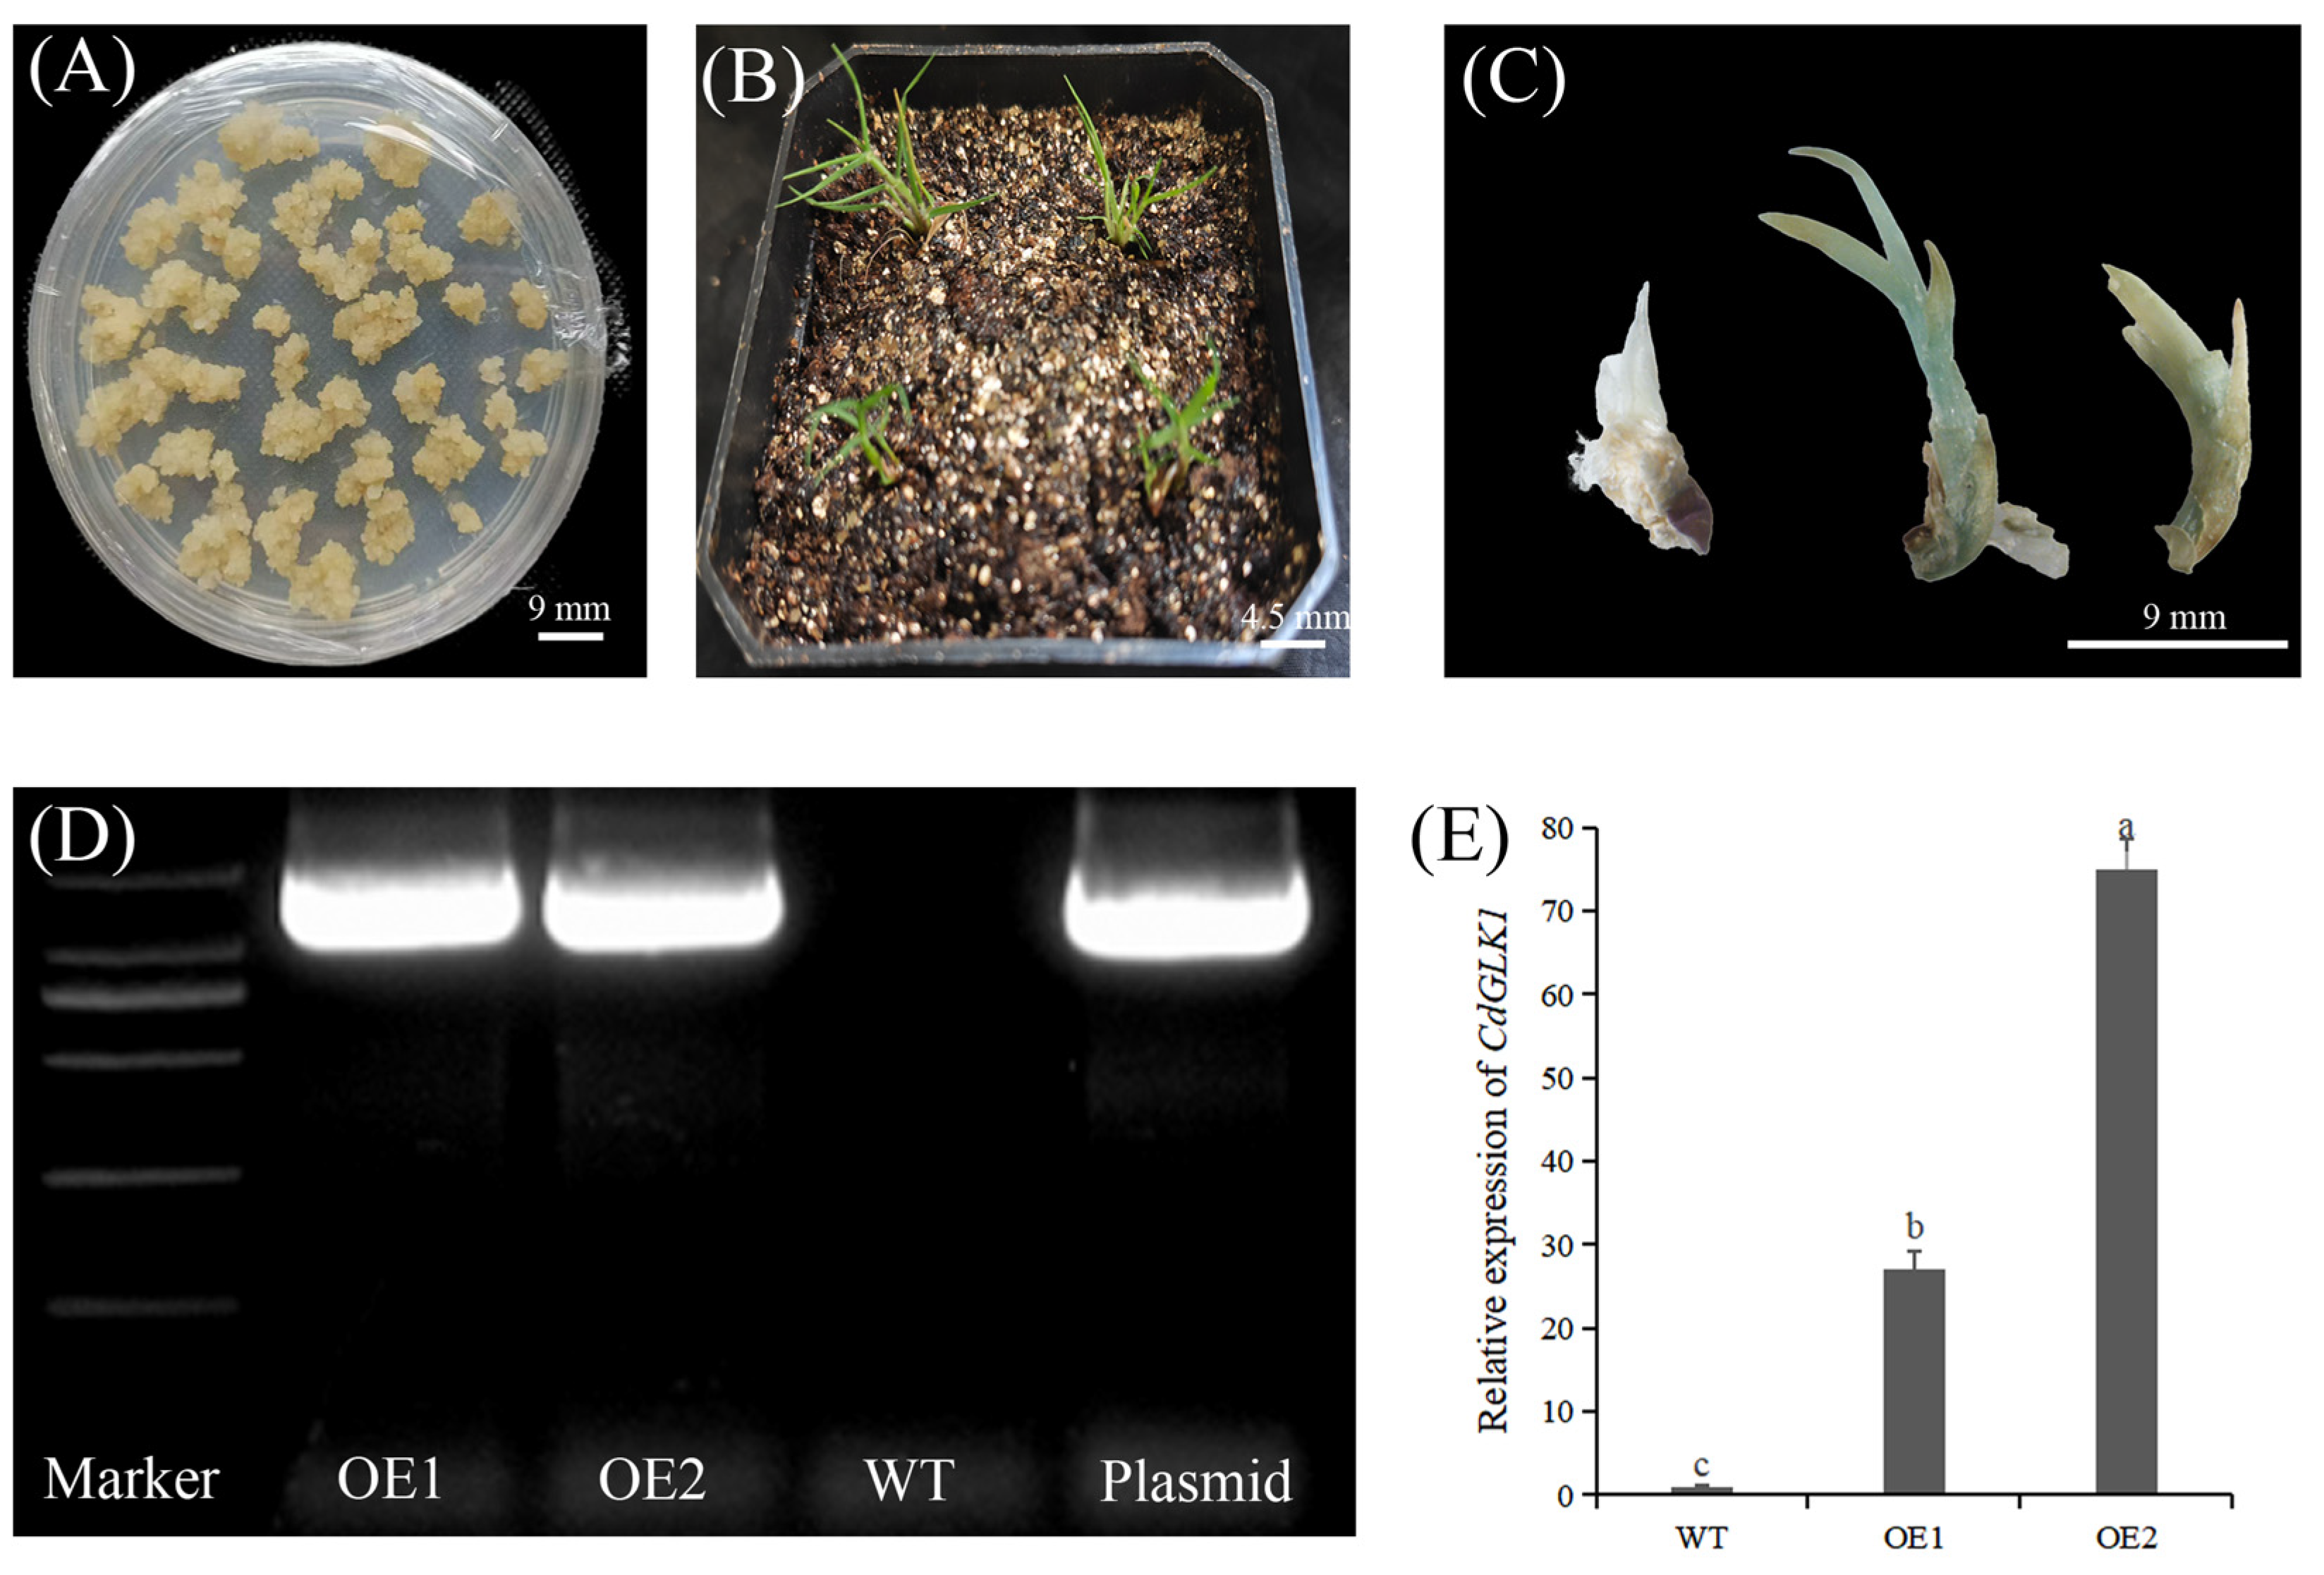
The transgenic lines were generated through particle bombardment using the PDS-1000/He System (Bio-Rad, Hercules, CA, USA). For genetic transformation, embryogenic calli were bombarded twice at a 6 cm target distance with gold microcarriers coated with pCAMBIA1305.2 plasmid containing the Ubi::CdGLK1 construct. The CdGLK1 gene was PCR-amplified and cloned into the pCAMBIA1305.2 vector via LR recombination (Gateway system). Following bombardment, calli were transferred to a regeneration medium and subsequently screened through a histological GUS assay, followed by molecular confirmation via PCR and qRT-PCR analyses (Figure A1) [28].

2.2. Experimental Design and Treatments

The experimental protocol was executed over a 60-day period under a bifactorial framework incorporating photosynthetically active radiation (PAR) levels and plant genotypes. The light treatments included control light (PAR: 800 μmol/m2/s) and low-light treatment using an 80-mesh sunshade net (PAR: 120 μmol/m2/s). The source of radiation in the described light treatments was LED tubes (Sansilighting Co., Ltd., Shanghai, China). Three pots of plants (three replicates) for each of the WT and CdGLK1-overexpressing lines (OE1 and OE2) were randomly placed in each of the two growth chambers under either control or low-light stress. Three biological replicates per genotype, including the wild-type (WT) and two independent CdGLK1-overexpressing lines (OE1, OE2), were systematically distributed across environmentally controlled growth chambers using randomized complete block design principles. During the treatment, none of the grass was clipped, but the other management conditions were the same as above. After 60 days of low-light treatment, the fifth leaves (counted from the top) of bermudagrass were measured using an Imaging-PAM chlorophyll fluorometer equipped with a computer-operated PAM-control unit (IMAG-MAXI; Heinz Walz, Effeltrich, Germany). Chlorophyll fluorescence profiling of the nodal position 5 leaves was carried out using a modulated Imaging-PAM system. Samples of leaves were taken from nodal positions 2–5 per tiller, immediately cryopreserved in liquid N2, and then stored at −80 °C for further analyses.

2.3. Assay of Morphological Parameters

Following the 60-day low-light treatment, quantitative morphometric evaluations were conducted. Plant height was quantified as the vertical span between the rhizosphere interface and the apical meristem of the dominant shoot. Leaf length and width were measured on the third fully expanded leaf. Stem diameter and internode length were measured by selecting the fifth internode starting from the top of the creeping stolon. The number of each tiller was assessed via manual enumeration of axillary shoots per ramet. Biomass partitioning was determined by excising standardized aerial and subterranean fractions from defined quadrats, followed by hydropneumatic root cleansing, organ separation, and desiccation at 80 °C to constant mass (72 h duration). All morphometric parameters were recorded with quintuplicate biological replicates, with experimental iterations repeated five times under controlled conditions.

2.4. Measurements of Gas Exchange Parameters, Fv/Fm, and Chlorophyll Content

Fresh apical leaves (the second to the fifth from the shoot apex) of WT and CdGLK1-overexpressing (OE1 and OE2) were excised from the shoot apex, and 0.4 g of healthy, immature leaf tissue per sample was subjected to chlorophyll extraction via 7-day dark incubation in dimethyl sulfoxide (DMSO; 8 mL solvent per 0.4 g fresh weight). Chlorophyll a, b, and total concentrations were spectrophotometrically determined using Arnon’s absorption coefficients [29], with five technical replicates per biological sample.
Gas exchange kinetics, including the net CO2 assimilation rate (Pn), stomatal conductance (Gs), intracellular CO2 concentration (Ci), and transpirational flux (Tr), were monitored using a LI-COR Li-6400XT portable gas exchange system under standardized conditions: 800 μmol·m−2·s−1 photosynthetically active radiation (PAR) provided by integrated LED arrays, 25 °C leaf chamber temperature, and 30 min photosynthetic induction prior to measurement. The photochemical efficiency of photosystem II (Fv/Fm) was determined through 30 min dark-adapted leaf samples analyzed using a Dynamax Fim 1500 pulse-amplitude modulation fluorometer (Dynamax, Inc., Houston, TX, USA), with the variable fluorescence (Fv) calculated as Fm − F0 relative to the maximal fluorescence (Fm). To ensure representative sampling, the fourth fully expanded leaf from the shoot apex was selected from each plant. Five independent biological replicates were established, each comprising triplicate leaf clusters (four leaves per cluster) of uniform developmental stage. All clusters were analyzed under standardized conditions to minimize intra-group variability.

2.5. Quantification of Photosynthetic Enzyme Activities

Fresh and healthy leaves (the second to the fifth from the shoot apex) of WT and CdGLK1-overexpressing (OE1 and OE2) bermudagrass plants were harvested, immediately flash-frozen in liquid nitrogen, and homogenized in 50 mM Tris-HCl buffer (pH 7.6) using 0.4 g of tissue per sample for downstream analyses, with three biological replicates per group. Rubisco activity and RCA activity were quantified spectrophotometrically following Xu’s protocol [30]. Ru5PK activity was assayed by monitoring NADPH oxidation at 340 nm, as described by Marri et al. [31]. PPDK activity was measured using the Pyruvate Phosphate Dikinase (PPDK) Activity Assay Kit (G0611F, Geruisi-bio Co., Ltd., Suzhou, Jiangsu, China), while PEPCK activity was analyzed with the Phosphoenolpyruvate Carboxykinase (PEPCK) Activity Assay Kit (G0606F, Geruisi-bio Co., Ltd., Suzhou, Jiangsu, China). All experiments were repeated at least three times.

2.6. Quantification of Antioxidant Enzyme Activities

Samples of 0.5 g were collected from the second to the fifth green leaves (positioned below the shoot tip) of WT and CdGLK1-overexpressing (OE1 and OE2) bermudagrass plants for analysis. Cryogenically pulverized leaf tissue was homogenized in 50 mM sodium phosphate buffer (pH 7.8) for enzymatic extractions. Peroxidase (POD) activity was quantified spectrometrically via guaiacol oxidation at 470 nm, following Upadhyaya’s protocol [32]. Superoxide dismutase (SOD) activity was determined spectrophotometrically through nitro blue tetrazolium (NBT) photoreduction inhibition at 560 nm, as per Beauchamp’s methodology [33]. Catalase (CAT) kinetics were assayed via the H2O2 decomposition rate at 240 nm using Aebi’s extinction coefficient [34]. Ascorbate peroxidase (APX) activity was monitored through ascorbate oxidation at 290 nm following the protocol of Nakano [35]. Glutathione reductase (GR) activity was measured at 340 nm utilizing Long’s enzymatic coupling system [8]. The lipid peroxidation levels were assessed through malondialdehyde (MDA) quantification via a thiobarbituric acid reactive substance (TBARS) assay at 532 nm, as described by Buege [36]. All experiments were repeated at least five times.

2.7. Transcriptome Profiling and Comparative Analysis

To analyze the gene expression differences between the transgenic lines (OE1, OE2) and wild-type (WT) plants under low light, fresh, healthy, and pest-free leaf samples (the second to the fifth leaves from the shoot apex) were collected with three biological replicates per group, each sample weighing 0.5 g. Total RNA was extracted and assessed for quality (RNA Integrity Number > 7.0) using an Agilent Bioanalyzer 2100 (Agilent Technologies, Santa Clara, CA, USA). High-quality RNA samples were processed using Genepioneer Biotech (Nanjing, China) for RNA sequencing. Sequencing libraries were prepared with the Illumina TruSeq Stranded (Illumina, San Diego, CA, USA) mRNA Kit and sequenced on an Illumina HiSeq 2000 platform (Trinity, v2.10.0, Broad Institute, Cambridge, MA, USA). Raw sequencing data were deposited in the NCBI (Accession: SUB14644498). Transcript assembly generated 375,951 consensus sequences using Trinity software. Differential gene expression analysis between the transgenic and WT groups was performed with edgeR (version 2.0), applying thresholds of an adjusted p < 0.05 and an absolute log2 fold change ≥ 1 for significance. Meanwhile, to reduce the potential false positive rate in transcriptome analysis, lowly expressed transcripts (TPM < 1) were first filtered out to minimize the number and complexity of statistical tests. Additionally, the CD-HIT-EST tool (Cluster Database at High Identity with Tolerance, v4.8.1, La Jolla, CA, USA) was employed to merge redundant transcripts, thereby reducing data redundancy and improving the efficiency of downstream analyses. Based on this refined dataset, a stringent false discovery rate (FDR < 0.05) was applied to ensure the statistical reliability and biological relevance of the identified differentially expressed genes.

2.8. Quantitative Real-Time PCR Analysis

Total RNA was extracted from 0.2 g of fresh, healthy, and pest-free leaf tissue (the second to the fifth leaves from the shoot apex) of WT and CdGLK1-overexpressing (OE1/OE2) bermudagrass plants using the Fast Pure Plant RNA Kit (Vazyme Biotech, Nanjing, Jiangsu, China). Twenty transcriptome-identified upregulated genes were verified using qRT-PCR. The reactions contained 2.0 μL cDNA, 0.5 μM primers, and 10 μL SYBR Green Master Mix (Vazyme Biotech, Nanjing, Jiangsu, China) in a total volume of 20 μL. Amplification was performed in a QuantStudio 5 system (Thermo Fisher Scientific, Waltham, MA, USA) with three technical replicates per sample. The gene expression levels were normalized using reference genes and calculated via the 2(−ΔΔCt) method, and Protein Phosphatase 2A (PP2A) was used as the reference gene [27]. The primers used are shown in Table 1. Three independent biological replicates were analyzed for each treatment group.

2.9. Statistical Analysis

The data were analyzed using SPSS 19.0 (SPSS, Inc., Chicago, IL, USA), and the means ± standard errors (SEs) were calculated for the measured parameters in the column charts. ANOVA analysis and Duncan’s multiple comparison test were applied to determine significant differences among the different parameters at a probability level of 0.05.

3. Results

3.1. Overexpression of CdGLK1 Alters Bermudagrass Morphology Under Low Light

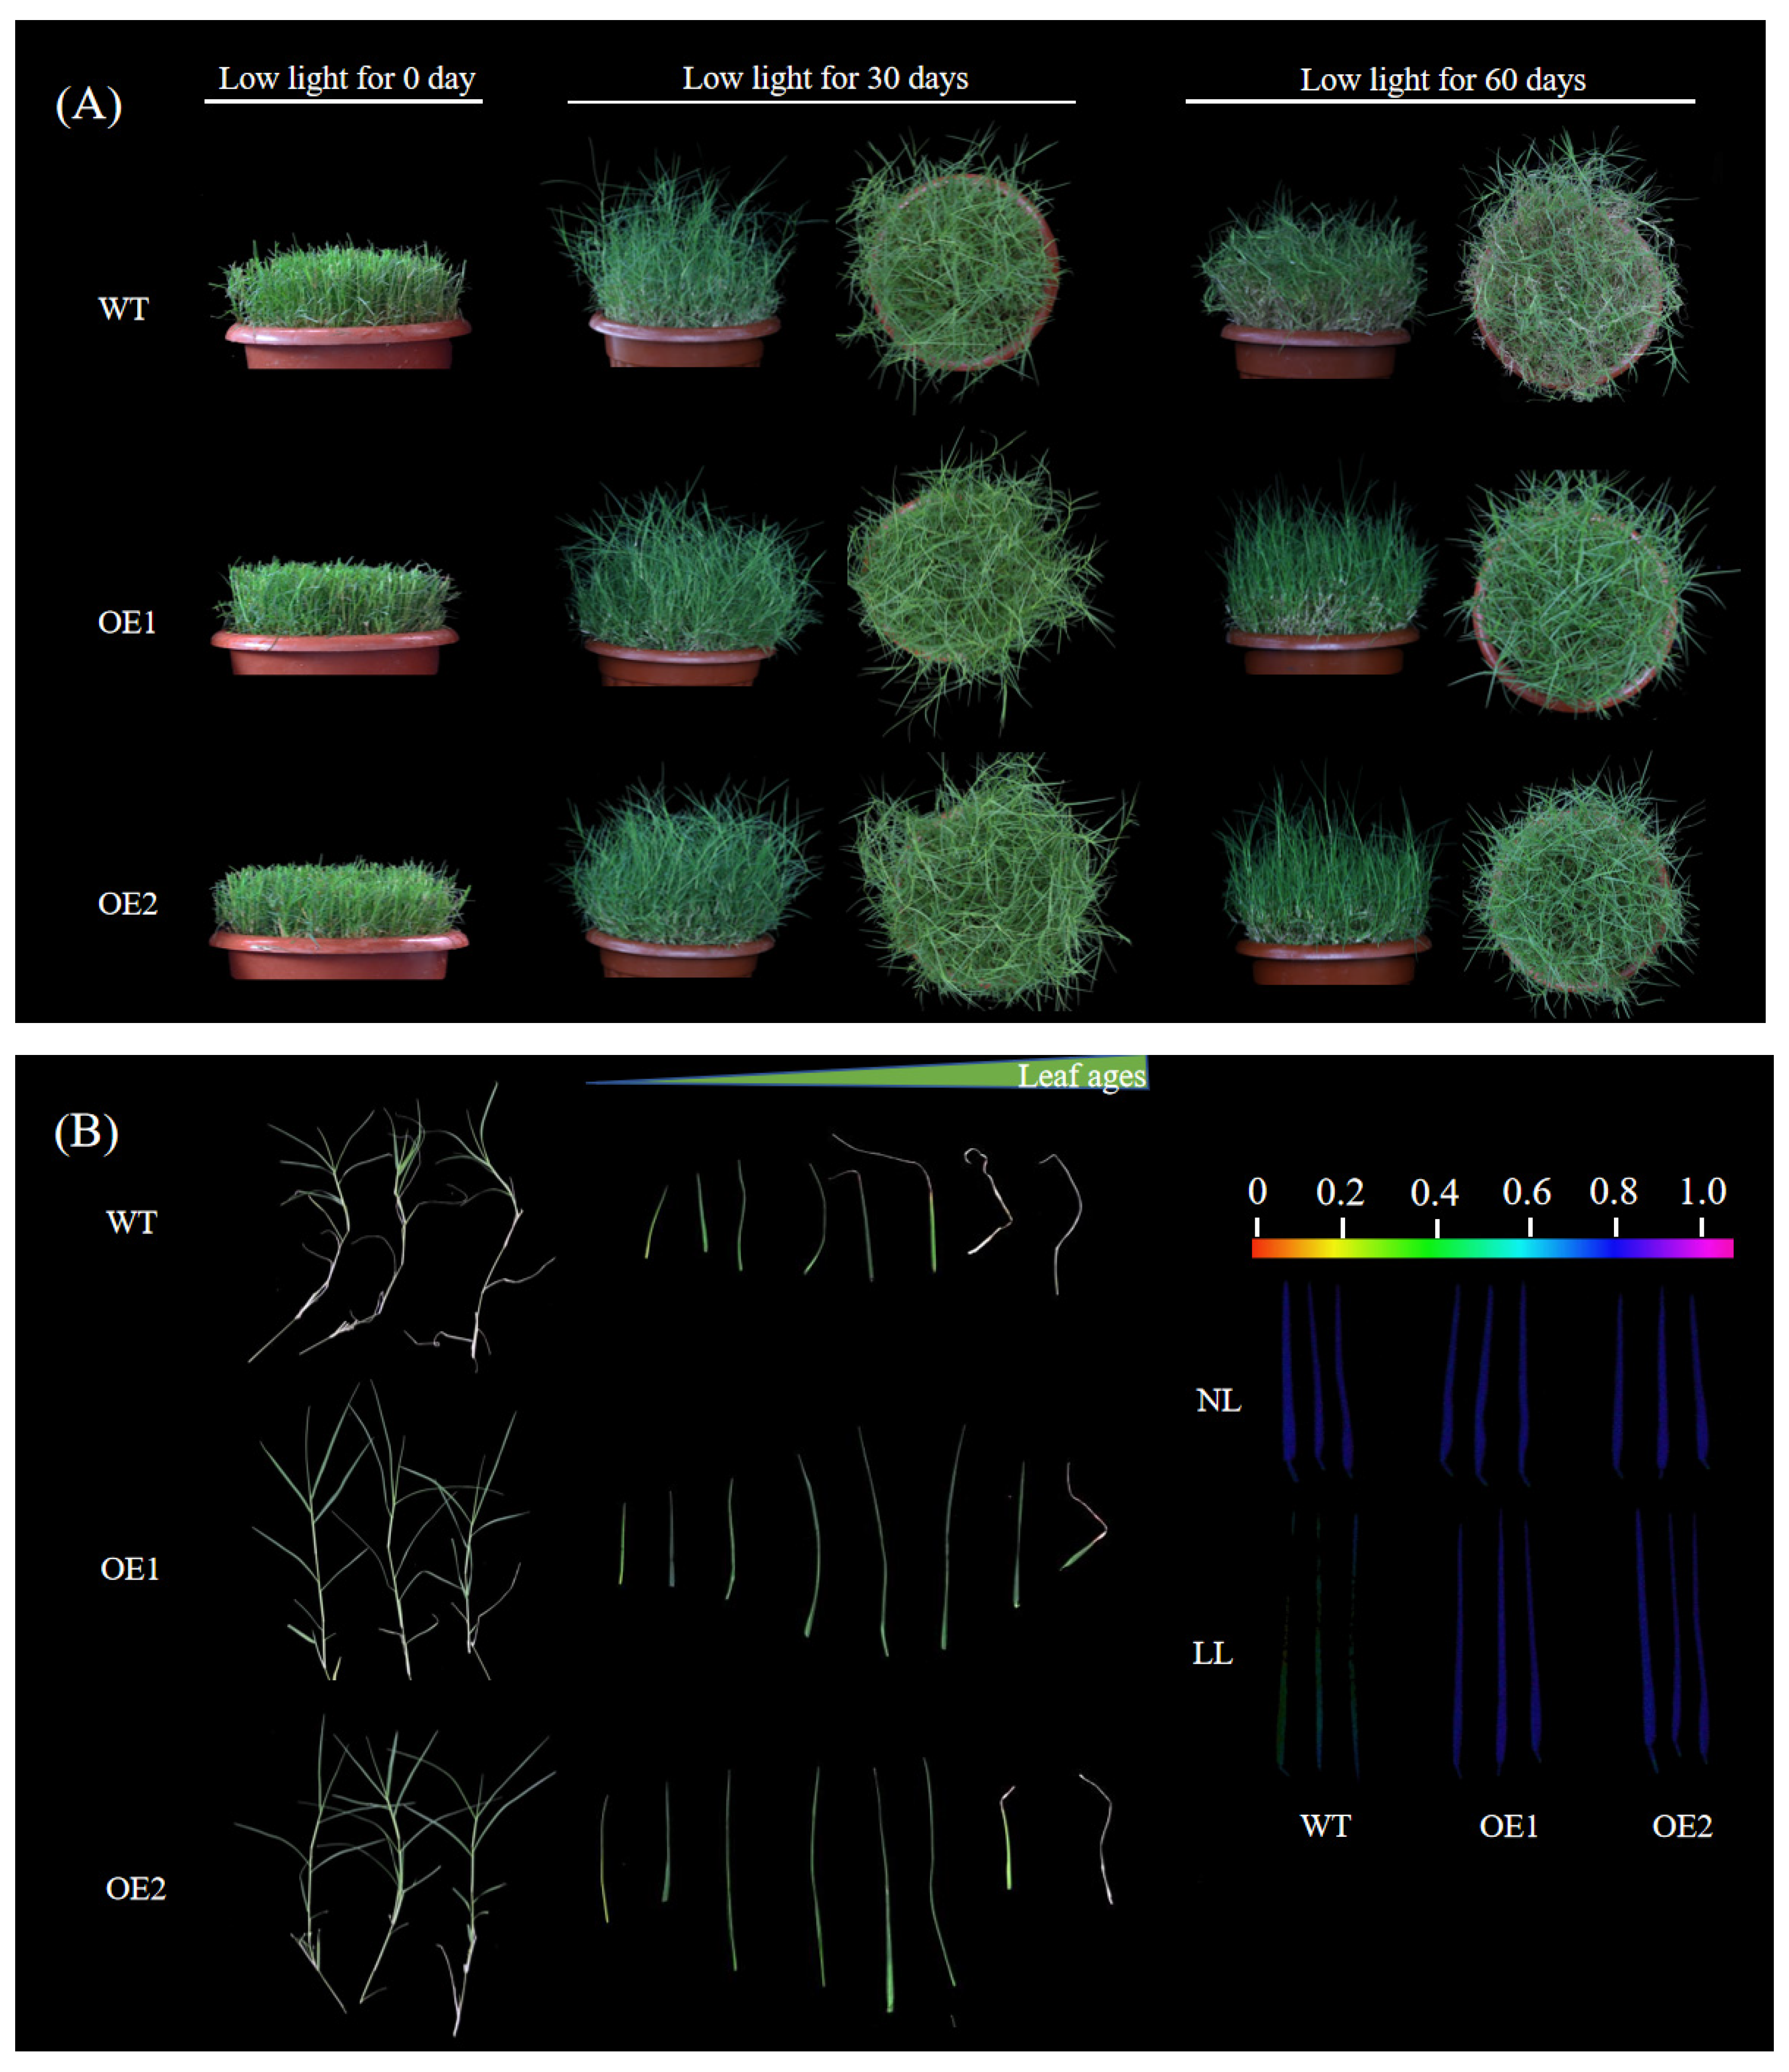
Low-light stress significantly decreased the number of tillers, stem diameter, root weight, and shoot weight in the WT, OE1, and OE2 plants, while increasing leaf length, plant height, and internode length (Figure 1). The overexpression of CdGLK1 significantly increased the number of tillers, shoot weight, and root weight both in low- and normal-light conditions. Specifically, compared with the WT under low-light conditions, the CdGLK1-overexpressing lines (OE1 and OE2) showed increases of 30.1% and 32.5% in tiller number, 15.1% and 18.9% in root weight, and 28.7% and 23.4% in shoot weight, respectively (Figure 1). Under normal-light conditions, the tiller number increased by 18.4% and 27.6%, the root weight increased by 66.8% and 70.8%, and the shoot weight increased by 42.2% and 72.3%, respectively. Additionally, low-light-treated plants overexpressing CdGLK1 exhibited an increase in the number of green tillers, delayed leaf elongation and internode lengthening, delayed stem thinning, and enhanced photosynthetic capacity compared with the WT. Figure 2 illustrates dissected tillers of WT and transgenic plants under low-light stress. In the WT, senescence began at the fifth leaf, marked by yellowing and chlorophyll degradation, and progressed basipetally. In contrast, OE1 and OE2 exhibited delayed senescence, with visible wilting first observed at the seventh and eighth leaves, respectively. These results indicate that CdGLK1 positively regulates plant growth under low-light conditions.

3.2. Overexpression of CdGLK1 Enhances Photosynthetic Capacity and Gas Exchange in Bermudagrass

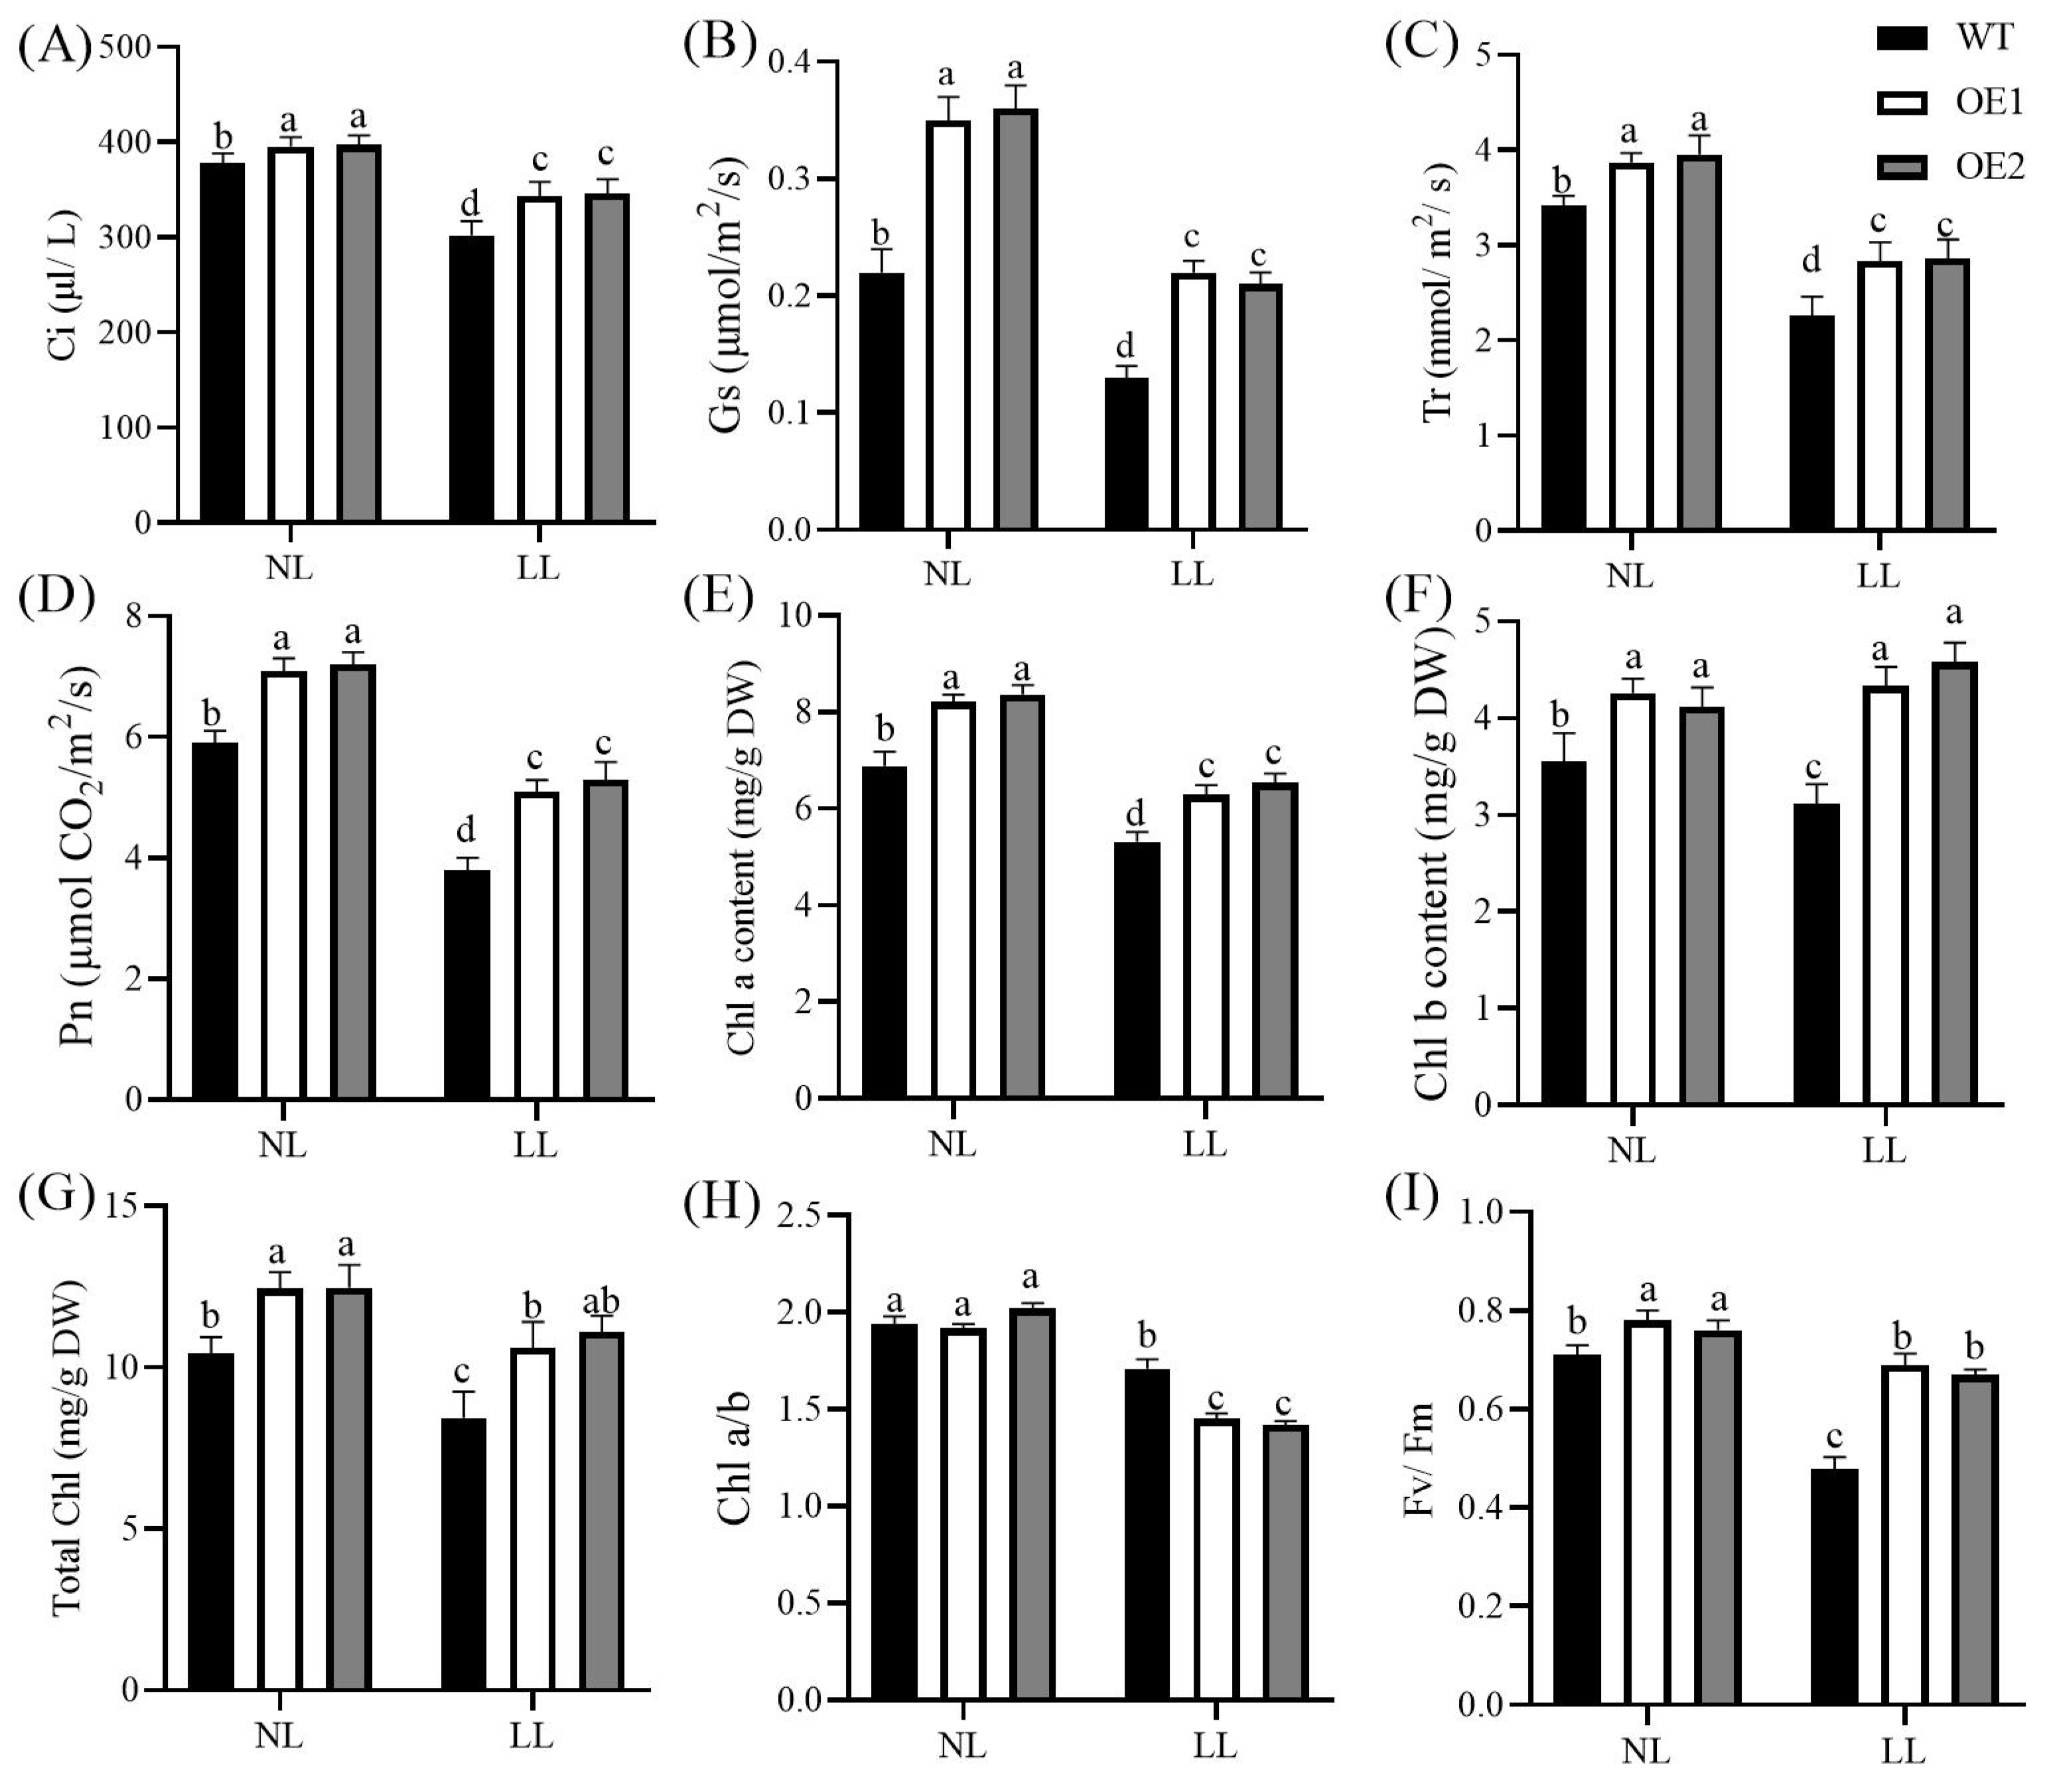
Low-light conditions significantly affected the photosynthetic capacity of all plants, with remarkable differences observed between the WT and the CdGLK1-overexpressing transgenic lines (Figure 3). The overexpression of CdGLK1 significantly increased Pn, Tr, Gs, Ci, and Fv/Fm compared with the WT under both low- and normal-light conditions. Under normal light, the Pn in OE1 and OE2 increased by 17.3% and 20.3%, respectively, compared with the WT. In addition, the overexpression of CdGLK1 significantly increased the Chl a, Chl b, and total chlorophyll contents compared with the WT under normal-light conditions. Specifically, under normal-light conditions, the chlorophyll a content in OE1 and OE2 increased by 19.3% and 21.5%, respectively; the chlorophyll b content increased by 20.0% and 16.1%, respectively; and the total chlorophyll content increased by 19.3% and 19.5%, respectively, compared with the WT. Under low-light conditions, the chlorophyll a content in OE1 and OE2 increased by 18.2% and 22.7%, respectively; the chlorophyll b content increased by 38.7% and 46.7%, respectively; and the total chlorophyll content increased by 25.6% and 31.4%, respectively, compared with the WT.
Meanwhile, the overexpression of CdGLK1 significantly decreased the chlorophyll a/b ratio under low-light conditions. Compared with the WT, the chlorophyll a/b ratio in OE1 and OE2 decreased by 15.6% and 17.0%, respectively. Overall, the transgenic lines overexpressing CdGLK1 exhibited improved photosynthetic capacity under both low- and normal-light conditions. The lower chlorophyll a/b ratio observed in OE1 and OE2 under low-light conditions indicates that the overexpression of CdGLK1 could enhance low-light adaptability in bermudagrass.

3.3. Overexpression of CdGLK1 Enhances the Activity of Photosynthetic Enzymes in Bermudagrass

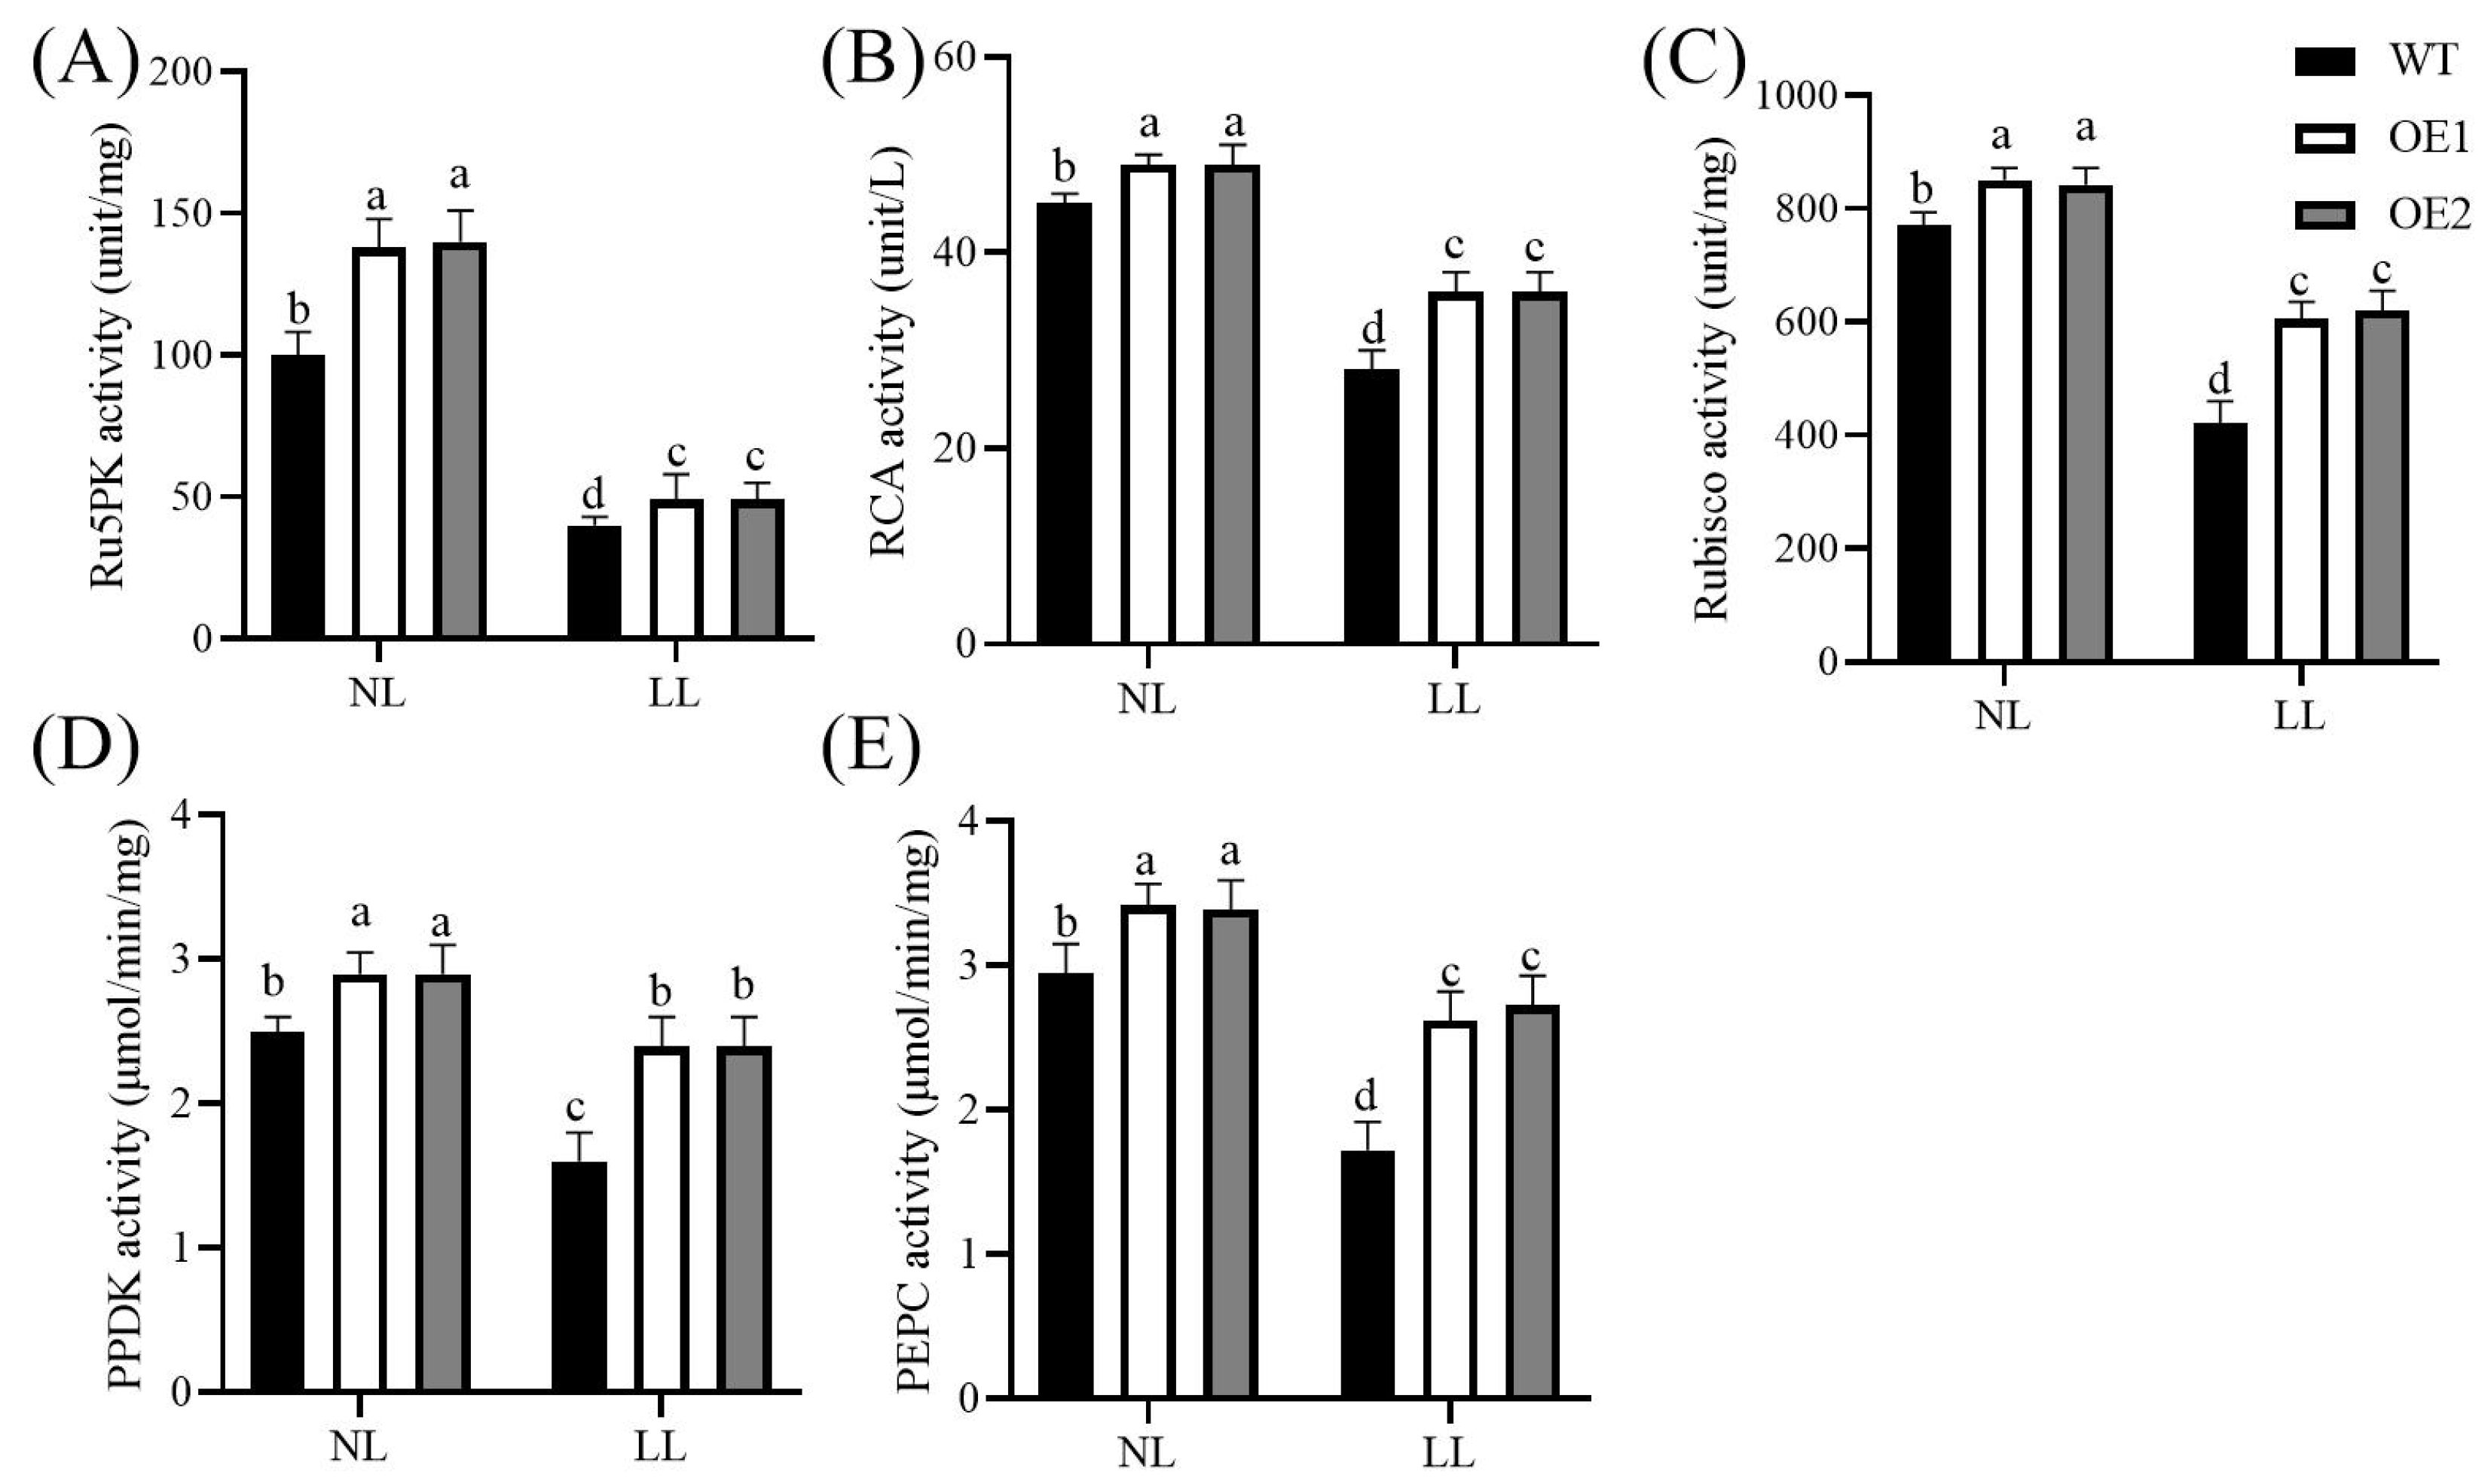
The overexpression of CdGLK1 significantly increased the activity of photosynthetic enzymes involved in both the C3 and C4 pathways (Figure 4). Under normal-light conditions, compared with the WT, ribulose-1,5-bisphosphate carboxylase/oxygenase (Rubisco) activity in OE1 and OE2 increased by 27.3% and 29.3%, respectively; ribulose-5-phosphate kinase (Ru5PK) activity increased by 23.1% and 24.2%, respectively; Rubisco activase (RCA) activity increased by 9.3% and 11.2%, respectively; pyruvate orthophosphate dikinase (PPDK) activity increased by 13.7% and 14.5%, respectively; and phosphoenolpyruvate carboxylase (PEPC) activity increased by 12.1% and 11.1%, respectively. Moreover, the transgenic lines maintained higher photosynthetic enzyme activities under low-light conditions. Compared with the WT, Rubisco activity in OE1 and OE2 increased by 39.0% and 40.2%, respectively; Ru5PK activity increased by 33.5% and 37.2%, respectively; RCA activity increased by 29.6% and 31.5%, respectively; PPDK activity increased by 51.4% and 53.0%, respectively; and PEPC activity increased by 54.1% and 58.7%, respectively.

3.4. Overexpression of CdGLK1 Enhances Antioxidant Enzyme Activity in Bermudagrass Under Low Light

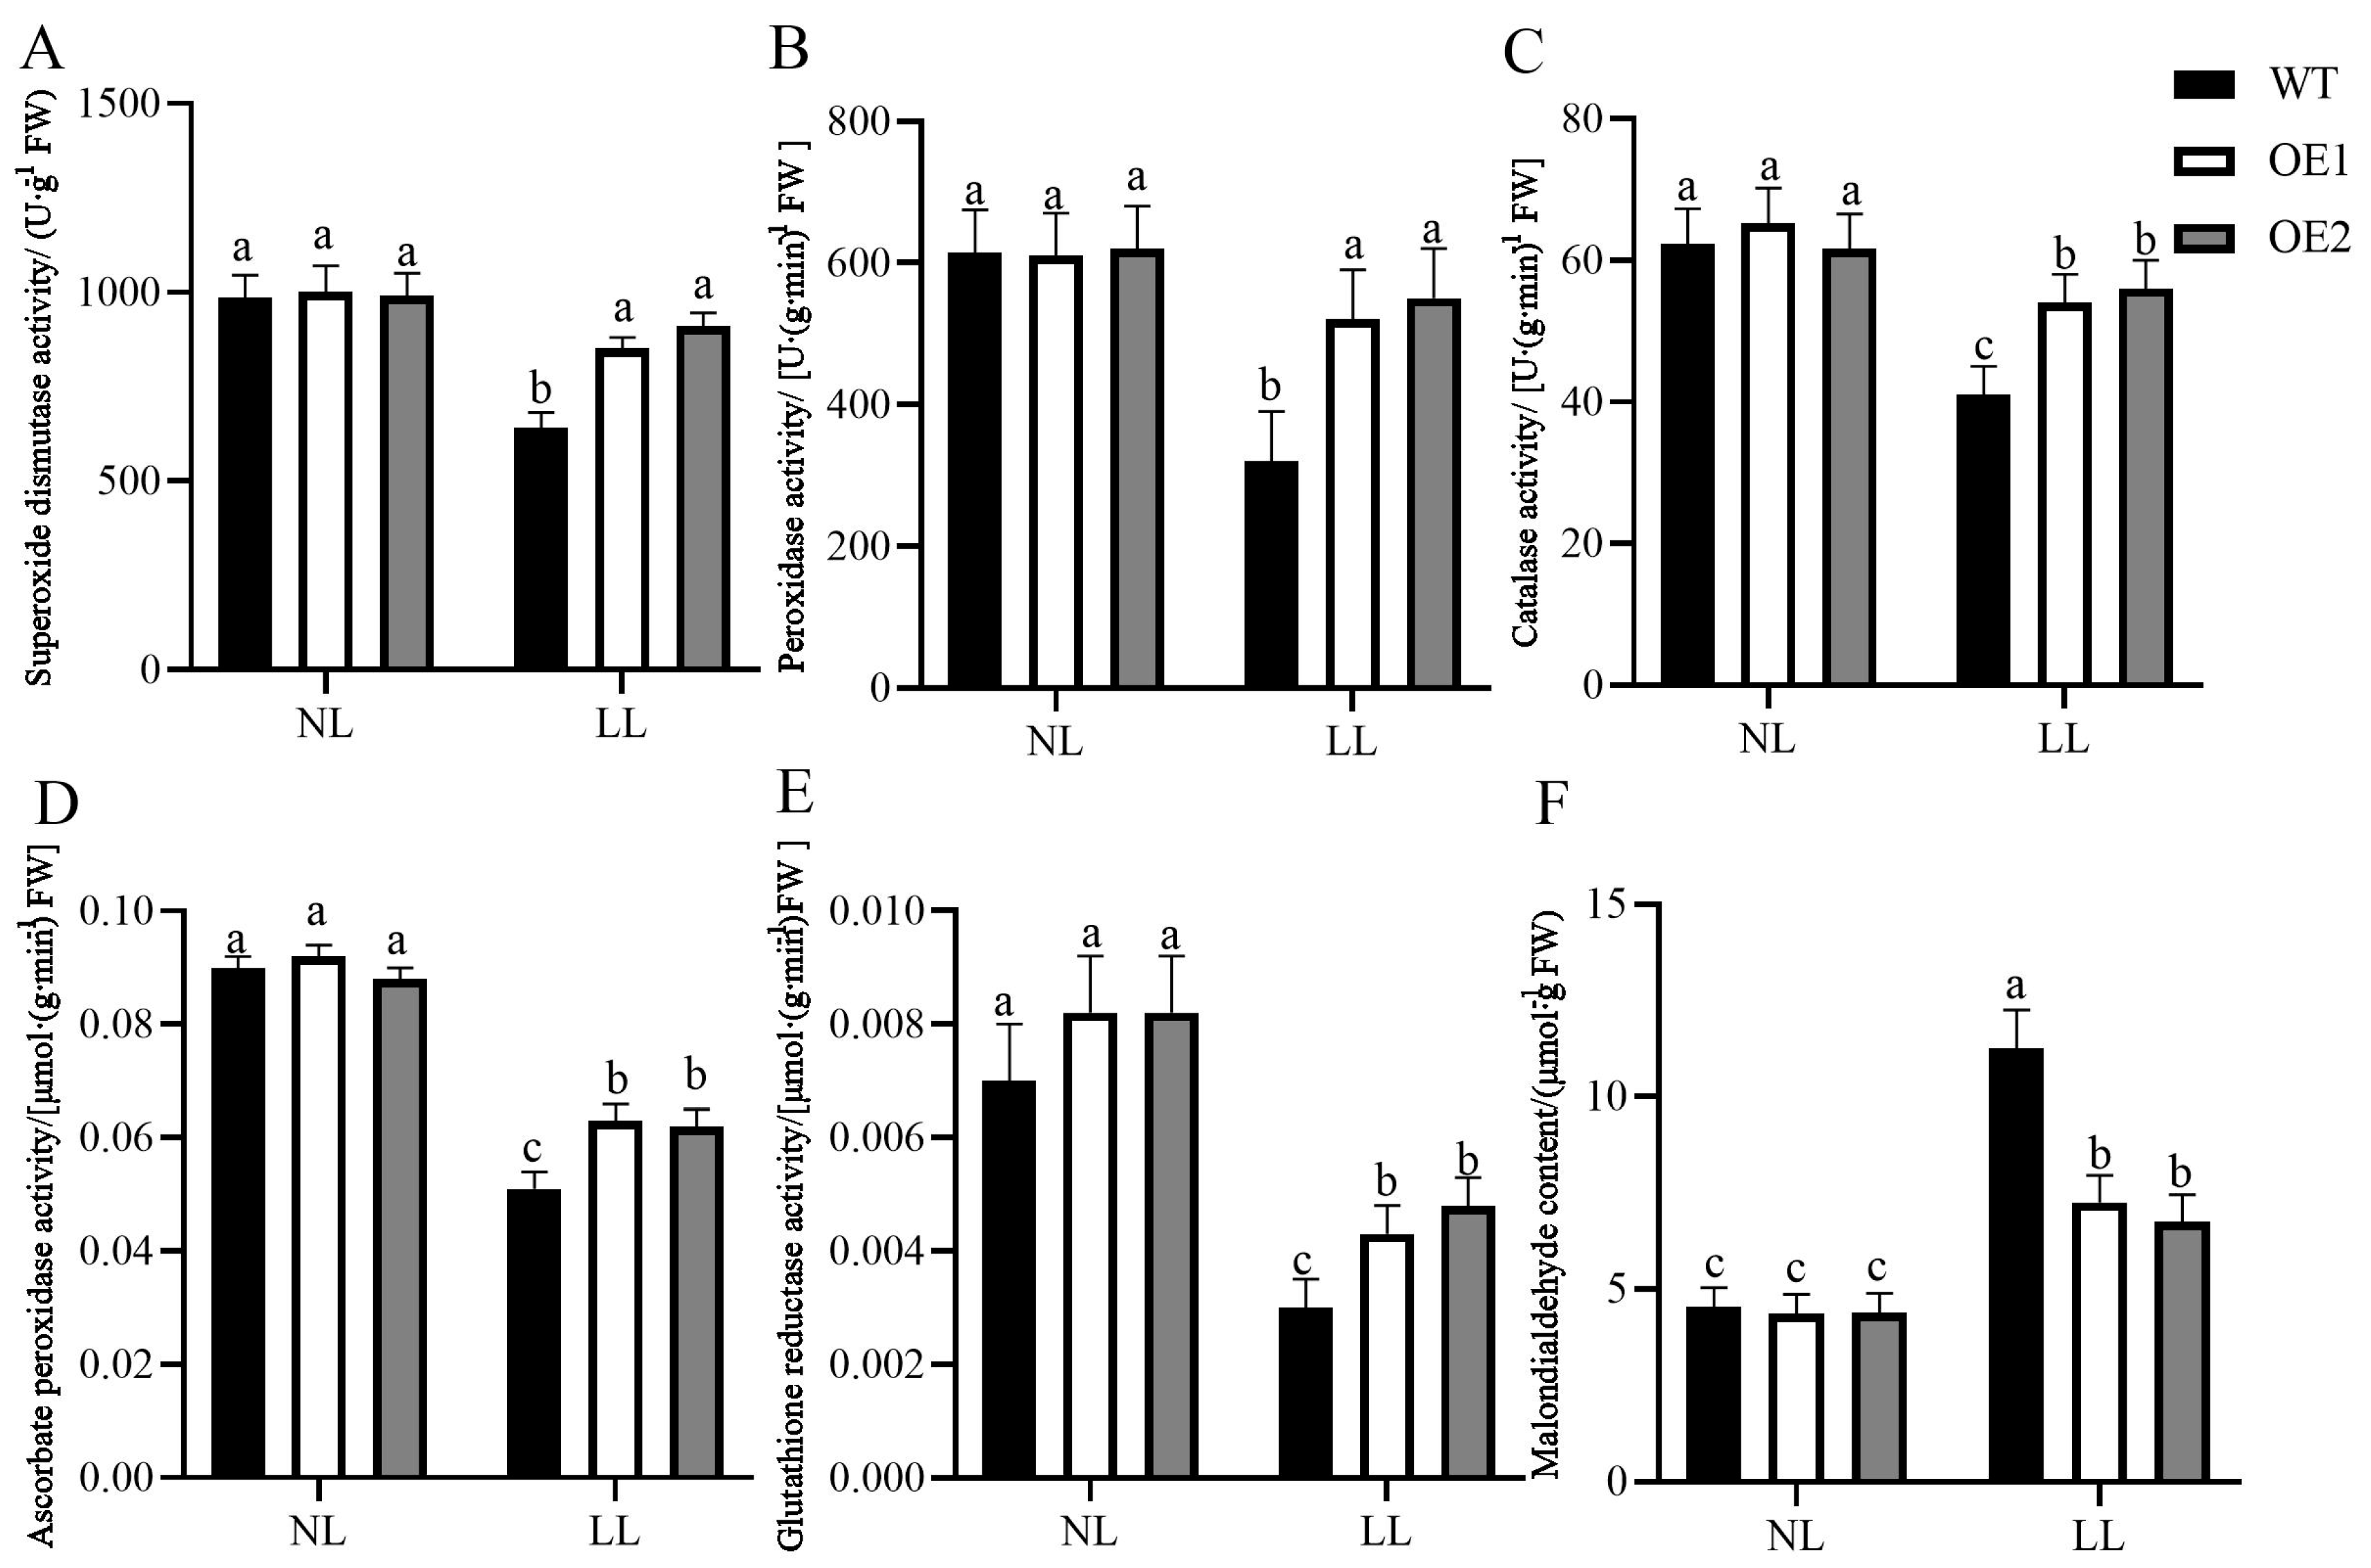
Under low-light stress, the activity levels of antioxidant enzymes were severely reduced in all plants, while the MDA content increased (Figure 5). However, under low-light conditions, compared with the WT, the activities of antioxidant enzymes significantly increased in OE1 and OE2. Specifically, superoxide dismutase (SOD) activity increased by 32.3% and 41.7%, respectively; peroxidase (POD) activity increased by 23.8% and 30.9%, respectively; catalase (CAT) activity increased by 34.1% and 40.4%, respectively; ascorbate peroxidase (APX) activity increased by 22.5% and 26.5%, respectively; and glutathione reductase (GR) activity increased by 24.6% and 39.1%, respectively, compared with the WT. Meanwhile, the MDA content in OE1 and OE2 decreased by 46.3% and 49.5%, respectively, compared with the WT. These results indicate that the overexpression of CdGLK1 in the transgenic lines reduced oxidative damage under low-light conditions.

3.5. Enrichment and Analysis of Differentially Expressed Genes

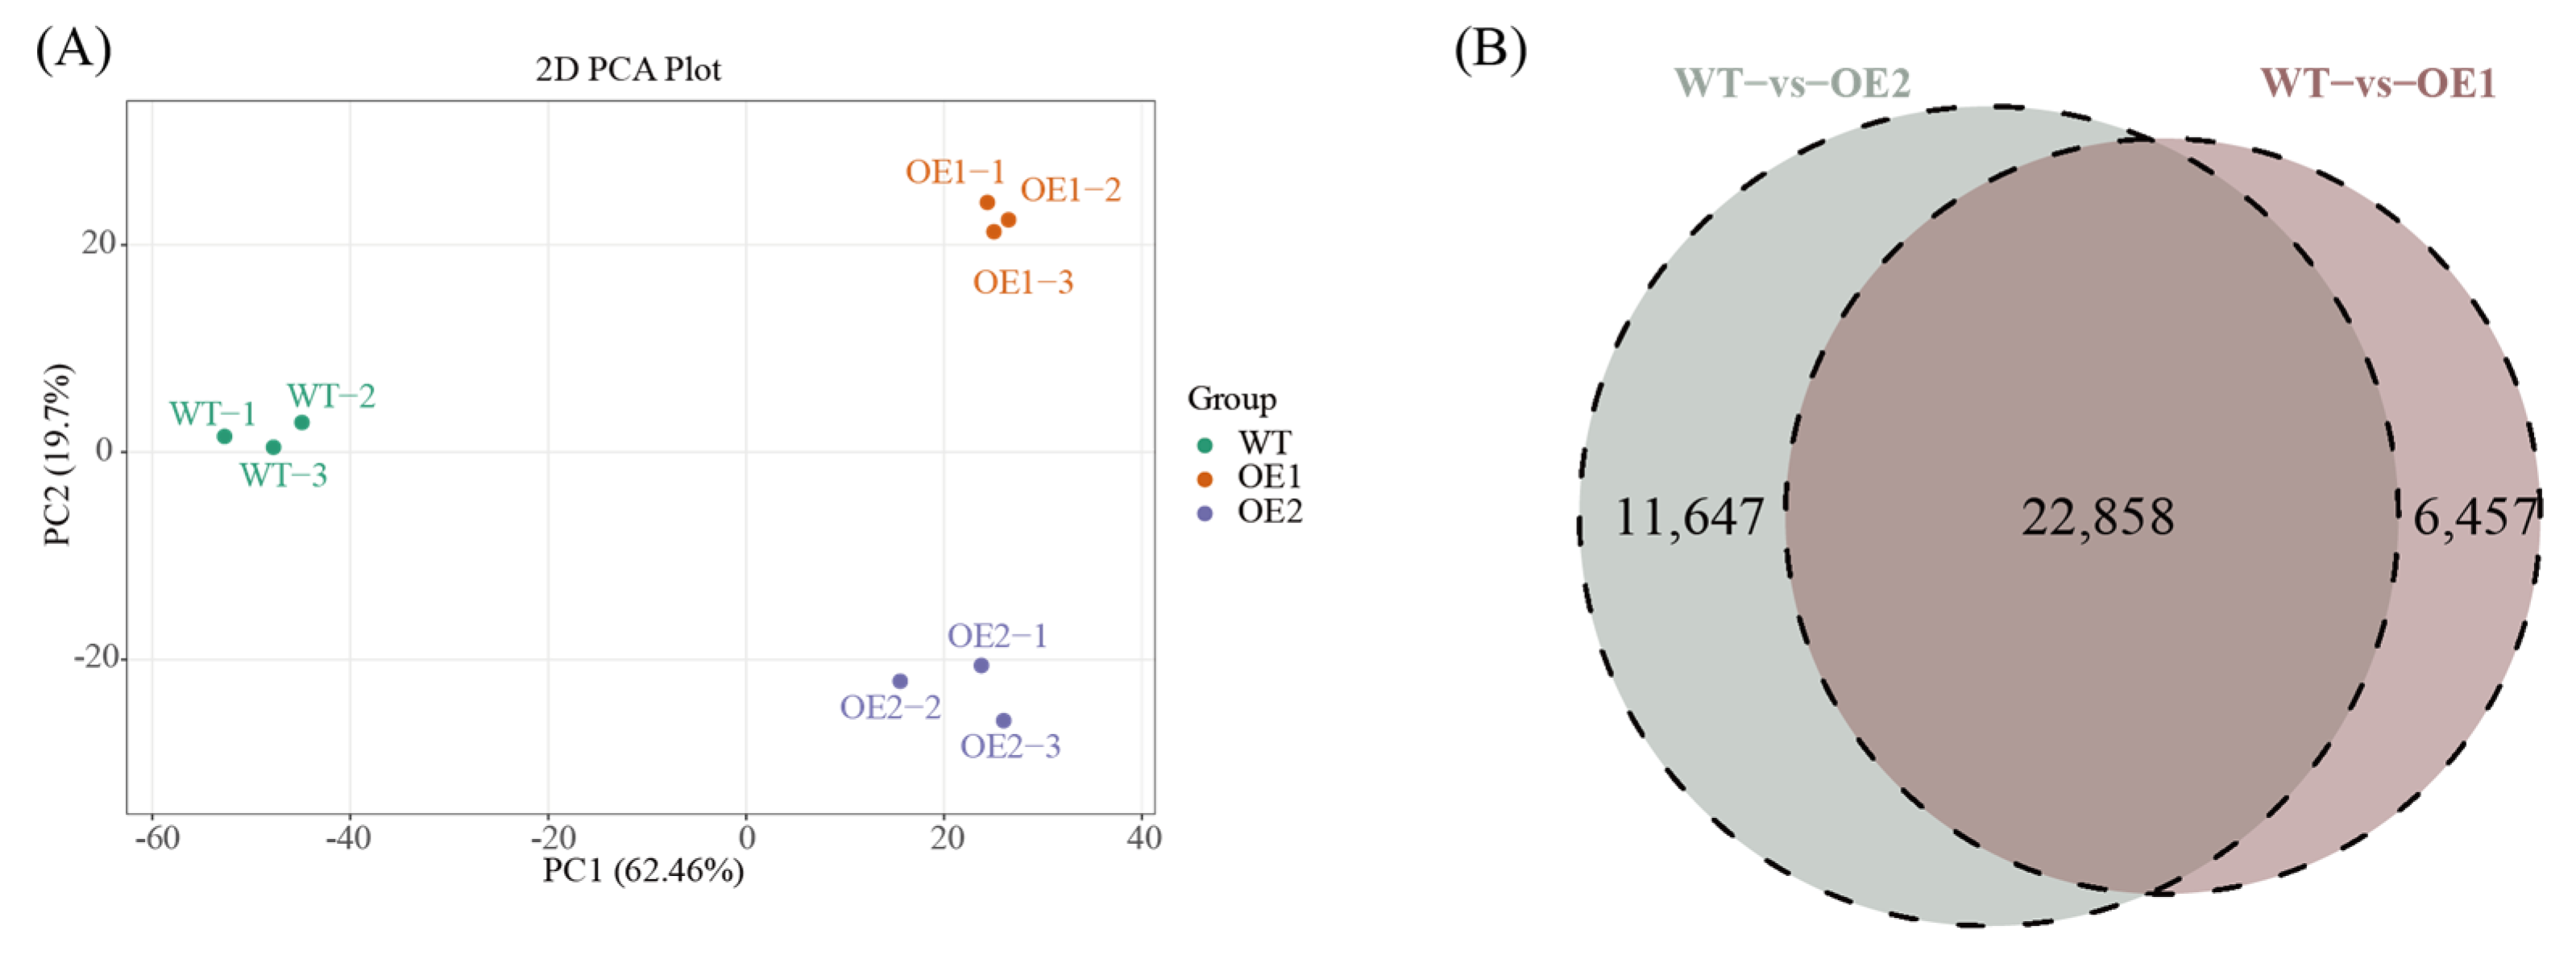
To evaluate the homogeneity and heterogeneity among different samples, PCA analysis was performed for all samples (Figure 6A). The results indicate that the WT and transgenic line samples were dispersed from each other, whereas samples within the same groups were clustered.
Compared with the WT, a total of 29,315 DEGs were identified in OE1, of which 12,314 were upregulated and 17,001 were downregulated. In OE2, 34,505 DEGs were identified, of which 14,344 were upregulated and 20,161 were downregulated (Figure 6B). Cluster analysis of DEGs was performed based on these differential expression results. In the OE1 vs. WT and OE2 vs. WT comparisons, 22,858 DEGs exhibited significant overlap.
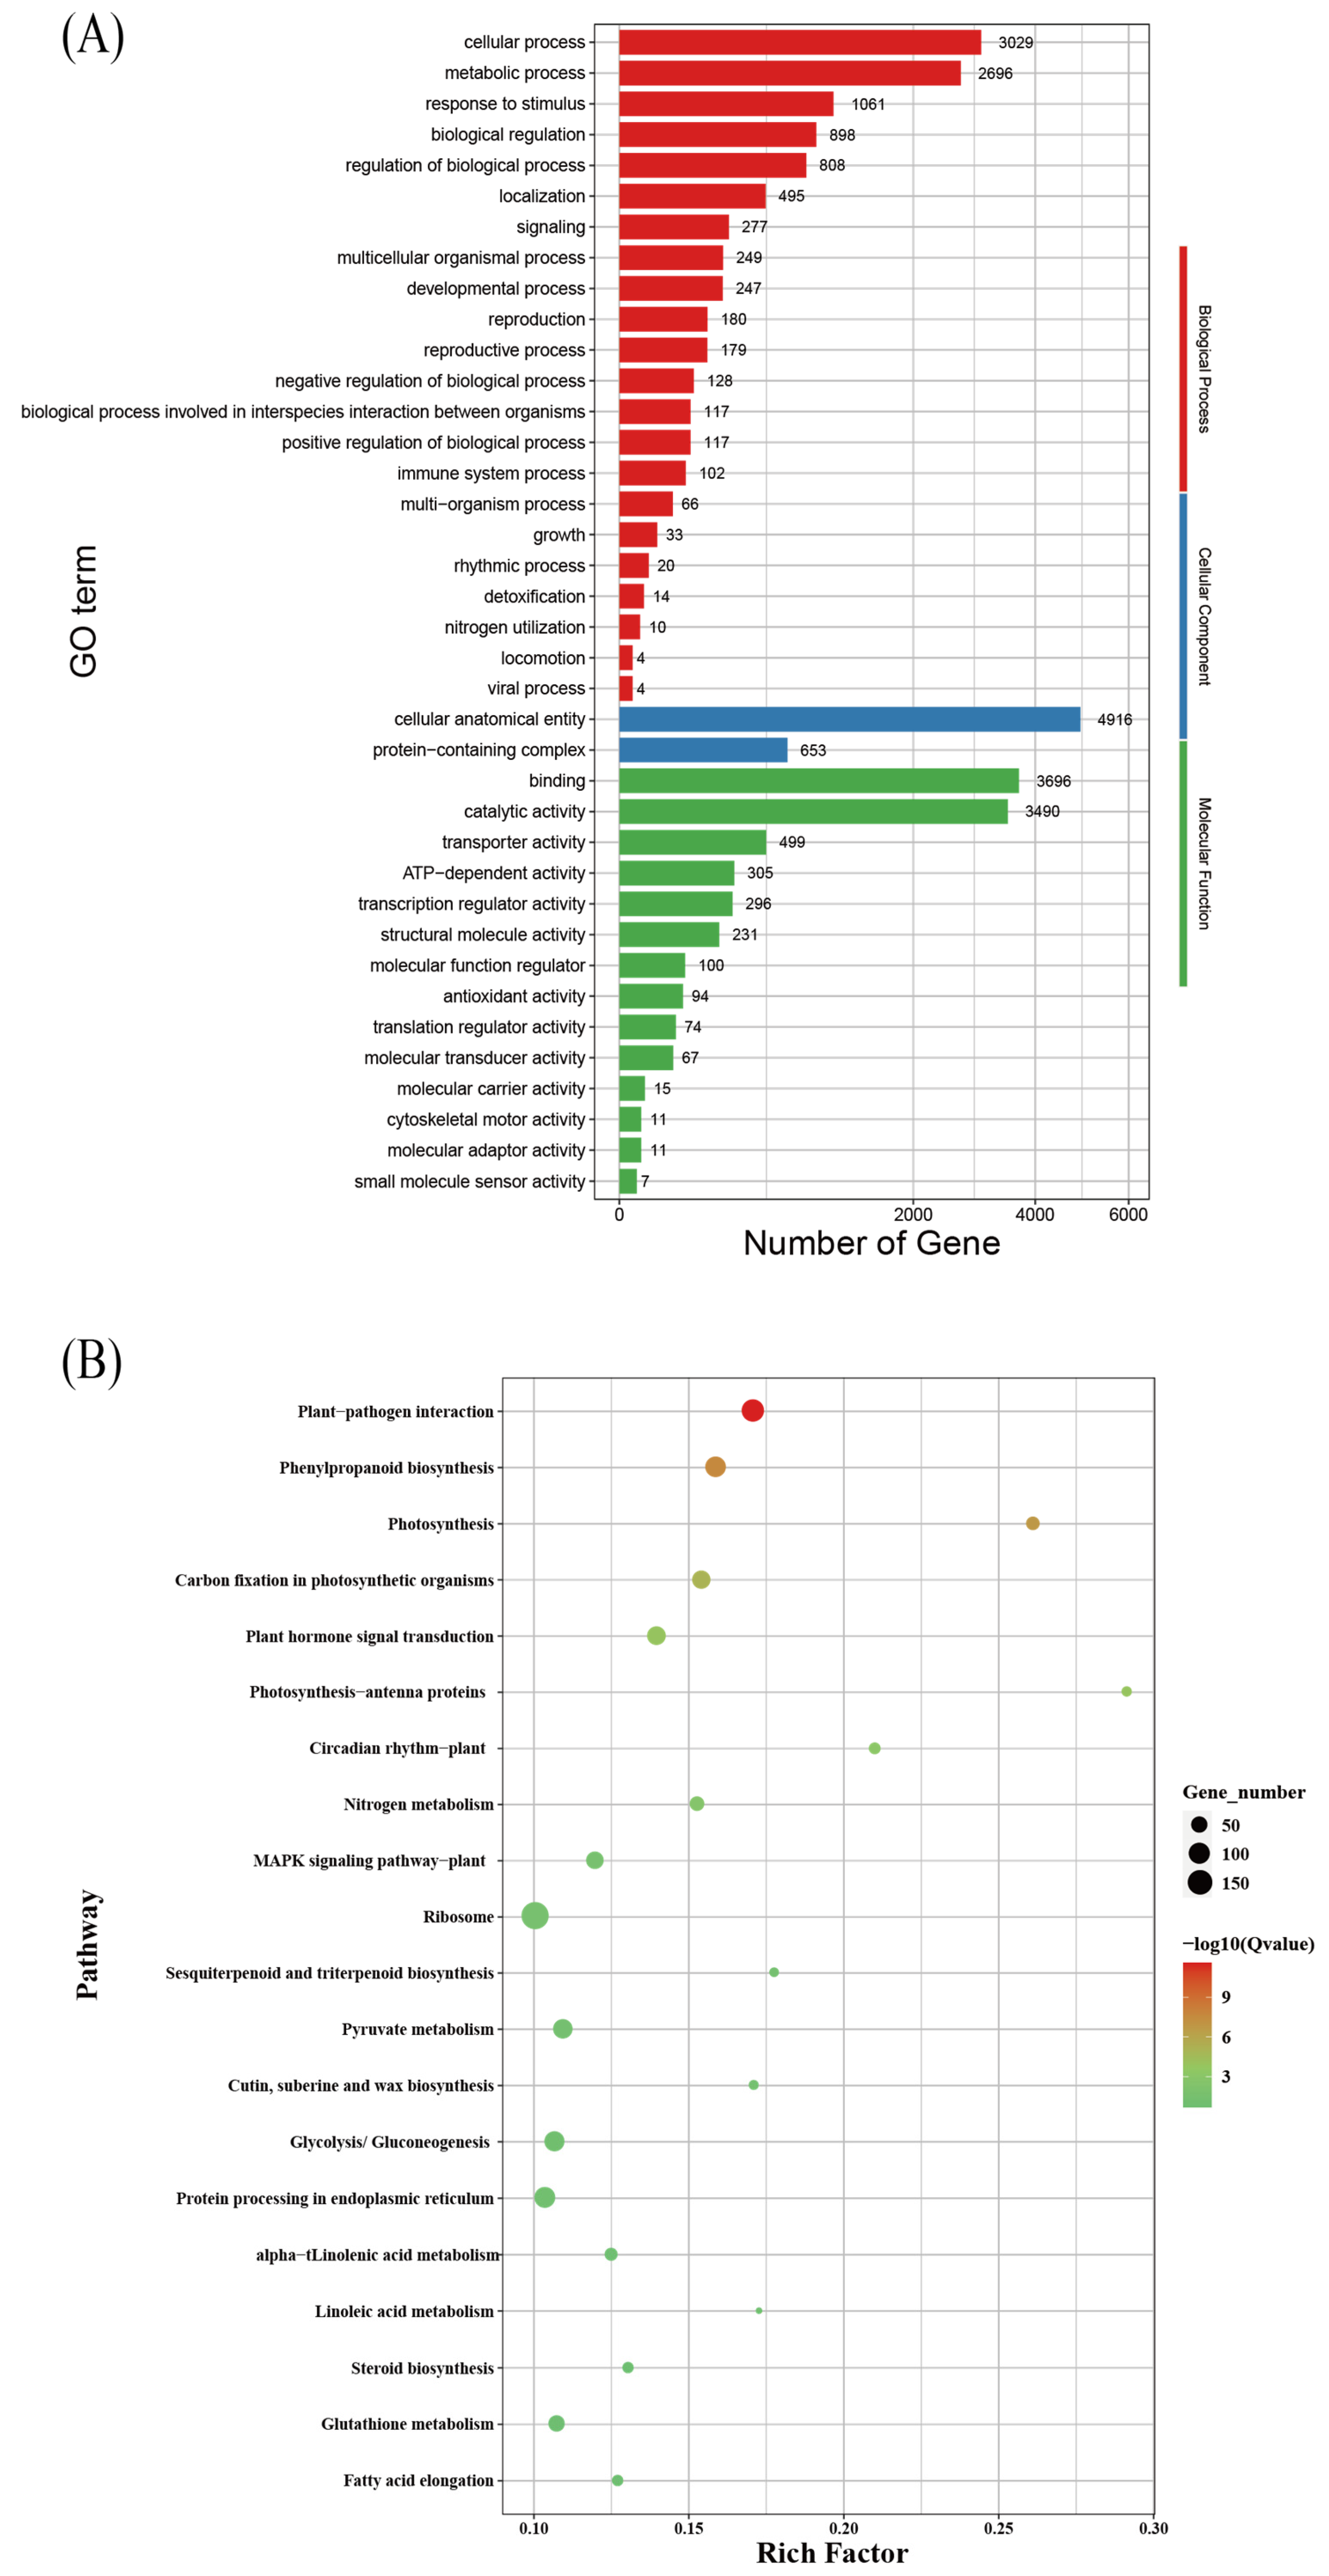
GO analysis revealed that “cellular anatomical entity” (4916 genes) and “protein-containing complex” (653 genes) were the most enriched terms in the cellular component category; “binding” (3696 genes) and “catalytic activity” (3490 genes) were the most enriched terms in the molecular function category; and “cellular process” (3029 genes) and “metabolic process” (2696 genes) were the most enriched terms in the biological process category (Figure 7A).
KEGG pathway enrichment analysis showed the top 20 enriched pathways among DEGs, including “plant–pathogen interaction,” “phenylpropanoid biosynthesis,” “photosynthesis,” “carbon fixation in photosynthetic organisms,” “photosynthesis–antenna proteins,” and “plant hormone signal transduction.” All of these enriched pathways were associated with responses to low-light stress (Figure 7B).
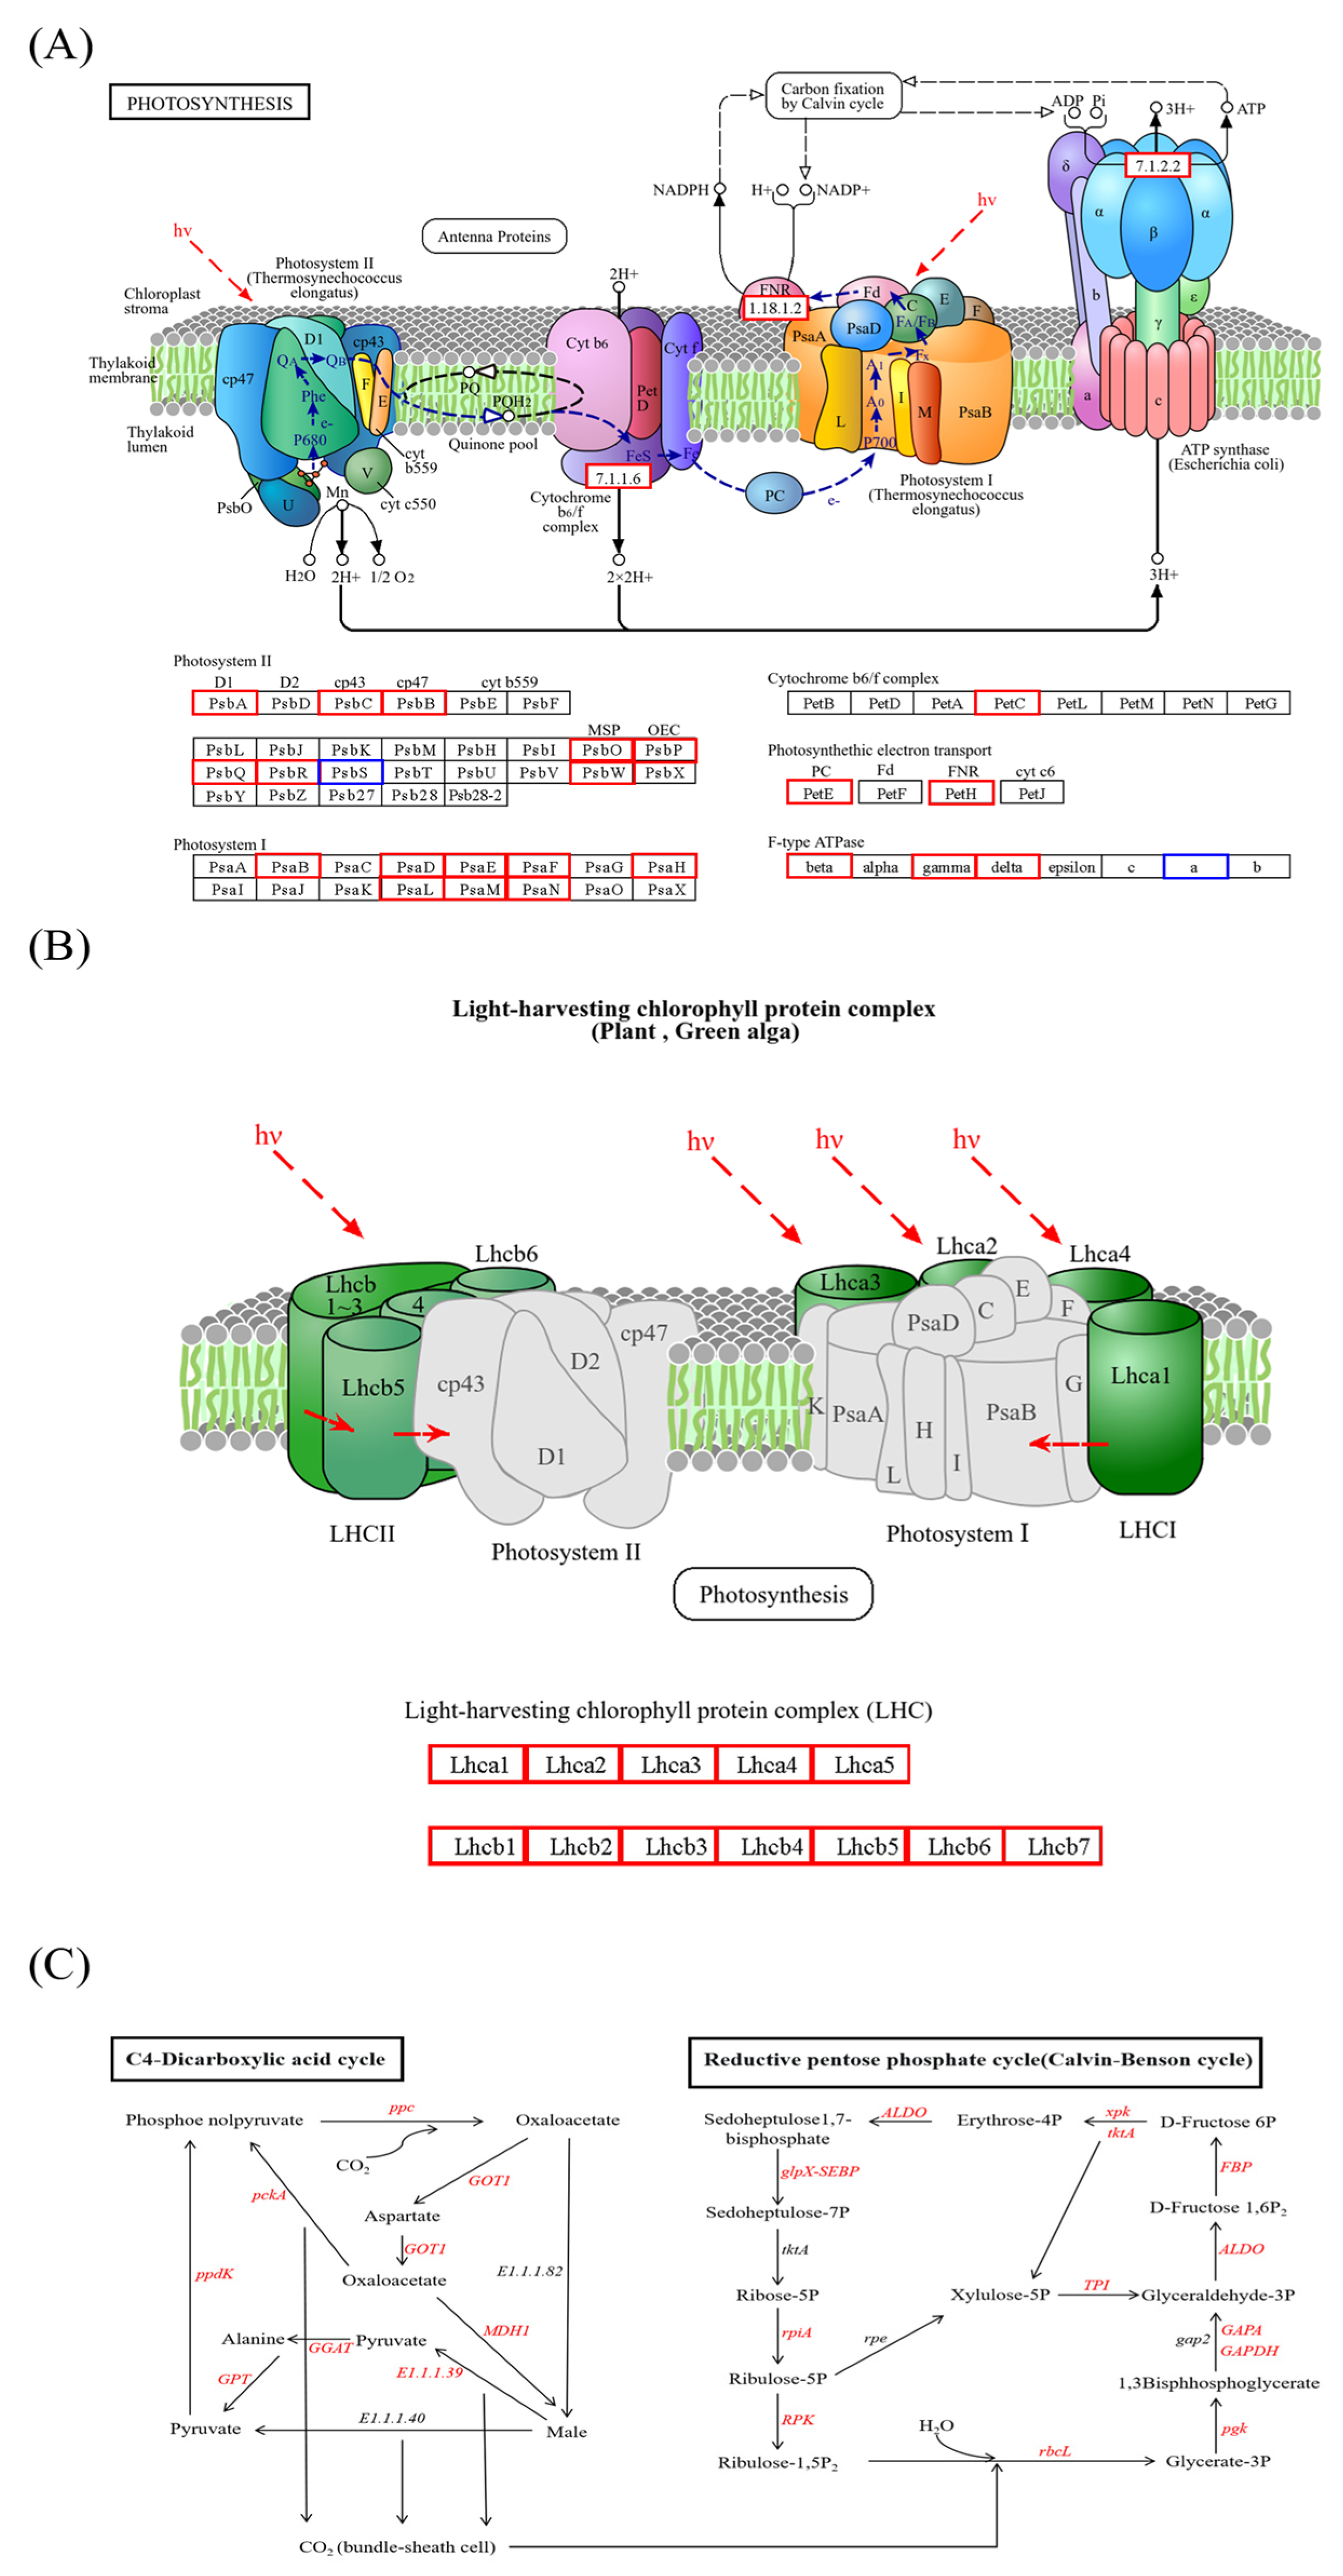
Low-light stress directly impacts plant photosynthesis. Therefore, based on KEGG enrichment analysis, photosynthesis-related DEGs in the leaves were investigated, revealing that the levels of psbS in photosystem II and atpF0A in F-type ATPase were significantly downregulated. These results indicate that the overexpression of CdGLK1 could enhance photosynthetic ability under low-light conditions.
Metabolic pathways related to photosynthetic antenna proteins were further analyzed to verify the light-harvesting ability in OE1 and OE2 (Figure 8B). A total of 16 DEGs were involved in photosynthesis-related antenna proteins. Compared with the WT, all 16 of these DEGs were significantly upregulated in OE1 and OE2. These results indicate that the overexpression of CdGLK1 could remarkably increase the light-harvesting ability under low-light conditions in bermudagrass.
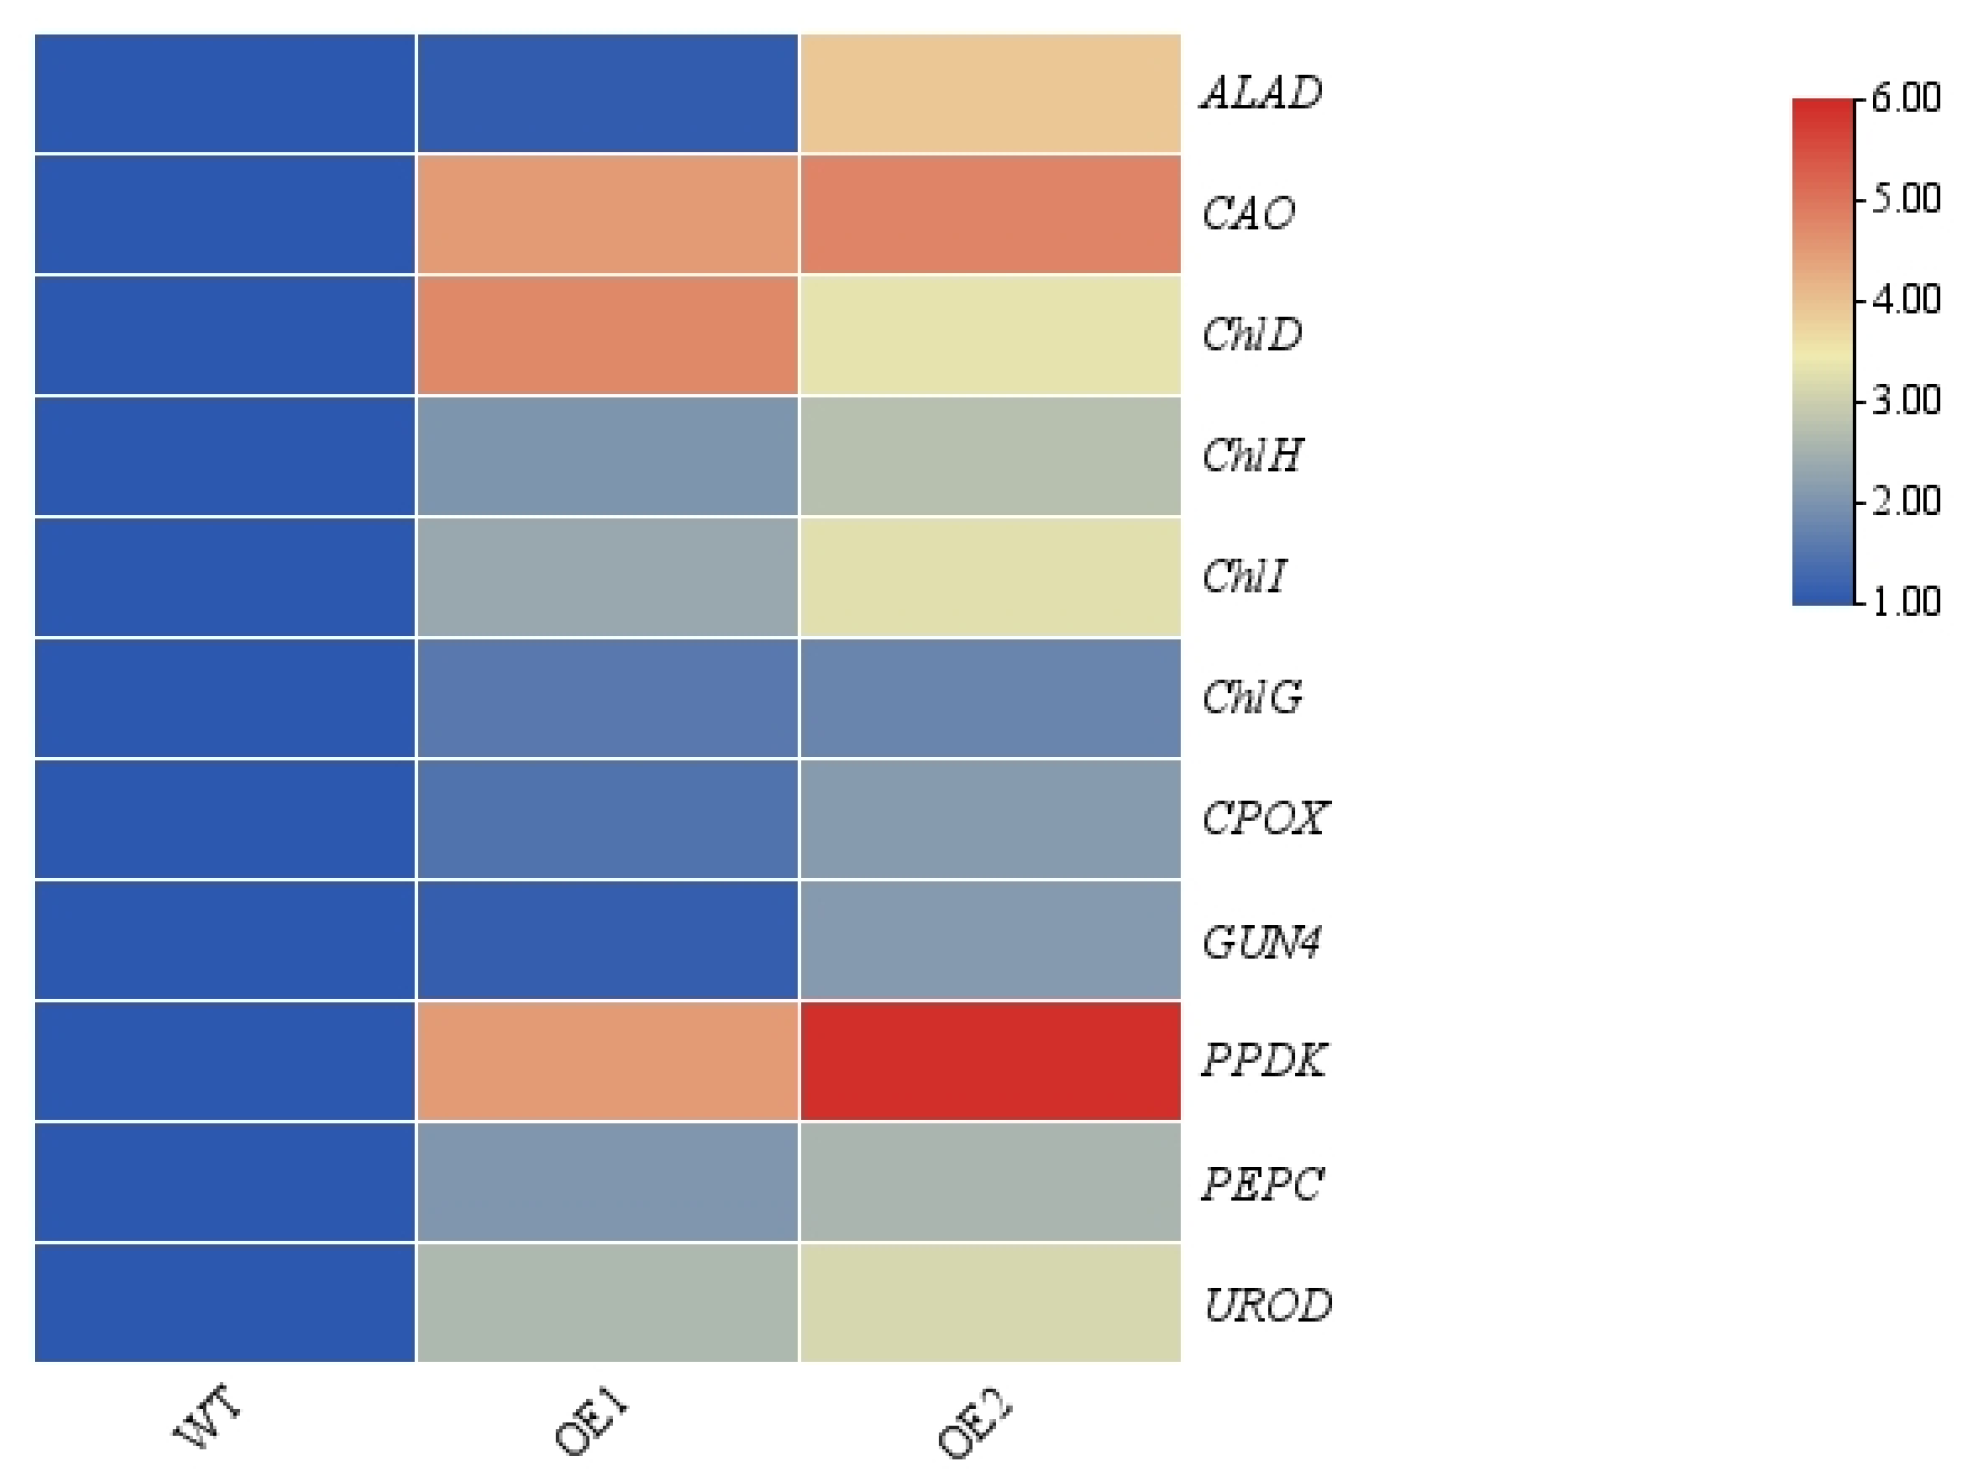
Additionally, DEGs related to carbon fixation in photosynthetic organisms were further investigated (Figure 8C). The results revealed that, compared with the WT, a total of 69 DEGs were enriched, among which 14 were significantly downregulated and 55 were significantly upregulated. Specifically, within the Calvin–Benson cycle, 13 genes (xfp, rbcL, PGK, GAPDH, GAPA, TPI, ALDO, FBP, tktA, glpX-SEBP, rpiA, PRK, and RPE) were significantly upregulated. Additionally, in the C4-dicarboxylic acid cycle, eight genes (pckA, PPDK, GPT, E1.1.1.39, PEPC, GOT1, MDH1, and maeB) were significantly upregulated. Among these genes, PPDK and PEPC are crucial rate-limiting enzymes in the C4 cycle. These findings demonstrate that the activity or efficiency of both the Calvin–Benson cycle and the C4-dicarboxylic acid cycle in the overexpression of transgenic lines was enhanced under low-light conditions. Additionally, the transcriptome data and qRT-PCR data show consistent results (Figure 9).

4. Discussion

Low-light stress is one of the most common abiotic factors causing the degradation of turf quality [37,38,39,40]. When exposed to low-light conditions, plants undergo morphological changes, such as leaf and stem elongation, which are a part of shade avoidance syndrome (SAS) [6,41]. Additionally, leaves age prematurely, typically beginning from the lower leaves and progressing upward [8,42]. Our experiment revealed that low-light conditions resulted in decreased tiller numbers, shoot weight, and root weight in bermudagrass (Figure 1). These findings align with previous research conducted on tall fescue (Festuca arundinacea) [7,8]. Nevertheless, compared with the WT, OE1 and OE2 showed significant increases in shoot and root weights and delayed senescence of lower leaves under low-light conditions. Furthermore, in the WT plants, senescence began at the base, manifested by leaf yellowing and chlorophyll degradation, and progressed acropetally, whereas the senescence process was significantly delayed in the OE1 and OE2 overexpression lines (Figure 2). These results demonstrate that the overexpression of CdGLK1 could effectively improve the growth performance of bermudagrass under low-light conditions.
In addition to morphological changes, low-light stress also significantly affects the photosynthetic capacity of plants (Figure 3). Chlorophyll, a crucial component of photosynthesis, directly influences photosynthetic efficiency [42,43,44]. Exposure to low-light conditions can alter chlorophyll content, and prolonged stress can lead to a significant decrease in chlorophyll levels, ultimately causing plant deterioration [45]. Conversely, brief periods of low-light stress may temporarily increase chlorophyll content while reducing the chlorophyll a/b ratio; a lower chlorophyll a/b ratio enhances the plant’s capacity to capture available light [8,45]. Therefore, the chlorophyll a/b ratio is an important indicator for evaluating plant tolerance to low-light stress [8]. In this study, the transgenic lines exhibited significantly higher chlorophyll content, along with a lower chlorophyll a/b ratio compared with the WT (Figure 3). Moreover, all 16 genes encoding photosynthetic antenna proteins and the key enzyme chlorophyllide a oxygenase (CAO), involved in chlorophyll b biosynthesis, were significantly upregulated compared to in the WT (Figure 9). As a core component of the thylakoid membrane, LHCs are essential for photon capture, with their expression levels directly determining plant shade tolerance by modulating light-harvesting efficiency [46]. Tanaka et al. demonstrated that GLK transcription factors orchestrate a synergistic regulatory network, simultaneously activating LHC genes and chlorophyll biosynthesis genes. This coordinated regulation facilitates the stable assembly of LHCII-PSII supercomplexes, thereby enhancing the structural integrity of the thylakoid membrane system under low-light conditions [26,46]. These results further indicate that the transgenic lines have a strong light-capturing ability and a stable light system under weak light conditions.
Fv/Fm, a core photosynthetic parameter reflecting photosystem II efficiency [43,47,48,49], showed contrasting responses in different genotypes. Under low-light stress, the WT exhibited significant Fv/Fm reduction, consistent with findings in tall fescue, likely due to GLK downregulation impairing both photosystem II repair and chlorophyll biosynthesis [21,48]. In contrast, CdGLK1-overexpressing lines maintained higher Fv/Fm values under low light, demonstrating enhanced photosynthetic capacity [49]. Notably, these transgenic lines also showed elevated Fv/Fm, chlorophyll content, and Pn under normal-light conditions, paralleling the conserved CdGLK1-mediated photosynthetic enhancement observed in Arabidopsis, rice (Oryza sativa), and maize (Zea mays) [11,21,50].
Meanwhile, low-light treatment reduces the expression and activity of enzymes involved in carbon fixation (Figure 4). Rubisco activity is crucial for the C3 cycle, and enhancing Rubisco activity can improve carboxylation efficiency and the RuBP regeneration capacity [51]. Additionally, RCA is essential for activating Rubisco, enabling it to catalyze carboxylation and oxygenation reactions. Under adverse environmental conditions, such as disease and heat stress, RCA maintains Rubisco activity, thereby sustaining normal photosynthesis. Rubisco catalyzes the fixation of CO2 into 3-phosphoglycerate (PGA), and Ru5PK facilitates the subsequent metabolism of PGA [51,52]. These two enzymes are intricately linked in the carbon assimilation pathway, working together to sustain photosynthetic efficiency. However, both Rubisco and Ru5PK activities are influenced by environmental factors such as light intensity and drought [42,43,44,45,46,47,48,49,50,51,52,53,54]. Our study revealed that the CdGLK1-overexpressing transgenic lines exhibited higher activities of Rubisco, Ru5PK, and RCA compared with the WT under low-light conditions (Figure 4). Furthermore, in the C3 cycle, the expression level of the Rubisco subunit gene rbcL was significantly increased, directly enhancing the carboxylation efficiency of ribulose-1,5-bisphosphate (RuBP) [8]. This suggests that CdGLK1 plays a pivotal role in maintaining the stability and functionality of the C3 cycle under low-light stress.
Although numerous studies have focused on the effects of low-light stress on enzymes involved in the C3 photosynthetic pathway, relatively few studies have examined the impact of low-light stress on enzymes participating in the C4 cycle [8]. The C4 photosynthetic process relies on two crucial rate-limiting enzymes: PEPC and PPDK [54]. PPDK catalyzes the conversion of pyruvate (Pyr) into phosphoenolpyruvate (PEP), which serves as the primary CO2 acceptor in C4 photosynthetic carbon assimilation. PEP and its downstream metabolites, such as oxaloacetate (OAA) and malate (Mal), are essential precursors for numerous biochemical reactions. Moreover, the PEP generated by PPDK provides the carbon framework necessary for synthesizing citrate and glutamic acid [51,54]. PEPC serves multiple functions, including supplementing C4-dicarboxylic acids for energy production and biosynthesis, delaying plant senescence, and supplying intermediates for the tricarboxylic acid (TCA) cycle [53,54]. The C4 pathway relies critically on these two rate-limiting enzymes, PEPC and PPDK [54]. Our results demonstrate that the CdGLK1-overexpressing transgenic lines exhibited significantly enhanced PEPC and PPDK activities under low-light conditions. These findings suggest that the overexpression of CdGLK1 in bermudagrass could enhance the stability of the C4 cycle, thereby supporting plant growth and metabolic functions under low-light conditions.
Low-light stress impairs photosynthetic efficiency and weakens antioxidant defenses, leading to ROS accumulation and oxidative damage, as shown by elevated MDA levels [8,52,55,56,57,58,59]. In the CdGLK1-overexpressing lines, an enhanced light-harvesting capacity alleviated carbon starvation by sustaining photosynthetic electron transport. This metabolic stabilization enabled efficient ROS scavenging, converting superoxide radicals into hydrogen peroxide and subsequently decomposing it, providing robust protection against photoinhibition [44,48,49,50,51,52]. Under low light, the transgenic lines exhibited both preserved photosynthetic parameters and significantly higher antioxidant enzyme activities alongside reduced MDA levels compared to the WT (Figure 5), demonstrating a synergistic mitigation of light-stress-induced damage. These results align with strategies that improve plant resilience through the coordinated optimization of photosynthesis and antioxidant systems [44,60,61], highlighting CdGLK1’s dual role in preventing energy collapse via photosynthetic reinforcement and sustaining ROS detoxification through metabolic resource allocation—a mechanistic interaction specific to shade adaptation. While overexpression of CdGLK1 generally enhances photosynthetic parameters under both low-light and normal conditions (Figure 3 and Figure 4), its specific contribution to low-light tolerance arises from the antioxidant capacity that alleviates leaf senescence and oxidative damage characteristic of low-light conditions (Figure 2 and Figure 5). This adaptive mechanism, combined with sustained photosynthetic efficiency, promotes prioritized resource allocation to stress adaptation under shading (Figure 5).
Thus, the synergistic enhancement of photosynthetic capacity and systemic elevation of antioxidant enzyme activity collectively constitute the core physiological mechanism by which CdGLK1 confers low-light tolerance in bermudagrass. Having established the functional framework of CdGLK1 under shade stress, future studies will integrate the bermudagrass reference genome to systematically dissect CdGLK1’s regulatory network and the cis-regulatory elements of its target genes, thereby comprehensively elucidating the molecular mechanisms underlying its role in shade adaptation. Furthermore, we will expand investigations to explore how varying light quality and shading duration modulate transcriptomic dynamics and metabolomic remodeling in bermudagrass, aiming to uncover the multidimensional interplay between environmental factors and genetic regulation in shaping shade tolerance.

5. Conclusions

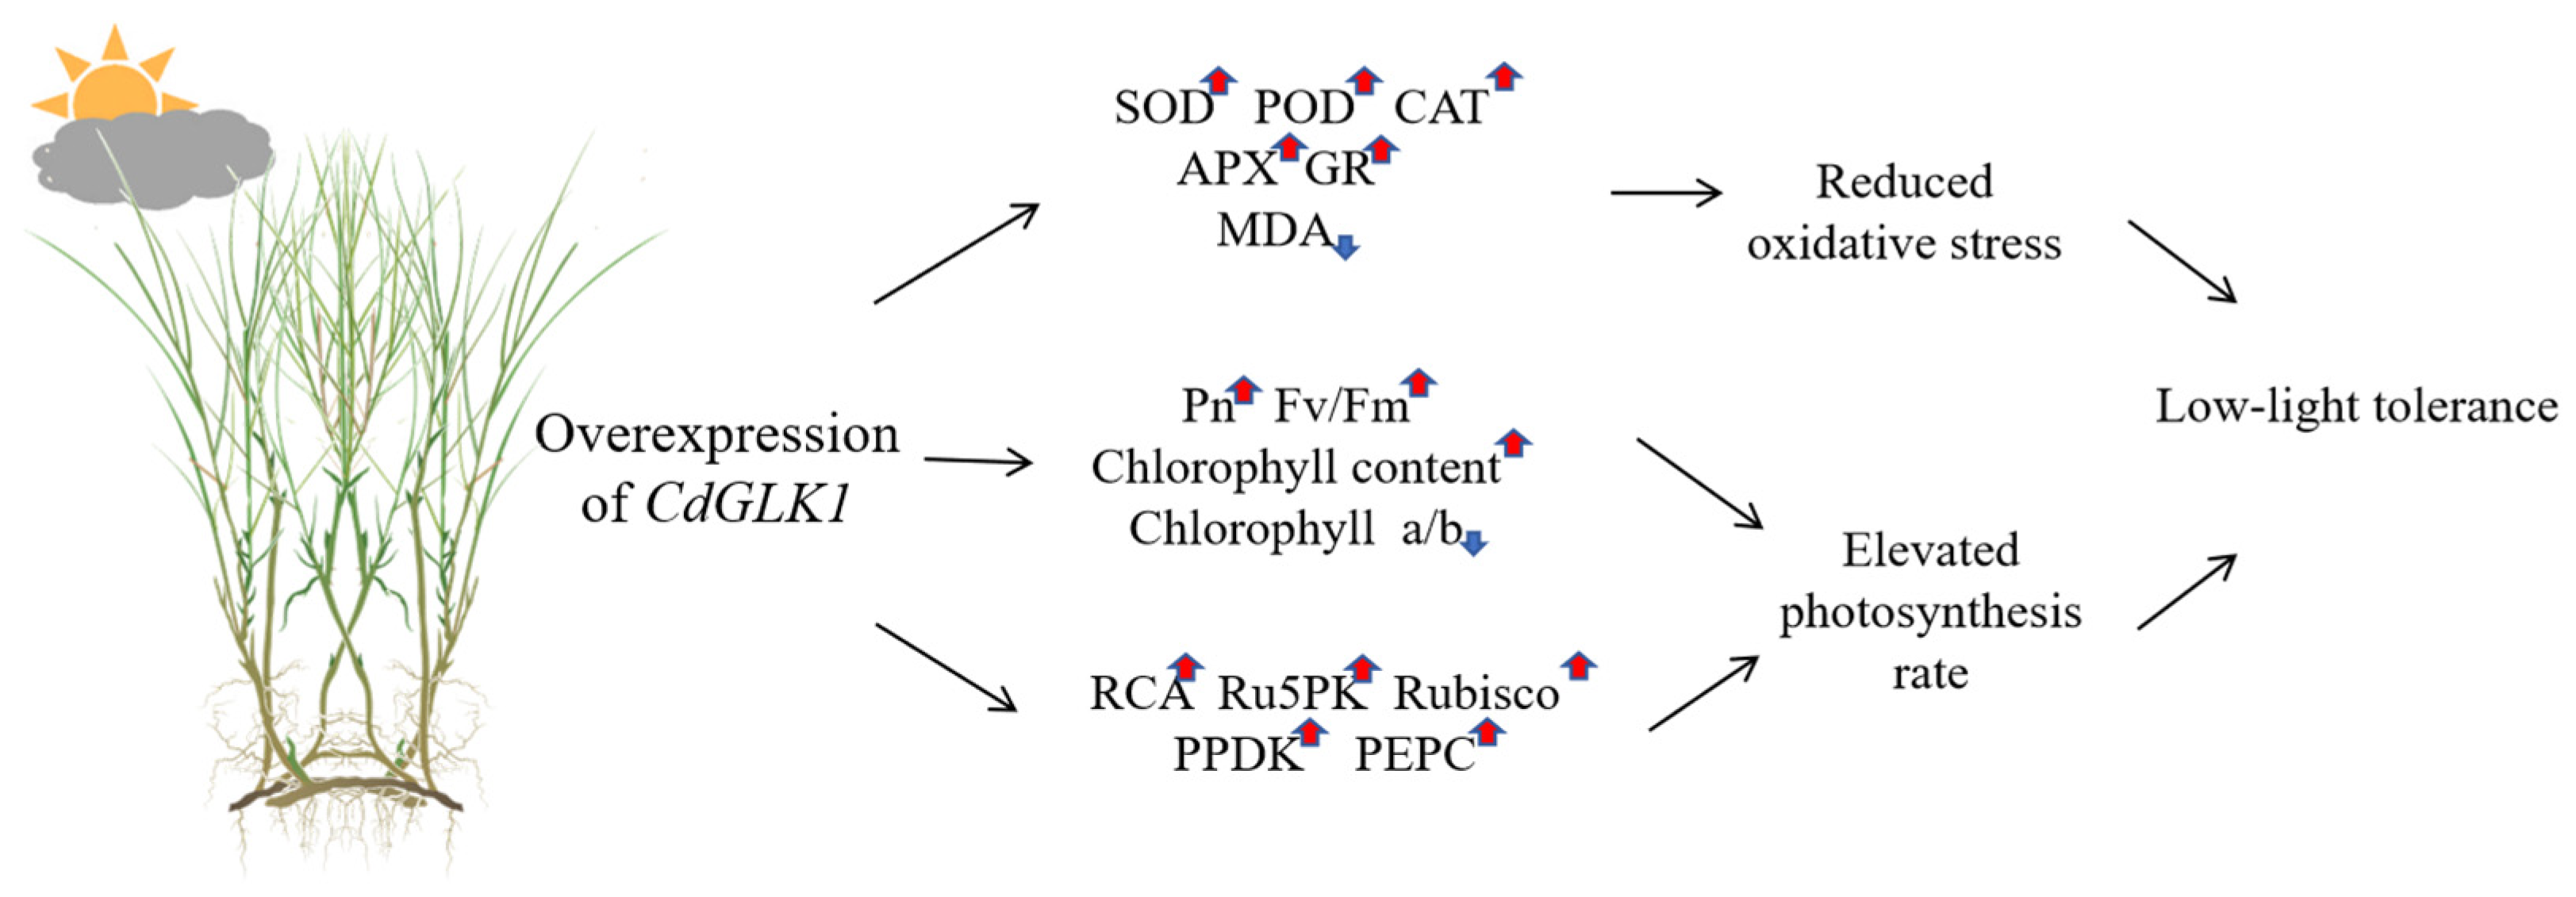
In conclusion, low-light stress significantly affects the photosynthetic capacity and growth of bermudagrass; however, the overexpression of CdGLK1 remarkably enhanced its tolerance (Figure 10). Under low-light stress, transgenic lines developed superior morphological adaptations, including increased shoot and root biomass, delayed leaf senescence, and enhanced tiller formation, indicating enhanced shade adaptation. Additionally, the CdGLK1-overexpressing lines retained elevated chlorophyll levels with optimized a/b ratios, suggesting improved light capture efficiency compared to the WT. Moreover, the CdGLK1-overexpressing lines exhibited elevated activities of antioxidant enzymes (SOD, POD, CAT, APX, and GR) along with reduced MDA accumulation, indicating stronger ROS scavenging capacity and less oxidative damage. Taken together, these findings provide insight into the molecular and physiological mechanisms underlying CdGLK1-mediated low-light tolerance and identify CdGLK1 as a promising genetic target for developing shade-tolerant bermudagrass cultivars through breeding programs.

Author Contributions

Conceptualization, P.H. and Z.Y.; methodology, Z.L.; software, F.H.; data curation, J.Y.; writing—original draft preparation, P.H. and J.L.; writing—review and editing, Z.Y.; visualization, F.H.; funding acquisition, Z.Y. All authors have read and agreed to the published version of the manuscript.

Funding

This research was funded by the Breeding of New Varieties Evergreen Grass in Yangtze River Delta (ZA32303), and the Fundamental Research Funds for the Central Universities (KYPT2024006).

Data Availability Statement

All data are presented in this report.

Conflicts of Interest

The authors declare no conflicts of interest.

Appendix A

Figure A1. Particle bombardment-mediated transformation of bermudagrass. The calli of bermudagrass were treated via particle bombardment (A). Regenerated plants (B) were identified using GUS assay (C), PCR analysis (D), and qRT-PCR (E). Data represent mean ± standard error (SE). Different letters indicate significant differences at p ≤ 0.05. Error bars represent standard error (SE). WT: wild-type; OE1: CdGLK1-overexpressing line 1; OE2: CdGLK1-overexpressing line 2.
Agronomy 15 01225 g0a1

References

  1. Lee, G.; Carrow, R.N.; Duncan, R.R. Salinity tolerance of selected Seashore paspalums and bermudagrasses: Root and verdure responses and criteria. HortScience 2004, 39, 1143–1147. [Google Scholar] [CrossRef]
  2. Chen, J.; Thammina, C.; Li, W.; Yu, H.; Yer, H. Isolation of prostrate turfgrass mutants via screening of dwarf phenotype and characterization of a perennial ryegrass prostrate mutant. Hortic. Res. 2016, 3, 16031. [Google Scholar] [CrossRef] [PubMed]
  3. Fox, J.L.; Jespersen, D.; Baxter, L.L.; Snider, J.L.; Iersel, M.W.V.; Schwartz, B.M. Towards estimating shade response of bermudagrass (Cynodon spp.) using field-based photosynthetic properties. Grass Res. 2022, 2, 20–25. [Google Scholar] [CrossRef]
  4. Guo, Z.; Jiang, J.; Dong, L.; Sun, X.; Chen, J.; Xie, F.; Chen, Y. Shade responses of prostrate and upright turf-type bermudagrasses. Grass Res. 2022, 2, 62–70. [Google Scholar] [CrossRef]
  5. Frangedakis, E.; Yelina, N.E.; Billakurthi, K.; Hua, L.; Schreier, T.; Dickinson, P.J.; Tomaselli, M.; Haseloff, J.; Hibberd, J.M. MYB-related transcription factors control chloroplast biogenesis. Cell 2024, 187, 1–18. [Google Scholar] [CrossRef] [PubMed]
  6. Gommers, C.M.M.; Visser, E.J.W.; Onge, K.R.S.; Voesenek, L.; Pierik, R. Shade tolerance: When growing tall is not an option. Trends Plant Sci. 2013, 18, 65–71. [Google Scholar] [CrossRef]
  7. Wen, S.; Liu, B.; Long, S.; Gao, S.; Liu, Q.; Liu, T.; Xu, Y. Low nitrogen level improves low light tolerance in tall fescue by regulating carbon and nitrogen metabolism. Environ. Exp. Bot. 2021, 194, 104749. [Google Scholar] [CrossRef]
  8. Long, S.; Liu, Q.; Guo, H.; Li, X.; You, X.K.; Liu, B.W.; Gao, S.H.; Wen, S.Y.; Liu, T.Y.; Xu, Y.F. Integrated physiological and transcriptomic analyses reveal differential photosynthetic responses to low light stress in tall fescue cultivars. Sci. Hortic. 2022, 304, 111343. [Google Scholar] [CrossRef]
  9. Jiang, Y.; Ronny, R.; Robert, N. Assessment of low light tolerance of seashore paspalum and bermudagrass. Crop Sci. 2004, 44, 587–594. [Google Scholar] [CrossRef]
  10. Mcbee, G. Association of certain variations in light quality with the performance of selected turfgrasses. Crop Sci. 1969, 9, 14–17. [Google Scholar] [CrossRef]
  11. Waters, M.T.; Wang, P.; Korkaric, M.; Capper, R.G.; Saunders, N.J.; Langdale, J.A. GLK transcription factors coordinate expression of the photosynthetic apparatus in Arabidopsis. Plant Cell 2009, 21, 1109–1128. [Google Scholar] [CrossRef] [PubMed]
  12. Cackett, L.; Luginbuehl, L.H.; Schreier, T.B.; Lopez, J.E.; Hibberd, J.M. Chloroplast development in green plant tissues: The interplay between light, hormone, and transcriptional regulation. New Phytol. 2021, 229, 1355–1370. [Google Scholar] [CrossRef]
  13. Koichi, K.; Daichi, S.; Ko, N.; Daiki, F.; Hirohisa, K.; Masami, K.; Mayuko, S.; Kiminori, T.; Keiko, S.; Niyogi, K. Photosynthesis of root chloroplasts developed in Arabidopsis lines overexpressing GOLDEN2-LIKE transcription factors. Plant Cell Physiol. 2013, 54, 1365–1377. [Google Scholar]
  14. Carina, B.; Schwechheimer, C. B-GATA transcription factors—Insights into their structure, regulation, and role in plant development. Front. Plant Sci. 2015, 6, 90–95. [Google Scholar]
  15. Yan, Z.; Blakley, I.C.; Franco, J.M.; Zorrilla, F.; Yamburenko, M.V.; Roberto, S.; Kieber, J.J.; Loraine, A.E.; Eric, S.G. Coordination of chloroplast development through the action of the GNC and GLK transcription factor families. Plant Physiol. 2018, 178, 720–735. [Google Scholar]
  16. Wang, P.; Fouracre, J.; Kelly, S.; Karki, S.; Gowik, U.; Aubry, S.; Shaw, M.K.; Westhoff, P.; Inez, H.S.; Quick, W.P.; et al. Evolution of GOLDEN2-LIKE gene function in C3 and C4 plants. Planta 2012, 237, 481–495. [Google Scholar] [CrossRef] [PubMed]
  17. Rossini, L.; Cribb, L.; Martin, D.J. The maize Golden2 gene defines a novel class of transcriptional regulators in plants. Plant Cell 2001, 13, 1231–1244. [Google Scholar] [CrossRef]
  18. Bravo, G.A.; Yasumura, Y.; Langdale, J.A. Specialization of the Golden2-like regulatory pathway during land plant evolution. New Phytol. 2009, 183, 133–141. [Google Scholar] [CrossRef] [PubMed]
  19. Nakamura, H.; Muramatsu, M.; Hakata, M.; Makoto, H.; Osamu, U.; Yoshiaki, N.; Hirohiko, H.; Makoto, T.; Hiroaki, I. Ectopic overexpression of the transcription factor OsGLK1 induces chloroplast development in non-green rice cells. Plant Cell Physiol. 2009, 50, 1933–1949. [Google Scholar] [CrossRef]
  20. Brand, A.; Borovsky, Y.; Hill, T.; Rahman, K.A.; Bellalou, A.; Deynze, A.V. CaGLK2 regulates natural variation of chlorophyll content and fruit color in pepper fruit. Theor. Appl. Genet. 2014, 127, 2139–2148. [Google Scholar] [CrossRef]
  21. Kim, N.; Jeong, J.; Kim, J.; Oh, J.; Choi, G. Shade represses photosynthetic genes by disrupting the DNA binding of GOLDEN2-LIKE1. Plant Physiol. 2023, 191, 2334–2352. [Google Scholar] [CrossRef] [PubMed]
  22. Zhang, T.; Zhang, R.; Zeng, X.Y.; Lee, S.; Ye, L.H.; Tian, S.L.; Zhang, Y.J.; Busch, W.; Zhou, W.B.; Zhu, X.G.; et al. GLK transcription factors accompany ELONGATED HYPOCOTYL5 to orchestrate light-induced seedling development in Arabidopsis. Plant Physiol. 2024, 194, 2400–2421. [Google Scholar] [CrossRef]
  23. Xu, X.; Liu, W.; Liu, X.; Cao, Y.; Li, X. Genetic manipulation of bermudagrass photosynthetic biosynthesis using Agrobacterium-mediated transformation. Physiol. Plantarum 2022, 174, 13710. [Google Scholar] [CrossRef]
  24. Cole, L.F.; Mccallan, S.A.; Olga, P.; Rafay, A.; Virginie, S.; Lee, C. The role of the GOLDEN2-LIKE (GLK) transcription factor in regulating terpenoid indole alkaloid biosynthesis in Catharanthus roseus. Plant Cell Rep. 2024, 6, 43–49. [Google Scholar]
  25. Huixin, G.; Ranhong, L.; Yuming, Z.; Guifeng, L.; Su, C.; Jing, J. Loss of GLK1 transcription factor function reveals new insights in chlorophyll biosynthesis and chloroplast development. J. Exp. Bot. 2019, 12, 3125–3138. [Google Scholar]
  26. Tu, X.; Ren, S.; Shen, W.; Li, J.; Li, Y.; Li, C.; Li, Y.; Zong, Z.; Xie, W.; Grierson, D.; et al. Limited conservation in cross-species comparison of GLK transcription factor binding suggested wide-spread cistrome divergence. Nat. Commun. 2022, 13, 7632. [Google Scholar] [CrossRef] [PubMed]
  27. Choi, H.; Gwak, D.; Kim, S.; Yi, T.; Ha, S. Molecular action of GOLDEN2-LIKE transcription factor family with diverse interacting promoters and proteins. Physiol. Plant. 2024, 1, 176–180. [Google Scholar] [CrossRef]
  28. Yang, Z.; Han, P.; Yu, J.; He, F.; Liu, J.; Chen, Y.; Zhuang, L. A Method of Particle Bombardment-Mediated Transformation System in Bermudagrass. Chinese Patent CN118006670A, 10 May 2024. [Google Scholar]
  29. Arnon, D. Copper enzymes isolated chloroplasts, polyphenoloxidase in Beta vulgaris. Plant Physiol. 1949, 24, 1–15. [Google Scholar] [CrossRef]
  30. Xu, L.; Yu, J.; Han, L.; Huang, B. Photosynthetic enzyme activities and gene expression associated with drought tolerance and post-drought recovery in kentucky bluegrass. Env. and Exp. Bot. 2013, 89, 28–35. [Google Scholar] [CrossRef]
  31. Marri, L.; Sparla, F.; Pupillo, P.; Trost, P. Co-ordinated gene expression of photosynthetic glyceraldehyde-3-phosphate dehydrogenase, phosphoribulokinase, and CP12 in Arabidopsis thaliana. J. Exp. Bot. 2005, 56, 73–80. [Google Scholar] [CrossRef]
  32. Upadhyaya, A.; Sankhla, D.; Davis, T.D.; Sankhla, N.; Smith, B.N. Effect of paclobutrazol on the activities of some enzymes of activated oxygen metabolism and lipid peroxidation in senescing soybean leaves. J. Plant Physiol. 1985, 121, 453–461. [Google Scholar] [CrossRef]
  33. Beauchamp, C.; Fridovich, L. Superoxide dismutase: Improved assays and an assay applicable to acrylamide gels. Anal. Biochem. 1971, 44, 276–287. [Google Scholar] [CrossRef]
  34. Aebi, H. Catalase in vitro. Methods Enzymol. 1984, 105, 121–126. [Google Scholar] [PubMed]
  35. Nakano, Y.; Asada, K. Hydrogen peroxide is scavenged by ascorbate-specific peroxidase in spinach chloroplasts. Plant Cell Physiol. 1981, 22, 867–880. [Google Scholar] [CrossRef]
  36. Buege, J.A.; Aust, S.D. Microsomal lipid peroxidation. Methods Enzymol. 1978, 52, 302–310. [Google Scholar] [PubMed]
  37. Jaime, F.; Manuel, R. Molecular mechanisms of shade tolerance in plants. New Phytol. 2023, 239, 1190–1202. [Google Scholar]
  38. Qian, Y.; Engelke, M. Influence of trinexapac-ethyl on diamond zoysiagrass in a shade environment. Crop Sci. 1999, 39, 202–208. [Google Scholar] [CrossRef]
  39. Kephart, K.; Buxton, D. Forage quality responses of C3 and C4 perennial grasses to shade. Crop Sci. 1993, 33, 831–837. [Google Scholar] [CrossRef]
  40. Okeyo, D.; Fry, J.; Bremer, D.; Chandra, A.; Genovesi, A. Stolon growth and tillering of experimental zoysiagrasses in shade. Hortscience 2011, 46, 1418–1422. [Google Scholar] [CrossRef]
  41. Valladares, F.; Niinemets, U. Shade tolerance: A key plant feature of complex nature and consequences. Annu. Rev. Ecol. Evol. Syst. 2008, 39, 237–257. [Google Scholar] [CrossRef]
  42. Bastakis, E.; Hedtke, B.; Klermund, C.; Grimm, B.; Schwechheimer, C. LLM-Domain B-GATA transcription factors play multifaceted roles in controlling greening in Arabidopsis. Plant Cell 2018, 30, 582–599. [Google Scholar] [CrossRef] [PubMed]
  43. Philip, A.; Knapp, A.K. Response to short-term reductions in light in soybean leaves. Int. J. Plant Sci. 1998, 159, 805–810. [Google Scholar]
  44. Fitter, D.W.; Martin, D.J.; Copley, M.J.; Scotland, R.W.; Langdale, J.A. GLK gene pairs regulate chloroplast development in diverse plant species. Plant J. 2002, 31, 713–727. [Google Scholar] [CrossRef]
  45. Van Huylenbroeck, J.M.; Van Bockstaele, E. Effects of shading on photosynthetic capacity and growth of turfgrass species. Turfgrass 2001, 9, 353–359. [Google Scholar]
  46. Tanaka, R.; Koshino, Y.; Sawa, S.; Ishiguro, S.; Okada, K.; Tanaka, A. Overexpression of chlorophyllide a oxygenase (CAO) enlarges the antenna size of photosystem II in Arabidopsis thaliana. Plant J. 2010, 26, 365–373. [Google Scholar] [CrossRef] [PubMed]
  47. Gan, P.; Liu, F.; Li, R.; Wang, S.; Luo, J. Chloroplasts—Beyond energy capture and carbon fixation: Tuning of photosynthesis in response to chilling stress. Int. J. Mol. Sci. 2019, 20, 5046. [Google Scholar] [CrossRef]
  48. Guo, M.; Yang, F.; Zhu, L.; Wang, L.; Qi, Z.; Fotopoulos, V.; Yu, J.; Zhou, J. Loss of cold tolerance is conferred by absence of the WRKY34 promoter fragment during tomato evolution. Nat. Commun. 2024, 15, 6667. [Google Scholar] [CrossRef]
  49. Tiwari, A.; Mamedov, F.; Fitzpatrick, D.; Gunell, S.; Tikkanen, M.; Aro, E.M. Differential FeS cluster photodamage plays a critical role in regulating excess electron flow through photosystem I. Nat. Plants 2024, 10, 1592–1603. [Google Scholar] [CrossRef]
  50. Li, X.; Li, J.; Wei, S.; Gao, Y.; Pei, H.; Geng, R.; Lu, Z.; Wang, P.; Zhou, W. Maize GOLDEN2-LIKE proteins enhance drought tolerance in rice by promoting stomatal closure. Plant Physiol. 2024, 194, 774–786. [Google Scholar] [CrossRef]
  51. Chastain, C.J.; Chollet, R. Regulation of pyruvate, orthophosphate dikinase by ADP-/Pi-dependent reversible phosphorylation in C3 and C4 plants. Plant Physiol. Biochem. 2003, 41, 523–532. [Google Scholar] [CrossRef]
  52. Niu, K.J.; Ma, H.L. The positive effects of exogenous 5-aminolevulinic acid on the chlorophyll biosynthesis, photosystem, and Calvin cycle of kentucky bluegrass seedlings in response to osmotic stress. Environ. Exp. Bot. 2018, 155, 260–271. [Google Scholar] [CrossRef]
  53. Walker, R.P.; Paoletti, A.; Leegood, R.C.; Famiani, F. Phosphorylation of phosphoenolpyruvate carboxykinase (PEPCK) and phosphoenolpyruvate carboxylase (PEPC) in the flesh of fruits. Plant Physiol. Biochem. 2016, 108, 323–327. [Google Scholar] [CrossRef] [PubMed]
  54. Doubnerova, V.; Rylova, H. What can enzymes of C4 photosynthesis do for C3 plants under stress? Plant Sci. 2011, 180, 575–583. [Google Scholar] [CrossRef]
  55. Pyngrope, S.; Bhoomika, K.; Dubey, R.S. Reactive oxygen species, ascorbate-glutathione pool, and enzymes of their metabolism in drought-sensitive and tolerant indica rice (Oryza sativa L.) seedlings subjected to progressing levels of water deficit. Protoplasma 2013, 250, 585–600. [Google Scholar] [CrossRef]
  56. Meloni, D.A.; Oliva, M.A.; Martinez, C.A.; Cambraia, J. Photosynthesis and activity of superoxide dismutase, peroxidase and glutathione reductase in cotton under salt stress. Environ. Exp. Bot. 2003, 49, 69–76. [Google Scholar] [CrossRef]
  57. Wang, J.; Dou, J.; Yue, Z.; Wang, J.; Chen, T.; Li, J.; Dai, H.; Dou, T.; Yu, J.; Liu, Z. Effect of hydrogen sulfide on cabbage photosynthesis under black rot stress. Plant Physiol. Biochem. 2024, 208, 08453. [Google Scholar] [CrossRef] [PubMed]
  58. Liang, X.; Li, Y.; Wang, L. Knockout of stigmatic ascorbate peroxidase 1 (APX1) delays pollen rehydration and germination by mediating ROS homeostasis in Brassica napus L. Plant J. 2024, 119, 1258–1271. [Google Scholar] [CrossRef]
  59. Fu, J.J.; Luo, Y.L.; Sun, P.G.; Gao, J.Z.; Zhao, D.H.; Yang, P.Z.; Hu, T.M. Effects of shade stress on turfgrasses morphophysiology and rhizosphere soil bacterial communities. BMC Plant Biol. 2020, 20, 92. [Google Scholar] [CrossRef]
  60. Zhang, X.H.; Liu, Y.H.; Liu, Q.; Zong, B.; Yuan, X.P.; Sun, H.E.; Wang, J.; Zang, L.; Ma, Z.Z.; Liu, H.M.; et al. Nitric oxide is involved in abscisic acid-induced photosynthesis and antioxidant system of tall fescue seedlings response to low light stress. Environ. Exp. Bot. 2018, 155, 226–238. [Google Scholar] [CrossRef]
  61. Wherley, B.G.; Gardner, D.S.; Metzger, J.D. Tall fescue photomorphogenesis as influenced by changes in the spectral composition and light intensity. Crop Sci. 2005, 45, 562–568. [Google Scholar] [CrossRef]
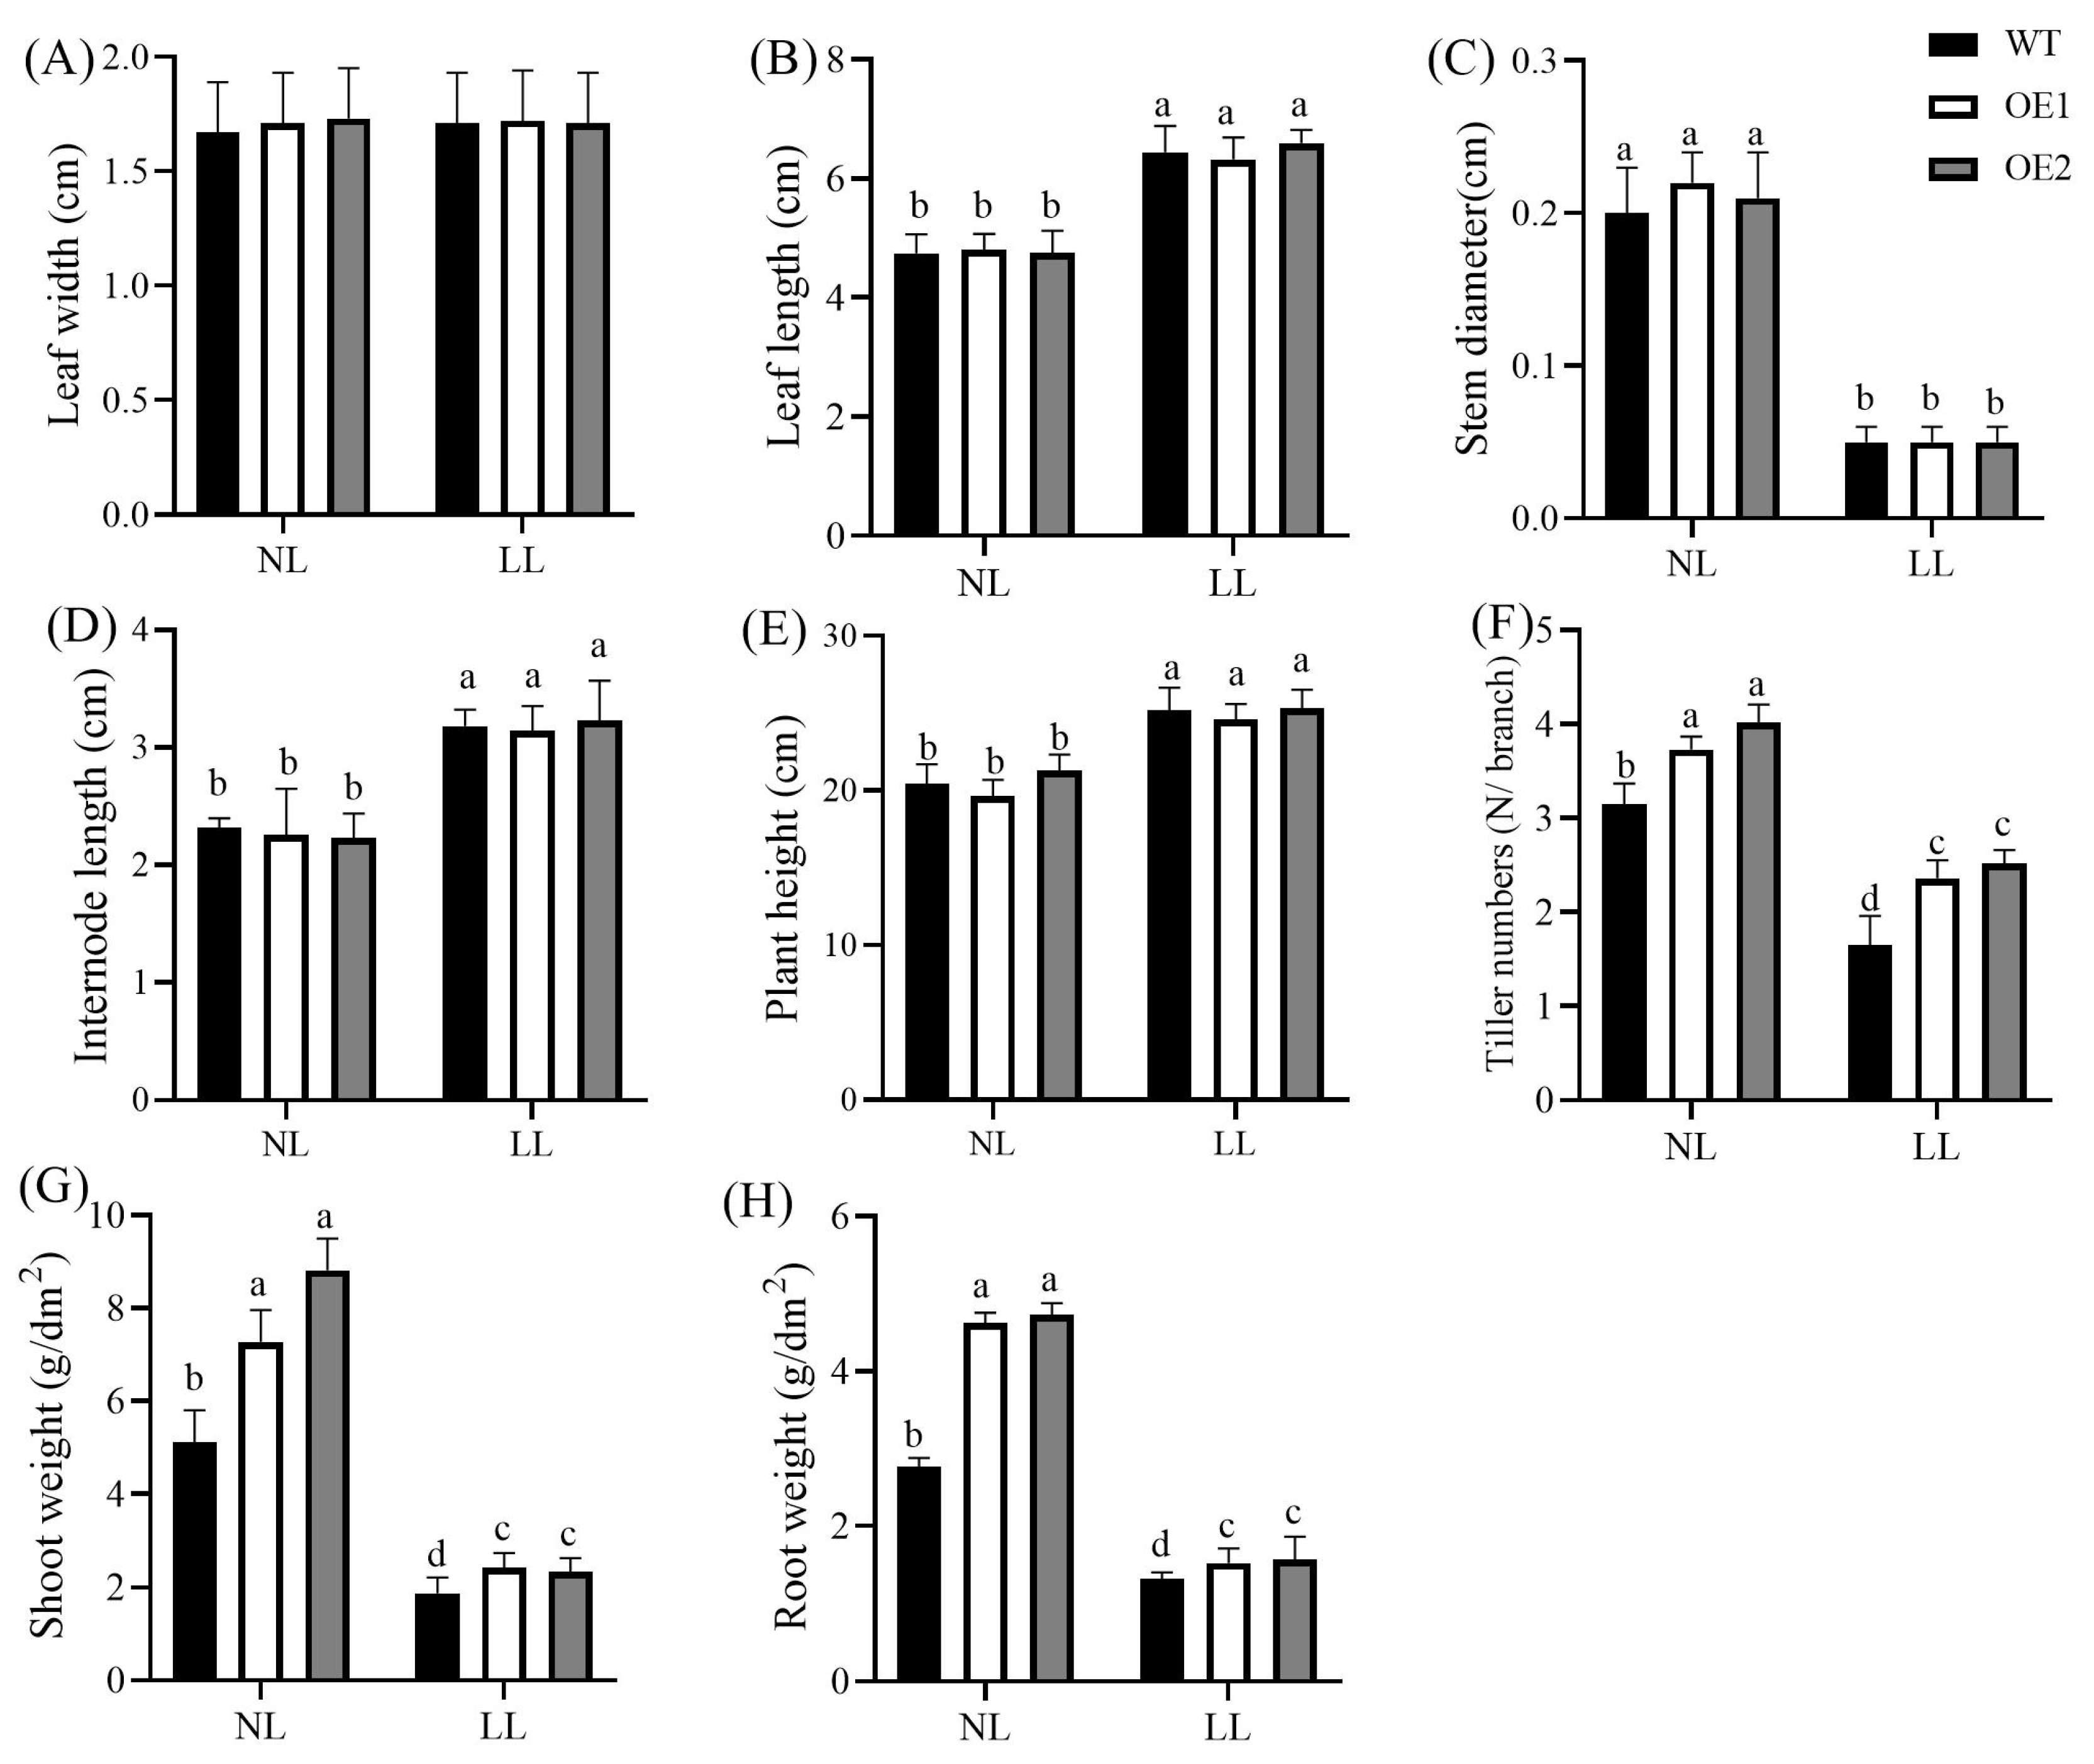
Figure 1. Effects of low light on morphological traits and biomass accumulation. Leaf width (A), leaf length (B), stem diameter (C), internode length (D), plant height (E), tiller number (F), shoot fresh weight (G), and root fresh weight (H). Data represent mean ± standard error (SE). Different letters indicate significant differences at p ≤ 0.05. NL: normal light (photosynthetically active radiation of 800 μmol/m2/s); LL: low light (photosynthetically active radiation of 120 μmol/m2/s); WT: wild-type; OE1/OE2: CdGLK1-overexpressing lines.
Agronomy 15 01225 g001
Figure 2. Phenotypic responses of CdGLK1-overexpressing lines and WT under low-light stress. (A) Phenotype of CdGLK1-overexpressing lines (OE1, OE2) and wild-type (WT) under low light. (B) Green leaves from each tiller under low-light treatment and the fifth leaves (counted from the apex) imaged using an Imaging-PAM chlorophyll fluorometer. Scale represents Fv/Fm. NL: normal light (photosynthetically active radiation of 800 μmol/m2/s); LL: low light (photosynthetically active radiation of 120 μmol/m2/s); WT: wild-type; OE1/OE2: CdGLK1-overexpressing lines.
Agronomy 15 01225 g002
Figure 3. Effects of low light on photosynthetic parameters and chlorophyll content. Intercellular CO2 concentration (Ci, (A)), stomatal conductance (Gs, (B)), transpiration rate (Tr, (C)), net photosynthetic rate (Pn, (D)), chlorophyll a (Chl a, (E)), chlorophyll b (Chl b, (F)), total chlorophyll (Total Chl, (G)), chlorophyll a/b ratio (Chl a/b, (H)), and maximum quantum yield of PSII photochemistry (Fv/Fm, (I)). Data represent mean ± standard error (SE). Different letters indicate significant differences at p ≤ 0.05. NL: normal light (photosynthetically active radiation of 800 μmol/m2/s); LL: low light (photosynthetically active radiation of 120 μmol/m2/s); WT: wild-type; OE1/OE2: CdGLK1-overexpressing lines.
Agronomy 15 01225 g003
Figure 4. Effects of low light on enzyme activities related to photosynthetic carbon metabolism. Ribulose-5-phosphate kinase (Ru5PK, (A)), Rubisco activase (RCA, (B)), ribulose-1,5-bisphosphate carboxylase/oxygenase (Rubisco, (C)), pyruvate orthophosphate dikinase (PPDK, (D)), and phosphoenolpyruvate carboxylase (PEPC, (E)). Data represent mean ± standard error (SE). Different letters indicate significant differences at p ≤ 0.05. NL: normal light (photosynthetically active radiation, 800 μmol/m2/s); LL: low light (photosynthetically active radiation, 120 μmol/m2/s); WT: wild-type; OE1/OE2: CdGLK1-overexpressing lines.
Agronomy 15 01225 g004
Figure 5. Effects of low light on antioxidant enzyme activities and malondialdehyde content. Superoxide dismutase (SOD, (A)), peroxidase (POD, (B)), catalase (CAT, (C)), ascorbate peroxidase (APX, (D)), glutathione reductase (GR, (E)), and malondialdehyde (MDA, (F)). Data represent mean ± standard error (SE). Different letters indicate significant differences at p ≤ 0.05. NL: normal light (photosynthetically active radiation, 800 μmol/m2/s); LL: low light (photosynthetically active radiation, 120 μmol/m2/s); WT: wild-type; OE1/OE2: CdGLK1-overexpressing lines.
Agronomy 15 01225 g005
Figure 6. Transcriptomic analysis of differentially expressed genes (DEGs). Principal component analysis (PCA) of 9 samples (A) and Venn diagram of DEGs in comparisons between OE1 and WT and between OE2 and WT (B).
Agronomy 15 01225 g006
Figure 7. Enrichment factor plot. (A) GO term classification of differentially expressed genes (DEGs). (B) KEGG enrichment analysis of bermudagrass under different treatment groups.
Agronomy 15 01225 g007
Figure 8. KEGG pathway analysis of bermudagrass under low-light stress. Subfigures show differentially expressed genes (DEGs) related to (A) photosynthesis, (B) photosynthesis antenna proteins, and (C) carbon fixation. Blue boxes represent downregulated genes, while red boxes and letters indicate upregulated expression. WT: wild-type; OE1/OE2: CdGLK1-overexpressing lines.
Agronomy 15 01225 g008
Figure 9. qRT-PCR verification of previously identified differentially expressed genes (DEGs). Heatmap depicting the expression patterns of photosynthesis-related DEGs based on qRT-PCR analysis.
Agronomy 15 01225 g009
Figure 10. Schematic diagram showing how the overexpression of CdGLK1 improves low-light tolerance in bermudagrass. Red arrows indicated upregulated trends and blue arrows indicated downregulated trends.
Agronomy 15 01225 g010
Table 1. Primers.
Table 1. Primers.
Gene NameForward Primer (5′-3′)Reverse Primer (5′-3′)
CdGLK1GCCCTGTTGTTTGGTGTTACCCGCAAGCTGGAGGCAC
PP2ATACTACTTCCCTTGACGGCAATACCCCAACCACATC
ALADTTATAAAATTATACCAGGATGATAATACAGTATCTCAT
CAOATCTCAGGCAAATGATGACCCCATCGATATGGAGTT
ChlDACGCGACCTTGGCTATCAAATATCTGGTACTTTCAACT
ChlHACTACCTTAACAATAGGACTGGTCTCTTAATCCAAGT
ChlIGCCGACAGACGTGCCTCCGTTGGCCCTGGCCTTGCAT
ChlGGGCGCGGGCGTACATGATGCCACCGCCTGGAGCTCAA
CPOXAGAAGTCCTGAACATTGCATGAGAACCCTACTATCTG
GUN4TCGACTTCTCCCCACGCCGCCCTTCCCCAACCTCCGC
PEPCATGGCGTCCGAGCGGCACCACAATTCCGGATCCTGGC
PPDKGCAGAGGGTCTTCCACTTCGATTAATGCTTCTGTACTT
URODCAGGCCCCACCTGGTGGAATGGGATCGAGGCTCAGCG
Disclaimer/Publisher’s Note: The statements, opinions and data contained in all publications are solely those of the individual author(s) and contributor(s) and not of MDPI and/or the editor(s). MDPI and/or the editor(s) disclaim responsibility for any injury to people or property resulting from any ideas, methods, instructions or products referred to in the content.