Article

Integrated Transcriptomic and Metabolomic Analyses Reveal the Positive Effects of 5-Aminolevulinic Acid (ALA) on Shading Stress in Peanut (Arachis hypogaea L.)

Shandong Peanut Research Institute/Chinese National Peanut Engineering Research Center, Shandong Academy of Agricultural Sciences, Qingdao 266100, China
*
Author to whom correspondence should be addressed.
Agronomy 2025, 15(5), 1211; https://doi.org/10.3390/agronomy15051211
Submission received: 17 April 2025 / Revised: 14 May 2025 / Accepted: 15 May 2025 / Published: 16 May 2025
(This article belongs to the Section Plant-Crop Biology and Biochemistry)

Abstract

Shading stress is a major negative abiotic environmental factor seriously affecting peanut growth, development, and ultimately resulting in a yield decrease in peanut in peanut/maize intercropping systems. However, 5-aminolevulinic acid (ALA) is a potential plant growth regulator that can enhance its tolerance to various abiotic stresses. However, there is limited information on how ALA affects plant physiology and molecular mechanisms under shading stress. To address this, field experiments were designed involving two shading conditions (CK and AS0, no shading; S40 and AS40, 40% shading) and two ALA foliar sprayed levels (CK and S40, no ALA application; AS0 and AS40, 20 mg L−1 (0.15 mM) ALA application) to investigate the effects of the exogenous application of ALA under shading stress via the evaluation of both transcriptome and metabolome. The research results suggested that the exogenous ALA application under normal light conditions significantly enhanced photosynthesis, while exogenous ALA application could improve the stability of the cell membrane structure and biological function in response to shading stress and thereby enhance shading tolerance of the plant. The results also implied that exogenous ALA regulates the adaptability of peanuts under different light conditions by affecting the concentration of endogenous ALA. This finding improves the understanding of ALA’s regulatory molecular mechanisms and the metabolic pathways of peanuts under shading stress. Our results extend the application of ALA in agricultural production and will provide a reference for crop cultivation, especially for peanut/maize intercropping systems.

1. Introduction

Light intensity, a major essential abiotic environmental factor, plays an extremely important role in plant growth, development, and yield, as it is an indispensable energy source for plant photosynthesis and accumulation–assimilation and restricts the natural geographical distribution of plants [1]. Leaves are the most sensitive organs for detecting light intensity. Reduced light intensity under shading stress greatly decreases the energy absorption and transfer, photochemical reactions, and electron transfer processes during photosynthesis, hence decreasing the accumulation of photosynthetic products [2]. Peanut (Arachis hypogaea L.), a nutritious food that contains lipids and protein, is an important crop for both oil and food use. In China, peanuts occupy an important position in agricultural production. The intercropping of peanut and maize is a common cropping system in North China that can effectively utilize light resources thoroughly and increase the total economic benefits of land [3]. Previous studies on this intercropping system have mostly focused on agronomic measures, fertilizer and water experiments, and cultivar selection; limited research on the impact of light intensity on peanut/maize intercropping systems has been carried out [4]. However, owing to the differences in the height of maize and peanut plants during the middle and late stages of growth and development, especially during the pod stage, which is a crucial period for peanut yield formation, high maize plants result in shading stress on low peanut plants, which causes insufficient lighting, decreased photosynthetic ability, reduced dry matter, and decreased production, and severely affects peanut yield formation and quality [3,5]. Peanuts in maize intercropping systems are often subject to insufficient lighting during the growth and development stages, which affects not only a number of biochemical processes, but also metabolite biosynthesis and utilization processes [6]. A small molecule regulator of 5-aminolevulinic acid (ALA, C5H9NO3, molecular weight: 131.13), a precursor of chlorophyll, has been used to promote growth and alleviate many abiotic stresses [7,8,9]. ALA is a key intermediate metabolite similar to phytohormones and is involved in the effective regulation of photosynthesis under various abiotic stresses [10,11]. Therefore, studying the effects of ALA on the response mechanism of peanuts to shading stress is crucial for further research on improving light energy utilization efficiency and the yields of peanut/maize intercropping systems. However, details on the regulatory molecular mechanisms and metabolic pathways of ALA under shading conditions remain unclear.
In this study, we conducted a field experiment in Laixi, Shandong, China, to detect the effects of ALA under shading stress in peanut via integrated analyses of the photophysiological characteristics, phenotypic parameters, transcriptome, and metabolome of the peanut cultivar Hua Yu 22 (HY 22) under two ALA application levels and two shading conditions throughout the whole growth stage. The findings of this work will provide significant insights for promoting yield and quality in the intercropping systems of peanut and maize and other intercropping systems of high and low crops.

2. Materials and Methods

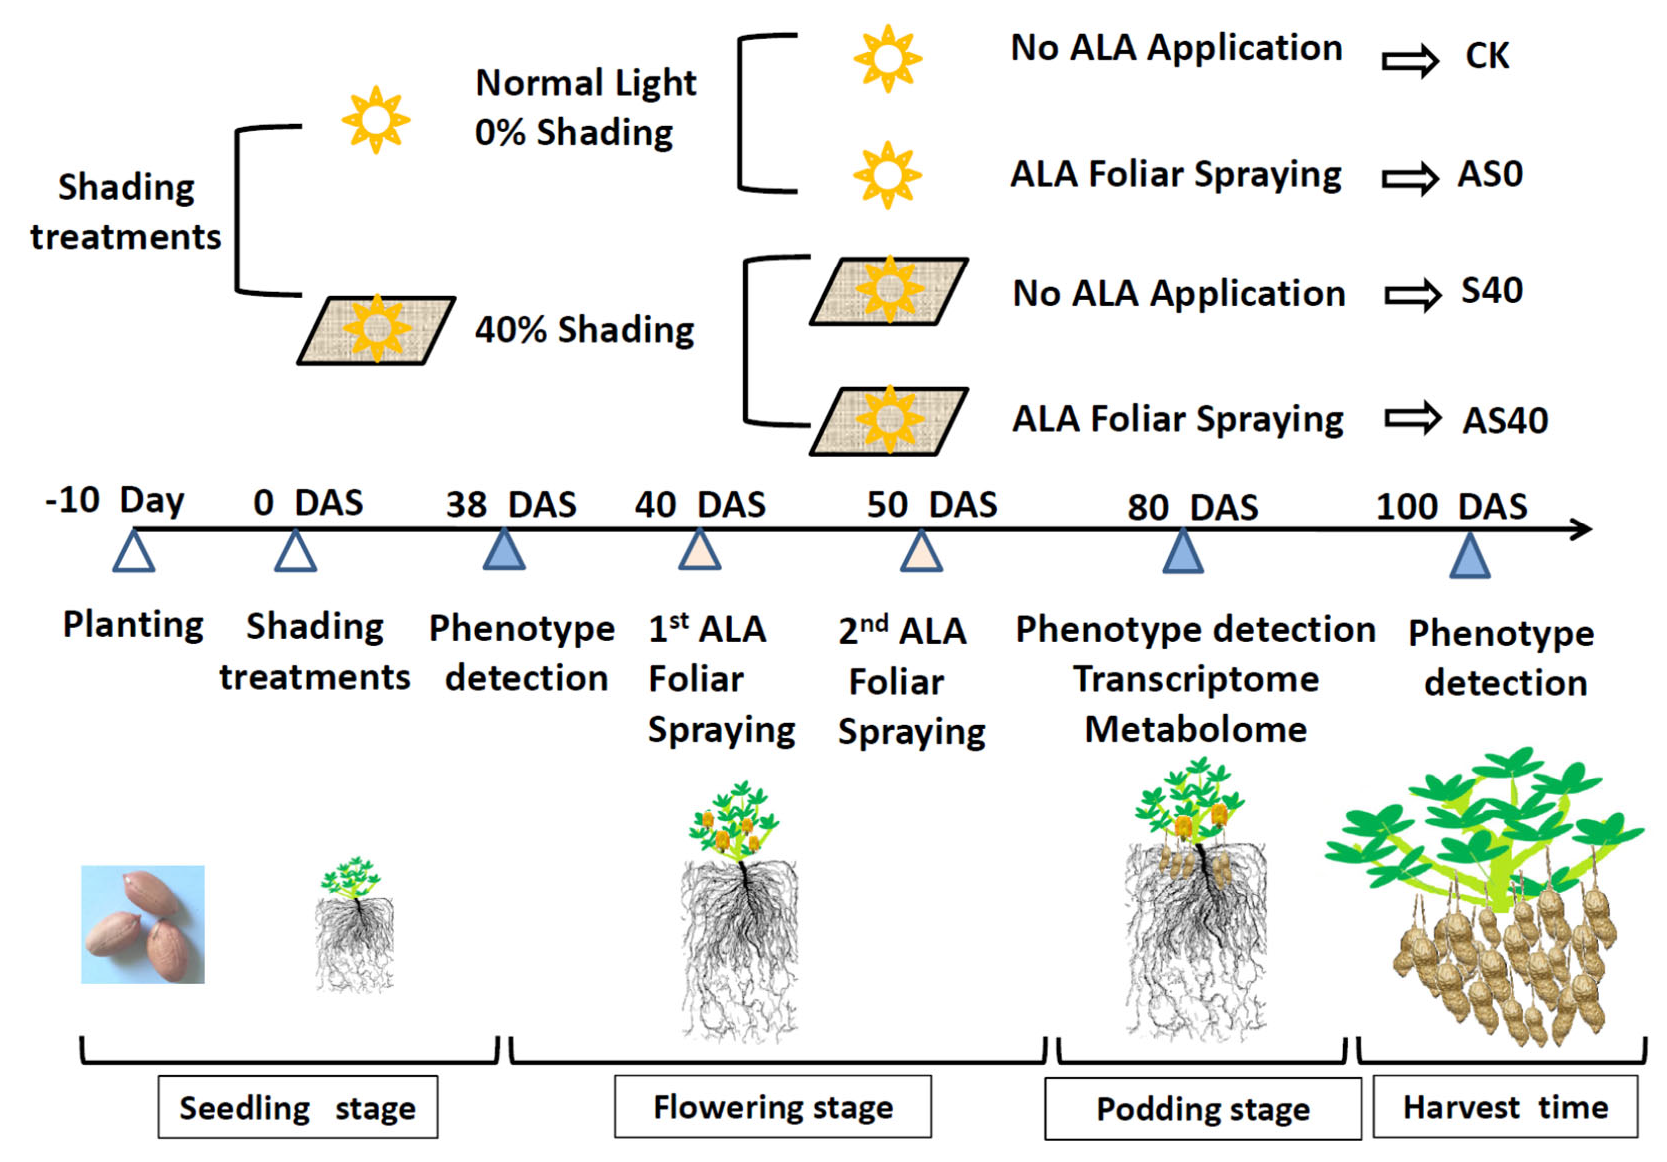
2.1. Plant Materials and Treatments

The Virginia-type, high-yield, large-seed peanut cultivar Huayu 22 (HY 22), which is one of the dominant varieties in Shandong Province, China, was used in this study. Plump and uniform seeds were treated with surface sterilization using 70% ethanol (v v−1) for 20 s and 0.1% mercury for 2 min, rinsed with distilled water, and then planted in peanut fields with brown soil (original pH 6.36) at a 120,000 hole hm−2 planting density and one seed per hole at a depth of 5 cm in Laixi, Shandong, China (36°87′ N, 120°05′ E). The total original available phosphorus (AP) and available nitrogen (AN) were 27.38 mg kg−1 and 11.20 mg kg−1, respectively. Compound fertilizer was applied according to the standard management amount of 750 kg hm−2 (N, P2O5, and K2O, each at 112.5 kg hm−2). The experiment involved two shading conditions during the whole growth stage (CK and AS0, no shading; S40 and AS40, 40% shading) and two foliar spraying levels of ALA (Sigma, St. Louis, MO, USA) (CK and S40, no ALA application; AS0 and AS40, 10 mg L−1 ALA solution, with 5 L per 30-plant application). In the CK and S40 treatments, distilled water was used as a substitute for ALA. The prepared ALA was sprayed on all leaf surfaces of each plant by a sprayer. Shading was conducted by putting up a shed with a black shading net at a height of 1.4 m (40% shade effect to sunlight) on the tenth day after planting (DAP), which remained until harvest. ALA solution was applied by spraying leaves twice on the 40th and 50th days after shading (DAS). Both the shade and ALA treatments were applied randomly to three replicate rows (0.4 m wide × 5 m long, 30 plants in each row) (Figure 1).

2.2. Phenotype Detection

The photosynthesis indices and plant morphology of plants in each treatment group were investigated at 38 DAS (two days before ALA was sprayed) and 80 DAS (30 days after ALA was sprayed). The five major photosynthesis indices, namely, the net photosynthesis rate (A, μmol CO2 m−2 s−1), transpiration rate (E, mmol H2O m−2 s−1), intercellular CO2 concentration (Ci, μmol CO2 mol−1), stomatal conduction degree (Gs, mol H2O m−2 s−1), and soil-plant analysis and development (SPAD) value from 9:00 to 11:30 in the morning, were measured for the third youngest fully expanded leaf (mature leaf) on the main stem of each plant using a CIRAS-3 portable photosynthesis system (PP SYSTEMS, Amesbury, MA, USA) and a SPAD meter (Minolta SPAD-502, Osaka, Japan). The plant morphology with the four treatments, CK (no shading and no ALA spraying), S40 (40% shading and no ALA spraying), AS0 (no shading with 10 mg L−1 ALA spraying), and AS40 (40% shading with 10 mg/L ALA spraying), was also characterized by the main stem height, the first lateral branch length, the branch number, and the dry weight (g) of the roots, stems, leaves, and pods. The following parameters were used to determine the growth parameters of the roots: total root length (cm), total root surface area (cm2), total root volume (cm3), and total number of root tips via WinRHIZO 2009c root analysis software pro 2009c (Regent Instruments Inc., Québec City, QC, Canada).

2.3. Transcriptome Sequencing to Identify DEGs Under Shading Stress

The mature leaves, which were the third youngest fully expanded leaves on the main stems, were collected on the 80th DAS for transcriptome sequencing. All the samples from each treatment were quickly frozen in liquid nitrogen and then stored at –80 °C for sequencing. The total RNA extracted from the samples from each treatment was then used to construct the RNA-Seq transcriptome library and for transcriptome sequencing on an Illumina NovaSeq 6000 transcriptome sequencing platform from APTBIO Company (Shanghai, China), with 3 biological replicates and 3 experimental repetitions for each treatment. The DESeq2 method was used to detect differentially expressed genes (DEGs) between treatments. Ten DEGs were selected to validate the results of transcriptome sequencing via qRT-PCR. The specific primers used for the DEGs were designed with Primer Premier v5.0 software. qRT-PCR was conducted with a 2 × SYBR Green Master Mix kit (Takara, Osaka, Japan) and carried out in a 7500 Fast Real-Time PCR system (Applied Biosystems, Foster City, CA, USA) with three replicates. The endogenous reference gene AhACTIN11 was used to normalize the expression levels of the target genes. The raw transcriptome data files have been deposited in the NCBI (http://www.ncbi.nlm.nih.gov/) Sequence Read Archive (SRA) under the accession number PRJNA1094605.

2.4. Analysis of Differentially Accumulated Metabolites Under Shading Stress

The metabolome of the samples tested was the same as that of the samples used for transcriptome sequencing. Frozen leaf samples were ground into a powder in liquid nitrogen, and 80 mg of powder was suspended in 1000 µL of extraction liquid (methanol–acetonitrile–water = 2:2:1, v v−1 v−1). The mixtures were treated via ultrasound at 40 kHz for 30 min at 4 °C, incubated at −20 °C for 10 min, and then centrifuged at 14,000 rpm for 20 min at 4 °C. The supernatant was transferred carefully to a fresh EP tube and dried in a vacuum centrifuge. Then, the precipitate was redissolved in 100 μL of acetonitrile solution (acetonitrile–water = 1:1, v v−1), centrifuged at 14,000 rpm for 15 min at 4 °C, and 2 µL of each supernatant sample was injected into a C-18 column (100 mm × 2.1 mm) at 40 °C using an Agilent 1290 infinity LC instrument platform (UHPLC) (Agilent Technologies, Santa Clara, CA, USA) for mass spectrometry analyses. The solvent A mobile phase consisted of 0.5% formic acid and 25 mM of ammonium acetate in water, and solvent B consisted of methanol with a solvent gradient at a flow rate of 0.4 mL min−1 as follows: from 0 to 0.5 min, 5% B; from 0.5 to 10 min, 5% B–100% B; from 10 to 12 min, 100% B; from 12 to 12.1 min, 100% B–5% B; and from 12.1 to 16 min, 5% B to equilibrate the systems. During the entire analysis process, the sample was placed in an automatic sampler at 4 °C. The AB Triple TOF 6600 instrument equipped with an electrospray ionization (ESI) source was set as follows: 600 °C source temperature, ±5500 V ion spray voltage floating (ISVF) in both the positive mode and negative mode, 60–1000 Da TOF metabolite scan m z−1 range, 25–1000 Da product ion scan m z−1 range, 0.20 s spectra−1 TOF metabolite scan accumulation time, and 0.05 s spectra−1 product ion scan accumulation time. The raw data were preprocessed using MS-DIAL 4.6 software [12]. Metabolites were identified according to the HMDB (http://www.hmdb.ca/), Metlin (https://metlin.scripps.edu/), and APTBIO databases. The data were analyzed on the APTBIO cloud platform (https://bio-cloud.aptbiotech.com/). The raw metabolome data files were deposited in the China National GenBank DataBase (CNGBdb), with accession number CNP0005538.

2.5. Statistical Analysis

A completely randomized design (CRD) was used for each test in triplicate. For each row, assign the treatments with different ALA concentrations randomly, and each treatment has 3 replicates. The statistical software SPSS 22.0 was used for data processing, analysis of variance (ANOVA), and multiple comparisons. The Duncan method was used to identify the differences between the two treatments at p < 0.01 and p < 0.05.

3. Results

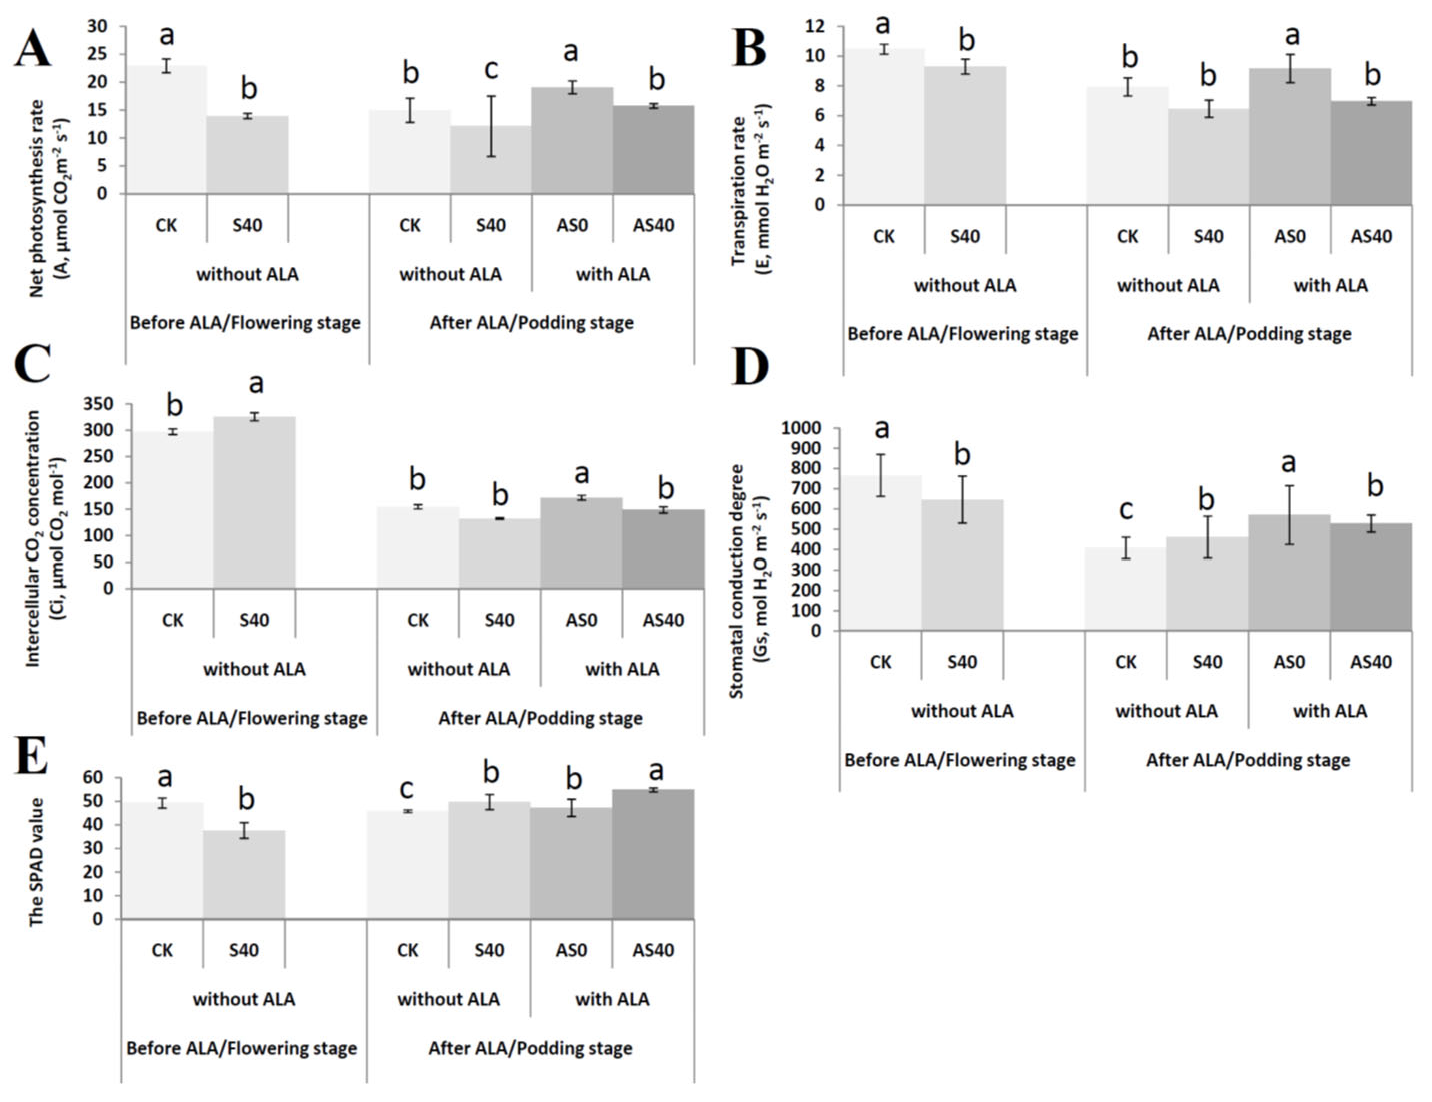
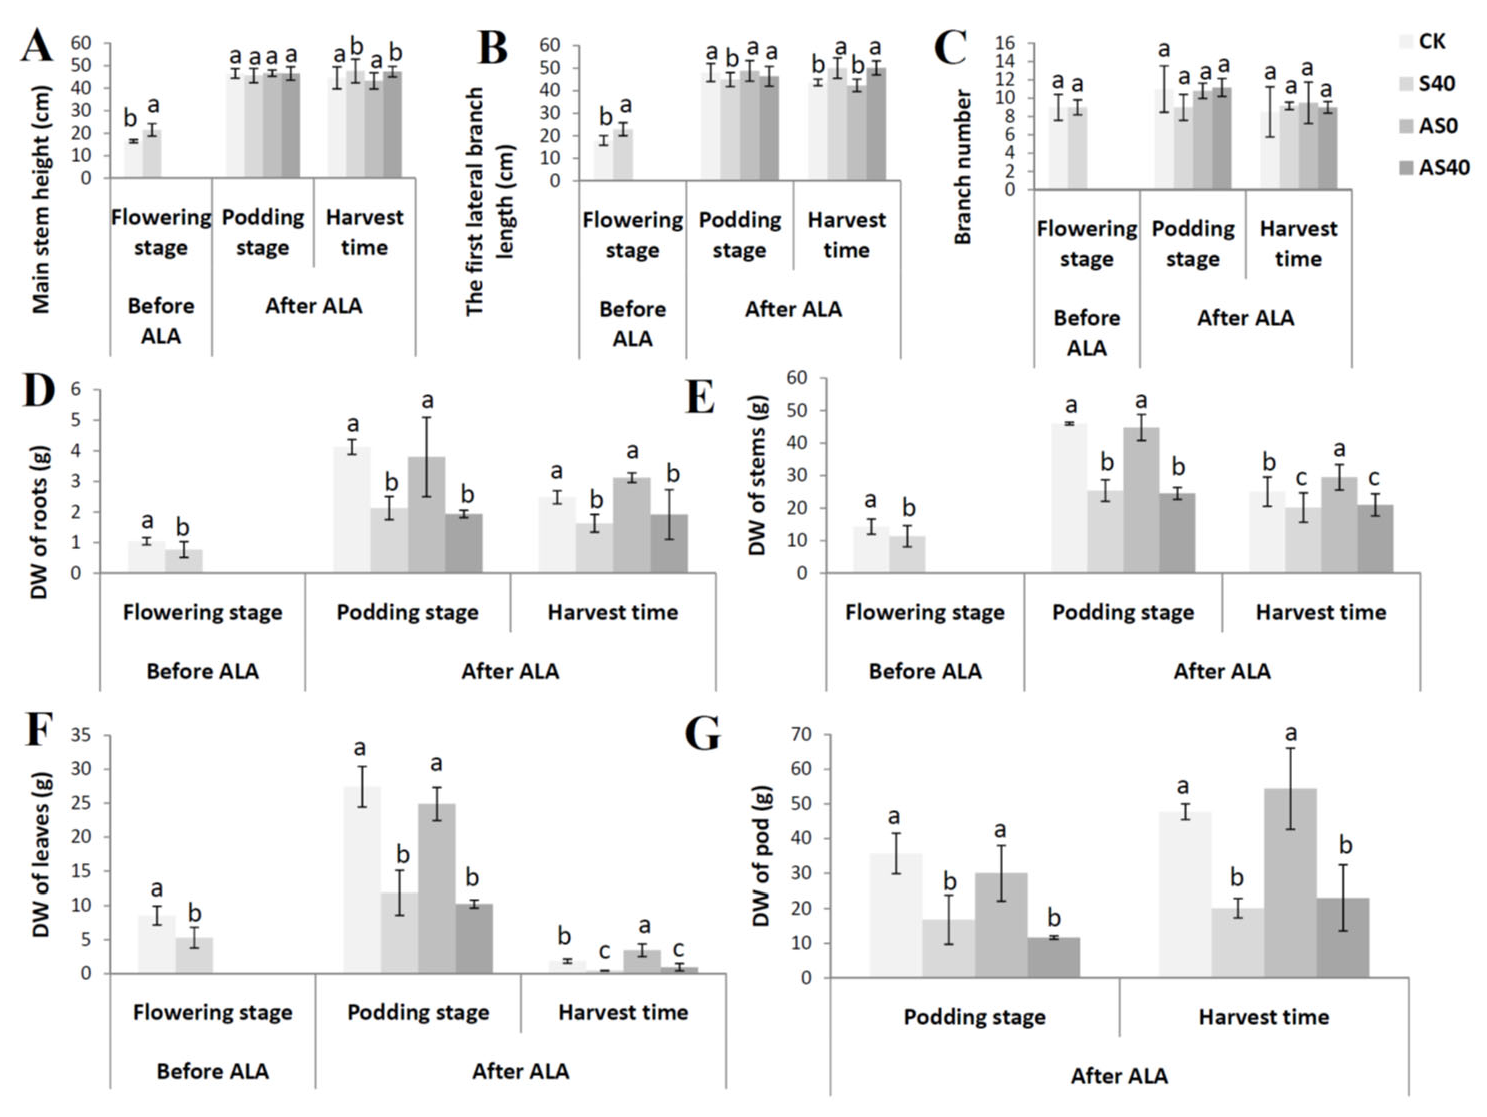
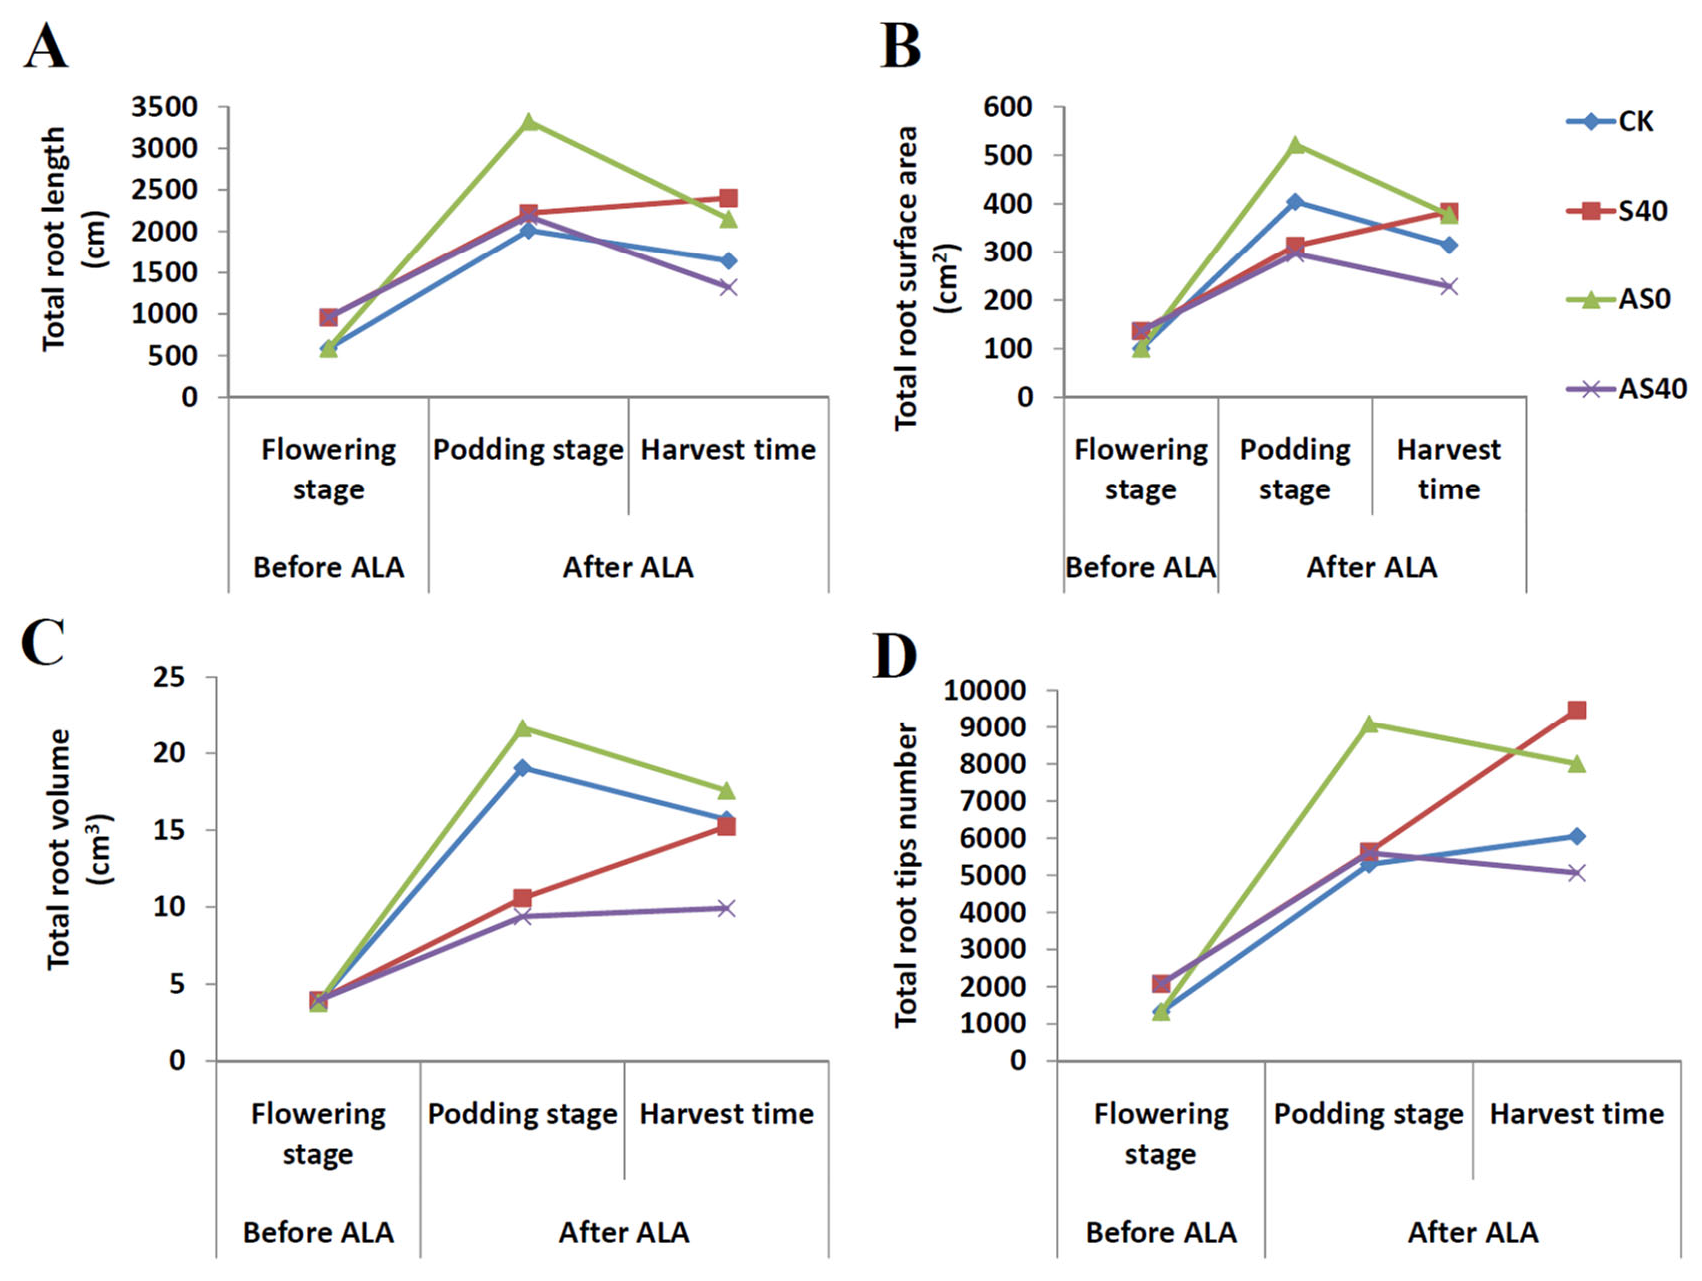
3.1. Shading Effects on the Peanut Phenotype

To estimate the effects of shading stress and ALA application on photosynthesis, photosynthetic parameters, including the net photosynthesis rate (A), transpiration rate (E), intercellular CO2 concentration (Ci), and stomatal conduction degree (Gs), were detected on the third fully expanded upper leaf of plants in the flowering stage (without ALA application) and podding stage (with ALA application). The A value, Gs value, and E value under normal light conditions (CK group) were significantly greater than those under 40% shade treatment (S40 group) before ALA was applied (p < 0.05), while the Ci value was lower in the CK group than in the S40 group (p < 0.05) (Figure 2). After ALA application, the A values in the AS0 groups were significantly greater than those in the CK, S0, and AS40 groups (Figure 2A). The E values in the AS0 group were much greater than those in the CK group. There were no significant differences among the three treatments of CK, S40, and AS40 (Figure 2B). The Ci values were obviously greater in the AS0 groups than in the CK, S40, and AS40 groups (Figure 2C). The Gs values were greater in the ALA treatment groups (AS0 and AS40) than in the non-ALA treatment groups (CK and S40) (Figure 2D). In addition, the SPAD values of shaded leaves were significantly lower than those of non-shaded leaves before ALA application, while after ALA spraying, the SPAD values significantly increased in AS40 (Figure 2E). When ALA was not sprayed in the early stage, the shading treatment had a significant impact on the five photosynthetic indexes. The present study showed that exogenous ALA application obviously increased the photosynthetic capacity and enhanced the shade resistance of peanut plants under shading stress.
The results showed that shading caused an increase in the length of the peanut’s main stem height and the length of the first pair of lateral branches. Both shading and the foliar application of ALA had little effect on the number of leaves on the main stem (Figure 3A–C). Before the application of ALA, the dry weights of the roots, stems, and leaves of the plants without shading were significantly higher than those of the shaded plants (Figure 3D–F). During the podding stage, regardless of whether ALA was applied or not, the dry weights of the roots, stems, and leaves in the non-shaded treatment group were significantly higher than those in the shaded group (Figure 3D–F). Compared with those in the CK group, the dry weights (DWs) of the roots, leaves, stems, and pods in the AS0 group increased by 25.77%, 84.69%, 17.59%, and 13.95%, respectively, while those in the AS40 group were 17.55%, 108.69%, 4.14%, and 14.43% greater than those in the S40 group at the harvest stage, respectively (Figure 3D–G). The DWs of the pods in the shading stress treatment group were much lower than those in the unshaded treatment group at the harvest stage (Figure 3G). Although the effect on the yield of applying ALA was not significant at the podding stage, ALA application significantly promoted the number of pods at harvest, as the pods’ dry weights in both the AS0 and AS40 treatments were greater than those in the CK and S40 treatments (Figure 3G).
The parameters for the roots, including the total length (cm), total surface area (cm2), total volume (cm3), and total tips, were analyzed via the WinRHIZO root analysis system (Figure 4). The results indicate that the total root length under 40% shading stress was noticeably greater than that under normal sunlight conditions without ALA application in the flowering/podding/harvest stages, while after spraying ALA, the root lengths in AS0 were significantly greater than those in AS40, even reaching 1.62 times that of AS40 in the harvest stage. Moreover, compared with those in the CK group, the lengths of the roots in the AS0 group were greater by 65.06% and 30.97% than those in the CK group under normal light conditions at the podding stage and harvest time, respectively (Figure 4A). Furthermore, the total surface area of the roots under shading stress increased compared with that under non-shaded conditions without the application of ALA. Nevertheless, after ALA application, the total surface area of the roots was notably greater in the AS0 group than in the AS40 group, and far exceeded that in the CK group at harvest (Figure 4B). The total volume increased under normal light conditions in both the CK and AS0 groups compared to that under shading stress in the S40 and AS40 groups. At harvest, that of AS0 even reached twice the value of AS40 (Figure 4C). For the detection of root tips, the results show that the quantity of root tips was greater under shading stress before ALA application, while it obviously increased under normal light conditions after ALA application. Additionally, at the harvest stage, the number of root tips in the AS0 group was greater than that in the CK group (Figure 4D).

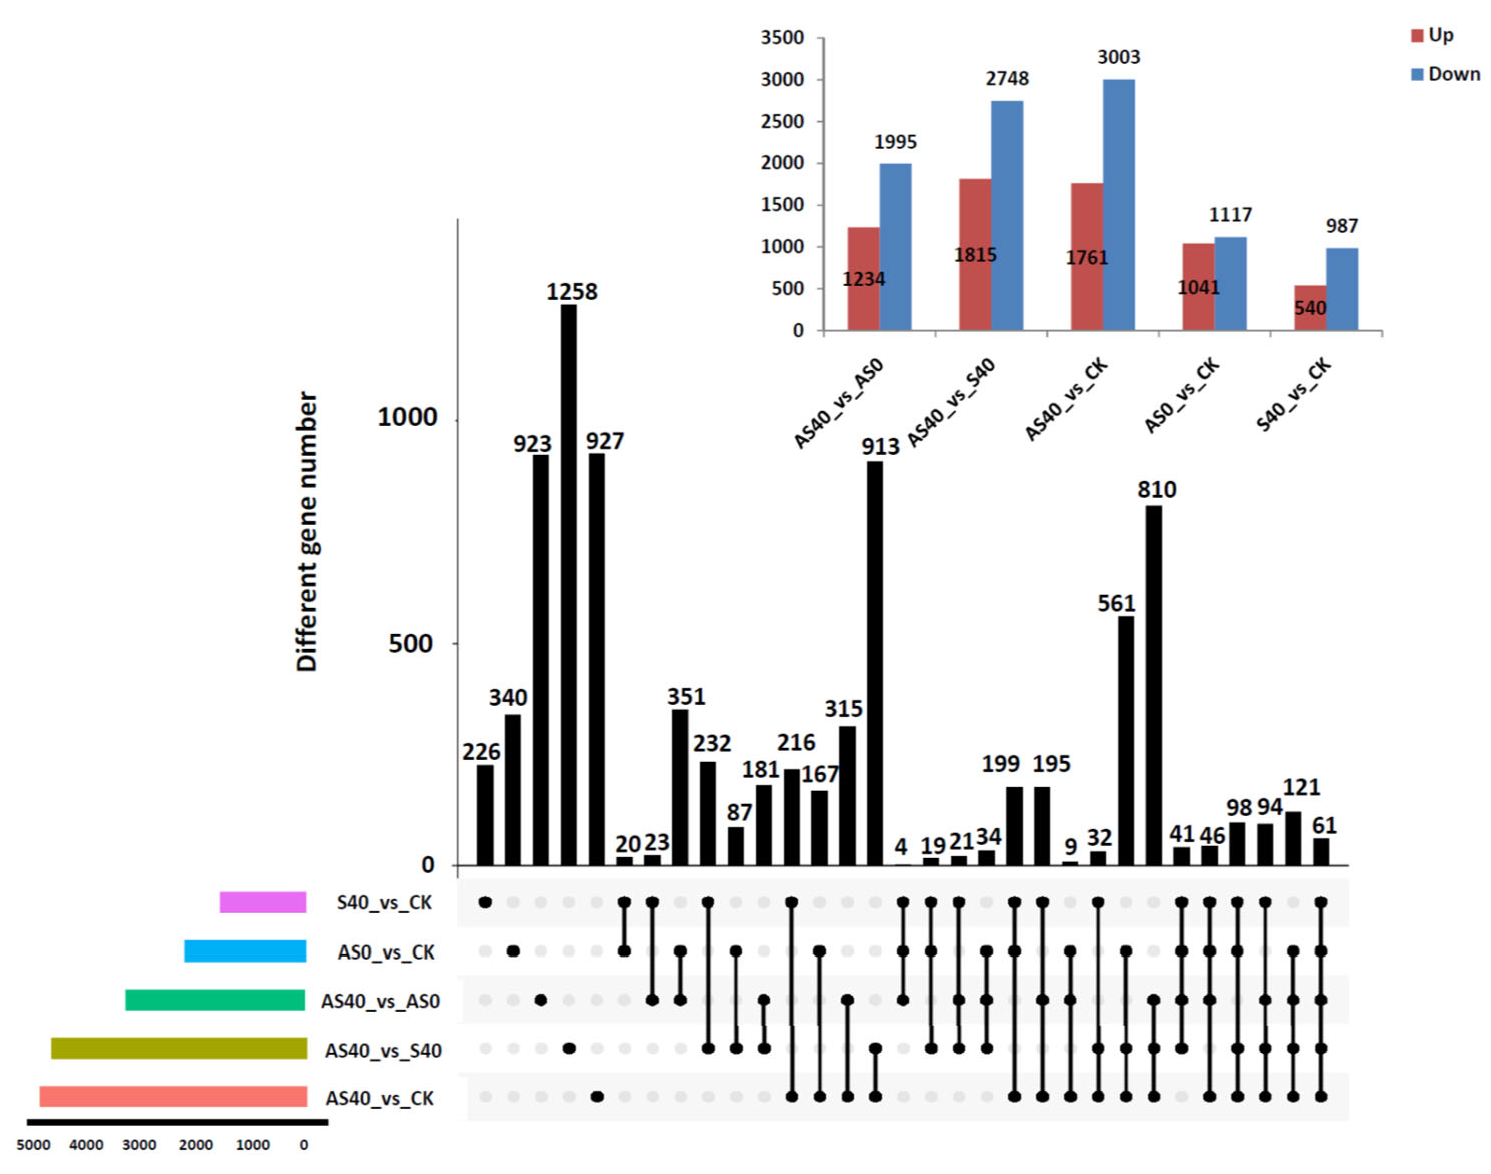
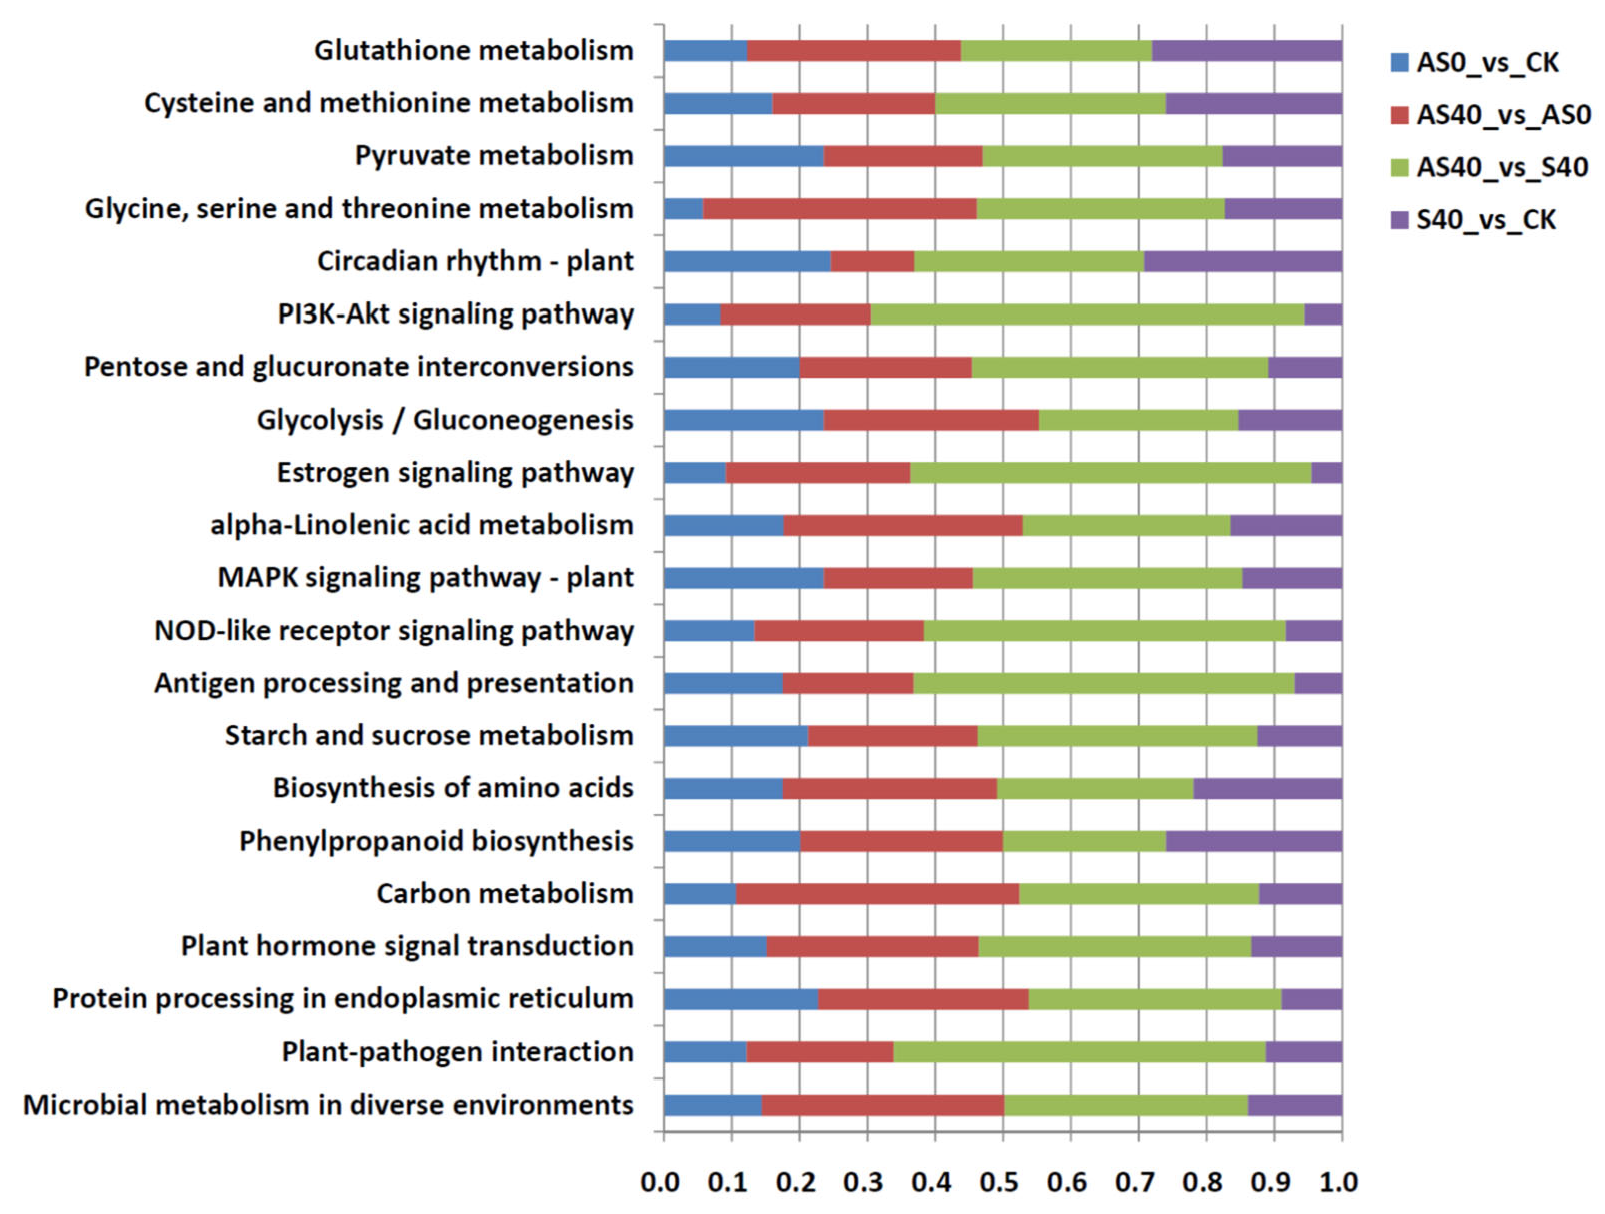
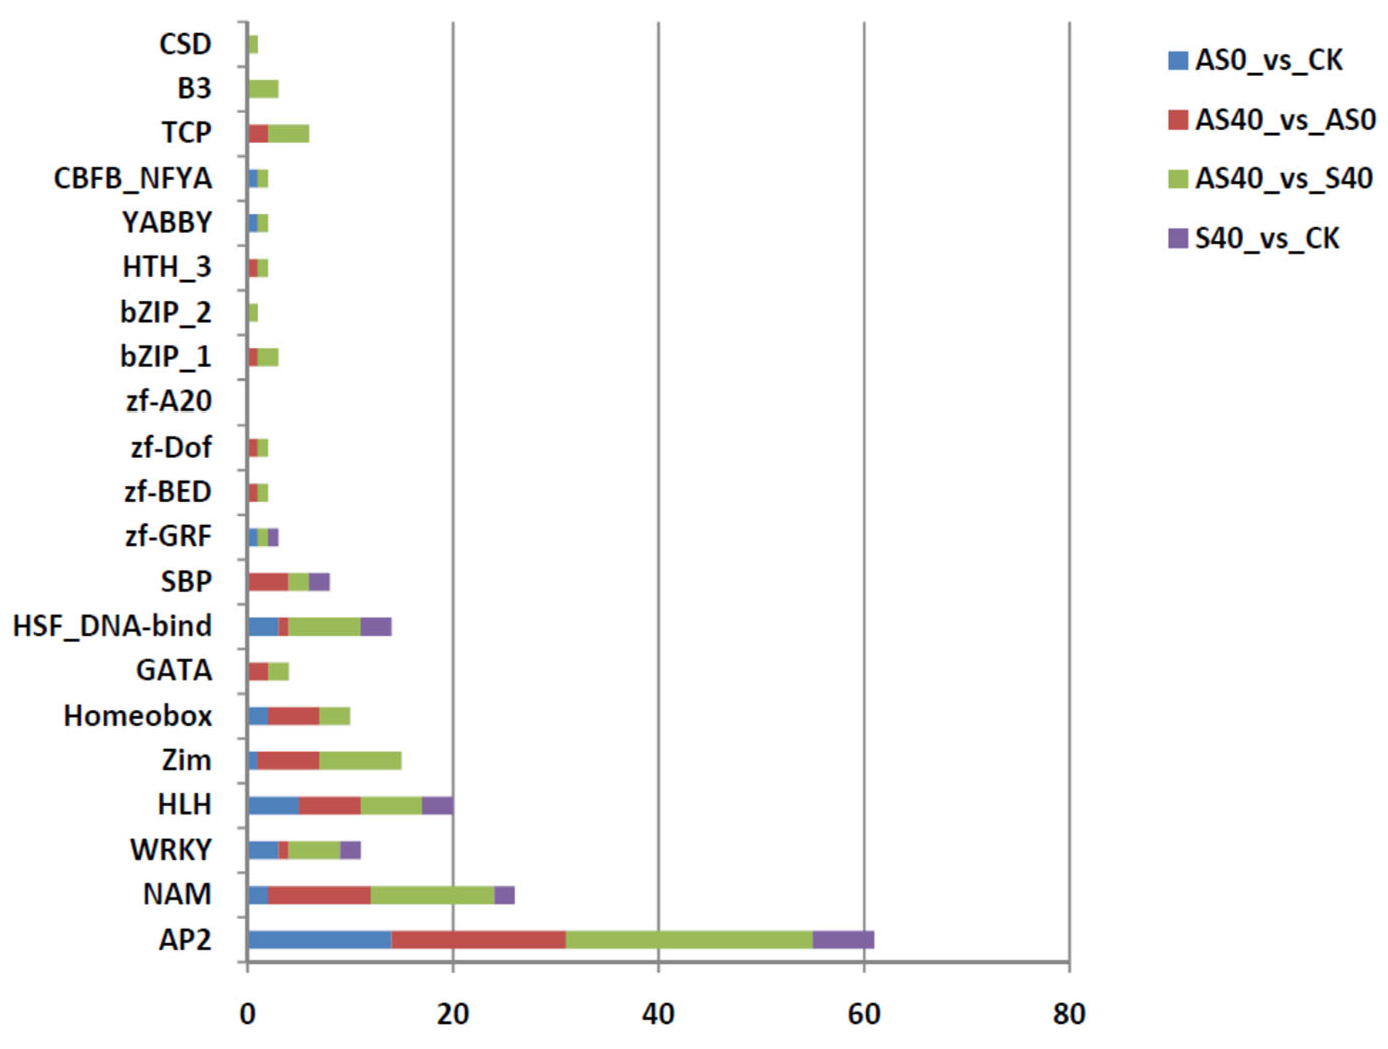
3.2. Transcriptome Analysis of Peanut Roots After ALA Application and Under Shading Stress

After filtering, a total of 89.96 Gb of high-quality clean bases were obtained, with an average clean base content of 7.50 Gb, an average Q20 value of 94.10%, and an average GC% value of 42.77% for one sample, which indicated that the transcriptome sequences were accurate and reliable (Supplemental Tables S1 and S2). The total mapped reads were found to be more than 69%, implying that the reference genome was appropriate. The values of fragments per kilobase of transcript per million mapped reads (FPKM) were used to represent the expression levels of genes. A total of 61,517 genes were annotated, with 8524 differentially expressed genes (DEGs) and 61 coexpressed DEGs among the comparisons of the four treatments. The number of DEGs is shown in Figure 5 and Table S3. Compared with those in the CK group (no shading treatment without ALA), there were 540 up-regulated and 987 down-regulated DEGs in the S40 group, while in the comparisons between AS0 and CK, AS40 and S40, and AS40 and AS0, there were 1041 up-regulated and 1117 down-regulated DEGs in the AS0 group, 1815 up-regulated and 2748 down-regulated DEGs in the AS40 group, and 1234 up-regulated and 1995 down-regulated DEGs in the AS40 group, respectively (Figure 5 and Supplemental Table S3). Among those comparisons, the greatest number was in the AS40 vs. CK comparison, with 4764 DEGs, while the lowest number was in the S40 vs. CK comparison, with 1527 DEGs. The results reveal that the addition of exogenous ALA under shading stress had a more extensive impact on peanut leaves at the transcriptome level than the addition of ALA under shading stress alone did, as there were almost three times more DEGs in the AS40 vs. CK comparison than in the S40 vs. CK comparison. A total of 2071 and 4467 uniquely expressed genes were detected in the AS0 vs. CK and AS40 vs. S40 comparisons, respectively. The number in the AS40 vs. S40 group was almost twice that in the AS0 vs. CK group. These findings indicate that the addition of exogenous ALA has a greater effect on peanut plants under shading stress than those under normal unshaded conditions. Only 23 coexpressed genes were identified in the S40 vs. CK and AS40 vs. AS0 comparisons, while 1504 and 3206 specifically expressed genes were identified in these two comparisons, respectively. A total of 4710 DEGs were defined as shading stress response genes. These 3206 DEGs might be closely related to ALA-regulated shading response pathways (Figure 5).
The results of GO enrichment analysis reveal that among all annotated genes, 315 genes were annotated in the biological processes (BPs) category, 567 genes were annotated in the cellular components (CCs) category, and 260 genes were annotated in the molecular functions (MFs) category. The terms “photosynthetic electron transport chain”, “photosynthesis”, “light reaction”, “generation of precursor metabolites and energy”, and “electron transport chain and oxidation-reduction process” were dominant in the BPs category. The GO terms “chloroplast thylakoid membrane”, “chloroplast thylakoid”, “organelle membrane”, and “intrinsic component of membrane” were closely related to the major CCs category. “Electron transporter, transferring electrons within the cyclic electron transport pathway of photosynthesis activity”, “electron transfer activity”, and “oxidoreductase activity” were the main enriched GO terms in the MFs category (Supplemental Table S4). The DEGs associated with ALA treatment under normal lighting conditions (AS0 vs. CK comparison) were enriched mainly in “electron transporter, transferring electrons within the cyclic electron transport pathway of photosynthesis activity” in the MFs category. Under treatment with ALA application and shading stress (AS40 vs. AS0), the DEGs were mainly enriched in “photosynthetic electron transport chain” and “photosynthesis, light reaction” in the BPs category, and “electron transfer activity” and “oxidoreductase activity” in the MFs category. These results suggest that ALA plays a major role in the regulation of leaf photosynthesis under different lighting conditions.
Additionally, a total of 226, 256, 257, 269, and 205 pathways were identified from the DEGs of the AS0 vs. CK, AS40 vs. AS0, AS40 vs. S40, AS40 vs. CK, and S40 vs. CK comparisons via KEGG pathway analysis, respectively. The top 20 enriched KEGG pathways, included phenylpropanoid biosynthesis, the biosynthesis of amino acids, starch and sucrose metabolism, alpha-linolenic acid metabolism, flavonoid biosynthesis, and photosynthesis (Figure 6). Similarly, when ALA was sprayed under the same lighting conditions, the DEGs were mainly enriched in those pathways (AS0 vs. CK and AS40 vs. S40), especially those related to protein processing in the endoplasmic reticulum and amino acid metabolism (“glycine, serine and threonine metabolism”, “cysteine and methionine metabolism”, and “tyrosine metabolism”) (Figure 6).
Among the DEGs, a total of 306 transcription factor (TF) genes affiliated with 21 TF families were related to the responses to shading stress and ALA modulation, including 31.8% from AP2, 13.1% from NAM, 7.9% from the HLH family, and 5.6% from WRKY (Figure 7). A significantly high proportion of AP2 (72.4%) was distributed in the ethylene-responsive transcription factor (ERF) family, suggesting that ERF genes play key roles in the regulation of related response gene networks under shade stress and exogenous ALA application. In both the AS0 vs. CK and AS40 vs. S40 comparisons, the expression levels of three and one ERF genes increased, respectively, while the expression levels of the vast majority of the other genes decreased. One ERF gene (ERF027) was identified in both the AS0 vs. CK and AS40 vs. S40 comparisons, indicating that it plays a key role in ALA application regulation under different light conditions. In addition, most NAM genes (90%) were distributed among five NAC domain-containing protein genes (including NAC domain-containing protein 2, NAC domain-containing protein 29, NAC domain-containing protein 72, NAC domain-containing protein 90, and NAC domain-containing protein 100), with decreased expression levels in all comparisons. The HLH transcription factor was mainly composed of bHLH14 and MYC2 in the AS0 vs. CK and AS40 vs. AS0 comparisons, with reduced expression levels. These down-regulated expression levels indicate that these TFs are crucial for downstream gene transcriptional regulation under shading stress and ALA regulation.
In addition, qRT-PCR was conducted to validate the accuracy of the genes obtained from the transcriptome by investigating the expression levels of ten DEGs randomly selected from the transcriptome data, including three DEGs involved in photosynthesis, three DEGs related to phenylpropanoid biosynthesis, and four DEGs related to starch and sucrose metabolism. The correlation between the RNA-seq value and qRT-PCR value was calculated using the Pearson correlation coefficient. The expression trends of the 10 selected DEGs are consistent with the RNA-seq results. These findings suggest that there is a strong correlation between the results obtained via the two different methods, which confirms the reliability of the transcriptome data (Supplemental Figure S1). The detailed primer information is shown in Supplemental Table S5.

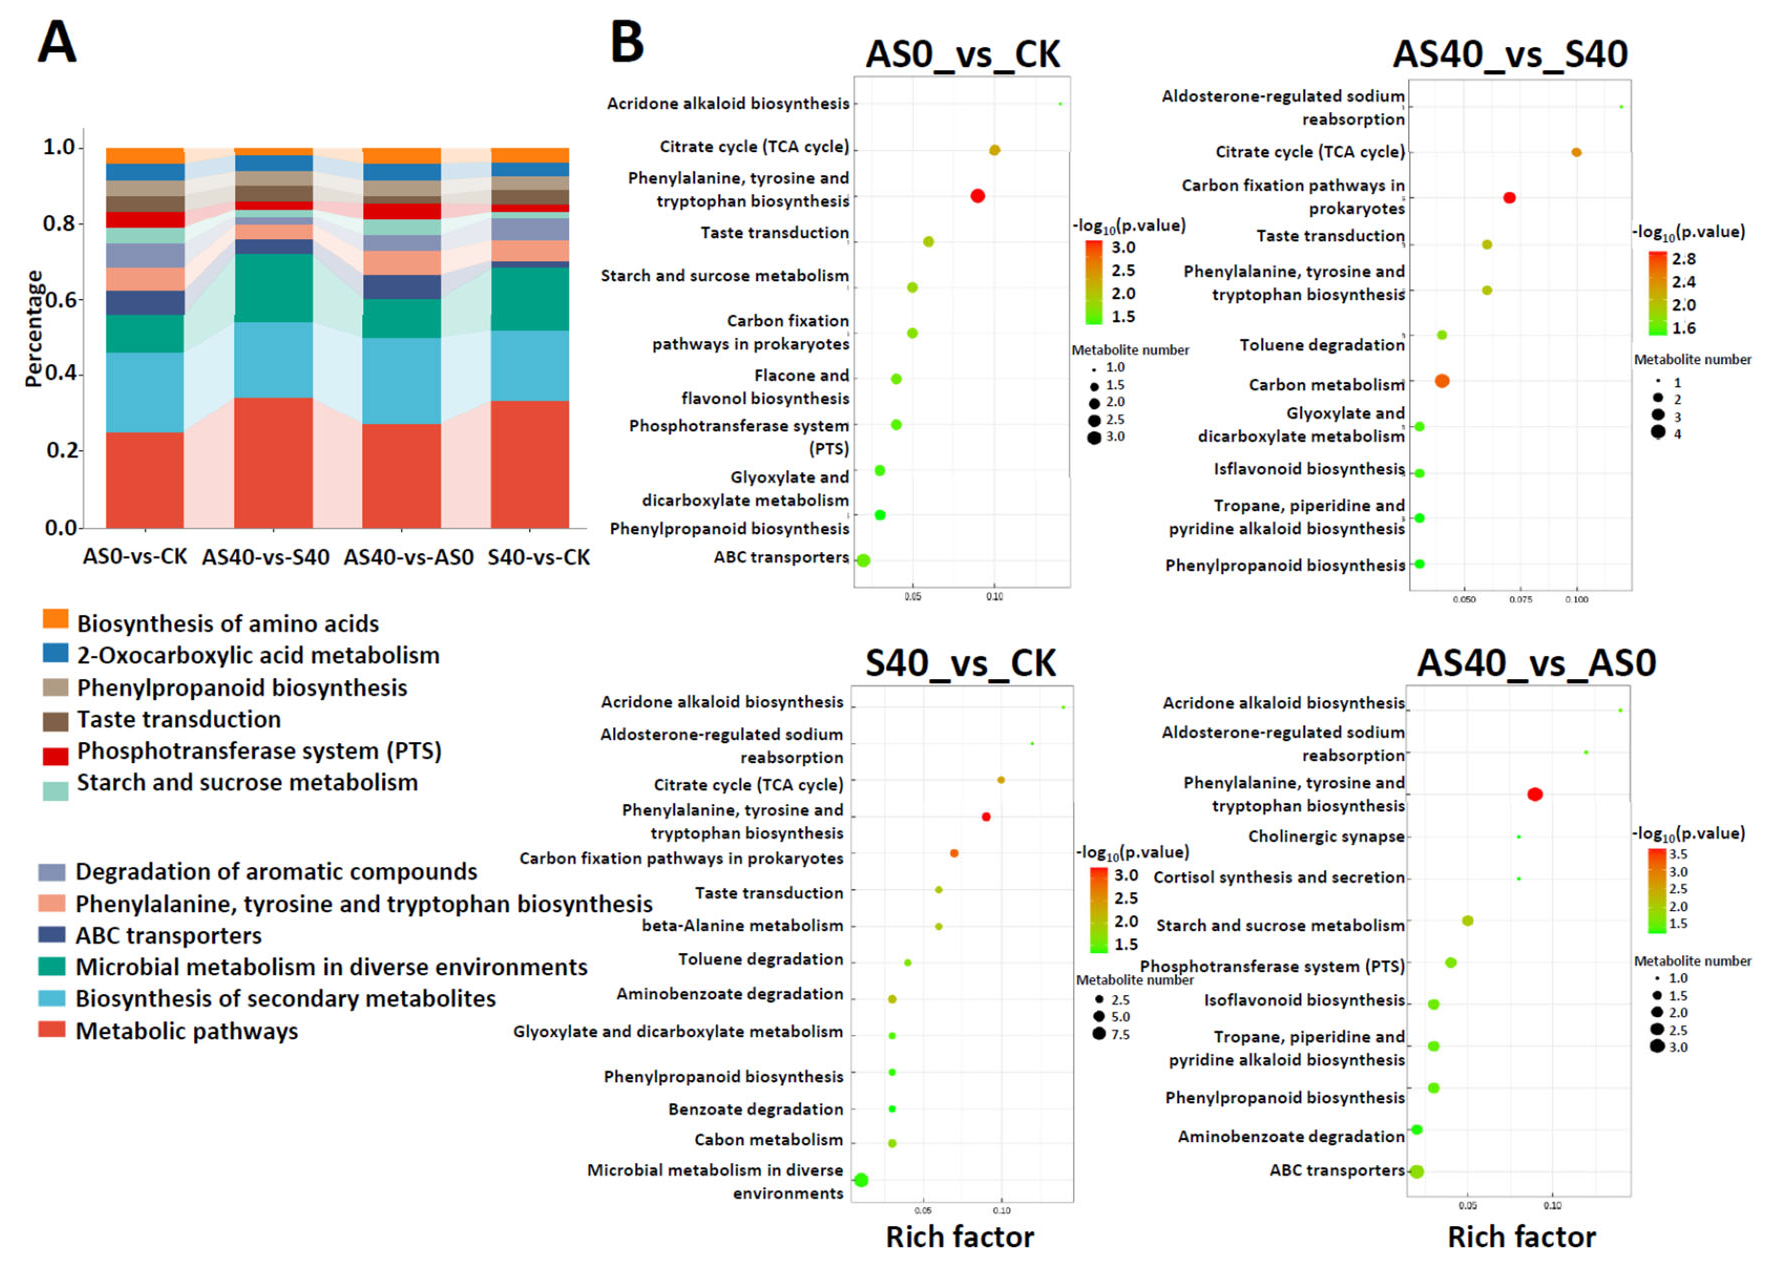
3.3. Metabolites of Peanut Leaves in Response to Shading Stress Under ALA Application

Nontarget metabolome analysis was subsequently conducted to detect the significantly altered metabolites in peanut leaves subjected to shading stress and ALA application. A hierarchical clustering heatmap and principal component analysis (PCA) were performed on the metabolite data, which indicated an obvious separation between the four treatments and that the addition of ALA caused significant changes in the metabolite expression levels between the AS40 and S40 treatments (Figure 8). The heatmap of the DAMs clearly reflects the differences between groups (Figure 8A). PC1 and PC2 explained 38.4% and 32.4% of the variance, respectively (Figure 8B).
A total of 907 metabolites were identified and classified into 11 chemical compound categories (Supplemental Figure S2A). The abundances of 426 metabolites significantly changed, including 82 (31 up-regulated and 51 down-regulated metabolites), 82 (47 up-regulated and 35 down-regulated metabolites), 91 (42 up-regulated and 49 down-regulated metabolites), 85 (53 up-regulated and 32 down-regulated metabolites), and 86 (40 up-regulated and 46 down-regulated metabolites) significantly changed metabolites in the AS0 vs. CK, AS40 vs. S40, S40 vs. CK, AS40 vs. AS0, and AS40 vs. CK comparisons, respectively, based on the criteria of a VIP score > 1 and a p value < 0.05 (Figure 9). There were 10 significantly altered metabolites in all five comparisons, indicating that the changes caused by shading stress were largely alleviated by the addition of ALA (Supplemental Figure S2B). Furthermore, 8, 10, 6, 8, and 2 metabolites specifically accumulated in the AS0 vs. CK, AS40 vs. S40, S40 vs. CK, AS40 vs. AS0, and AS40 vs. CK comparisons, respectively. In addition, there were 133 significantly changed metabolites in the S40 vs. CK and AS40 vs. AS0 comparisons, and 42 specifically accumulated metabolites in the AS40 vs. AS0 comparison, implying a close relationship between shading stress and the amortizing functions of ALA. A total of 128 significantly changed metabolites were detected in the AS0 vs. CK and AS40 vs. S40 comparisons, with the most accumulated lipids and lipid-like molecules (19.4% and 29.8%, respectively), phenylpropanoids and polyketides (19.4% and 23.4%, respectively), and decreased metabolites of organic oxygen compounds (14.3%) (Supplemental Figure S2C). These findings indicate that the function of ALA in alleviating shading is related to the pathways of these metabolites. The top ten specified accumulated metabolites were identified based on the fold change values from each comparison (Supplemental Figure S2C).
The DAMs were annotated using KEGG enrichment analysis and visualized in Figure 10, which shows the top 20 pathways with the greatest significance based on the p value. Among the comparisons under shading stress (S40 vs. CK and AS40 vs. AS0), significant enrichment was assigned to phenylalanine, tyrosine, and tryptophan biosynthesis, the degradation of aromatic compounds, the phosphotransferase system (PTS), and citrate cycle (TCA cycle) metabolic pathways. Furthermore, after ALA application under shading stress (AS40 vs. S40), the metabolites related to “carbon metabolism” were enriched. When ALA was applied under normal sunlight conditions (AS0 vs. CK), the metabolites were assigned to phenylalanine, tyrosine, and tryptophan biosynthesis, the phosphotransferase system (PTS), phenylpropanoid biosynthesis, and the biosynthesis of amino acids. A considerable portion of metabolites were enriched in the biosynthesis of the secondary metabolites pathway, the phosphotransferase system, and amino acid metabolism in peanut leaves under shading stress and ALA application, which suggests that these important metabolic pathways are related to the ability of ALA to enhance shading resistance.

3.4. Integrated Analysis of the Transcriptome and Metabolome Data

Correlation analysis was conducted between DEGs and DAMs in the same comparison and annotated in the same metabolic pathway to further understand the underlying mechanism of the response to shading stress and the alleviation mechanism of ALA application. The number of metabolic pathways involved in both the transcriptome and metabolome tended to increase under shading stress (AS0 vs. CK, AS40 vs. S40) (Figure 11). However, the number of metabolic pathways involved in both omics analyses decreased after ALA application (AS40 vs. AS0 and S40 vs. CK) (Figure 11). The results show that many DEGs that responded to ALA application under both normal sunlight and shading stress (AS0 vs. CK and AS40 vs. S40) were strongly correlated with DAMs that were significantly enriched in the phenylpropanoid biosynthesis pathway (Figure 11). Under normal lighting conditions, ALA strongly influences starch and sucrose metabolism pathways. Simultaneously, the results show that under shading stress, ALA application (AS40 vs. AS0 and S40 vs. CK) not only had a strong relationship with the phenylpropanoid biosynthesis pathway, but was also significantly associated with the tropane, piperidine, and pyridine alkaloid biosynthesis pathways.
According to the combined transcriptome and metabolome analysis, many DEGs and DAMs in the S40 vs. CK and AS40 vs. AS0 comparisons under shading stress were significantly enriched in starch and sucrose metabolism. The accumulation of many metabolites and enzyme-related genes associated with the glycolysis pathway decreased under shading stress. The glycolysis pathway, a respiratory pathway, is essential for energy provision and can feed the glycolytic product pyruvate into a substrate of the tricarboxylic acid cycle (TCA cycle). Furthermore, the expression level of pyruvate dehydrogenase E2, which can catalyze the conversion of pyruvate to acetyl-CoA (the entry of the TCA cycle), was obviously increased in the AS40 vs. AS0 comparison with the control group. Both cis-aconitate and malic acid in the TCA cycle increased under shading stress (S40 vs. CK). However, after ALA application, the accumulation of cis-aconitate decreased in the AS40 vs. AS0 comparison. These results indicate that shading stress has a strong negative influence on peanut energy metabolism. In addition, a significant increase in the accumulation of phenylpyruvate, which is an important compound for the biosynthesis of the aromatic amino acid phenylalanine, was detected in AS40 vs. AS0 group. Moreover, both ferulic acid and 4-hydroxystyrene, the downstream metabolites of phenylalanine involved in phenylpropanoid biosynthesis metabolism, were also significantly increased in the AS40 vs. AS0 comparison, which indicates that the alleviation mechanism of ALA application occurs under shading stress. Phenylalanine is not only a product of the pentose phosphate pathway, but also the start of phenylpropanoid biosynthesis, which directly involves the carbon flow into the phenylpropanoid metabolism pathway (Figure 11). Furthermore, the increased accumulation of ferulic acid suggests an increase in the metabolite production of these three kinds of lignin. Under shading stress, ALA also has a significant effect on photosynthesis in peanut leaves. Many DEGs belonging to photosystem II (PSII) (for enzymes, PsbC/PsbP/PsbQ/PsbS/Psb28/PsbE), cytochrome b6/f (cytb6f) (for enzymes, PetC), photosystem I (PSI) (for enzymes, PetF), and ATPase (for enzymes, b/beta) were down-regulated after ALA application under shading stress (AS40 vs. AS0). The results show that ALA positively regulates plant photosynthesis and adapts to shaded environments.
Through the combined analysis of these studies, we revealed that ALA alleviated plant shading stress and enhanced plant adaptability through different regulatory mechanisms. Under normal light conditions (AS0 vs. CK), ALA application significantly increased the expression levels of the PsbC, PetD, and PetF genes involved in photosynthesis, while under shading stress, the differences in the expression of the three genes mentioned above disappeared in the AS40 vs. S40 comparison, accompanied by a significant decrease in the expression levels of PsbP, PsbQ, PsbS, and Psb28 of the PS II compound, and b genes of the ATPase compound. Equally significant differences were observed in the glycolysis pathway. Under normal light conditions, the AS0 group produced more sucrose than the CK group. Moreover, we detected markedly increased expression levels of genes related to enzymes involved in the glycolysis pathway (6-phosphofructokinase, fructose-bisphosphate aldolase, NADP+, pyruvate decarboxylase, pyruvate dehydrogenase E1, pyruvate decarboxylase, and alcohol dehydrogenase). These findings suggest that exogenous ALA addition under normal light conditions greatly enhances the activity of the glycolysis pathway. Under shading stress, the accumulation of both sucrose and the enzymes mentioned above (with the exception of 6-phosphofructokinase) in the ALA application group (AS40) decreased in the S40 group. The regulatory effects of ALA differ under normal light conditions and shade stress. ALA greatly enhanced the pentose phosphate pathway activity and phenylpropanoid biosynthesis under shaded conditions, as indicated by the significant accumulation of phenylpyruvate, ferulic acid, and 4-hydroxystyrene. Furthermore, an increased accumulation of cis-aconitate and decreased accumulation of malic acid were detected in the TCA cycle in the AS0 vs. CK comparison. Succinyl-CoA, the precursor of ALA, is an important intermediate between cis-aconitate acid and malic acid in the TCA cycle and is critical for various metabolic processes. These findings indicate that the exogenous addition of ALA may inhibit the biosynthesis of endogenous ALA under normal light conditions. However, under shading stress, both cis-aconitate acid and malic acid increased in the S40 vs. CK comparison, which suggests an increase in the accumulation of endogenous ALA.

4. Discussion

Since ALA has a critical function in plant metabolism and growth as a common precursor of chlorophyll in all plants, it has received increasing attention and has been proven to be an effective and environmentally friendly growth regulator and promoter in agriculture [13]. Increasing evidence suggests that the exogenous application of ALA can increase yield and enhance resistance to various harmful stresses in plants [14,15,16,17]. Peanut is an important crop in peanut and maize intercropping systems because it allows for the more efficient utilization of light energy and greater economic value [3]. However, peanuts in intercropping systems with maize often experience shading stress, leading to a limited peanut yield as the maize continues to grow taller. Peanut–maize intercropping systems are typically environments with dense plant populations and shading stress, usually for shorter peanut plants, which causes the shade syndrome characterized by reduced photosynthetic capacity [18]. Shading stress obviously affected peanut growth and development by inhibiting various metabolic pathways. Therefore, more in-depth studies aimed at understanding the effects and regulatory mechanisms of ALA on peanut shading stress are needed and meaningful for agriculture, because of the promising regulatory effects in intercropping systems. In this study, we performed an integrated analysis of DEGs via the transcriptome and DAMs via the metabolome in peanut leaves under shading stress. The results showed that exogenous ALA application could promote a series of biochemical and physiological processes, such as photosynthesis, glycolysis, phenylpropanoid biosynthesis, and serine metabolism. Moreover, the results also indicated that the regulatory effects of ALA under normal light conditions were different from those under shading stress.

4.1. The Regulatory Mechanism of ALA Under Normal Light Conditions

ALA has been widely applied as a promising crop growth regulator and biostimulant to improve immune responses, promote resistance, and increase yield in agriculture [19]. In this study, the phenotypic results show that exogenous supplementation with ALA could significantly increase photosynthetic parameters under normal light conditions. Photosynthesis is the foundation of all metabolic processes. Simultaneously, the results of the combined transcriptome and metabolome analyses indicate that the application of exogenous ALA under normal light conditions significantly increased the expression levels of the PsbC gene in PSII, PetF gene in PSI, and PetD gene in the cytb6f complex in the photosynthetic pathway. PSII, cytb6f, PSI, and ATP synthase supercomplexes are key photosynthetic elements that sustain light harvesting, linear electron transport to NADP+ and CO2 assimilation, carbon fixation, and the generation of the high-energy carriers ATP and NADPH in plants [20]. The PsbC protein is an important assembly factor of PSII that plays an important role in maintaining the efficient assembly and repair of PSII under various conditions [21]. The petC protein (Rieske FeS protein), one of the major subunits of cytb6f, has been shown to positively regulate the abundance of cytb6f, the electron transport capacity of PSII, and CO2 assimilation [22,23]. PetF is a crucial light-dependent ferredoxin (FDX) protein that can receive electrons from PSI. The overexpression of PetF in Chlamydomonas reinhardtii could decrease the level of H2O2 and diminish chlorophyll degradation [24]. The increased expression levels of those genes involved in photosynthesis implied that photosynthesis increased with exogenous ALA application under normal light conditions, as evidenced by both plant photosynthetic and growth indicators.
Moreover, the increased accumulation of sucrose in the glycolysis pathway also reflects increased photosynthesis from another perspective. Glycolysis is a prelude to the TCA cycle. Ethanol is the major source of NADPH as well as a typical downstream fermentation pathway of glycolysis [25]. The increased expression of most enzymes involved in the ethanol fermentation pathway indicates that ALA application redirected carbon fixation via photosynthesis into ethanol. Ethanol is known to be a useful signaling molecule and has positive and protective effects on plants to enhance their adaptation to stress [26]. An increasing number of studies have shown that exogenous ALA treatment can promote resistance to abiotic stress through physiological and molecular defense mechanisms in plants [27,28,29,30]. We speculate that the foliar application of ALA under normal light conditions can also enhance plant resistance to abiotic stresses, possibly by increasing the level of ethanol, which acts as a positive signal for downstream regulation.
Furthermore, the increased expression levels of lipoxygenase and jasmonate O-methyltransferase in α-linolenic acid (C18:3 ∆9,12,15) metabolism strongly prompted us to believe that the content of jasmonate (JAs) increased. JAs, the precursor to jasmonic acid (JA), is involved in a wide range of physiological processes, such as plant growth, development, and defense against various stresses, through the establishment of a downstream signaling network as a signaling molecule [31]. It has been reported that the exogenous application of JAs improved the PSII maximum quantum efficiency, increased the photosynthetic efficiency, and increased the accumulation of saccharides in photosynthetic products in Brassica oleracea L. [32]. Our results indicate that exogenous supplementation with ALA not only enhanced photosynthesis by enhancing photosynthesis-related gene expression, but also increased photosynthesis by producing JAs through the α-linolenic acid pathway under normal light conditions. Furthermore, we believe that the accumulation of JAs is another pathway by which ALA enhances plant resistance to stress conditions [33].
Increased accumulations of cysteine-S-conjugate beta-lyase and 1-aminocyclopropane-1-carboxylate have been identified in the ethylene biosynthesis pathway. This finding suggests that the accumulation of ethylene is another pathway through which downstream ALA regulation can influence photosynthesis under normal light conditions. Photosynthesis is the most important process in plants and can convert solar energy and organic compounds into carbohydrates and oxygen. For decades, a large number of studies have suggested that ethylene is strongly related to the normal chlorophyll content in juvenile leaves and exerts a triple regulatory effect on photosynthesis (inhibition, no effect, and stimulation) in different species, indicating the occurrence of species-specific regulation [34]. The present study suggests that photosynthesis is stimulated by ethylene in peanuts. Additionally, this volatile plant hormone responds to various abiotic and biotic stresses [35]. We speculate that this is also a pathway through which the exogenous application of ALA can enhance plant resistance. The detailed mechanism underlying the regulation of ALA metabolism remains unclear, and more in-depth research is needed to improve the understanding of this process. Taken together, these results highlight the importance of ALA signaling in mediating plant photosynthesis, tolerance, and resistance under normal light conditions.

4.2. The Regulatory Mechanism of ALA Under Shading Conditions

Phosphatidylcholine (PC), the most abundant component of the plasma membrane, is synthesized mainly through choline [36]. The membrane system plays an important role in controlling the material inflow and outflow. Due to their sensitivity to various injuries, membranes can adjust their state by changing the components of PCs to promote resistance to external stress and maintain photosynthesis [37]. Therefore, the increased accumulation of choline in the AS40 vs. S40 and AS40 vs. AS0 comparisons suggests the increased accumulation of PC in those comparisons, which indicates the increased stability of the cell membrane structure and its steady biological function under shading stress. Furthermore, PCs are not only major components of the membrane system, but also signal substances related to the stress response [37]. We believe that exogenous ALA application not only increases membrane stability (including cell and thylakoid membranes) and normal photosynthesis, but also regulates downstream related gene expression in response to shading stress through the PC signaling pathway.
The significant accumulation of phenylpyruvate in the shikimate pathway was detected in both the AS40 vs. S40 and AS40 vs. AS0 comparisons. This result implies an increase in phenylalanine, which was also demonstrated by the obvious accumulation of ferulic acid and 4-hydroxystyrene in the phenylpropanoid biosynthesis pathway. At the start of this pathway, the increase in phenylalanine suggests an increase in the number of products of the phenylpropanoid biosynthesis pathway. Both phenylalanine and ferulic acid are involved in the synthesis of guaiacyl lignin, syringyl lignin, and 5-hydroxy-guaiacyl lignin. These results suggest that more lignin accumulates under shading stress and in the presence of ALA (AS40) than in the S40 and AS0 groups. Since lignin is the main component and most important for the physical mechanical strength of the cell wall and plant xylem vessels, lignin biosynthesis is indispensable for plant growth, organ development, and water and nutrient transport [38]. A significant accumulation of metabolic flux in the lignin synthesis pathway would benefit plant adaptation under shading stress [39,40]. Previous studies have also demonstrated that lignin contributes to the protection of plants against abiotic stresses [41,42]. In this study, the increased lignin content caused by phenylpyruvate and ferulic acid enhanced the acclimation and resistance to shading stress. Our results are consistent with those of previous studies. Under shading stress, the accumulation of lignin can increase the thickness and reduce the permeability of the cell wall, which can promote adaptability to shading stress. Furthermore, the biosynthesis of lignin extensively benefits plant growth, development, and resistance [43]. The whole-plant function is affected by altered lignin biosynthesis [44]. Lignin deficiency can drastically interfere with and reduce photosynthetic processes [45]. It has been suggested that lignin deficiency plays a negative role in cell wall biosynthesis and severely inhibits plant growth, leading to stunted plant growth [46]. The cell wall is crucial for photosynthesis regulation, not only because of its thickness but also because of its composition [47]. The thickness of the cell wall is dynamic and can influence photosynthesis under different light conditions [48]. The thicker the cell wall, the lower the photosynthetic efficiency [47]. Our study revealed that the exogenous application of ALA under shaded conditions may reduce plant photosynthesis by enhancing the activity of lignin biosynthesis pathways, altering the thickness and composition of the cell wall, and thereby increasing the adaptability of plants under shaded conditions. The consistency between the changes in lignin and PC suggest the important role of the cell wall, cell membrane, and thylakoid membrane in photosynthetic adaptation under shading stress.

4.3. Exogenous ALA Exerts Downstream Regulatory Effects by Affecting Internal ALA Biosynthesis

ALA has been identified as a regulator of and is associated with normal plant growth; it is effective at regulating harmful stresses and is involved in physiological and biochemical processes, similar to hormones [49]. However, there is little detailed information on the regulatory effect of ALA on peanut plants. In our study, the results imply that exogenous ALA application may have different influences on internal ALA biosynthesis metabolism under normal light conditions and shading stress conditions. We speculate that exogenous ALA regulates the adaptability of peanuts under different light conditions by affecting the concentration of endogenous ALA.
There are two main pathways for the biosynthesis of ALA: the C4 pathway (Shemin pathway), which has been found in animals, fungi, and bacteria, and the C5 pathway (Beale pathway), which is one of the most important bioprocesses in photosynthetic plants and algae [13,50]. In the C4 pathway, ALA is produced from succinyl-CoA in the TCA cycle and glycine, and this process is catalyzed by ALA synthase. In the C5 pathway, the ALA synthesis pathway starts from L-glutamate and mainly includes three steps of enzymatic reactions [13]. In the C4 pathway, the expression of the HemA gene, which encodes a key rate-limiting enzyme, glutamate-tRNA reductase enzyme (GluTR), significantly differed between the AS40 and AS0 treatments. However, the accumulation of glycine hydroxymethyltransferase, which catalyzes the biosynthesis of glycine from serine, significantly changed in all four comparisons. Both the C4 and C5 pathways responded to the addition of exogenous ALA, but the C4 pathway was more sensitive to the addition of exogenous ALA than the C5 pathway.
Since dose effects often occur when exogenous ALA is applied to plants [13,51], we believe that the reason for the dose effect of exogenous ALA causing different influences on plants may be the alteration in the internal ALA concentration of plants, as indicated by the combined analysis of genes and enzymes from the transcriptome and metabolome of the ALA biosynthesis pathways in our study. Based on the changes in the accumulation of cis-aconitate and malic acid and the expression levels of glycine hydroxymethyltransferase genes, we speculate that the exogenous application of ALA promotes the biosynthesis of endogenous ALA under normal light conditions (AS0 vs. CK), while reducing the biosynthesis of endogenous ALA under shading conditions (AS40 vs. S40). This can also potentially be explained by the increased accumulation of sucrose in the AS0 vs. CK comparison, which suggests that the increased content of glucose had a greatly positive effect on the ALA synthesis process [52].
In addition, because the C4 pathway is commonly used in fungi and bacteria to synthesize ALA, we speculate that endogenous microorganisms in peanut leaves may play a major role in responding to exogenous ALA and promoting peanut adaptation to both normal light and shading stress conditions through the C4 pathway of ALA production. Recently, an increasing number of studies have reported on the C4 pathway of ALA biosynthesis via Corynebacterium glutamicum and Escherichia coli originating from native photosynthetic bacteria. We propose the hypothesis that the ALA bioproduction and metabolism pathways of endophytic microorganisms in peanut leaves have positive and reinforcing effects on normal light adaptation and shade tolerance. This study will provide crucial insights for subsequent research on the function and biosynthesis of ALA.

5. Conclusions

We concluded that ALA could be used as an efficient regulator or signaling molecule to regulate downstream pathways and ultimately enhance shading tolerance at both the transcript and metabolic levels in peanuts. Under normal light conditions, exogenous ALA application significantly enhanced photosynthetic efficiency. However, exogenous ALA application under shading stress could improve the stability of the cell membrane structure and reduce plant photosynthesis to enhance the adaptability of plants. The results of the integrated analyses also imply that exogenous ALA application may have different influences on internal ALA biosynthesis metabolism under normal light conditions and shading stress conditions. Taken together, these results improve our knowledge and understanding of ALA’s effects and molecular mechanisms. Our findings would suggest that exogenous ALA application is beneficial for peanut growth and development under shading conditions.

Supplementary Materials

The following supporting information can be downloaded at: https://www.mdpi.com/article/10.3390/agronomy15051211/s1. Table S1. Original data of transcriptome sequencing; Table S2. Data of transcriptome sequencing reads; Table S3. Information of DEGs in transcriptome analysis; Table S4. The main terms of GO enrichment; Table S5. List of primer sequences used in qRT-PCR verification; and Figure S1. Verification and consistency analysis of the selected genes’ expression levels between RNA-Seq and qRT-PCR results in peanut leaves. Figure S2. (A) Identification of DAMs for comparison. (B) A total of 907 metabolites were identified and classified into 11 chemical compound categories. (C) Venn diagram analysis of metabolites.

Author Contributions

Conceptualization, P.S. and Q.W.; funding acquisition, P.S., L.Y., H.L. and M.L.; investigation, Q.W., L.Y., H.L., M.L. and D.C.; methodology, Q.W., L.Y., H.L., M.L. and D.C.; resources, P.S.; supervision, P.S.; writing—original draft, Q.W.; writing—review and editing, P.S. and Q.W. All authors have read and agreed to the published version of the manuscript.

Funding

This research was supported by the Agricultural Science and Technology Innovation Engineering of Shandong Academy of Agricultural Sciences (CXGC2025C19), the Shandong Natural Science Foundation (ZR2022MC074), the Major Scientific and Technological Innovation Projects in Shandong Province (2019JZZY010702), and the Key R & D Program of Shandong Province (2023TZXD007).

Data Availability Statement

The data are contained within the article or Supplementary Materials.

Acknowledgments

The authors are grateful to all the laboratory members for continuous technical advice and helpful discussion. We also would like to show our gratitude to Jianhua Sun and Xuejun Lu for their assistance during planting management and soil sampling.

Conflicts of Interest

The authors declare that they have no known competing financial interests or personal relationships that could have appeared to influence the work reported in this paper.

References

  1. Liu, H.; Lin, R.; Deng, X.W. Photobiology: Light signal transduction and photomorphogenesis. J. Integr. Plant Biol. 2020, 62, 1267–1269. [Google Scholar] [CrossRef] [PubMed]
  2. Yao, X.D.; Li, C.H.; Li, S.Y.; Zhu, Q.; Zhang, H.J.; Wang, H.Y.; Yu, C.M.; Steven, K.S.M.; Xie, F.T. Effect of shade on leaf photosynthetic capacity, light-intercepting, electron transfer and energy distribution of soybeans. Plant Growth Regul. 2017, 83, 409–416. [Google Scholar] [CrossRef]
  3. Li, Y.H.; Shi, D.Y.; Li, G.H.; Zhao, B.; Zhang, J.W.; Liu, P.; Ren, B.Z.; Dong, S.T. Maize/peanut intercropping increases photosynthetic characteristics, 13C-photosynthate distribution, and grain yield of summer maize. J. Integr. Agric. 2019, 18, 2219–2229. [Google Scholar] [CrossRef]
  4. Gronle, A.; Lux, G.; Böhm, H.; Schmidtke, K.; Wild, M.; Demmel, M.; Brandhuber, R.; Wilbois, K.P.; Heß, J. Effect of ploughing depth and mechanical soil loading on soil physical properties weed infestation, yield performance and grain quality in sole and intercrops of pea and oat in organic farming. Soil Tillage Res. 2015, 148, 59–73. [Google Scholar] [CrossRef]
  5. Wang, J.; Yao, R.; Sun, Z.; Wang, M.; Jiang, C.; Zhao, X.; Liu, X.; Zhong, C.; Zhang, H.; Zhao, S.; et al. Effects of shading on morphology, photosynthesis characteristics, and yield of different shade-tolerant peanut varieties at the flowering stage. Front. Plant Sci. 2024, 15, 1429800. [Google Scholar] [CrossRef] [PubMed]
  6. Liu, Z.; Nan, Z.; Lin, S.; Meng, W.; Xie, L.; Yu, H.; Zhang, Z.; Wan, S. Organ removal of maize increases peanut canopy photosynthetic capacity, dry matter accumulation, and yield in maize/peanut intercropping. Front. Plant Sci. 2023, 14, 1266969. [Google Scholar] [CrossRef]
  7. Gupta, D.; Prasad, S.M. Priming with 5-aminolevulinic acid (ALA) attenuates UV-B induced damaging effects in two varieties of Cajanus cajan L. seedlings by regulating photosynthetic and antioxidant systems. S. Afr. J. Bot. 2021, 138, 129–140. [Google Scholar] [CrossRef]
  8. Mohamed, S.; Hangqi, S.; Jungui, X.; Yajing, G.; Wenjian, S.; Jin, H. Seed polyamines metabolism induced by seed priming with spermidine and 5-aminolevulinic acid for chilling tolerance improvement in rice (Oryza sativa L.) seedlings. Environ. Exp. Bot. 2017, 137, 58–72. [Google Scholar] [CrossRef]
  9. Tan, S.; Cao, J.; Xia, X.; Li, Z. Advances in 5-Aminolevulinic Acid Priming to Enhance Plant Tolerance to Abiotic Stress. Int. J. Mol. Sci. 2022, 23, 702. [Google Scholar] [CrossRef]
  10. Aksakal, O.; Algur, O.; Aksakal, F.; Aysin, F. Exogenous 5-aminolevulinic acid alleviates the detrimental effects of UV-B stress on lettuce (Lactuca sativa L.) seedlings. Acta Physiol. Plant. 2017, 39, 1–10. [Google Scholar] [CrossRef]
  11. Akram, N.A.; Ashraf, M. Regulation in plant stress tolerance by a potential plant growth regulator, 5-aminolevulinic acid. J. Plant Growth Regul. 2013, 32, 663–679. [Google Scholar] [CrossRef]
  12. Tsugawa, H.; Ikeda, K.; Takahashi, M.; Satoh, A.; Mori, Y.; Uchino, H.; Okahashi, N.; Yamada, Y.; Tada, I.; Bonini, P.; et al. A lipidome atlas in MS-DIAL. Nat. Biotechnol. 2020, 38, 1159–1163. [Google Scholar] [CrossRef] [PubMed]
  13. Wu, Y.; Liao, W.; Dawuda, M.M.; Hu, L.; Yu, J. 5-Aminolevulinic acid (ALA) biosynthetic and metabolic pathways and its role in higher plants: A review. Plant Growth Regul. 2019, 87, 357–374. [Google Scholar] [CrossRef]
  14. An, Y.; Cheng, D.; Rao, Z.; Dun, Y.; Tang, Q.; Wang, L. 5-Aminolevulinic acid (ALA) promotes primary root elongation through modulation of auxin transport in Arabidopsis. Acta Physiol. Plant. 2019, 41, 85. [Google Scholar] [CrossRef]
  15. Sher, A.; Nawaz, A.; Ul-Allah, S.; Sattar, A.; Ijaz, M.; Qayyum, A.; Manaf, A. Foliar application of 5-aminolevulinic acid improves the salt tolerance in sunflower (Helianthus annuus L.) by enhancing the morphological attributes and antioxidant defense mechanism. Acta Physiol. Plant. 2024, 46, 24. [Google Scholar] [CrossRef]
  16. Farid, M.; Ali, S.; Saeed, R.; Rizwan, M.; Bukhari, S.A.H.; Abbasi, G.H.; Hussain, A.; Ali, B.; Zamir, M.S.I.; Ahmad, I. Combined application of citric acid and 5-aminolevulinic acid improved biomass, photosynthesis and gas exchange attributes of sunflower (Helianthus annuus L.) grown on chromium contaminated soil. Int. J. Phytoremediat. 2019, 21, 760–767. [Google Scholar] [CrossRef]
  17. Ahmad, P.; Abd-Allah, E.F.; Alyemeni, M.N.; Wijaya, L.; Alam, P.; Bhardwaj, R.; Siddique, K.H.M. Exogenous application of calcium to 24-epibrassinosteroid pre-treated tomato seedlings mitigates NaCl toxicity by modifying ascorbate glutathione cycle and secondary metabolites. Sci. Rep. 2018, 8, 13515. [Google Scholar] [CrossRef] [PubMed]
  18. Rasheed, R.; Yasmeen, H.; Hussain, I.; Iqbal, M.; Ashraf, M.A.; Parveen, A. Exogenously applied 5-aminolevulinic acid modulates growth, secondary metabolism and oxidative defense in sunflower under water deficit stress. Physiol. Mol. Biol. Plants 2020, 26, 489–499. [Google Scholar] [CrossRef]
  19. Mohammadi, H.; Ezati, P.; Hazrati, S.; Ghorbanpour, M. Exogenously applied 5-aminolevulinic acid modulates growth, yield, and physiological parameters in lentil (Lens culinaris Medik.) under rain-fed and supplemental irrigation conditions. Sci. Rep. 2023, 13, 21312. [Google Scholar] [CrossRef]
  20. Pan, X.; Cao, D.; Xie, F.; Xu, F.; Su, X.; Mi, H.; Zhang, X.; Li, M. Structural basis for electron transport mechanism of complex I-like photosynthetic NAD (P) H dehydrogenase. Nat. Commun. 2020, 11, 610. [Google Scholar] [CrossRef]
  21. Zabret, J.; Bohn, S.; Schuller, S.K.; Arnolds, O.; Möller, M.; Meier-Credo, J.; Liauw, P.; Chan, A.; Tajkhorshid, E.; Langer, J.; et al. Structural insights into photosystem II assembly. Nat. Plants 2021, 7, 524–538. [Google Scholar] [CrossRef]
  22. Simkin, A.J.; McAusland, L.; Lawson, T.; Raines, C.A. Overexpression of the RieskeFeS protein increases electron transport rates and biomass yield. Plant Physiol. 2017, 175, 134–145. [Google Scholar] [CrossRef]
  23. Ermakova, M.; Lopez-Calcagno, P.E.; Raines, C.A.; Furbank, R.T.; von Caemmerer, S. Overexpression of the Rieske FeS protein of the Cytochrome b6f complex increases C4 photosynthesis in Setaria viridis. Commun. Biol. 2019, 2, 314. [Google Scholar] [CrossRef] [PubMed]
  24. Lin, Y.H.; Pan, K.Y.; Hung, C.H.; Huang, H.E.; Chen, C.L.; Feng, T.Y.; Huang, L.F. Overexpression of ferredoxin, PETF, enhances tolerance to heat stress in Chlamydomonas reinhardtii. Int. J. Mol. Sci. 2013, 14, 20913–20929. [Google Scholar] [CrossRef]
  25. Xiao, T.; Khan, A.; Shen, Y.; Chen, L.; Rabinowitz, J.D. Glucose feeds the tricarboxylic acid cycle via excreted ethanol in fermenting yeast. Nat. Chem. Biol. 2022, 18, 1380–1387. [Google Scholar] [CrossRef]
  26. Rahman, M.M.; Mostofa, M.G.; Das, A.K.; Anik, T.R.; Keya, S.S.; Ahsan, S.M.; Khan, M.A.R.; Ahmed, M.; Rahman, M.A.; Hossain, M.M.; et al. Ethanol Positively Modulates Photosynthetic Traits, Antioxidant Defense and Osmoprotectant Levels to Enhance Drought Acclimatization in Soybean. Antioxidants 2022, 11, 516. [Google Scholar] [CrossRef]
  27. Wu, Y.; Liu, N.; Hu, L.; Liao, W.; Tang, Z.; Xiao, X.; Lu, J.; Xie, J.; Calderón-Urrea, A.; Yu, J. 5-Aminolevulinic Acid Improves Morphogenesis and Na+ Subcellular Distribution in the Apical Cells of Cucumis sativus L. Under Salinity Stress. Front. Plant Sci. 2021, 12, 636121. [Google Scholar] [CrossRef]
  28. Sher, A.; Tahira, A.S.; Sattar, A.; Nawaz, A.; Qayyum, A.; Hussain, S.; Manaf, A. Foliage application of 5-aminolevulinic acid alleviates drought stress in sunflower (Helianthus annuus L.) through improving stay green and antioxidant enzymes activities. Acta Physiol. Plant 2021, 43, 22. [Google Scholar] [CrossRef]
  29. Baral, A. Strawberries under salt stress: ALA and ROS to the rescue. Physiol. Plant. 2019, 167, 2–4. [Google Scholar] [CrossRef]
  30. Wu, L.; Song, L.; Cao, L.; Meng, L. Alleviation of Shade Stress in Chinese Yew (Taxus chinensis) Seedlings with 5-Aminolevulinic Acid (ALA). Plants 2023, 12, 2333. [Google Scholar] [CrossRef]
  31. Griffiths, G. Jasmonates: Biosynthesis, perception and signal transduction. Essays Biochem. 2020, 64, 501–512. [Google Scholar] [CrossRef] [PubMed]
  32. Sirhindi, G.; Mushtaq, R.; Gill, S.S.; Sharma, P.; Allah, E.F.A.; Ahmad, P. Jasmonic acid and methyl jasmonate modulate growth, photosynthetic activity and expression of photosystem II subunit genes in Brassica oleracea L. Sci. Rep. 2020, 10, 9322. [Google Scholar] [CrossRef] [PubMed]
  33. Ruan, J.; Zhou, Y.; Zhou, M.; Yan, J.; Khurshid, M.; Weng, W.; Cheng, J.; Zhang, K. Jasmonic acid signaling pathway in plants. Int. J. Mol. Sci. 2019, 20, 2479. [Google Scholar] [CrossRef] [PubMed]
  34. Ceusters, J.; Van de Poel, B. Ethylene exerts species-specific and age-dependent control of photosynthesis. Plant Physiol. 2018, 176, 2601–2612. [Google Scholar] [CrossRef]
  35. Mohorović, P.; Geldhof, B.; Holsteens, K.; Rinia, M.; Daems, S.; Reijnders, T.; Ceusters, J.; Van den Ende, W.; Van de Poel, B. Ethylene inhibits photosynthesis via temporally distinct responses in tomato plants. Plant Physiol. 2023, 195, 762–784. [Google Scholar] [CrossRef]
  36. Moitra, S.; Pawlowic, M.C.; Hsu, F.; Zhang, K. Phosphatidylcholine synthesis through cholinephosphate cytidylyltransferase is dispensable in Leishmania major. Sci. Rep. 2019, 9, 7602. [Google Scholar] [CrossRef] [PubMed]
  37. Sun, M.; Liu, X.; Gao, H.; Zhang, B.; Peng, F.; Xiao, Y. Phosphatidylcholine enhances homeostasis in peach seedling cell membrane and increases its salt stress tolerance by phosphatidic acid. Int. J. Mol. Sci. 2022, 23, 2585. [Google Scholar] [CrossRef]
  38. Zhao, S.; Zhao, L.; Liu, F.; Wu, Y.; Zhu, Z.; Sun, C.; Tan, L. Narrow and rolled leaf 2 regulates leaf shape, male fertility, and seed size in rice. J. Integr. Plant Biol. 2016, 58, 983–996. [Google Scholar] [CrossRef]
  39. Wang, J.P.; Matthews, M.L.; Naik, P.P.; Williams, C.M.; Ducoste, J.J.; Sederoff, R.R.; Chiang, V.L. Flux modeling for monolignol biosynthesis. Curr. Opin. Biotechnol. 2019, 56, 187–192. [Google Scholar] [CrossRef]
  40. Dong, N.Q.; Lin, H.X. Contribution of phenylpropanoid metabolism to plant development and plant-environment interactions. J. Integr. Plant Biol. 2021, 63, 180–209. [Google Scholar] [CrossRef] [PubMed]
  41. Cesarino, I. Structural features and regulation of lignin deposited upon biotic and abiotic stresses. Curr. Opin. Biotechnol. 2019, 56, 209–214. [Google Scholar] [CrossRef]
  42. Liu, W.; Jiang, Y.; Wang, C.; Zhao, L.; Jin, Y.; Xing, Q.; Li, M.; Lv, T.; Qi, H. Lignin synthesized by CmCAD2 and CmCAD3 in oriental melon (Cucumis melo L.) seedlings contributes to drought tolerance. Plant Mol. Biol. 2020, 103, 689–704. [Google Scholar] [CrossRef]
  43. Liu, Q.; Luo, L.; Zheng, L. Lignins: Biosynthesis and Biological Functions in Plants. Int. J. Mol. Sci. 2018, 19, 335. [Google Scholar] [CrossRef]
  44. Zhang, Q.; Wang, L.; Wang, Z.; Zhang, R.; Liu, P.; Liu, M.; Liu, Z.; Zhao, Z.; Wang, L.; Chen, X.; et al. The regulation of cell wall lignification and lignin biosynthesis during pigmentation of winter jujube. Hortic. Res. 2021, 8, 238. [Google Scholar] [CrossRef]
  45. Prokopavicius, R.M.; Stout, A.T.; Davis, A.A.; King, J.S. Transgenically altered lignin biosynthesis affects photosynthesis and water relations of field-grown Populus trichocarpa. Biomass Bioenerg. 2017, 98, 15–25. [Google Scholar] [CrossRef]
  46. Bonawitz, N.D.; Kim, J.I.; Tobimatsu, Y.; Ciesielski, P.N.; Anderson, N.A.; Ximenes, E.; Maeda, J.; Ralph, J.; Donohoe, B.S.; Ladisch, M. Disruption of mediator rescues the stunted growth of a lignin-deficient Arabidopsis mutant. Nature 2014, 509, 376–380. [Google Scholar] [CrossRef]
  47. Flexas, J.; Clemente-Moreno, M.J.; Bota, J.; Brodribb, T.J.; Gago, J.; Mizokami, Y.; Nadal, M.; Perera-Castro, A.V.; Roig-Oliver, M.; Sugiura, D.; et al. Cell wall thickness and composition are involved in photosynthetic limitation. J. Exp. Bot. 2021, 72, 3971–3986. [Google Scholar] [CrossRef] [PubMed]
  48. Fini, A.; Loreto, F.; Tattini, M.; Giordano, C.; Ferrini, F.; Brunetti, C.; Centritto, M. Mesophyll conductance plays a central role in leaf functioning of Oleaceae species exposed to contrasting sunlight irradiance. Physiol. Plant 2016, 157, 54–68. [Google Scholar] [CrossRef]
  49. Agrawal, S.; Karcher, D.; Ruf, S.; Bock, R. The Functions of Chloroplast Glutamyl-tRNA in Translation and Tetrapyrrole Biosynthesis. Plant Physiol. 2020, 183, 263–276. [Google Scholar] [CrossRef]
  50. Chen, B.; Li, J.; Feng, Y.; Le, K.; Zai, Y.; Tang, X.; Sun, Y.; Zeng, X.; Lin, L. Green and mild production of 5-aminolevulinic acid from algal biomass. Korean J. Chem. Eng. 2021, 38, 899–905. [Google Scholar] [CrossRef]
  51. Phung, T.H.; Jung, S. Perturbed porphyrin biosynthesis contributes to differential herbicidal symptoms in photodynamically stressed rice (Oryza sativa) treated with 5-aminolevulinic acid and oxyfluorfen. Pest. Biochem. Physiol. 2014, 116, 103–110. [Google Scholar] [CrossRef] [PubMed]
  52. Chen, J.; Wang, Y.; Guo, X.; Rao, D.; Zhou, W.; Zheng, P.; Sun, J.; Ma, Y. Efficient bioproduction of 5-aminolevulinic acid, a promising biostimulant and nutrient, from renewable bioresources by engineered Corynebacterium glutamicum. Biotechnol. Biofuels 2020, 13, 41. [Google Scholar] [CrossRef] [PubMed]
Figure 1. Outline diagram of the experimental process. A total of four treatments involved CK, AS0, S40, and AS40. The three sampling times were marked with blue triangles. The two ALA foliar spraying times were marked with pink triangles. DAS means day after shading.
Agronomy 15 01211 g001
Figure 2. Photosynthesis indices of peanut plants, including the A value (A), E value (B), Ci value (C), Gs value (D), and SPAD value (E) were detected before (flowering stage) and after (podding stage) spraying with ALA in four treatments. Bars with different lowercase letters were significantly different from each other (p < 0.05).
Agronomy 15 01211 g002
Figure 3. Phenotypes of peanut plants before (flowering stage) and after (podding stage) spraying with ALA under four treatments including the main stem height (A), the first lateral branch length (B), branch number (C), and the dry weights (DWs) of the roots (D), stems (E), leaves (F), and pods (G). Bars with different lowercase letters were significantly different from each other (p < 0.05).
Agronomy 15 01211 g003
Figure 4. The growth parameters of the roots, including total root length (A), total root surface area (B), total root volume (C), and total number of root tips (D) before (flowering stage) and after (podding stage and harvest time) spraying with ALA under four treatments.
Agronomy 15 01211 g004
Figure 5. DEG analysis of transcriptome results between each treatment. In the upper right bar chart, red bars and blue bars represented up-regulated and down-regulated DEGs between treatments, respectively. In the bar chart below, each row represents a differential comparison group, and the colored bar chart represents the number of differential genes in each differential comparison group. The black dots indicate the differentially expressed genes belonging to a certain comparison group. The interconnected black dots indicate that there are common differentially expressed genes among several differentially expressed groups anchored by the black dots. The bar chart of different gene numbers represents the number of differentially expressed genes at the intersection of each comparison group.
Agronomy 15 01211 g005
Figure 6. KEGG pathway annotation analysis and KEGG enrichment analysis in four comparisons.
Agronomy 15 01211 g006
Figure 7. Information on DEGs from 21 TF families between four treatments in transcriptome analysis. The Y-axis represents transcription factors and the X-axis represents the number of members with significantly changed expression levels in different comparison groups.
Agronomy 15 01211 g007
Figure 8. The hierarchical clustering heatmap (A) and principal component analysis (PCA) of metabolomic data (B). The samples within the treatment are gathered together. Each treatment contains six samples, labeled as AS40-1~AS40-6, CK-1~CK-6, S40-1~S40-6, and AS0-1~AS0-6.
Agronomy 15 01211 g008
Figure 9. The abundances of metabolites significantly changed between four comparisons. In the comparisons of AS0 vs. CK (A), AS40 vs. S40 (B), S40 vs. CK (C), and AS40 vs. AS0 (D), differential metabolites were labeled as colored dots with a fold change ≥1.6 (up-regulated) or ≤0.625 (down-regulated) and a p-value < 0.05. The horizontal axis represents the fold change in gene expression in different experimental treatments. The vertical axis represents the statistical significance of changes in gene expression levels. The scattered dots in the figure represent each gene. Black dots below the horizontal dashed line represent genes with no significant differences. The colored dots above the horizontal dashed line and to the right of the vertical dashed line represent up-regulated genes with significant differences. The colored dots above the horizontal dashed line and to the left of the vertical dashed line represent down-regulated genes with significant differences. The color represents the corresponding compounds in lists on the right.
Agronomy 15 01211 g009
Figure 10. The proportion of main DAMs (A) and KEGG enrichment analysis (B). In plot A, the color of each bar represents the corresponding category in the list below the plot. The height of each bar represents the proportion of DAMs annotated in the category. In plot B, each bubble represents a metabolic pathway. The size of the bubble represents the influence of the pathway in topological analysis. The larger the size, the greater the influence. The depth of color represents the −log10 p-value. The darker the color, the more significant the enrichment.
Agronomy 15 01211 g010
Figure 11. Candidate metabolic pathway related to shading stress and exogenous ALA application effects. Four comparisons (AS0 vs. CK, AS40 vs. S40, S40 vs. CK, and AS40 vs. AS0) were used to detect the important correlated pathways. Red box represents up-regulated DEGs/DAMs. Green box represents down-regulated DEGs/DAMs. White box represents no significant change in comparisons.
Agronomy 15 01211 g011
Disclaimer/Publisher’s Note: The statements, opinions and data contained in all publications are solely those of the individual author(s) and contributor(s) and not of MDPI and/or the editor(s). MDPI and/or the editor(s) disclaim responsibility for any injury to people or property resulting from any ideas, methods, instructions or products referred to in the content.

