Article

Genome-Wide Characterization and Haplotype Module Stacking Analysis of the KTI Gene Family in Soybean (Glycine max L. Merr.)

1
National Key Laboratory of Smart Farm Technology and System, National Research Center of Soybean Engineering and Technology, Northeast Agricultural University, Harbin 150030, China
2
College of Arts and Sciences, Northeast Agricultural University, Harbin 150030, China
3
Jiamusi Branch Institute, Heilongjiang Academy of Agricultural Sciences, Jiamusi 154005, China
4
Grain Crops Institute, XinJiang Academy of Agricultural Sciences, Urumqi 830091, China
*
Authors to whom correspondence should be addressed.
These authors contributed equally to this paper.
Agronomy 2025, 15(5), 1210; https://doi.org/10.3390/agronomy15051210
Submission received: 7 April 2025 / Revised: 6 May 2025 / Accepted: 14 May 2025 / Published: 16 May 2025
(This article belongs to the Special Issue Genetic Basis of Crop Selection and Evolution)

Abstract

:
The Kunitz trypsin inhibitor (KTI) gene family encompasses a category of trypsin inhibitors, and the KTI proteins are important components of the 2S storage protein fraction in soybeans. In this study, fifty members of the GmKTI family were identified in the soybean genome, and their physicochemical properties, domain compositions, phylogenetic relationships, gene structures, and expression patterns were comprehensively analyzed to explore their impact on soybean seed protein content. The results revealed significant gene expansion within the GmKTI family in soybean. The gene structures and conserved motifs of GmKTI members exhibited both regularity and diversity, with distinct expression patterns across different soybean tissues. Haplotype analysis identified 7 GmKTI genes significantly associated with seed storage protein content, and the combination of superior haplotypes was found to enhance seed storage protein content. This is crucial for the improvement of soybean varieties and the enhancement of storage protein content. Additionally, the GmKTI family demonstrated evolutionary conservation, with its functions likely linked to light induction, biotic stress, and growth development. This study characterizes the structure, expression, genomic haplotypes, and molecular features of the soybean KTI domain for the first time, providing a foundation for functional analyses of the GmKTI domain in soybean and other plants.

1. Introduction

Soybean (Glycine max L. Merr.), a major oilseed crop, is renowned for its high-quality protein and oil. With approximately 40 g of protein per 100 g, its protein content is comparable to that of meat, earning it the designation ‘vegetable meat’. Additionally, soybeans contain around 20 g of fat per 100 g, ranking them among the leading legumes. Consequently, soybeans serve as a vital source of edible oil and protein for both humans and animals [1,2].
Edible proteins are primarily derived from animals, plants, and fungi [3]. Plant-based proteins are classified into four categories: albumins, globulins, prolamins, and glutelins [4]. Soybean proteins are further categorized into two types based on solubility: water-soluble and salt-soluble [5]. Soybeans contain roughly 40% crude protein, with globulins being the predominant type. While solubility-based classification is convenient, a more precise method using sedimentation coefficients (S20,W) has been developed, where ‘S’ refers to Svedberg units, and a larger number indicates a larger protein [6,7]. Under appropriate buffer conditions (0.0325 M K2HPO4, 0.0026 M KH2PO4, 0.40 M NaCl, pH = 7.6), soybean proteins are divided into four components by ultracentrifugation based on sedimentation coefficients: 2S (25 kDa), 7S (160 kDa), 11S (350 kDa), and 15S (600 kDa) [8,9]. Albumins are primarily found in the 2S fraction, while globulins are mainly in the 7S, 11S, and 15S fractions [10]. The 2S component, which accounts for 20% of soybean protein, contains low-molecular-weight proteins, such as 2S globulin, cytochrome C, Kunitz trypsin inhibitor (KTI; ~20,100 Da), and Bowman-Birk trypsin inhibitor (BBTI; ~8000 Da), both of which are associated with childhood growth retardation. In 1945, Kunitz first isolated a protein with protease inhibitor activity from soybeans, termed soybean trypsin inhibitor (SKTI). Proteolytic enzyme inhibitors extracted from non-soybean plants are called KTIs. Kunitz-type inhibitors are proteinase inhibitors that delay or inhibit enzyme catalysis and are considered anti-nutritive compounds [11].
In previous studies, based on variations in nucleotide sequences among soybean KTI family members resulting in distinct electrophoretic mobility patterns, researchers have classified them into twelve distinguishable types: Tia, Tib, Tic, Tid, Tie, Ti-null–type, Tif, Tibi5, Tiaa1, Tiaa2, Tiab1, and Tig [12,13,14,15,16,17,18,19]. These types are controlled by multiple alleles at a single locus. Amino acid sequence studies reveal that Tia and Tib differ by nine amino acids, while Tic, Tid, Tie, and Tia differ by only one amino acid, as do Tif and Tib. Some scholars suggest that the divergence between Tia and Tib occurred anciently, likely before the domestication of wild soybeans into cultivated ones [20,21,22,23]. Tia is considered the prototype of Tib due to its prevalence in wild soybeans. Although there is no other evidence to support this hypothesis, the frequency of Tia in wild soybeans from China and other Asian countries corroborates this view [24,25]. Apart from Tid, there are 11 alleles at the KTI locus in wild beans [14,26]. Tia, Tib, and Tic are common in both wild and cultivated soybeans, while seven other KTI types (Tie, Tif, Tibi5, Tia1, Tia2, Tig, and Tib1) have been found in wild soybeans. Tid has been identified in Chinese cultivars [19]. Despite differences in KTI types, they function similarly to trypsin inhibitors, and their biological functions may be replaced by analogous proteins [27,28,29,30].
Current research on soybean seed protein content has made significant progress. GmSWEET10a/b regulates fatty acid synthesis through sugar allocation, thereby indirectly influencing protein accumulation [31]. HSSP1 modulates soybean seed protein content by controlling GmCG1 expression [32]. However, no functional validation of KTI members has been conducted. To date, no comprehensive genome-wide survey and characterization of soybean KTI domains have been conducted, despite its dual role as a storage protein and anti-nutritional factor. In this study, we identified KTI family members in the soybean genome and performed extensive bioinformatics analyses, including assessments of physicochemical properties, domain structures, phylogenetic relationships, gene structures, and expression patterns. Additionally, we analyzed duplication events of GmKTI members to gain evolutionary insights and conducted haplotype analysis using resequencing data from 547 soybean accessions in Northeast China [33]. This analysis revealed that superior haplotype combinations are associated with higher storage protein content, highlighting the potential link between GmKTIs and storage protein content. This study aims to investigate the genomic and functional characteristics of GmKTI members and their regulatory roles in modulating seed storage protein content. These findings will significantly influence crop improvement strategies and efforts to boost storage protein content.

2. Materials and Methods

2.1. Identification of KTI Gene Family Members

The KTI family number PF00197 was retrieved from the Pfam database, and the corresponding PF00197.hmm file was downloaded using the pfamID [34]. The hmmsearch program in HMMER software (v3.4) was then used to search against the complete protein sequences of Arabidopsis thaliana, Oryza sativa, Zea mays, Medicago truncatula, and Glycine max, which served as the reference databases [35,36,37,38,39,40]. Genes with an E-value of less than 0.05 were screened and identified as members of the KTI family.

2.2. Analysis of Protein Characteristics and Physicochemical Properties of GmKTIs

The physicochemical properties of each gene in the KTI gene family were analyzed using the ExPASy website (https://web.expasy.org/protparam/, accessed on 15 February 2025), which provided data on amino acid length, molecular weight, hydrophilicity, and other relevant characteristics for the soybean KTI gene family [41]. Subcellular localization sites of the KTI gene family members were predicted using the online software Cell Ploc2.0 (http://www.csbio.sjtu.edu.cn/bioinf/plant/, accessed on 15 February 2025) [42]. The hydropathy of the proteins encoded by the KTI gene family was predicted using Expasy (https://web.expasy.org/protscale/, accessed on 15 February 2025) [41]. Signal peptides of the KTI protein family were predicted using the online tool SignaIP (https://services.healthtech.dtu.dk/services/SignalP-4.1/, accessed on 15 February 2025) [43]. The transmembrane domains were analyzed using the online tool TMHMM2.0 (https://services.healthtech.dtu.dk/services/TMHMM-2.0/, accessed on 15 February 2025) [44].

2.3. Construction of Phylogenetic Tree

The protein sequences of KTI family members from five species were aligned using MAFFT software (v7.520) [45]. The alignment results were imported into MEGA X software (v10.2.5), and a maximum likelihood (ML) tree was constructed using the Maximum Likelihood method with 1000 bootstrap replicates [46]. The tree was visualized using the TVBOT online tool (https://www.chiplot.online/tvbot.html, accessed on 22 February 2025) [47].

2.4. Gene Structure, Conserved Motifs, Promoter Cis-Acting Elements, and Transcriptional Profiling ANALYSIS

The gff3 file of the soybean reference genome Glycine max Wm82.a2.v1 was downloaded from the Phytozome database to obtain structural information of the longest transcript of the KTI family. MEME software (v5.5.7) was used for motif analysis of the soybean KTI family members with the following parameters: -protein-mod anr-nmotifs 10-minw 6-maxw 100, where the ANR model was employed to search for 10 motifs, each ranging from 6 to 100 amino acids in length [48]. The PlantCare website (https://bioinformatics.psb.ugent.be/webtools/plantcare/html/, accessed on 25 February 2025) was used to obtain promoter sequences within −2500 bp upstream of the ATG start codon, and TBtools software (v2.225) was used for visualization [49,50]. Expression data of KTI family members in various tissues of Williams82 were retrieved from the SoyMD database, and an expression heatmap was generated using the R language [51].

2.5. Collinearity and Phylogenetic Analysis of Paralogous Genes

The protein sequences of KTI family members in soybean were compared using Blastp software (v2.12.0+) [52]. Homology and collinearity analyses were performed using MCScanX software (v1.0.0) with the following parameters: MCScanX-k 30-s 3-w 3 [53]. The duplicate_gene_classifier program was used to categorize gene duplications, and tandem and segmental duplication gene pairs were organized separately. Ka, Ks, and Ka/Ks values for homologous gene pairs were calculated using ParaAT software (v2.0) [54]. The formula for calculating divergence time is as follows:
T = k s 2 λ
T represents divergence time, k s represents the synonymous substitution rate, and   λ represents the synonymous substitution rate per synonymous site per year. In dicotyledonous plants, λ = 1.5 × 10 8 [55]. The two polyploidy events in soybean occurred 13 million years ago (Glycine) and 58 million years ago (legumes), corresponding to Ks values of 0–0.39 and 0.39–1.74, respectively [56].

2.6. Haplotype and Haplotype Module Stacking Analysis

In this study, we conducted haplotype analysis on a panel of 547 soybean accessions from the study by Qi [33]. Variant sites in the CDS region of GmKTI genes were extracted using the vcftools software (v0.1.17) and subjected to strict quality control measures [57]. Specifically, we filtered out sites with a missing rate > 20% and a minor allele frequency < 5%. Subsequently, we used R scripts to assess polymorphisms in the high-quality variant sites, defining haplotypes with a population frequency > 5% as major haplotypes. T-tests in R were performed to evaluate storage protein content differences among these major haplotypes. Additionally, we selected the top 5% and bottom 5% of accessions based on storage protein content and analyzed the haplotype module Stacking of GmKTI members in these accessions. T-tests were used to compare the differences between superior and inferior haplotypes.

3. Results

3.1. Identification of GmKTI Family

Using the KTI family’s hidden Markov model from the Pfam database, 50 GmKTI members were identified in soybean and renamed based on their chromosome positions (Table S1). All these members possess complete coding sequences. They encode proteins ranging from 90 to 243 amino acids in length, with molecular weights from 10.23 to 26.679 kDa. For example, GmKTI4 exhibits the shortest amino acid length and lowest molecular weight, while GmKTI42 has the longest and highest. Among the 50 members, 15 have isoelectric points above 7 (acidic), and 35 below 7 (alkaline), indicating a predominance of alkaline proteins in the GmKTI family. Hydropathy values range from −0.443 (GmKTI40) to −0.456 (GmKTI50), with 22 hydrophilic and 28 hydrophobic proteins. The aliphatic amino acid index ranges from 71.59 (GmKTI3) to 113.37 (GmKTI50), all above 70, indicating high thermostability of GmKTI proteins. Subcellular localization reveals that GmKTI members are distributed across multiple regions: plasma membrane, cell wall, endoplasmic reticulum, cytoplasm, and chloroplast, implying involvement in various biological processes and regulatory functions at different cellular levels. Signal peptide prediction shows that only GmKTI3 and GmKTI4 lack signal peptides, while the other 48 members possess them. Transmembrane domain analysis indicates 32 members have none, 16 members possess one, and GmKTI24 and GmKTI35 each have two. This suggests that GmKTI members are likely secretory or membrane proteins, potentially involved in extracellular signaling and environmental interactions. The varying number and the distribution of transmembrane domains highlight the diversity of membrane structures within the GmKTI family, with GmKTI24 and GmKTI35 possibly having more complex regulatory mechanisms in signal transduction or substance transport.

3.2. Phylogenetic Analysis of the GmKTI Family

To analyze the evolutionary patterns of the KTI family, we identified KTI members from five species: Arabidopsis thaliana, Oryza sativa, Zea mays, Medicago truncatula, and Glycine max. Only one KTI gene was found in both Oryza sativa and Zea mays, seven in Arabidopsis thaliana, while the largest number of KTI members were identified in Glycine max (50) and Medicago truncatula (49), indicating significant gene expansion in these two species. A phylogenetic tree was constructed based on these 108 KTI members (Figure 1A). The results revealed that, unlike other gene families, KTI members cluster by species, suggesting substantial structural differences between KTI members of different species. These differences may arise from distinct selective pressures and mutation events during evolution, which have shaped the specific biological functions of KTI genes in their respective host plants. This species-specific clustering implies that functional studies of the KTI family should consider the unique characteristics of each species, as KTI members from different species may exhibit significant structural and functional divergence. Therefore, the function of KTI genes in one species cannot be directly extrapolated to others.

3.3. Conservation Motif Analysis of GmKTIs

Using the MEME software (v5.5.7), we identified 10 conserved motifs in the GmKTI family members (Figure 1B). Motif 7, motif 3, and motif 5 are located in the N-terminal KTI domain region, while motif 2 and motif 6 are in the C-terminal KTI domain region. Most GmKTI family members contain these five motifs, indicating that the KTI family has conserved these key structural characteristics during evolution. These conserved structures give the KTI family some functional commonalities. However, there are differences in the positions and quantities of conserved motifs among different KTI members, mainly in the number of two or three motifs in the middle part. For example, GmKTI4 has a different N-terminal motif compared to other family members, while GmKTI22 and GmKTI33 have a distinct C-terminal motif. Notably, GmKTI24 only contains motif 1. These findings suggest that the KTI family has a relatively conserved motif arrangement but still exhibits some variations. The differences in the middle part’s motifs allow further classification of the GmKTI family.

3.4. Analysis of Gene Structure and Promoter Cis-Acting Elements

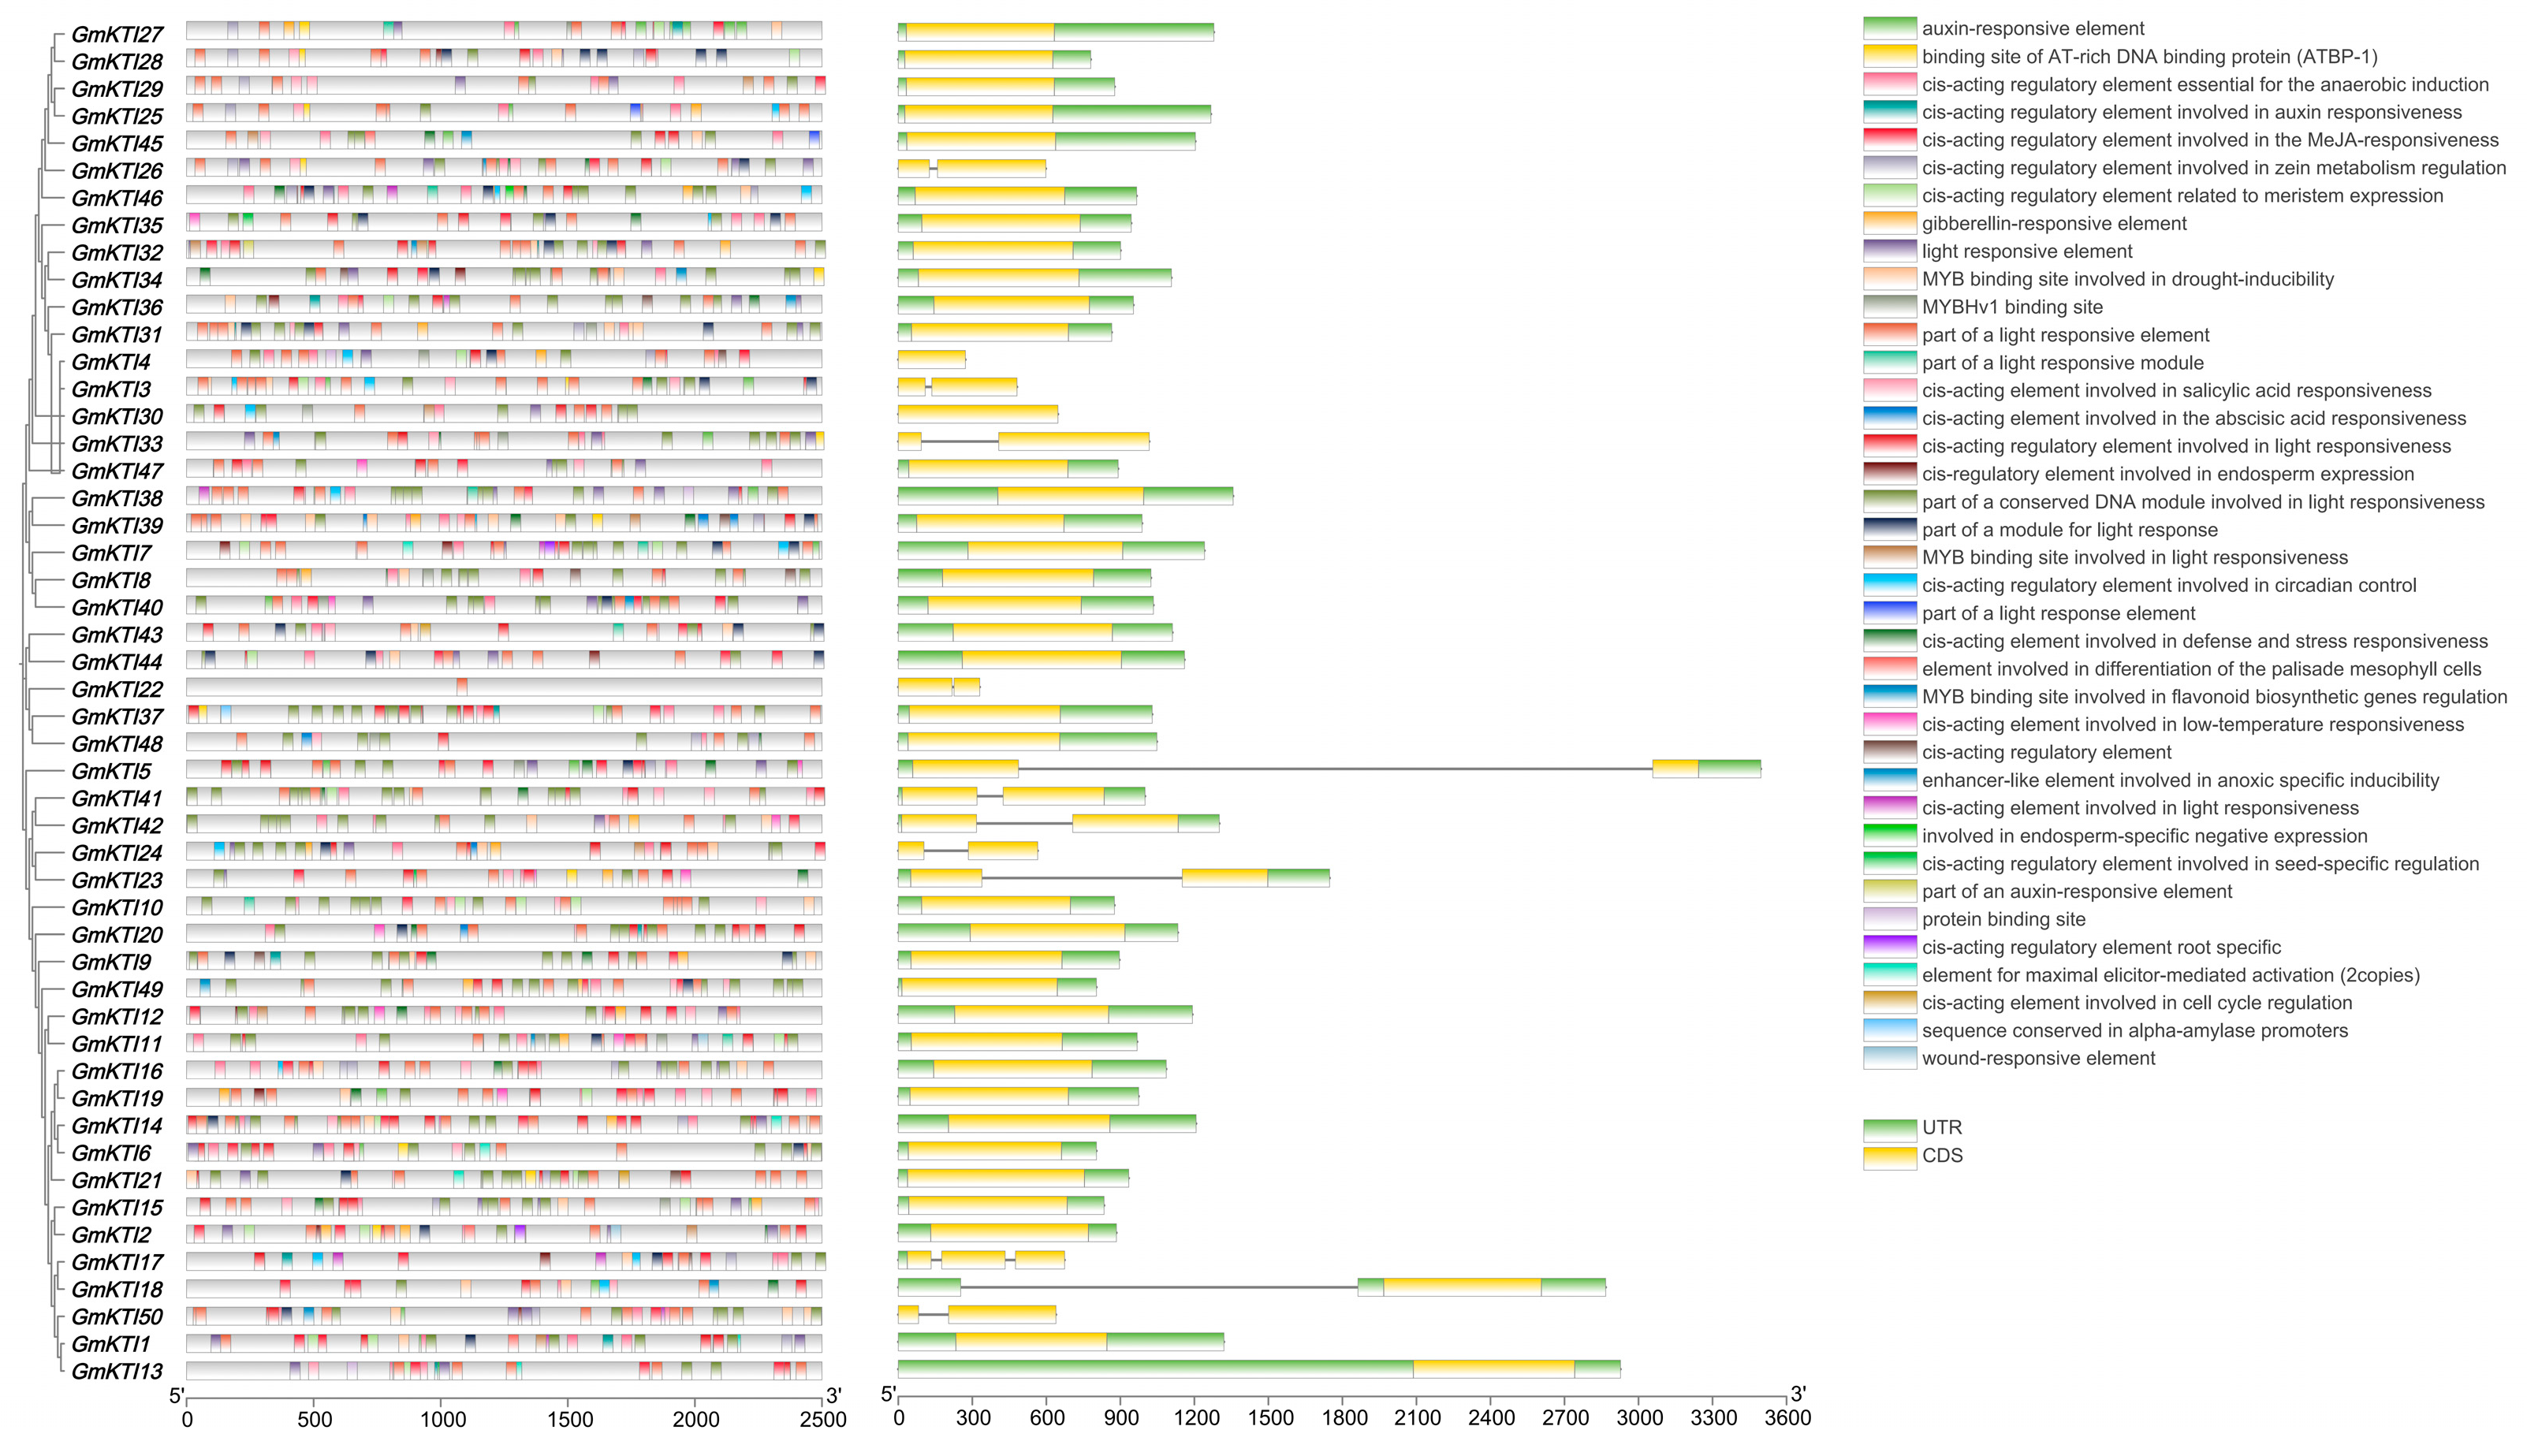
In this study, the gene structures of the GmKTI family members were analyzed. The results revealed that, except for GmKTI5, GmKTI23, GmKTI41, and GmKTI42, all other genes with both 5′UTR and 3′UTR have non-intron (Figure 2). In contrast, except for GmKTI4 and GmKTI30, all other genes without UTR structures have an intron, and most of these interrupted genes contain two segments of CDS. Notably, GmKTI17 contains three segments of CDS and lacks the 3′UTR. The patterns observed in the gene structures are consistent with the patterns of the motifs. For instance, GmKTI3 and GmKTI4, which lack the N-terminal motif, also lack both the 3′UTR and 5′UTR. Similarly, GmKTI30 and GmKTI33, which lack the central motif, also lack the UTR, and GmKTI33, being an interrupted gene, further lacks the C-terminal motif. These findings indicate a certain degree of regularity in the structure of GmKTI family genes and a correlation between gene structure and functional regions such as motifs.
We analyzed the promoter cis-acting elements in the region 2500 bp upstream of the start codon ATG for GmKTI members. These elements can be categorized into four functional classes: developmental and metabolic-related (such as auxin-responsive element, cis-acting element involved in cell cycle regulation, seed-specific regulatory element, and root-specific regulatory element), biotic stress-related (such as defense and stress responsiveness element, salicylic acid responsiveness element, and MYB binding site for flavonoid biosynthesis regulation), abiotic stress-related (such as low-temperature responsiveness element, drought-inducibility MYB binding site, and anoxic inducibility enhancer element), and light responsiveness-related (such as light responsiveness element, light-responsive MYB binding site, and light response element). All GmKTI members contain light responsiveness elements in their promoter regions, indicating a potential link between KTI and light induction. Additionally, 48 and 49 members contain elements related to biotic stress and growth regulation, respectively, highlighting the KTI family’s significant roles in biotic stress responses and growth development (Figure 2).

3.5. Phylogenetic Analysis of Paralogous Genes in the GmKTIs

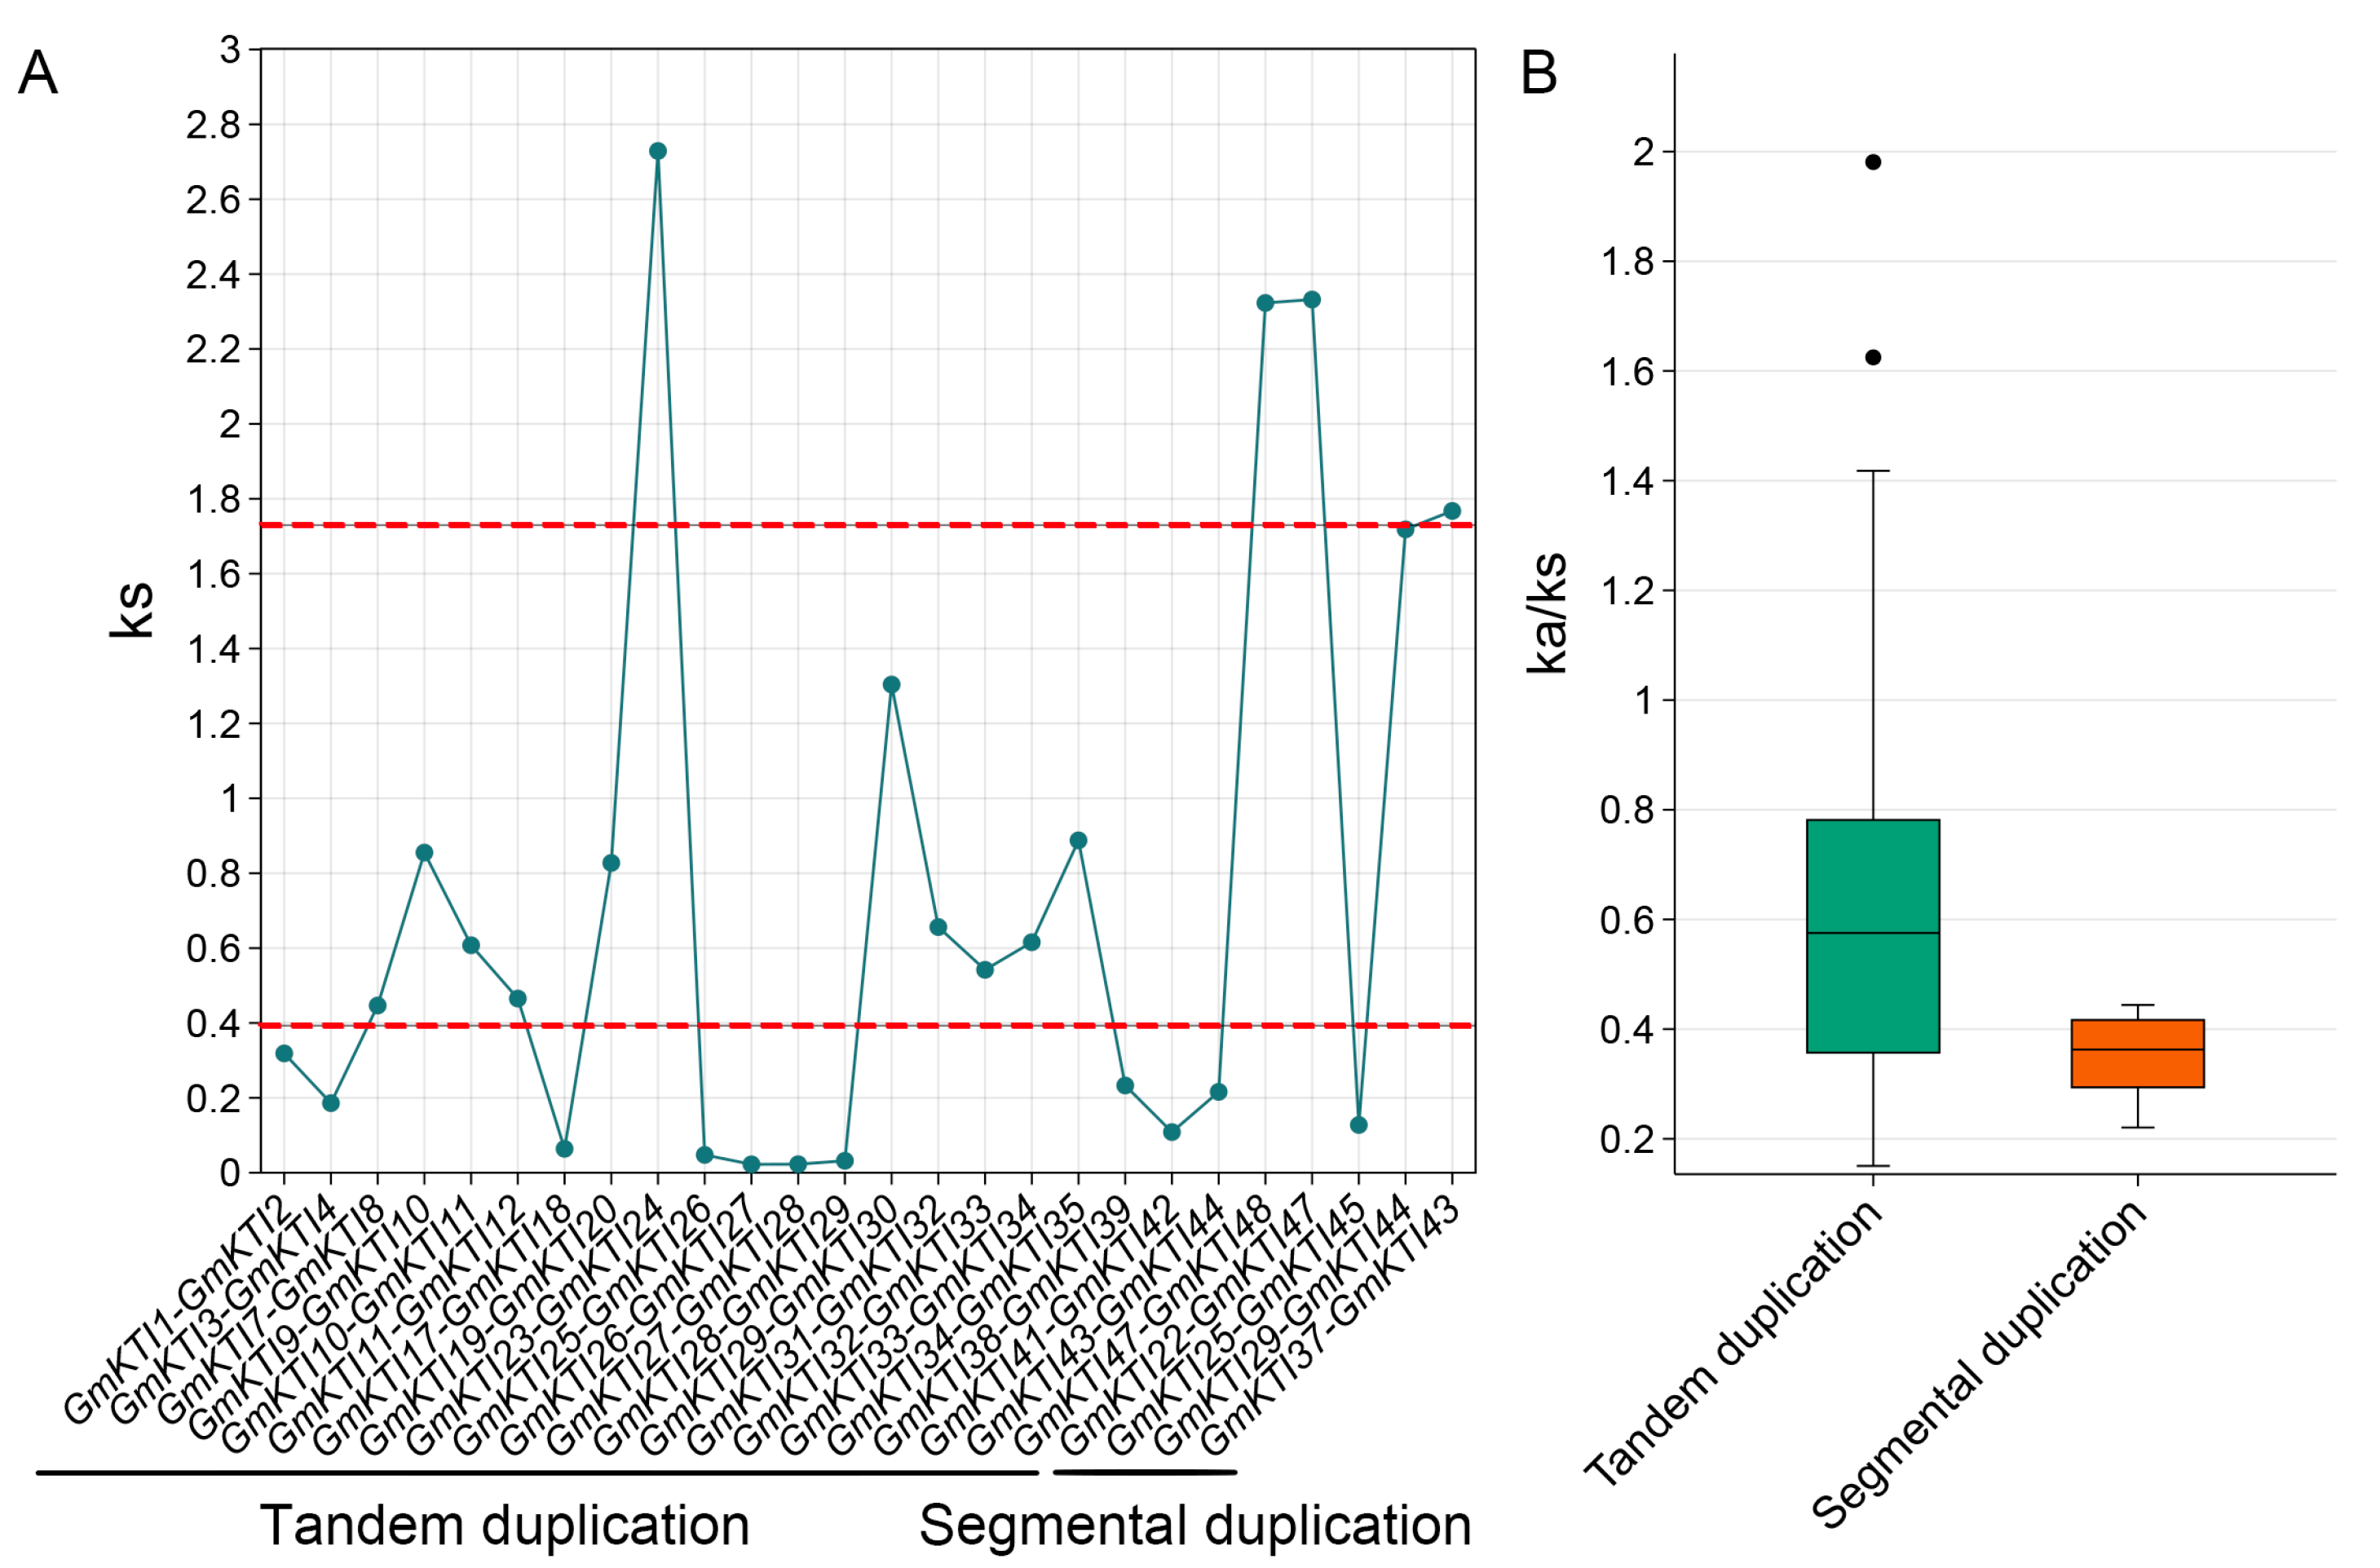
To gain deeper insights into the evolution of GmKTIs, we identified paralogous genes among the 50 GmKTI members, detecting four segmental duplication pairs, which are regarded as one pair of duplicated fragments, and 22 tandem duplication pairs. Further analysis of the synonymous (Ks) and non-synonymous (Ka) substitution rates among these paralogous pairs revealed that most tandem duplication genes had Ks values between 0.39 and 1.74, indicating duplication events between 13 and 58 million years ago. Some tandem duplicates with Ks values below 0.39 suggested recent duplications, while the Ks value between GmKTI47 and GmKTI48 exceeded 2, indicating saturation and making it impossible to determine their exact duplication time. The segmental duplicates GmKTI25 and GmKTI45 had a Ks value of 0.13, suggesting duplication around the 13-million-year Glycine event (Figure 3A). Other segmental duplications likely occurred near the legume genome duplication events. Both tandem and segmental duplicates mostly had Ka/Ks ratios below 1, with no statistically significant differences, implying that the GmKTI family has undergone purifying selection and retains a relatively conserved function (Figure 3B).

3.6. Transcriptional Profiling of GmKTIs

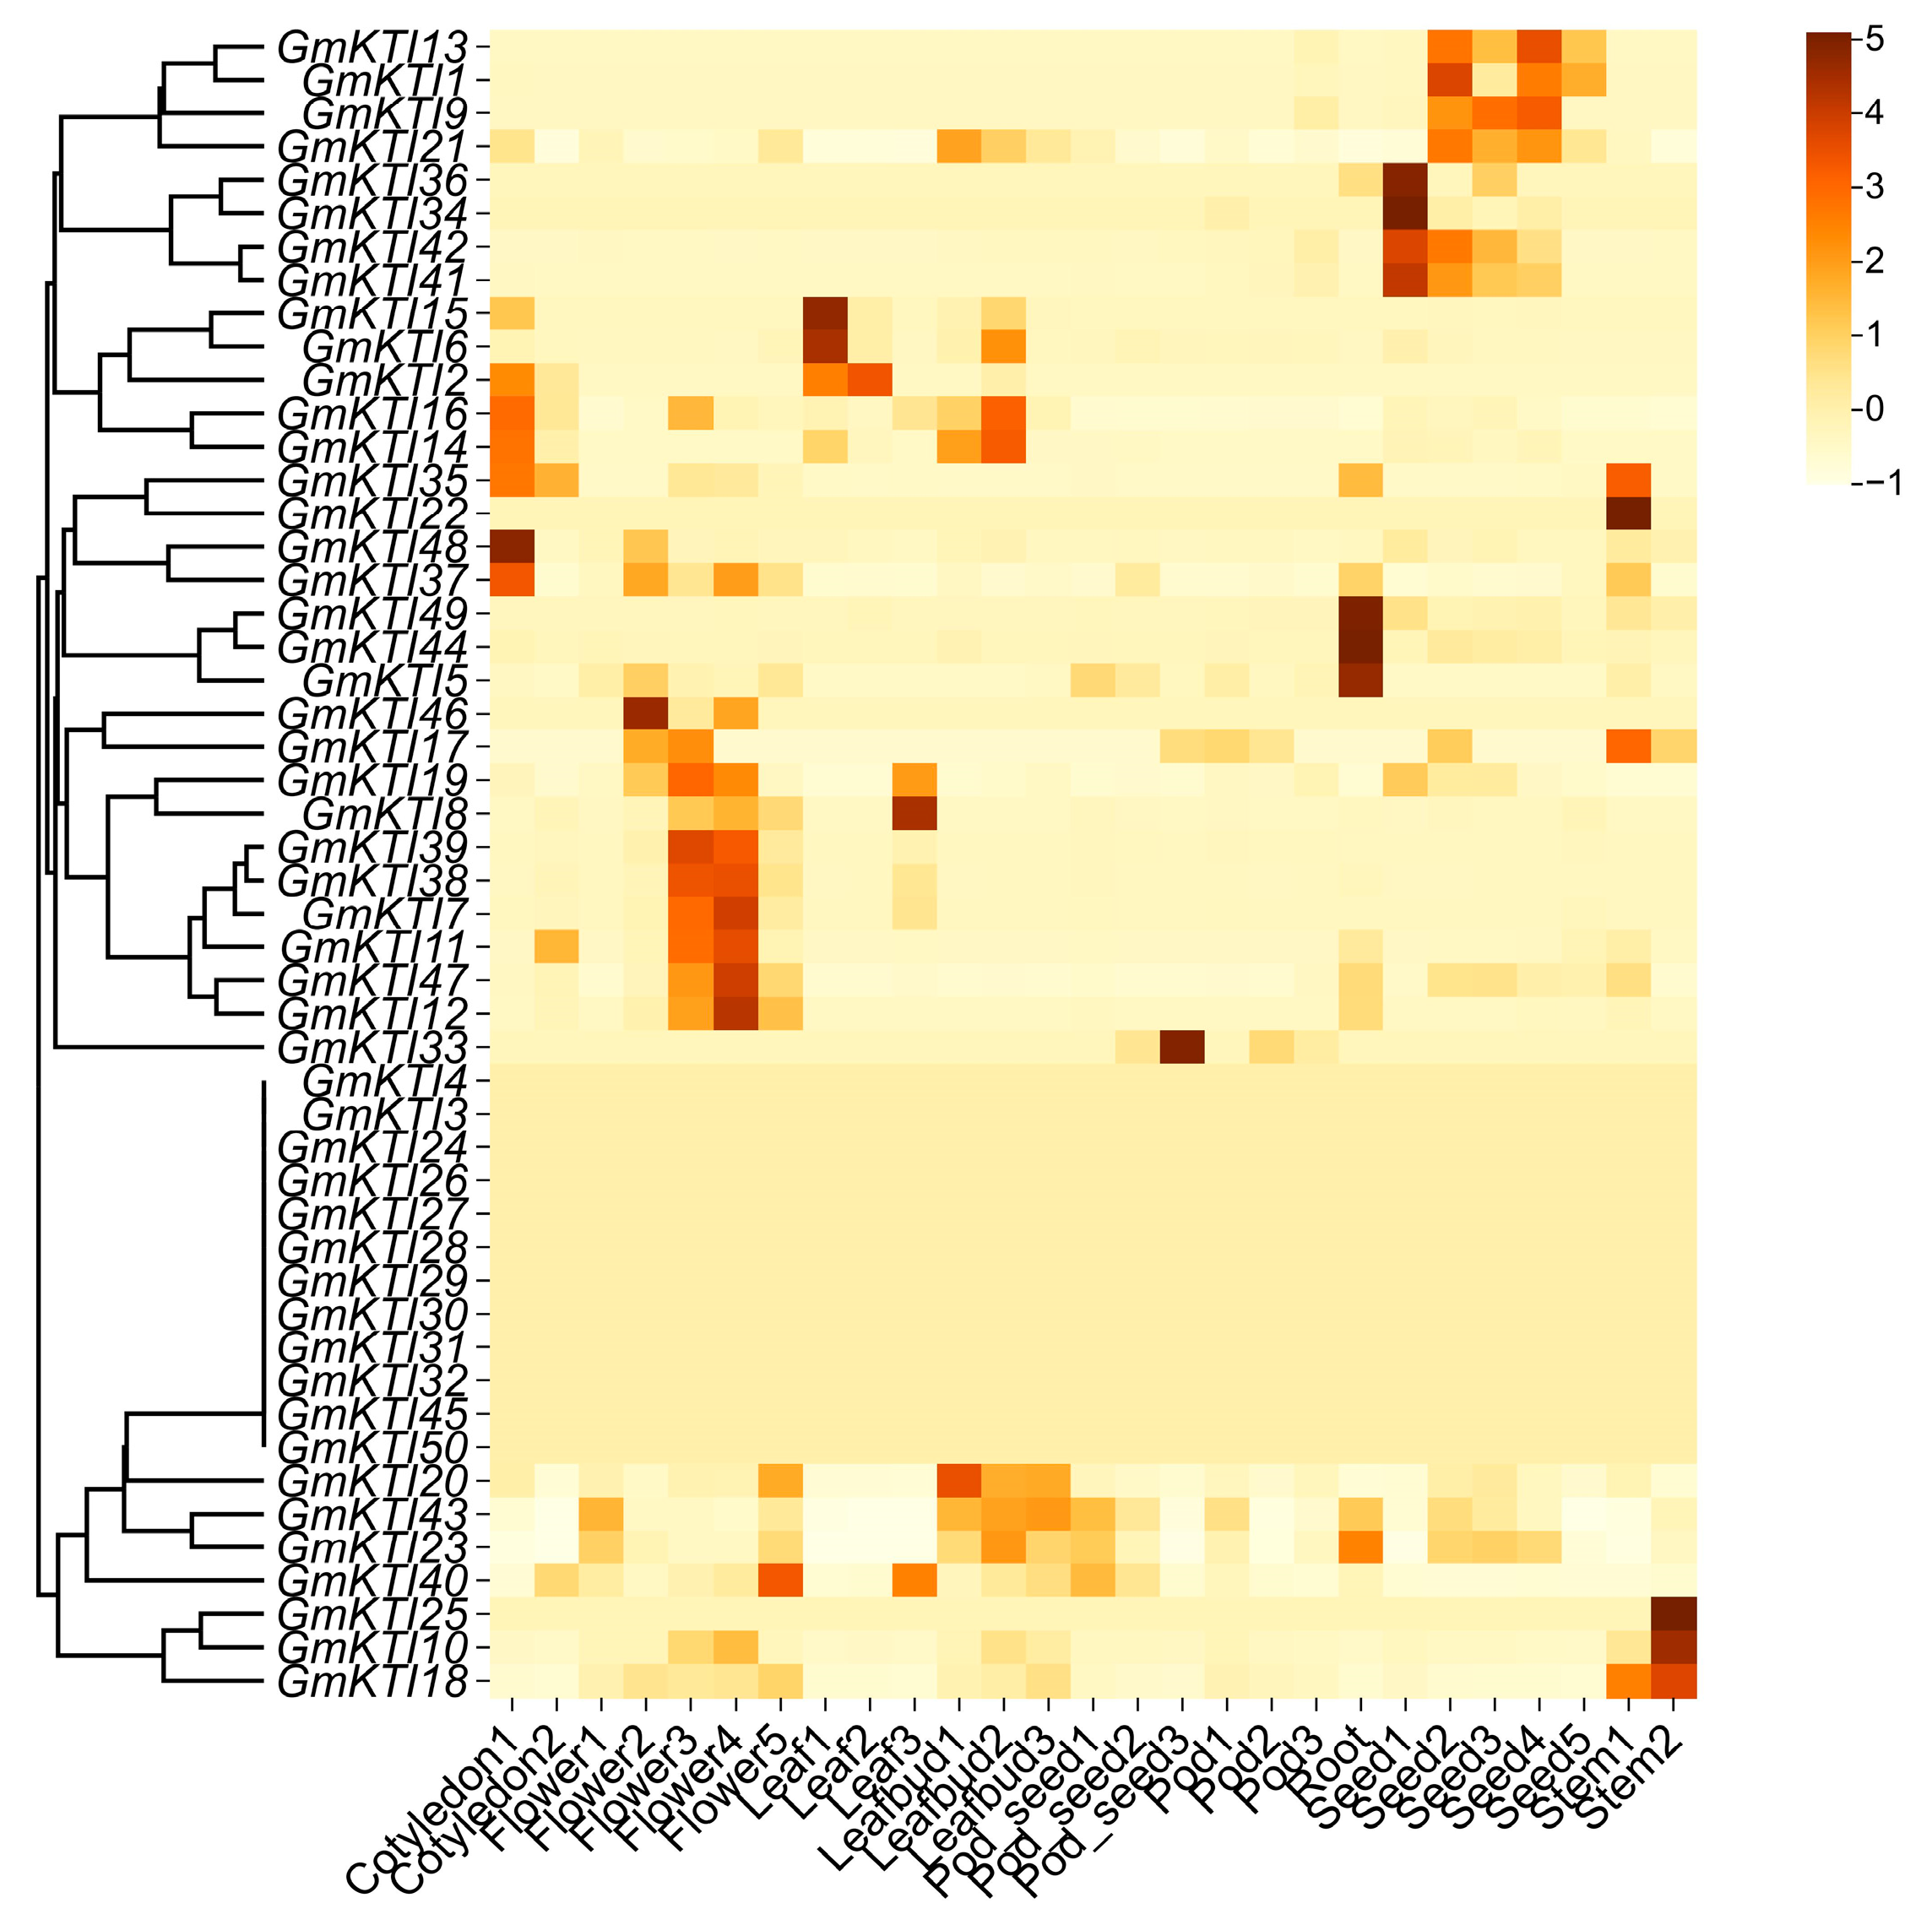
The expression locations and timing of genes in plants are closely related to their functions. To further explore the functions of the GmKTI family, we analyzed expression data from different tissues and developmental stages of Williams 82, including cotyledons, flowers, leaves, leaf buds, pods, seeds, roots, and stems, and clustered the GmKTI members based on their expression patterns. Results showed that four GmKTI members were highly expressed in cotyledons and leaves, indicating their similar functional roles in these tissues. GmKTI37 and GmKTI48 were highly expressed in cotyledons and flowers. Eight members, including the tandem duplicates GmKTI41 and GmKTI42, were specifically highly expressed in seeds, suggesting a role in seed development and nutrient allocation. Ten genes, including the tandem duplicates GmKTI38 and GmKTI39, were specifically highly expressed in flowers, highlighting their importance in flower development. Three genes were highly expressed in stems, potentially contributing to plant growth. Additionally, 12 genes showed no expression across all tissues and stages, possibly being functionally redundant within the family (Figure 4). The similar expression patterns of tandem duplicates further indicate redundancy in the GmKTI family.

3.7. Haplotype Analysis of GmKTIs

Single-nucleotide polymorphisms (SNPs) can significantly impact gene function. To explore the relationship between GmKTI members and soybean seed storage protein content, we conducted haplotype analysis on the 38 GmKTI members that are expressed in tissues, using the 547 soybean accessions from the core collection in Northeast China [33].
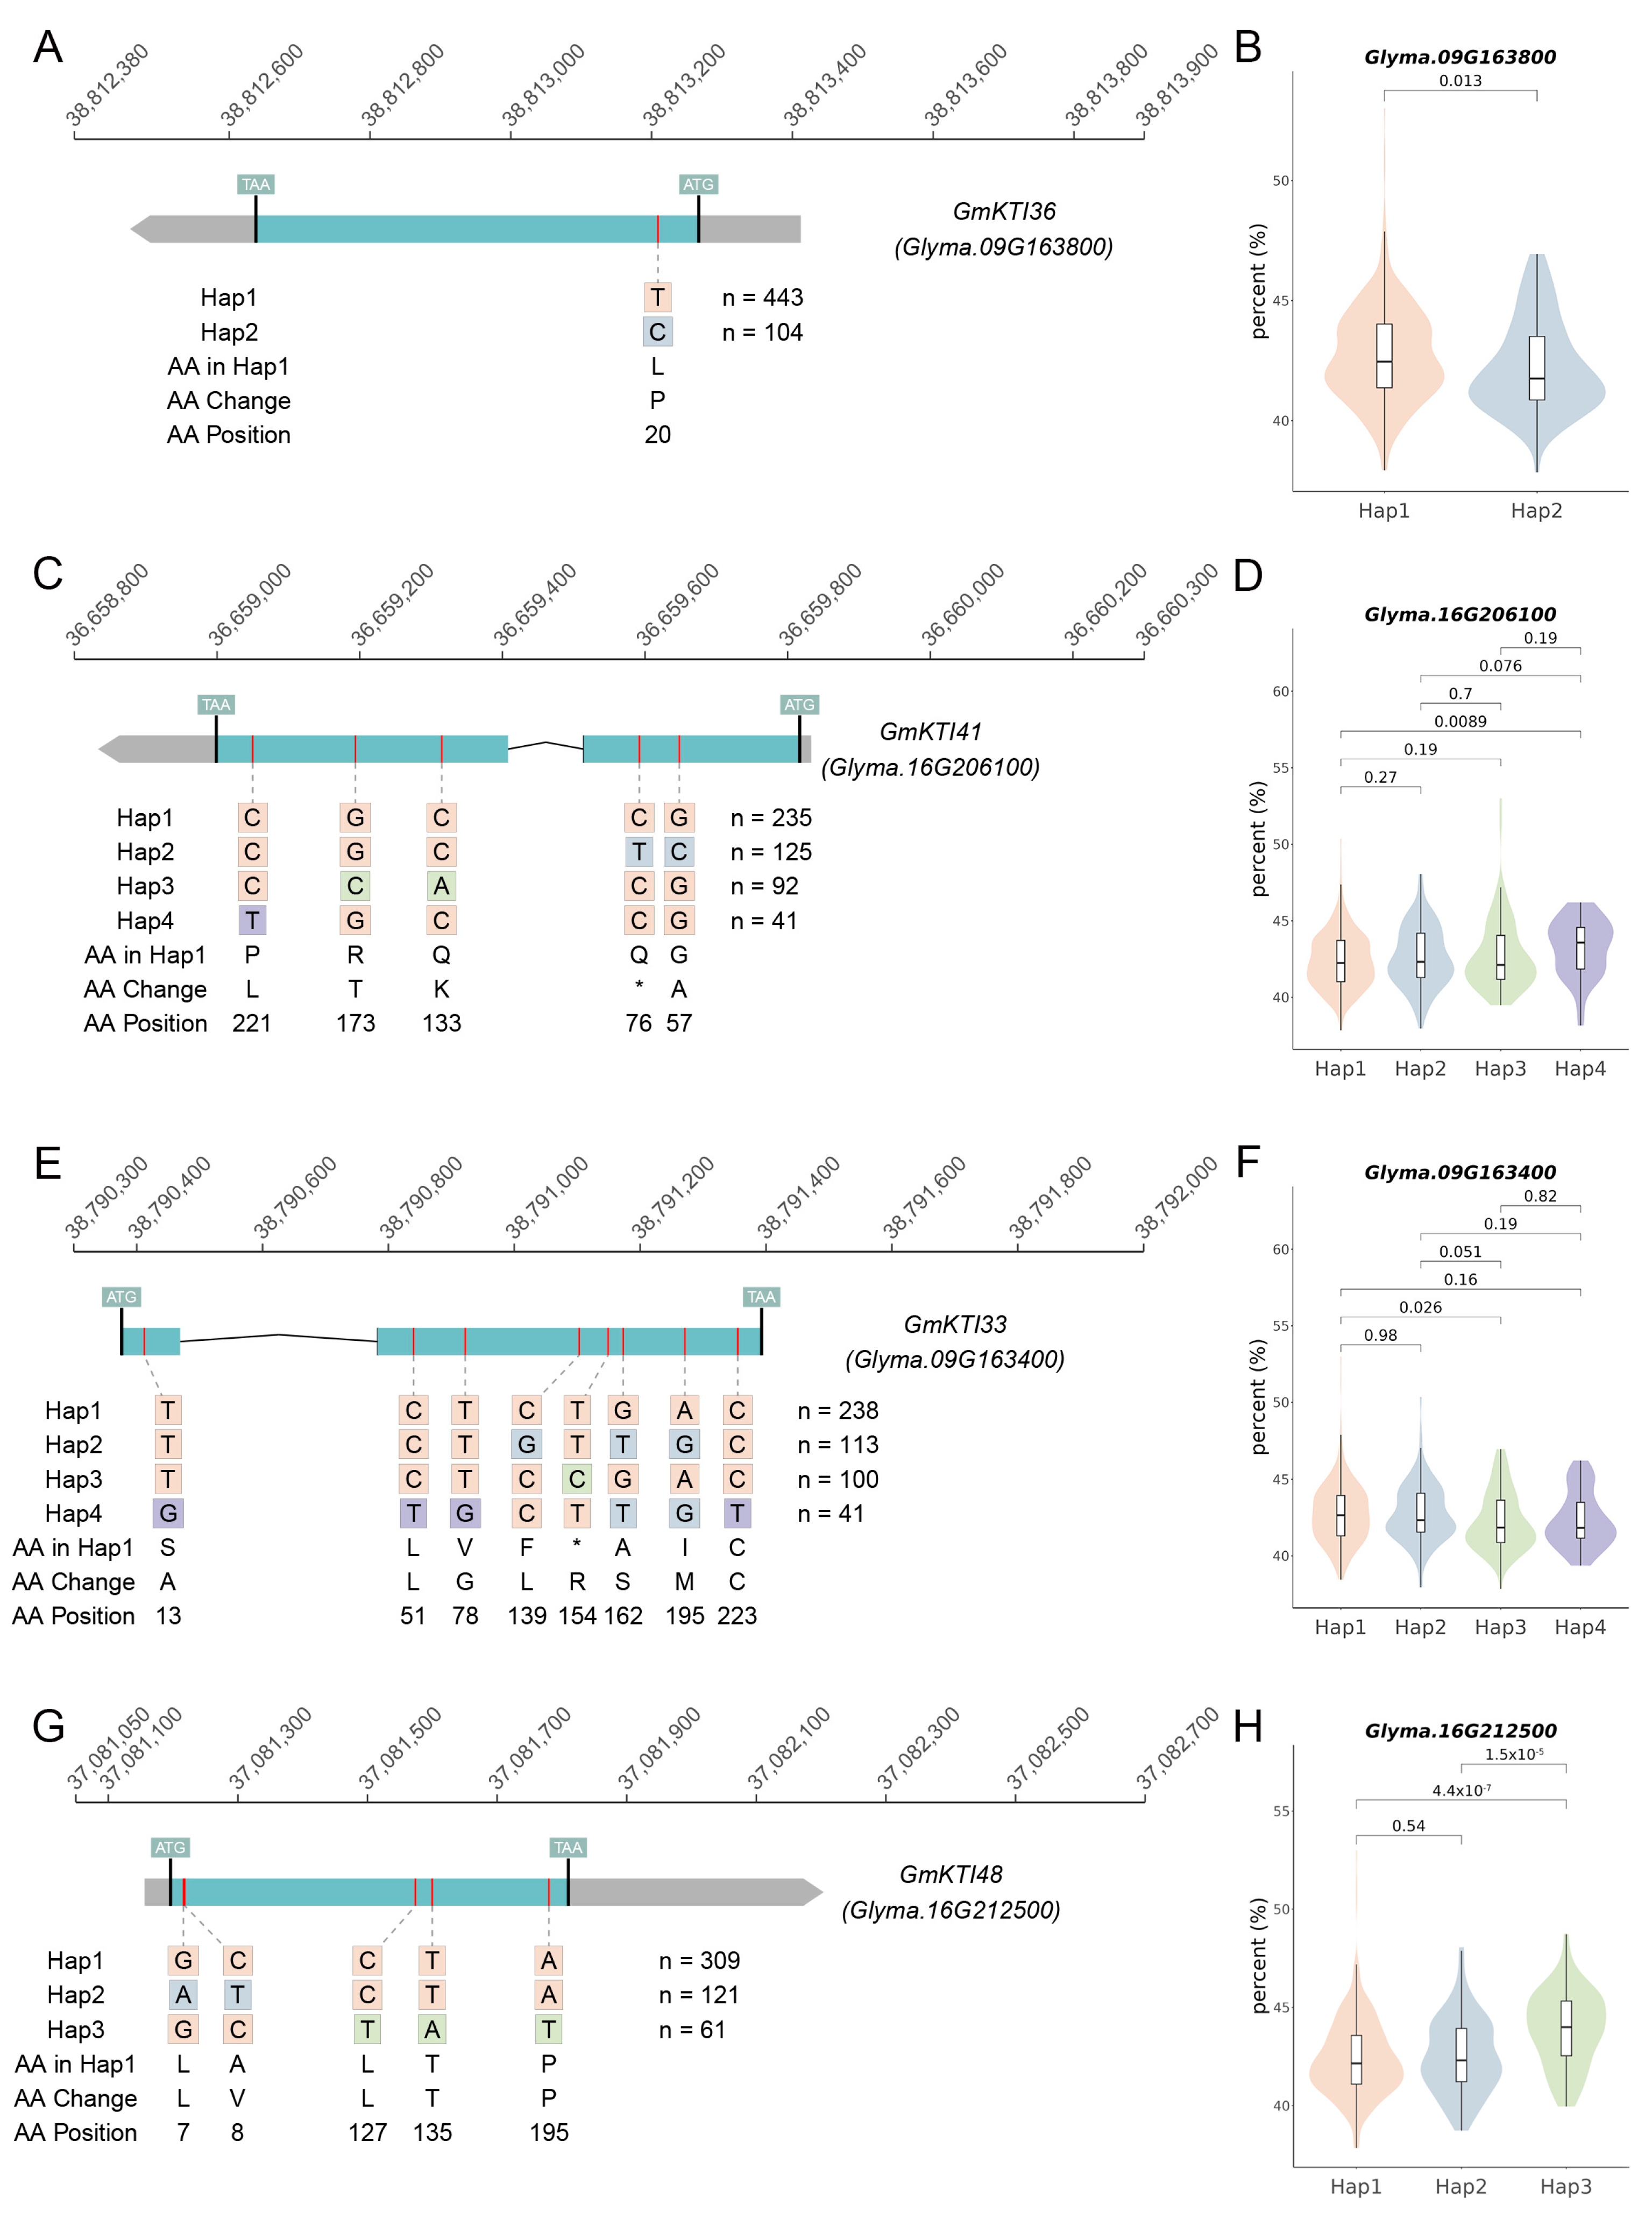
We performed a significance analysis of storage protein content among major haplotypes (with a population frequency of 5%) to identify genes with significant effects on storage protein content. A total of 7 GmKTI members were found to be associated with storage protein content (Table S2). Four of these genes are highly expressed in seed-related tissues such as seeds, pods, or cotyledons. GmKTI36 is specifically expressed in 3-week-old seeds and has a nonsynonymous mutation in its CDS, resulting in two major haplotypes (Figure 5A). On average, Hap1 has 0.5% higher storage protein content than Hap2 (Figure 5B). GmKTI41 is highly expressed in seeds from weeks 3 to 8 and has six nonsynonymous mutations (Figure 5C). Although Hap2 causes a premature stop at amino acid 76, it shows no significant difference in storage protein content compared to Hap1. In contrast, Hap4 has 0.87% higher storage protein content than Hap1 (Figure 5D). GmKTI33 is highly expressed in pods and has four major haplotypes. Hap1, Hap2, and Hap4 cause a premature stop at amino acid 154, and Hap1 has significantly higher storage protein content than Hap3 (Figure 5E,F). GmKTI48 is highly expressed in cotyledons and has three major haplotypes due to one nonsynonymous and four synonymous mutations (Figure 5G). Both Hap1 and Hap2 have significantly lower storage protein content than Hap3 (Figure 5H). These genes are specifically or highly expressed in seed-related tissues. Their major haplotypes show significant storage protein content differences, indicating a potentially important link to protein synthesis and accumulation. In addition, GmKTI22 is specifically highly expressed in stems, and GmKTI46 and GmKTI47 are specifically highly expressed in flowers (Figure S1A–F). The storage protein content of the major haplotypes of these three genes also shows significant differences, suggesting a possible indirect relationship.

3.8. Haplotype Module Stacking Analysis

To assess the contribution of GmKTI family members to seed storage protein content, we classified the major haplotypes of the 7 GmKTI members in the population into superior and inferior types based on their storage protein content. We then conducted haplotype module stacking analysis to evaluate the accumulation of superior haplotypes (Table S2). By selecting the top and bottom 5% of varieties in terms of storage protein content, we found that accessions with higher storage protein content tend to accumulate superior haplotypes, significantly outperforming the number of inferior haplotypes (Figure 6A,B). Conversely, accessions with lower storage protein content accumulate inferior haplotypes (Figure 6C). For instance, JiuTaiZhuYanDou (JL167), which has 5 superior haplotypes, has a storage protein content of 45.88%, while Magnolid (CX27), which has 7 inferior haplotypes, has only 39.73% (Table S2). These findings suggest that accessions with higher storage protein content tend to accumulate superior haplotypes, while those with lower storage protein content accumulate inferior haplotypes. This is crucial for developing high-protein soybean varieties.

4. Discussion

Although KTI is a major component of soybean seed storage proteins, and stacking superior haplotypes of specific GmKTI members can increase seed protein content, trypsin inhibitors (TI) reduce protein digestibility in the intestines of humans and monogastric livestock, leading to protein malabsorption [11]. Therefore, soybean seeds are typically subjected to heat treatment before feeding to degrade TI. Due to TI’s interference with protein absorption and its negative impact on health, research in recent years has focused on identifying molecular markers associated with low-KTI content and developing soybean varieties with reduced KTI levels [58,59,60]. Existing research shows that although the genetic removal of KTI can reduce protein content in some soybean lines, this is not always the case. Some KTI-free RILs can still maintain normal protein content (about 40%) [61]. Additionally, Kunitz trypsin inhibitor has been shown to enhance insect resistance. Researchers have identified six genes in soybean roots infected with soybean cyst nematode that are highly similar to protease inhibitors: E01D05, D03G05, D10B03, B08G06, and D06D04 [62]. Among these, two genes encode proteins closely related to two Kunitz trypsin inhibitors, E01D05 (GmKTI22) and D03G05 (GmKTI25), and one gene encodes a more distantly related Kunitz trypsin inhibitor, B08G06 (GmKTI27) [63]. Introducing exogenous protease inhibitor genes into soybeans can improve breed quality. Studies have shown that transferring the gene regulating cowpea trypsin inhibitor into tobacco leaves enhances tobacco’s insect resistance [64]. Experiments have confirmed that ApKTI, extracted and purified from Albizia procera seeds, shows significant insecticidal activity against all life stages of the red flour beetle (egg, larva, pupa, and adult), with an efficacy comparable to that of the standard trypsin inhibitor (GmKTI) [65].
Phylogenetic analysis sheds light on the Kunitz trypsin inhibitor (KTI) family’s evolutionary patterns and characteristics across different species. Research shows that KTI family members have significant structural variations among species, due to divergent selective pressures and mutational events during evolution, which have adapted the family to meet specific biological needs. For instance, KTI family gene expansion is much higher in soybeans and alfalfa than in rice, Arabidopsis, and maize, possibly linked to legumes’ unique evolutionary history. In soybeans, KTI family expansion may be associated with past genome duplication events, such as the 13-million-year-old Glycine duplication and the 58-million-year-old legume duplication. These events provided opportunities for KTI family diversification, resulting in a large number of members and diverse functions in soybeans. This gene family expansion not only boosts genetic diversity but may also enhance soybeans’ plasticity to adapt to complex environments and physiological demands, offering evolutionary advantages.
The phylogenetic characteristics and expression patterns of the Kunitz trypsin inhibitor (KTI) family are closely and complexly linked. This connection not only reflects the differentiation and evolution of gene functions but also reveals their specific roles in soybean growth stages and tissues. Some KTI members’ clustering on the phylogenetic tree aligns with their expression patterns in specific tissues, supporting the functional correlation hypothesis. For example, GmKTI1 and GmKTI13, which are specifically expressed in seeds, share six conserved motifs and cluster together on the phylogenetic tree. This suggests they may have similar or complementary functions in seed development and protein accumulation, affecting soybean yield and quality. Similarly, GmKTI15 and GmKTI2, located on the same branch and highly expressed in leaves, likely participate in leaf physiological processes like photosynthesis or protein metabolism, influencing soybean growth and productivity. GmKTI38 and GmKTI39, clustering closely on the phylogenetic tree and sharing four conserved motifs, are specifically highly expressed in flowers. This suggests they may play crucial roles in flower development and reproduction, thereby impacting soybean propagation and seed formation. Conversely, GmKTI26-GmKTI32, despite similar motif structures, show no significant expression in the tested tissues. This implies they might be activated under specific physiological conditions or have been replaced by other family members, becoming redundant genes, a common phenomenon in gene family evolution that illustrates functional redundancy and compensation. Additionally, GmKTI47 and GmKTI48, tandem repeat genes, are significantly associated with storage protein content but differ in expression tissues, reflecting functional differentiation after gene duplication. One may regulate protein synthesis in source tissues (such as leaves), while the other affects protein accumulation in sink tissues (such as seeds), jointly influencing soybean’s storage protein content trait. Among the three haplotypes of GmKTI48, only Hap2 carries a non-synonymous mutation at the 8th amino acid position. However, phenotypic analysis revealed that Hap3 exhibits significantly higher protein content compared to both Hap1 and Hap2, while no significant difference was observed between Hap1 and Hap2 (Figure 5G,H). This indicates that the amino acid substitution in Hap2 does not affect functional activity. The elevated protein content in Hap3 may instead be attributed to differences in the promoter region linked to the CDS region rather than coding sequence variations.
The link between the phylogenetic and expression traits of the Kunitz trypsin inhibitor (KTI) family offers key insights into its functional diversification and evolutionary history, and guides future research and applications. This helps parse the genetic regulatory network of soybean storage protein content, offering theoretical support and gene resources for soybean quality improvement. Molecular stacking breeding, a modern strategy, can effectively integrate multiple favorable genes or alleles into one variety to enhance target traits. In this study, haplotype analysis of GmKTIs revealed that specific haplotypes of some genes are significantly linked to seed storage protein content, with superior haplotype combinations tending to boost protein levels. In previous studies, it has been demonstrated that stacking superior haplotypes associated with soybean seed protein storage can increase protein content [32]. This discovery offers clear targets for molecular stacking breeding. In practice, techniques like marker-assisted selection can precisely identify and combine these superior haplotypes associated with high storage protein content, accelerating and improving the breeding process. For example, selecting parental lines with superior haplotypes such as Hap1 of GmKTI36, Hap4 of GmKTI41, Hap1 of GmKTI33, and Hap3 of GmKTI48 for hybridization could yield new soybean varieties with higher storage protein content. Moreover, molecular stacking breeding can incorporate other genes related to seed protein content for comprehensive optimization, enhancing soybean quality to meet the rising demand for plant-based protein.

5. Conclusions

The Kunitz trypsin inhibitor (KTI) is an important group of storage proteins in soybeans, and its gene family members have significant effects on seed protein content. Our comprehensive analysis of the GmKTI family in soybeans provides new insights into their genomic characteristics and functional roles. We identified 50 GmKTI members in the soybean genome and analyzed their physicochemical properties, domain compositions, phylogenetic relationships, gene structures, and expression patterns. The results revealed significant gene expansion within the GmKTI family and distinct expression patterns across different soybean tissues. Haplotype analysis identified 7 GmKTI genes significantly associated with seed storage protein content, and the combination of superior haplotypes was found to enhance seed storage protein content. This study fills a gap in the understanding of the genomic and functional characteristics of the GmKTI family and provides a foundation for further functional analysis of the KTI domain in soybean and other plants. Our findings also highlight the potential of molecular stacking breeding as a strategy for improving soybean varieties and increasing seed protein content. Future research could focus on the functional validation of specific GmKTI members and their roles in soybean growth and development, as well as exploring the use of CRISPR-Cas9 gene editing technology to develop soybean varieties with reduced KTI content while maintaining high protein levels.

Supplementary Materials

The following supporting information can be downloaded at: https://www.mdpi.com/article/10.3390/agronomy15051210/s1, Figure S1. Haplotype analysis of GmKTI members. (A) Gene variation and haplotype of GmKTI22. (B) The difference in seed storage protein content between the three haplotypes of GmKTI22. (C) Gene variation and haplotype of GmKTI46. (D) The difference in seed storage protein content between the two haplotypes of GmKTI46. (E) Gene variation and haplotype of GmKTI47. (F) The difference in seed storage protein content between the three haplotypes of GmKTI47. Table S1. Information of 50 GmKTI family members in soybean. Table S2. Stacking analysis of 7 GmKTI members associated with soybean seed protein content based on haplotypes. Supplementary Data: The raw data of Haplotype Analysis.

Author Contributions

Formal analysis, H.T., Z.Z., S.F., J.S., X.H., X.C. and C.L.; Project administration, Q.C.; Validation, Z.Z., E.L., L.X., M.Y. and Q.C.; Visualization, H.T., J.S., X.H., X.C. and C.L.; Funding acquisition, Z.Z., X.W. and Z.Q.; Data curation, J.S.; Investigation, X.H. and X.C.; Supervision, Q.C., X.W. and Z.Q.; Conceptualization, Q.C., X.W. and Z.Q.; Writing—original draft, H.T. and S.F.; Writing—review and editing, E.L., L.X. and M.Y. All authors have read and agreed to the published version of the manuscript.

Funding

This research was supported by the Natural Science Foundation of Heilongjiang Province of China (LH2021C026, LH2023C005); the National Natural Science Foundation of China (32201755, 32301900, 32472108); the National Key R&D Program of China (2023ZD0403201-03); the Hainan Seed Industry Laboratory and China National Seed Group (B23YQ1503); the Heilongjiang Postdoctoral Science Foundation (LBH-Z23011, LBH-Z24091); the China Agriculture Research System (CARS-04-PS15); the Heilongjiang Cooperation and Innovation Breeding Foundation (LJGXCG2022-035); and the Science Fund for Distinguished Young Scholars of Heilongjiang Academy of Agricultural Sciences (CX22JQ02).

Institutional Review Board Statement

Not applicable.

Informed Consent Statement

Not applicable.

Data Availability Statement

The original contributions presented in this study are included in the article/Supplementary Materials. Further inquiries can be directed to the corresponding authors.

Conflicts of Interest

The authors declare no conflicts of interest.

References

  1. Kim, E.H.; Ro, H.M.; Kim, S.L.; Kim, H.S.; Chung, I.M. Analysis of isoflavone, phenolic, soyasapogenol, and tocopherol compounds in soybean [Glycine max (L.) Merrill] germplasms of different seed weights and origins. J. Agric. Food Chem. 2012, 60, 6045–6055. [Google Scholar] [CrossRef] [PubMed]
  2. Sugiyama, A.; Ueda, Y.; Takase, H.; Yazaki, K. Do soybeans select specific species of Bradyrhizobium during growth? Commun. Integr. Biol. 2015, 8, e992734. [Google Scholar] [CrossRef] [PubMed]
  3. Loveday, S.M. Food Proteins: Technological, Nutritional, and Sustainability Attributes of Traditional and Emerging Proteins. Annu. Rev. Food Sci. Technol. 2019, 10, 311–339. [Google Scholar] [CrossRef] [PubMed]
  4. Osborne, T.B. Our present knowledge of plant proteins. Science 1908, 28, 417–427. [Google Scholar] [CrossRef]
  5. Guan, X.; Yao, H.; Chen, Z.; Shan, L.; Zhang, M. Some functional properties of oat bran protein concentrate modified by trypsin. Food Chem. 2007, 101, 163–170. [Google Scholar] [CrossRef]
  6. Naismith, W.E.F. Ultracentrifuge studies on soybean protein. Biochim. Et Biophys. Acta 1955, 16, 203–210. [Google Scholar] [CrossRef]
  7. Wolf, W.J. Ultracentrifugal investigation of the effect of neutral salts on the extraction of soybean proteins. Arch. Biochem. Biophys. 1956, 63, 40–49. [Google Scholar] [CrossRef]
  8. Wolf, W.; Briggs, D. Purification and characterization of the 11S component of soybean proteins. Arch. Biochem. Biophys. 1959, 85, 186–199. [Google Scholar] [CrossRef]
  9. Liwang, C.; Wolf, W.J. Soybean protein aggregation by sonication: Ultracentrifugal analysis. J. Food Sci. 1983, 48, 1260–1264. [Google Scholar] [CrossRef]
  10. Sui, X.; Zhang, T.; Jiang, L. Soy Protein: Molecular Structure Revisited and Recent Advances in Processing Technologies. Annu. Rev. Food Sci. Technol. 2021, 12, 119–147. [Google Scholar] [CrossRef]
  11. Vagadia, B.H.; Vanga, S.K.; Raghavan, V. Inactivation methods of soybean trypsin inhibitor–A review. Trends Food Sci. Technol. 2017, 64, 115–125. [Google Scholar] [CrossRef]
  12. Singh, L.; Wilson, C.M.; Hadley, H.H. Genetic Differences in Soybean Trypsin Inhibitors Separated by Disc Electrophoresis 1. Crop Sci. 1969, 9, 489–491. [Google Scholar] [CrossRef]
  13. Hymowitz, T. Electrophoretic Analysis of SBTI-A2 in the USDA Soybean Germplasm Collection1. Crop Sci. 1973, 13, 420–421. [Google Scholar] [CrossRef]
  14. Zhao, S. A new electrophoretic variant of SBTi-A_2 in soybean seed protein. Soybean Genet. News Lett. 1992, 19, 22–24. [Google Scholar]
  15. Wang, K.-j.; Kaizuma, N.; Takahata, Y.; Hatakeyama, S. Detection of Two New Variants of Soybean Kunitz Trypsin Inhibitor through Electrophoresis. Breed. Sci. 1996, 46, 39–44. [Google Scholar] [CrossRef]
  16. Orf, J.H.; Hymowitz, T. Inheritance of the absence of the kunitz trypsin inhibitor in seed protein of soybeans 1. Crop Sci. 1979, 19, 107–109. [Google Scholar] [CrossRef]
  17. Wang, K.J.; Yamashita, T.; Watanabe, M.; Takahata, Y. Genetic characterization of a novel Tib-derived variant of soybean Kunitz trypsin inhibitor detected in wild soybean (Glycine soja). Genome 2004, 47, 9–14. [Google Scholar] [CrossRef]
  18. Wang, K.; Li, X. Tif type of soybean Kunitz trypsin inhibitor exists in wild soybean of northern China. In Proceedings of the 8th National Soybean Research Conference of China, Beijing, China, 10–15 August 2009; pp. 167–168. [Google Scholar]
  19. Wang, K.; Takahata, Y.; Kono, Y.; Kaizuma, N. Allelic differentiation of Kunitz trypsin inhibitor in wild soybean (Glycine soja). Theor. Appl. Genet. 2008, 117, 565–573. [Google Scholar] [CrossRef]
  20. Song, S.I.; Kim, C.H.; Baek, S.J.; Choi, Y.D. Nucleotide sequences of cDNAs encoding the precursors for soybean (Glycine max) trypsin inhibitors (Kunitz type). Plant Physiol. 1993, 101, 1401–1402. [Google Scholar] [CrossRef]
  21. Kim, S.H.; Hara, S.; Hase, S.; Ikenaka, T.; Toda, H.; Kitamura, K.; Kaizuma, N. Comparative Study on Amino Acid Sequences of Kunitz-Type Soybean Trypsin Inhibitors, Tia, Tib, and Tic. J. Biochem. 1985, 98, 435–448. [Google Scholar] [CrossRef]
  22. Wang, K.-j.; Takahata, Y.; Ito, K.; Zhao, Y.; Tsutsumi, K.-i.; Kaizuma, N. Genetic Characterization of a Novel Soybean Kunitz Trypsin Inhibitor. Breed. Sci. 2001, 51, 185–190. [Google Scholar] [CrossRef]
  23. Kaizuma, N.; Oikawa, K.; Miura, M. Consideration on the cause of the differential t i alleles frequency distributions found among some regional populations of soybean glycine max land varieties. J. Fac. Agric. Iwate Univ. 1980, 15, 81–96. [Google Scholar]
  24. Hymowitz, T.; Kaizuma, N. Soybean Seed Protein Electrophoresis Profiles from 15 Asian Countries or Regions: Hypotheses on Paths of Dissemination of Soybeans from China. Econ. Bot. 1981, 35, 10–23. [Google Scholar] [CrossRef]
  25. Fushan, L.J. Studies on the ecological and geographical distribution ofthe Chinese resources of wild soybean (G. Soja). Sci. Agric. Sin. 1993, 26, 47–55. [Google Scholar]
  26. Xin, H.; Xie, K.; Dong, A.W.; Uan, Q.Y.; Gu, O.M. The amino acid sequence determination of a new variant of Kunitz soybean trypsin inhibitor (SBTi-A2). Soybean Genet. Newslett. 1999. [Google Scholar]
  27. Birk, Y.; Gertler, A. Khalef S A pure trypsin inhibitor from soya beans. J. Biochem. 1963, 87, 281. [Google Scholar] [CrossRef]
  28. Frattali, V.P.; Steiner, R.F. Soybean inhibitors. I. Separation and some properties of three inhibitors from commercial crude soybean trypsin inhibitor. Biochemistry 1968, 7, 521–530. [Google Scholar] [CrossRef]
  29. Rachis, I.J.; Anderson, R. Isolation of four soybean trypsin inhibitors by DEAE-cellulose chromatography. Biochem. Biophys. Res. Commun. 1964, 15, 230–235. [Google Scholar] [CrossRef]
  30. Yamamoto, M.; Ikenaka, T. Studies on soybean trypsin inhibitorPurification and characterization of two soybean trypsin inhibitors. J. Biochem. 1967, 62, 141–149. [Google Scholar] [CrossRef]
  31. Wang, S.; Liu, S.; Wang, J.; Yokosho, K.; Zhou, B.; Yu, Y.; Liu, Z.; Frommer, W.; Ma, J.; Chen, L. Simultaneous changes in seed size, oil content and protein content driven by selection of SWEET homologues during soybean domestication. Natl. Sci. Rev. 2020, 7, 1776–1786. [Google Scholar] [CrossRef]
  32. Tian, H.; Yin, Y.; Li, X.; Zhang, Z.; Feng, S.; Jin, S.; Han, X.; Yang, M.; Xu, C.; Hu, L. Identification of HSSP1 as a regulator of soybean protein content through QTLanalysis Soy-SPCCnetwork. Plant Biotechnol. J. 2025. [Google Scholar] [CrossRef] [PubMed]
  33. Qi, Z.; Guo, C.; Li, H.; Qiu, H.; Li, H.; Jong, C.; Yu, G.; Zhang, Y.; Hu, L.; Wu, X. Natural variation in Fatty Acid 9 is a determinant of fatty acid protein content. Plant Biotechnol. J. 2024, 22, 759–773. [Google Scholar] [CrossRef] [PubMed]
  34. Mistry, J.; Chuguransky, S.; Williams, L.; Qureshi, M.; Salazar, G.A.; Sonnhammer, E.L.L.; Tosatto, S.C.E.; Paladin, L.; Raj, S.; Richardson, L.J.; et al. Pfam: The protein families database in 2021. Nucleic Acids Res. 2021, 49, D412–D419. [Google Scholar] [CrossRef] [PubMed]
  35. Mistry, J.; Finn, R.D.; Eddy, S.R.; Bateman, A.; Punta, M. Challenges in homology search: HMMER3 and convergent evolution of coiled-coil regions. Nucleic Acids Res. 2013, 41, e121. [Google Scholar] [CrossRef]
  36. Lamesch, P.; Berardini, T.Z.; Li, D.; Swarbreck, D.; Wilks, C.; Sasidharan, R.; Muller, R.; Dreher, K.; Alexander, D.L.; Garcia-Hernandez, M. The Arabidopsis Information Resource (TAIR): Improved gene annotation and new tools. Nucleic Acids Res. 2012, 40, D1202–D1210. [Google Scholar] [CrossRef]
  37. Ouyang, S.; Zhu, W.; Hamilton, J.; Lin, H.; Campbell, M.; Childs, K.; Thibaud-Nissen, F.; Malek, R.L.; Lee, Y.; Zheng, L. The TIGR rice genome annotation resource: Improvements and new features. Nucleic Acids Res. 2007, 35 (Suppl. 1), D883–D887. [Google Scholar] [CrossRef]
  38. Hufford, M.B.; Seetharam, A.S.; Woodhouse, M.R.; Chougule, K.M.; Ou, S.; Liu, J.; Ricci, W.A.; Guo, T.; Olson, A.; Qiu, Y. De novo assembly, annotation, and comparative analysis of 26 diverse maize genomes. Science 2021, 373, 655–662. [Google Scholar] [CrossRef]
  39. Young, N.D.; Debellé, F.; Oldroyd, G.E.; Geurts, R.; Cannon, S.B.; Udvardi, M.K.; Benedito, V.A.; Mayer, K.F.; Gouzy, J.; Schoof, H. The Medicago genome provides insight into the evolution of rhizobial symbioses. Nature 2011, 480, 520–524. [Google Scholar] [CrossRef]
  40. Schmutz, J.; Cannon, S.B.; Schlueter, J.; Ma, J.; Mitros, T.; Nelson, W.; Hyten, D.L.; Song, Q.; Thelen, J.J.; Cheng, J. Genome sequence of the palaeopolyploid soybean. Nature 2010, 463, 178–183. [Google Scholar] [CrossRef]
  41. Artimo, P.; Jonnalagedda, M.; Arnold, K.; Baratin, D.; Csardi, G.; De Castro, E.; Duvaud, S.; Flegel, V.; Fortier, A.; Gasteiger, E. ExPASy: SIB bioinformatics resource portal. Nucleic Acids Res. 2012, 40, W597–W603. [Google Scholar] [CrossRef]
  42. Chou, K.-C.; Shen, H.-B. Cell-PLoc 2.0: An improved package of web-servers for predicting subcellular localization of proteins in various organisms. Nat. Sci. 2010, 2, 1090–1103. [Google Scholar] [CrossRef]
  43. Petersen, T.N.; Brunak, S.; Von Heijne, G.; Nielsen, H. SignalP 4.0: Discriminating signal peptides from transmembrane regions. Nat. Methods 2011, 8, 785–786. [Google Scholar] [CrossRef] [PubMed]
  44. Krogh, A.; Larsson, B.; Von Heijne, G.; Sonnhammer, E.L. Predicting transmembrane protein topology with a hidden Markov model: Application to complete genomes. J. Mol. Biol. 2001, 305, 567–580. [Google Scholar] [CrossRef] [PubMed]
  45. Katoh, K.; Misawa, K.; Kuma, K.i.; Miyata, T. MAFFT: A novel method for rapid multiple sequence alignment based on fast Fourier transform. Nucleic Acids Res. 2002, 30, 3059–3066. [Google Scholar] [CrossRef]
  46. Kumar, S.; Stecher, G.; Li, M.; Knyaz, C.; Tamura, K. MEGA X: Molecular Evolutionary Genetics Analysis across Computing Platforms. Mol. Biol. Evol. 2018, 35, 1547–1549. [Google Scholar] [CrossRef]
  47. Letunic, I.; Bork, P. Interactive Tree of Life (iTOL) v6: Recent updates to the phylogenetic tree display and annotation tool. Nucleic Acids Res. 2024, 52, W78–W82. [Google Scholar] [CrossRef]
  48. Bailey, T.L.; Johnson, J.; Grant, C.E.; Noble, W.S. The MEME suite. Nucleic Acids Res. 2015, 43, W39–W49. [Google Scholar] [CrossRef]
  49. Rombauts, S.; Déhais, P.; Van Montagu, M.; Rouzé, P. PlantCARE, a plant cis-acting regulatory element database. Nucleic Acids Res. 1999, 27, 295–296. [Google Scholar] [CrossRef]
  50. Chen, C.; Wu, Y.; Li, J.; Wang, X.; Zeng, Z.; Xu, J.; Liu, Y.; Feng, J.; Chen, H.; He, Y. TBtools-II: A “one for all, all for one” bioinformatics platform for biological big-data mining. Mol. Plant 2023, 16, 1733–1742. [Google Scholar] [CrossRef]
  51. Yang, Z.; Luo, C.; Pei, X.; Wang, S.; Huang, Y.; Li, J.; Liu, B.; Kong, F.; Yang, Q.-Y.; Fang, C. SoyMD: A platform combining multi-omics data with various tools for soybean research and breeding. Nucleic Acids Res. 2024, 52, D1639–D1650. [Google Scholar] [CrossRef]
  52. Madden, T. The BLAST sequence analysis tool. In The NCBI Handbook; National Center for Biotechnology Information: Bethesda, MD, USA, 2013; Volume 2, pp. 425–436. [Google Scholar]
  53. Wang, Y.; Tang, H.; DeBarry, J.D.; Tan, X.; Li, J.; Wang, X.; Lee, T.-h.; Jin, H.; Marler, B.; Guo, H. MCScanX: A toolkit for detection and evolutionary analysis of gene synteny and collinearity. Nucleic Acids Res. 2012, 40, e49. [Google Scholar] [CrossRef] [PubMed]
  54. Zhang, Z.; Xiao, J.; Wu, J.; Zhang, H.; Liu, G.; Wang, X.; Dai, L. ParaAT: A parallel tool for constructing multiple protein-coding DNA alignments. Biochem. Biophys. Res. Commun. 2012, 419, 779–781. [Google Scholar] [CrossRef]
  55. Van, K.; Kim, D.H.; Cai, C.M.; Kim, M.Y.; Shin, J.H.; Graham, M.A.; Shoemaker, R.C.; Choi, B.-S.; Yang, T.-J.; Lee, S.-H. Sequence level analysis of recently duplicated regions in soybean [Glycine max (L.) Merr.] genome. DNA Res. 2008, 15, 93–102. [Google Scholar] [CrossRef]
  56. Severin, A.J.; Cannon, S.B.; Graham, M.M.; Grant, D.; Shoemaker, R.C. Changes in twelve homoeologous genomic regions in soybean following three rounds of polyploidy. Plant Cell 2011, 23, 3129–3136. [Google Scholar] [CrossRef] [PubMed]
  57. Danecek, P.; Auton, A.; Abecasis, G.; Albers, C.A.; Banks, E.; DePristo, M.A.; Handsaker, R.E.; Lunter, G.; Marth, G.T.; Sherry, S.T. The variant call format and VCFtools. Bioinformatics 2011, 27, 2156–2158. [Google Scholar] [CrossRef] [PubMed]
  58. Panzade, S.; Chimote, V.; Shinde, C.; Aher, A. Identification of Soybean (Glycine max L.) Segregants for Kunitz Trypsin Inhibitor and Lipoxygenase Free Gene Using Linked Molecular Markers. Plant Cell Biotechnol. Mol. Biol. 2025, 26, 33–34. [Google Scholar]
  59. Liu, K.; Wang, Z.; An, Y.-Q. Developing evaluating CRISPR-Cas9 edited transgene-free soybeans with dramatic reduction in trypsin chymotrypsin inhibition based on selfing phenotyping T1, T3 Seeds. J. Agric. Food Res. 2025, 101811, in press. [Google Scholar] [CrossRef]
  60. Bukan, M.; Andrijanić, Z.; Pejić, I.; Ključarić, M.; Čižmek, L.; Tomaz, I.; Buljević, N.; Šarčević, H. Validation of Molecular Markers for Low Kunitz Trypsin Inhibitor Content in European Soybean (Glycine max, L. Merr.) Germplasm. Genes 2024, 15, 1028. [Google Scholar] [CrossRef]
  61. Rani, A.; Kumar, V.; Shukla, S.; Jha, P.; Tayalkar, T.; Mittal, P. Changes in storage protein composition on genetic removal of Kunitz trypsin inhibitor maintain protein content in soybean (Glycine max). J. Agric. Food Res. 2020, 2, 100065. [Google Scholar] [CrossRef]
  62. Khan, R.; Alkharouf, N.; Beard, H.; MacDonald, M.; Chouikha, I.; Meyer, S.; Grefenstette, J.; Knap, H.; Matthews, B. Resistance mechanisms in soybean: Gene expression profile at an early stage of soybean cyst nematode invasion. J. Nematol. 2004, 36, 241–248. [Google Scholar]
  63. Rashed, N.A.; MacDonald, M.H.; Matthews, B.F. Protease inhibitor expression in soybean roots exhibiting susceptible and resistant interactions with soybean cyst nematode. J. Nematol. 2008, 40, 138. [Google Scholar] [PubMed]
  64. Hilder, V.A.; Gatehouse, A.M.; Sheerman, S.E.; Barker, R.F.; Boulter, D. A novel mechanism of insect resistance engineered into tobacco. Nature 1987, 330, 160–163. [Google Scholar] [CrossRef]
  65. Mehmood, S.; Thirup, S.S.; Ahmed, S.; Bashir, N.; Saeed, A.; Rafiq, M.; Saeed, Q.; Najam-ul-Haq, M.; Khaliq, B.; Ibrahim, M. Crystal structure of Kunitz-type trypsin inhibitor: Entomotoxic effect of native and encapsulated protein targeting gut trypsin of Tribolium castaneum Herbst. Comput. Struct. Biotechnol. J. 2024, 23, 3132–3142. [Google Scholar] [CrossRef] [PubMed]
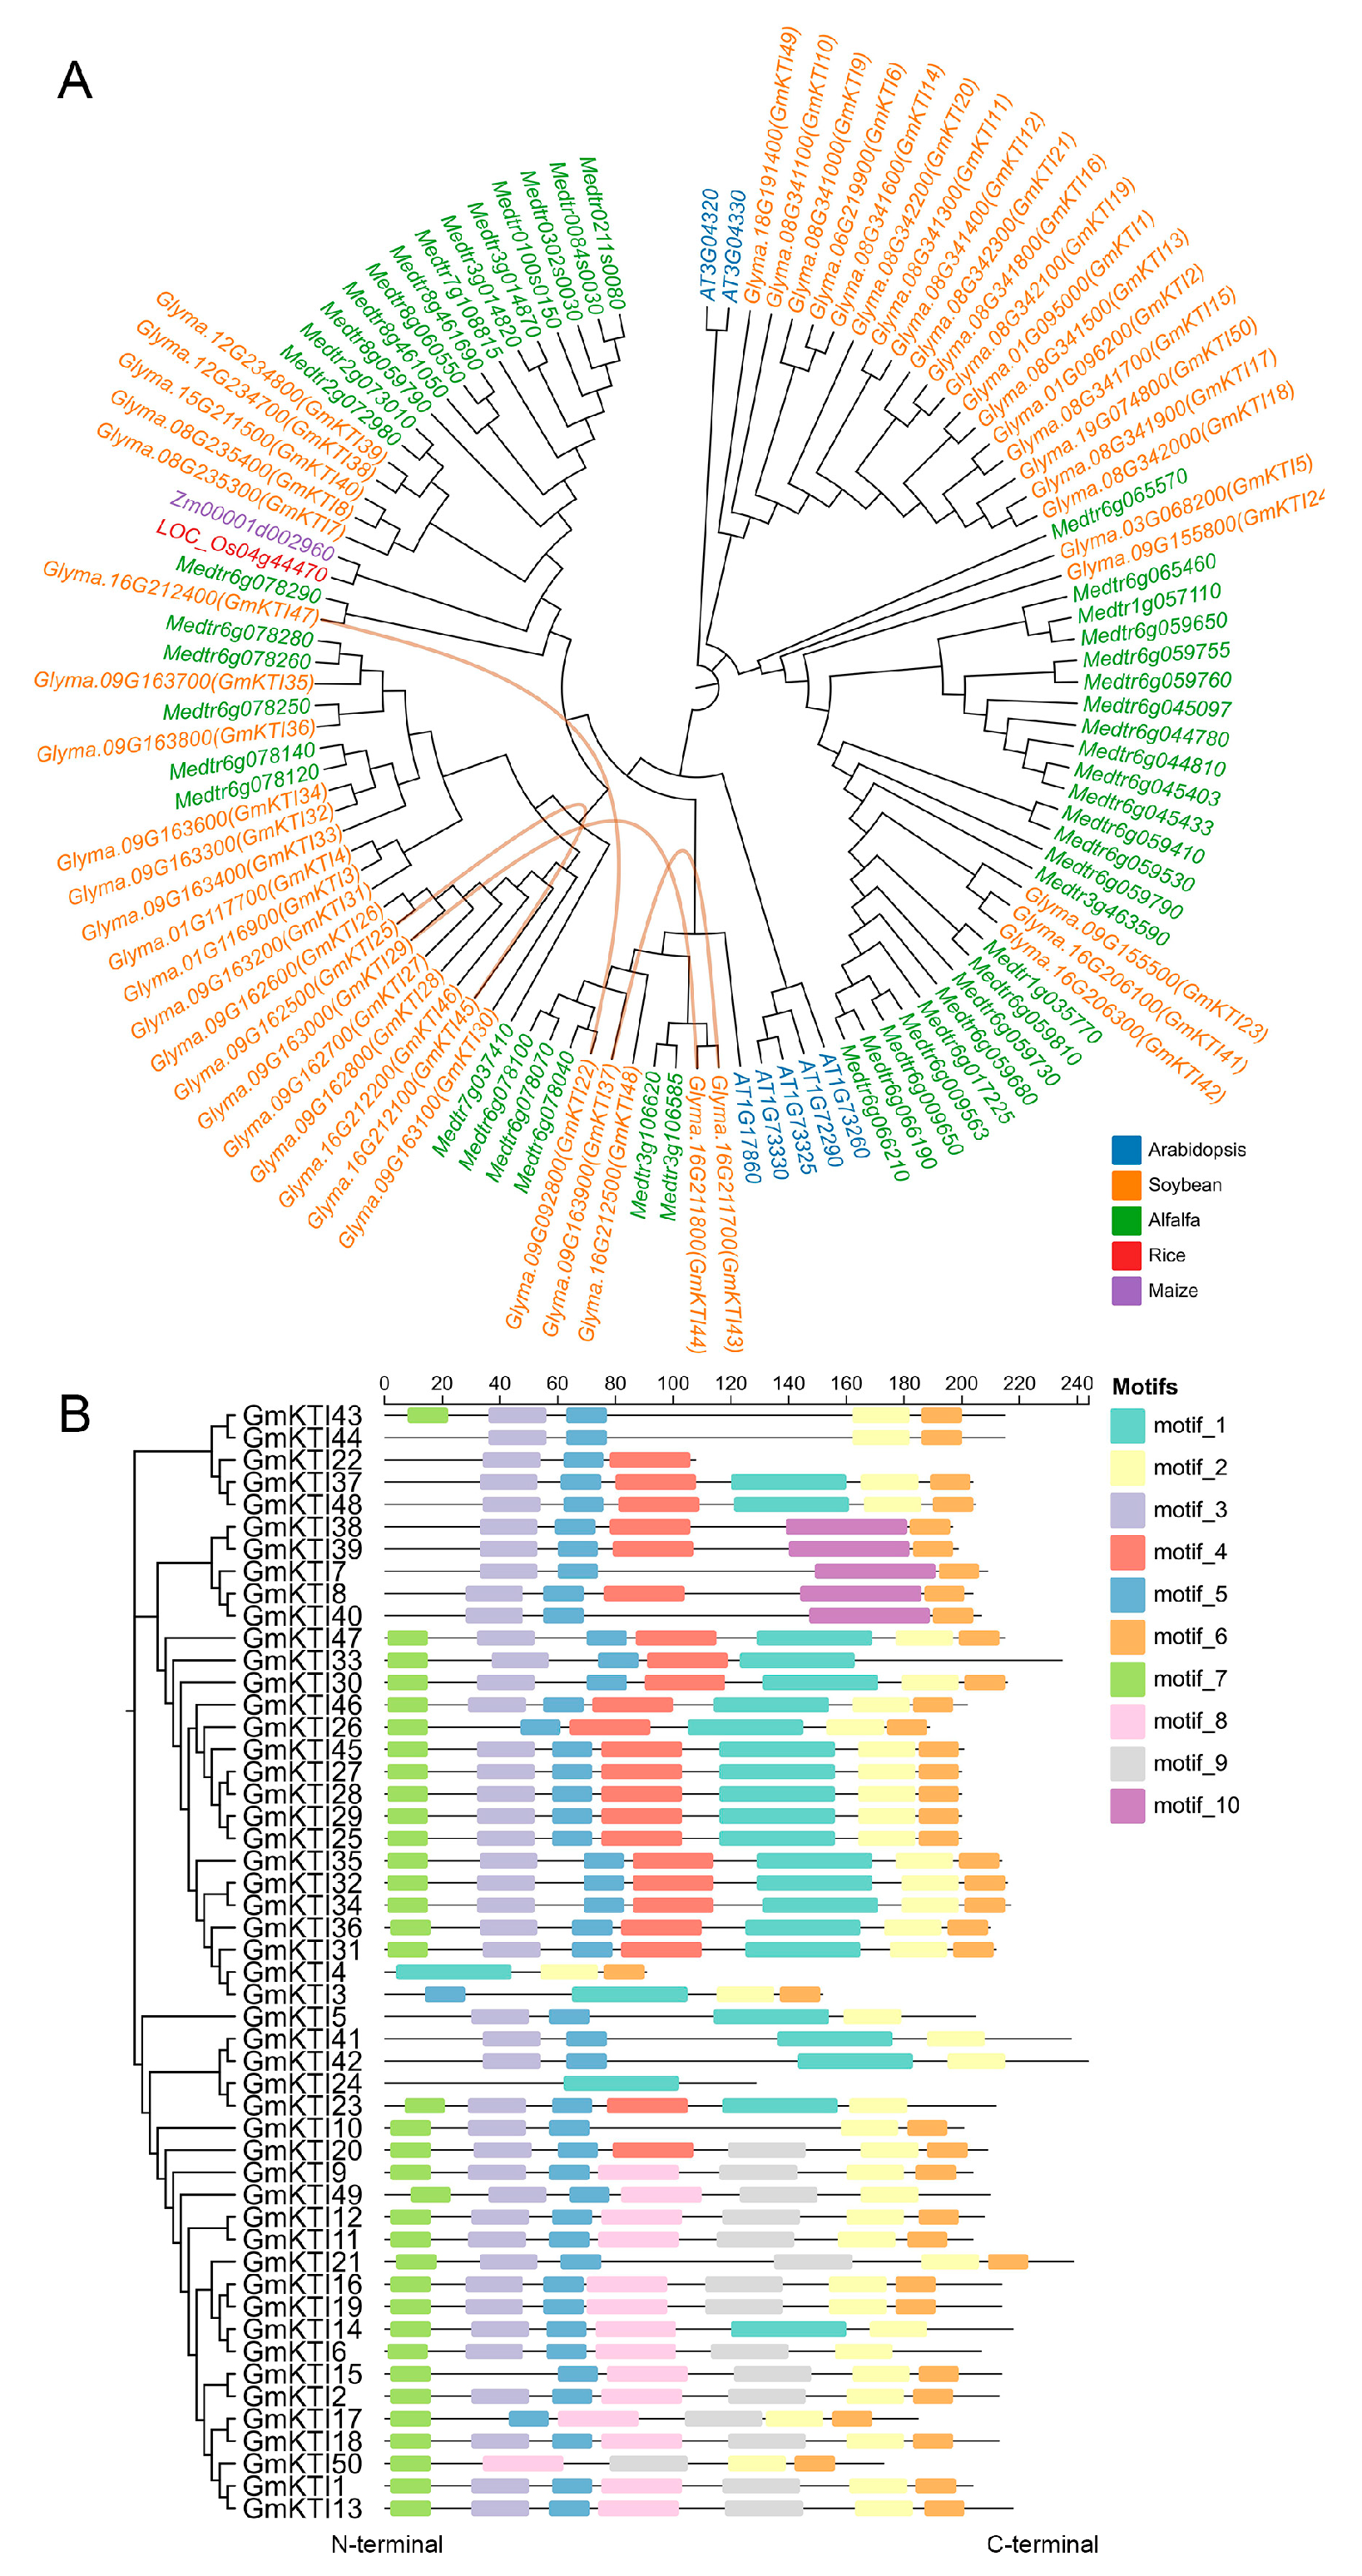
Figure 1. Characterization of the KTI family. (A) Phylogenetic tree of KTI proteins in soybean, alfalfa, rice, Arabidopsis, and maize constructed by the neighbor-joining method in MEGA-X. Different colors indicate different species: blue for Arabidopsis, orange for soybean, green for alfalfa, red for rice, and purple for maize. The orange lines indicate the syntenic GmKTI members in soybean. (B) Conserved motifs in 50 GmKTI proteins. Different colored boxes represent distinct conserved motifs. The left side shows the phylogenetic relationships of GmKTI members.
Agronomy 15 01210 g001
Figure 2. Cis-acting element analysis of GmKTI promoter regions. Different colored boxes represent different types of cis-acting elements, and gray lines represent the length of the gene promoter region.
Agronomy 15 01210 g002
Figure 3. Ka-Ks calculation of GmKTI members. (A) Ks values of GmKTI duplicated gene pairs, the two red lines represent two duplication events. (B) Ka/Ks values of Tandem repeat genes and segmental repeat genes. The points represent outliers.
Agronomy 15 01210 g003
Figure 4. Transcriptional profiling of GmKTI members in different stages and tissues of soybean. Cotyledon 1 indicates cotyledon at germination stage; cotyledon 2 indicates cotyledon at trefoil stage; flower 1–5 indicate flower buds, pre-flowering buds, flowers at anthesis, flowers at 5 DAF, and flowers at anthesis; leaf 1–3 indicate leaf at trefoil stage, leaf at flower bud differentiation stage, and senescent leaves; leafbud 1–3 indicate new leaves at germination, trefoil, and flower bud differentiation stages; Pod_seed 1–3 indicate pods with seeds at two, three, and four weeks; Pod 1–3 indicate pods at three, four, and five weeks; root indicate germination stage root; seed 1–5 indicate developing seeds at approximately three, five, six, eight, and ten weeks; stem 1–2 indicate stems at germination and trefoil stages [51].
Agronomy 15 01210 g004
Figure 5. Haplotype analysis of GmKTI members. (A) Gene variation and haplotype of GmKTI36. (B) The difference in seed storage protein content between the two haplotypes of GmKTI36. (C) Gene variation and haplotype of GmKTI41. (D) The difference in seed storage protein content between the four haplotypes of GmKTI41. (E) Gene variation and haplotype of GmKTI33. (F) The difference in seed storage protein content between the four haplotypes of GmKTI33. (G) Gene variation and haplotype of GmKTI48. (H) The difference in seed storage protein content between the three haplotypes of GmKTI48. In the gene structure diagram, blue rectangles indicate CDS, gray rectangles indicate 3’UTR or 5’UTR, AA stands for amino acids, and asterisks indicate translation termination.
Agronomy 15 01210 g005
Figure 6. GmKTI haplotype module stacking analysis. (A) GmKTI haplotype module stacking in the top and bottom 5% soybean accessions for storage protein content. (B) Counts of superior and inferior haplotypes in the top 5% accessions. The point represents outliers. (C) Counts of superior and inferior haplotypes in the bottom 5% accessions. *** means p < 0.001, ** means p < 0.01 and * means p < 0.05 (Student’s t-test).
Agronomy 15 01210 g006
Disclaimer/Publisher’s Note: The statements, opinions and data contained in all publications are solely those of the individual author(s) and contributor(s) and not of MDPI and/or the editor(s). MDPI and/or the editor(s) disclaim responsibility for any injury to people or property resulting from any ideas, methods, instructions or products referred to in the content.