Article

A Comprehensive Analysis of the Multiple AP2/ERF Regulatory Network Unveils Putative Components of the Fatty Acid Pathway for Environmental Adaptation

by
Junjie Deng
1,2,4,†,
Ming Yang
2,4,†,
Heng Liang
1,3,
Daojun Zheng
1,3,
Guangshun Zhu
2,4,
Zhenpei Ye
2,4,
Xinjie Lai
2,4 and
Moyang Liu
1,2,3,4,*
1
Tropical Horticultural Plant Research Center, Hainan Research Institute, Shanghai Jiao Tong University, Sanya 572000, China
2
Shanghai Collaborative Innovation Center of Agri-Seeds, School of Agriculture and Biology, Shanghai Jiao Tong University, Shanghai 200240, China
3
Institute of Tropical Horticulture Research, Hainan Academy of Agricultural Sciences, Haikou 571100, China
4
Joint Center for Single Cell Biology, School of Agriculture and Biology, Shanghai Jiao Tong University, Shanghai 200240, China
*
Author to whom correspondence should be addressed.
These authors contributed equally to this work.
Agronomy 2025, 15(5), 1112; https://doi.org/10.3390/agronomy15051112
Submission received: 7 March 2025 / Revised: 21 April 2025 / Accepted: 28 April 2025 / Published: 30 April 2025
(This article belongs to the Special Issue Genetic Basis of Crop Selection and Evolution)

Abstract

:
Environmental stresses significantly influence crop growth and productivity, acting as powerful selective pressures in plant evolution. The AP2/ERF superfamily is crucial for plant development and stress responses, orchestrating key regulatory pathways. This study explores the adaptive evolution of AP2/ERF genes across 15 key plant species, focusing on expansion and contraction patterns driven by amplification through multi-omics analyses. Across 15 plant genomes, we identified 1495 AP2/ERF genes. AP2/ERF genes demonstrated preferential retention following amplification, underscoring their importance in genomic stability and functional adaptation. Notably, the amplification-associated AP2 subfamily exhibited substantial expansion in quinoa (CqAP2/ERFs), emphasizing its role in stress adaptation. Robust regulatory networks were identified between CqAP2/ERFs, AtAP2/ERFs, and fatty acid pathways, highlighting their contributions to stress resilience. Transcriptomic analyses in Arabidopsis thaliana further validated the conserved correlation of these networks. Functional predictions based on phenotypic and RNA-seq data revealed the involvement of AP2/ERFs in key stress response and developmental processes. By integrating genomic, metabolomic, phenotypic, transcriptomic, and protein interaction data, this study uncovers novel regulators and adaptive pathways of AP2/ERFs, providing insights into their evolutionary diversification post-amplification. These findings establish a comprehensive framework for understanding the pivotal roles of AP2/ERFs in enhancing plant stress tolerance.

1. Introduction

Environmental stresses, such as drought, salinity, and extreme temperatures, substantially impact plant productivity, driving adaptation and diversification of regulatory networks in plant genomes. With ongoing climate change predicted to exacerbate the frequency and severity of these stresses, understanding the genetic mechanisms underlying plant adaptation is increasingly critical [1].
Whole-genome duplication (WGD) or amplification events are major evolutionary processes that can significantly expand gene families, providing genetic raw material for diversification and adaptive innovation [2]. Polyploid plants often exhibit enhanced adaptability and stress resilience compared to their diploid progenitors, primarily due to the duplicated genes that may acquire novel functions or expression patterns. Among such gene expansions, transcription factors frequently undergo retention and diversification post-amplification, potentially enhancing regulatory complexity and adaptive capacity [3]. Despite these insights, our understanding remains limited regarding how gene family expansion resulting from amplification specifically contributes to adaptive regulatory networks under environmental stress conditions [4].
One of the largest and most functionally diverse transcription factor families, the APETALA2/ETHYLENE RESPONSE FACTOR (AP2/ERF) superfamily, is critical for coordinating plant growth, development, and stress responses [5]. This superfamily comprises distinct subfamilies including AP2, DREB, ERF, and RAV, each mediating unique sets of physiological processes [5]. AP2 factors, for instance, influence floral organ identity and seed maturation, whereas the DREB and ERF subfamilies regulate plant responses to abiotic stresses like drought, cold, and salinity [6]. Although previous genomic analyses have extensively cataloged AP2/ERF family members across numerous species, significant questions remain unanswered: specifically, how does gene amplification post-amplification reshape AP2/ERF regulatory networks, and what novel metabolic pathways might these expanded AP2/ERFs regulate to facilitate environmental adaptability [1,4,7,8].
To address this critical gap, we selected Chenopodium quinoa (quinoa), an allotetraploid crop renowned for its nutritional excellence and exceptional abiotic stress tolerance, as our model organism [9]. Quinoa seeds are nutritionally dense, enriched particularly with essential fatty acids, making quinoa an attractive alternative to traditional staple crops [10,11,12,13,14]. Importantly, fatty acids play crucial roles in membrane stability and signaling under stress conditions, suggesting metabolic linkages to stress adaptation [14,15,16,17,18]. Quinoa’s polyploid nature, abundant nutritional qualities, and robustness to environmental stresses provide an ideal system to investigate how amplification-driven gene amplification in the AP2/ERF family might regulate fatty acid metabolism, thus contributing to stress resilience [13,14,15,16,17,18,19].
The specific objectives of our study were thus to (i) comprehensively characterize AP2/ERF gene amplification events in quinoa resulting from whole-genome duplication; (ii) uncover the AP2/ERF regulatory networks associated with fatty acid biosynthesis and environmental stress adaptation; and (iii) evaluate the evolutionary conservation of these networks by comparative analyses with Arabidopsis thaliana, a well-studied model species [20,21,22,23,24,25].
Through integrative multi-omics approaches—including genomics, transcriptomics, metabolomics, phenotyping, and protein interaction analyses—we aim to clarify how AP2/ERF gene family expansion after amplification contributes to adaptive metabolic reprogramming in quinoa [26,27,28,29,30,31]. This study not only addresses fundamental evolutionary questions but also provides a valuable framework for improving crop resilience and nutritional quality through targeted genetic strategies [2,32,33,34,35,36].

2. Materials and Methods

2.1. Genomes and Transcriptomes Mining

For this study, genome sequences for 15 plant species were sourced from Phytozome. Additionally, we acquired various microarray datasets for Arabidopsis thaliana, covering responses to hormones like auxin, gibberellin, abscisic acid, ethylene, methyl jasmonate, brassinosteroid, zeatin, and salicylic acid, as well as datasets for abiotic stresses, including ozone, high light, and hydrogen peroxide, and biotic stresses, like Botrytis cinerea, elicitors Flg22 and EF-Tu, Erysiphe orontii, Phytophthora infestans, Blumeria patens, and Erysiphe cichoracearum. Proteome data for A. thaliana, Oryza sativa, and Chenopodium quinoa, as well as DAP-seq data for A. thaliana, were also downloaded. Expression analyses of CqAP2/ERFs used RNA-seq data from various tissues. Following Li’s computational strategy, multiple RNA-seq datasets for A. thaliana were employed to predict the potential functions of AP2/ERFs.

2.2. Systematic Identification of the AP2/ERF Gene Family

The Hidden Markov Model (HMM) of the AP2/ERF domain (PF00847) was obtained from the Pfam database. Utilizing HMMER V3.1, we identified AP2/ERFs from the 15 plants, applying an e-value threshold of ≤1 × 10⁻⁵. AP2/ERF protein sequences from these genomes underwent BLASTP analysis against the NCBI database, filtering out non-AP2/ERF sequences with a score of ≥100 and an e-value of ≤1 × 10⁻¹⁰. Further verification was performed using HMMER, SMART, Pfam, and InterPro to ensure all identified genes possessed AP2/ERF domains.

2.3. Orthogroups Identification of Multispecies AP2/ERFs

Orthogroups for the AP2/ERF proteins across the 15 species were determined using OrthoFinder 2. We aligned the AP2/ERF protein sequences from these species using MUSCLE 3.8.31. The species tree was then constructed with Mega7, providing a phylogenetic framework to further analyze these proteins.

2.4. Sequence Alignment, TimeTree, and Phylogenetic Tree Construction

To determine the divergence times among the 15 species, we constructed a TimeTree using the TimeTree online tool. For phylogenetic analysis, amino acid sequences of AP2/ERF proteins from these species were aligned using MUSCLE 3.8.31 with default parameters. The aligned sequences were used in Mega7 to identify the optimal protein evolution model, which was determined to be the Jones–Taylor–Thornton (JTT) model. Based on this model, we generated a maximum likelihood (ML) tree using Mega7, with support values calculated through 1000 bootstrap replicates to ensure robustness.

2.5. Systematic Analysis of AP2/ERF Gene Structure

To investigate the evolutionary characteristics of AP2/ERFs across different subfamilies, we used Mega7 to construct gene trees for each subfamily, as determined by Ortho Finder 2. Conserved motifs in the AP2/ERF amino acid sequences from the 15 species were identified using MEME v4.9.0 (Table S3). Exon and intron structures of the Chenopodium quinoa AP2/ERFs were analyzed using the Gene Structure Display Server. Additionally, promoter regions of these genes were examined with PlantPAN3.0, enabling the prediction of cis-acting regulatory elements (Table S11).

2.6. Chromosome Distribution, Syntenic Analysis, and Comparative Genomics

Chromosomal localization data for AP2/ERFs from C. quinoa (CqAP2/ERFs), Arabidopsis thaliana (AtAP2/ERFs), Fagopyrum tataricum (FtAP2/ERFs), and Solanum tuberosum (StAP2/ERFs) were extracted from GFF and sequencing files. These data were visualized using Ciros software. To examine syntenic relationships between species, Dual Synteny Plotter software was employed to create comparative maps of AP2/ERF genes across different species (Table S6). BLASTP was utilized to identify homologous protein sequences within and between species. Intraspecific and interspecific syntenic regions were identified using MCscan. Furthermore, non-synonymous (Ka) to synonymous (Ks) substitution ratios and Ks values were calculated using the PAML package, providing insights into evolutionary pressures acting on AP2/ERF genes.

2.7. Identification of AP2/ERFs Gene Types and Development-Related Phenotypic Analysis

Following previous studies, we used the duplicate_gene_classifier program in MCScanX to identify AP2/ERFs associated with amplification. BLASTP was applied to detect potential anchor points (E-value < 1 × 10⁻⁵; top five matches) between each pair of chromosomes across multiple genomes. For phenotypic analysis, we utilized the TAIR and RARGE II databases. We specifically screened for AP2/ERFs whose expression or knockdown resulted in observable phenotypic changes in plants. By integrating the gene data from these two databases, we identified 14 specific AP2/ERFs that caused phenotypic alterations when overexpressed or knocked out.

2.8. Gene Ontology (GO) Analysis and Correlation Network Construction

Gene Ontology (GO) analysis was performed for all identified genes using the Blast2GO gene ontology tools (Blast2GO Basic v6.0). To construct interaction networks, we used the R package imsbinfer, available on GitHub (https://github.com/, accessed on 5 March 2025), to facilitate the analysis of gene interactions and associated biological processes.

2.9. Gene-Module Association Determination (G-MAD)

To annotate the functions of AP2/ERFs, we integrated multiple RNA-seq datasets from Arabidopsis thaliana and employed the G-MAD method. We used the Competitive Correlation Adjusted MEan RAnk (CAMERA) gene set test to compute enrichment between the genes of interest and various biological modules. The expression data were preprocessed using the probabilistic estimation of expression residuals (PEER) method. The dataset results were then meta-analyzed, and gene-module association scores (GMASs) were calculated as the mean connection score, weighted by sample sizes and intergene correlation coefficients within the modules.

2.10. Construction of CqAP2/ERFs Expression Profiles

The transcriptional levels of differentially expressed CqAP2/ERFs in two types of C. quinoa fruits were analyzed using quantitative RT-PCR (qRT-PCR). Primers were designed using Primer3, and the reference gene selected for normalization was Elongation Factor 1 alpha (EF1α). The qRT-PCR conditions included an initial denaturation at 95 °C for 3 min, followed by 40 cycles of denaturation at 95 °C for 5 s, and annealing and extension at 60 °C for 30 s. Transcriptional data were analyzed using the 2ΔΔCT method. For each sample, three biological replicates were performed, each with three technical replicates. The primers used for qRT-PCR are listed in Table S17.

3. Results

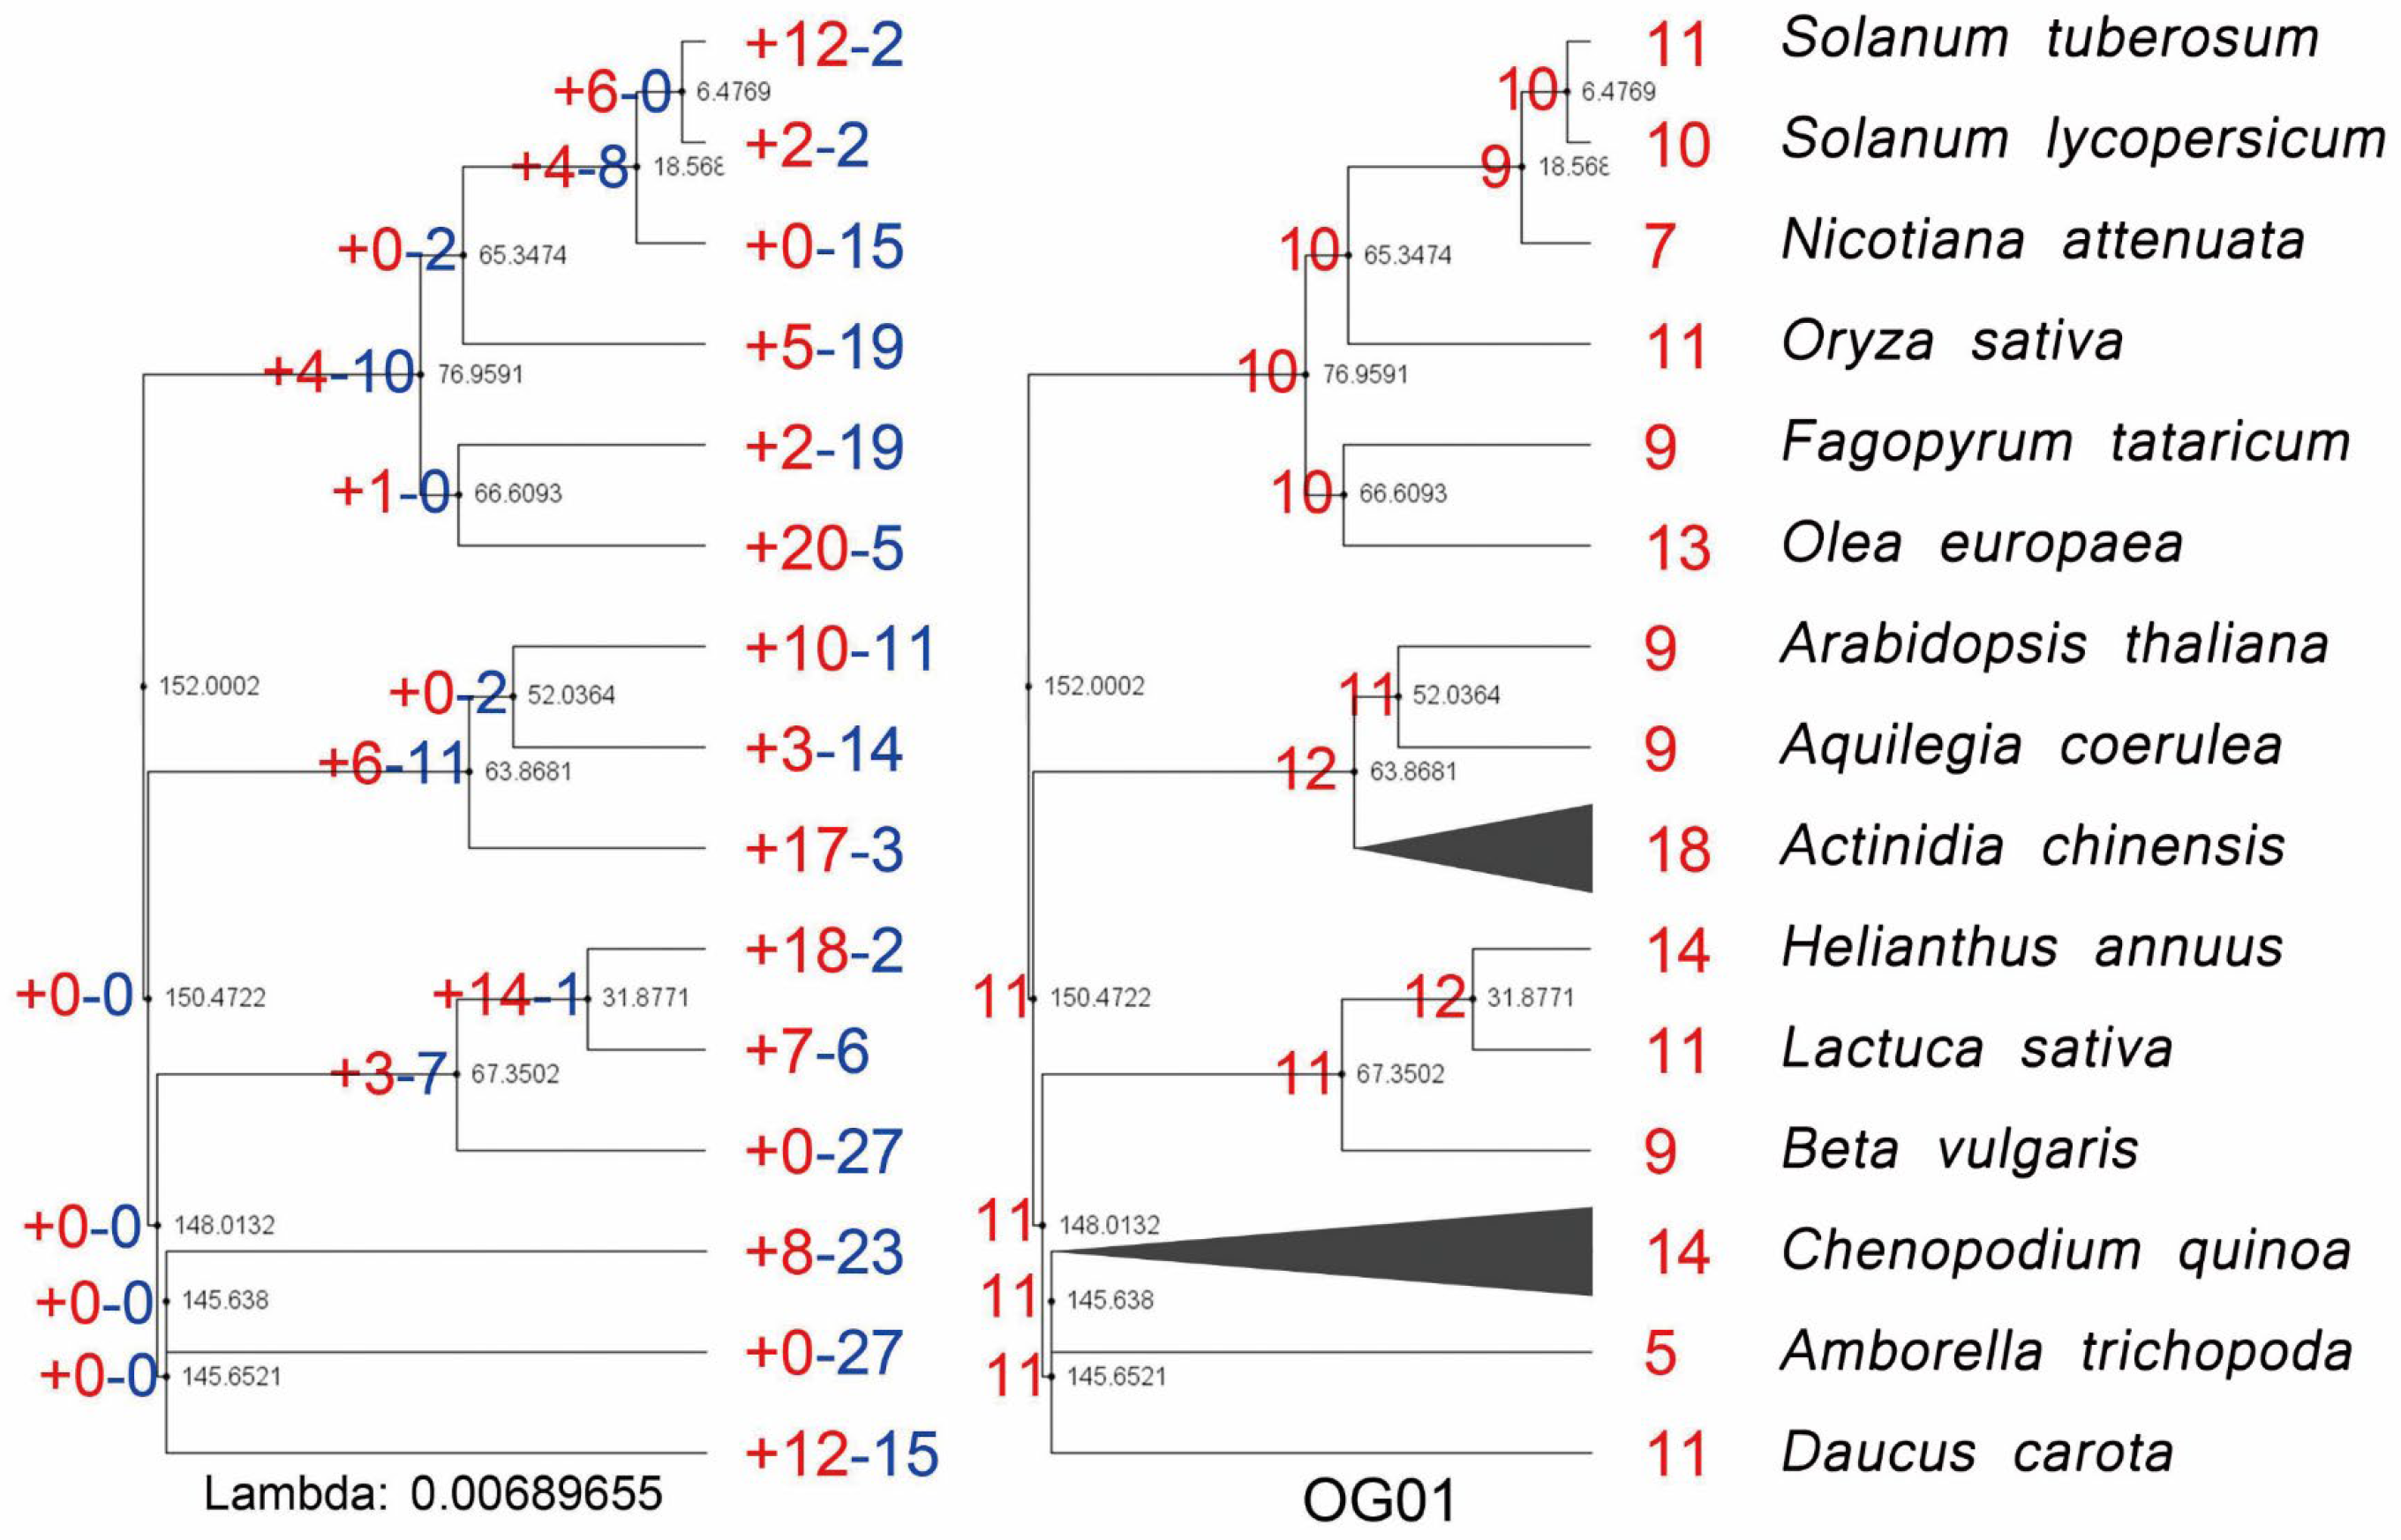
3.1. Phylogenetic Identification, Evolutionary Expansion, and Contraction of AP2/ERFs in Important Plants

We analyzed the genomes of 15 plant species to investigate the evolutionary dynamics of the AP2/ERF gene family, particularly in polyploid species (Figure 1, Table S1). A total of 1495 AP2/ERF genes were identified, with 43 to 70 genes in monocots and 47 to 179 genes in dicots. These genes were grouped into 35 orthogroups, which were further divided into two categories: Group I (orthogroups 0–12) and Group II (orthogroups 13–35) (Figure 1).
Group I orthogroups contained multiple genes per species, reflecting extensive gene family expansion over evolutionary history. In contrast, Group II orthogroups typically had one or a few genes, with some species showing no representation. Notably, the basal angiosperm Amborella trichopoda, which has not undergone whole-genome duplication (WGD), exhibited significantly fewer genes in both groups, highlighting its unique evolutionary position (Figure 2).
Expansion and contraction of gene families play critical roles in plant adaptation. Evolutionary analysis revealed that the AP2 subfamily underwent notable expansion in polyploid species such as Chenopodium quinoa and Actinidia chinensis (Figure 2). These findings suggest that AP2 genes in these species contribute to enhanced adaptive evolution.
Phylogenetic trees were constructed for different AP2/ERF subfamilies in C. quinoa and other species (Figure 3 and Figure S1). The gene phylogeny largely aligned with species phylogeny, with C. quinoa AP2/ERFs forming sister groups with Beta vulgaris genes. Some B. vulgaris genes were closely related to one or two C. quinoa AP2/ERFs, indicating shared evolutionary origins (Figure 3 and Figure S1). The complex phylogenetic topology observed in Group I suggests multiple duplication events before and after amplification in C. quinoa.
Motif analysis revealed that all AP2/ERF genes shared motif 1, corresponding to the conserved AP2/ERF domain (Figure 1 and Figure S1, Table S3). Additional lineage-specific motifs were identified, such as motif 8 in the A5 subfamily, which was exclusive to dicots. Novel motifs also emerged in more derived species. For example, while the basal angiosperm A. trichopoda contained only conserved motifs (e.g., motif 1: AP2/ERF domain, and motif 3: EAR motif), novel unannotated motifs (e.g., motifs 2, 5, and 10) appeared in species like Oryza sativa and C. quinoa.
In the A3 subfamily, motif loss was observed during the divergence of monocots and dicots. For instance, Aquilegia coerulea lacked motifs 7, 8, and 9, while O. sativa lacked motifs 2, 3, and 4, indicating differential motif retention. Interestingly, motifs 3 (EAR motif) and 5 (unannotated) in the A6 subfamily either coexisted or were absent, suggesting potential functional redundancy (Figure S1).
These results indicate that the AP2/ERF family has undergone extensive diversification through expansion, contraction, and motif evolution. The presence of lineage-specific and novel motifs highlights their potential roles in adaptive processes, particularly in polyploid species like C. quinoa.

3.2. The Expansion of AP2/ERFs in Important Plants Caused by Recursive Amplification

AP2/ERF genes are unevenly distributed across chromosomes in different species. In the Arabidopsis thaliana genome, 100 collinear AP2/ERF gene pairs were identified, and similar patterns of collinearity were observed in the genomes of other species (Figure 4, Figure 5, Figure 6 and Figure 7, Table S4). Analysis of the relationships between collinear AP2/ERFs across species revealed a close correlation in their expression patterns, suggesting that these genes may perform similar functions (Figure 8A, Table S4). Furthermore, Ks value analysis of homologous gene pairs confirmed that these genes underwent whole-genome duplication (WGD) events (Figure 8B).
Collinear genes, which retain their ancestral positions, are commonly used to infer paleopolyploid events. In this study, AP2/ERFs were classified into four types based on their genomic distribution: polyploidy-related, tandem, proximal, and dispersed. The majority of AP2/ERFs in C. quinoa, S. tuberosum, F. tataricum, and A. thaliana were polyploidy-related (Figure 8C, Table S5).
We further analyzed AP2/ERF types in additional species (Figure 8D). Notably, Actinidia chinensis and Helianthus annuus each contained 139 polyploidy-related AP2/ERFs, more than any other species (Figure 8D, Table S5). In contrast, Beta vulgaris had the fewest polyploidy-related AP2/ERFs, with only 20 (Figure 8D, Table S5). In terms of proportions, 97.2% (138) of Olea europaea AP2/ERFs were polyploidy-related, followed by Nicotiana attenuata (89.09%, 49), while only 35% of Lactuca sativa AP2/ERFs were polyploidy-related (Table S5). Across the 15 species analyzed, polyploidy-related AP2/ERFs accounted for 42.11–100% of the homologs in 13 species (Figure 8C,D, Table S5). These findings suggest that the extensive expansion of AP2/ERFs in these species is likely driven by amplification. Although AP2/ERF retention following WGD is common, the expansion observed in many species—especially diploids like Olea europaea—cannot be fully explained by polyploidy. Instead, segmental and tandem duplication events are major contributors to AP2/ERF amplification. Figure 8A,D clearly reflect this, with many AP2 paralogs classified as non-WGD duplicates.

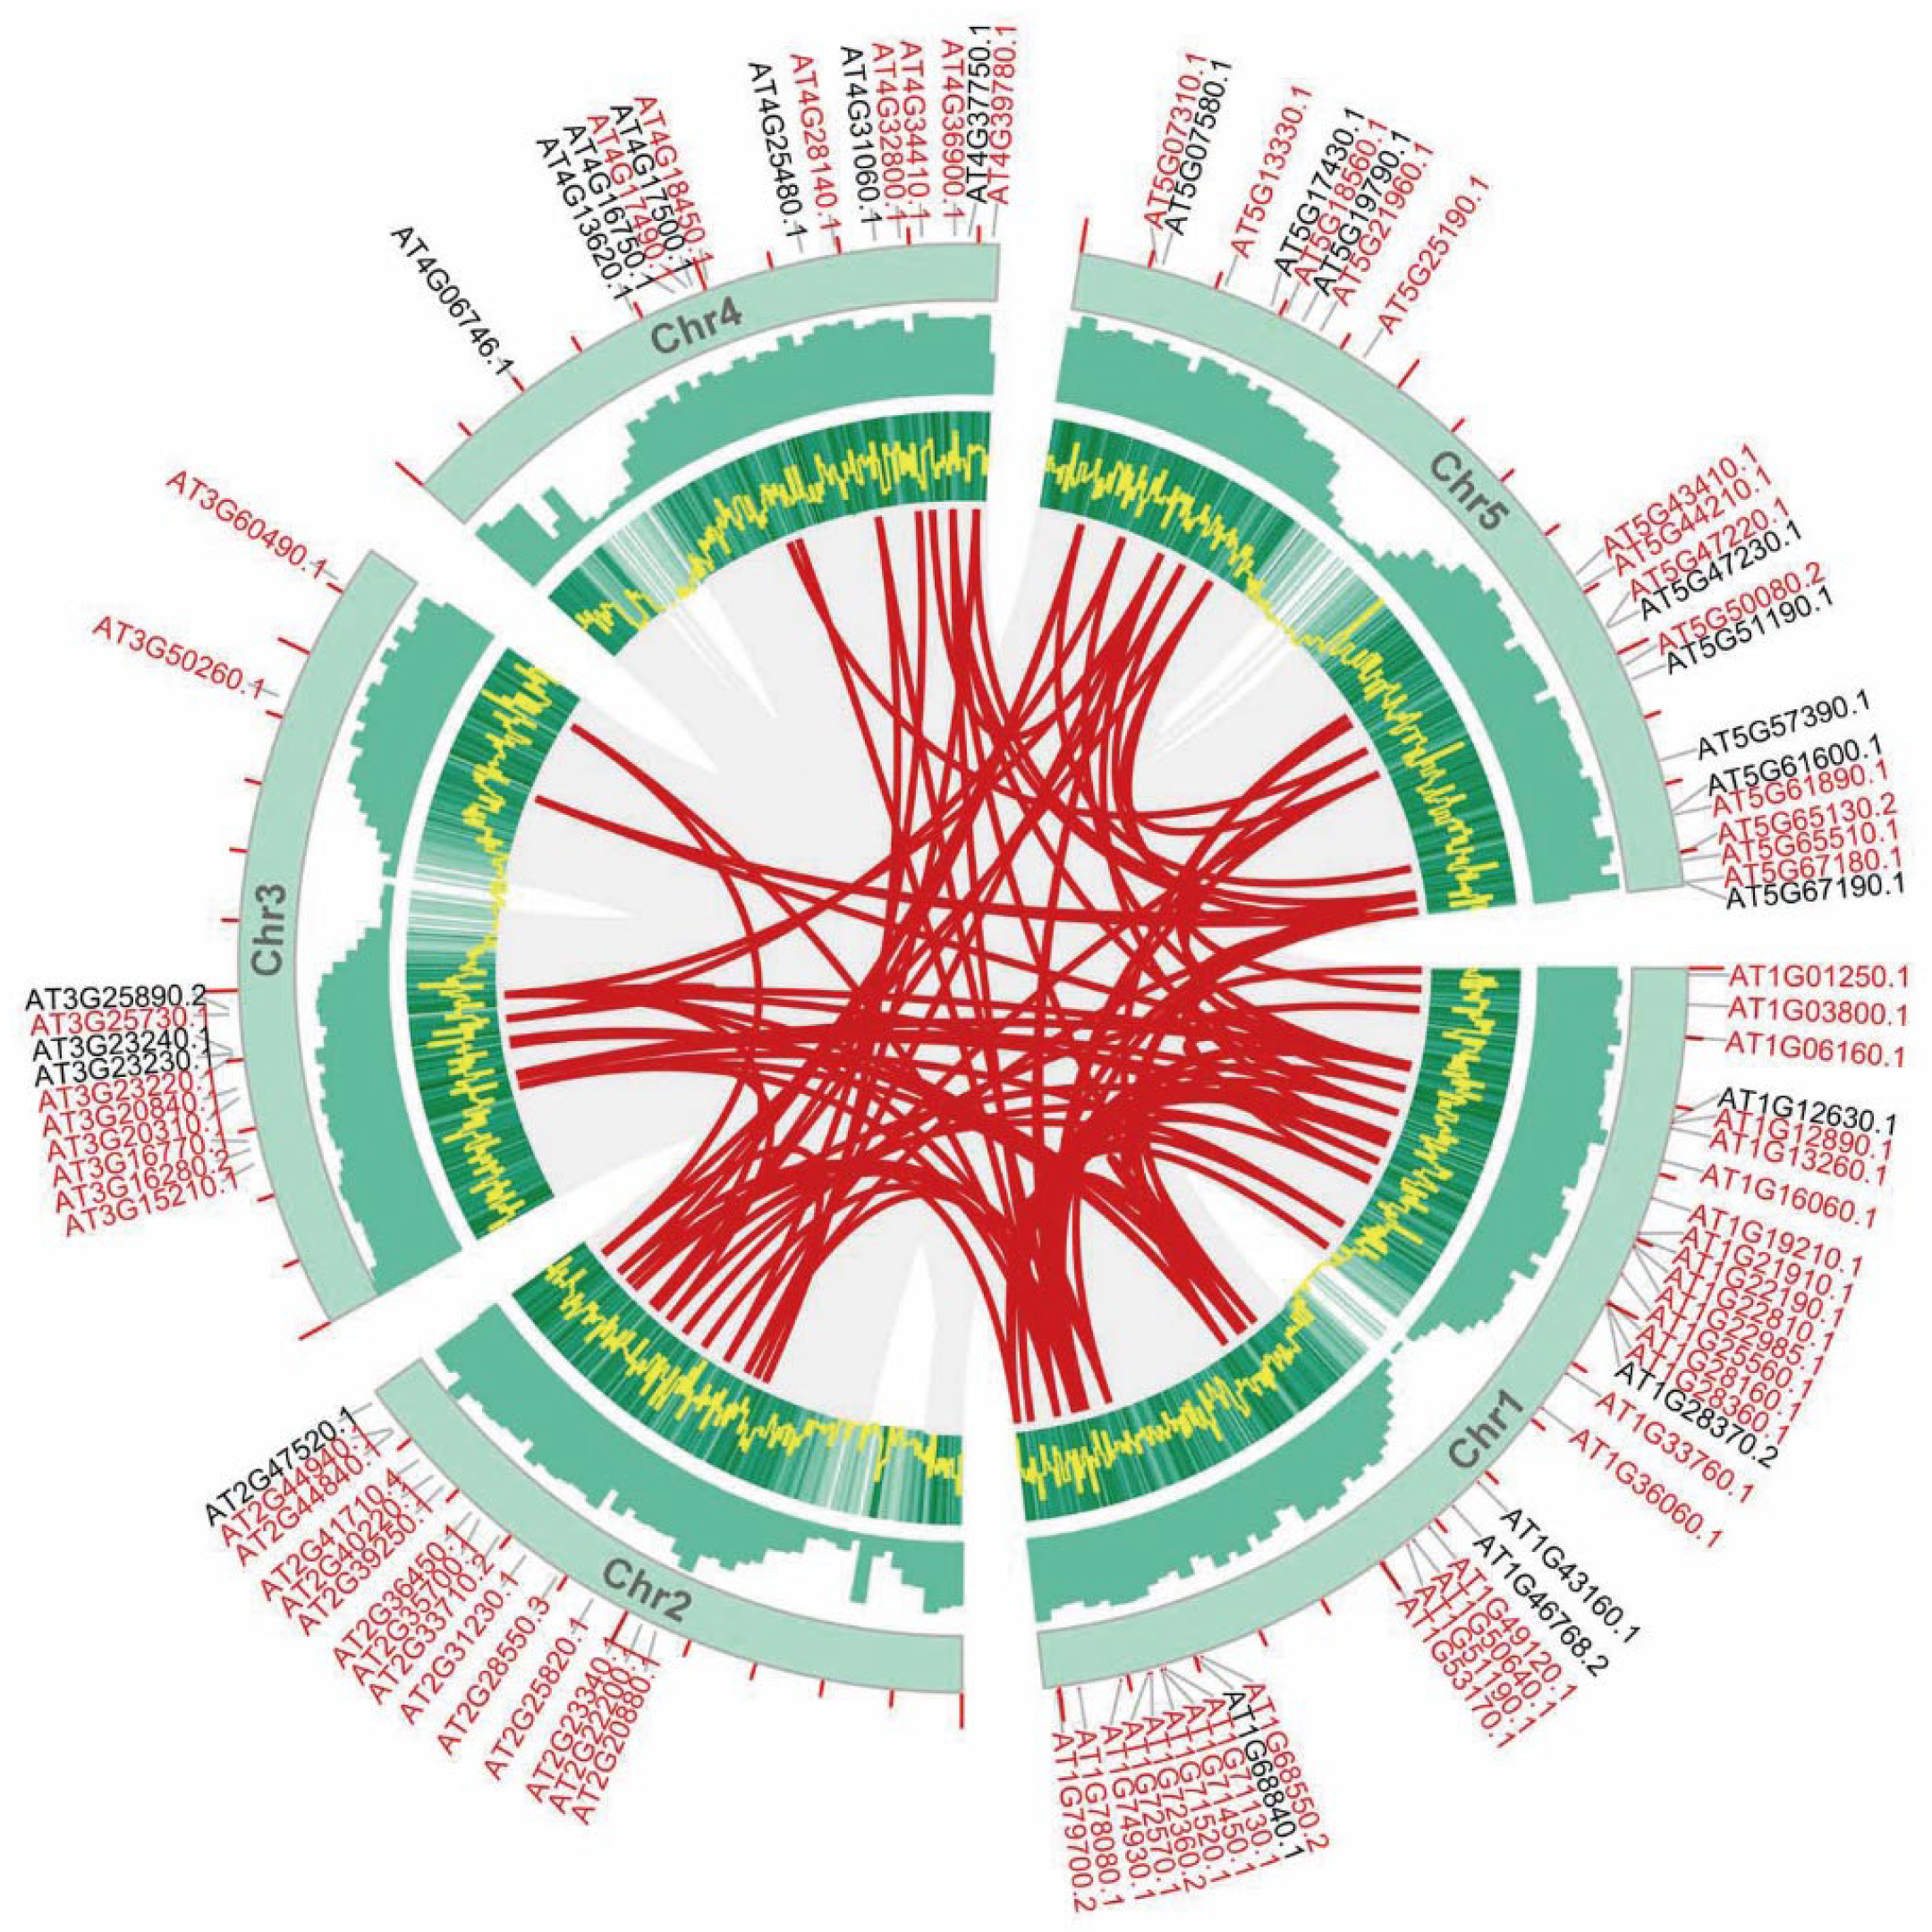
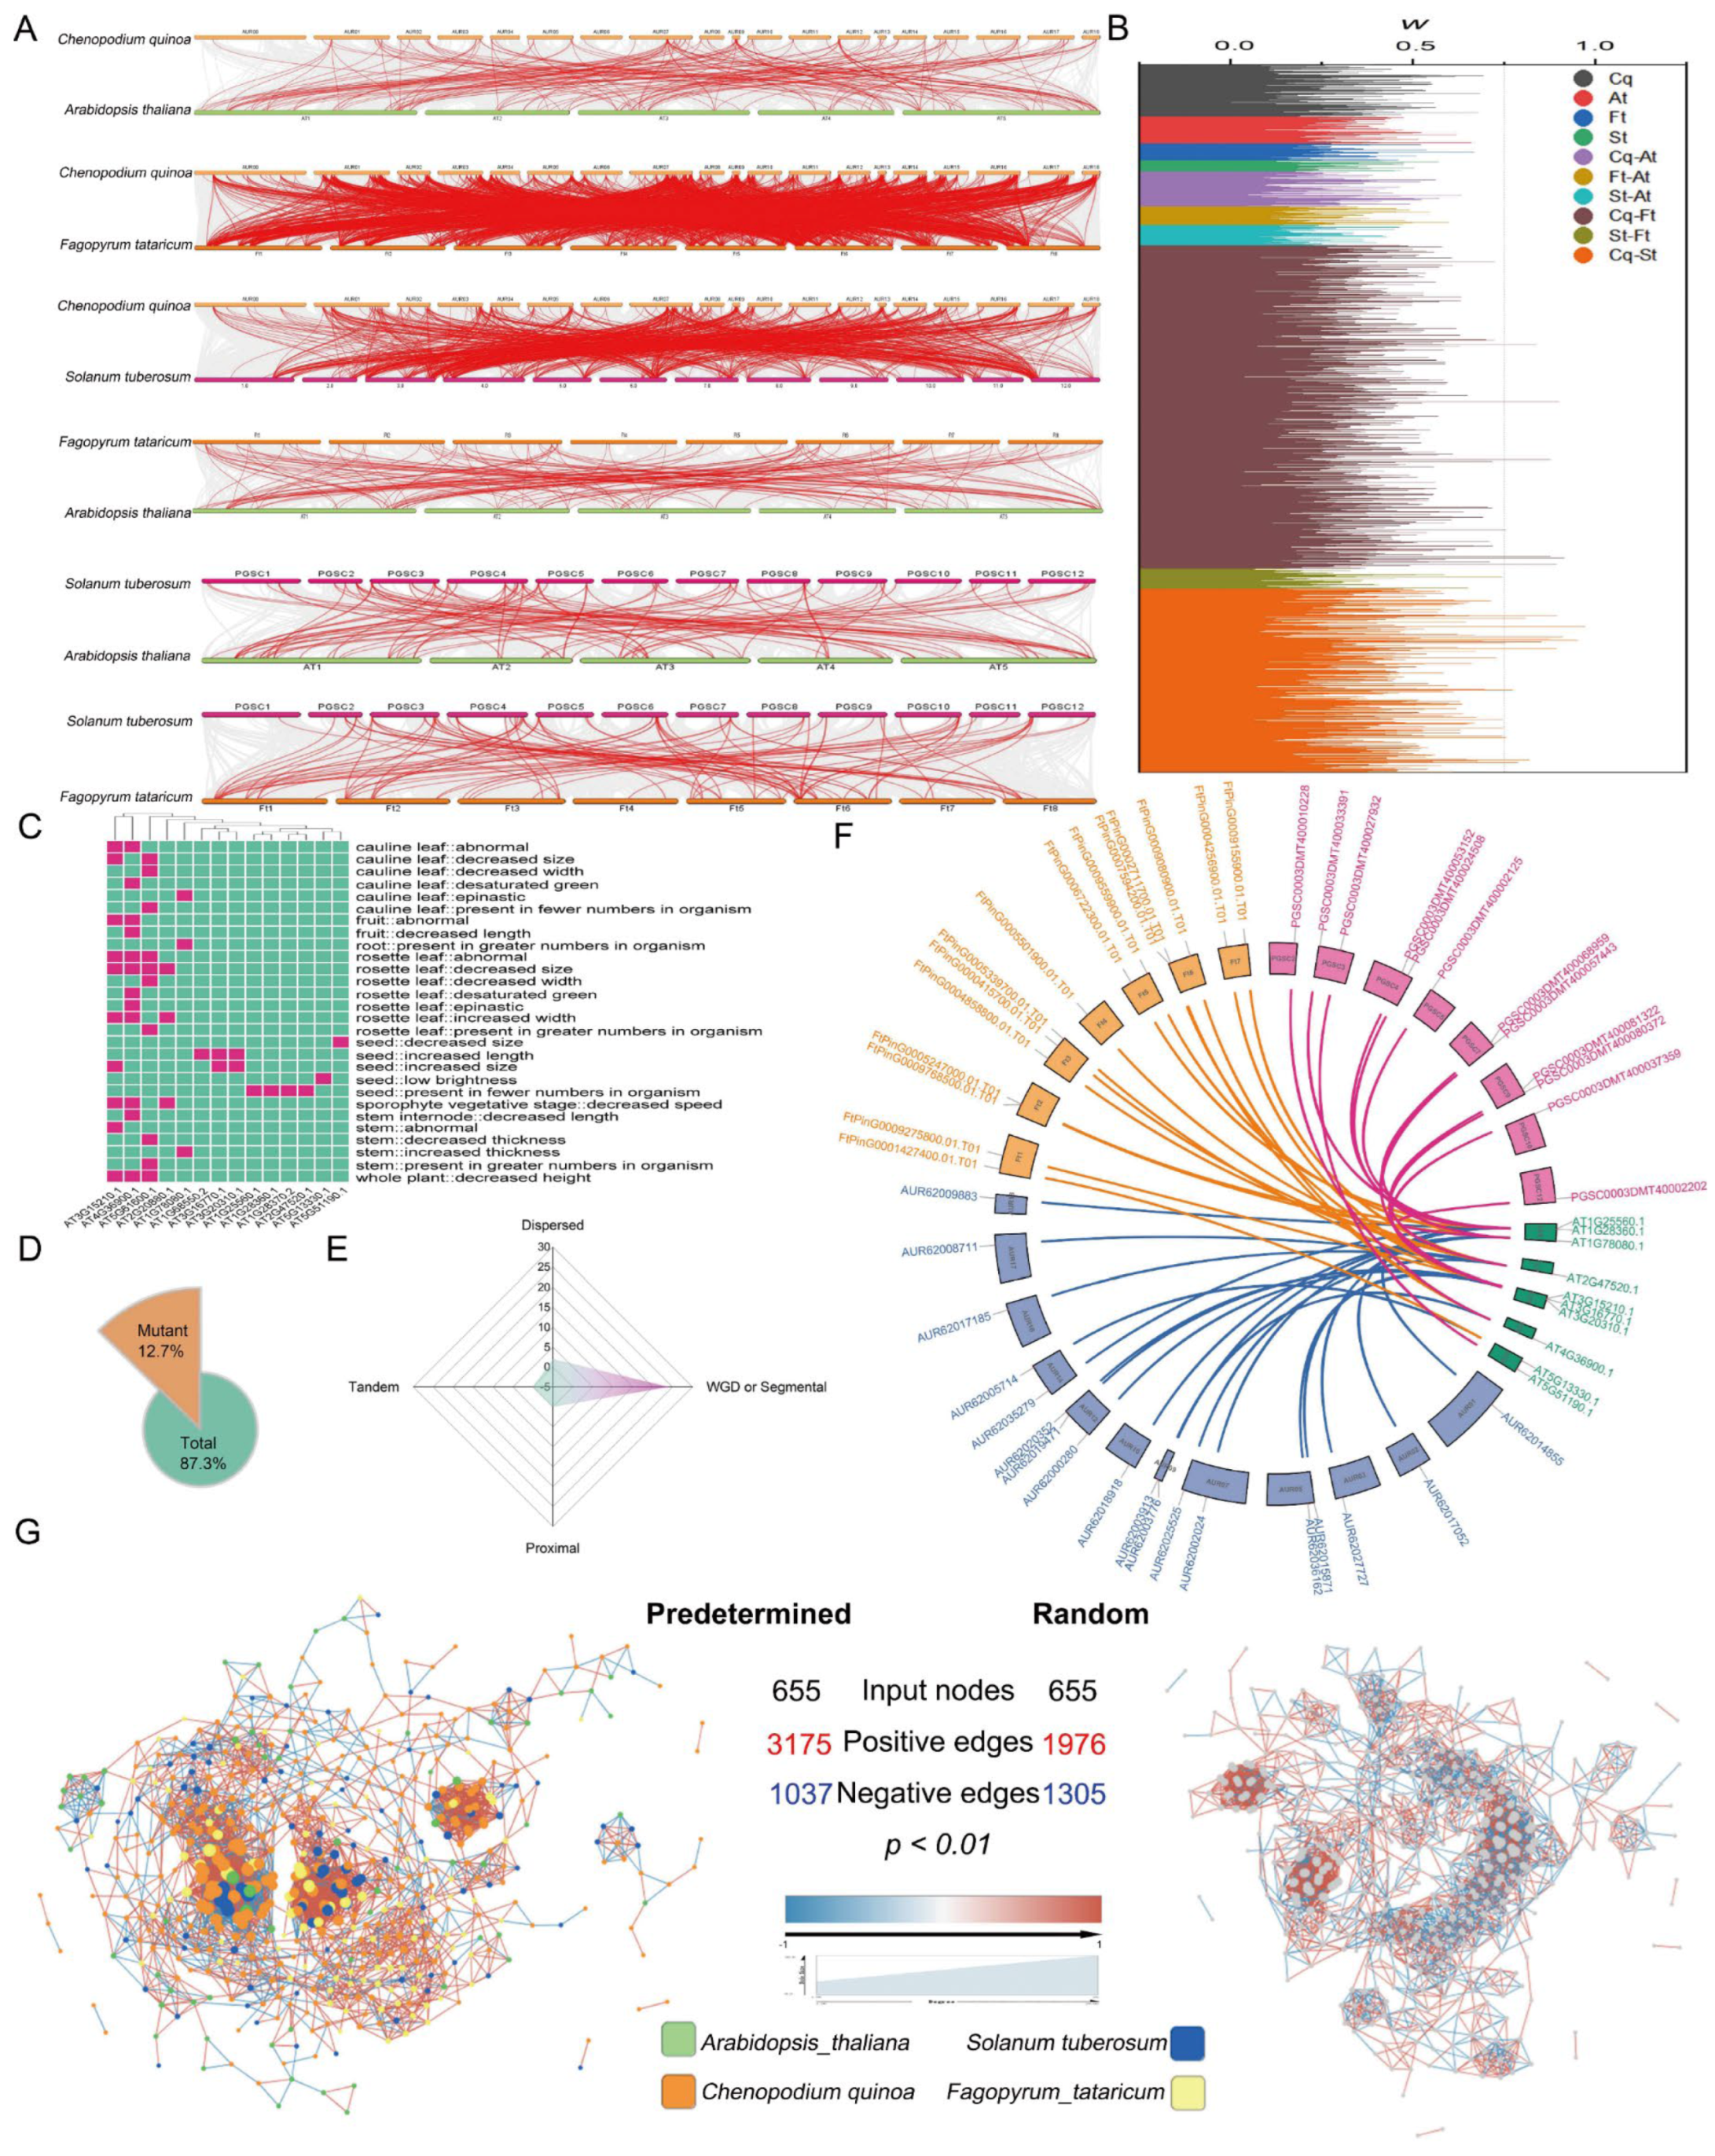
3.3. Genomic Synteny Conservation of AP2/ERFs in Important Plants

Polyploidy has significantly contributed to the expansion of AP2/ERFs, raising the question of whether their functions are conserved across different plant species. Genomic synteny, characterized by the conservation of gene order, is widely observed in angiosperms, particularly within conserved genomic regions.
To investigate the synteny of AP2/ERFs, we constructed comparative syntenic maps for several representative species. The analysis revealed that C. quinoa and F. tataricum shared the highest number of orthologous gene pairs (2047 pairs), followed by C. quinoa and S. tuberosum (789 pairs). Lower numbers were observed between C. quinoa and A. thaliana (171 pairs) and between F. tataricum and A. thaliana (133 pairs). The fewest shared pairs were identified between S. tuberosum and A. thaliana (98 pairs) and between S. tuberosum and F. tataricum (97 pairs) (Figure 9A, Table S6). These results underscore the close evolutionary relationship between C. quinoa and F. tataricum, as reflected by the high number of conserved gene pairs [5].
Orthologous AP2/ERF gene pairs exhibited significant expression pattern correlations (p < 0.05), which were absent in a random gene set (Figure 9G, Table S6). This suggests that conserved AP2/ERFs are likely involved in shared regulatory pathways across species.
Further Ka/Ks analysis of orthologous AP2/ERFs revealed values consistent with purifying selection, indicating evolutionary constraints that preserve their functions (Figure 9B). Together with the expression data, these findings support the hypothesis that AP2/ERFs maintain conserved regulatory roles across species.
In summary, these results highlight the evolutionary and functional conservation of AP2/ERFs. Their critical roles in regulatory networks suggest that AP2/ERFs contribute to maintaining genomic stability and functional integrity in diverse plant species.

3.4. Phenotypic Analysis of AtAP2/ERFs and Mapping to Important AP2/ERFs in Other Species

Phenotypic data from the TAIR and RARGE II databases identified 14 AtAP2/ERFs involved in developmental processes, representing 12.7% of the total AtAP2/ERFs. These genes were clustered based on their phenotypic effects, highlighting diverse roles in plant development (Figure 9C,D). Mutations in AT3G15210.1 and AT4G36900.1 affected both vegetative and reproductive organs, while AT5G61600.1 specifically impacted vegetative growth. Two additional genes, AT1G78080.1 and AT2G20880.1, were also associated exclusively with vegetative development. Mutations in the remaining nine AtAP2/ERFs primarily influenced seed morphology, underscoring their critical roles in reproductive organ regulation (Figure 9C).
To identify AP2/ERFs with similar functions in other species, the 14 AtAP2/ERFs were mapped to corresponding genes in CqAP2/ERFs, FtAP2/ERFs, and StAP2/ERFs. This mapping revealed 23 syntenic pairs between AtAP2/ERFs and CqAP2/ERFs, including two one-to-one syntenic pairs: AT3G16770.1 with AUR62000280 and AT5G13330.1 with AUR62005714 (Figure 9F, Table S7). Notably, 66.7% of the AtAP2/ERFs were associated with whole-genome duplications (WGDs) or segmental duplications, emphasizing the evolutionary significance of these events in gene retention and diversification (Figure 9E).
Among the nine AtAP2/ERFs regulating fruit morphology, six formed syntenic pairs with CqAP2/ERFs, including the two one-to-one pairs mentioned above. These findings suggest that specific CqAP2/ERFs are likely key regulators of fruit development, with potential implications for seed formation and fruit size. Additionally, AtAP2/ERFs formed 16 syntenic pairs with StAP2/ERFs (four one-to-one pairs) and 21 syntenic pairs with FtAP2/ERFs (one one-to-one pair) (Figure 9F).
Together, these findings highlight the conserved roles of AtAP2/ERFs and their syntenic counterparts in regulating plant development. Mutations in AtAP2/ERFs serve as useful markers to identify collinear AP2/ERFs in other species, aiding the discovery of candidate genes involved in key developmental pathways [3].

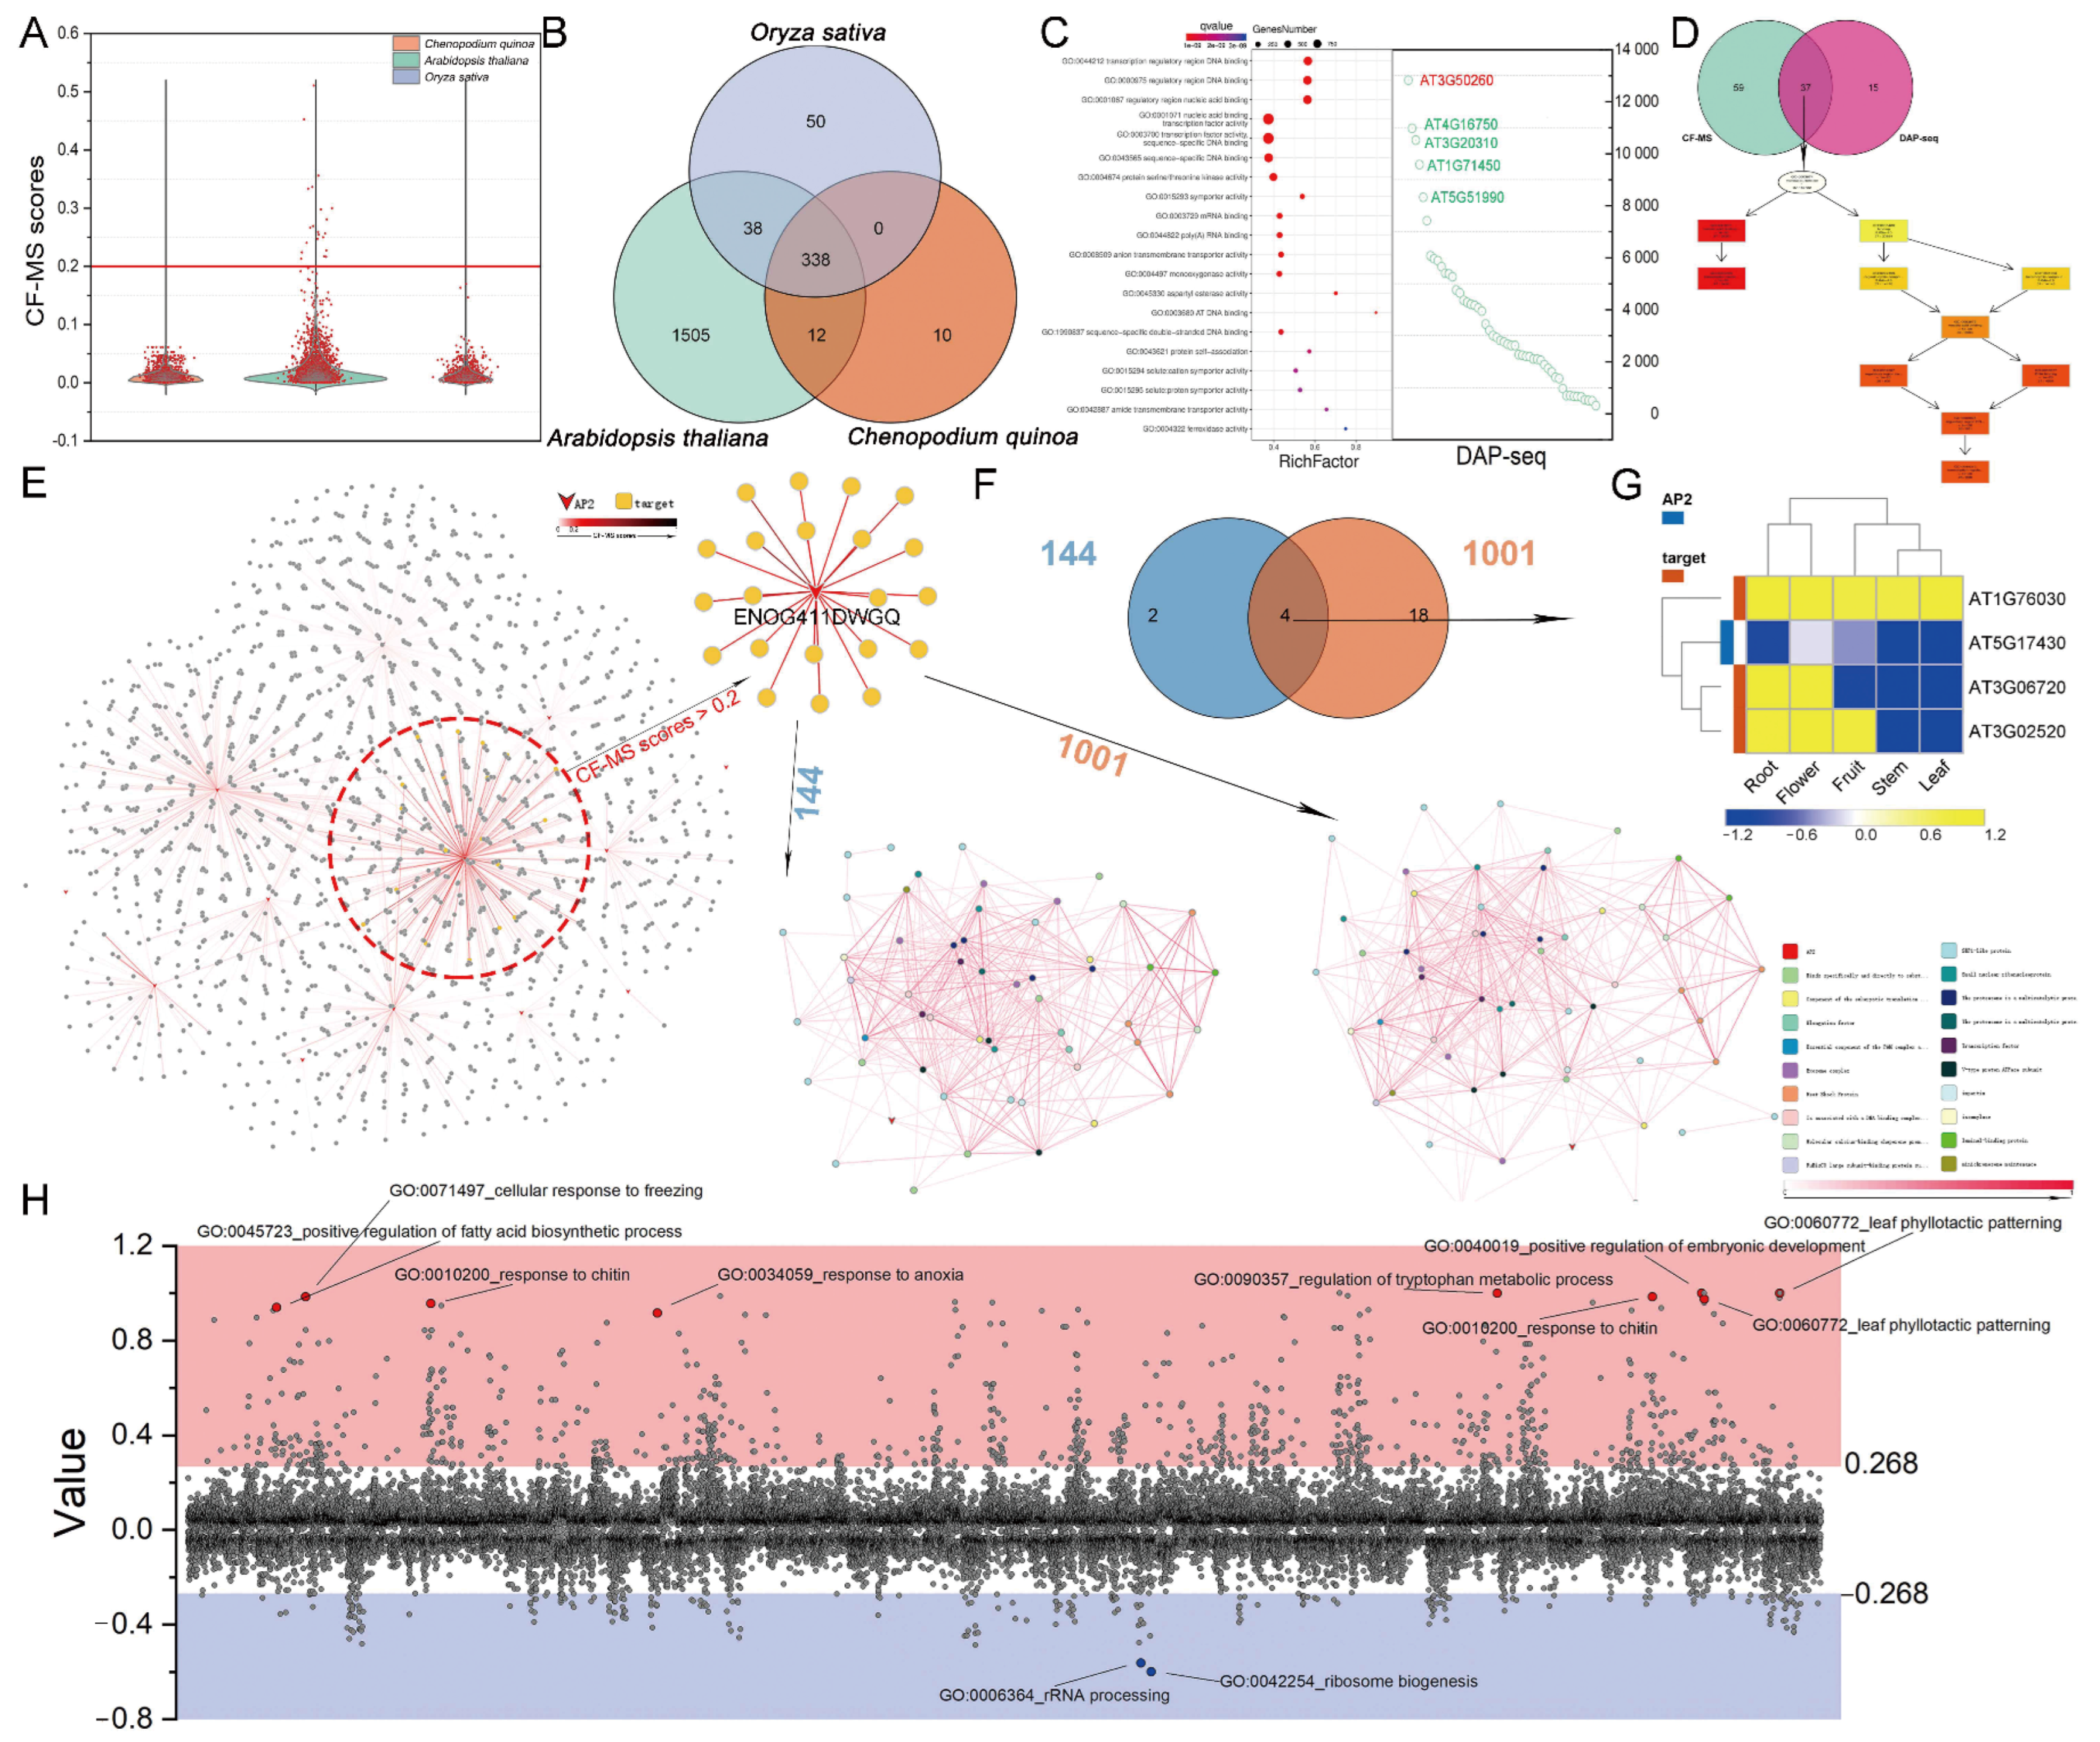
3.5. CF-MS and DNA Affinity Purification Sequencing (DAP-Seq) Determine the Functions of AP2/ERFs

Co-fractionation mass spectrometry (CF-MS) identified 338 protein complexes involving AP2/ERFs in C. quinoa, A. thaliana, and O. sativa (Figure 10A,B, Table S8). Among these, the ENQC411DWGQ orthogroup, which includes AP2/ERF genes, interacted with 22 other orthogroups, supported by a CF-MS score above 0.2 in A. thaliana (Figure 10E, Table S9). Further analysis of 144 A. thaliana accessions using the 1001 Genomes Project revealed that AT5G17430, an AP2/ERF gene, interacts with Vacuolar H+-ATPase (AT1G76030). This interaction implicates AT5G17430 in actin cytoskeleton remodeling and plant cell development (p < 0.05) (Figure 10E, Table S8).
The nuclear transporter IMPα (At3G06720), which recognizes nuclear localization signals (NLS) to mediate nuclear import, was also found to interact with AT5G17430. This interaction suggests that AT5G17430 may play a critical role in nuclear processes associated with cell development (Figure 10E, Table S9).
DAP-seq analysis identified genome-wide binding sites for AtAP2/ERFs, revealing variability in the number of target genes per AP2/ERF. AT3G50260 was associated with the highest number of target genes. Gene Ontology (GO) analysis of these targets showed significant enrichment in nucleic acid binding and transcription factor activity pathways (Figure 10C, Table S10).
Integration of CF-MS and DAP-seq data identified 37 conserved AP2/ERFs across species. GO analysis further confirmed their roles in transcriptional regulation and stress response pathways, underscoring their functional conservation (Figure 10D and Figure S2, Table S10). Interestingly, four of these conserved genes were part of the A. thaliana mutant set. For example, AT3G15210 formed a one-to-two synteny pair with CqAP2/ERFs (AUR62036162 and AUR62019471), and AT3G20310 formed synteny pairs with three CqAP2/ERFs (AUR62015871, AUR62010658, and AUR62020352). These syntenic relationships suggest that CqAP2/ERFs may perform functions similar to their A. thaliana counterparts (Figure 10C).
To explore the broader roles of AP2/ERFs, RNA-seq data from A. thaliana were integrated using the G-MAD method to annotate their functions. This analysis linked AP2/ERFs to 125 previously reported pathways and predicted associations with 1101 additional pathways. Notably, AT1G16060 and AT1G79700 were implicated in the positive regulation of fatty acid biosynthesis, highlighting their involvement in both adaptive and metabolic processes (Figure 10H, Table S11).

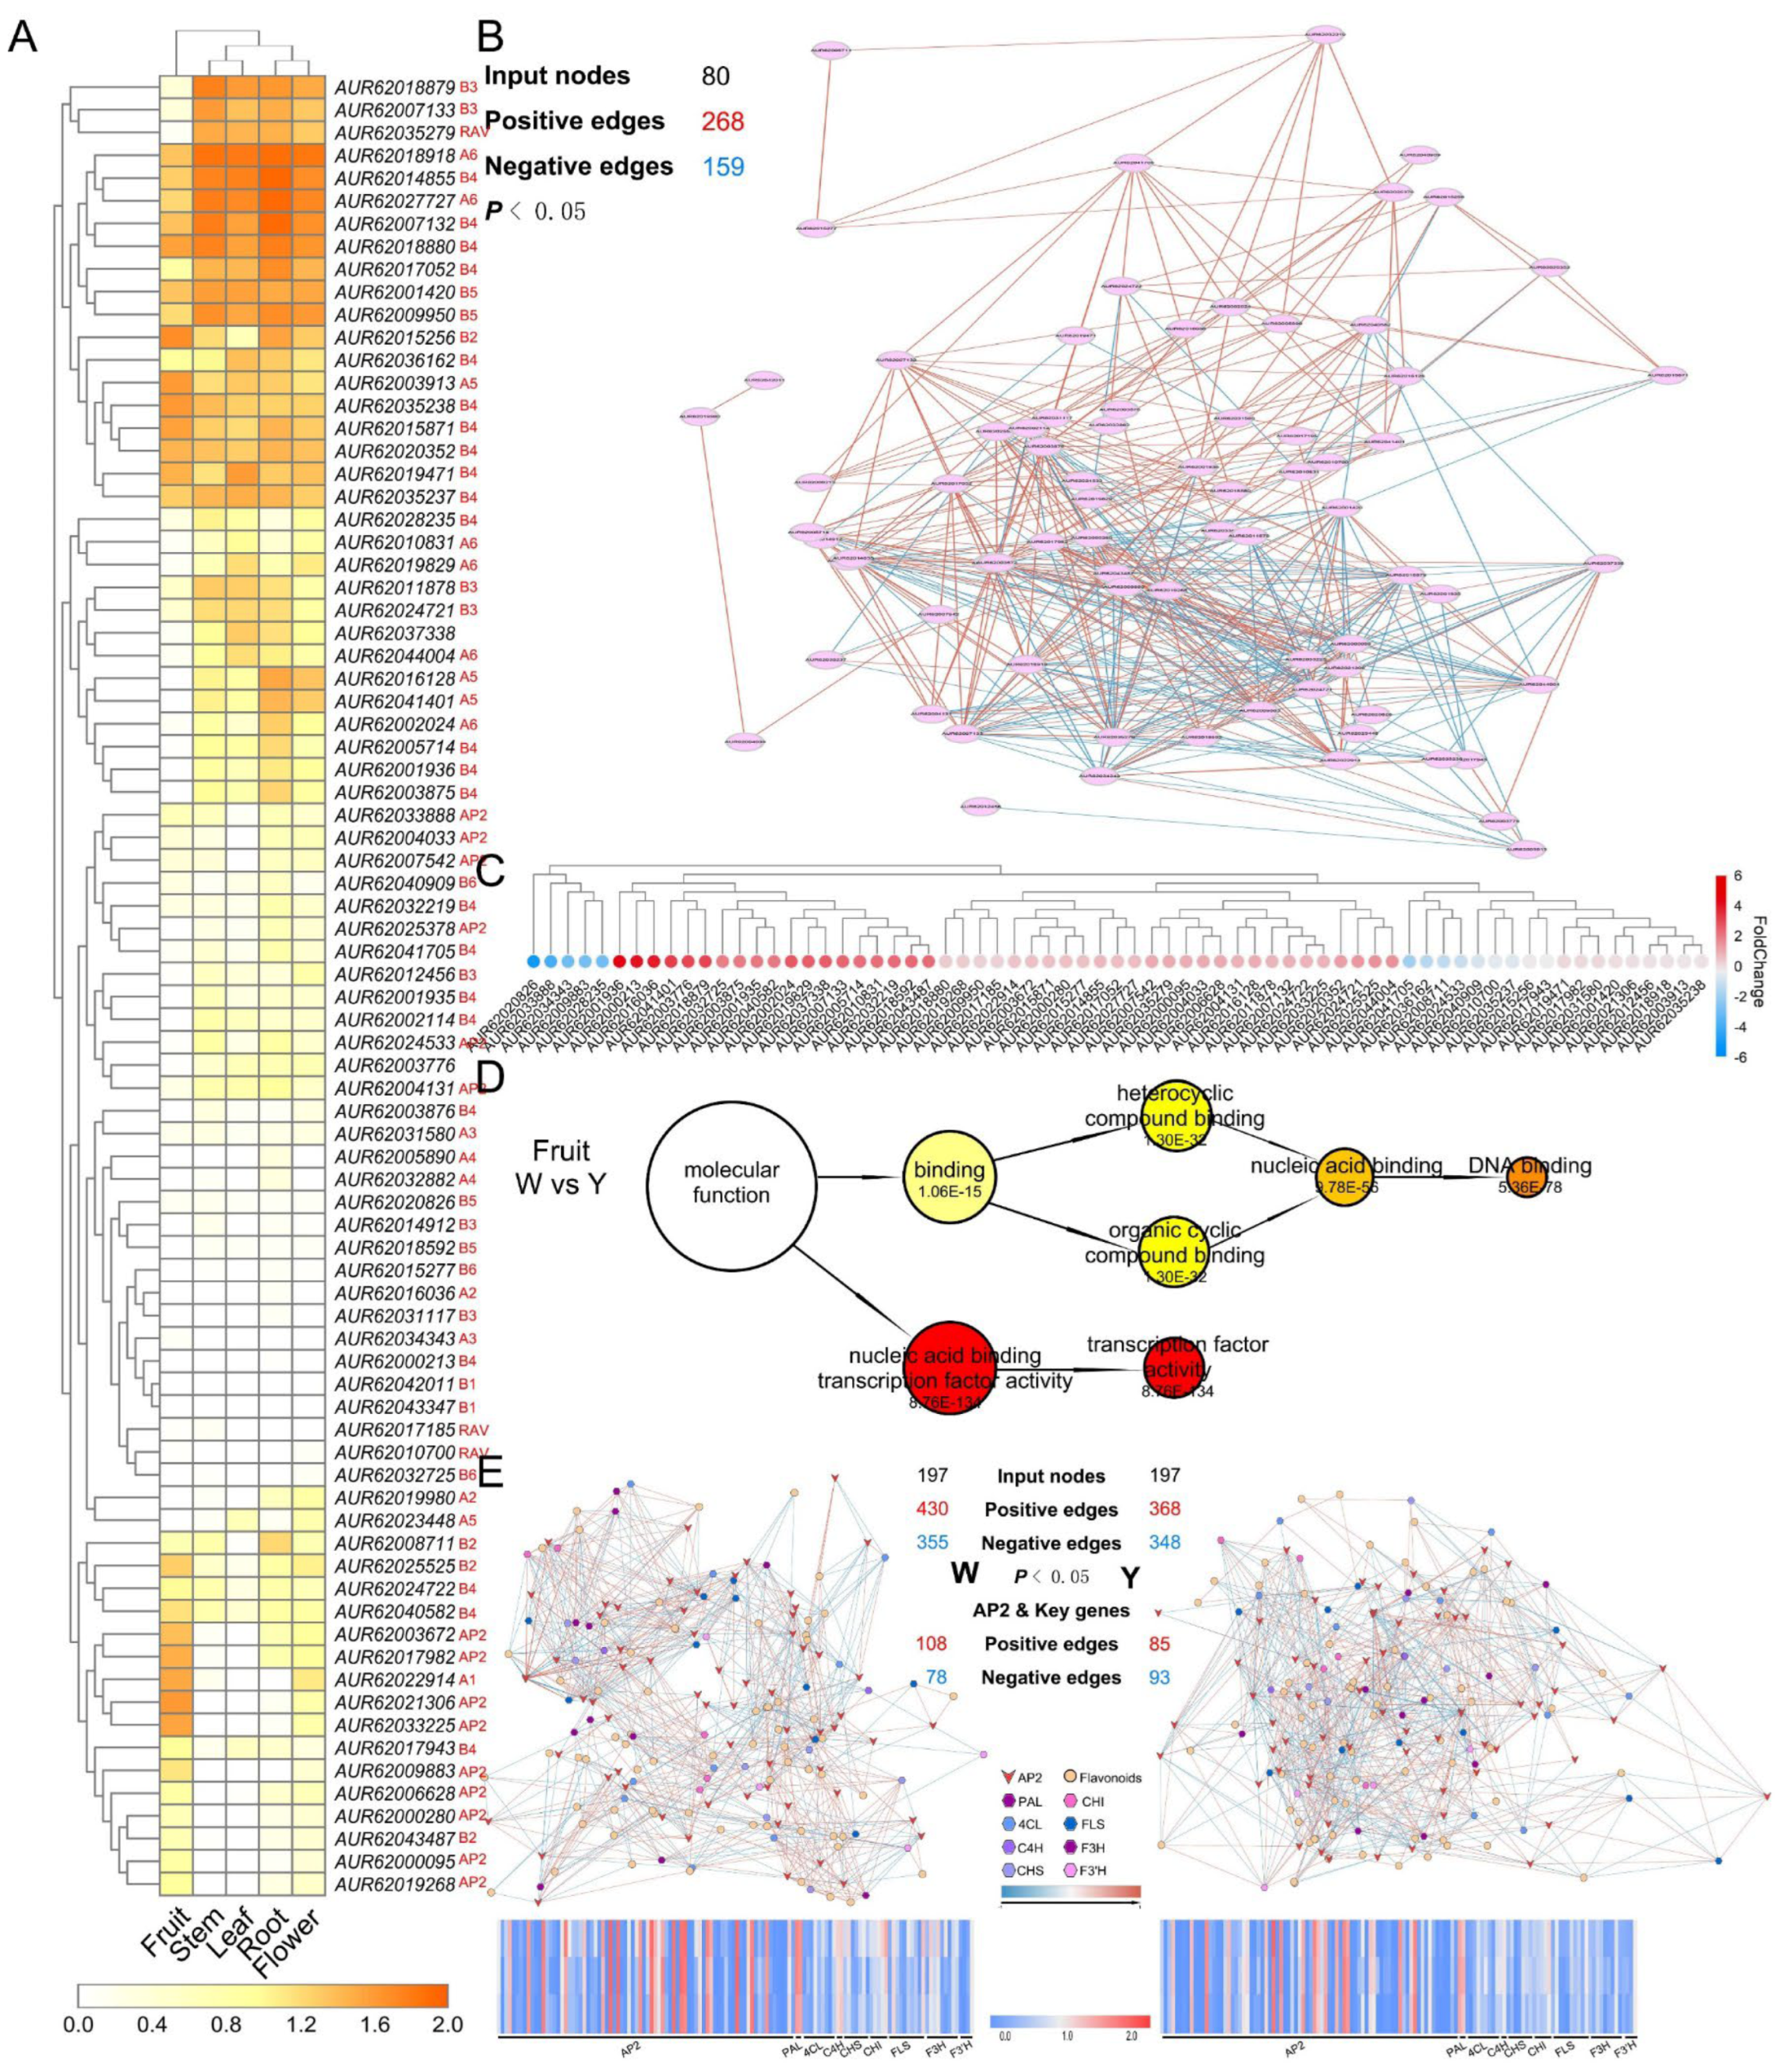
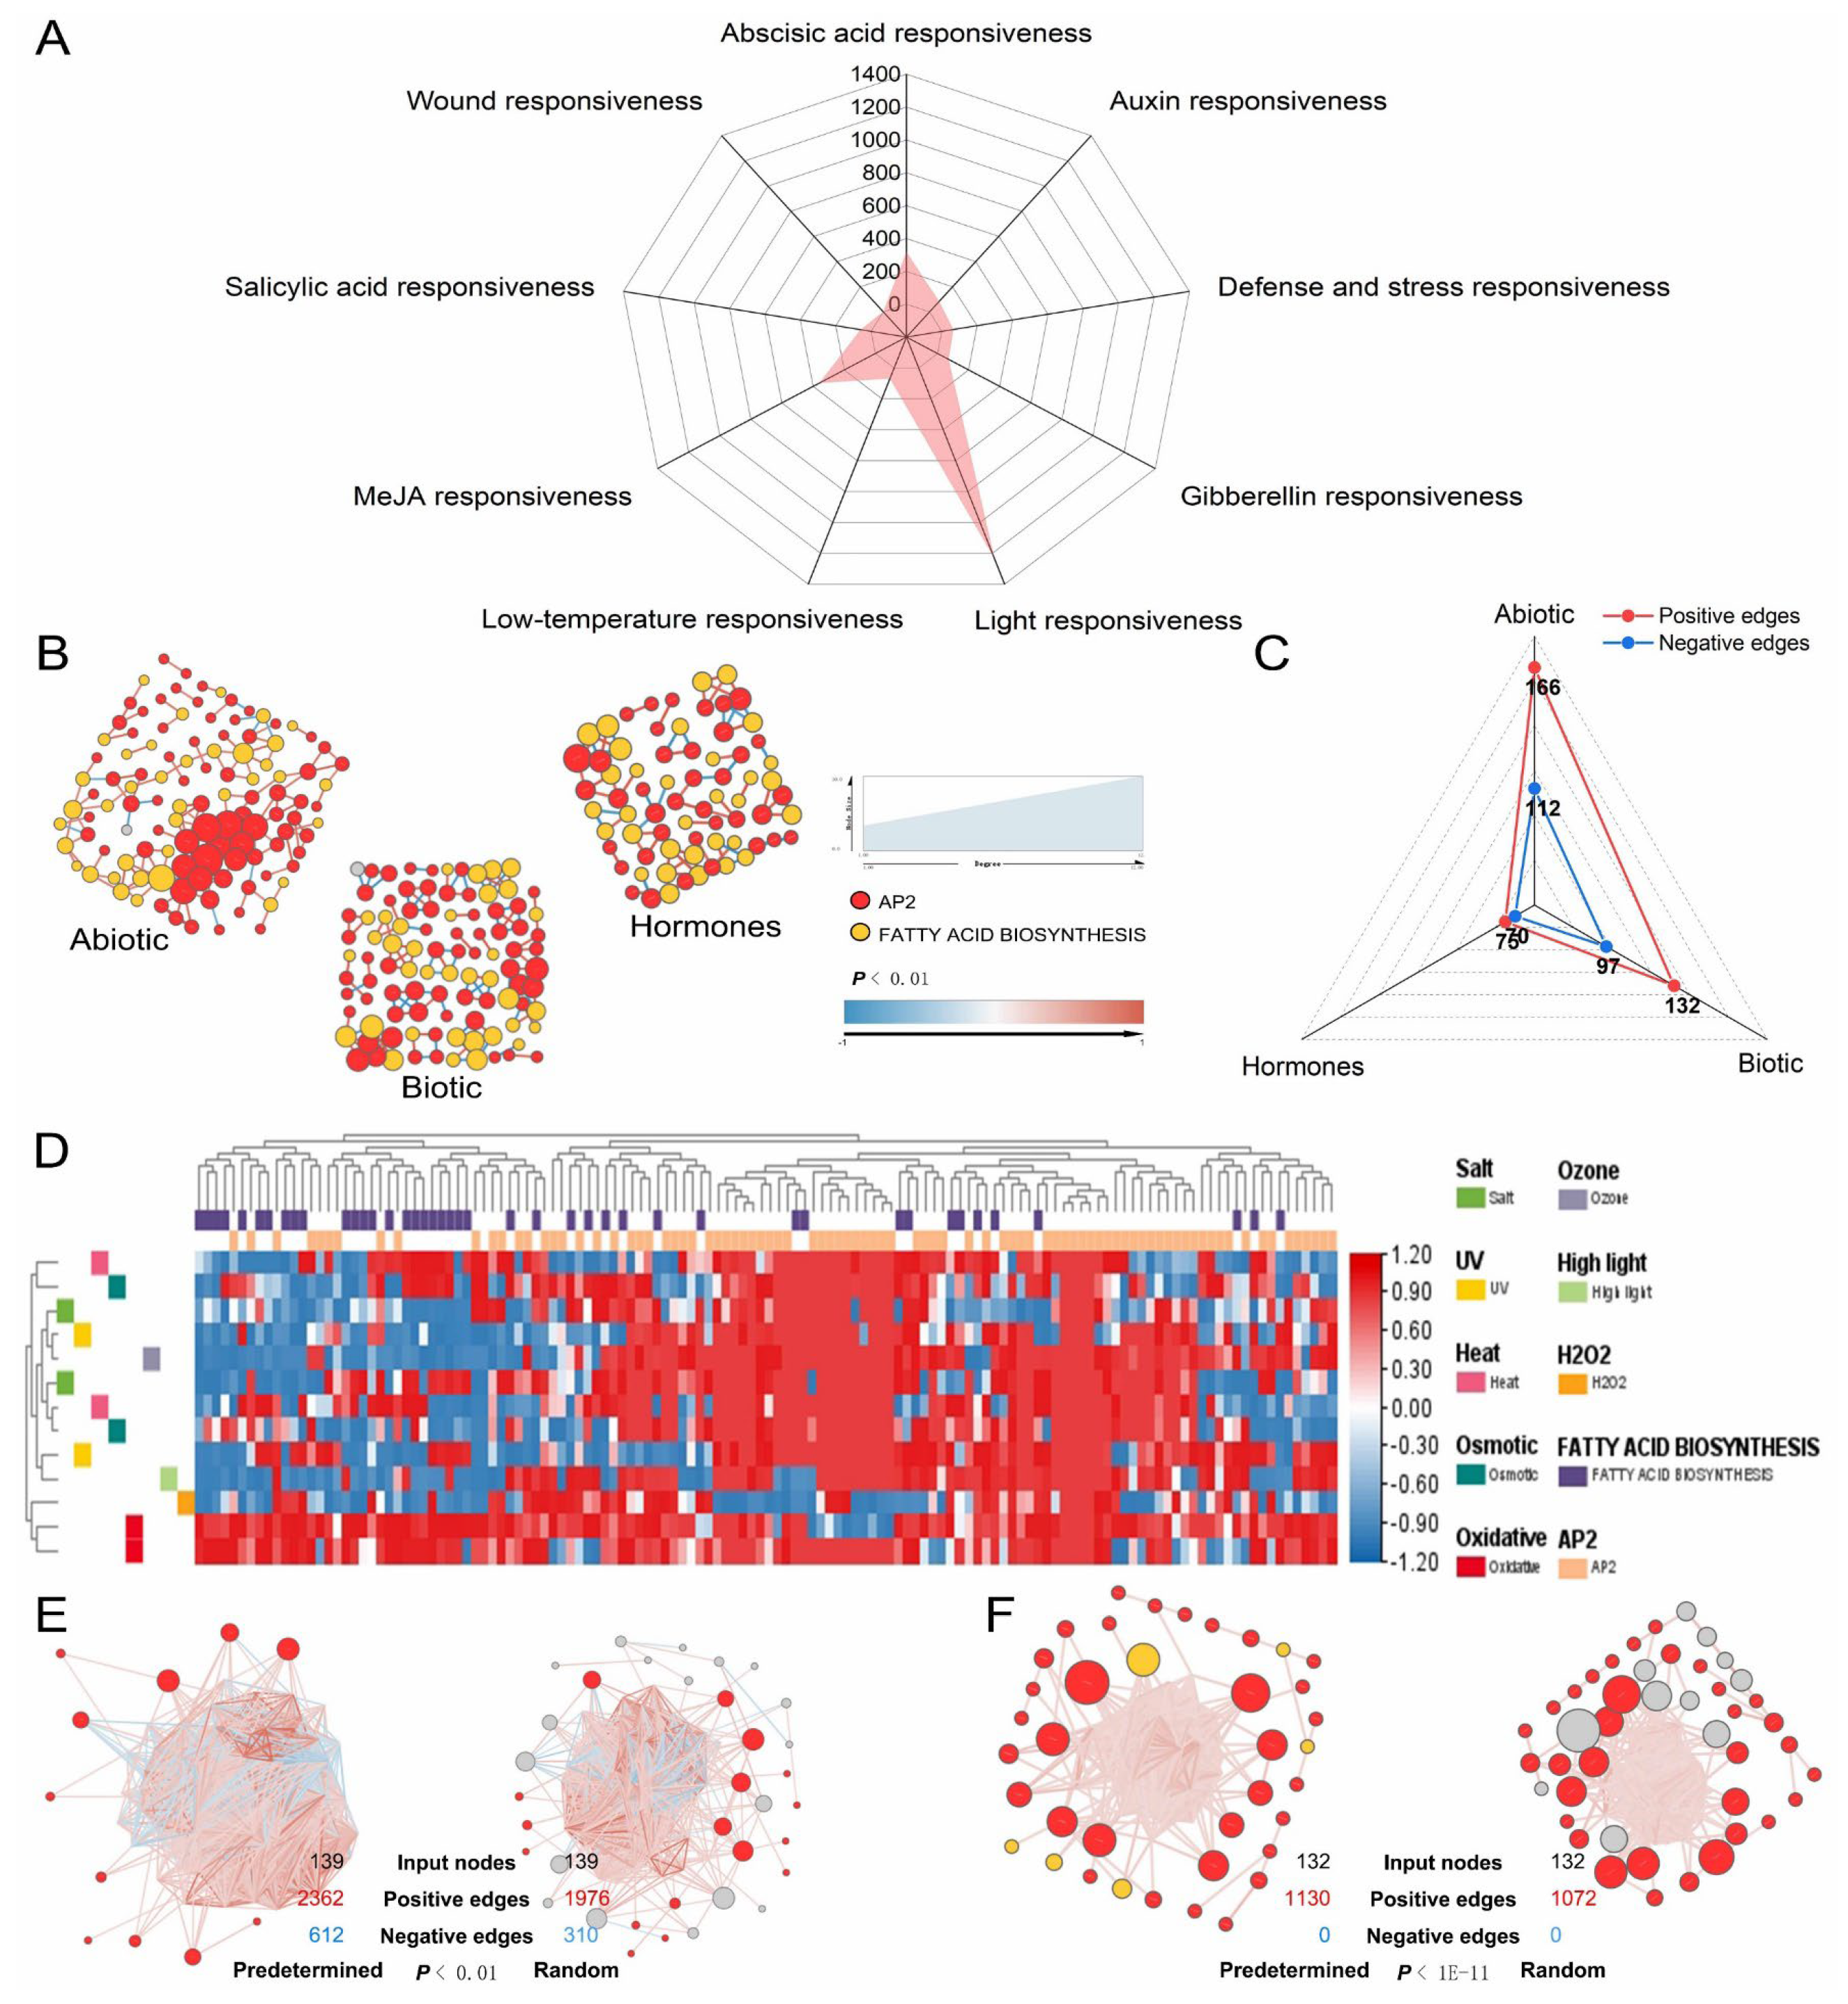
3.6. Polyploidy-Related CqAP2/ERFs May Promote Environmental Adaptability by Regulating the Fatty Acid Synthesis Pathway

To explore the potential functions of polyploidy-related CqAP2/ERFs, we analyzed the expression profiles of 80 CqAP2/ERFs using quinoa transcriptomic data. All 80 genes were expressed in at least one tissue, with 52 showing tissue-wide expression (Figure 11A, Table S13). Expression patterns varied significantly within subfamilies. For example, CqAP2/ERFs from the B4 subfamily were divided into distinct expression branches, while AUR62015871 and AUR62020352, homologous to AT3G20310, exhibited similar expression patterns, suggesting potential functional redundancy (Figure 11A,B). Correlation analysis further confirmed strong transcriptional relationships among most CqAP2/ERFs (p < 0.05).
A significant difference in lipid content was observed between white and yellow quinoa fruits, with yellow quinoa fruits showing higher levels of fatty acids and lipids. These differences may reflect enhanced metabolic activity and stress adaptation associated with lipid biosynthesis. Prior studies have shown that the AP2 transcription factor WRINKLED1 plays a key role in oil accumulation in mature A. thaliana seeds, supporting the hypothesis that related CqAP2/ERFs contribute to fatty acid biosynthesis.
To investigate this further, we examined the expression of CqAP2/ERFs in white and yellow quinoa fruits. Among these, 25 CqAP2/ERFs were significantly upregulated in white quinoa fruits, while 44 showed lower expression compared to yellow quinoa fruits (Figure 11C, Table S14). qRT-PCR analysis validated these expression patterns, demonstrating consistency with transcriptomic data (Figure S3).
Gene Ontology (GO) analysis of differentially expressed CqAP2/ERFs revealed enrichment in transcriptional regulation and molecular function pathways (Figure 11D). Similar enrichment patterns were observed across other tissues of white and yellow quinoa, indicating a conserved regulatory role for these genes (Figure S4). These results suggest that CqAP2/ERFs play critical roles in controlling fatty acid biosynthesis pathways.
To further elucidate their involvement, we analyzed the correlation network between differentially expressed CqAP2/ERFs and key fatty acid biosynthesis genes. A strong correlation was identified for both white and yellow quinoa fruits, with a more robust network observed in yellow quinoa fruits (p < 0.05) (Figure 11E, Table S15). This enhanced correlation in yellow quinoa may be associated with its higher lipid content.
In summary, polyploidy-related CqAP2/ERFs exhibit distinct expression patterns and are differentially expressed between white and yellow quinoa fruits. Their strong association with fatty acid biosynthesis genes highlights their potential as key regulators of lipid metabolism, contributing to quinoa’s adaptability to environmental stress.

3.7. General Applicability Network of AP2/ERFs and Fatty Acid Pathway Genes

To assess the broader applicability of the correlation network between AP2/ERFs and the fatty acid synthesis pathway, we analyzed its presence in Arabidopsis thaliana. The promoters of AtAP2/ERFs contain numerous stress-responsive elements, indicating that these genes likely play essential roles in environmental stress responses (Figure 12A, Table S12). Previous studies have associated AtAP2/ERFs with various environmental pathways, with notable enrichment in the fatty acid synthesis pathway (Figure 10H, Table S11).
We further examined the correlation network between AtAP2/ERFs and key fatty acid synthesis genes under hormone, biotic, and abiotic stress conditions (Figure 12B, Tables S16 and S17). Our analysis revealed strong correlations under all conditions, with the most robust network observed during abiotic stress, suggesting that AtAP2/ERFs play a pivotal role in stress adaptation (Figure 12B,C, Table S17).
Transcriptional patterns of AtAP2/ERFs and key fatty acid synthesis genes were evaluated under various abiotic treatments. Notably, some genes exhibited consistent responses across multiple treatments, emphasizing their potential importance in stress resilience (Figure 12D, Table S16).
To validate the conserved correlations of this network, we analyzed transcript levels of AP2/ERFs and fatty acid pathway genes across 144 A. thaliana accessions. The analysis identified a robust network between these genes, which was absent in a random gene set (p < 1×10⁻6, Student’s t-test) (Figure 12E, Table S17). This finding indicates that the regulation of fatty acid biosynthesis by AP2/ERFs is conserved across diverse accessions, highlighting its significance in stress response mechanisms [23].
Further validation using the A. thaliana 1001 Genomes and OneKP projects confirmed the robustness of this network (p < 1 × 10⁻⁶, Student’s t-test) (Figure 12F and Figure S5, Table S17). These results demonstrate that AP2/ERFs are integral components of the fatty acid regulatory network and play a critical role in regulating fatty acid biosynthesis, particularly under stress conditions [19].

4. Discussion

4.1. The Evolution of Auxiliary Motifs in AP2/ERFs and Their Neofunctionalization

AP2/ERFs in angiosperms share a conserved domain structure yet exhibit diverse roles in growth and development. Understanding the mechanisms underlying their functional diversification remains a critical question in plant biology. The EAR motif, located in the disordered C-terminal region, has been shown to mediate interactions between regulatory proteins, such as CONSTANS and the AP2/ERF family member TOE in Arabidopsis thaliana. Widely recognized as a key repression element, the EAR motif frequently appears in proteins involved in hormone signaling and stress responses. By recruiting corepressors and regulatory complexes, it enables the negative regulation of genes associated with diverse physiological and developmental pathways, underscoring its central role in coordinating plant responses to environmental and endogenous signals.
Motif analysis across different AP2/ERF subfamilies revealed considerable variation in the distribution of EAR motifs. Subfamilies such as AP2 (orthogroup 1), A2 (orthogroup 4), A6 (orthogroup 3), A5 (orthogroups 8 and 9), and B3 (orthogroup 6) universally contain EAR motifs, suggesting a conserved role in transcriptional repression and stress response (Table S3). However, several EAR motifs are species-specific. For example, motif 10 in the A3 subfamily (orthogroup 5) is restricted to Chenopodium quinoa and Olea europaea, while the same motif in the A1 subfamily (orthogroup 7) is found only in A. thaliana, Aquilegia coerulea, Lactuca sativa, and Helianthus annuus (Figure S1, Table S3). These findings suggest that the gain or loss of EAR motifs during evolution contributes to species-specific functional specialization, potentially reflecting selection pressures to optimize transcriptional regulation under distinct ecological contexts.
Beyond the EAR motifs, additional conserved motifs were identified across subfamilies, including previously uncharacterized auxiliary motifs. For instance, motifs 3, 4, and 7 were detected in the B3 subfamily (orthogroup 2), complementing the well-documented motif 1 (Table S3). These uncharacterized motifs may play roles in post-translational modifications, protein–protein interactions, or transcriptional regulation. Notably, the independent loss of conserved motifs was observed in multiple AP2/ERF subfamilies, with certain motifs appearing exclusively in dicotyledons. This pattern suggests that the gain and loss of auxiliary motifs are common evolutionary events, potentially driving functional diversification and adaptation across species.
The loss of specific motifs in transcription factors often results in functional shifts or neofunctionalization. In the context of AP2/ERFs, such evolutionary changes likely enhance their ability to regulate species-specific biological processes. Further investigation into the roles of these auxiliary motifs could provide valuable insights into the mechanisms underlying transcription factor evolution and adaptation.

4.2. AP2/ERFs Generated by Amplification May Facilitate Environmental Adaptation

Gene-family proliferation in transcription-factor superfamilies frequently reflects a composite duplication history rather than a single evolutionary event. Our comparative analysis indicates that, although whole-genome duplication (WGD) supplied an initial reservoir of AP2/ERF loci in several lineages, the present-day repertoire of tens to hundreds of paralogs is chiefly attributable to small-scale gene-amplification processes—namely segmental and tandem duplications [6,20,37]. This conclusion is underscored by diploid species such as Olea europaea and Actinidia chinensis, each of which retains >95% duplicated AP2/ERFs despite the absence of recent WGD. These lineage-specific amplifications have been followed by differential retention and regulatory divergence, producing the observed functional diversity within the superfamily. Therefore, the expansion of AP2/ERF genes to “tens of paralogs” in both diploid and polyploid plants should be viewed as the cumulative outcome of successive gene-amplification events layered upon earlier genome duplications, rather than as a direct product of polyploidy alone. In our dataset, several stress-responsive CqAP2/ERF paralogs (for example, CqAP2-AUR62015871 and CqAP2-AUR62020352) display seed-biased expression, while their co-orthologs are leaf- or root-dominant, suggesting a division of labor that fine-tunes fatty acid metabolism in distinct tissues. Mounting evidence indicates that retaining multiple gene paralogs confers substantial adaptive advantages under fluctuating environments. Segmental or tandem duplications can be rapidly fixed when plants face drought, salinity, or nutrient deprivation because extra gene copies provide dosage flexibility and opportunities for sub- or neofunctionalization [2,32,33,34,35,36,38].
Amplification is strongly linked to the expansion of gene families involved in stress responses, providing plants with enhanced adaptability to environmental challenges. The AP2/ERF family, which regulates plant development, metabolism, and stress resistance, expanded significantly in polyploid plants (Figure 2). WGDs generate additional gene copies that serve as a substrate for functional diversification, enabling polyploid plants to better respond to diverse environmental stresses. Notably, polyploid plants often exhibit greater resilience to environmental challenges than their diploid counterparts, underscoring the role of gene duplication in adaptive evolution [14,16,17,19].
The overrepresentation of AP2/ERFs in polyploid-related gene groups highlights the putative role of WGDs in driving their expansion, surpassing other mechanisms of gene duplication (Figure 2). This finding suggests that AP2/ERFs are integral to enhancing plant stress resistance. However, the adaptability of polyploid plants appears to depend more on changes in gene expression patterns after amplification than on mere increases in gene copy number [39,40]. For instance, in Chenopodium quinoa, all CqAP2/ERFs originated from amplification, and their diverse expression patterns within subfamilies likely contribute to quinoa’s adaptability across different ecological conditions (Figure 11A).
Notably, the expanded AP2 subfamily in quinoa establishes a robust correlation network with the fatty acid synthesis pathway, which is critical for stress adaptation. This suggests that the post-amplification expansion of CqAP2 subfamily genes promotes environmental adaptation by enhancing fatty acid synthesis. Similar findings in Arabidopsis thaliana indicate that AtAP2/ERFs are also involved in the fatty acid pathway. Under abiotic stress, AtAP2/ERFs form a strong correlation network with key fatty acid synthesis genes, further confirming their role as central regulators of the fatty acid synthesis network and their contribution to plant stress resistance (Figure 12).
Finally, transcriptome analyses across plant populations have validated the essential role of AP2/ERFs in regulating fatty acid biosynthesis and promoting environmental adaptation (Figure S5). Future studies should focus on experimentally verifying the molecular mechanisms by which AP2/ERFs regulate fatty acid synthesis and mediate environmental stress responses. Expanding this research to other polyploid species will further elucidate the role of AP2/ERFs in adaptive evolution and reveal potential applications in crop improvement and stress tolerance engineering [36,37,39,41,42,43].

4.3. Comparative Perspectives and Breeding Prospects of AP2/ERF Expansion

While our integrative approach uncovers a robust AP2/ERF–FA regulatory module in C. quinoa, several limitations merit acknowledgment. First, the evidence is largely correlative; functional validation through gene editing or transgenics will be essential to confirm causality [1,3,5,6]. Second, our taxon sampling, though spanning 15 genomes, omits key polyploids such as hexaploid Triticum aestivum and allotetraploid Gossypium hirsutum, so broader generalization awaits future surveys. Third, public RNA-seq data for quinoa emphasize drought and salinity; heat and biotic stresses remain under-represented.
Despite these constraints, the quinoa AP2/ERF expansion pattern differs markedly from oilseed Brassica napus (ERF-biased), tetraploid cotton (balanced retention), and potato (moderate expansion). Notably, only in quinoa do expanded AP2 subfamily members form direct promoter-binding and protein-interaction links with core FA-biosynthetic genes. This suggests a unique neofunctionalization in which lipid metabolism is co-opted for abiotic stress tolerance [41,42,43,44].
These insights are immediately transferable to breeding. High-confidence AP2/ERF candidates (e.g., CqAP2-AUR62015871, AUR62020352) can serve as markers for selecting high-oil, stress-tolerant quinoa lines. CRISPR-based activation of orthologous AP2/ERFs in B. napus or G. hirsutum offers a targeted route to enhance membrane stability under stress without yield penalties. Finally, integrating AP2/ERF–FA network single-nucleotide polymorphisms into genomic-selection models promises to accelerate the development of multi-stress-resistant, nutritionally superior polyploid cultivars.

5. Conclusions

This study provides new insights into the mechanisms driving the expansion, contraction, and functional evolution of AP2/ERFs in polyploid plants, including key agricultural and model species. Our findings emphasize their critical roles in adaptive evolution under environmental stress. Specifically, we demonstrate that polyploidy facilitates the expansion of AP2/ERFs associated with environmental responses, enhancing plants’ adaptability to dynamic environmental conditions. This conclusion is supported by genomic and transcriptomic evidence highlighting the overrepresentation of AP2/ERFs in polyploid-related gene groups and their correlation with stress-adaptive traits. Genome collinearity and evolutionary selection analyses revealed that while the core functions of AP2/ERFs are conserved across species, lineage-specific adaptations have driven functional diversification. This conservation underscores the essential role of AP2/ERFs in maintaining fundamental regulatory processes while enabling plants to adapt to distinct ecological niches. Our results also highlight the extensive involvement of polyploidy-related AP2/ERFs in regulating the fatty acid synthesis pathway, a critical mechanism for stress tolerance. Strong transcriptional correlations with key biosynthesis genes suggest that AP2/ERFs act as central regulators within this pathway, enhancing the resilience of polyploid plants to environmental challenges. This linkage underscores the importance of fatty acid metabolism in supporting stress adaptation and promoting evolutionary success in polyploid plants. Overall, this study integrates genomic, transcriptomic, and evolutionary approaches to establish a comprehensive systems biology framework for understanding how AP2/ERFs, particularly in polyploid plants, drive environmental adaptation. Future research should focus on experimentally validating these findings, elucidating the molecular mechanisms underlying AP2/ERF-mediated regulation of fatty acid metabolism, and exploring their applications in improving crop resilience and stress tolerance.

Supplementary Materials

The following supporting information can be downloaded at: https://www.mdpi.com/article/10.3390/agronomy15051112/s1, The online version contains supplementary figures and tables available. Figure S1: Phylogenetic relationship and motif compositions of multispecies AP2/ERFs in different subfamilies. Figure S2: GO enrichment analysis of interacting proteins in CF-MS and DAP-seq datasets. Figure S3: The gene expression of CqAP2/ERFs in two kinds of quinoa fruits. Figure S4: Analysis of molecular functions enriched by differentially expressed CqAP2/ERFs in different tissues of two kinds of quinoa. Table S1. Number of genes of each species in each orthogroup. Table S2. Gene IDs of different species in all orthogroups. Table S3. List of the sequences and lengths of conserved motifs of AP2/ERF family in this study. Table S4. Correlation analysis and KS of segmental duplicate AP2/ERF gene pairs in Arabidopsis, quinoa, Tartary buckwheat, and potato. Table S5. Summary of four duplication types of genes in 15 representative species. Table S6. Correlation network and KaKs of comparative synteny gene pairs of Arabidopsis, quinoa, Tartary buckwheat, and potato. Table S7. List of AtAP2/ERFs that can alter the plant phenotype after mutation and CqAP2/ERFs, FtAP2/ERFs, and StAP2/ERFs mapped to AtAP2/ERFs. Table S8. Interactions between AP2/ERFs and other proteins in Arabidopsis, rice, and quinoa identified by CF-MS and their conserved protein complexes. Table S9. Analysis of Arabidopsis orthogroups with CF-MS scores above 0.2 and interaction analysis using 144 Arabidopsis accessions and Arabidopsis 1001 Genomes Project analyses. Table S10. DAP-seq determination of the number of target genes bound to each AtAP2/ERF and GO enrichment analysis of target genes. Table S11. Predicting the function of AtAP2/ERFs using multiple A. thaliana RNA-seq data. Table S12. Summary of cis-acting elements in AP2/ERF gene promoters of quinoa and Arabidopsis thaliana. Table S13. Expression and correlation of CqAP2/ERFs in different tissues. Table S14. Differential expression of CqAP2/ERFs in white and yellow quinoa fruits. Table S15. Expression of CqAP2/ERFs and fatty acids contents in white and yellow quinoa fruits and the correlation analysis of CqAP2/ERFs and key fatty acid genes and fatty acids. Table S16. Transcriptome data of Arabidopsis AP2/ERF genes and key fatty acid genes under different environment stresses. Table S17. Correlation network analysis of the expression levels of AtAP2/ERFs and key fatty acid genes under various environmental stresses and in Arabidopsis thaliana population transcriptome. Table S18. List of the primers for qRT-PCR in this study.

Author Contributions

M.L. planned and designed the research. J.D. and M.Y. analyzed data. J.D. and H.L. wrote the original manuscript. M.Y. and H.L. identified the AP2/ERF family of multiple species and visualized structures of CqAP2/ERFs. G.Z. and J.D. determined the duplication types of multispecies AP2/ERFs. H.L. and D.Z. performed chromosome distribution, gene duplication, and synteny analysis of CqAP2/ERFs. D.Z. performed correlation analysis of AP2/ERFs and fatty acid pathways in quinoa, A. thaliana, and A. thaliana populations. Z.Y. and X.L. performed phenotype analysis of A. thaliana and quinoa AP2/ERF mutants. M.L. and J.D. revised the manuscript. M.L. supervised the research. All authors have read and agreed to the published version of the manuscript.

Funding

This research was sponsored by the National Natural Science Foundation of China (grant IDs 32101682, 32170333, 32360414, 32122076), the Scientific and Technological Innovation Team of Hainan Academy of Agricultural Sciences (grant ID HAAS2023TDYD05), the Hainan Province Science and Technology Talent Innovation Project (grant ID KJRC2023C24), and the Basic Scientific Research Business Expenses of HAAS (grant ID ITH2024ZD02).

Data Availability Statement

The public transcriptomic data of the focal species were downloaded from the National Center for Biotechnology Information (NCBI) (https://www.ncbi.nlm.nih.gov/, accessed on 5 March 2025). We also acquired DAP-seq and CF-MS datasets for A. thaliana, as well as 144 natural A. thaliana accessions (GEO: GSE43858), the A. thaliana 1001 Genomes Project (GEO: GSE80744), and the OneKP Project transcriptome datasets. Origin Pro 2021 software (OriginLab Corporation) was used to analyze experimental data and draw figures. Supplementary Materials (methods, figures, tables, graphical abstract, slides, videos, Chinese-translated version, and updated materials) may be found at the online DOI. The original contributions presented in this study are included in the article/Supplementary Material. Further inquiries can be directed to the corresponding author(s).

Acknowledgments

We thank all colleagues in our laboratory for providing useful discussions and technical assistance.

Conflicts of Interest

The authors declare no conflicts of interest.

References

  1. Guyomarc’h, S.; Boutté, Y.; Laplaze, L. AP2/ERF transcription factors orchestrate very long chain fatty acid biosynthesis during Arabidopsis lateral root development. Mol. Plant 2021, 14, 205–207. [Google Scholar] [CrossRef] [PubMed]
  2. Lu, H.; Xue, L.; Cheng, J.; Yang, X.; Xie, H.; Song, X.; Qiang, S. Polyploidization-driven differentiation of freezing tolerance in Solidago canadensis. Plant Cell Environ. 2020, 43, 1394–1403. [Google Scholar] [CrossRef] [PubMed]
  3. Liu, S.; Li, K.; Dai, X.; Qin, G.; Lu, D.; Gao, Z.; Li, X.; Song, B.; Bian, J.; Ren, D.; et al. A telomere-to-telomere genome assembly coupled with multi-omic data provides insights into the evolution of hexaploid bread wheat. Nat. Genet. 2025, 57, 1008–1020. [Google Scholar] [CrossRef] [PubMed]
  4. Soltis, P.S.; Soltis, D.E. Ancient WGD events as drivers of key innovations in angiosperms. Curr. Opin. Plant Biol. 2016, 30, 159–165. [Google Scholar] [CrossRef]
  5. Liu, M.; Yu, J.; Yang, M.; Cao, L.; Chen, C. Adaptive evolution of chloroplast division mechanisms during plant terrestrialization. Cell Rep. 2024, 43, 113950. [Google Scholar] [CrossRef]
  6. Xu, L.; Yang, L.; Li, A.; Guo, J.; Wang, H.; Qi, H.; Li, M.; Yang, P.; Song, S. An AP2/ERF transcription factor confers chilling tolerance in rice. Sci. Adv. 2024, 10, eado4788. [Google Scholar] [CrossRef]
  7. Jiao, Y.; Wickett, N.J.; Ayyampalayam, S.; Chanderbali, A.S.; Landherr, L.; Ralph, P.E.; Tomsho, L.P.; Hu, Y.; Liang, H.; Soltis, P.S.; et al. Ancestral polyploidy in seed plants and angiosperms. Nature 2011, 473, 97–100. [Google Scholar] [CrossRef]
  8. Xie, Z.; Nolan, T.M.; Jiang, H.; Yin, Y. AP2/ERF Transcription Factor Regulatory Networks in Hormone and Abiotic Stress Responses in Arabidopsis. Front. Plant Sci. 2019, 10, 228. [Google Scholar] [CrossRef]
  9. Wang, Z.; Miao, L.; Chen, Y.; Peng, H.; Ni, Z.; Sun, Q.; Guo, W. Deciphering the evolution and complexity of wheat germplasm from a genomic perspective. J. Genet. Genom. 2023, 50, 846–860. [Google Scholar] [CrossRef]
  10. Yu, H.; Liao, J.; Jiang, Y.; Zhong, M.; Tao, S.; Chai, S.; Wang, L.; Lin, L.; Yang, R.; Deng, X.; et al. Ecotype-specific phenolic acid accumulation and root softness in Salvia miltiorrhiza are driven by environmental and genetic factors. Plant Biotechnol. J. 2025. [Google Scholar] [CrossRef]
  11. Münzbergová, Z.; Haisel, D. Effects of polyploidization on the contents of photosynthetic pigments are largely population-specific. Photosynth. Res. 2019, 140, 289–299. [Google Scholar] [CrossRef]
  12. Chen, Y.; Cui, Q.; Xu, Y.; Yang, S.; Gao, M.; Wang, Y. Effects of tung oilseed FAD2 and DGAT2 genes on unsaturated fatty acid accumulation in Rhodotorula glutinis and Arabidopsis thaliana. Mol. Genet. Genom. 2015, 290, 1605–1613. [Google Scholar] [CrossRef]
  13. Zuo, S.; Guo, X.; Mandáková, T.; Edginton, M.; Al-Shehbaz, I.A.; Lysak, M.A. Genome diploidization associates with cladogenesis, trait disparity, and plastid gene evolution. Plant Physiol. 2022, 190, 403–420. [Google Scholar] [CrossRef] [PubMed]
  14. Magar, M.M.; Liu, H.; Yan, G. Genome-Wide Analysis of AP2/ERF Superfamily Genes in Contrasting Wheat Genotypes Reveals Heat Stress-Related Candidate Genes. Front. Plant Sci. 2022, 13, 853086. [Google Scholar] [CrossRef]
  15. Xiao, L.; Ren, J.-Z.; Li, Q.; Yang, B.; Liu, Z.-J.; Chen, R.-B.; Zhang, L. Genome-wide analysis of AP2/ERF superfamily in Isatis indigotica. J. Integr. Med. 2023, 21, 77–88. [Google Scholar] [CrossRef]
  16. Ghorbani, R.; Zakipour, Z.; Alemzadeh, A.; Razi, H. Genome-wide analysis of AP2/ERF transcription factors family in Brassica napus. Physiol. Mol. Biol. Plants 2020, 26, 1463–1476. [Google Scholar] [CrossRef]
  17. Nakano, T.; Suzuki, K.; Fujimura, T.; Shinshi, H. Genome-Wide Analysis of the ERF Gene Family in Arabidopsis and Rice. Plant Physiol. 2006, 140, 411–432. [Google Scholar] [CrossRef]
  18. Zhao, M.; Haxim, Y.; Liang, Y.; Qiao, S.; Gao, B.; Zhang, D.; Li, X. Genome-wide investigation of AP2/ERF gene family in the desert legume Eremosparton songoricum: Identification, classification, evolution, and expression profiling under drought stress. Front. Plant Sci. 2022, 13, 885694. [Google Scholar] [CrossRef]
  19. Liu, M.; Xu, Y.; Song, Y.; Fan, D.; Li, J.; Zhang, Z.; Wang, L.; He, J.; Chen, C.; Ma, C. Hierarchical Regulatory Networks Reveal Conserved Drivers of Plant Drought Response at the Cell-Type Level. Adv. Sci. 2025, e2415106. [Google Scholar] [CrossRef]
  20. Aanniz, T.; El Baaboua, A.; Aboulaghras, S.; Bouyahya, A.; Benali, T.; Balahbib, A.; El Omari, N.; Butnariu, M.; Muzammil, K.; Yadav, K.K.; et al. Impact of water stress to plant epigenetic mechanisms in stress and adaptation. Physiol. Plant. 2025, 177, e70058. [Google Scholar] [CrossRef]
  21. Landis, J.B.; Soltis, D.E.; Li, Z.; Marx, H.E.; Barker, M.S.; Tank, D.C.; Soltis, P.S. Impact of whole-genome duplication events on diversification rates in angiosperms. Am. J. Bot. 2018, 105, 348–363. [Google Scholar] [CrossRef] [PubMed]
  22. Wang, M.; Gao, M.; Zhao, Y.; Chen, Y.; Wu, L.; Yin, H.; Xiong, S.; Wang, S.; Wang, J.; Yang, Y.; et al. LcERF19, an AP2/ERF transcription factor from Litsea cubeba, positively regulates geranial and neral biosynthesis. Hortic. Res. 2022, 9, uhac093. [Google Scholar] [CrossRef] [PubMed]
  23. Xie, W.; Ding, C.; Hu, H.; Dong, G.; Zhang, G.; Qian, Q.; Ren, D. Molecular Events of Rice AP2/ERF Transcription Factors. Int. J. Mol. Sci. 2022, 23, 12013. [Google Scholar] [CrossRef] [PubMed]
  24. Paul, P.; Singh, S.K.; Patra, B.; Liu, X.; Pattanaik, S.; Yuan, L. Mutually Regulated AP2/ERF Gene Clusters Modulate Biosynthesis of Specialized Metabolites in Plants. Plant Physiol. 2020, 182, 840–856. [Google Scholar] [CrossRef]
  25. Kandhol, N.; Jain, M.; Tripathi, D.K. Nanoparticles as potential hallmarks of drought stress tolerance in plants. Physiol. Plant. 2022, 174, e13665. [Google Scholar] [CrossRef]
  26. Jeong, J.S.; Kim, Y.S.; Redillas, M.C.F.R.; Jang, G.; Jung, H.; Bang, S.W.; Choi, Y.D.; Ha, S.-H.; Reuzeau, C.; Kim, J.-K. OsNAC5 overexpression enlarges root diameter in rice plants leading to enhanced drought tolerance and increased grain yield in the field. Plant Biotechnol. J. 2013, 11, 101–114. [Google Scholar] [CrossRef]
  27. Parks, M.B.; Nakov, T.; Ruck, E.C.; Wickett, N.J.; Alverson, A.J. Phylogenomics reveals an extensive history of genome duplication in diatoms (Bacillariophyta). Am. J. Bot. 2018, 105, 330–347. [Google Scholar] [CrossRef]
  28. Gong, Z.; Xiong, L.; Shi, H.; Yang, S.; Herrera-Estrella, L.R.; Xu, G.; Chao, D.-Y.; Li, J.; Wang, P.-Y.; Qin, F.; et al. Plant abiotic stress response and nutrient use efficiency. Sci. China Life Sci. 2020, 63, 635–674. [Google Scholar] [CrossRef]
  29. Ma, N.; Sun, P.; Li, Z.-Y.; Zhang, F.-J.; Wang, X.-F.; You, C.-X.; Zhang, C.-L.; Zhang, Z. Plant disease resistance outputs regulated by AP2/ERF transcription factor family. Stress Biol. 2024, 4, 2. [Google Scholar] [CrossRef]
  30. He, M.; Qin, C.-X.; Wang, X.; Ding, N.-Z. Plant Unsaturated Fatty Acids: Biosynthesis and Regulation. Front. Plant Sci. 2020, 11, 390. [Google Scholar] [CrossRef]
  31. He, M.; Ding, N.-Z. Plant Unsaturated Fatty Acids: Multiple Roles in Stress Response. Front. Plant Sci. 2020, 11, 562785. [Google Scholar] [CrossRef]
  32. Feng, D.; Cheng, J.; Yang, X.; Tian, Z.; Liu, Y.; Zhang, Y.; Qiang, S. Polyploidization-enhanced effective clonal reproduction endows the successful invasion of Solidago canadensis. Ecol. Appl. 2024, 34, e2738. [Google Scholar] [CrossRef] [PubMed]
  33. Clo, J. Polyploidization: Consequences of genome doubling on the evolutionary potential of populations. Am. J. Bot. 2022, 109, 1213–1220. [Google Scholar] [CrossRef] [PubMed]
  34. Alix, K.; Gérard, P.R.; Schwarzacher, T.; Heslop-Harrison, J.S.P. Polyploidy and interspecific hybridization: Partners for adaptation, speciation and evolution in plants. Ann. Bot. 2017, 120, 183–194. [Google Scholar] [CrossRef]
  35. Liu, M.; Yang, M.; Liang, H.; Luo, B.; Deng, J.; Cao, L.; Zheng, D.; Chen, C. Polyploidy drives autophagy to participate in plant-specific functions. iMeta 2024, 3, e252. [Google Scholar] [CrossRef]
  36. Heslop-Harrison, J.S.P.; Schwarzacher, T.; Liu, Q. Polyploidy: Its consequences and enabling role in plant diversification and evolution. Ann. Bot. 2023, 131, 1–10. [Google Scholar] [CrossRef]
  37. Wang, X.; Liu, X.; Su, Y.; Shen, H. Rice Responses to Abiotic Stress: Key Proteins and Molecular Mechanisms. Int. J. Mol. Sci. 2025, 26, 896. [Google Scholar] [CrossRef]
  38. Zhang, Y.; Xu, J.; Li, R.; Ge, Y.; Li, Y.; Li, R. Plants’ Response to Abiotic Stress: Mechanisms and Strategies. Int. J. Mol. Sci. 2023, 24, 10915. [Google Scholar] [CrossRef]
  39. Hu, Z.; Wang, X.; Wei, L.; Wansee, S.; Rabbani Nasab, H.; Chen, L.; Kang, Z.; Wang, J. TaAP2-10, an AP2/ERF transcription factor, contributes to wheat resistance against stripe rust. J. Plant Physiol. 2023, 288, 154078. [Google Scholar] [CrossRef]
  40. Zhang, Y.; Ji, A.; Xu, Z.; Luo, H.; Song, J. The AP2/ERF transcription factor SmERF128 positively regulates diterpenoid biosynthesis in Salvia miltiorrhiza. Plant Mol. Biol. 2019, 100, 83–93. [Google Scholar] [CrossRef]
  41. Liu, W.; Zhang, R.; Xiang, C.; Zhang, R.; Wang, Q.; Wang, T.; Li, X.; Lu, X.; Gao, S.; Liu, Z.; et al. Transcriptomic and Physiological Analysis Reveal That α-Linolenic Acid Biosynthesis Responds to Early Chilling Tolerance in Pumpkin Rootstock Varieties. Front. Plant Sci. 2021, 12, 669565. [Google Scholar] [CrossRef]
  42. Zhang, L.; Wu, S.; Chang, X.; Wang, X.; Zhao, Y.; Xia, Y.; Trigiano, R.N.; Jiao, Y.; Chen, F. The ancient wave of polyploidization events in flowering plants and their facilitated adaptation to environmental stress. Plant Cell Environ. 2020, 43, 2847–2856. [Google Scholar] [CrossRef] [PubMed]
  43. Wang, X.; Tan, N.W.K.; Chung, F.Y.; Yamaguchi, N.; Gan, E.-S.; Ito, T. Transcriptional Regulators of Plant Adaptation to Heat Stress. Int. J. Mol. Sci. 2023, 24, 13297. [Google Scholar] [CrossRef]
  44. Ren, R.; Wang, H.; Guo, C.; Zhang, N.; Zeng, L.; Chen, Y.; Ma, H.; Qi, J. Widespread Whole Genome Duplications Contribute to Genome Complexity and Species Diversity in Angiosperms. Mol. Plant 2018, 11, 414–428. [Google Scholar] [CrossRef] [PubMed]
Figure 1. A TimeTree reflecting the divergence times of these 15 species was constructed on the TimeTree online website (upper left). The geologic timescale is shown on the (lower left). The orthogroups of AP2/ERF proteins identified from 15 species were inferred using OrthoFinder 2 (right). The total number of genes, the number of genes in the orthogroups, and the number of unassigned genes are provided. Rows represent species and columns represent the orthogroups. The orthogroups were named in turn as different subfamilies, including B4, AP2, B3, A6, A2, A3, A1, A5, B6, B2, RAV, A4, and B1, and unclassified subfamilies.
Agronomy 15 01112 g001
Figure 2. Expansion and contraction of the AP2/ERF gene family among 15 plant species. The red numbers represent the number of subgroups that underwent expansion, while the blue numbers represent the number of subgroups that underwent contraction (left). Expansion and contraction of the AP2 subfamily among 15 plant species (right).
Agronomy 15 01112 g002
Figure 3. Phylogenetic relationship and motif composition of multispecies AP2/ERFs of the AP2 subfamily. The ML tree was constructed using Mega7 under the JTT model. A total of 1000 bootstrap replications were conducted for support estimation. The motifs (numbered 1–10) are displayed in differently colored boxes. The sequence information for each motif is provided in Table S3.
Agronomy 15 01112 g003
Figure 4. Schematic representations of the interchromosomal relationships of AtAP2/ERFs. The colored lines indicate the synteny blocks in the quinoa genome.
Agronomy 15 01112 g004
Figure 5. Schematic representations of the interchromosomal relationships of CqAP2/ERF. The colored lines indicate the synteny blocks in the quinoa genome.
Agronomy 15 01112 g005
Figure 6. Schematic representations of the interchromosomal relationships of FtAP2/ERFs. The colored lines indicate the synteny blocks in the quinoa genome.
Agronomy 15 01112 g006
Figure 7. Schematic representations of the interchromosomal relationships of StAP2/ERFs. The colored lines indicate the synteny blocks in the quinoa genome.
Agronomy 15 01112 g007
Figure 8. (A) Correlation network of collinear AP2/ERF gene pairs in A. thaliana, C. quinoa, F. tataricum, and S. tuberosum. (B) Whole-genome duplications in A. thaliana, C. quinoa, F. tataricum, and S. tuberosum, as revealed by the Ks between syntenically orthologous genes. (C) Distribution of AP2/ERF duplication types in A. thaliana, C. quinoa, F. tataricum, and S. tuberosum. (D) Distribution of AP2/ERF duplication types of multispecies, including L. sativa, A. coerulea, A. trichopoda, B. vulgaris, Daucus carota, N. attenuata, O. sativa, A. chinensis, O. europaea, S. lycopersicum, and H. annuus.
Agronomy 15 01112 g008
Figure 9. (AG): (A) The synteny relationship between orthologous AP2/ERFs in A. thaliana, C. quinoa, F. tataricum, and S. tuberosum. Gray lines in the background indicate collinear blocks within quinoa and other plant genomes, while red lines highlight syntenic AP2/ERF gene pairs. (B) The Ka/Ks ratios of homologous AP2/ERF gene pairs within and between different species. (C) Clustering of 14 AP2/ERFs according to the type of plant phenotype change after mutation. Pink indicates a corresponding phenotypic change after the mutation. (D) The proportion of AtAP2/ERFs that can affect the phenotype after mutation. (E) The distribution of gene duplication types of AtAP2/ERFs and CqAP2/ERFs. (F) Collinearity of AtAP2/ERFs with altered phenotypes after mutation and CqAP2/ERFs, FtAP2/ERFs, and StAP2/ERFs. The blue line represents the collinear gene pairs formed by AtAP2/ERFs and CqAP2/ERFs. The pink line represents the collinear gene pair formed by AtAP2/ERFs and StAP2/ERFs. The yellow lines represent collinearity gene pairs formed by AtAP2/ERFs and FtAP2/ERFs. (G) The left represents the correlation network of AP2/ERF collinear gene pairs of Arabidopsis, quinoa, F. tataricum, and S. tuberosum. The right represents the correlation network of AP2/ERFs and random genes except AP2/ERFs. Blue circles represent StAP2/ERFs, green circles represent AtAP2/ERFs, dark yellow circles represent CqAP2/ERFs, and pale yellow circles represent FtAP2/ERFs.
Agronomy 15 01112 g009
Figure 10. (A) Detection of AP2/ERF protein-interacting orthogroups in A. thaliana, O. sativa, and C. quinoa by CF-MS. (B) Conserved orthogroups interacting with AP2/ERF proteins in A. thaliana, O. sativa, and C. quinoa. (C) DAP-seq determination of the number of target genes bound to each AtAP2/ERF and GO enrichment analysis of target genes. (D) Conserved AtAP2/ERFs in CF-MS and DAP-seq datasets and their GO analysis. (E) Analysis of Arabidopsis orthogroups with CF-MS scores above 0.2 and interaction analysis using 144 Arabidopsis accessions and 1001 Genomes Project analyses. (F) Conserved interaction genes between 144 Arabidopsis accessions and 1001 Genomes Project analyses. (G) Expression patterns and correlations of conserved interacting genes in roots, stems, leaves, flowers, and fruits. (H) The functions of AtAP2/ERFs were predicted by integrated multiple A. thaliana RNA-seq data and the G-MAD method. The red circle represents the pathway with a value above 0.9. A gene-module association score (GMAS) threshold of 0.268 was used.
Agronomy 15 01112 g010
Figure 11. (A) Cluster analysis of CqAP2/ERF transcripts in roots, stems, leaves, flowers, and fruits. (B) Correlation network analysis of CqAP2/ERF expression. (C) The expression difference ratio of CqAP2/ERFs in white and yellow quinoa fruits. (D) Analysis of molecular functions enriched by differentially expressed CqAP2/ERFs in two quinoa fruits. (E) Correlation network analysis of the expression levels of CqAP2/ERFs differentially expressed in two quinoa fruits and key fatty acid genes and fatty acids. The left represents the correlation network formed by the above three in white quinoa. The right represents the correlation network formed by the above three in yellow quinoa. The red circles represent CqAP2/ERFs, yellow circles represent fatty acids, and purple circles represent fatty acid synthesis pathway genes.
Agronomy 15 01112 g011
Figure 12. (A) Distribution of cis-acting elements in AtAP2/ERF promoters. (B) Correlation network analysis of the expression levels of AtAP2/ERFs and key fatty acid genes under abiotic stress, biotic stress, and hormone treatments. Red circles represent AP2/ERFs; yellow circles represent fatty acid pathway genes. (C) The degree of correlation network analysis of the expression levels of AtAP2/ERFs and key fatty acid genes under abiotic stress, biotic stress, and hormone treatments. (D) Expression of AtAP2/ERFs and key fatty acid genes under abiotic stress, biotic stress, and hormone treatments. (E) Correlation network analysis of the expression levels of AtAP2/ERFs and key fatty acid genes in 144 natural Arabidopsis accessions. The left represents correlation network analysis of the expression levels of AtAP2/ERFs and key fatty acid genes. The right represents correlation network analysis of the expression levels of random genes and key fatty acid genes. (F) Correlation network analysis of the expression levels of AtAP2/ERFs and key fatty acid genes in the Arabidopsis 1001 Genomes Project. The left represents the correlation network analysis of the expression levels of AtAP2/ERFs and the key fatty acid genes. The right represents the correlation network analysis of the expression levels of random genes and key fatty acid genes.
Agronomy 15 01112 g012
Disclaimer/Publisher’s Note: The statements, opinions and data contained in all publications are solely those of the individual author(s) and contributor(s) and not of MDPI and/or the editor(s). MDPI and/or the editor(s) disclaim responsibility for any injury to people or property resulting from any ideas, methods, instructions or products referred to in the content.

