Article

Soil Phosphorus and Potassium Fractions in Response to the Long-Term Application of Pig Slurry and NPK Mineral Fertilizers

by
Przemysław Barłóg
1,*,
Lukáš Hlisnikovský
2,
Remigiusz Łukowiak
1 and
Eva Kunzová
2
1
Department of Agricultural Chemistry and Environmental Biogeochemistry, Poznan University of Life Sciences, Wojska Polskiego 28, 60-637 Poznan, Poland
2
Department of Nutrition Management, Crop Research Institute, Drnovská 507, Ruzyně, CZ-161 01 Prague 6, Czech Republic
*
Author to whom correspondence should be addressed.
Agronomy 2025, 15(5), 1183; https://doi.org/10.3390/agronomy15051183
Submission received: 13 March 2025 / Revised: 12 May 2025 / Accepted: 13 May 2025 / Published: 13 May 2025

Abstract

:
The content of bioavailable forms of phosphorus (P) and potassium (K) in soil is essential for the proper functioning of agroecosystems. This study aimed to determine the effects of pig slurry (PS) and NPK mineral fertilizers on soil phosphorus (P) and potassium (K) fractions, the relationship between these fractions and basic soil agrochemical properties, and crop yield. The research material was collected from a long-term experiment established in 1955 in Prague-Ruzyně, Czechia. The effect of two constant factors was analyzed: manure application (control, PS) and different doses of NPK fertilizers (N0P0K0, N1P1K1, N3P2K2, and N4P2K2). A significant effect of fertilization on basic soil properties was demonstrated, including total soil carbon and nitrogen. PS and NPK fertilization also significantly affected the content of water-soluble and moderate labile fractions of P and K. These fractions were positively correlated with plant-available P and K (Mehlich 3). The best fertilization option, which resulted in the greatest increase in yield, was the use of PS and mineral fertilizers at the N3P2K2 level. Increasing the nitrogen dose to the level of N4 resulted in a decrease in the content of bioavailable forms of P and K in topsoil despite the application of PS.

1. Introduction

Phosphorus (P) and potassium (K), along with nitrogen (N), are among the most important plant nutrients systematically used in fertilizers to improve soil fertility. This is due not only to their numerous biochemical and physiological functions, increasing photosynthesis efficiency, but also to limited soil resources, which often limit the production potential of modern crop varieties [1,2,3]. The predominant source of P and K in soil is the parent rock, or more precisely, the minerals contained within it. In contrast to K, the majority of rocks and primary minerals in soil contain trace amounts of P [4]. On average, the P content in mineral soils (topsoil) is approximately 500–800 mg kg−1, but the proportion of the organic form can vary widely, ranging from 20% to 80% [5]. Consequently, the total content of this component in soil is frequently determined by the content and/or inflow of fresh organic matter to the soil [6]. The content of total K in mineral soils is higher than that of P and ranges from 400 to 30,000 mg kg−1, with approximately 90–98% present in the crystalline structure of aluminosilicates and thus not directly available for plant uptake [7]. The availability of K to plants is closely correlated with the content of exchangeable K (Ex-K). The latter is, in turn, dependent on the content and type of clay mineral, its charge density, soil moisture content, competing ions, and soil pH [8]. The loss of P and K from soil can be attributed to natural and anthropogenic factors. The initial group of factors pertains to the movement of K and P beyond the root system of crops, facilitated by either leaching (predominantly K) or various forms of soil erosion (predominantly P) [9,10]. The second group of factors is primarily associated with agricultural activities, which result in the removal of nutrients from the field in the crop [11].
Maintaining P and K resources in the soil at appropriate levels requires the application of various compounds, which can be divided into mineral fertilizers, organic fertilizers, and organic manures. Organic fertilizers and manures are characterized by a lower content of nutrients directly available to plants compared to mineral fertilizers [12]. However, they are a source of organic matter (OM) in the soil [13]. It not only contains plant nutrients, including P and K, but also has a positive effect on a number of physical and chemical properties of the soil that define what is known as “healthy soil” [14]. The relatively low C-org content in liquid manures (slurries) means that the effect of this fertilizer on building broadly defined soil fertility is slower and requires longer repeated applications compared to solid manures [15]. Unlike solid manures, liquid manures contain more nutrients in a form directly available to plants. This makes it possible to replace or even eliminate the use of mineral fertilizers in agricultural technology [16]. The effect of PS on soil P and K levels can be direct as a result of the amount of fertilizer applied, the chemical composition, the number of years of application, and the frequency of application in the crop rotation [17,18]. This influence can also be indirect by shaping important soil characteristics such as soil organic carbon (SOC), pH, and cation exchange capacity (CEC) [19,20,21,22]. Therefore, in the context of the multidirectional effects of PS on soil chemical properties, it is necessary to fully recognize the effects of this fertilizer on different forms and fractions of P and K in the soil, as they differ in their potential to meet the nutritional needs of crops [23,24].
The best crop production results are achieved when minerals and manures are used together [25]. This is due to the positive effect of manures on the fertility of the soil and a better balance of nutrients, especially N [26]. Unfortunately, in many countries of the world, including Czechia, the production of natural fertilizers cannot keep up with the demand for this group of fertilizers [27]. In addition, the strong economic pressure on the selection of crops in crop rotation results in a series of simplifications and the dominance of cereals, which results in further soil degradation [28]. Thus, it is necessary to identify the best agricultural practices that will help maintain soil fertility for decades to come while facilitating adaptation to climate change. The best tool for identifying these practices is long-term experimentation. This is due to the fact that a number of changes in the physical and chemical properties of the soil become visible only after several or a dozen years of systematic fertilization and/or the impact of crops [25,29].
This study hypothesized that the regular application of pig slurry to root crops in a 9-year rotation with cereals and alfalfa, together with the simultaneous application of mineral fertilizers (NPK), would improve soil fertility in terms of potential plant P and K supply to a greater extent than the regular application of NPK fertilizers alone. The results from a long-term experiment (lasting 65 years) were used to test the hypothesis. The aim of the research was to evaluate the effect of pig slurry application and different NPK doses on (i) basic chemical properties of the soil, with special emphasis on total carbon content; (ii) the content of different fractions of P and K in two soil depths, e.g., 0–30 and 30–60 cm; (iii) the content of plant-available P and K determined using the Mehlich 3 method; (iv) relationships between basic soil properties and the content of different fractions of P and K; and (v) the yield of two selected crop plants—winter wheat and sugar beet.

2. Materials and Methods

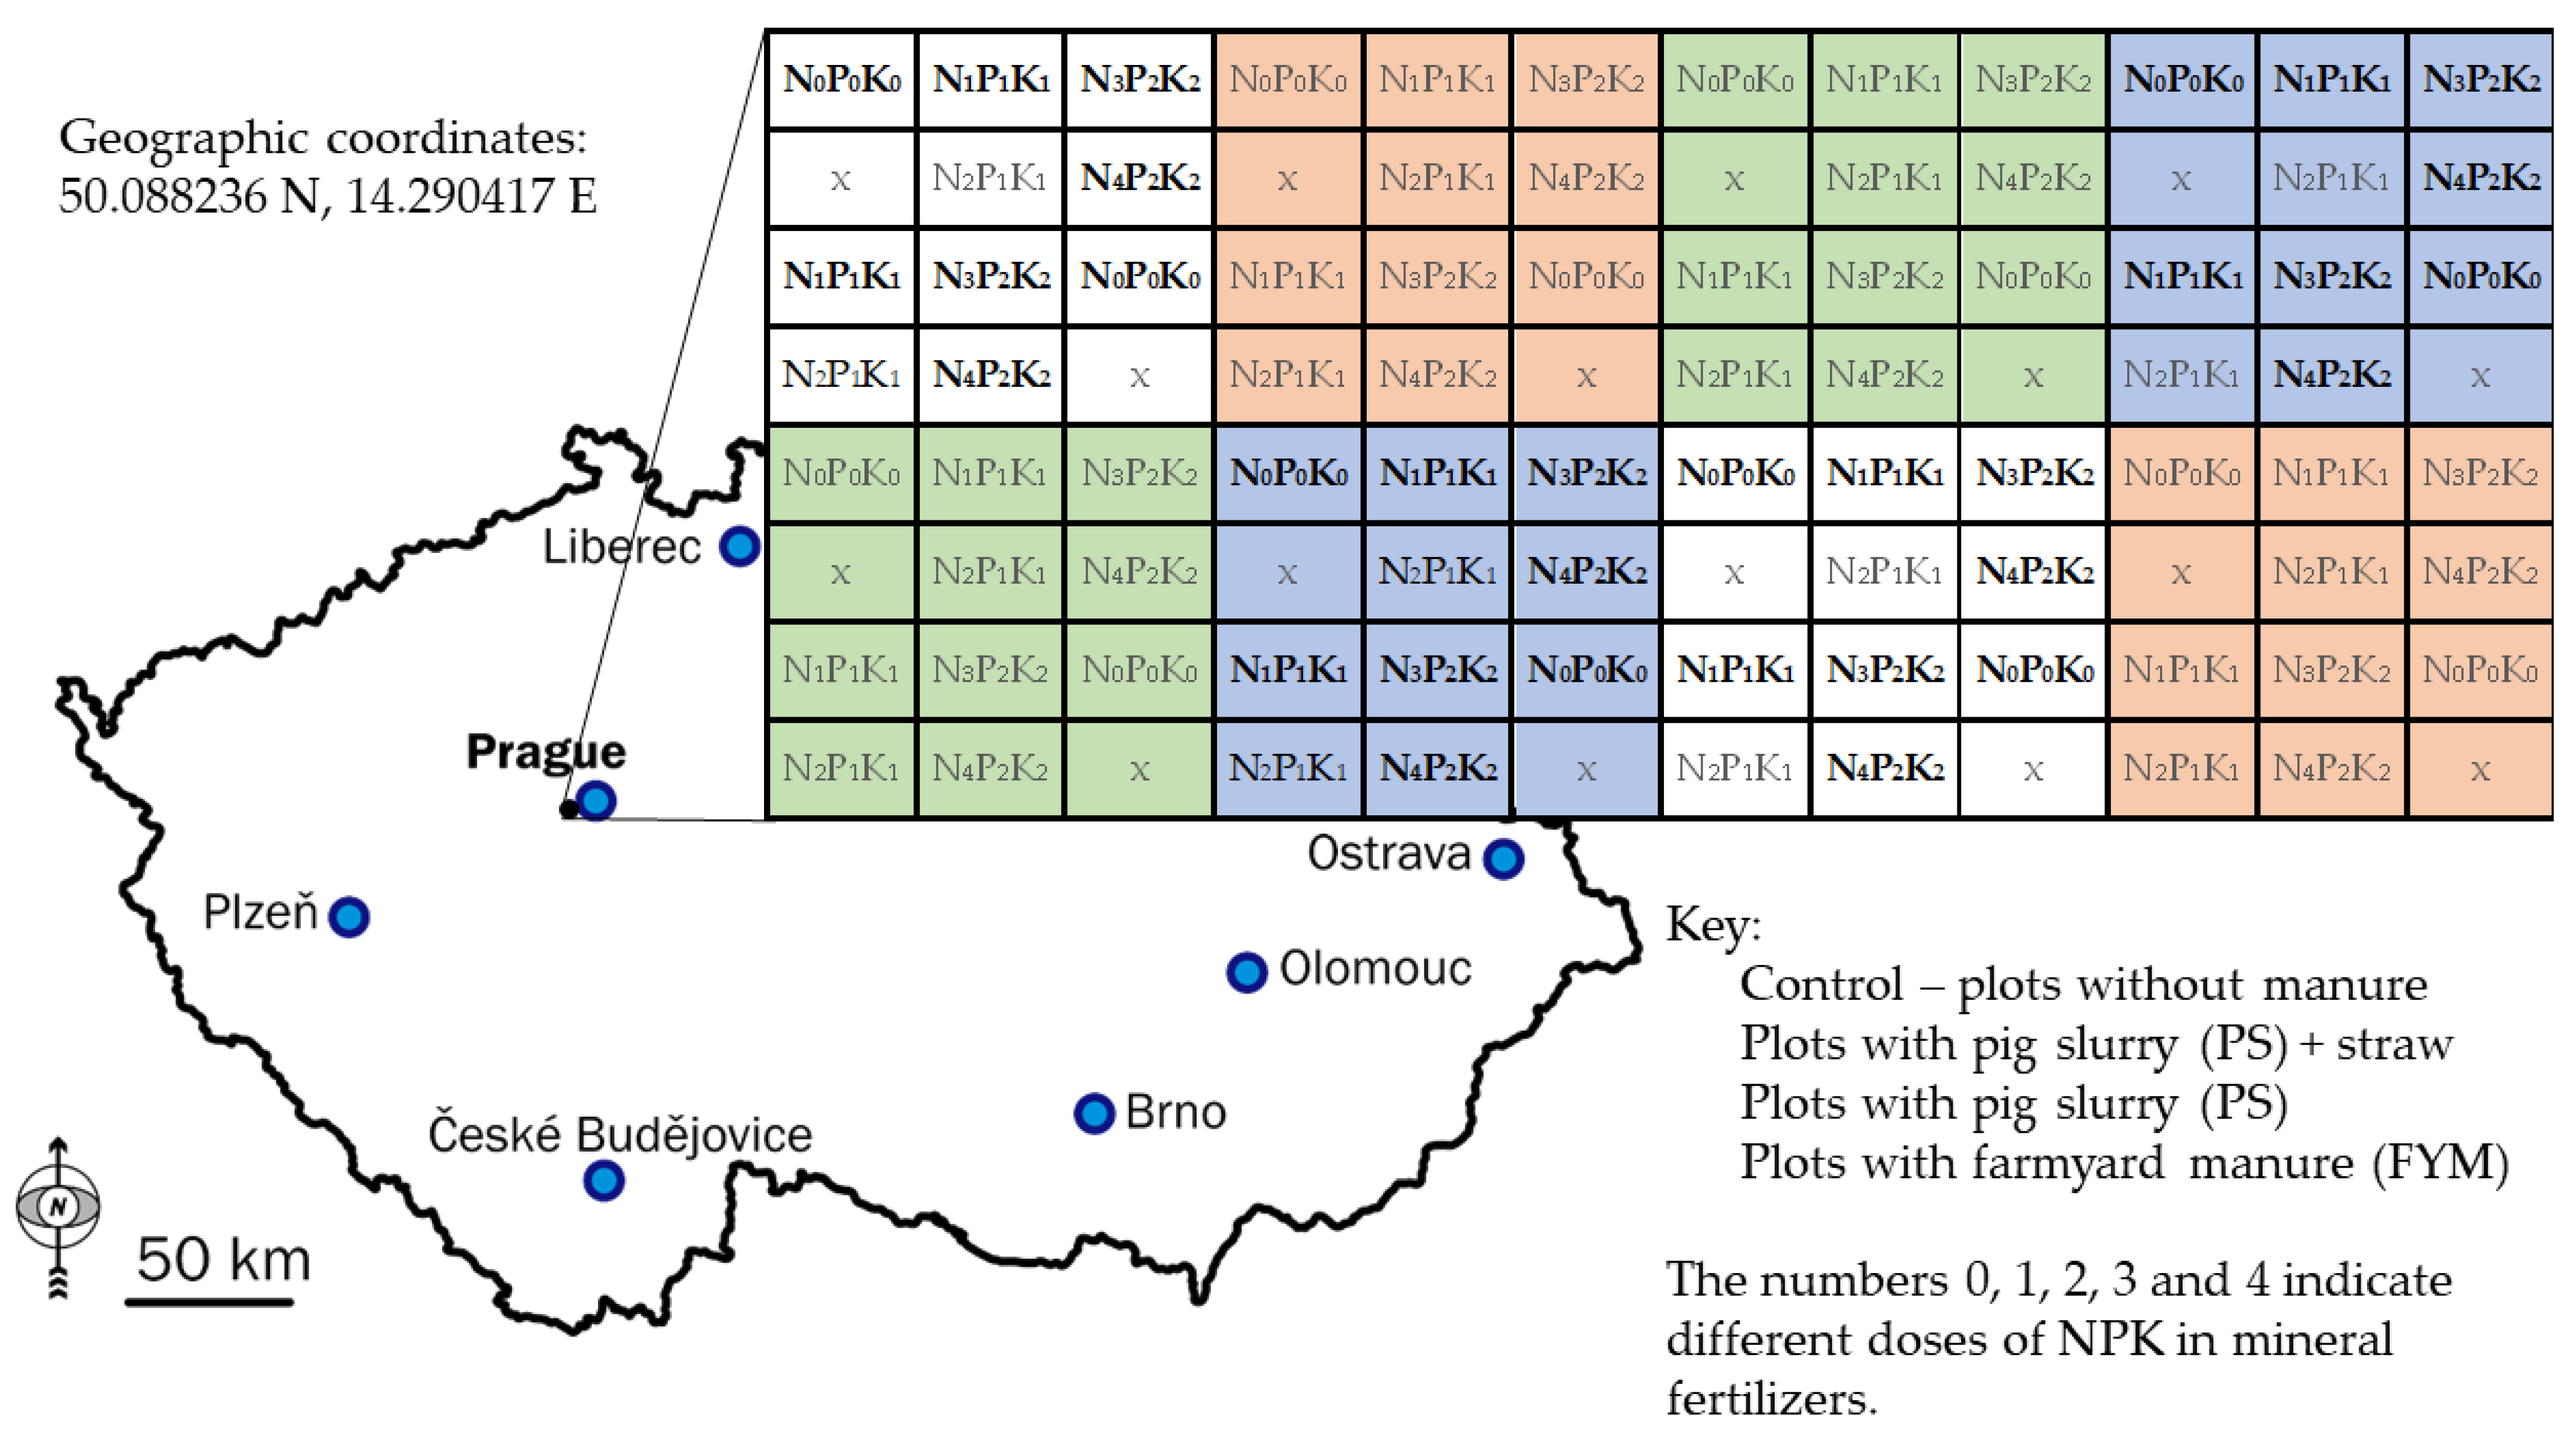
2.1. Site Description

The results presented in this article are obtained from a long-term experiment established in Czechia (the Czech Republic) in 1955. The research project is carried out by the Crop Research Institute (CRI) in Prague-Ruzyně (Figure 1). The field selected for analysis is part of a larger project named the Ruzyně Fertilizer Experiment (RFE). The experiment was conducted on soil classified as Orthic Luvisol, according to the World Reference Base for Soil Resources (WRB). The parent rock of the soil is loess with an admixture of highly weathered limestone. The soil’s particle size structure is clearly defined as silty clay loam. The particle size distribution in topsoil (0.0–0.3 m) is as follows: sand (0.05–2.0 mm)—14%; coarse silt (0.02–0.05 mm)—33%; fine silt (0.02–0.05 mm)—25%; and clay (≤0.002 mm)—28%. For subsoil, the distribution is as follows: 14, 32, 23, and 32%, respectively. The altitude of the field is 370 m a.s.l. Prior to the establishment of the experiment, the pH measured in 1 M KCl was 6.5 in the topsoil layer (0–0.2 m), and the soil organic carbon (SOC) content was 11.7 g kg−1. The average long-term (1955–2018) temperature in the study area is 8.2 °C (ranging from 6.4 to 10.7 °C), and the annual sum of precipitation is about 450 mm (ranging from 255 to 701 mm). In the years of the study, i.e., 2019, 2020, and 2021, the average air temperature was 10.8, 10.6, and 9.2 °C, respectively. The annual sum of precipitation during the study was 431, 505, and 530 mm for 2019, 2020, and 2021, respectively. Detailed data on average temperatures and total precipitation in individual months are presented in the Supplementary Materials (Table S1).

2.2. Experimental Design

The RFE consists of 5 field strips. The area of each field strip is 13,824 m2. Each field strip consists of 24 fertilizer treatments replicated four times and arranged in a complete randomized design (96 individual plots with a size of 144 m2). For the purposes of this study, Field Strip III was selected for analysis. It represents crop rotation referred to as “Classical Crop Rotation”. The proportions of each crop group are as follows: 45% cereals, 33% root crops, and 22% legumes. The crops are rotated in the following order: alfalfa, alfalfa, winter wheat, sugar beet, spring barley, potatoes, winter wheat, sugar beet, and spring barley with alfalfa under-sowing. The experiment tests the influence of two factors: (i) organic fertilization in the form of straw, slurry, and manure and (ii) different doses of macronutrients N, P, and K (Figure 1). To test the hypothesis, two levels of the first factor and four levels of the second factor were selected for this study:
(1)
Organic (manure) fertilization: without (control) and with pig slurry (PS);
(2)
NPK mineral fertilization: N0P0K0; N1P1K1; N3P2K2; and N4P2K2.
In crop rotation, PS was only applied during the sugar beet and potato growing seasons. Slurry was applied in the fall after harvesting the pre-crop of the above crops. A medium harrow was used to mix the manure with the soil. The rates of the PS depended on the crop. The PS dose in the sugar beet season was always higher (68 t ha−1) than before the potato crop (49 t ha−1). The chemical composition of PS from the last years is provided in Table 1.
Nutrient doses in NPK mineral fertilizers varied not only within the research factor but also among crops. The detailed nutrient (NPK) supply to the soil as a function of the combination of two factors is shown in Table 2. It is worth noting that no N fertilizer is used to grow alfalfa. Moreover, NPK rates were not reduced by additional PS application. The following fertilizers are used each year: calcium ammonium nitrate (27% N), simple superphosphate (8.3% P), and potassium chloride (49.8% K). Nitrogen fertilizer is applied in the spring season, and P and K fertilizers are applied in the late summer or early fall after the previous crop is harvested. During the growing season, standard plant protection against weeds and pathogens was used.

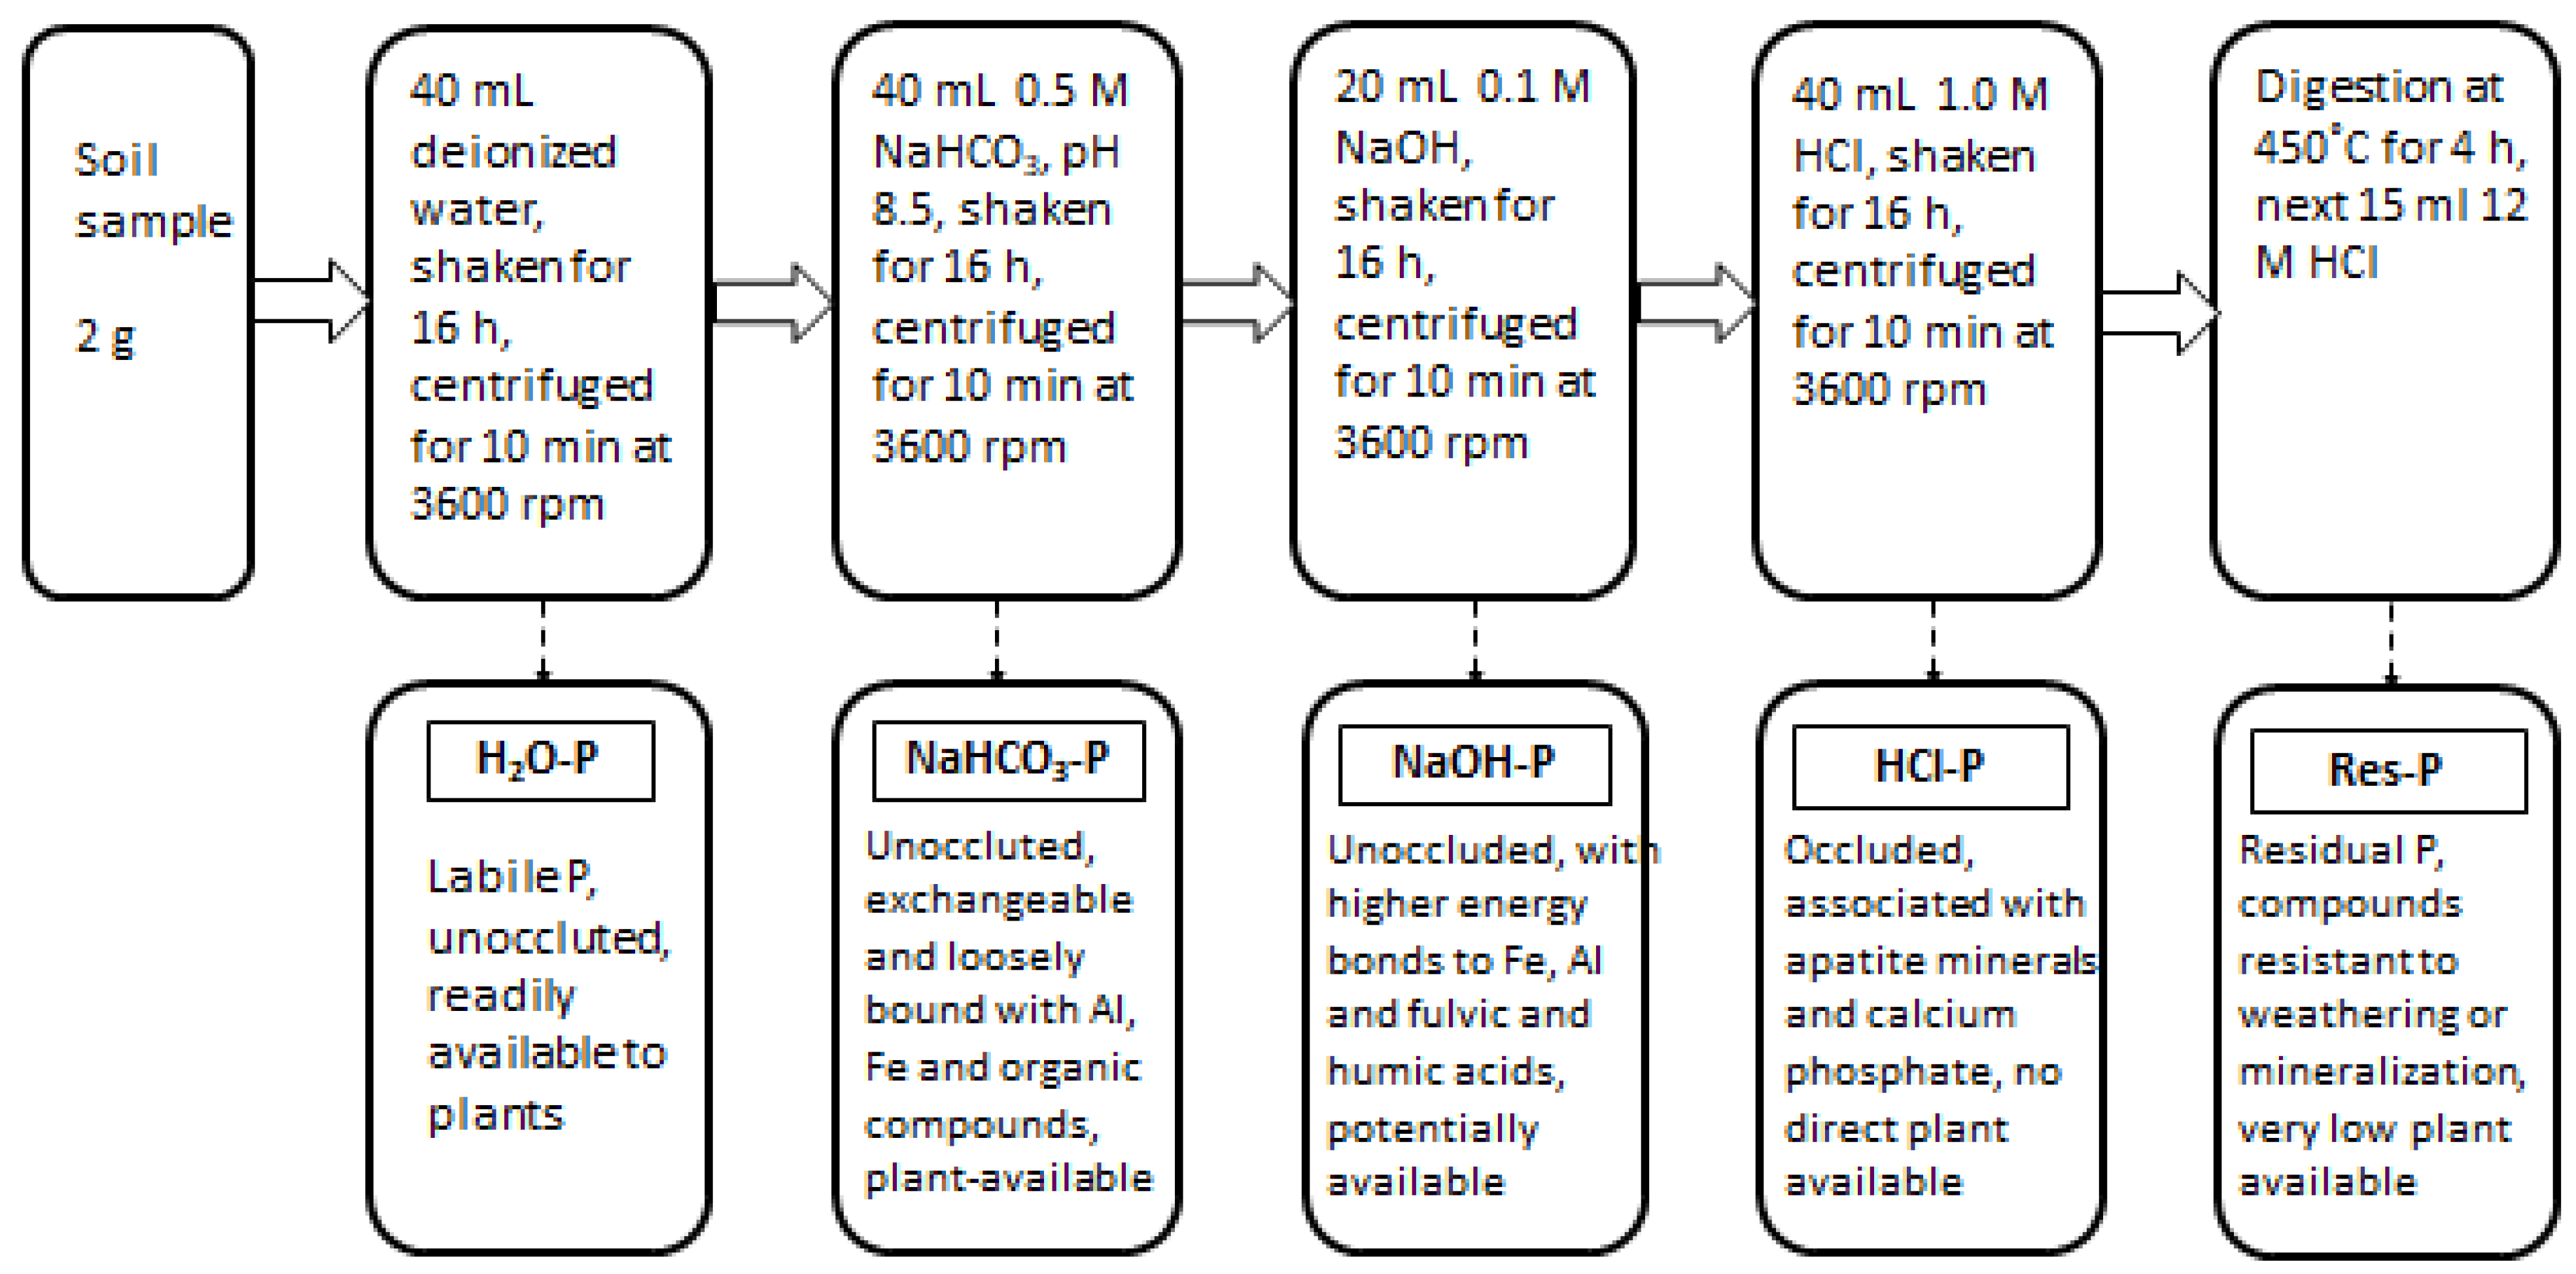
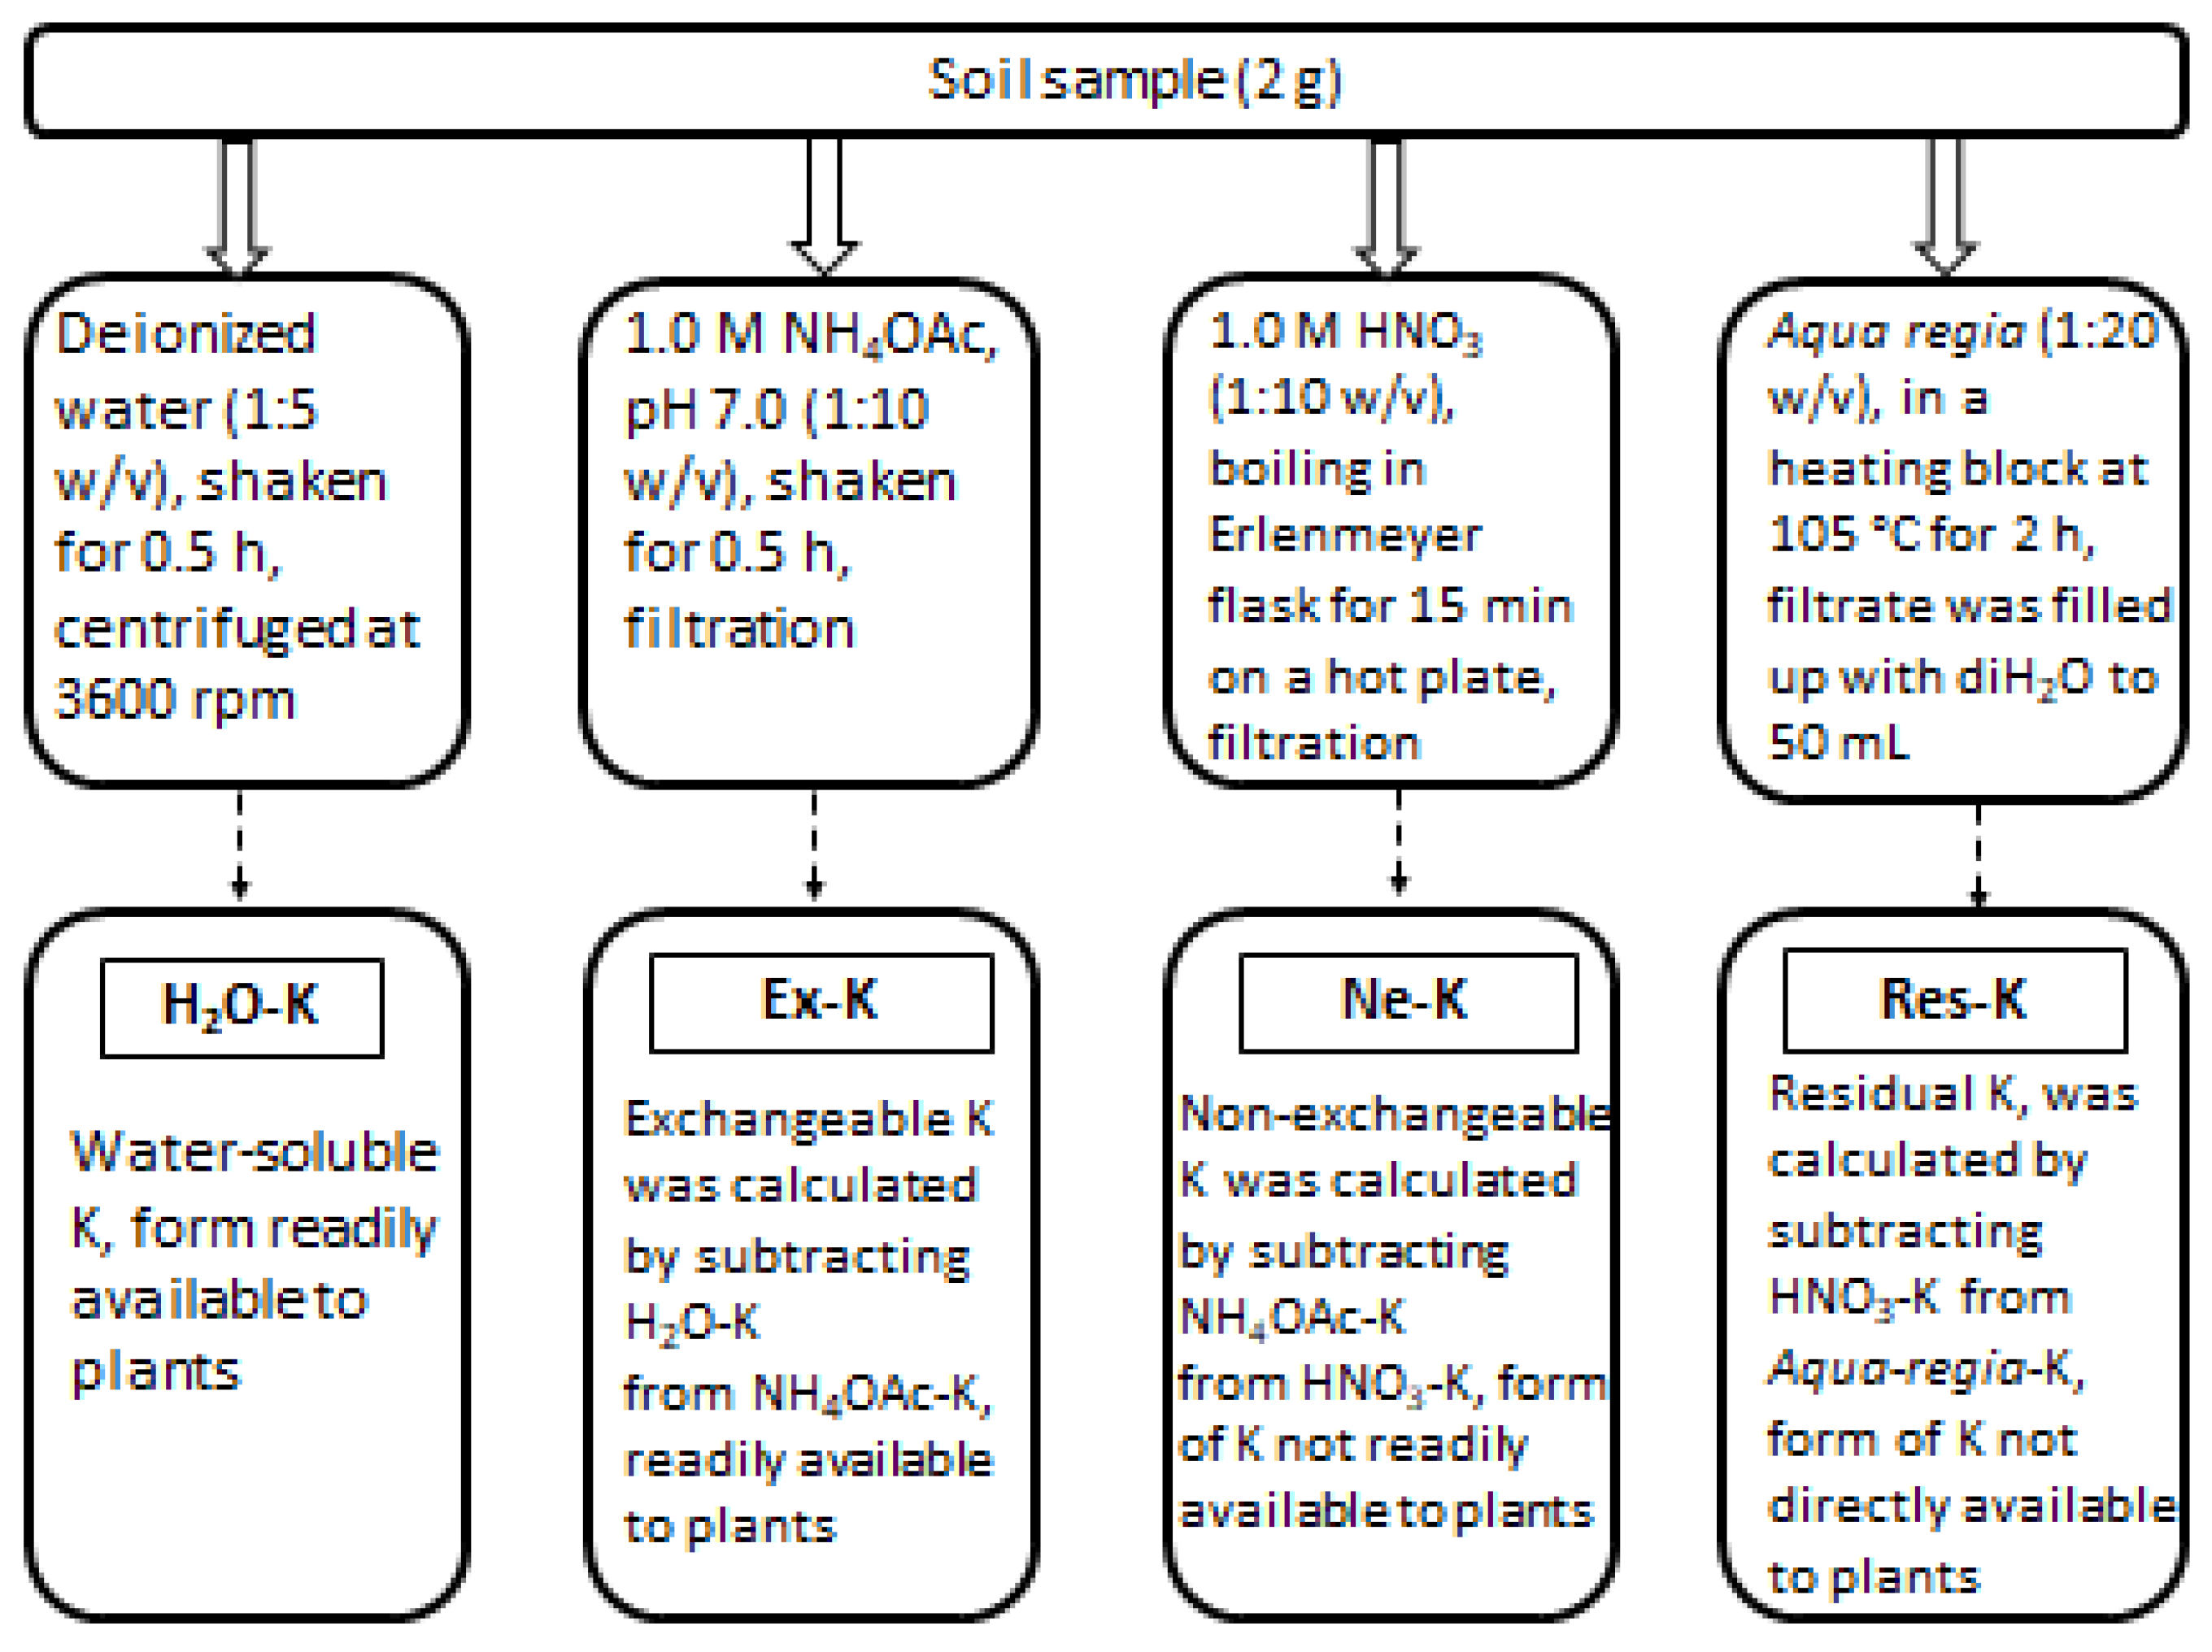
2.3. Soil Sampling and Analysis

Soil samples were collected in early spring, before the start of vegetation (in February), and over two years: 2020 and 2021. Soil samples were taken at two depths: 0–30 cm (topsoil) and 31–60 cm (subsoil). The soil sample representing 1 plot was created by mixing several individual samples taken from the same soil depth. In the chemical laboratory, the soil samples were dried at room temperature (18–20 °C). The soil samples were then ground in a porcelain mortar and sieved to obtain fractions smaller than 2 mm. The soil reaction (pH) was measured in a solution of potassium chloride (1 M KCl) using a CP-511 pH meter (Elmetron, Zabrze, Poland). The soil–solution ratio was 1: 2.5 (w/v). The total soil carbon (TSC) content was determined using an ELTRA CS-2000 analyzer (ELTRA GmbH, Haan, Germany). The total soil nitrogen (TN) content was determined via the Kjeldahl method using a thermal block and a distillation unit manufactured by FOSS, Hillerød, Denmark. The cation exchange capacity (CEC) was determined by adding the sum of basic cations (Ca2+, Mg2+, K+, and Na+) and acid cations (H+ and Al3+) [30]. Basic cations were determined in 1 M NH4OAc (1:10; w/v), and the sum of acidic cations (exchangeable acidity) was determined in a 1 M KCl solution (1:2.5, w/v). The phosphorus (P) fractions were determined according to the method proposed by Hedley [23]. In these studies, five P fractions were distinguished: H2O-P, NaHCO3-P, NaOH-P, HCl-P, and residual-P. A flowchart of the P fraction determination procedure and the interpretation of the results is shown in Figure 2. The total phosphorus in soil (TP) was calculated by summing the 5 fractions [31]. To determine the fractions, 2 g of soil was weighed into centrifuge tubes; then, extracts were added sequentially. After shaking, the soil suspension was centrifuged using a Rotafix 32A centrifuge (A. Hettich GmbH and Co. KG, Tuttlingen, Germany). The concentration of P in the extracts was determined calorimetrically according to the method proposed by Murphy and Riley [32] at a wavelength of 720 µm on a Jasco V-630 UV-VIS spectrophotometer (Jasco International Co, LTD, Tokyo, Japan).
The content of potassium (K) fractions was determined using different extraction procedures. A flowchart of the K fraction determination procedure and the interpretation of the results is shown in Figure 3. Water-soluble K (H2O-K) was determined by shaking the soil with deionized water [33]. To determine the exchangeable form of K (Ex-K), 1 M ammonium acetate (NH4OAc) was used [30]. Next, the amount of water-soluble K was subtracted from the result. The non-exchangeable form of K (Ne-K) was determined using boiling HNO3 and subtracting NH4OAc-K from HNO3-K [34]. The residual K (Res-K) was calculated by subtracting HNO3-extractable K from the amount of K determined using aqua regia [35]. The quasi-total K (TK) content was obtained by summing all of the K fractions listed above.
Independent of the analysis of the P and K fractions, the content of plant-available forms of both nutrients was additionally determined according to the Mehlich 3 method [36]. The proportion of plant-available P and K (M3P and M3K) in the TP and TK, i.e., the sum of all P and K fractions in soil, was also calculated. The concentration of P in the Mehlich 3 extract was measured via the ammonium molybdate method using a Jasco V-630 UV-VIS spectrophotometer (Jasco International Co., LTD, Tokyo, Japan) at a wavelength of 800 nm. The concentrations of cations (K, Mg, and Ca) in all extracts were analyzed using an atomic absorption spectrometer 235 (AAS) (ThermoScientific iCE 3000 Series, Thermo Fisher Scientific Inc., Waltham, MA, USA).

2.4. Plant Material and Chemical Analysis

The Mulan winter wheat (Triticum aestivum L.) variety was tested in the first year, and sugar beet (Beta vulgaris L.; cultivar BTS 6995) was tested in the second year. Winter wheat was harvested on 8 August 2020, and sugar beet was harvested on 4 October 2021. Wheat was harvested with a “Sampo” combine harvester from an area of 25 m2. Sugar beet was harvested manually from an area of 10 m2. From each plot, samples of wheat grain, straw, and beet taproots and leaves were randomly selected for chemical analyses. After drying and grinding, the total N content was determined via the Kjeldahl method using a thermal block and a distillation unit (FOSS, Denmark). In order to determine the P and K, plant material was mineralized using the dry ashing method at a temperature of 600 °C. The concentration of P after dissolving the ashes in dilute HNO3 was measured via the colorimetric method with ammonium molybdate using a Jasco V-630 UV-VIS spectrophotometer (Jasco International Co., LTD, Tokyo, Japan) at a wavelength of 436 nm. The concentration of K, Mg, and Ca was measured using atomic absorption spectrometry (ThermoScientific iCE 3000 Series, Thermo Fisher Scientific Inc., Waltham, MA, USA). NPK removal from the field was calculated using the concentration and the dry matter of the crop parts removed from the field. These plant parts were in the form of grain and straw yield (wheat) and taproot yield (sugar beet). The NPK balance was calculated as the difference between the NPK input in fertilizers and the amount of nutrients removed from the field.

2.5. Statistical Analysis

The RFE consists of 5 field strips. The effects of fertilizer treatments on soil parameters were assessed via two-way ANOVA (year × treatment), and for crop yield and nutrient balance, one-way ANOVA was used. The means were separated via honest significant difference (HSD) using Tukey’s method. The distribution of the data (normality) was checked via the Shapiro–Wilk test, and the homogeneity of variance was verified using the Bartlett test. The standard error of the mean (SEM) was used to express the statistical error. The relationships between traits were analyzed using principal component analysis (PCA). In the present study, only principal components (PCs) with eigenvalues greater than 1 (Kaiser’s criterion) were considered for analyses. To interpret the PCs, soil characteristics with factor loadings greater than 0.7 were used. The relationships between the soil characteristics are graphically presented on the PCA biplot diagrams. Statistica 13 software was used for all statistical analyses (TIBCO Software Inc., Tulsa, OK, USA).

3. Results

3.1. Basic Soil Parameters

Two-way analysis of variance showed that the values of basic soil chemical parameters (pH, TSC, TN, C:N, and CEC) at 0–30 cm soil depth were not significantly dependent on the year of soil sampling. The main factor affecting these parameters was fertilization treatments (Table S2). This factor had a significant effect on pH, TSC, and TN in the topsoil (0–30 cm). However, in the subsoil (31–60 cm), the factor only significantly altered the soil pH. The regular application of PS resulted in a significant reduction in pH compared to plots without manure, regardless of the soil depth. In the topsoil, the average pH of the manure plots was 5.17 compared to 5.36 without manure. In the subsoil, the values were 5.46 and 5.91, respectively. NPK fertilizer application also had a negative effect on pH, especially in plots with PS. In the 0–30 cm soil depth, the highest pH value was found in the N1P1K1 treatment, which was significantly higher than in the PS + N4P2K2 treatment. In the 31–60 cm soil depth, there was a significant difference between the N1P1K1 and PS + N3P2K2 treatments. The long-term application of manure and NPK fertilizer increased TSC contents in the 0–30 cm soil depth (Table 3). The lowest TSC concentration was found in the control treatment, and the highest was observed in the PS + N3P2K2 treatment. The difference between treatments was 11.2%. A significant increase in TSC compared to the control was also obtained for the PS + N4P2K2 treatment (+9.0%). Fertilization with PS only increased the TSC content compared to the control, but the difference was not significant and amounted to only 3.7%. Taking into account the increase in TSC depending on the PS application, the optimal fertilizer dose was N1P1K1 on plots without PS and N3P2K2 on plots with PS. Unlike topsoil, the TSC content in the 31–60 cm soil depth was slightly dependent on the type of fertilization. In addition, the NPK dose had a greater influence than PS, although this was not statistically confirmed. The highest TSC contents in this soil depth were recorded in the treatment with the highest NPK dose (N4P2K2), regardless of the PS application.
The TN content was significantly dependent on PS application and NPK fertilizers. The average content of TN was 0.123% in the plots without PS and 0.134% in the plots with PS. Regardless of the PS treatment, with an increase in N dose in mineral fertilizers, the TN content in the 0–30 cm soil depth also increased. The highest TN increase was obtained as a result of PS application and the highest N dose (PS + N4P2K2). In this treatment, the TN content was 0.021% higher than in the control and N1P1K1. A significant increase in TN content compared to the control was also observed in the treatments PS + N1P1K1 and PS + N3P2K2. In contrast to topsoil, the TN content in subsoil was at a similar level for all analyzed treatments (Table 3).
Long-term fertilizer application had no significant effect on the soil C:N ratio and the sum of exchangeable cations (CEC), regardless of soil depth. Nevertheless, a trend toward lower C:N values can be observed in the 0–30 cm soil depth due to higher nitrogen inputs into the soil (Table 3).

3.2. Phosphorus Fractions

The average contents of H2O-P, NaHCO3-P, NaOH-P, HCl-P, and Res-P fractions in the 0–30 cm soil depth were 10.2, 64.4, 232.5, 137.2, 136.2, and 580.6 mg kg−1, respectively. The obtained values were higher than those obtained in the 31–60 cm soil depth by 300.3, 108.4, 81.4, 60.3, and 15.6%, respectively. The average total P (TP) content was 580.6 mg kg−1 in the 0–30 cm and 365.0 mg kg−1 in the 31–60 cm soil depth. Long-term diversified fertilization significantly influenced the content of fractions such as H2O-P, NaHCO3-P, and NaOH-P in the 0–30 cm soil depth and H2O-P and NaHCO3-P in the 31–60 cm soil depth (Table 4). Simultaneously, it significantly influenced the sum of all fractions (TP). It should be noted that the effect of the fertilization treatments on the above-mentioned P fractions was independent of the year of study, except for NaOH-P in the 0–30 cm layer (Table S3).
Slurry (PS) application increased the average contents of H2O-P, NaHCO3-P, and NaOH-P in the 0–30 cm layer by 124.4, 54.6, and 22.7%, respectively, compared to the results obtained in the control plots. In the 31–60 cm soil depth, the differences between the treatments with PS and without PS were smaller and amounted to 52.9, 41.7, and 15.6%, respectively. Taking into account the content of potentially plant-available forms, the optimal treatment was PS + N3P2K2. Higher doses of N (N4), without increasing the level of P fertilization, resulted in a decrease in the content of H2O-P, NaHCO3-P, and NaOH-P in the soil.
Regarding the HCl-P and Res-P fractions, no significant effect of the fertilization treatment was found. However, the regular application of manure not only maintained but even increased the contents of both fractions compared to the control and other treatments. It is worth noting that in plots without PS, the highest levels of these fractions were found in N3 treatments, regardless of soil depth. In the PS plots, the response to NPK fertilization was less clear with respect to res-P. As a result of the interaction of mineral and organic fertilization, the highest TP content was obtained in the PS + N3P2K2 treatment. The application of PS alone significantly increased the TP content in the 0–30 cm layer compared to the control. An increase in TP was also observed in the deeper soil depth, but the response was only a trend (Table 4).
The effect of PS and NPK application on the distribution ratio (%) of soil P fractions in TP is presented in Figure S1. As observed in the figure, the proportion of the NaHCO3-P fraction in the total P content increased with the input of P to the soil. This relationship was observed for both soil depths.

3.3. Potassium Fractions

The average contents of H2O-K, Ex-K, Ne-K, and Res-K fractions in the 0–30 cm layer were 42.5, 132.4, 1078, and 4470 mg kg−1, respectively. For comparison, the average contents of the same fractions in the 31–60 cm layer were 35.7, 113.6, 1041, and 4547 mg kg−1. Fertilization significantly affected two potassium fractions: H2O-K and Ex-K (Table 5). At the same time, the effect of fertilization on Ex-K content in the 0.0–0.3 m soil depth was modified by the growing season (Table S4). The content of H2O-K and Ex-K in the 0–30 cm layer increases significantly when NPK and PS fertilizers are applied simultaneously. The highest content of both K fractions was found in the PS + N3P2K2 treatment. Compared to the control, the increase in content was 48.9 and 47.0% for H2O-K and Ex-K, respectively. In the 31–60 cm layer, the highest Ex-K content was obtained in the PS + N4P2K2 treatment. The difference was 26.4% compared to the control.
The effect of fertilization on the content of other K fractions was insignificant. Nevertheless, it can be observed that the simultaneous application of PS and NPK fertilizers had a positive effect on the Ne-K content, especially after the application of the highest NPK dose. A positive effect of mineral fertilizers on the content of Res-K and TK in the 0–30 cm layer was also observed in the plots without PS. In addition, soil samples collected from the PS + N4P2K2 treatment exhibited a trend toward an increase in Res-K and TK contents. Regardless of the NPK rates, PS application increased the average H2O-K content in the topsoil by 12.3%, and Ex-K and Ne-K increased by 9.2% and 2.9%, respectively. However, this factor had little effect on Res-K and TK.
The effect of PS and NPK application on the distribution ratio (%) of soil K fractions in TK is presented in Figure S2. In general, fertilization only slightly differentiated the contribution of the individual fractions to the TK. However, a trend toward an increase in the contribution of Ex-K to TK was observed.

3.4. Plant-Available P and K

The content of P in the plant-available form was determined via the Mehlich 3 method. The content of this form of P depended not only on the fertilization but also on the growing season. However, the analysis of variance did not show a significant interaction with respect to “year × fertilization” (Table S3). Regarding the effect of the year, higher M3P values were obtained in the season when PS was applied. On average, for the two years, samples collected from plots without PS contained 87.2 mg kg−1 in the 0–30 cm soil depth, and from PS plots, 141.9 mg kg−1 was observed. This represented 16.4% and 22.7% of the total P. Regardless of the PS application, NPK doses increased the M3P content in the soil, and at the same time, they increased the proportion of the M3P in the total P content (Table 6). The optimal treatment was PS + N3P2K2 because of the maximum level of M3P. Its M3P level was 4 times higher than that of the control. The slurry application alone increased the M3P content twice as much as in the control.
M3K content was significantly dependent on year and fertilization type. There was no interaction between the two factors (Table S4). On average, for the two years, PS application increased the M3K in the 0–30 cm soil depth from 193.7 to 210.1 mg kg−1 (+8.5%), and in the 31–60 cm depth, it increased from 174.6 to 188.4 mg kg−1 (+7.9%). For comparison, the increase in M3K content under the influence of the highest dose of K and the average level of N fertilization (N3P2K2) was as follows: 16.3% on plots without PS and, on plots with PS, as much as 26.4%. As a result of the application of PS and NPK fertilizers, the proportion of M3K in the total content of the element also increased. However, the differences obtained between the treatments were smaller than for M3P and not significant (Table 6).

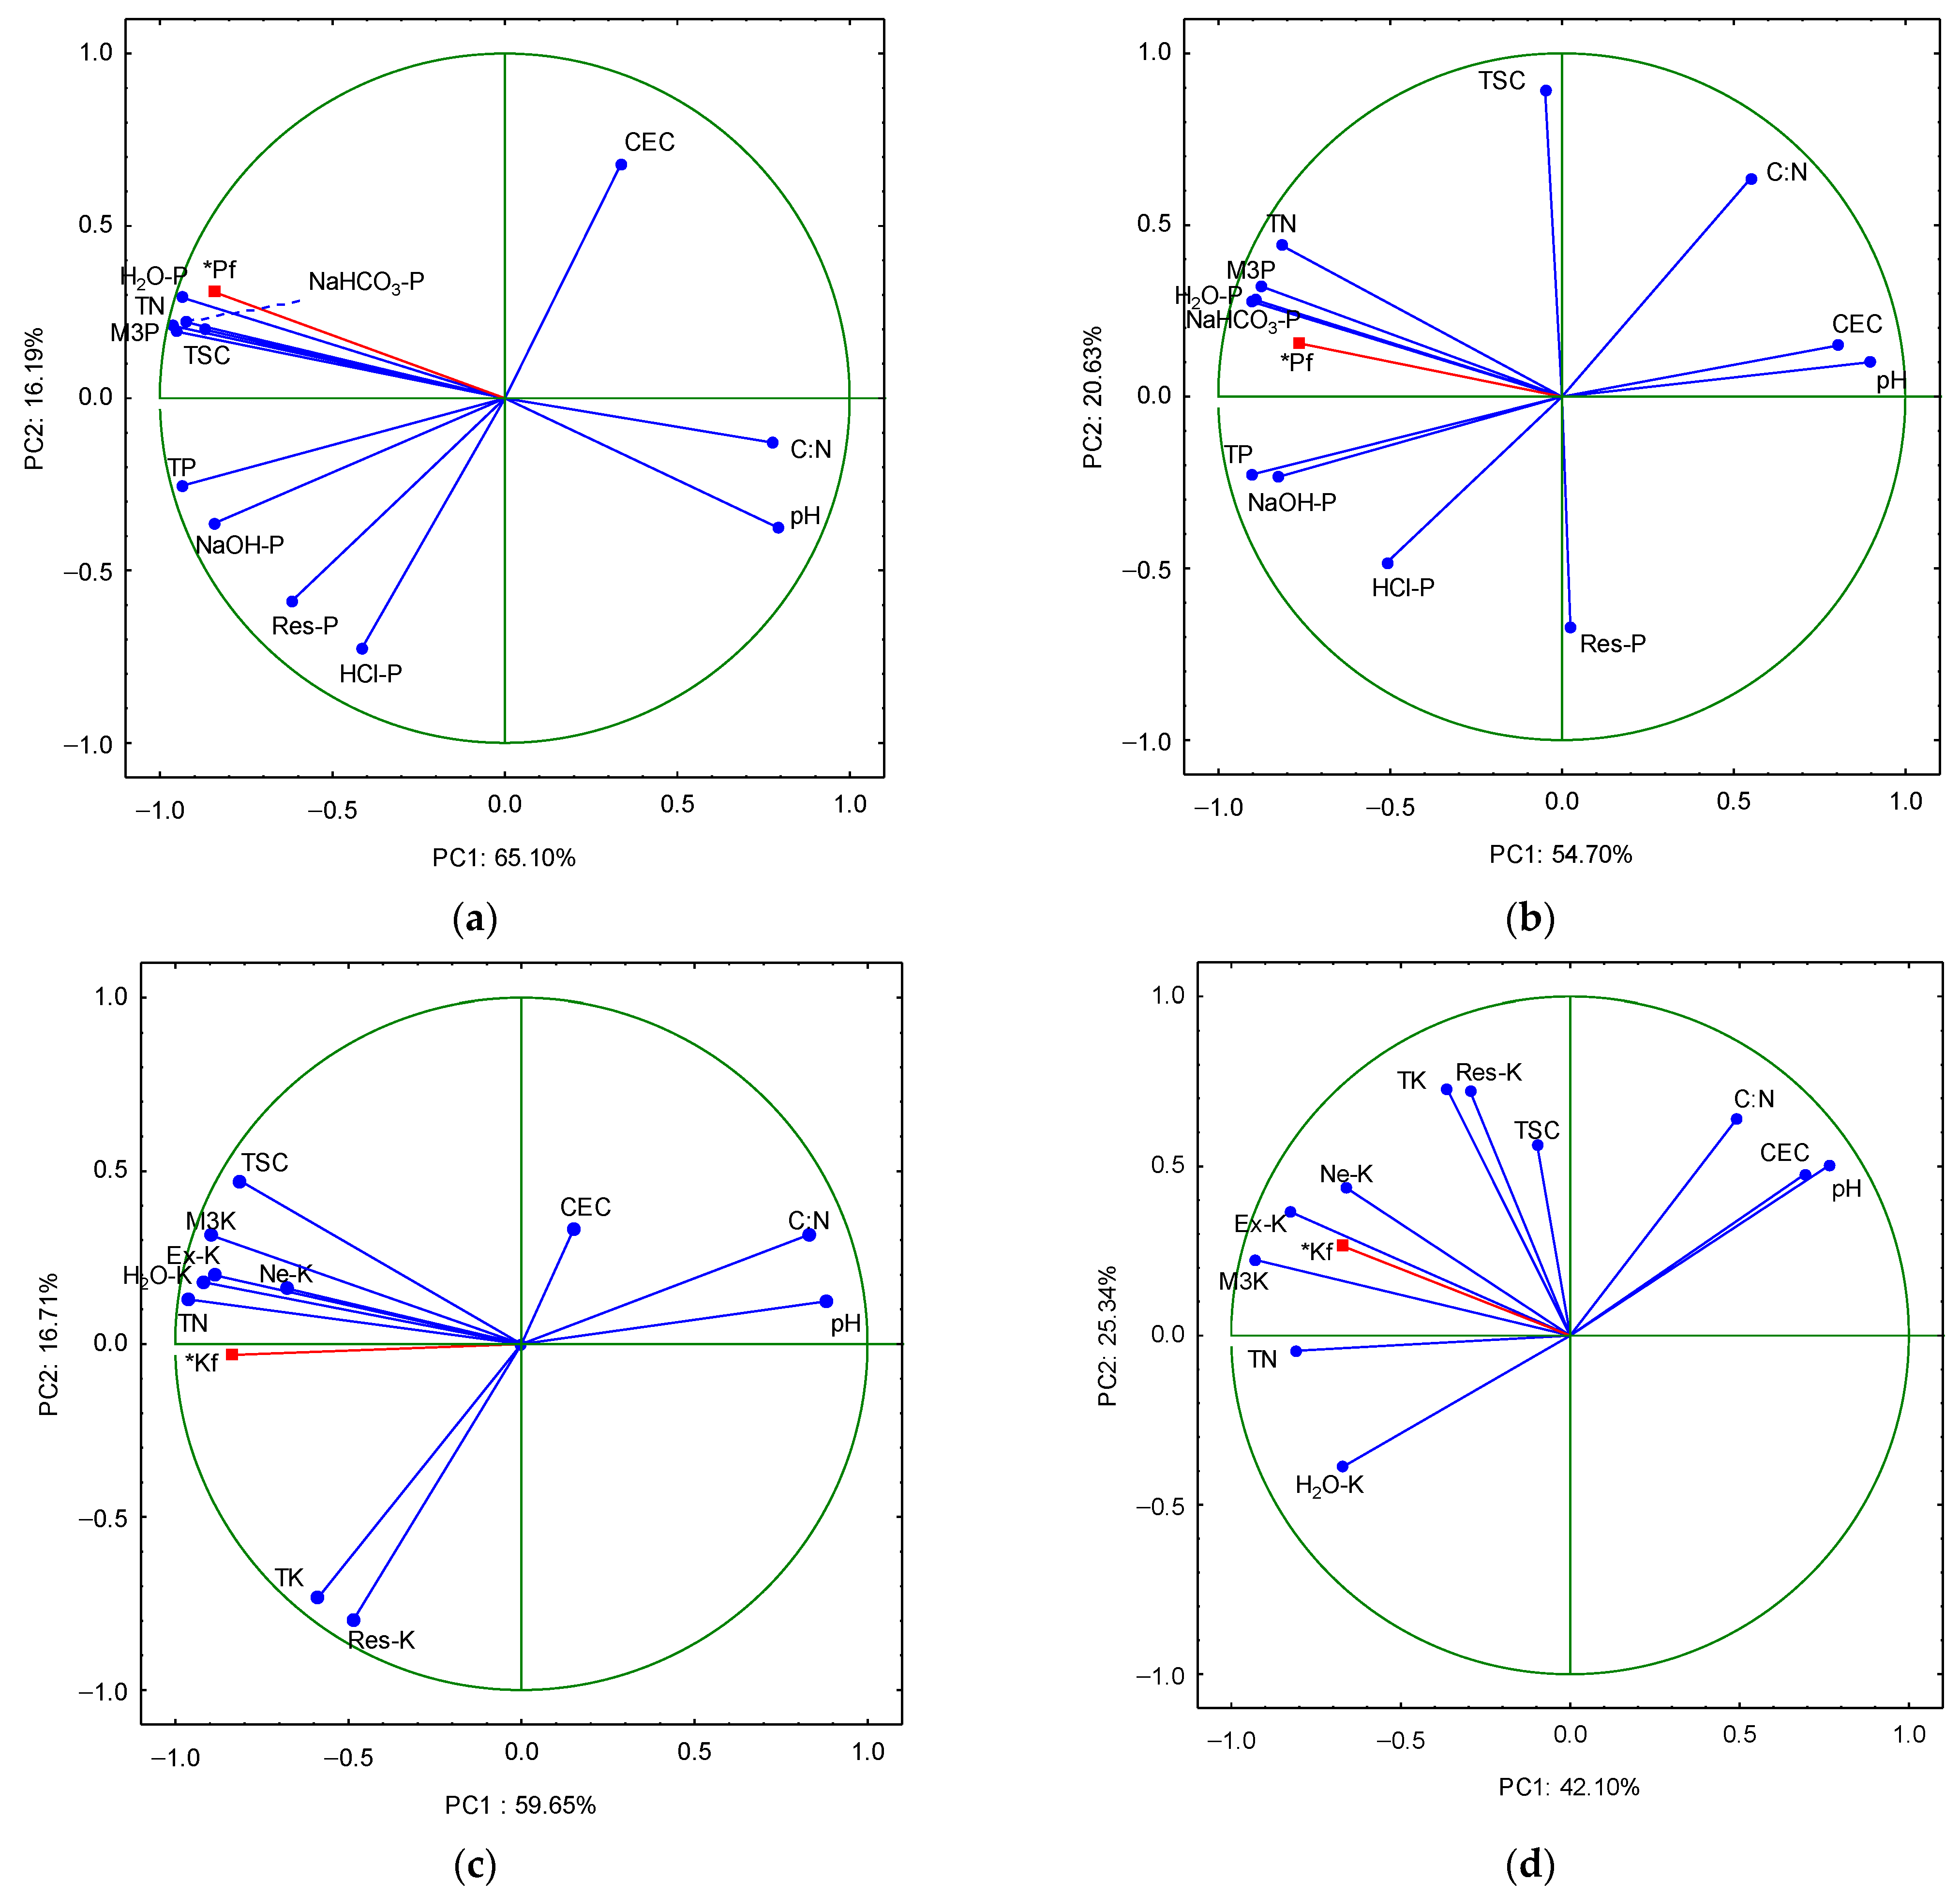
3.5. Relationships Between Soil Parameters

The relationships between the features were analyzed using two methods: PCA and multivariate linear regression. The main objective of PCA was to determine the relationship between basic soil properties (pH, TSC, TN, C:N, and CEC) and the content of different forms and fractions of P and K. An additional variable included in the PCA was the average annual input (dose) of P and K in all fertilizers in the analyzed crop rotation. The variability of P content in the 0.0–0.3 m soil depth was explained using three principal components (Table S5). Together, they explained 92.7% of the variability. The first principal component (PC1) correlated with characteristics such as pH, TSC, TN, and C:N and with the analyzed P fractions, except for HCl-P. PC2 represented two variables: HCl-P and CEC. Together, both PCs explained 81.3% of the total variability and were used to analyze the relationships between features concerning the P content in the 0.0–0.3 m layer (Figure 4a).
The contents of NaHCO3-P and M3P were strongly and positively correlated with the contents of TN and TSC in the soil. The content of H2O-P was also correlated with these traits, which in turn were most strongly related to the P doses (Pf) used in the crop rotation. However, these characteristics were negatively correlated with soil pH and the C:N ratio. A separate cluster was formed using variables related to NaOH-P, Res-P, and HCl-P. They were generally negatively correlated with CEC, especially HCl-P.
The variability of P contents in the 31–60 cm soil depth was explained using two PCs (Table S5). The first one (PC1) was mainly related to pH, TN, CECs, H2O-P, NaHCO3-P, NaOH-P, TP, and M3P. The second one (PC2) was mainly formed by TSC. Together, both PCs explained 75.3% of the total variability of the 31–60 cm layer results. As shown in the biplot, TSC was weakly related to most P fractions in contrast to the 0–30 cm layer. There was also a negative correlation between TSC and Res-P. In turn, pH was negatively correlated with the content of P fractions potentially readily available to plants. However, it was positively correlated with CEC. The level of P fertilization primarily determined the content of H2O-P, NaHCO3-P, and then M3P (Figure 4b).
The variability in topsoil K content was explained using three principal components (Table S6). Variables representing pH, TSC, TN, C:N, H2O-K, Ex-K, M3K, and average annual K input (Kf) formed via PC1. Variables representing Res-K and CEC formed via PC2. The first two PCs explained 76.4% of the total variability. The biplot created using PC1 and PC2 for K-related variables shows three distinct clusters of traits. The first concerns K doses (Kf) and related traits such as H2O-K, Ex-K, Ne-K, and M3K (as well as TSC and TN). Opposite of this group are variables representing pH and C:N (Figure 4c). The last two characteristics were positively related to CEC. This parameter was negatively correlated with Res-K and TK.
The K content in the 31–60 cm layer was explained using three principal components. They explained 42.1, 25.3, and 18.9% of the total variability (Table S6). PC1 and PC2 were used to construct the biplot (Figure 4d). As a result, M3K, Ex-K, and Ne-K contents had the strongest positive correlation with K doses in fertilizers. The large angle between Kf and H2O-K and Res-K contents indicates the weak effect of direct K fertilization on both K fractions. It is also worth pointing out that H2O-K was negatively correlated with pH and CEC. A positive relationship was also found between TSC and Res-K contents, as well as the sum of all K fractions.

3.6. Crop Yield and Nutrient Balance

The long-term application of NPK fertilizers significantly affected crop yield (Table 7). In the plots without PS, the highest yield of grain (GY) and straw (SY) of winter wheat was obtained in the N4P2K2 treatment. In the PS plots, the highest GY and SY values were obtained in the treatment with moderate N rates (PS + N3P2K2). Regardless of NPK fertilization treatments, the difference in GY and SY between the plots with and without PS was 18.6% and 14.9%, respectively. In relation to sugar beet, the highest taproot yield (TY) was observed in the treatment with the highest N rate (N4), regardless of PS application. However, in the fertilization system without PS, the TY increase compared to the control was lower (+33.1%) than with PS (+40.5%). At the same time, the application of PS alone increased TY by 31.5% compared to the control. The greatest increase in LY was also obtained in the PS + N4P2K2 treatment. On average, the application of PS increased TY by 12.2% and LY by 19.0% compared to the values obtained in the plots without PS. The yield of the tested plants depended significantly on the content of the labile P and K fractions, as well as the M3P and M3K levels. The relationships between the traits were best described using nonlinear functions, which also indicated that M3P was the component that limited yield the most (Figure S3).
The removal of nutrients from the field, along with the yield of the tested crops, increased with the inflow of NPK to the soil. The PS + N4P2K2 treatment had the highest NPK losses for both crops. The application of slurry increased the removal of N and P at each level of NPK fertilization. Lower K removal was observed only for K in the PS + N4P2K2 treatment, not in N4P2K2. However, the difference was statistically insignificant. The PS application increased the mean removal of N from the field by 25.2–30.6%, P by 14.9–27.0%, and K by 6.1–13.6%, depending on the crop. The tested plants affected the NPK balance differently, as expected, based on the NPK supply and the amount of nutrients removed from the field. In the winter wheat season, N and P losses exceeded the total income from mineral fertilizers (soil mining). Potassium showed a positive balance only in the treatments with the highest K doses (K2). The K surplus at the N4 level was slightly smaller than at the N3 level. In the sugar beet season, the NPK balance was positive, except for the control treatment and PS + N0P0K0 for K. As for wheat, PS + N3P2K2 had the highest K surplus in the soil–plant system.

4. Discussion

4.1. Basic Soil Parameters

A significant effect of different NPK doses and cyclic PS application on TSC, TN, and pH was observed in the studies. The best results in terms of TSC content were obtained under the conditions of the simultaneous application of PS and NPK fertilizers. Depending on the NPK fertilizer rate, the simultaneous cyclic application of PS increased the TSC content by 6.7–11.5% compared to the control. As a result of applying PS only, the TSC content increased by 3.7% in the topsoil. According to the scientific literature, the effect of PS on TSC (SOC) depends on a number of factors, including the dose, chemical composition of the fertilizer, frequency of application, duration of the experiment, and soil characteristics [37,38,39,40]. The analysis of numerous experiments showed that the TSC content increased by an average of 7% after the application of liquid manure (PS) compared to the values observed in the control soil [18]. It is worth noting that there are also data in the literature indicating no significant or negative effect of PS use on SOC [41,42].
Changes in TSC content can be explained by the direct and indirect effects of PS application. The direct effect is related to the presence of C-org in PS. In our experiment, PS was applied at rates of 49–68 t ha−1 but only three times in a 9-year rotation. In one crop rotation, the total dry matter input in the form of slurry was approximately only 0.85 t ha−1. In addition, the humification coefficient of the PS organic biomass is relatively low, between 4 and 8 kg of C-org m−3 year−1, depending on the dry matter content [43]. Therefore, the positive effect of PS on TSC should primarily be explained by an indirect mechanism through a positive effect on crop yield and a greater input of crop residues to the soil, which was demonstrated in this study (Table 7). In contrast to the PS, the increase in TSC in the mineral-fertilizer-only treatments (NPK) is only possible as a result of C-org accumulation from dead roots and their secretions, as well as from stubble or fallen dead leaves [22]. Two crops were tested in the experiment: winter wheat and sugar beet. The data in the table clearly show that yields increased with NPK doses. Wheat straw was removed from the field; thus, the additional positive effect of PS application on TSC could only result from the increased biomass of the stubble and roots of higher-yielding plants [44]. Unfortunately, these parameters were not analyzed in this study. During the sugar beet season, leaves returned to the soil. Assuming a C content of 40% in the dry mass of the leaves, the supply of this element to the soil ranged from 0.83 to 2.03 t ha−1, depending on the treatment. The average C-org influx was 1.53 t ha−1 in the plots without PS and 1.84 t ha−1 in the plots with PS. It should be noted that this study only analyzed two crops. These crops indicate the direction of changes. However, to determine the TSC balance of the entire crop rotation, it is necessary to consider all plants, especially alfalfa [43,45].
With the increase in NPK supply, the TN content in the soil also increased. However, a significant increase in TN compared to the control was only obtained in the treatments with simultaneous fertilization with PS and NPK. In contrast to our studies, Mazzoncini et al. [46] showed that 15 years of the systematic application of mineral N fertilizer was only sufficient for significantly increasing TN levels by 10.7% compared to the control. In our studies, it is likely that the effect of N fertilization, both mineral and organic, on TN levels was masked by the assimilation of atmospheric N2 through biological nitrogen fixation due to the presence of alfalfa in the crop rotation tested. Previous studies have shown that the net soil N balance after alfalfa harvest can average 84, 148, and 137 kg N ha−1 for 1-year-old, 2-year-old, and 3-year-old stands, respectively [47]. This means that alfalfa stands as young as 2 years old have the potential to provide significant benefits to the soil N status. The increase in soil TSC and TN was related to an increase in soil acidity. However, the addition of PS resulted in a decrease in pH compared to the control, only in treatments with the highest NPK doses. The obtained result is in accordance with studies of other authors on the conditions of Czech soil [16].

4.2. Phosphorus Fractions

In the studies carried out, the NaOH-P fraction was the largest contributor to total P (TP) in the 0–30 cm soil depth. It represents moderately labile forms of P, such as those associated with Fe and Al oxides and humic matter [48]. Considering the acidic reaction of the tested soils, it can be assumed that, in our studies, NaOH-P was mainly associated with Al oxides and hydroxides [23,49]. In contrast to the topsoil, the percentage of NaOH-P and Res-P fractions was similar in the 31–60 cm layer. This can be attributed to the weak P transfer in the soil profile, mainly determined by the phenomena of adsorption and/or precipitation [50]. Therefore, the significant effect of mineral and organic fertilization on P content is mainly observed in the arable layer, where fertilizers are mixed with the soil [17,51,52]. In the studies carried out, a significant effect of fertilization on the content of three fractions (H2O-P, NaHCO3-P, and NaOH-P) in the topsoil was obtained. The obtained result is therefore consistent with previous studies on the long-term effect of phosphorus fertilization on the fractions of this element in the soil [53]. The above-mentioned fractions represent soluble and labile adsorbed mineral P forms and easily mineralized organic P fractions [54]. Only over time do they transform into less labile ones, regardless of whether the source was a mineral or organic fertilizer [55]. The mineral fertilizer application exhibited a stronger effect on the formation of H2O-P and NaHCO3-P contents than PS. This effect can be attributed to the higher input of easily soluble calcium phosphate in the form of superphosphate into the soil. PS application also has a positive effect on the content of mineral forms of P in the soil, including fractions that are potentially available to plants [17]. This is due to the fact that more than 80% of the P in PS can be in mineral form, with about 60% in water-soluble form [56]. Therefore, P compounds in PS are converted to plant-available P shortly after fertilizer application. It is interesting that in our studies, the differences in the effects of NPK and PS mineral fertilizers were smallest in relation to the NaOH-P fraction, which simultaneously indicates that PS is a good alternative source of P in relation to NPK fertilizers in maintaining medium-labile forms of the element in the soil. The results obtained are in line with the results of previous studies, which have shown the significant importance of phosphorus originating from the organic compounds present in PS in the formation of the NaOH-P content [57]. However, contrary to the cited authors, our own research did not show a significant effect of fertilization on HCl-P and Res-P. The lack of a significant effect of mineral and organic fertilization on the content of HCl-P and Res-P is also indicated by previous studies [58]. Differences in the results obtained may be due to the different forms of organic fertilizers used in the experiments—liquid and solid fertilizers. However, some authors emphasize that the changes in P fractions depend mainly on the dose of P and not on the form of organic fertilizer [59]. The environmental conditions of the soil, the type of organic matter, and the microbiological activity of the soil are also important factors in determining the differences in P fraction content [6,60].
In our study, as shown by the PCA analysis, the content of the H2O-P and NaHCO3-P fractions was positively related to TSC but negatively related to soil pH. The latter result indicates the risk of forming P compounds that are less available to plants, e.g., with Al [54]. However, the Na-OH-P fraction was more strongly related to TSC than pH. This indicates the dominant effect of the systematic NPK supply on the system in shaping the content of fractions potentially available to crops. In the study carried out, the positive role of PS fertilization on M3P was noted mainly in combination with mineral fertilizers. As a result, the average increase in M3P in the treatments with PS was 62.8% in the topsoil and 43.5% in the subsoil. This is because, depending on the soil and time after fertilizer application, the plant availability of P from PS is 52–100% of the plant availability of P from mineral fertilizers [55]. In addition, the N/P ratio in manure is usually lower than the N/P ratio in crops [61]. Thus, the PS application promotes faster P accumulation in the soil than N. Regardless of the PS application, the optimal mineral fertilization treatment was N3P2K2. Increasing the level of N fertilization to the level of N4 caused a decrease in the content of M3P. The differences were not significant, but at the same time, wider N:P ratios were observed in the biomass of crop plants (Table 7). This result indicates that excessive and unbalanced doses of N contribute to the depletion of the soil in M3P due to the increased plant demand for P.

4.3. Potassium Fractions

Long-term mineral–organic fertilization significantly affected the content of two K fractions in the 0–30 cm soil depth: H2O-K and Ex-K. In the deeper soil depth (31–60 cm), fertilization only significantly affected Ex-K. The direct cause of H2O-K accumulation in the topsoil was the application of mineral fertilizers and manure. Over 90% of the total K contained in pig slurry can be diluted in water [62]; thus, the fate of this component in the soil is the same as that of mineral fertilizers. Therefore, the higher the total dose of K, the higher the H2O-K content in the soil (Table 5). This process took place intensively at the soil depth of 31–60 cm, causing a reduction in mobile or weakly bound forms of K. This explains the lack of any significant effect of fertilization on H2O-K in this soil depth. The earlier field experiments have shown that the degree of change in the content of H2O-K and Ex-K fractions depends on the soil properties, rate of fertilizer, and the land use system [63,64]. Soil exchangeable K is a function of the clay fraction, clay mineral structure, and SOC content [65]. These components determine the CEC and thus the soil potential for K+ exchange capacity [66]. The long-term application of slurry can increase CEC and thus Ex-K, especially in soils with a low mineral colloid content [19]. In the study, the fertilization treatments tested did not significantly affect CECs. However, fertilization had a positive effect on TSC. Therefore, the reasons for the increase in Ex-K should be related not only to the constant supply of K from fertilizers but also to the increased adsorption potential of K by soils enriched with organic matter [67]. This phenomenon is confirmed using PCA, as the Ex-K fraction was positively related to TSC, especially in the 0–30 cm layer. The lower concentration of Ex-K in the soil depth of 31–60 cm compared to 0–30 cm may be due to the lower amount of TSC, as indicated by Balík et al. [33]. Another explanation could be a more intensive K uptake from deeper soil depths, especially since they are better hydrated than the topsoil [68]. In our study, no significant difference in Ex-K content was found between the control (N0P0K0) and PS + N0P0K0 treatment. This is due to the frequency of applying PS and the lower doses of K introduced into the soil compared to mineral fertilizers. According to previous studies, the systematic long-term application of PS can increase Ex-K [69,70].
In contrast to Ex-K, the fertilization treatments tested had little effect on Ne-K content. This result is similar to the results obtained by Balík et al. [63]. On the other hand, Das et al. [64] found a significant effect of fertilization over the years on Ne-K. According to Kitagawa et al. [34], the non-exchangeable fixation potential K is relatively constant. In addition, Ne-K is a moderately or freely available fraction of K in the soil that is independent of Ex-K. Despite this, in our own studies, a positive correlation between Ex-K and Ne-K was observed. According to Balík et al. [33], the amount released from the Ne-K to the available K form was 46–69 kg K ha−1 year−1, depending on the site. Thus, our studies confirm that systematic K fertilization results in the saturation of non-exchangeable K binding sites and ultimately in Ne-K accumulation. The study also observed a trend toward Res-K (lattice K) accumulation in the treatments with a simultaneous application of PS and NPK fertilizers. The maximum increase in Res-K (as well as TK) in the 0–30 cm soil depth was obtained in the PS + N4P2K2 treatment. The Res-K fraction is slightly related to the actual uptake by plants [71]. Nevertheless, Res-K is a measure of their potential to provide adequate amounts of K to plants [24]. In the absence of K fertilizer application, the residual fraction is responsible for replenishing the labile fractions as they are depleted by plant uptake [33]. In the studies, the Res-K level was not very high [63,69]. Nevertheless, the Res-K content was sufficient for the control without the K fertilizer in maintaining the content of this nutrient in a plant-available form (M3K) at a good level, in the same class as the treatments with the highest K doses [72]. It is worth noting that the highest M3K and Ex-K contents were found in the PS + N3P2K2 treatment. At the same time, it was shown that in the PS + N3P2K2 treatment, the K surplus was slightly higher than in the PS + N4P2K2 treatment in every year of the study, regardless of the plant tested. Thus, the results indicate that the highest nitrogen (N) doses in crop rotations do not increase potassium (K) accumulation in the soil; rather, they create a risk of K deficiency. This may explain why wheat did not respond positively to the highest dose of N (Table 7).
The total balance of P and K requires taking into account all plants in the crop rotation. However, the results obtained indicate the direction of changes depending on the fertilization treatment.

5. Conclusions

Long-term NPK mineral fertilization combined with cyclic pig slurry application only before tuber crops in a 9-year rotation significantly improved the soil’s potential in supplying adequate P and K to crops. With the increase in the annual NPK input to the soil, regardless of the type of fertilizer, not only did the content of labile and medium-labile fractions of P and K increase, but also the content of the total C and N. However, in the treatment with the highest N dose, there was a trend toward a decrease in the content of P and K fractions potentially available to plants (NaHCO3-P and Ex-K) and the plant-available P and K determined using the Mehlich 3 method. As a result, applying the highest N dose without increasing the PK dose no longer resulted in an increase in crop yield. In the evaluated experiment, the level of bioavailable P limited the yield of selected crops to a greater extent than K.

Supplementary Materials

The following supporting information can be downloaded at https://www.mdpi.com/article/10.3390/agronomy15051183/s1: Table S1: Weather conditions in 2019–2021. Prague-Ruzyně measuring station, Czechia. Table S2: Two-way ANOVA results—effect of long-term application of pig slurry and NPK fertilizers on basic soil parameters. Table S3: Two-way ANOVA results of long-term application of pig slurry and NPK fertilizer on the content of phosphorus (P) fractions determined using the Hedley method; total P (TP) and plant-available P (M3P) via the Mehlich3 method. Table S4: Two-way ANOVA results of the long-term application of pig slurry and NPK fertilizer on the content of potassium (K) fractions, quasi-total K (TK), and plant-available K (M3K) according to the Mehlich 3 method. Table S5: Correlation matrix loadings and variance of significant principal components (PCs) for basic soil parameters, Hedley P fraction, total P, plant-available P, and average annual P supply in fertilizers in the analyzed crop rotation (n = 8). Table S6: Correlation matrix loadings and variance of significant principal components (PCs) for basic soil parameters, K fraction, total K, plant-available K, and average annual K supply in fertilizers in the analyzed crop rotation (n = 8). Figure S1: Effect of the long-term application of pig slurry (PS) and different doses of mineral fertilizers (NPK) on the distribution ratio (%) of soil P factions. Figure S2: Effect of the long-term application of pig slurry (PS) and different doses of mineral fertilizers (NPK) on the distribution ratio (%) of soil K factions. Figure S3: Crop yield as a function of plant-available P and K (M3P and M3K) content in two soil depths. Key: GY—grain yield of winter wheat (a,b); TY—taproot yield of sugar beet (c,d).

Author Contributions

Conceptualization, P.B. and E.K.; methodology, P.B., L.H. and R.Ł.; software, R.Ł. and L.H.; validation, P.B. and L.H.; formal analysis, P.B. and R.Ł.; investigation, P.B., L.H. and R.Ł.; resources, R.Ł. and L.H.; data curation, R.Ł. and E.K.; writing—original draft preparation, P.B., R.Ł. and L.H.; writing—review and editing, P.B. and L.H.; visualization, P.B. and R.Ł.; supervision, P.B. and L.H.; project administration, E.K. All authors have read and agreed to the published version of the manuscript.

Funding

This work was supported by the research plan of the Ministry of Agriculture of Czechia: MZE-RO0425. The publication was financed by the Polish Minister of Science and Higher Education as part of the Strategy of the Poznan University of Life Sciences for 2024–2026 in the field of improving cientific research and development work in priority research areas.

Data Availability Statement

The data presented in this study are available upon request from the corresponding author.

Conflicts of Interest

The authors declare no conflicts of interest.

References

  1. Smit, A.L.; Bindraban, P.S.; Schröder, J.J.; Conijn, J.H.; van der Meer, H.G. Phosphorus in Agriculture: Global Resources, Trends and Developments. Report 282 to the Steering Committee Technology Assessment of the Ministry of Agriculture, Nature and Food Quality, The Netherlands and in Collaboration with the Nutrient Flow Task Group (NFTG), Supported by DPRN (Development Policy Network); Plant Research International: Wageningen, The Netherlands, 2009; p. 282. [Google Scholar]
  2. Cordell, D.; Drangert, J.-O.; White, S. The Story of Phosphorus: Global Food Security and Food for Thought. Glob. Environ. Change 2009, 19, 292–305. [Google Scholar] [CrossRef]
  3. Wang, C.; Xie, Y.; Tan, Z. Soil potassium depletion in global cereal croplands and its implications. Sci. Total Environ. 2024, 10, 167875. [Google Scholar] [CrossRef] [PubMed]
  4. Harley, A.; Gilkes, R. Factors influencing the release of plant nutrient elements from silicate rock powders: A geochemical overview. Nutr. Cycl. Agroecosyst. 2000, 56, 11–36. [Google Scholar] [CrossRef]
  5. Mengel, K.; Kirkby, E.A.; Kosegarten, H.; Appel, T. Phosphorus. In Principles of Plant Nutrition; Mengel, K., Kirkby, E.A., Kosegarten, H., Appel, T., Eds.; Springer: Dordrecht, The Netherlands, 2001; pp. 453–479. [Google Scholar] [CrossRef]
  6. Dębicka, M. The Role of Organic Matter in Phosphorus Retention in Eutrophic and Dystrophic Terrestrial Ecosystems. Agronomy 2024, 14, 1688. [Google Scholar] [CrossRef]
  7. Zörb, C.; Senbayram, M.; Peiter, E. Potassium in agriculture-status and perspectives. J. Plant Physiol. 2014, 171, 656–669. [Google Scholar] [CrossRef] [PubMed]
  8. Sparks, D.L. Potassium Dynamics in Soils. In Advances in Soil Science; Stewart, B.A., Ed.; Springer: New York, NY, USA, 1987; Volume 6, pp. 1–63. [Google Scholar] [CrossRef]
  9. Alewell, C.; Ringeval, B.; Ballabio, C.; Robinson, D.A.; Panagos, P.; Borrelli, P. Global phosphorus shortage will be aggravated by soil erosion. Nat. Commun. 2020, 11, 4546. [Google Scholar] [CrossRef]
  10. Lu, D.; Dong, Y.; Chen, X.; Wang, H.; Zhou, J. Comparison of potential potassium leaching associated with organic and inorganic potassium sources in different arable soils in China. Pedosphere 2022, 32, 330–338. [Google Scholar] [CrossRef]
  11. Muntwyler, A.; Panagos, P.; Pfister, S.; Lugato, E. Assessing the phosphorus cycle in European agricultural soils: Looking beyond current national phosphorus budgets. Sci. Total Environ. 2024, 906, 167143. [Google Scholar] [CrossRef]
  12. Tambone, F.; Orzi, V.; D’Imporzano, G.; Adani, F. Solid and liquid fractionation of digestate: Mass balance, chemical characterization, and agronomic and environmental value. Bioresour. Technol. 2017, 243, 1251–1256. [Google Scholar] [CrossRef]
  13. Chen, Y.; Camps-Arbestain, M.; Shen, Q.; Singh, B.; Cayuela, M.L. The long-term role of organic amendments in building soil nutrient fertility: A meta-analysis and review. Nutr. Cycl. Agroecosyst. 2018, 111, 103–125. [Google Scholar] [CrossRef]
  14. Lal, R. Soil health and carbon management. Food Energy Secur. 2016, 5, 212–222. [Google Scholar] [CrossRef]
  15. Bhogal, A.; Nicholson, F.A.; Rollett, A.; Taylor, M.; Litterick, A.; Whittingham, M.J.; Williams, J.R. Improvements in the Quality of Agricultural Soils Following Organic Material Additions Depend on Both the Quantity and Quality of the Materials Applied. Front. Sustain. Food Syst. 2018, 2, 9. [Google Scholar] [CrossRef]
  16. Hlisnikovský, L.; Menšík, L.; Čermak, P.; Kunzová, E. Long-Term Effect of Pig Slurry and Mineral Fertilizer Additions on Soil Nutrient Content, Field Pea Grain and Straw Yield under Winter Wheat–Spring Barley–Field Pea Crop Rotation on Cambisol and Luvisol. Land 2022, 11, 187. [Google Scholar] [CrossRef]
  17. Boitt, G.; Schmitt, E.D.; Gatiboni, L.; Wakelin, S.; Black, A.; Sacomori, W.; Cassol, P.; Condron, L.M. Fate of phosphorus applied to soil in pig slurry under cropping in southern Brazil. Geoderma 2018, 321, 164–172. [Google Scholar] [CrossRef]
  18. Yost, J.L.; Schmidt, A.M.; Koelsch, R.; Schott, L.R. Effect of swine manure on soil health properties: A systematic review. Nutrient management & soil & plant analysis. Soil Sci. Soc. Am. J. 2021, 86, 450–486. [Google Scholar] [CrossRef]
  19. Bernal, M.P.; Roig, A.; Lax, A.; Navarro, A.F. Effect of the application of pig slurry on some physico-chemical and physical properties of calcareous soils. Bioresour. Technol. 1992, 42, 233–239. [Google Scholar] [CrossRef]
  20. Benedet, L.; Wilbert Ferreira, G.; Brunetto, G.; Loss, A.; Emílio Lovato, P.; Rogério Lourenzi, C.; Godinho Silva, S.H.; Curi, N.; José Comin, J. Use of Swine Manure in Agriculture in Southern Brazil: Fertility or Potential Contamination? In Soil Contamination-Threats and Sustainable Solutions; Larramendy, M.L., Soloneski, S., Eds.; IntechOpen Limited: London, UK, 2020; Available online: https://www.intechopen.com/chapters/74212 (accessed on 17 February 2025).
  21. Martinez, E.; Maresma, A.; Biau, A.; Berenguer, P.; Cela, S.; Santiveri, F.; Michelena, A.; Lloveras, J. Long-term effects of liquid swine manure on soil organic carbon and Cu/Zn levels in soil and maize. Nutr. Cycl. Agroecosys. 2020, 118, 193–205. [Google Scholar] [CrossRef]
  22. Scheid, D.L.; da Silva, R.F.; da Silva, V.R.; Da Ros, C.O.; Pinto, M.A.B.; Gabriel, M.; Cherubin, M.R. Changes in soil chemical and physical properties in pasture fertilised with liquid swine manure. Sci. Agric. 2020, 77, e20190017. [Google Scholar] [CrossRef]
  23. Hedley, M.J.; Stewart, J.W.B.; Chauhan, B.S. Changes in inorganic and organic soil phosphorus fractions induced by cultivation practices and by laboratory incubations. Soil Sci. Soc. Am. J. 1982, 46, 970–976. [Google Scholar] [CrossRef]
  24. Madaras, M.; Koubova, M. Potassium availability and soil extraction tests in agricultural soils with low exchangeable potassium content. Plant Soil Environ. 2015, 61, 234–239. [Google Scholar] [CrossRef]
  25. Körschens, M.; Albert, E.; Armbruster, M.; Barkusky, D.; Baumecker, M.; Behle-Schalk, L.; Bischoff, R.; Čergan, Z.; Ellmer, F.; Herbst, F.; et al. Effect of mineral and organic fertilization on crop yield, nitrogen uptake, carbon and nitrogen balances, as well as soil organic carbon content and dynamics: Results from 20 European long-term field experiments of the twenty-first century. Arch. Agron. Soil Sci. 2013, 59, 1017–1040. [Google Scholar] [CrossRef]
  26. Ferreira, P.A.A.; Ceretta, C.A.; Lourenzi, C.R.; De Conti, L.; Marchezan, C.; Girotto, E.; Tiecher, T.L.; Palermo, N.M.; Parent, L.-É.; Brunetto, G. Long-Term Effects of Animal Manures on Nutrient Recovery and Soil Quality in Acid Typic Hapludalf under No-Till Conditions. Agronomy 2022, 12, 243. [Google Scholar] [CrossRef]
  27. Menšík, L.; Hlisnikovský, L.; Pospíšilová, L.; Kunzová, E. The effect of application of organic manures and mineral fertilizers on the state of soil organic matter and nutrients in the long-term field experiment. J. Soils Sediments 2018, 18, 2813–2822. [Google Scholar] [CrossRef]
  28. Auzins, A.; Leimane, I.; Krievina, A.; Morozova, I.; Miglavs, A.; Lakovskis, P. Evaluation of Environmental and Economic Performance of Crop Production in Relation to Crop Rotation, Catch Crops, and Tillage. Agriculture 2023, 13, 1539. [Google Scholar] [CrossRef]
  29. de Oliveira, D.A.; Pinheiro, A.; da Veiga, M. Effects of pig slurry application on soil physical and chemical properties and glyphosate mobility. Rev. Bras. Ciência Solo 2014, 38, 1421–1431. [Google Scholar] [CrossRef]
  30. Ross, D.; Ketterings, Q. Recommended methods for determining soil cation exchange capacity [Chapter 9]. In Recommended Soil Testing Procedures for the Northeastern United States, 3rd ed.; No. 493; Northeastern Regional Publication; The Northeast Coordinating Committee for Soil Testing: Newark, DE, USA, 2011; pp. 75–86. [Google Scholar]
  31. Tiessen, H.; Moir, J.O. Characterization of available P by sequential extraction. In Soil Sampling and Methods of Analysis; Canadian Society of Soil Science; Carter, M.R., Ed.; Lewis Publishers: Boca Raton, CA, USA, 1993; pp. 75–86. [Google Scholar]
  32. Cho, Y.H.; Nielsen, S.S. Phosphorus Determination by Murphy-Riley Method. In Food Analysis Laboratory Manual; Food Science Text Series; Springer: Cham, Switzerland, 2017; pp. 153–156. [Google Scholar] [CrossRef]
  33. Balík, J.; Kulhanek, M.; Černy, J.; Sedlař, O.; Suran, P. Potassium fractions in soil and simple K balance in long-term fertilising experiments. Soil Water Res. 2020, 15, 211–219. [Google Scholar] [CrossRef]
  34. Kitagawa, Y.; Yanai, J.; Nakao, A. Evaluation of nonexchangeable potassium content of agricultural soils in Japan by the boiling HNO3 extraction method in comparison with exchangeable potassium. Soil Sci. Plant Nutr. 2018, 64, 116–122. [Google Scholar] [CrossRef]
  35. ISO 54321: 2020; International Standards. Soil, Treated Biowaste, Sludge and Waste—Digestion of Aqua Regia Soluble Fractions of Elements. ISO: Geneva, Switzerland, 2020. Available online: https://cdn.standards.iteh.ai/samples/75441/cf65d2ce8bc54b5aa2e373cca2737b2f/ISO-54321-2020.pdf (accessed on 8 January 2024).
  36. Mehlich, A. Mehlich 3 soil test extractant: A modification of Mehlich 2 extractant. Commun. Soil Sci. Plant Anal. 1984, 15, 1409–1416. [Google Scholar] [CrossRef]
  37. Iyyemperumal, K.; Shi, W. Soil microbial community com-position and structure: Residual effects of contrasting N fertilization of swine lagoon effluent versus ammonium nitrate. Plant Soil 2007, 292, 233–242. [Google Scholar] [CrossRef]
  38. Brunetto, G.; Comin, J.J.; Schmitt, D.E.; Guardini, R.; Mezzari, C.P.; Oliveira, B.S.; de Moraes, M.P.; Gatiboni, L.C.; Lovato, P.E.; Ceretta, C.A. Changes in soil acidity and organic carbon ina sandy typic hapludalf after medium-term pig-slurry and deep-litterapplication. Rev. Bras. Ciênc. Solo 2012, 36, 1620–1628. [Google Scholar] [CrossRef]
  39. Yanardag, A.B.; Mermut, A.; Cano, A.F.; Garrido, M.G. Academic Research and Reviews in Agriculture, Forestry and Aquaculture Sciences. In Changes in Soil Properties, Quality and Productivity Following Pig Slurry Application in Semiarid Region of Spain; Atík, A., Ed.; Duvar Publishing: Izmir, Turkey, 2021; pp. 77–97. [Google Scholar]
  40. Cote, D.; Ndayegamiye, A. Effect of long-term pig slurry and solid cattle manure application on soil chemical and biological prop-erties. Can. J. Soil Sci. 1989, 69, 39–47. [Google Scholar] [CrossRef]
  41. Plaza, C.; García-Gil, J.C.; Polo, A. Effects of pig slurry application on soil chemical properties under semiarid conditions. Agrochimica 2005, 49, 87–92. [Google Scholar]
  42. Comin, J.J.; Loss, A.; da Veiga, M.; Guardini, R.; Schmitt, D.E.; de Oliveira, V.; Filho, P.B.; da Rosa Couto, R.; Benedet, L.; Júnior, V.M.; et al. Physical properties and organic carbon content of a Typic Hapludult soil fertiliser with pig slurry and piglitter in a no-tillage system. Soil Res. 2013, 51, 459–470. [Google Scholar] [CrossRef]
  43. Körschens, M.; Rogasik, J.; Schulz, E. Balance and standard values of soil organic matter. Landbauforsch. Volkenrode 2005, 55, 1–10. [Google Scholar]
  44. Duncan, E.G.; O’Sullivan, C.A.; Roper, M.M.; Palta, J.A.; Whisson, K.; Peoples, M.B. Yield and nitrogen use efficiency of wheat increased with root length and biomass due to nitrogen, phosphorus, and potassium interactions. J. Plant Nutr. Soil Sci. 2018, 181, 364–373. [Google Scholar] [CrossRef]
  45. Song, X.; Fang, C.; Yuan, Z.Q.; Li, F.M. Long-Term Growth of Alfalfa Increased Soil Organic Matter Accumulation and Nutrient Mineralization in a Semi-Arid Environment. Front. Environ. Sci. 2021, 9, 649346. [Google Scholar] [CrossRef]
  46. Mazzoncini, M.; Sapkota, T.B.; Bàrberi, P.; Antichi, D.; Risaliti, R. Long-term effect of tillage, nitrogen fertilization and cover crops on soil organic carbon and total nitrogen content. Soil Tillage Res. 2011, 114, 165–174. [Google Scholar] [CrossRef]
  47. Kelner, D.J.; Vessey, J.K.; Entz, M.H. The nitrogen dynamics of 1-, 2- and 3-year stands of alfalfa in a cropping system. Agric. Ecosyst. Environ. 1997, 64, 1–10. [Google Scholar] [CrossRef]
  48. Zhu, Y.; Wu, F.; He, Z.; Guo, J.; Qu, X.; Xie, F.; Giesy, J.P.; Liao, H.; Guo, F. Characterization of organic phosphorus in lake sediments by sequential fractionation and enzymatic hydrolysis. Environ. Sci. Technol. 2013, 47, 7679–7687. [Google Scholar] [CrossRef]
  49. Penn, C.J.; Camberato, J.J. A Critical Review on Soil Chemical Processes that Control How Soil pH Affects Phosphorus Availability to Plants. Agriculture 2019, 9, 120. [Google Scholar] [CrossRef]
  50. Pierzynski, G.M.; McDowell, R.W.; Sims, T.J. Chemistry, cycling, and potential movement of inorganic phosphorus in soils. In Phosphorus: Agriculture and the Environment, Agronomy Monograph; No. 46; Sims, J.T., Sharpley, A.N., Eds.; American Society of Agronomy, Crop Science Society of America, Soil Science Society of America: Madison, WI, USA, 2005; pp. 53–86. [Google Scholar] [CrossRef]
  51. Wang, K.; Zhang, Z.J.; Zhu, Y.M.; Wang, G.H.; Shi, D.C.; Christie, P. Surface water phosphorus dynamics in rice fields receiving fertilizer and manure phosphorus. Chemosphere 2001, 42, 209–214. [Google Scholar] [CrossRef] [PubMed]
  52. De Conti, L.; Ceretta, C.A.; Ferreira, P.A.A.; Lorensini, A.; Lourenzi, C.; Vidal, R.F.; Tassinari, A.; Brunetto, G. Effects of Pig Slurry Application and Crops on Phosphorus Content in Soil and the Chemical Species in Solution. Rev. Bras. Ciênc. Solo 2015, 39, 774–787. [Google Scholar] [CrossRef]
  53. Biassoni, M.M.; Vivas, H.; Gutiérrez-Boem, F.H.; Salvagiotti, F. Changes in soil phosphorus (P) fractions and P bioavailability after 10 years of continuous P fertilization. Soil Tillage Res. 2023, 232, 105777. [Google Scholar] [CrossRef]
  54. Wang, Y.; Zhang, W.; Müller, T.; Lakshmanan, P.; Liu, Y.; Liang, T.; Wang, L.; Yang, H.; Chen, X. Soil phosphorus availability and fractionation in response to different phosphorus sources in alkaline and acid soils: A short-term incubation study. Sci. Rep. 2023, 13, 5677. [Google Scholar] [CrossRef] [PubMed]
  55. Eghball, B.; Wienhold, B.J.; Woodbury, B.L.; Eigenberg, R.A. Plant Availability of Phosphorus in Swine Slurry and Cattle Feedlot Manure. Agron. J. 2005, 97, 542–548. Available online: https://digitalcommons.unl.edu/usdaarsfacpub/1186 (accessed on 11 April 2025). [CrossRef]
  56. Wienhold, B.J.; Miller, P.S. Phosphorus fractionation in manure from swine fed traditional and low phytate corn diets. J. Environ. Qual. 2004, 33, 389–393. [Google Scholar] [CrossRef]
  57. Lehmann, J.; Lan, Z.; Hyland, C.; Sato, S.; Solomon, D.; Ketterings, Q. Long-term dynamics of phosphorus forms and retention in manure amended soils. Environ. Sci. Technol. 2005, 39, 6672–6680. [Google Scholar] [CrossRef] [PubMed]
  58. MacKenzie, A.; Liang, B.; Zhang, T.; Drury, C. Soil test phosphorus and phosphorus fractions with long-term phosphorus addition and depletion. Soil Sci. Soc. Am. J. 2004, 68, 519–528. [Google Scholar] [CrossRef]
  59. Negassa, W.; Leinweber, P. How does the Hedley sequential phosphorus fractionation reflect impacts of land use and management on soil phosphorus: A review. J. Plant Nutr. Soil Sci. 2009, 172, 305–325. [Google Scholar] [CrossRef]
  60. Cross, A.F.; Schlesinger, W.H. A literature review and evaluation of the Hedley fractionation: Applications to the biogeochemical cycle of soil phosphorus in natural ecosystems. Geoderma 1995, 64, 197–214. [Google Scholar] [CrossRef]
  61. van Es, H.M.; Schindelbeck, R.R.; Jokela, W.E. Effect of manure application timing, crop, and soil type on phosphorus leaching. J. Environ. Qual. 2004, 33, 1070–1080. [Google Scholar] [CrossRef] [PubMed]
  62. Marszałek, M.; Kowalski, Z.; Makara, A. Physicochemical and microbiological characteristics of pig slurry. Tech. Trans. Chem. 2014, 1, 81–91. [Google Scholar]
  63. Balík, J.; Černý, J.; Kulhánek, M.; Sedlář, O.; Suran, P. Balance of potassium in two long-term field experiments with different fertilization treatments. Plant Soil Environ. 2019, 65, 225–232. [Google Scholar] [CrossRef]
  64. Das, A.; Biswas, D.R.; Sharma, V.K.; Ray, P. Soil potassium fractions under two contrasting land use systems of Assam. Indian J. Agric. Sci. 2019, 89, 1340–1343. [Google Scholar] [CrossRef]
  65. Baruah, H.C.; Bora, D.K.; Baruah, T.C.; Nath, A.K. Fixation of potassium in three major soil orders of Assam. J. Pot. Res. 1991, 7, 170–175. [Google Scholar]
  66. Lalitha, M.; Dhakshinamoorthy, M. Forms of soil potassium—A review. Agric. Rev. 2014, 35, 64–68. [Google Scholar] [CrossRef]
  67. Andrews, E.M.; Kassama, S.; Smith, E.E.; Brown, P.H.; Khalsa, S.D.S. A Review of Potassium-Rich Crop Residues Used as Organic Matter Amendments in Tree Crop Agroecosystems. Agriculture 2021, 11, 580. [Google Scholar] [CrossRef]
  68. Simonsson, M.; Andersson, S.; Andrist-Rangel, Y.; Hillier, S.; Mattson, L.; Öborn, I. Potassium release and fixation as a function of fertilizer application rate and soil parent material. Geoderma 2007, 140, 188–198. [Google Scholar] [CrossRef]
  69. Chikuvire, T.J.; Muchaonyerwa, P.; Zengeni, R. Long-term effects of pig slurry application on selected soil quality parameters and tissue composition of maize in a subhumid subtropical environment. S. Afr. J. Plant Soil 2019, 36, 143–148. [Google Scholar] [CrossRef]
  70. Shakoor, A.; Bosch-Serra, À.D.; Alberdi, J.R.O.; Herrero, C. Seven years of pig slurry fertilization: Impacts on soil chemical properties and the element content of winter barley plants. Environ. Sci. Pollut. Res. 2022, 29, 74655–74668. [Google Scholar] [CrossRef]
  71. Madaras, M.; Koubova, M.; Lipavský, J. Stabilization of available potassium across soil and climatic conditions of the Czech Republic. Arch. Agron. Soil Sci. 2010, 56, 433–449. [Google Scholar] [CrossRef]
  72. Zbíral, J.; Němec, P. Integrating of Mehlich 3 extractant into the Czech soil testing scheme. Commun. Soil Sci. Plant Anal. 2000, 31, 2171–2182. [Google Scholar] [CrossRef]
Figure 1. The Ruzyně Fertilizer Experiment (RFE) location in Prague-Ruzyně, Czechia. Field Strip III was selected for analysis, and the plots were fertilized with pig slurry (PS) and different rates of NPK fertilizers (marked in black and bold font).
Agronomy 15 01183 g001
Figure 2. Sequential analysis of soil phosphorus (P) fractions according to the Hedley procedure modified by Tiessen and Moir [31].
Agronomy 15 01183 g002
Figure 3. Scheme of the fractionation of potassium (K) in soil.
Agronomy 15 01183 g003
Figure 4. Principal component analysis (PCA) biplot of the soil basic parameters (pH; TSC—total soil carbon; TN—total nitrogen; C:N; CEC—cation exchange capacity); different P and K fractions and plant-available P and K (M3P and M3K) in the two soil depths. The additional variable represents the average annual P and K input in crop rotation (*Pf and *Kf) marked in red. (a) P fractions, 0–30 cm; (b) P fractions, 31–60 cm; (c) K fractions, 0–30 cm; (d) K fractions, 31–60 cm.
Agronomy 15 01183 g004
Table 1. Chemical composition of the pig slurry (PS) used in the current crop rotation for potatoes and sugar beets.
CharacteristicsUnitRangeMean
pH-6.7–7.47.1
Dry matter (DM)g kg−142.3–60.651.4
Ashg kg−1 of DM166.8–226.3196.5
ConductivitymS m−12377–24412409
Total Ng kg−1 of DM25.1–26.025.5
Total Pg kg−1 of DM9.8–12.511.1
Total Kg kg−1 of DM23.2–26.925.1
Total Cag kg−1 of DM21.0–25.723.3
Total Mgg kg−1 of DM7.0–9.78.3
Total Cumg kg−1 of DM136.1–159.7147.9
Total Znmg kg−1 of DM384.5–657.6521.0
Total Pbmg kg−1 of DM1.09–1.601.35
Total Cdmg kg−1 of DM0.276–0.4770.376
Table 2. Mean annual rates of the main macronutrients (NPK) in mineral fertilizers and pig slurry (PS) over a nine-year crop rotation period (kg ha−1).
TreatmentsAlfalfaAlfalfaWinter WheatSugar BeetSpring BarleyPotatoesWinter WheatSugar BeetSpring BarleyMean
N0P0K00-0-00-0-00-0-00-0-00-0-00-0-00-0-00-0-00-0-00-0-0
N1P1K10-22-1330-31-18340-21-8080-28-12530-21-6650-22-12040-21-8080-28-12530-21-6639-24-109
N3P2K20-31-1830-43-24955-26-100160-35-16650-26-8370-31-18655-26-100160-35-16650-26-8367-31-146
N4P2K20-31-1830-43-24975-26-100200-35-16670-26-83110-31-18675-26-100200-35-16670-26-8391-31-146
PS + N0P0K00-0-00-0-00-0-089-39-880-0-064-28-630-0-089-39-880-0-027-12-27
PS + N1P1K10-22-1330-31-18340-21-80169-67-21330-21-66114-50-18340-21-80169-67-21330-21-6666-36-135
PS + N3P2K20-31-1830-43-24955-26-100249-74-25450-26-83134-59-24955-26-100249-74-25450-26-8394-43-173
PS + N4P2K20-31-1830-43-24975-26-100289-74-25470-26-83174-59-24975-26-100289-74-25470-26-83116-43-173
PS—pig slurry at a rate of 68 t ha−1 (sugar beet) and 49 t ha−1 (potatoes).
Table 3. Basic soil chemical properties after 65 years of pig slurry (PS) application and different doses of NPK in mineral fertilizers (mean ± SEM).
TreatmentspHTSC
g kg−1
TN
g kg−1
C:NCEC
mM kg−1
Soil depth: 0–30 cm
N0P0K05.35 ± 0.03 ab13.35 ± 0.42 c1.20 ± 0.02 d11.1 ± 0.3175.4 ± 4.05
N1P1K15.53 ± 0.19 a13.68 ± 0.25 abc1.20 ± 0.03 d11.5 ± 0.2277.3 ± 4.21
N3P2K25.40 ± 0.15 ab13.56 ± 0.26 bc1.25 ± 0.01 cd10.8 ± 0.2774.2 ± 4.24
N4P2K25.16 ± 0.17 ab13.49 ± 0.38 bc1.28 ± 0.01 bcd10.5 ± 0.2574.8 ± 3.71
PS + N0P0K05.40 ± 0.11 ab13.93 ± 0.22 abc1.25 ± 0.06 cd11.3 ± 0.5374.2 ± 2.87
PS + N1P1K15.26 ± 0.13 ab14.25 ± 0.21 abc1.33 ± 0.02 abc10.7 ± 0.0873.1 ± 3.32
PS + N3P2K25.06 ± 0.10 ab14.88 ± 0.19 a1.39 ± 0.01 ab10.7 ± 0.1076.4 ± 3.32
PS + N4P2K24.86 ± 0.07 b14.61 ± 0.16 ab1.41 ± 0.02 a10.4 ± 0.1174.6 ± 2.34
Soil depth: 31–60 cm
N0P0K05.97 ± 0.19 ab9.54 ± 0.710.86 ± 0.0310.9 ± 0.9994.0 ± 5.67
N1P1K16.28 ± 0.22 a9.92 ± 0.870.89 ± 0.0311.2 ± 0.9198.1 ± 6.08
N3P2K25.79 ± 0.23 ab9.95 ± 0.720.91 ± 0.0310.9 ± 0.7087.9 ± 8.11
N4P2K25.61 ± 0.28 ab11.59 ± 1.290.97 ± 0.0411.9 ± 1.2085.3 ± 7.64
PS + N0P0K05.48 ± 0.08 ab9.60 ± 0.500.96 ± 0.0510.0 ± 0.2081.6 ± 3.76
PS + N1P1K15.54 ± 0.11 ab8.89 ± 0.380.91 ± 0.049.8 ± 0.1883.8 ± 4.70
PS + N3P2K25.37 ± 0.12 b9.82 ± 0.500.98 ± 0.0510.1 ± 0.3085.3 ± 4.70
PS + N4P2K25.44 ± 0.16 ab10.13 ± 0.660.10 ± 0.079.9 ± 0.2082.5 ± 3.69
Key: pH—soil reaction in 1 M KCl; TSC—total soil carbon; TN—total nitrogen; C:N—TSC:TN ratio; CEC—cation exchange capacity. Letters indicate significant differences between treatments (p ≤ 0.05).
Table 4. Soil P fractions (in mg kg−1) after 65 years of pig slurry (PS) application and different doses of NPK in mineral fertilizers (mean ± SEM).
Soil DepthTreatmentH2O-PNaHCO3-PNaOH-PHCl-PRes-PTP
0–30 cmN0P0K02.38 ± 0.42 c23.2 ± 1.89 e181.7 ± 26.6 c132.0 ± 14.1124.5 ± 8.6463.8 ± 36.8 d
N1P1K15.79 ± 0.89 bc54.2 ± 1.79 cd176.2 ± 25.1 c126.4 ± 15.5127.0 ± 10.0489.6 ± 36.0 cd
N3P2K28.60 ± 0.86 b64.5 ± 0.87 c268.0 ± 16.7 ab143.7 ± 5.8139.7 ± 3.3624.4 ± 20.3 ab
N4P2K28.49 ± 0.62 b60.6 ± 1.08 cd209.2 ± 13.9 bc126.5 ± 5.2134.8 ± 3.5539.6 ±12.4 bcd
PS4.98 ± 0.57 bc48.6 ± 3.06 d251.8 ± 26.4 ab150.2 ± 11.8145.6 ± 6.2601.2 ± 37.6 bc
PS + N1P1K114.98 ± 1.54 a80.2 ± 4.06 b231.9 ± 16.6 c140.9 ± 8.2141.2 ± 14.1609.3 ± 25.9 ab
PS + N3P2K219.25 ± 1.24 a94.1 ± 2.30 a284.2 ± 21.8 a146.3 ± 6.7130.8 ± 9.8674.6 ± 33.9 a
PS + N4P2K217.46 ± 1.80 a90.1 ± 4.26 ab256.8 ± 34.1 ab131.8 ± 11.1145.9 ± 10.4642.1 ± 49.4 ab
31–60 cmN0P0K01.61 ± 0.19 c15.3 ± 2.9 d113.8 ± 20.578.9 ± 8.8114.9 ± 7.3324.5 ± 30.7 b
N1P1K11.62 ± 0.21 c25.0 ± 2.1 cd96.8 ± 7.983.6 ± 5.3114.7 ± 9.8321.8 ± 13.1 ab
N3P2K22.38 ± 0.34 bc30.2 ± 2.6 c147.3 ± 17.785.4 ± 8.2126.9 ± 2.2392.2 ± 25.3 ab
N4P2K22.49 ± 0.29 bc31.8 ± 2.9 bc117.4 ± 9.183.7 ± 8.7114.4 ± 6.2349.9 ± 8.7 ab
PS1.99 ± 0.20 c23.4 ± 2.2 cd129.2 ± 18.087.7 ± 9.3119.2 ± 1.3361.6 ± 26.2 ab
PS + N1P1K12.29 ± 0.31 bc29.1 ± 1.9 cd123.9 ± 5.991.3 ± 5.5124.1 ± 9.6370.6 ± 8.0 ab
PS + N3P2K23.81 ± 0.59 ab47.0 ± 4.6 ab162.2 ± 18.894.3 ± 11.1111.9 ± 9.3419.2 ± 35.0 a
PS + N4P2K24.27 ± 0.74 a45.5 ± 6.4 a134.2 ± 13.679.8 ± 7.5116.4 ± 6.1380.2 ± 19.3 ab
Letters indicate significant differences between treatments (p ≤ 0.05).
Table 5. Soil K fractions (in mg kg−1) after 65 years of pig slurry (PS) application and different doses of NPK in mineral fertilizers (mean ± SEM).
Soil DepthTreatmentH2O-KEx-KNe-KRes-KTK
0–30 cmN0P0K033.3 ± 4.7 b107.5 ± 10.0 b1041 ± 904149 ± 2695331 ± 313
N1P1K140.4 ± 3.6 ab129.6 ± 7.2 ab998 ± 694532 ± 2395701 ± 210
N3P2K243.2 ± 2.2 ab137.7 ± 7.4 ab1103 ± 374745 ± 2366029 ± 231
N4P2K243.7 ± 2.1 ab131.5 ± 6.8 ab1039 ± 574663 ± 7795877 ± 802
PS38.6 ± 2.1 ab111.2 ± 11.9 b1120 ± 754140 ± 2135410 ± 266
PS + N1P1K144.1 ± 2.7 ab134.9 ± 7.3 ab1048 ± 524146 ± 5885373 ± 581
PS + N3P2K249.6 ± 1.7 a158.0 ± 8.8 a1143 ± 734071 ± 5265422 ± 495
PS + N4P2K247.3 ± 1.2 a148.5 ± 4.2 a1135 ± 565314 ± 8836645 ± 916
31–60 cmN0P0K031.2 ± 4.999.0 ± 5.8 b984 ± 754539 ± 1985653 ± 245
N1P1K135.8 ± 6.3110.6 ± 7.2 ab1096 ± 974857 ± 2826100 ± 269
N3P2K230.4 ± 5.8109.3 ± 5.7 ab991 ± 893952 ± 5135083 ± 576
N4P2K230.8 ± 4.6123.7 ± 5.4 ab1037 ± 694774 ± 4715966 ± 487
PS38.2 ± 2.8102.3 ± 3.0 ab1009 ± 544170 ± 5035320 ± 539
PS + N1P1K140.0 ± 4.9114.6 ± 6.8 ab1052 ± 704967 ± 4566174 ± 432
PS + N3P2K242.9 ± 2.5124.1 ± 6.3 ab1086 ± 574483 ± 5255737 ± 561
PS + N4P2K236.4 ± 3.6125.1 ± 7.8 a1075 ± 735134 ± 8106370 ± 830
Letters indicate significant differences between treatments (p ≤ 0.05).
Table 6. Content of plant-available P and K (Mehlich 3 method) in soil after 65 years of pig slurry (PS) application and different doses of NPK in mineral fertilizers (mean ± SEM).
TreatmentM3PM3K
mg kg−1% in TPmg kg−1% in TK
Soil depth: 0–30 cm
N0P0K043.4 ± 6.0 d10.1 ± 1.8 d177.5 ± 11.0 b3.4 ± 0.19
N1P1K187.0 ± 12.0 c17.7 ± 2.4 bc195.1 ± 10.0 ab3.4 ± 0.11
N3P2K2114.7 ± 7.4 a18.7 ± 1.7 bc206.5 ± 10.9 ab3.5 ± 0.21
N4P2K2103.6 ± 13.0 bc19.2 ± 2.3 bc195.6 ± 8.4 ab3.9 ± 0.81
PS85.5 ± 8.6 c14.8 ± 2.0 cd183.6 ± 13.0 b3.4 ± 0.23
PS + N1P1K1145.4 ± 9.4 b23.7 ± 0.7 ab206.8 ± 11.4 ab4.4 ± 0.85
PS + N3P2K2172.5 ± 5.3 a25.9 ± 1.1 a232.1 ± 7.4 a4.7 ± 0.71
PS + N4P2K2164.0 ± 8.6 a26.4 ± 1.9 a218.0 ± 9.1 ab3.8 ± 0.62
Soil depth: 31–60 cm
N0P0K023.7 ± 4.0 c8.0 ± 1.7160.8 ± 7.82.9 ± 0.2
N1P1K144.3 ± 5.2 bc14.0 ± 1.9181.0 ± 13.73.0 ± 0.2
N3P2K246.4 ± 4.9 bc12.2 ± 1.6169.0 ± 11.13.9 ± 0.8
N4P2K257.7 ± 5.5 ab16.4 ± 1.3187.5 ± 11.63.2 ± 0.2
PS41.8 ± 3.4 bc12.1 ± 1.8173.0 ± 4.33.8 ± 0.8
PS + N1P1K152.4 ± 5.8 ab14.1 ± 1.5190.2 ± 5.83.2 ± 0.3
PS + N3P2K276.0 ± 7.0 a18.7 ± 1.9196.9 ± 6.83.4 ± 0.6
PS + N4P2K276.7 ± 9.9 a20.2 ± 2.5193.6 ± 9.13.3 ± 0.4
M3P and M3K—plant-available P and K; TP and TK—total P and K content, respectively. Letters indicate significant differences between treatments (p ≤ 0.05).
Table 7. Effect of the long-term use of pig slurry (PS) and NPK mineral fertilizers on winter wheat and sugar beet yield, nutrient removal by crops, and nutrient balance (mean with 2 × SEM).
TreatmentGrain or Taproot YieldStraw or Leaf YieldNutrient RemovalNutrient Balance
NPKNPK
t ha−1t ha−1 kg ha−1 kg ha−1
Winter wheat
N0P0K05.14 ± 0.14 d4.00 ± 0.10 d107.4 ± 2.9 f21.5 ± 1.4 b56.7 ± 5.3 b−107.4 ± 2.9 a−21.5 ± 1.4 bc−56.7 ± 5.3 b
N1P1K17.04 ± 0.15 c5.76 ± 0.22 bc145.2 ± 3.0 e31.4 ± 3.0 a81.7 ± 8.1 ab−105.2 ± 3.0 a−10.4 ± 3.0 ab−1.7 ± 8.1 a
N3P2K27.32 ± 0.13 bc5.92 ± 0.11 bc162.0 ± 2.9 d31.7 ± 2.7 a85.0 ± 8.1 a−107.0 ± 2.9 a−5.7 ± 2.7 a15.0 ± 8.1 a
N4P2K27.74 ± 0.17 ab6.35 ± 0.21 abc191.3 ± 4.1 bc33.7 ± 2.3 a93.2 ± 3.6 a−116.3 ± 4.1 a−7.7 ± 2.3 a6.8 ± 3.6 a
PS + N0P0K07.70 ± 0.16 abc5.71 ± 0.24 c159.7 ± 3.4 de29.9 ± 1.1 ab77.3 ± 5.4 ab−159.7 ± 3.4 c−29.9 ± 1.1 c−77.3 ± 5.4 b
PS + N1P1K17.85 ± 0.09 ab6.37 ± 0.06 abc180.2 ± 2.0 c33.7 ± 1.2 a81.9 ± 5.7 a−140.2 ± 2.0 b−12.7 ± 1.2 a−1.9 ± 5.7 a
PS + N3P2K28.34 ± 0.15 a6.78 ± 0.13 a200.8 ± 3.7 b36.2 ± 1.0 a87.7 ± 5.3 a−145.8 ± 3.7 bc−10.2 ± 1.0 a12.3 ± 5.3 a
PS + N4P2K28.26 ± 0.16 a6.50 ± 0.09 ab217.9 ± 4.0 a36.3 ± 1.4 a89.1 ± 4.9 a−142.9 ± 4.0 b−10.3 ± 1.4 a10.9 ± 4.9 a
Sugar beet
N0P0K061.3 ± 2.01 c20.7 ± 0.90 d58.2 ± 1.9 e14.7 ± 0.48 d104.2 ± 3.42 c−58.2 ± 1.9 f−14.7 ± 0.5 e−104.2 ± 3.4 f
N1P1K172.3 ± 2.15 b37.6 ± 2.46 c72.3 ± 2.2 d19.5 ± 0.58 c115.6 ± 3.45 c7.7 ± 2.2 e8.5 ± 0.6 d9.4 ± 3.4 d
N3P2K280.5 ± 2.18 ab47.9 ± 1.62 a96.6 ± 2.6 c26.6 ± 0.72 ab136.9 ± 3.70 b63.4 ± 2.6 d8.4 ± 0.7 d29.1 ± 3.7 c
N4P2K281.6 ± 1.83 a46.5 ± 1.73 a98.0 ± 2.2 bc26.1 ± 0.58 ab155.1 ± 3.47 a102.0 ± 2.2 c8.9 ± 0.6 d10.9 ± 3.5 d
PS + N0P0K080.6 ± 1.42 ab38.2 ± 1.80 bc88.7 ± 1.6 c25.8 ± 0.45 b137.1 ± 2.42 b0.3 ± 1.6 e13.2 ± 0.5 c−49.1 ± 2.4 e
PS + N1P1K181.7 ± 0.93 a45.4 ± 0.40 ab98.0 ± 1.1 bc28.6 ± 0.32 a138.9 ± 1.57 b71.0 ± 1.1 d38.4 ± 0.3 b74.1 ± 1.6 b
PS + N3P2K283.6 ± 1.76 a49.8 ± 1.23 a108.6 ± 2.3 b27.6 ± 0.58 ab150.4 ± 3.12 ab140.4 ± 2.3 b46.4 ± 0.6 a103.6 ± 3.2 a
PS + N4P2K286.1 ± 2.56 a50.8 ± 1.47 a129.1 ± 3.8 a28.4 ± 0.84 a154.9 ± 4.61 a159.9 ± 3.8 a45.6 ± 0.8 a99.1 ± 4.6 a
The same letter indicates a lack of significant difference between the fertilized treatments (HSD test, p ≤ 0.05). Nutrient removal—nutrient accumulation in grain and straw of winter wheat or in the taproots of sugar beet. Nutrient balance—the difference between NPK input in all fertilizers and removal from the field.
Disclaimer/Publisher’s Note: The statements, opinions and data contained in all publications are solely those of the individual author(s) and contributor(s) and not of MDPI and/or the editor(s). MDPI and/or the editor(s) disclaim responsibility for any injury to people or property resulting from any ideas, methods, instructions or products referred to in the content.

