Article

Genome-Wide Association Study and Genomic Prediction of Essential Agronomic Traits in Diversity Panel of Soybean Varieties

1
Key Laboratory of Molecular Epigenetics of the Ministry of Education (MOE), Northeast Normal University, Changchun 130024, China
2
Key Laboratory of Hybrid Soybean Breeding of Ministry of Agriculture and Rural Affairs, Soybean Research Institute, Jilin Academy of Agricultural Sciences, Changchun 130033, China
3
Department of Agronomy, Jilin Agricultural University, Changchun 130118, China
*
Authors to whom correspondence should be addressed.
Agronomy 2025, 15(5), 1181; https://doi.org/10.3390/agronomy15051181
Submission received: 10 April 2025 / Revised: 8 May 2025 / Accepted: 11 May 2025 / Published: 13 May 2025

Abstract

:
Soybean, a globally important crop, is a typical short-day and thermophilic plant. Continuous efforts are necessary to elucidate the genetic basis of its essential traits. In this study, we assembled a collection of 203 soybean varieties, all of which are well suited for cultivation in the northeastern region of China. We assessed 15 agronomic traits under three distinct environments, noting substantial phenotypic variations in the panel and stable correlations among traits. The population structure analysis, based on genotyping-by-sequencing (GBS) data, revealed seven subpopulations within the panel and significant gene flows among these subpopulations. Through genome-wide association studies (GWASs), we identified 64 significantly associated loci (SALs) for 15 traits and unveiled the genetic interconnections between yield and related traits. Additionally, we highlighted a few candidate genes within SALs for yield and related traits. Finally, we evaluated the genomic prediction performances of four distinct methods across the three environments, revealing the significant influence of environmental factors on predictive accuracies. We found that rrBLUP is suitable for most traits, though specific traits may benefit from more complex machine learning models. Our findings establish a foundation for the future research of genetic mechanisms of soybean agronomic traits and the application of genomic selection in soybean breeding.

1. Introduction

Soybean (Glycine max), which is an annual legume, is one of the globally important food crops [1,2]. Archeological and historical evidence indicate that cultivated soybean was domesticated from wild soybean (Glycine soja) approximately 5000 to 6000 years ago during the Zhou dynasty in China [3,4]. Soybean seeds contain 34.1–56.8% protein and 8.3–27.9% oil [5], making it an important source of vegetable oil and protein for both human consumption and livestock feed [6]. The increasing demand for soybean highlights the urgent need to enhance soybean yields, emphasizing the importance of traits associated with productivity [3,7]. As a typical pod crop, soybean yield is influenced by the yield components including pod number, number of seeds per pod and seed weight, as well as architecture traits such as plant height, node number and branch number [8]. Therefore, soybean breeding should focus not only on the yield and yield-related traits but also optimizing plant architecture [8].
The northeastern region of China serves as the primary cultivation area for spring sowing soybeans and is the largest soybean-producing region in China [9]. There has been an extensive history of soybean breeding in northeast China, where hundreds of soybean cultivars have been released resulting in a rich repository of soybean genetic resources [9]. However, emerging challenges, such as climate changes, necessitate the ongoing development of new, optimized cultivars [10,11].
The first soybean reference genome, comprising sequences of the 20 chromosomes, was assembled in 2010, facilitating the unveiling of the genetic bases of agronomic traits in soybean. To date, thousands of quantitative trait loci (QTLs) identified from bi-parent populations have been documented in Soybase (https://www.soybase.org/, accessed on 5 April 2025), including 230 QTLs for plant height, 37 for node number, 3 for stem diameter, 21 for branch number, 76 for seed set, 51 for pod number, 15 for seed number, 313 for seed weight and 163 for seed yield. The rapid advancement of high-throughput sequencing technologies has led to the widespread application of genome-wide association studies (GWASs) in understanding population genetic structure and identifying significantly associated loci (SALs) for agronomic traits [12,13]. Recently, an increasing number of studies have reported the identification of numerous SALs related to various agronomic traits of soybeans at the genome-wide level [14,15,16,17,18,19,20]. For instance, research on 40 soybean nested association mapping (NAM) populations uncovered 103 significant marker–trait associations for yield, maturity, plant height, plant lodging, and seed mass [21]. Another study involving 211 soybean genotypes identified 57 SNPs associated with yield-related traits [22]. An investigation into the genetic basis of 12 architecture and seed traits in a panel of 496 soybean accessions revealed 169 SALs [23]. GWAS analyses of 809 soybean accessions identified 245 SALs for 57 agronomic traits, revealing that most traits are interconnected through linkage disequilibrium among SALs [20]. Additionally, research on 250 soybean accessions identified 3165 significantly associated genes (SAGs) for 43 traits and highlighted the role of hub nodes in complex phenotypic associations [16]. These studies provide valuable resources for molecular breeding in soybean.
Many of the valuable traits in soybean are complex quantitative traits governed by numerous genes with minor effects, making marker-assisted selection (MAS) ineffective [24,25]. Genomic selection (GS), which employs genome-wide markers to construct genomic prediction models for predicting the genomic estimated breeding value (GEBV) of candidate individuals, provides a superior method for the selection of quantitative traits compared to MAS [26,27]. The advancement in genotyping and phenotyping technologies has promoted the development and application of genomic selection in plant breeding [28]. More complex methodologies, such as machine learning, are being explored to predict plant performance with intricate datasets [29,30]. For soybean, genomic selection has demonstrated significant potential in enhancing selection efficiency and shortening the selection cycle [31,32].
Soybean is a typical short-day and thermophilic crop, with its development being sensitive to photo-thermal conditions [33]. This characteristic imposes significant constraints on the cultivation range of a specific soybean cultivar [34]. Photo-thermal conditions can profoundly influence the performance of soybean’s agronomic traits such as yield, plant architecture, and seed quality [34]. Hence, it is necessary to investigate the phenotypic variations and their genetic underpinnings within a diversity panel of soybean varieties that are acclimated to similar photo-thermal conditions.
In this study, we assembled a collection of 203 soybean varieties, all of which are well suited for cultivation in the northeastern region of China. We assessed their traits across three environments. In addition, we conducted genotyping by sequencing (GBS) on these soybean varieties. We analyzed the population structure, elucidated the genetic foundations of essential agronomic traits within this diversity soybean panel through GWASs, and addressed the genetic network influencing these traits. Moreover, we identified novel candidate genes associated with yield and related traits. Finally, we evaluated the efficacy of genomic prediction within this soybean collection. Our findings provide a foundation for future functional studies and potential breeding applications in soybean.

2. Materials and Methods

2.1. Plant Growth and Phenotyping

A collection of 203 soybean varieties was cultivated in three-row blocks using a completely randomized design in 2019 and 2020 at Taonan (designated as E1 and E2) and 2020 at Fanjiatun (designated as E3), Jilin province, China. Each variety was planted in a block of three rows, with a row length of 5 m and a row spacing of 0.65 m. For detailed phenotyping in each environment, 3–5 adjacent mature plants were harvested from each variety. In total, we measured 13 quantitative traits, including plant height (PH), bottom pod insertion height (BPIH), node number (NN), stem diameter (SD), branch number (BN), one-seed pod number (1SPN), two-seed pod number (2SPN), three-seed pod number (3SPN), four-seed pod number (4SPN), the total number of pods (TNP), the total number of seeds (TNS), hundred-seed weight (HSW), and yield per plant (YPP, calculated by multiplying the total seed number by seed weight). For each soybean variety, the mean value of the measured individuals was calculated for every quantitative trait to represent the performance of the variety in the given environment. Additionally, two categorical traits, stem growth habit (SGH) and pubescence color (PC), were manually assessed for each plant, resulting in a total of 15 traits measured. All descriptive statistics and correlation tests were performed in R (version 4.1.3) using base functions, and a correlation heatmap among traits was created using the corrplot package (https://github.com/taiyun/corrplot, accessed on 5 April 2025) in R. The variances of each trait for broad-sense heritability estimation were calculated with the formula “trait ~ (1|accession) + (1|environment)” with lme4 package in R [35]. Broad-sense heritability (H2) was calculated using the following formula, H 2 = V G V G + V ε n , where VG denotes the genotype variance, Vε denotes residual variance, and n represents the number of environments.

2.2. DNA Extraction, Genotyping by Sequencing, Variant Calling and Filtration

For DNA extraction, five plants of each accession were cultivated in a growth chamber. Fresh leaves from three healthy plants were harvested and immediately frozen in liquid nitrogen. DNA was subsequently extracted employing the CTAB method [36]. The genotyping-by-sequencing (GBS) library construction and sequencing were conducted by BGI Genomics Company Limited, Shenzhen, China. Sequencing was performed on the Illumina Hiseq2000 platform using a 100-base pair paired-end strategy. The average yield of clean data was 0.74 Gb per accession (Table S1). The sequencing reads were subjected to further filtration using Trimmomatic (version 0.39) with the following parameters: “LEADING:3 TRAILING:3 HEADCROP:5 MINLEN:50” [37]. The trimmed reads were subsequently aligned to reference sequences, which comprised the G. max genome (Phytozome v4.0) and the mitochondrial (NC_020455.1) and chloroplast (NC_007942.1) genomes, using BWA (version 0.7.17-r1188) [38]. The BAM files were sorted using Samtools (version 1.12) [39]. Variant detection and genotyping were performed using the mpileup function in BCFtools (version 1.12) with parameters “-E -q 10 -Q 20 -P illumina -d 10000” and call with the parameter setting “-m” [40]. The raw variants were subjected to filtration using PLINK (version 1.90b6.9) [41] to exclude indels, sites with a high missing rate (0.5) or low minor allele frequency (MAF < 0.05). Samples with more than 25% missing sites were discarded. After this stringent filtration process, 95,471 biallelic SNPs and 194 accessions remained in the dataset. Beagle (version 5.2) was then deployed to impute the missing genotypes [42].

2.3. Phylogenetic Analysis, Linkage Disequilibrium, Principle Components Analysis and Population Structure

For phylogenetic analysis, the variants were converted to the input format compatible with Phylip using the vcf2phylip.py script (https://github.com/edgardomortiz/vcf2phylip, accessed on 5 April 2025). A phylogenetic tree was constructed using Phylip with default parameters [43]. The tree was subsequently visualized using Figtree (version 1.4.4, https://tree.bio.ed.ac.uk/software/Figtree/, accessed on 5 April 2025). Linkage disequilibrium (LD) analysis was performed by calculating the pairwise r2 using PLINK. The average r2 for 5 kb bins was computed and graphically depicted using R (version 4.1.3). For principal component analysis (PCA) and population structure analysis, SNPs were pruned for r2 less than 0.2 using the parameter setting “--indep-pairwise 50 10 0.2” in PLINK [44]. A total of 9170 SNPs were utilized for PCA and population structure analysis. The eigenvectors and eigenvalues were computed using PLINK. The ancestry matrices were calculated using Admixture (version 1.3.0) with 200 bootstrap iterations [45]. The optimal number of clusters (k) was chosen based on the error rates of 5-fold cross-validations spanning from k = 2 to k = 10.

2.4. Genome-Wide Association Analysis and Candidate Gene Exploration

A GWAS was conducted for each trait and the genome-wide SNPs using a mixed linear model (MLM) method implemented in the GEMMA software (version 0.98.5) (version 0.98.5) [46]. The kinship matrix (K) was utilized to define the variance structure of the random variables, thereby controlling the cryptic relationships among the cultivars. Concurrently, the first three principal components (PCs) were fitted as fixed effects to account for the population structure. We compared models with different covariates using the mean square deviation (MSD) method [47,48]. Briefly, the degree to which the p-values from each model deviated from the expected distribution was estimated by calculated the MSD for all markers. The model with the lowest MSD value was selected for each trait in each environment (Table S2). The false discovery rate for each trait’s GWAS result was calculated. Ultimately, a uniform threshold (p-values < 1.00 × 10⁻⁵) was chosen based on the overall false discovery rates for all quantitative traits except for 4SPN, which is sparsely distributed among a few accessions. For 4SPN and two qualitative traits, PC and SGH, a threshold (p-values < 1.00 × 10⁻⁷) was applied. SALs were determined based on p-values and linkage disequilibrium (r2 = 0.3) among SNPs for each trait using the clump function in PLINK, and overlapping clump ranges were merged to form a single SAL [49]. To obtain all genes potentially related to the SALs, we extracted genes located within the SAL regions, as well as those in the up- or downstream 10 kb regions, which corresponds to average spacing between SNPs. The best hits of these genes in Arabidopsis thaliana were identified using the blastp program. Genes with known functions or those with related functional homologs in Arabidopsis were selected as candidate genes for the SAL.

2.5. Genomic Prediction

Phenotypic and genomic data were employed to evaluate the performance of various genomic prediction methods for each trait. Predictive models using ridge regression best linear unbiased predictor (rrBLUP) were developed using the rrBLUP package in R [50]. Prediction models for the three machine learning methods, support vector machine with linear function (SVR-linear), support vector regression–radial basis function (SVR-RBF), and random forest (RF), were implemented using the “scikit-learn” package in Python (version 3.12.7) [51]. For each method, the dataset was partitioned using 10-fold cross-validation with five repetitions. The predictive accuracy was defined as the Pearson correlation coefficient between predicted and observed values in each iteration. An analysis of variance (ANOVA) was used to analyze the variance of predictability for each trait, and least significant difference (LSD) multiple comparisons with false discovery rate (FDR) adjustments were conducted to test differences between various factors.

3. Results

3.1. Phenotype Variation in the Soybean Diversity Panel

We evaluated the phenotypes for 13 quantitative traits and 2 qualitative traits across 203 soybean varieties in three environments (E1, E2, and E3). Most quantitative traits exhibited an approximately normal distribution (with absolute skewness < 2 and absolute kurtosis < 3), except for 1SPN (E1 and E3), 2SPN (E2), 3SPN (E1), 4SPN (E1, E2, and E3), TNP (E1 and E3), TNS (E1), and YPP (E1 and E3) (Figure S1 and Table S3). The coefficient of variation ranged from 0.11 for SD to 0.94 for BN across all quantitative traits, with the exception of 4SPN, which exhibited CVs greater than 1 in all environments. Significant correlations were observed for all quantitative traits across different environments (Pearson correlation test, p-value < 0.05), except for YPP between E1 and E3 (Pearson correlation test, p-value = 0.17) (Table S4). We assessed the broad-sense heritability for each quantitative trait across the three environments, finding it ranged from 36.17% for YPP to 88.30% for HSW (Table S3). A further investigation into trait relationships revealed stable and significant correlations among several traits (Figure 1). For instance, in all three environments, YPP was significantly positively correlated with 1SPN, 2SPN, 3SPN, 4SPN, TNP, TNS and HSW (Figure 1). Similarly, BPIH was positively correlated with PH, NN, and HSW while negatively correlated with BN, 2SPN, TNP and TNS (Figure 1). These findings suggest pleiotropic effects of certain genetic loci and strong genetic connections among key agronomic traits.

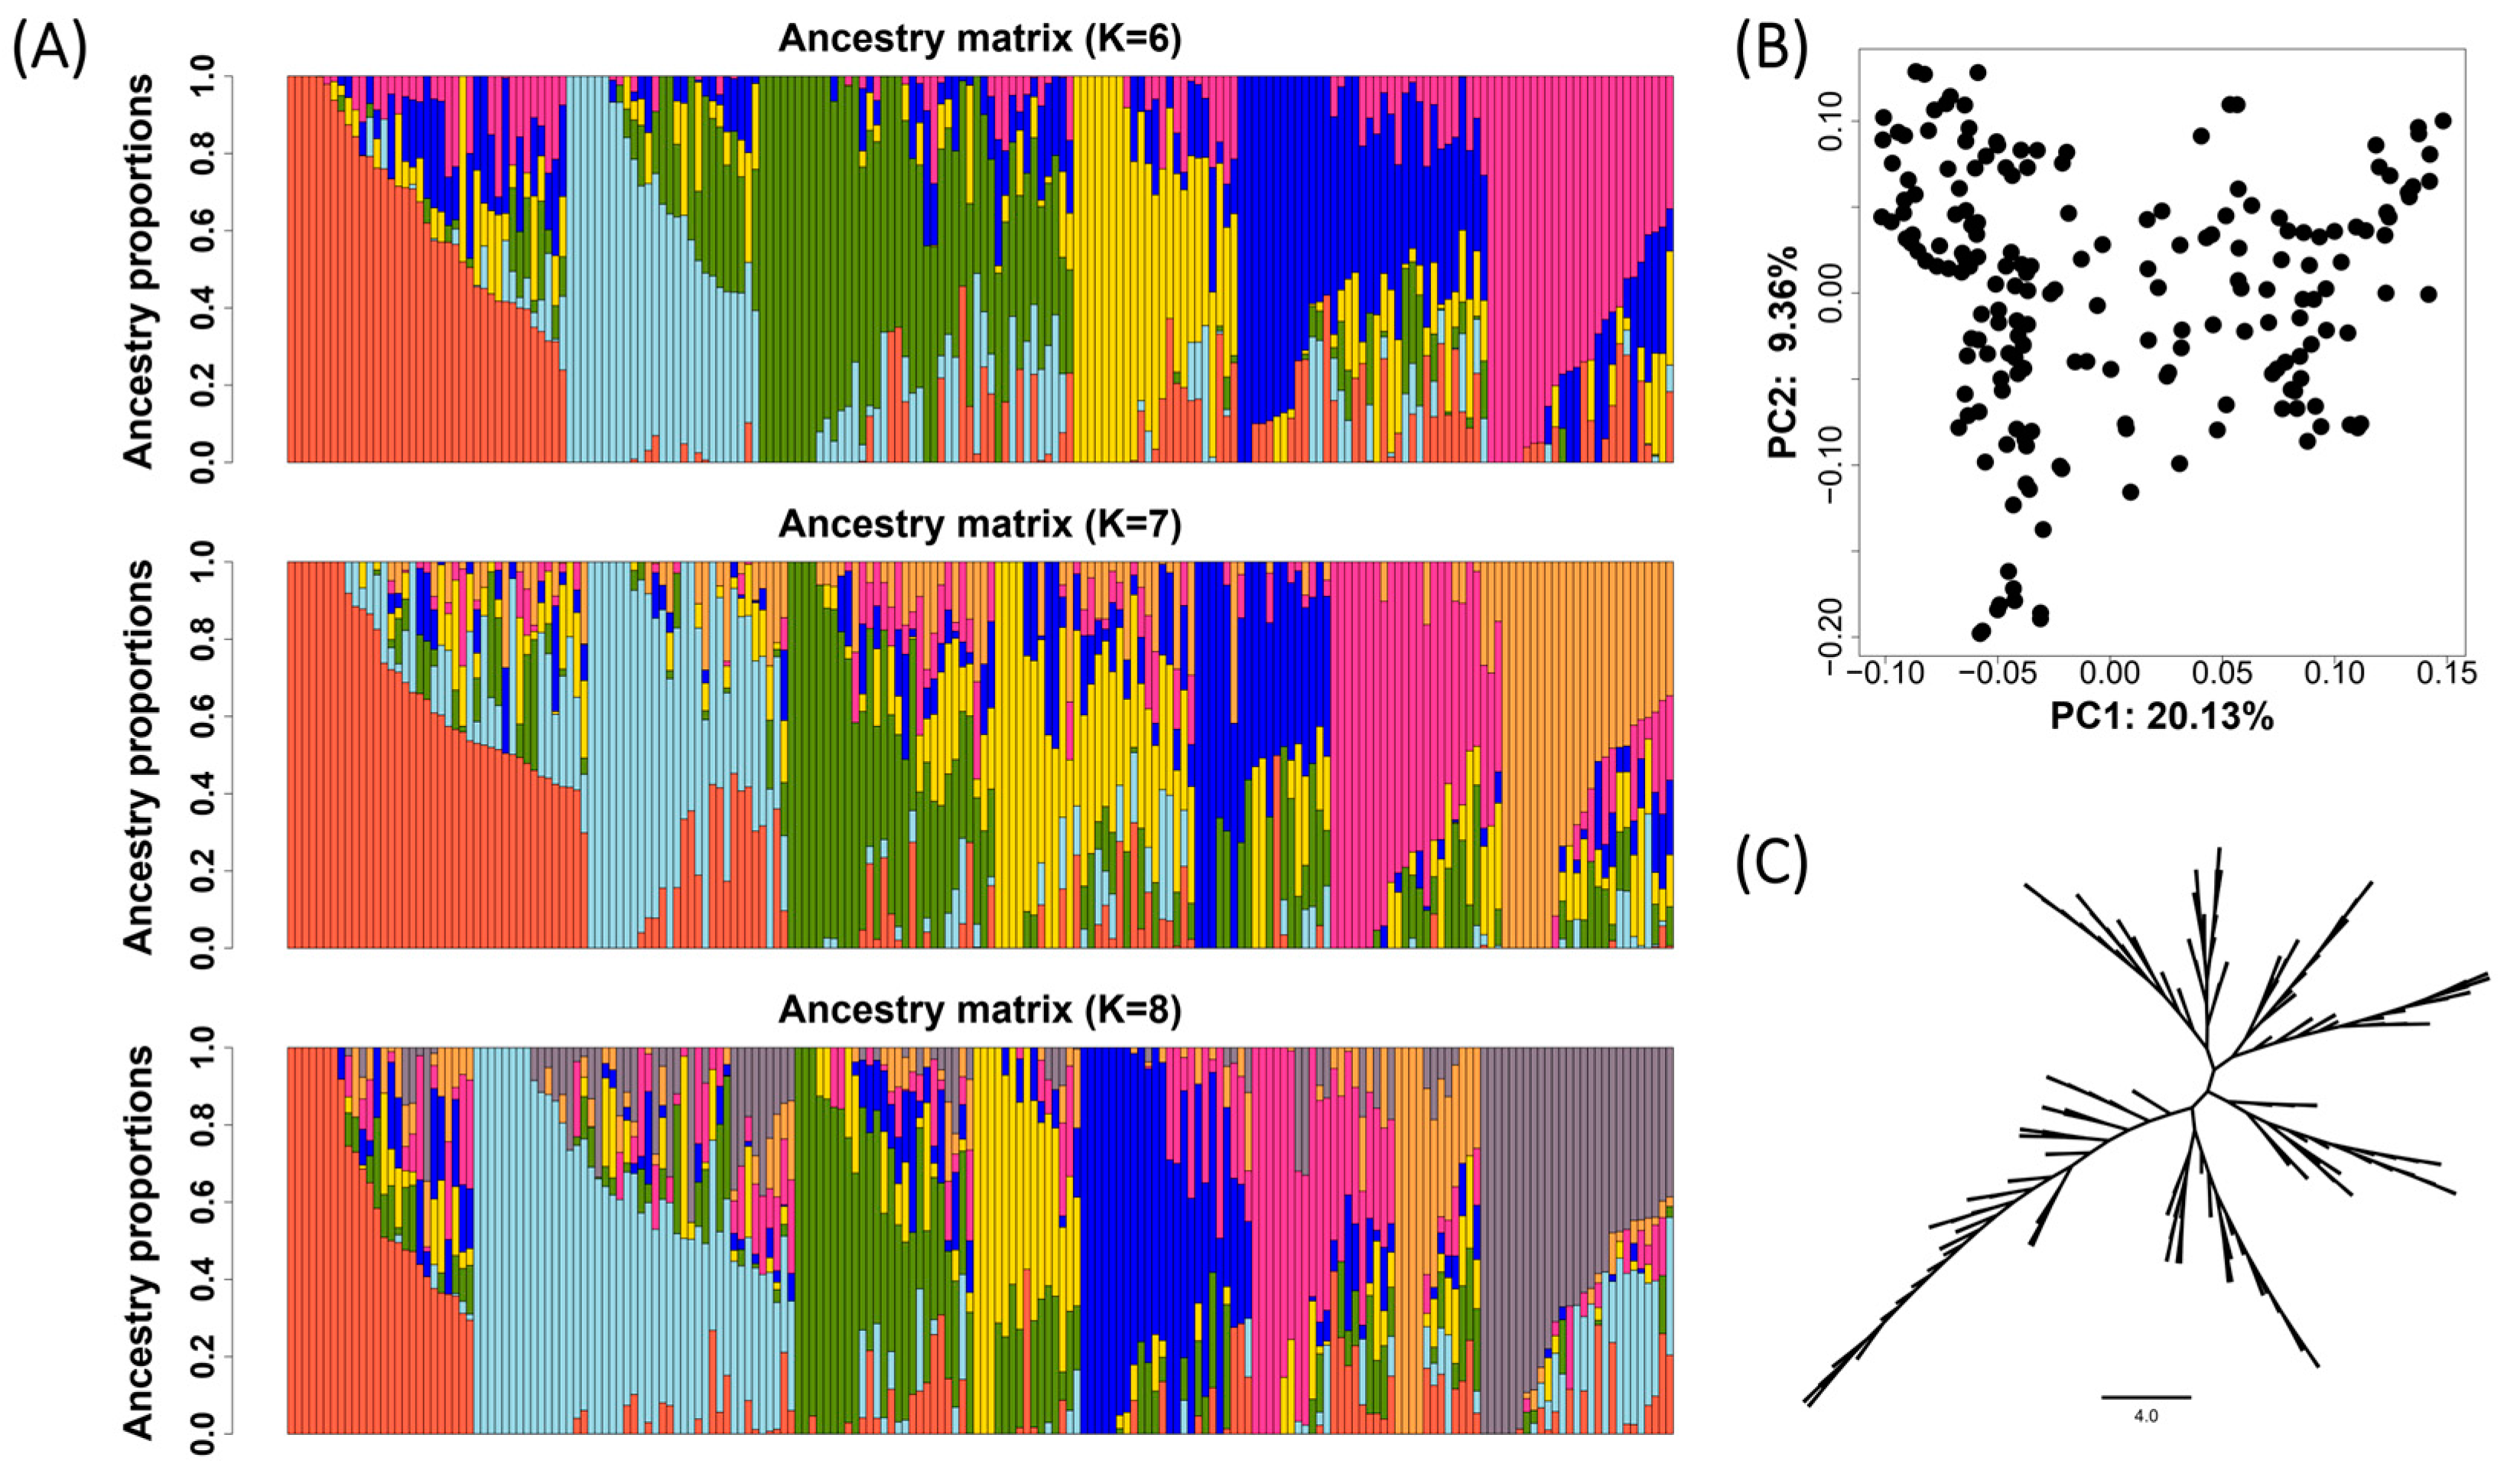
3.2. The Genetic Relationship and Population Structure of the Soybean Diversity Panel

We conducted GBS for all soybean varieties, identifying 95,471 high-quality SNPs across 194 varieties. Phylogenetic analysis revealed that the soybean varieties could be grouped into seven clusters (Figure 2C). The linkage disequilibrium decay distance was approximately 463 kb for r2 to drop to half of its maximum value and 245 kb for r2 = 0.2 (Figure S2). Additionally, we analyzed the population structure of the soybean diversity panel, classifying all varieties into seven subpopulations (Figure 2A). Most varieties exhibited mixed ancestral components, suggesting gene exchange among different subpopulations. Principal component analysis (PCA) indicated no evident population stratification (Figure 2B), with the first and second principal components accounting for 20.13% and 9.36% of the variance, respectively.

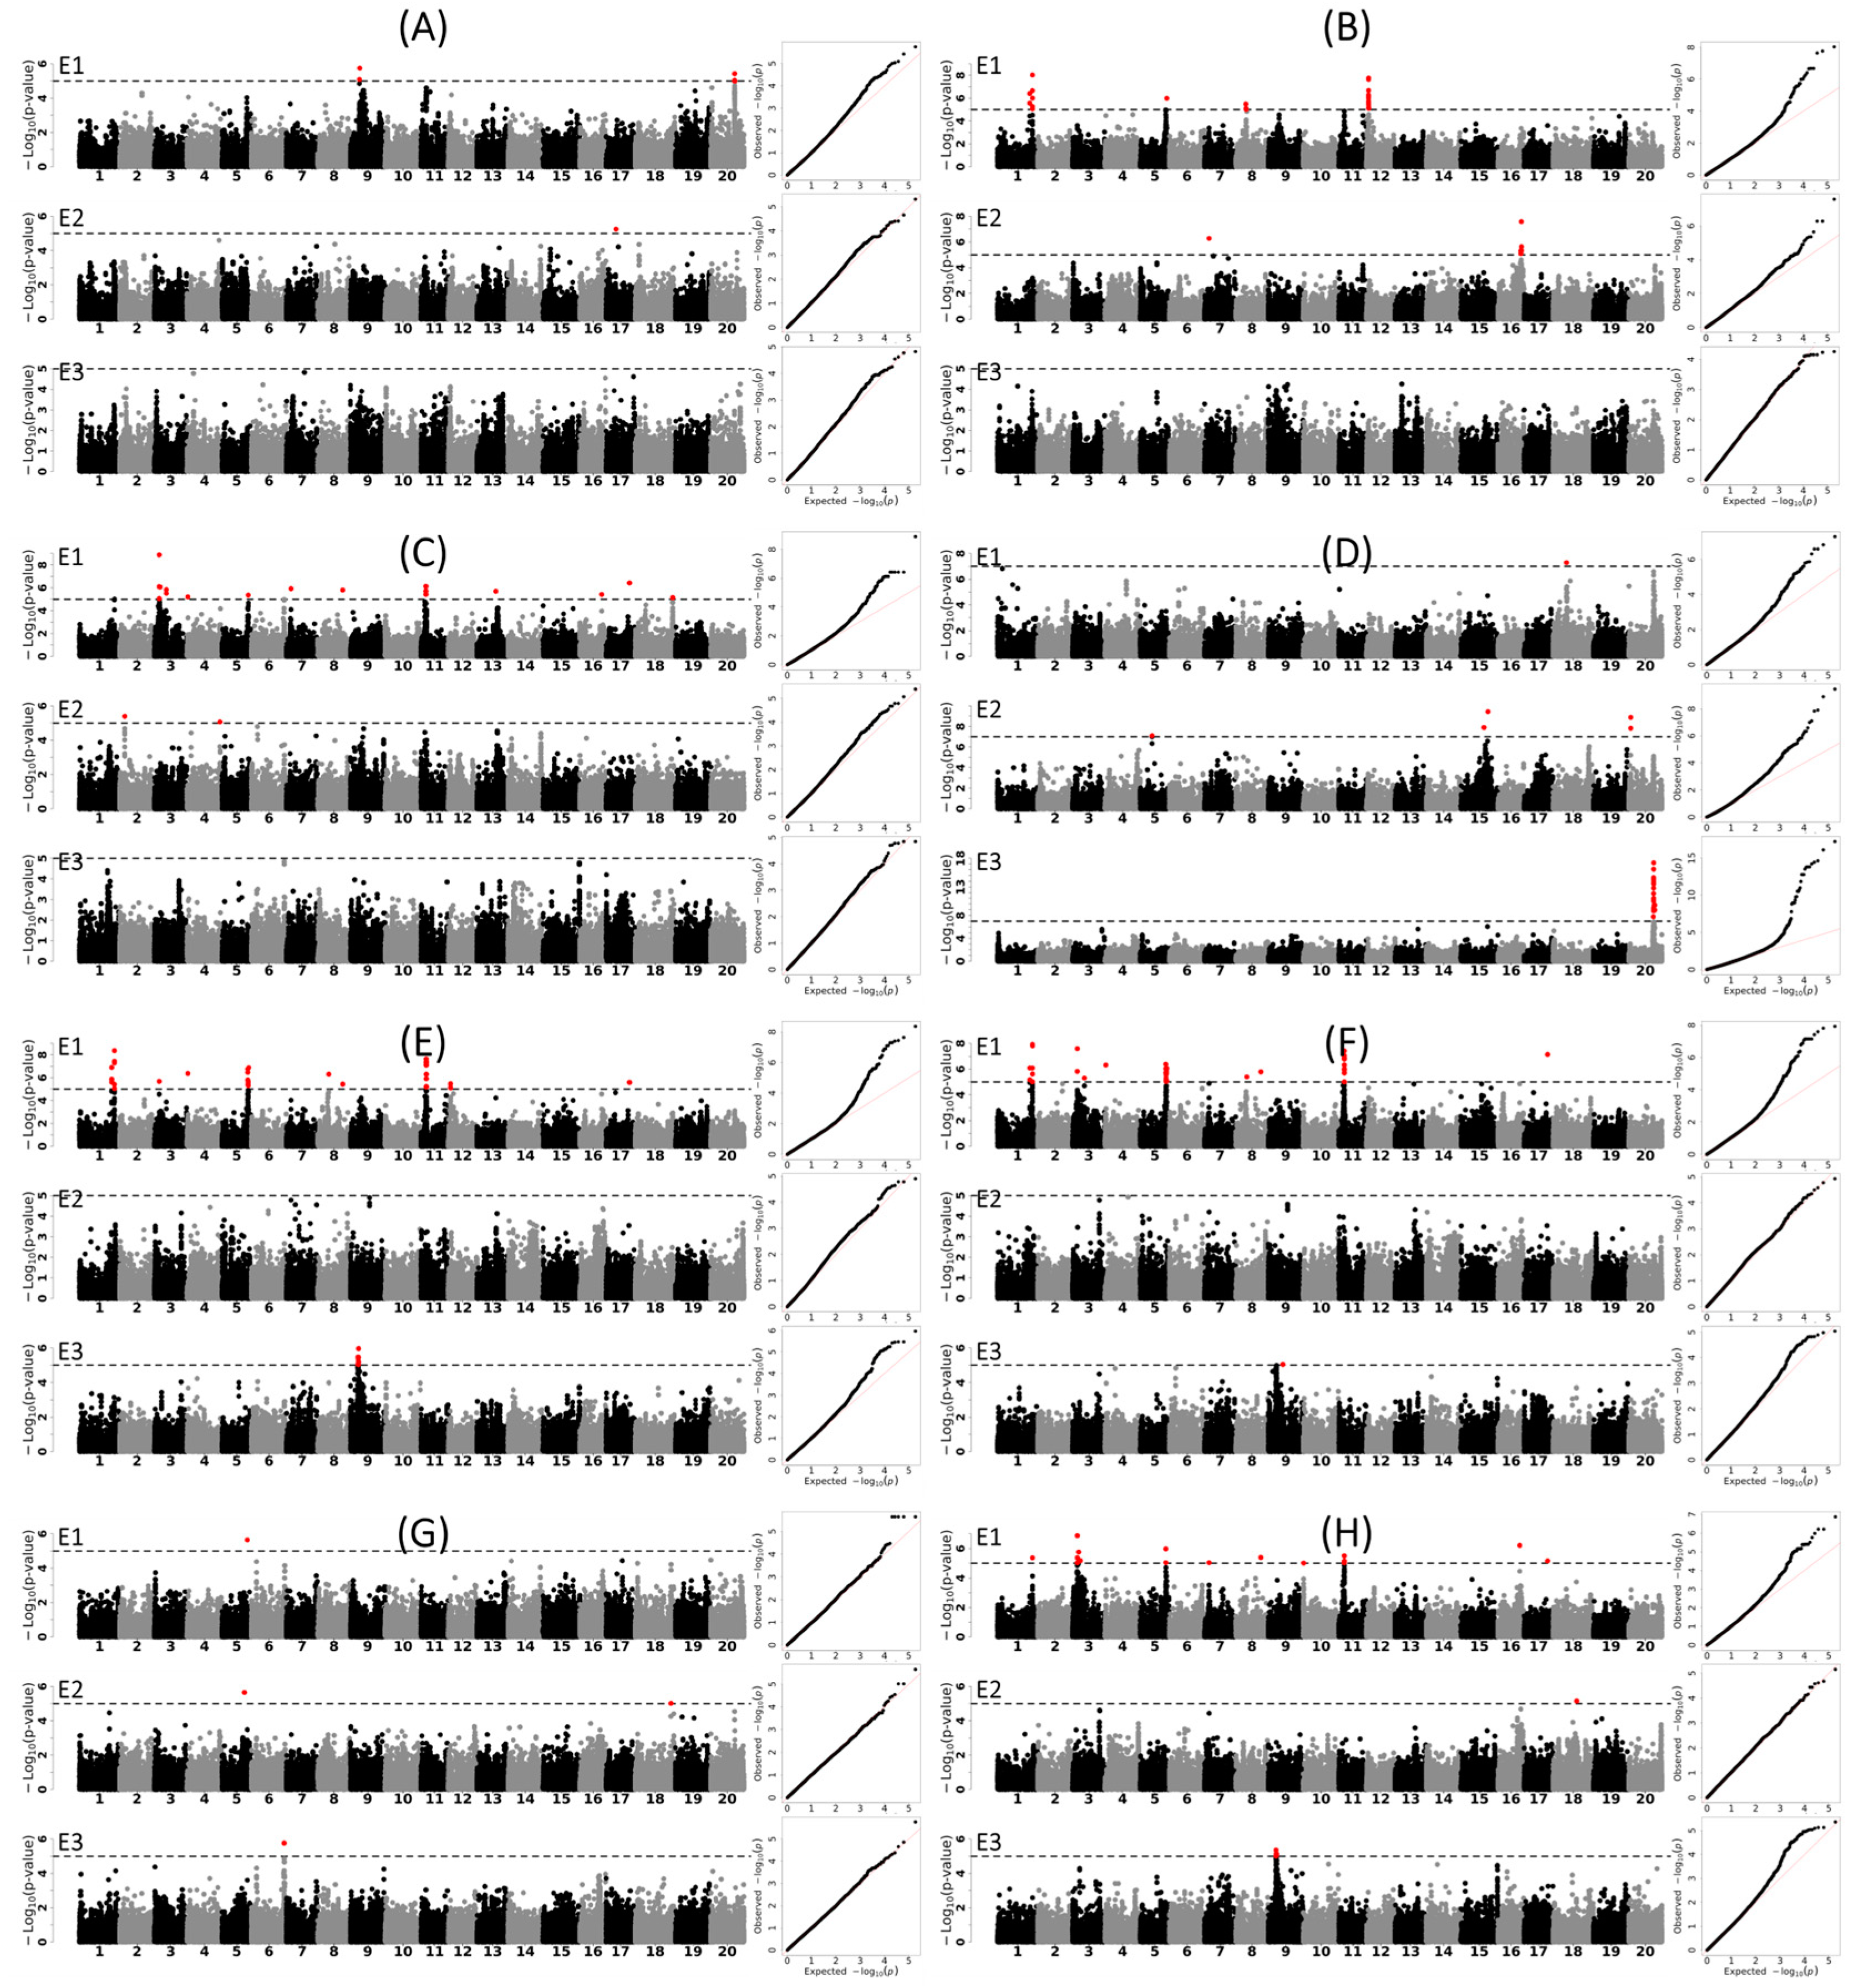
3.3. Genetic Loci and Candidate Genes Associated with Different Agronomic Traits

To elucidate the genetic loci that contribute to phenotypic variations, we executed a GWAS for each trait using a mixed linear model in GEMMA. In total, we discovered 64 significantly associated locus SALs related to 15 traits (Figure S3 and Table S5), 34 of which were overlapped with documented QTLs by Soybase (https://www.soybase.org/, accessed on 5 April 2025) or known genes, including recognized genes such as Dt2 for SGH and T for PC (Table S3). For yield and its related traits, we identified 44 SALs: 7 associated with YPP and 1, 7, 5, 3, 11, 8, and 2 related to 1SPN, 2SPN, 3SPN, 4SPN, TNP, TNS, and HSW, respectively (Figure 3 and Table S5).
By analyzing the functional annotations of genes located within the SAL regions, we identified several potential candidate genes. Among the most significant SALs for YPP on chromosome 3 (Gm03: 6840944-7005871, tag SNP p-value = 1.34 × 10⁻⁷), nine genes had Arabidopsis homologues, including a phosphatidylethanolamine-binding protein (PEBP) gene, Glyma.03G052200. This gene is homologous to the Arabidopsis thaliana STEPMOTHER OF FT AND TFL1 (SMFT) gene, known to affect seed vitality [52]. In the SAL for YPP on chromosome 05 (Gm05: 36963440-37120200, tag SNP p-value = 1.04 × 10⁻⁶), we discovered Glyma.05G182700, a homolog of Arabidopsis embryo defective 2453 (EMB2453) [53]. A significant peak of associated SNPs was observed in the 4SPN results, resulting in three adjacent SALs, among which the most significant SAL (Gm20: 35884355-36526675, tag SNP p-value = 5.25 × 10⁻¹⁹) contained the known four-seed regulator gene Ln [54]. For the 3SPN, two of the five SALs overlap with SALs for TNP, TNS, and YPP. The most significant SAL for 3SPN almost entirely overlaps with the most significant SAL for YPP and also contains SMFT. Three of the seven SALs identified for 2SPN overlap with SALs for TNP and two of the them overlap with SAL for TNS. In the most significant SAL for 2SPN (Gm01: 50272167-50494680, tag SNP p-value = 9.32 × 10⁻⁹), we discovered Glyma.01G154700, a homolog of Arabidopsis APYRASE 7 (APY7) [55]. The SAL for 2SPN on chromosome 16 (Gm16: 33805368-34119155, tag SNP p-value = 2.62 × −8) contains Glyma.16G177300, a homolog of Arabidopsis embryo defective 1417 (EMB1417) [53]. The most significant SAL for HSW (Gm06: 47295253-47446271, tag SNP p-value = 1.71 × 10⁻⁶) contains GmGLK38 (Glyma.06G289300), whose Arabidopsis homolog GLK1 is a primary regulator of chloroplast biogenesis and photosynthetic activity [56].
Upon a further analysis of the relationship among different traits and SALs, we discovered direct or indirect genetic connections between YPP,2SPN, 3SNP, TNP, TNS, and BN via SALs (Figure 4). Notably, both 2SPN and 3SPN demonstrated dense connections with TNP, while 3SPN, TNP, and TNS were closely linked with YPP. Interestingly, the BN also shared an SAL with TNS, TNPs, and YPP, suggesting its influential role in seed yield. This observation aligns with the phenotypic correlation observed between these traits.

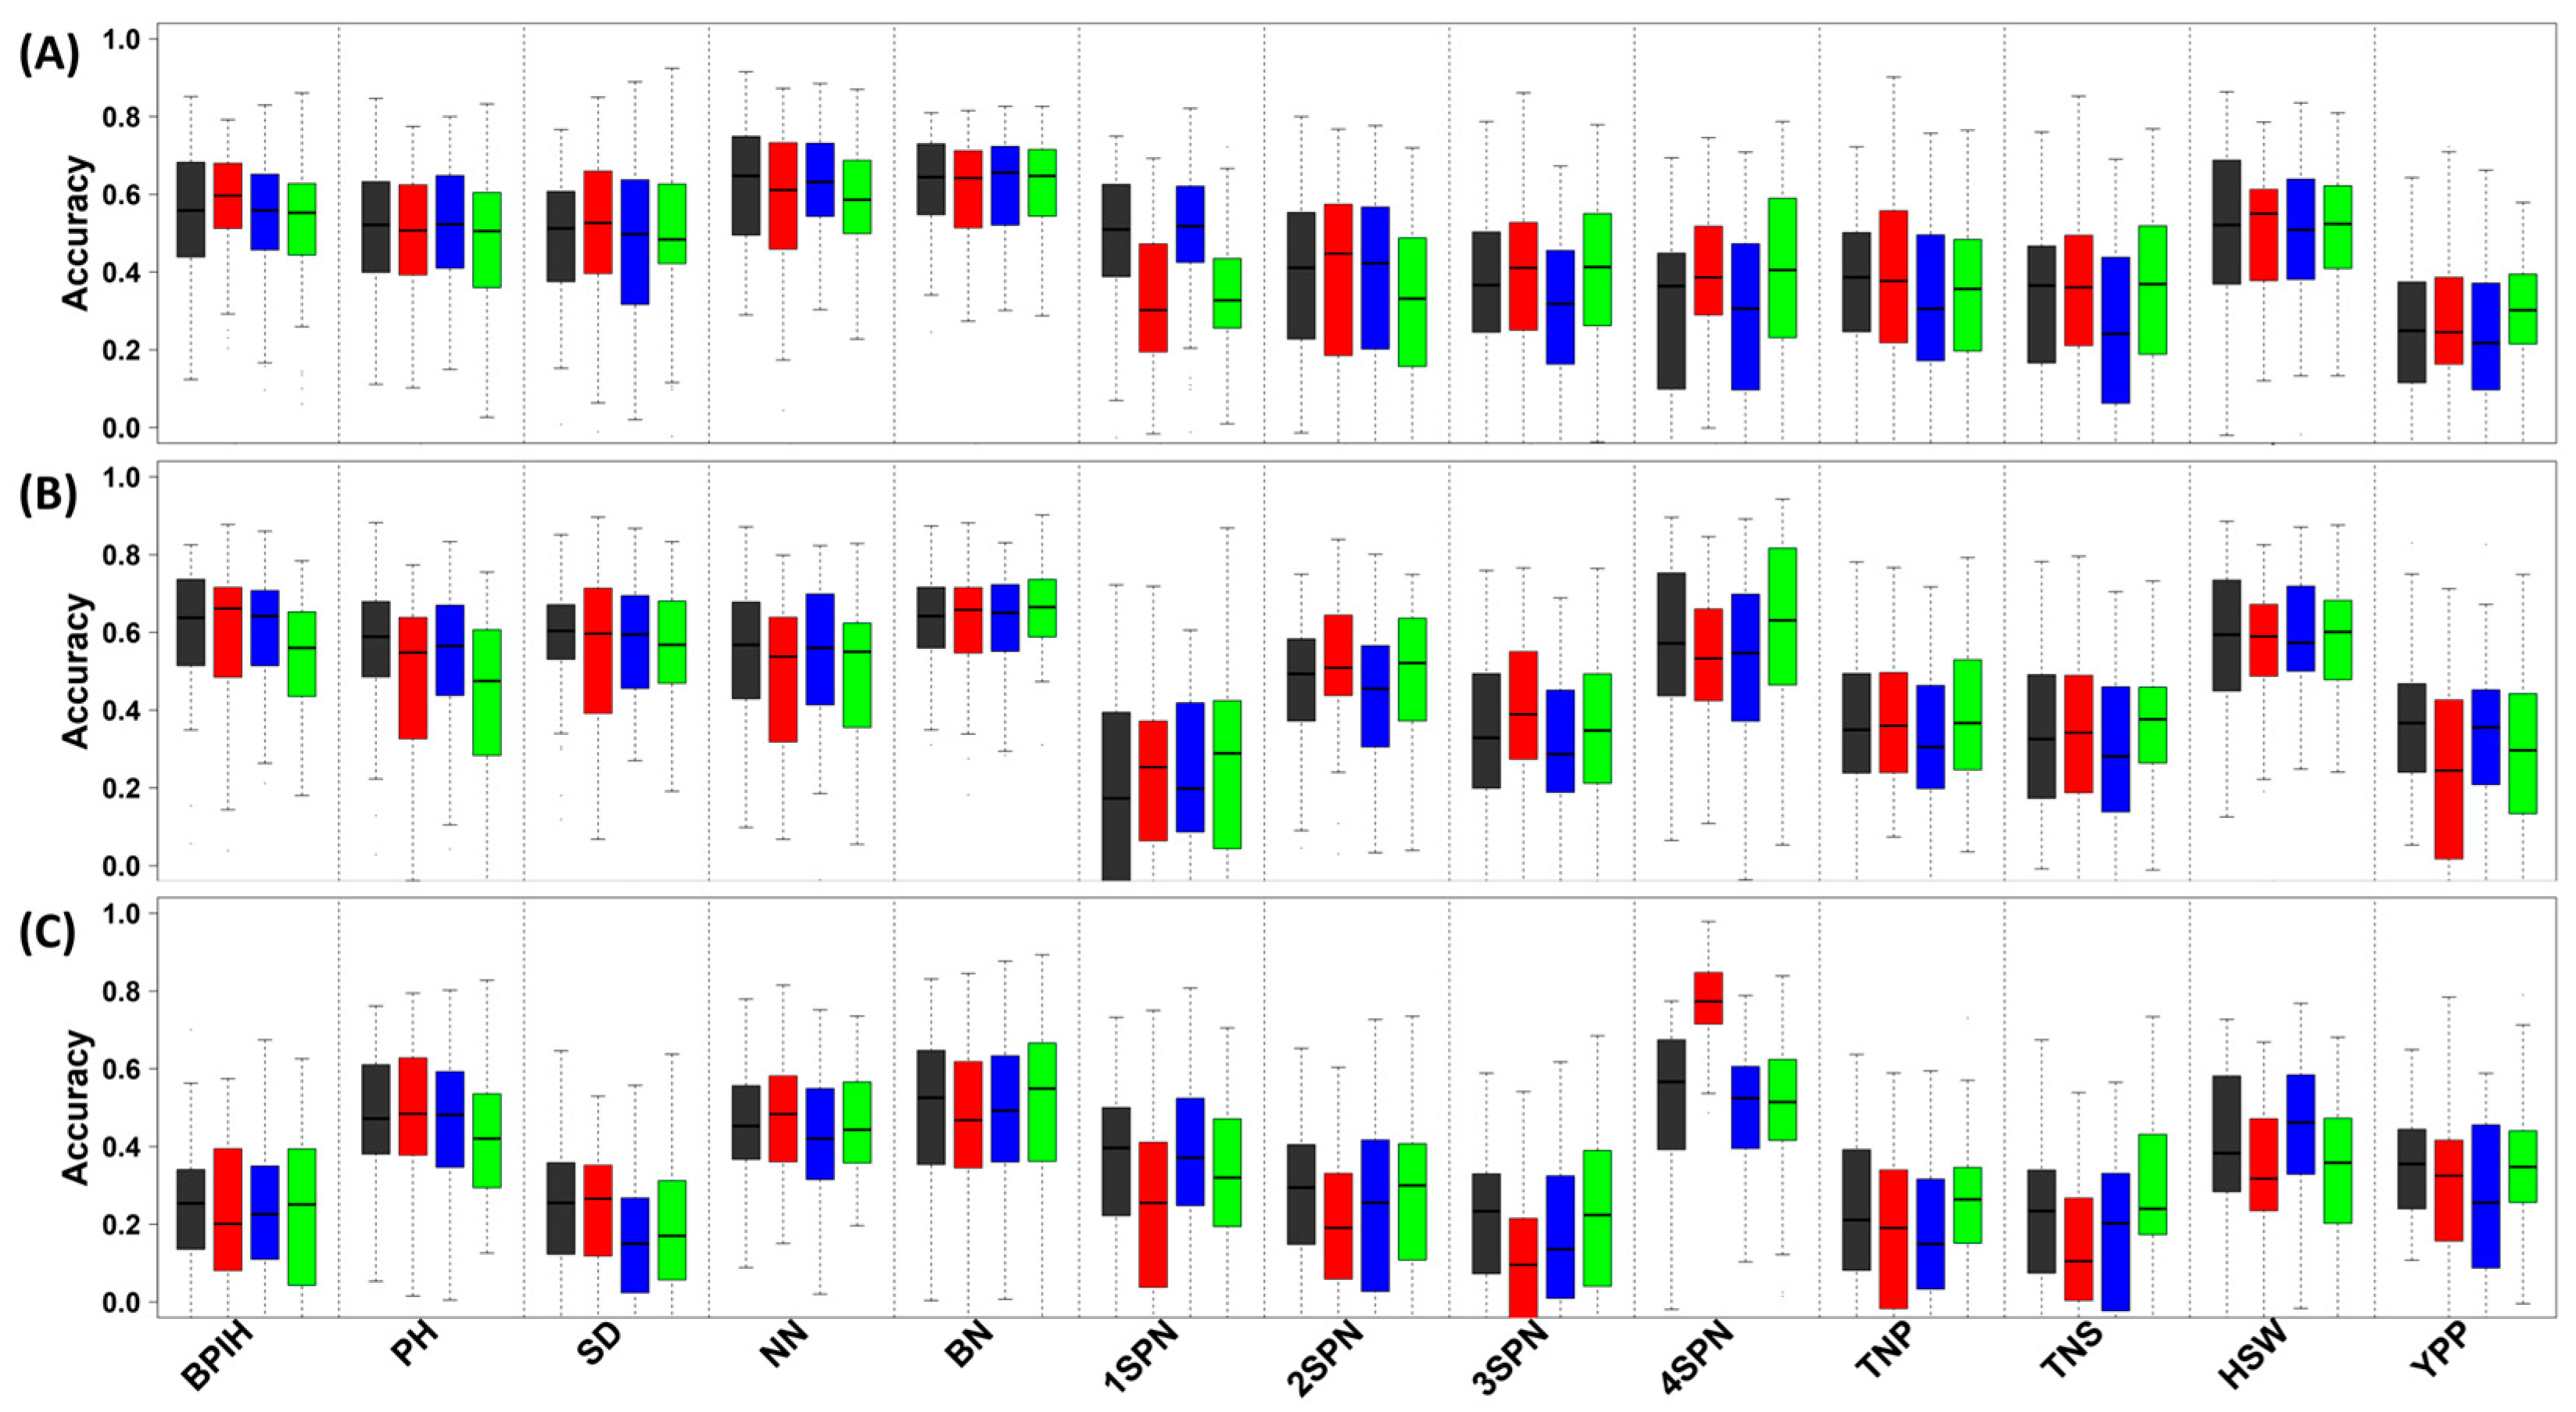
3.4. Genomic Prediction of Essential Agronomic Traits

We further evaluated the predictability of 13 quantitative traits based on genomic data using four distinct methods: rrBLUP, RF, SVM-linear, and SVM-rbf. The average predictive accuracies of cross-validations for different traits using these methods across three environments ranged from 0.07 to 0.77. For YPP, the predictive accuracies varied from 0.22 to 0.36 (Figure 5 and Table S6).
Furthermore, we analyzed the variance in predictability for each trait by treating predictive accuracy as the response variable in an ANOVA. We considered four methods, three environments, and the interactions between methods and environments. The results indicated that the effects of the environment were significant for all traits (p-value < 0.05) (Table S7). The method effects were significant for PH, 1SPN, 3SPN, 4SPN, TNS, and YPP (p-value < 0.05). Meanwhile, the interaction effects were significant for 1SPN, 2SPN, 3SPN, 4SPN, and YPP (p-value < 0.05).
Additionally, we performed LSD multiple comparisons with FDR adjustment to test differences between various factors. For the three environments, the predictive accuracies were significantly higher in E1 or E2 than in E3 for all traits, with the exception of 4SPN and YPP, where the predictive accuracies in E2 and E3 were significantly higher than in E1 (Figure 5 and Table S8). Regarding the four methods, there was no significant difference among the methods for 8 of the 13 traits (Table S9). The rrBLUP models demonstrated higher or equal predictive accuracies compared to the other methods across all traits, with the exception of 4SPN, where the RF and SVR-rbf models exhibited the highest predictive accuracy (Table S9).

4. Discussion

In this study, we assessed the phenotype for 13 quantitative traits and 2 qualitative traits within a collection of 203 soybean varieties. Each trait demonstrated significant phenotypic variation in distinct environments (Figure S1 and Table S3). The broad-sense heritability for the majority of these traits was found to be greater than 0.5 (Table S3). These results suggest that our collection of soybean accessions encompasses substantial phenotypic variations, likely attributable to genetic variations. By investigating the correlations among different traits, we uncovered stable relationships among certain traits (Figure 1). For instance, we found correlations between YPP and various seed and pod traits, as well as correlations between BPIH and NN under varied environments (Figure 1). These findings suggest the existence of pleiotropic effects at certain genetic loci and strong genetic associations among some key agronomic traits [16,20]. The diversity panel was classified into seven subpopulations. However, we observed substantial gene flows among different subpopulations (Figure 2), which aligns with the frequent use of varieties from different backgrounds in hybridization for the selection of new cultivars.
Soybean is characterized as a short-day and photo-thermal sensitive plant [33]. Consequently, many important agronomic traits, such as yield, plant height, and maturity, are significantly influenced by photo-thermal conditions [34]. Consequently, numerous QTLs associated with yield and maturity have been discovered to be closely linked, underscoring the complex interplay between these traits and the environmental factors [21,57,58]. In our study, we employed GWASs to identify the SALs for critical agronomic traits (Table S5). We discovered several well-established genes, such as Dt2 (the gene for stem growth habit), T (the gene for pubescence color), and Ln (the gene for four-seed pod number), within the SALs for these traits [54,59,60]. Furthermore, we identified several candidate genes in SALs for yield and yield-related traits. One of these candidate genes, Glyma.03G052200, is a homolog of SMFT, a member of the PEBP gene family, which is frequently involved in regulating flower induction and inflorescence architecture in plants [52]. A recent study has shown that Arabidopsis SMFT is increasingly being expressed, reaching the highest level in fully ripe seeds, and affects seed vitality characteristics [52]. Two other candidate genes, Glyma.05G182700 and Glyma.01G154700, are homologs of Arabidopsis EMB2453 and EMB1417, respectively, both of which are annotated as being involved in embryo development in Arabidopsis [53]. Another candidate gene, Glyma.01G154700, is a homolog of APY7 which is involved in pollen exine pattern formation and anther dehiscence [55]. The final candidate gene, Glyma.06G289300, is a homolog of GLK1 which is a primary regulator of chloroplast biogenesis and photosynthetic activity [56]. In soybean, the up-regulation of GmGLK10, a member of GLKs, has been linked with enlarged seeds in CHROMOMETHYLASE (CMT) mutants [61]. Additionally, we explored the expression patterns of these candidate genes across various tissues and organs by retrieving published RNA-seq data from the soybean expression atlas (https://soyatlas.venanciogroup.uenf.br/, accessed on 7 May 2025) [62,63]. We found all candidate genes exhibited detectable expression across different tissues. Notably, Glyma.03G052200 showed relatively high expression in shoot, flower, and seed, while, Glyma.01G154700 showed relatively high expression in flower and seed (Figure S4). These findings suggest that multiple biological processes or functions may play a role in regulating yield within this diversity panel of soybeans. Through the analysis of the relationship between SALs and traits, we illuminated the genetic links between yield and its related traits, as well as the connection between NN and BPIH (Figure 4). These results align with observations from GWASs in soybean and other crops, suggesting they might be regulated by pleiotropic QTLs or closely linked QTLs [16,20,49]. The observed genetic connections among these traits are in agreement with the phenotypic correlations we noted between these traits (Figure 4 and Figure 1). Thus, our findings may establish a foundation for the further fine mapping and cloning of QTLs/genes related to essential agronomic traits, offering a basis for high-yield soybean breeding.
Genomic selection has been established as an efficient strategy for crop breeding [64,65]. Genomic best linear unbiased prediction (GBLUP) and rrBLUP are commonly used in genomic selection in plants and are often the first choice when exploring the potential of genomic prediction in a breeding program [66]. In recent years, numerous genomic prediction models and algorithms have been proposed [67]. A recent study on rice has shown that trait predictability could be optimized by utilizing superior prediction models and selectively employing omics datasets [68]. Research in wheat and maize indicates that deep learning or machine learning models can offer similar or slightly superior predictive abilities to GBLUP models, depending on the specific context [69,70,71]. In our study, we assessed the predictive performance of four different methods across three distinct environments. We found that the rrBLUP method yielded the highest accuracies for nearly all traits, and machine learning methods such as RF and SVM-rbf demonstrated superior predictive accuracies for 4SPN (Figure 5 and Table S9). We also observed the significant impact of environmental factors on the predictive accuracies (Figure 5 and Table S8). In our study, the two experimental locations varied in soil water, salt and nutrient content, and differing weather conditions over two years resulted in the three distinct environments (2019 and 2020 at Taonan and 2020 at Fanjiatun). We speculate that some accessions experienced waterlogging in E3 due to weather conditions at that location, leading to reduced predictive accuracies. Observations of varied predictive accuracies across different environments have also been documented in studies of white spruce and maize [71,72]. Our findings suggest that the environment in which data are collected significantly influences the predictive performance of genomic prediction. While rrBLUP is suitable for most traits, certain traits may benefit from more complex machine learning models.

5. Conclusions

In this study, we evaluated 15 agronomic traits in three distinct environments, conducted GBS, analyzed population structure, and performed GWAS analysis on a diversity panel of soybean accessions. We identified 64 SALs for important agronomic, revealed the genetic interconnections between yield and related traits, and highlighted several candidate genes for these traits. Additionally, we assessed the performances of genomic prediction using four distinct methods across three different environments for essential agronomic traits. Our findings lay the foundation for future research into genetic mechanisms of soybean agronomic traits and the application of genomic selection in soybean breeding.

Supplementary Materials

The following supporting information can be downloaded at: https://www.mdpi.com/article/10.3390/agronomy15051181/s1, Figure S1: Phenotype distribution of each trait in each environment; Figure S2: Decay of LD in 194 soybean accessions; Figure S3: Manhattan plots and Q-Q plots of genome-wide association analysis for all traits; Figure S4: Expression profiles of candidate genes across 28 different soybean tissues based on previously published RNA-seq data; Table S1: Summary of GBS data yield for 194 soybean accessions; Table S2: GWAS model selection for each trait in three environments; Table S3: Descriptive statistics of essential agronomic traits of the diversity panel under different environment; Table S4: Correlation between different environments for each trait; Table S5: Summary of SALs for 15 agronomic traits; Table S6: Summary of predictive accuracies with different method in 13 traits; Table S7: Summary of ANOVA result of predictive accuracy for each trait; Table S8: LSD multiple comparisons of predictive accuracies across different environments for each trait; Table S9: LSD multiple comparisons of predictive accuracies across different methods for each trait.

Author Contributions

Conceptualization, B.L., X.D. and C.X.; methodology, Q.D. and Y.C.; formal analysis, Q.D. and Y.C.; investigation, Y.L, Y.T., D.L., J.Y. and N.Z.; resources, X.D.; data curation, Y.C., Y.L., Y.T. and J.Y.; writing—original draft preparation, Q.D., Y.C., Y.L., Y.T., D.L., J.Y. and N.Z.; writing—review and editing, B.L., X.D. and C.X.; visualization, Y.C.; supervision, C.X.; funding acquisition, C.X. and X.D. All authors have read and agreed to the published version of the manuscript.

Funding

This research was funded by the Natural Science Foundation of Jilin Province (grant no. 20210101007JC), the Biological Breeding-National Science and Technology Major Project (grant no. 2023ZD0403702), the Jilin Province Young Science and Technology Talent Support Project (grant no. QT202326), the earmarked Fund for China Agriculture Research System (grant no. CARS-04) and the Jilin Province Science and Technology Development Plan Project (grant no. YDZJ202502CXJD046).

Data Availability Statement

The GBS data for this study have been submitted to the NCBI SRA database and can be found under the following accession number PRJNA1248597.

Acknowledgments

We thank Di Liang, Qi An, Ruihong Guo, and Yuhui Jiang for their help in collecting the phenotype data.

Conflicts of Interest

The authors declare no conflicts of interest.

References

  1. Hartman, G.L.; West, E.D.; Herman, T.K. Crops that feed the World 2. Soybean-worldwide production, use, and constraints caused by pathogens and pests. Food Secur. 2011, 3, 5–17. [Google Scholar] [CrossRef]
  2. Sedivy, E.J.; Wu, F.; Hanzawa, Y. Soybean domestication: The origin, genetic architecture and molecular bases. New Phytol. 2017, 214, 539–553. [Google Scholar] [CrossRef] [PubMed]
  3. Tian, Z.; Nepomuceno, A.L.; Song, Q.; Stupar, R.M.; Liu, B.; Kong, F.; Ma, J.; Lee, S.H.; Jackson, S.A. Soybean2035: A decadal vision for soybean functional genomics and breeding. Mol. Plant 2025, 18, 245–271. [Google Scholar] [CrossRef] [PubMed]
  4. Hymowitz, T. Speciation and Cytogenetics. In Soybeans: Improvement, Production, and Uses, 3rd ed.; Boerma, H.R., Specht, J.E., Eds.; American Society of Agronomy, Inc.: Madison, WI, USA, 2004; pp. 97–136. [Google Scholar]
  5. Wilson, R.F. Seed Composition. In Soybeans: Improvement, Production, and Uses, 3rd ed.; Boerma, H.R., Specht, J.E., Eds.; American Society of Agronomy, Inc.: Madison, WI, USA, 2004; pp. 621–677. [Google Scholar]
  6. Duan, Z.; Xu, L.; Zhou, G.; Zhu, Z.; Wang, X.; Shen, Y.; Ma, X.; Tian, Z.; Fang, C. Unlocking soybean potential: Genetic resources and omics for breeding. J. Genet. Genom. 2025, in press. [Google Scholar] [CrossRef]
  7. Ray, D.K.; Mueller, N.D.; West, P.C.; Foley, J.A. Yield Trends Are Insufficient to Double Global Crop Production by 2050. PLoS ONE 2013, 8, e66428. [Google Scholar] [CrossRef]
  8. Liu, S.; Zhang, M.; Feng, F.; Tian, Z. Toward a “Green Revolution” for Soybean. Mol. Plant 2020, 13, 688–697. [Google Scholar] [CrossRef]
  9. Wu, T.T.; Sun, S.; Wang, C.J.; Lu, W.C.; Sun, B.C.; Song, X.Q.; Han, X.Z.; Guo, T.; Man, W.Q.; Cheng, Y.X.; et al. Characterizing Changes from a Century of Genetic Improvement of Soybean Cultivars in Northeast China. Crop Sci. 2015, 55, 2056–2067. [Google Scholar] [CrossRef]
  10. Guo, S.; Zhang, Z.; Zhang, F.; Yang, X. Optimizing cultivars and agricultural management practices can enhance soybean yield in Northeast China. Sci. Total Environ. 2023, 857, 159456. [Google Scholar] [CrossRef]
  11. Zhang, L.; Zheng, H.Y.; Li, W.J.; Olesen, J.E.; Harrison, M.T.; Bai, Z.Y.; Zou, J.; Zheng, A.X.; Bernacchi, C.; Xu, X.Y.; et al. Genetic progress battles climate variability: Drivers of soybean yield gains in China from 2006 to 2020. Agron. Sustain. Dev. 2023, 43, 50. [Google Scholar] [CrossRef]
  12. Liu, H.J.; Yan, J. Crop genome-wide association study: A harvest of biological relevance. Plant J. 2019, 97, 8–18. [Google Scholar] [CrossRef]
  13. Tibbs Cortes, L.; Zhang, Z.; Yu, J. Status and prospects of genome-wide association studies in plants. Plant Genome 2021, 14, e20077. [Google Scholar] [CrossRef] [PubMed]
  14. Li, D.; Zhao, X.; Han, Y.; Li, W.; Xie, F. Genome-wide association mapping for seed protein and oil contents using a large panel of soybean accessions. Genomics 2019, 111, 90–95. [Google Scholar] [CrossRef]
  15. Dong, L.; Fang, C.; Cheng, Q.; Su, T.; Kou, K.; Kong, L.; Zhang, C.; Li, H.; Hou, Z.; Zhang, Y.; et al. Genetic basis and adaptation trajectory of soybean from its temperate origin to tropics. Nat. Commun. 2021, 12, 5445. [Google Scholar] [CrossRef] [PubMed]
  16. Yang, C.M.; Yan, J.; Jiang, S.Q.; Li, X.; Min, H.W.; Wang, X.F.; Hao, D.Y. Resequencing 250 Soybean Accessions: New Insights into Genes Associated with Agronomic Traits and Genetic Networks. Genom. Proteom. Bioinform. 2022, 20, 29–41. [Google Scholar] [CrossRef]
  17. Sharmin, R.A.; Karikari, B.; Chang, F.; Al Amin, G.M.; Bhuiyan, M.R.; Hina, A.; Lv, W.; Chunting, Z.; Begum, N.; Zhao, T. Genome-wide association study uncovers major genetic loci associated with seed flooding tolerance in soybean. BMC Plant Biol. 2021, 21, 497. [Google Scholar] [CrossRef]
  18. Bhat, J.A.; Yu, H.; Weng, L.; Yuan, Y.; Zhang, P.; Leng, J.; He, J.; Zhao, B.; Bu, M.; Wu, S.; et al. GWAS analysis revealed genomic loci and candidate genes associated with the 100-seed weight in high-latitude-adapted soybean germplasm. Theor. Appl. Genet. 2025, 138, 29. [Google Scholar] [CrossRef]
  19. Zhang, Q.; Sun, T.; Wang, J.; Fei, J.; Liu, Y.; Liu, L.; Wang, P. Genome-wide association study and high-quality gene mining related to soybean protein and fat. BMC Genom. 2023, 24, 596. [Google Scholar] [CrossRef] [PubMed]
  20. Fang, C.; Ma, Y.; Wu, S.; Liu, Z.; Wang, Z.; Yang, R.; Hu, G.; Zhou, Z.; Yu, H.; Zhang, M.; et al. Genome-wide association studies dissect the genetic networks underlying agronomical traits in soybean. Genome Biol. 2017, 18, 161. [Google Scholar] [CrossRef] [PubMed]
  21. Diers, B.W.; Specht, J.; Rainey, K.M.; Cregan, P.; Song, Q.J.; Ramasubramanian, V.; Graef, G.; Nelson, R.; Schapaugh, W.; Wang, D.C.; et al. Genetic Architecture of Soybean Yield and Agronomic Traits. G3 Genes Genom. Genet. 2018, 8, 3367–3375. [Google Scholar] [CrossRef]
  22. Bhat, J.A.; Adeboye, K.A.; Ganie, S.A.; Barmukh, R.; Hu, D.; Varshney, R.K.; Yu, D. Genome-wide association study, haplotype analysis, and genomic prediction reveal the genetic basis of yield-related traits in soybean (Glycine max L.). Front. Genet. 2022, 13, 953833. [Google Scholar] [CrossRef]
  23. Niu, M.; Tian, K.; Chen, Q.; Yang, C.; Zhang, M.; Sun, S.; Wang, X. A multi-trait GWAS-based genetic association network controlling soybean architecture and seed traits. Front. Plant Sci. 2023, 14, 1302359. [Google Scholar] [CrossRef] [PubMed]
  24. Bernardo, R. Molecular markers and selection for complex traits in plants: Learning from the last 20 years. Crop Sci. 2008, 48, 1649–1664. [Google Scholar] [CrossRef]
  25. Melchinger, A.E.; Utz, H.F.; Schon, C.C. Quantitative trait locus (QTL) mapping using different testers and independent population samples in maize reveals low power of QTL detection and large bias in estimates of QTL effects. Genetics 1998, 149, 383–403. [Google Scholar] [CrossRef] [PubMed]
  26. Meuwissen, T.H.; Hayes, B.J.; Goddard, M.E. Prediction of total genetic value using genome-wide dense marker maps. Genetics 2001, 157, 1819–1829. [Google Scholar] [CrossRef]
  27. Moeinizade, S.; Kusmec, A.; Hu, G.; Wang, L.; Schnable, P.S. Multi-trait Genomic Selection Methods for Crop Improvement. Genetics 2020, 215, 931–945. [Google Scholar] [CrossRef]
  28. Crossa, J.; Perez-Rodriguez, P.; Cuevas, J.; Montesinos-Lopez, O.; Jarquin, D.; de Los Campos, G.; Burgueno, J.; Gonzalez-Camacho, J.M.; Perez-Elizalde, S.; Beyene, Y.; et al. Genomic Selection in Plant Breeding: Methods, Models, and Perspectives. Trends Plant Sci. 2017, 22, 961–975. [Google Scholar] [CrossRef]
  29. Sandhu, K.; Patil, S.S.; Pumphrey, M.; Carter, A. Multitrait machine- and deep-learning models for genomic selection using spectral information in a wheat breeding program. Plant Genome 2021, 14, e20119. [Google Scholar] [CrossRef]
  30. Bayer, P.E.; Petereit, J.; Danilevicz, M.F.; Anderson, R.; Batley, J.; Edwards, D. The application of pangenomics and machine learning in genomic selection in plants. Plant Genome 2021, 14, e20112. [Google Scholar] [CrossRef]
  31. Matei, G.; Woyann, L.G.; Milioli, A.S.; Oliveira, I.D.; Zdziarski, A.D.; Zanella, R.; Coelho, A.S.G.; Finatto, T.; Benin, G. Genomic selection in soybean: Accuracy and time gain in relation to phenotypic selection. Mol. Breed. 2018, 38, 117. [Google Scholar] [CrossRef]
  32. Miller, M.J.; Song, Q.; Li, Z. Genomic selection of soybean (Glycine max) for genetic improvement of yield and seed composition in a breeding context. Plant Genome 2023, 16, e20384. [Google Scholar] [CrossRef]
  33. Wang, C.J.; Wu, T.T.; Wu, C.X.; Jiang, B.J.; Sun, S.; Hou, W.S.; Han, T.F. Changes in photo-thermal sensitivity of widely grown Chinese soybean cultivars due to a century of genetic improvement. Plant Breed. 2015, 134, 94–104. [Google Scholar] [CrossRef]
  34. Zhang, L.X.; Liu, W.; Tsegaw, M.; Xu, X.; Qi, Y.P.; Sepey, E.; Liu, L.P.; Wu, T.T.; Sun, S.; Han, T.F. Principles and practices of the photo-thermal adaptability improvement in soybean. J. Integr. Agric. 2020, 19, 295–310. [Google Scholar] [CrossRef]
  35. Bates, D.; Mächler, M.; Bolker, B.M.; Walker, S.C. Fitting Linear Mixed-Effects Models Using lme4. J. Stat. Softw. 2015, 67, 1–48. [Google Scholar] [CrossRef]
  36. Allen, G.C.; Flores-Vergara, M.A.; Krasynanski, S.; Kumar, S.; Thompson, W.F. A modified protocol for rapid DNA isolation from plant tissues using cetyltrimethylammonium bromide. Nat. Protoc. 2006, 1, 2320–2325. [Google Scholar] [CrossRef]
  37. Bolger, A.M.; Lohse, M.; Usadel, B. Trimmomatic: A flexible trimmer for Illumina sequence data. Bioinformatics 2014, 30, 2114–2120. [Google Scholar] [CrossRef]
  38. Li, H.; Durbin, R. Fast and accurate short read alignment with Burrows-Wheeler transform. Bioinformatics 2009, 25, 1754–1760. [Google Scholar] [CrossRef]
  39. Li, H.; Handsaker, B.; Wysoker, A.; Fennell, T.; Ruan, J.; Homer, N.; Marth, G.; Abecasis, G.; Durbin, R.; 1000 Genome Project Data Processing Subgroup. The Sequence Alignment/Map format and SAMtools. Bioinformatics 2009, 25, 2078–2079. [Google Scholar] [CrossRef]
  40. Danecek, P.; Bonfield, J.K.; Liddle, J.; Marshall, J.; Ohan, V.; Pollard, M.O.; Whitwham, A.; Keane, T.; McCarthy, S.A.; Davies, R.M.; et al. Twelve years of SAMtools and BCFtools. Gigascience 2021, 10, giab008. [Google Scholar] [CrossRef]
  41. Purcell, S.; Neale, B.; Todd-Brown, K.; Thomas, L.; Ferreira, M.A.R.; Bender, D.; Maller, J.; Sklar, P.; de Bakker, P.I.W.; Daly, M.J.; et al. PLINK: A tool set for whole-genome association and population-based linkage analyses. Am. J. Hum. Genet. 2007, 81, 559–575. [Google Scholar] [CrossRef]
  42. Browning, B.L.; Browning, S.R. Genotype Imputation with Millions of Reference Samples. Am. J. Hum. Genet. 2016, 98, 116–126. [Google Scholar] [CrossRef]
  43. Felsenstein, J. Confidence Limits on Phylogenies: An Approach Using the Bootstrap. Evolution 1985, 39, 783–791. [Google Scholar] [CrossRef] [PubMed]
  44. Zhang, G.; Wang, R.; Ma, J.; Gao, H.; Deng, L.; Wang, N.; Wang, Y.; Zhang, J.; Li, K.; Zhang, W.; et al. Genome-wide association studies of yield-related traits in high-latitude japonica rice. BMC Genom. Data 2021, 22, 39. [Google Scholar] [CrossRef] [PubMed]
  45. Alexander, D.H.; Novembre, J.; Lange, K. Fast model-based estimation of ancestry in unrelated individuals. Genome Res. 2009, 19, 1655–1664. [Google Scholar] [CrossRef]
  46. Zhou, X.; Stephens, M. Genome-wide efficient mixed-model analysis for association studies. Nat. Genet. 2012, 44, 821–824. [Google Scholar] [CrossRef]
  47. Moghaddam, S.M.; Mamidi, S.; Osorno, J.M.; Lee, R.; Brick, M.; Kelly, J.; Miklas, P.; Urrea, C.; Song, Q.; Cregan, P.; et al. Genome-Wide Association Study Identifies Candidate Loci Underlying Agronomic Traits in a Middle American Diversity Panel of Common Bean. Plant Genome 2016, 9, plantgenome2016-02. [Google Scholar] [CrossRef]
  48. Mamidi, S.; Chikara, S.; Goos, R.J.; Hyten, D.L.; Annam, D.; Moghaddam, S.M.; Lee, R.K.; Cregan, P.B.; McClean, P.E. Genome-Wide Association Analysis Identifies Candidate Genes Associated with Iron Deficiency Chlorosis in Soybean. Plant Genome 2011, 4, 154–164. [Google Scholar] [CrossRef]
  49. Crowell, S.; Korniliev, P.; Falcao, A.; Ismail, A.; Gregorio, G.; Mezey, J.; McCouch, S. Genome-wide association and high-resolution phenotyping link Oryza sativa panicle traits to numerous trait-specific QTL clusters. Nat. Commun. 2016, 7, 10527. [Google Scholar] [CrossRef]
  50. Endelman, J.B. Ridge Regression and Other Kernels for Genomic Selection with R Package rrBLUP. Plant Genome 2011, 4, 250–255. [Google Scholar] [CrossRef]
  51. Pedregosa, F.; Varoquaux, G.; Gramfort, A.; Michel, V.; Thirion, B.; Grisel, O.; Blondel, M.; Prettenhofer, P.; Weiss, R.; Dubourg, V.; et al. Scikit-learn: Machine Learning in Python. J. Mach. Learn. Res. 2011, 12, 2825–2830. [Google Scholar]
  52. Bellinazzo, F.; Nadal Bigas, J.; Hogers, R.A.H.; Kodde, J.; van der Wal, F.; Kokkinopoulou, P.; Duijts, K.T.M.; Angenent, G.C.; van Dijk, A.D.J.; van Velzen, R.; et al. Evolutionary origin and functional investigation of the widely conserved plant PEBP gene stepmother of FT and TFL1 (SMFT). Plant J. 2024, 120, 1410–1420. [Google Scholar] [CrossRef]
  53. Tzafrir, I.; Pena-Muralla, R.; Dickerman, A.; Berg, M.; Rogers, R.; Hutchens, S.; Sweeney, T.C.; McElver, J.; Aux, G.; Patton, D.; et al. Identification of genes required for embryo development in Arabidopsis. Plant Physiol. 2004, 135, 1206–1220. [Google Scholar] [CrossRef]
  54. Jeong, N.; Suh, S.J.; Kim, M.H.; Lee, S.; Moon, J.K.; Kim, H.S.; Jeong, S.C. Ln is a key regulator of leaflet shape and number of seeds per pod in soybean. Plant Cell 2012, 24, 4807–4818. [Google Scholar] [CrossRef] [PubMed]
  55. Yang, J.; Wu, J.; Romanovicz, D.; Clark, G.; Roux, S.J. Co-regulation of exine wall patterning, pollen fertility and anther dehiscence by Arabidopsis apyrases 6 and 7. Plant Physiol. Biochem. 2013, 69, 62–73. [Google Scholar] [CrossRef]
  56. Fitter, D.W.; Martin, D.J.; Copley, M.J.; Scotland, R.W.; Langdale, J.A. GLK gene pairs regulate chloroplast development in diverse plant species. Plant J. 2002, 31, 713–727. [Google Scholar] [CrossRef]
  57. Kou, K.; Yang, H.; Li, H.; Fang, C.; Chen, L.; Yue, L.; Nan, H.; Kong, L.; Li, X.; Wang, F.; et al. A functionally divergent SOC1 homolog improves soybean yield and latitudinal adaptation. Curr. Biol. 2022, 32, 1728–1742.e6. [Google Scholar] [CrossRef] [PubMed]
  58. Zhu, X.T.; Leiser, W.L.; Hahn, V.; Würschum, T. Identification of QTL for seed yield and agronomic traits in 944 soybean (Glycine max) RILs from a diallel cross of early-maturing varieties. Plant Breed. 2021, 140, 254–266. [Google Scholar] [CrossRef]
  59. Yang, K.; Jeong, N.; Moon, J.K.; Lee, Y.H.; Lee, S.H.; Kim, H.M.; Hwang, C.H.; Back, K.; Palmer, R.G.; Jeong, S.C. Genetic analysis of genes controlling natural variation of seed coat and flower colors in soybean. J. Hered. 2010, 101, 757–768. [Google Scholar] [CrossRef] [PubMed]
  60. Ping, J.; Liu, Y.; Sun, L.; Zhao, M.; Li, Y.; She, M.; Sui, Y.; Lin, F.; Liu, X.; Tang, Z.; et al. Dt2 is a gain-of-function MADS-domain factor gene that specifies semideterminacy in soybean. Plant Cell 2014, 26, 2831–2842. [Google Scholar] [CrossRef]
  61. Xun, H.; Wang, Y.; Yuan, J.; Lian, L.; Feng, W.; Liu, S.; Hong, J.; Liu, B.; Ma, J.; Wang, X. Non-CG DNA hypomethylation promotes photosynthesis and nitrogen fixation in soybean. Proc. Natl. Acad. Sci. USA 2024, 121, e2402946121. [Google Scholar] [CrossRef]
  62. Almeida-Silva, F.; Pedrosa-Silva, F.; Venancio, T.M. The Soybean Expression Atlas v2: A comprehensive database of over 5000 RNA-seq samples. Plant J. 2023, 116, 1041–1051. [Google Scholar] [CrossRef]
  63. Shen, Y.; Zhou, Z.; Wang, Z.; Li, W.; Fang, C.; Wu, M.; Ma, Y.; Liu, T.; Kong, L.A.; Peng, D.L.; et al. Global dissection of alternative splicing in paleopolyploid soybean. Plant Cell 2014, 26, 996–1008. [Google Scholar] [CrossRef]
  64. Varshney, R.K.; Bohra, A.; Yu, J.; Graner, A.; Zhang, Q.; Sorrells, M.E. Designing Future Crops: Genomics-Assisted Breeding Comes of Age. Trends Plant Sci. 2021, 26, 631–649. [Google Scholar] [CrossRef]
  65. Alemu, A.; Astrand, J.; Montesinos-Lopez, O.A.; Isidro, Y.S.J.; Fernandez-Gonzalez, J.; Tadesse, W.; Vetukuri, R.R.; Carlsson, A.S.; Ceplitis, A.; Crossa, J.; et al. Genomic selection in plant breeding: Key factors shaping two decades of progress. Mol. Plant 2024, 17, 552–578. [Google Scholar] [CrossRef] [PubMed]
  66. Crossa, J.; Martini, J.W.R.; Vitale, P.; Perez-Rodriguez, P.; Costa-Neto, G.; Fritsche-Neto, R.; Runcie, D.; Cuevas, J.; Toledo, F.; Li, H.; et al. Expanding genomic prediction in plant breeding: Harnessing big data, machine learning, and advanced software. Trends Plant Sci. 2025. [Google Scholar] [CrossRef] [PubMed]
  67. Wang, X.; Xu, Y.; Hu, Z.L.; Xu, C.W. Genomic selection methods for crop improvement: Current status and prospects. Crop J. 2018, 6, 330–340. [Google Scholar] [CrossRef]
  68. Wang, S.; Wei, J.; Li, R.; Qu, H.; Chater, J.M.; Ma, R.; Li, Y.; Xie, W.; Jia, Z. Identification of optimal prediction models using multi-omic data for selecting hybrid rice. Heredity 2019, 123, 395–406. [Google Scholar] [CrossRef]
  69. Westhues, C.C.; Mahone, G.S.; da Silva, S.; Thorwarth, P.; Schmidt, M.; Richter, J.C.; Simianer, H.; Beissinger, T.M. Prediction of Maize Phenotypic Traits with Genomic and Environmental Predictors Using Gradient Boosting Frameworks. Front. Plant Sci. 2021, 12, 699589. [Google Scholar] [CrossRef]
  70. Montesinos-Lopez, A.; Rivera, C.; Pinto, F.; Pinera, F.; Gonzalez, D.; Reynolds, M.; Perez-Rodriguez, P.; Li, H.; Montesinos-Lopez, O.A.; Crossa, J. Multimodal deep learning methods enhance genomic prediction of wheat breeding. G3 Genes Genomes Genet. 2023, 13, jkad045. [Google Scholar] [CrossRef]
  71. Barreto, C.A.V.; das Gracas Dias, K.O.; de Sousa, I.C.; Azevedo, C.F.; Nascimento, A.C.C.; Guimaraes, L.J.M.; Guimaraes, C.T.; Pastina, M.M.; Nascimento, M. Genomic prediction in multi-environment trials in maize using statistical and machine learning methods. Sci. Rep. 2024, 14, 1062. [Google Scholar] [CrossRef]
  72. Cappa, E.P.; Chen, C.; Klutsch, J.G.; Sebastian-Azcona, J.; Ratcliffe, B.; Wei, X.; Da Ros, L.; Liu, Y.; Bhumireddy, S.R.; Benowicz, A.; et al. Revealing stable SNPs and genomic prediction insights across environments enhance breeding strategies of productivity, defense, and climate-adaptability traits in white spruce. Heredity 2025, 134, 186–199. [Google Scholar] [CrossRef]
Figure 1. Correlation among 13 quantitative traits across three environments. The environments include E1 (Taonan 2019), E2 (Taonan 2020), and E3 (Fanjiatun 2020). The Pearson correlation coefficients are represented by a color gradient. * denotes p-value < 0.05, ** denotes p-value < 0.01, and *** denotes p-value < 0.001.
Agronomy 15 01181 g001
Figure 2. The population structure, principal component analysis (PCA), and phylogenetic tree of 194 spring soybean varieties. (A) The population structure of the 194 soybean varieties for K = 6, K = 7, and K = 8. Different colors represent different ancestry coefficients. (B) A PCA plot for the soybean varieties. Each dot represents a single sample. (C) A phylogenetic tree of the 194 soybean varieties.
Agronomy 15 01181 g002
Figure 3. Manhattan plots and Q-Q plots of genome-wide association analysis for yield and related traits. X-axis is position on each chromosome. Y-axis is the log10-transferred p-values. Each dot represents an SNP. Dashed line in the Manhattan plot indicates the cutoff (q-value < 1 × 10⁻⁵). The significant SNPs are shown in red. The red line in the Q-Q plot represents the theoretical normal distribution. (A) 1SPN; (B) 2SPN; (C) 3SPN; (D) 4SPN; (E) TNP; (F) TNS; (G) HSW; (H) YPP. E1, E2, E3 denote the three environments.
Agronomy 15 01181 g003
Figure 4. Relationships among traits and SALs. Traits and loci are represented as green hexagons and orange circles, respectively. Overlapping SALs are merged. The relationship between an SAL and a trait is indicated by an arrowed line.
Agronomy 15 01181 g004
Figure 5. Predictive accuracies of different methods for each trait across three environments. (A) Predictive accuracies in Environment 1 (E1); (B) Predictive accuracies in Environment 2 (E2); (C) Predictive accuracies in Environment 3 (E3). The prediction methods are represented by different colors: gray for rrBLUP, red for random forest (RF), blue for support vector machine with a linear kernel (SVM-linear), and green for support vector machine with a radial basis function kernel (SVM-rbf).
Agronomy 15 01181 g005
Disclaimer/Publisher’s Note: The statements, opinions and data contained in all publications are solely those of the individual author(s) and contributor(s) and not of MDPI and/or the editor(s). MDPI and/or the editor(s) disclaim responsibility for any injury to people or property resulting from any ideas, methods, instructions or products referred to in the content.

