Article

Transcriptome and Physio-Biochemical Profiling Reveals Differentially Expressed Genes in Seedlings from Aerial and Subterranean Seeds Subjected to Drought Stress in Amphicarpaea edgeworthii Benth

1
Key Laboratory of Agricultural Biological Functional Genes, Northeast Agricultural University, Harbin 150030, China
2
Key Laboratory of Soybean Biology of Chinese Education Ministry, Northeast Agricultural University, Harbin 150030, China
3
Soybean Research Institute, Northeast Agricultural University, Harbin 150030, China
*
Authors to whom correspondence should be addressed.
Agronomy 2025, 15(3), 735; https://doi.org/10.3390/agronomy15030735
Submission received: 11 February 2025 / Revised: 17 March 2025 / Accepted: 17 March 2025 / Published: 19 March 2025

Abstract

:
Drought stress represents a prevalent environmental challenge that significantly impedes plant growth. The Chinese hog-peanut (Amphicarpaea edgeworthii Benth.), an amphicarpic legume, can produce both aerial seeds (ASs) and subterranean seeds (SSs). However, it is largely unknown whether there are differences between the seedlings from ASs and SSs in response to drought stress. In this study, the 30-day old AS and SS seedlings of A. edgeworthii are subjected to drought stress by withholding watering for five or ten days. Then, we identify the morphological and physio-biochemical characteristics of seedlings from both ASs and SSs under drought stress. Following ten days of drought treatment, the contents of proline (PRO) and malondialdehyde (MDA), the root shoot ratio, and the rate of water loss were significantly increased, whereas the chlorophyll content and the relative water content were significantly decreased in both AS and SS seedlings. Moreover, compared to AS seedlings, SS seedlings accumulated more hydrogen peroxide (H2O2) while exhibiting significantly lower peroxidase (POD) and superoxide dismutase (SOD) activities after exposure to ten days of drought stress. These findings indicate that SS seedlings are more susceptible to drought stress. To identify drought-associated genes and reveal the mechanisms underlying drought adaptability in AS and SS seedlings, we performed an RNA-seq-based transcriptomic analysis in AS and SS seedlings exposed to drought stress. We identified 1317 and 2029 differentially expressed genes (DEGs) in AS seedlings five and ten days post-drought treatment, respectively, and 1793 DEGs in SS seedlings ten days post-drought treatment compared to the normal treatment (CK). These DEGs were commonly enriched in response-related GO terms. Furthermore, hundreds of transcription factor (TF) genes were identified among the DEGs in AS and SS seedlings after drought treatment. Notably, the ERF, bHLH, NAC, and C2H2 families were predominant in AS seedlings five days following drought treatment, while the bHLH, ERF, MYB-related, and WRKY families were prevalent in both AS and SS seedlings ten days following drought treatment. These findings suggest that the identified TFs may play crucial roles in the response of AS and SS seedlings of A. edgeworthii to drought stress.

1. Introduction

Chinese hog-peanut (Amphicarpaea edgeworthii Benth.), a typical amphicarpic legume widely distributed across China, exhibits a remarkable ability to produce distinct types of flowers, facilitating both aerial and subterranean seed development. This characteristic is emblematic of plants that bear seeds both above and below ground. The seed coat of the aerial seeds (ASs) is well developed, in contrast to the undeveloped seed coat of the subterranean seeds (SSs). ASs exhibit a combination of physical dormancy and physiological dormancy, which can be alleviated through mechanical abrasion of the seed coat [1,2]. Recent genomic studies have revealed that the genome of A. edgeworthii represents the most compact genome documented to date [3]. This species demonstrates adaptability to both arid and wet environments, exhibiting significant phenotypic variation between plants from semi-arid fields and seasonally flooded fields [4]. However, our understanding of the responses of A. edgeworthii to abiotic stresses remains limited, particularly regarding potential differences in the reactions of seedlings from ASs and SSs to such stresses.
Drought is a prevalent meteorological phenomenon that poses a significant threat to agricultural productivity globally [5]. The stress induced by droughts triggers a variety of morphological, physiological, and biochemical responses in plants [6,7]. Under drought conditions, the concentrations of osmoregulatory compounds, such as soluble sugars and proline (PRO), increase, while the activities of antioxidant enzymes, including peroxidase (POD), catalase (CAT), and superoxide dismutase (SOD) are also influenced [8,9]. The physiological alterations resulting from drought stress are often accompanied by changes in gene expression. Under drought stress, genes involved in the protection system against reactive oxygen species (ROSs), transcription factors (TFs), and chaperones are upregulated, while genes involved in photosynthesis, growth, and development are usually downregulated. Notably, researchers have initiated efforts to enhance drought tolerance of leguminous plants through the overexpression of some TF genes (WRKY, NAC, DREB, ZIP, AP2/ERF, MYB) [10]. In addition to TF genes, the overexpression of the osmoregulatory P5CSF129A gene in the chickpea (Cicer arietinum L.) has been shown to enhance PRO accumulation while simultaneously reducing levels of malondialdehyde (MDA) and free radicals [11]. Moreover, the exotic expression of the GmSK1 gene from soybean (Glycine max L.) in tobacco (Nicotiana tobacum L.) has been shown to improve drought stress tolerance by reducing greenness and water loss alongside an increase in MDA accumulation [12].
RNA sequencing (RNA-seq) is a highly efficient and robust technology for transcriptome analysis, significantly enhancing our comprehension of transcriptomic landscapes. Utilizing various transcriptome assembly approaches, including genome-guided and de novo strategies, RNA-seq has been extensively employed in both model organisms and non-model organisms that lack high-quality reference genomes [13,14]. In plants, RNA-seq has become a widely employed method for elucidating the molecular mechanisms underlying plant responses to drought stress and for identifying candidate genes [15,16,17]. Several studies have indicated that drought stress can upregulate genes that enhance antioxidant capacity and suppress senescence [18]. For instance, an analysis of the soybean transcriptome at various stages after drought stress treatment has revealed a series of transcription factors (TFs) and drought-related genes [19]. Aleem et al. (2021) utilized RNA-seq technology to investigate the transcriptome of wild soybean under drought stress, identifying ten candidate genes associated with drought tolerance [20]. Additionally, Abdeen et al. (2010) demonstrated that the gene expression profile of plants overexpressing ABF3 under drought stress significantly differed from that of the control group [21].
In the present study, we analyze the morphological and physio-biochemical characteristics of seedlings from both ASs and SSs under drought stress and employ Illumina RNA-seq technology to sequence the transcriptomes of A. edgeworthii seedlings from both ASs and SSs under drought stress conditions. Subsequently, we analyze the differentially expressed genes (DEGs) through functional annotation and TF predictions, aiming to provide valuable insights into the various mechanisms that govern the drought response in seedlings derived from ASs and SSs.

2. Materials and Methods

2.1. Plant Materials and Drought Treatment

The two types of seeds (ASs and SSs) of A. edgeworthii were collected from the Acheng district (45°32′00.00″ N, 126°59′00.00″ E) of Harbin, China, in October 2021. ASs exhibit a flattened, round morphology, characterized by a black–brown seed coat adorned with black–gray spots. The average dimensions of these seeds were recorded as 3.42 mm in length, 3.00 mm in width, and 1.68 mm in thickness. Conversely, SSs are enveloped in a thick layer of brown skin and densely covered with brown hairs, with sizes varying up to a maximum diameter of 16 mm (Figure S1). Then, the plant materials were propagated and maintained in laboratory settings at the Key Laboratory of Agricultural Biological Functional Genes, Northeast Agricultural University. The experimental studies on drought treatment in A. edgeworthii seedlings were conducted in laboratory and greenhouse settings in April 2023. The seed coats of both ASs and SSs were incised using a razor blade and subsequently subjected to vernalization on wet filter paper for a duration of two days. Following germination, vermiculite was placed in an appropriate container and allowed to absorb water until saturation. The AS and SS seedlings of A. edgeworthii were then transferred to an artificial climate incubator, where they were cultured under controlled conditions: a light intensity of 200 μmol·m−2·s−1, a temperature of 22 °C, humidity of 60%, and a photoperiod of 16 h/8 h (light/dark). Throughout the growth period of the plants, the vermiculite was alternated with water and Hoagland’s solution (pH 5.5) every six days to maintain adequate moisture and nutrient levels. After 30 days, the AS and SS seedlings were subjected to drought stress by withholding water for ten days. Leaves from the drought-stressed plants were harvested on the fifth and tenth days post-treatment, while leaves from untreated plants served as controls (CK). Three biological replicates were collected from each group, and the samples were subsequently frozen in liquid nitrogen and preserved at −80 °C for later analyses.

2.2. Physiological Index Measurements Under Drought Stress

Assays were performed using commercial kits from Beijing Box Biotechnology Co., Ltd. (BOXBIO, Beijing, China). MDA content was quantified using the thiobarbituric acid method (MDA Content Assay Kit). SOD activity was assessed using the xanthine oxidase-nitro blue tetrazolium chloride (XOD-NBT) method (SOD Activity Assay Kit), and POD activity was measured with the POD Activity Assay Kit. CAT activity was determined via the UV absorption method (CAT Activity Assay Kit). Hydrogen peroxide (H2O2) content was evaluated using the titanium sulfate method (H2O2 Assay Kit), and PRO content was measured using the acid ninhydrin method (Proline Content Assay Kit). Chlorophyll content was measured by ethanol extraction (Chlorophyll Content Assay Kit). Relative moisture content was analyzed following the protocol by Jia et al. [22]. For each parameter, five seedlings per treatment group were sampled, with three biological replicates analyzed. Absorbance readings were obtained using a Tecan infinite 200 Pro (M plex) multimode plate reader (Tecan, Grödig, Austria).

2.3. RNA Extraction and Illumina RNA-Seq

Total RNA was extracted utilizing the Trizol reagent (Invitrogen, Carlsbad, CA, USA) in accordance with the manufacturer’s instructions. The concentration and purity of the total RNA were assessed using the Agilent 2100 Bioanalyzer (Agilent Technologies, Palo Alto, CA, USA). The mRNA with a poly (A) structure was enriched with Oligo(dT) magnetic beads, and the RNA was fragmented into approximately 300 bp in length through ion interruption. The first strand of complementary DNA (cDNA) was synthesized using a six-base random primer and reverse transcriptase, with RNA serving as the template. The second strand of cDNA was synthesized using the first strand as the template. Following the library construction, PCR amplification was employed to enrich the library fragments, which were then selected based on fragment size, targeting a library size of 450 bp. Quality control of the library was performed using the Agilent 2100 Bioanalyzer, followed by measurement of the total and effective concentrations of the library. The libraries were sequenced using the Illumina RNA-seq platform for paired-end (PE) sequencing, conducted by Shanghai Personalbio Technology Co., Ltd. (Shanghai, China) in December 2023.

2.4. Raw Data Processing, Read Mapping, and Differentially Expressed Gene Analysis

The raw reads obtained from RNA-seq were processed using fastp (v0.22.0) to eliminate reads containing adaptors and those of low quality, thereby yielding high-quality sequences (clean reads) for subsequent analysis. Then, the clean reads were mapped to the reference genome [BioProject of CNSA (https://db.cngb.org/cnsa/, accessed on 30 December 2023), accession: CNP0001124] using the HISAT2 (v2.1.0) package. The HTSeq (v0.9.1) software was employed to quantify the read count for each gene, serving as the raw expression measure, which is positively correlated with the true expression level of the gene, the length of the gene, and the depth of sequencing. To facilitate comparability of gene expression levels across genes and samples, expression normalization was performed using FPKM (fragments per kilobases of transcript per million mapped reads). Genes with an FPKM value greater than 0 were considered expressed. Differential expression analysis was conducted using the R package DESeq (v1.38.3), with criteria for identifying DEGs set to a fold change of |log2FoldChange| > 1 and a significance p-value < 0.05.

2.5. Functional Annotation of DEGs

Gene ontology (GO) enrichment analysis was performed using the topGO (v2.50.0) software, where the list of DEGs and their counts were calculated for each term based on GO term annotations of DEGs; p-values were computed using the hypergeometric distribution method, with a significant p-value threshold of <0.05, to identify GO terms significantly enriched in DEGs relative to the whole genome background.
KEGG enrichment analysis was conducted using ClusterProfiler (v4.6.0), where gene lists and counts were calculated for each pathway based on KEGG annotations of DEGs, with p-values determined by the hypergeometric distribution method (significant threshold: p-value < 0.05).
TF predictions were made through PlantTFDB databases (https://planttfdb.gao-lab.org/index.php, accessed on 29 June 2024) to identify TFs and their associated families. Heatmaps were generated using the R package pheatmap (v1.0.12).

2.6. Quantitative Real-Time PCR (RT-qPCR)

RT-qPCR assays were employed to validate the reliability of RNA-seq analyses. Reverse transcription of RNA samples was conducted using the ReverTra Ace qPCR RT Master Mix Kit (TOYOBO, Osaka, Japan). Primers for these analyses were designed using the Primer Premier 5.0 software (PREMIER Biosoft, Palo Alto, CA, USA) (Table S1). The expression of AeSKP1 (Ae.00009204) was used as an internal control [3], and real-time PCR was performed using the SYBR Green PCR Master Mix system (TOYOBO, Japan). The Ct values for DEGs and internal reference genes were recorded. Each gene was replicated three times, and the experimental data were analyzed quantitatively using the 2−ΔΔCt method [23].

2.7. Statistical Analysis

Physiological index measurements and RT-qPCR assays were performed with three biological/technical replications, and values are presented as the mean with the standard deviation (SD). Data processing and visualization were conducted using the GraphPad Prism v8.4.0 software (GraphPad Software, San Diego, CA, USA), and significance analysis was performed using unpaired two-tailed Student’s t-test. Statistical significance was considered achieved when the p-value was less than 0.05.

3. Results

3.1. Phenotypic and Physiological Alterations in A. edgeworthii Under Drought Stress

To investigate the impact of drought stress on the growth of A. edgeworthii, we exposed thirty-day-old plants to drought stress for a duration of ten days. Drought stress resulted in noticeable symptoms of dehydration, e.g., leaf yellowing or becoming dry, with SS seedlings exhibiting a more pronounced degree of yellowing compared to AS seedlings after the ten-day drought treatment (D10) (Figure 1a). A decline in chlorophyll content was noticed under drought conditions, particularly in SS seedlings (Figure 1b), a finding which aligns with the dehydration phenotypes observed in both ASs and SSs. In A. edgeworthii, the accumulation of PRO and MDA content, as well as the root shoot ratio of plants, were all significantly increased in both AS and SS seedlings following the drought treatment (Figure 1c–e). Additionally, the relative water content in both AS and SS seedlings exhibited significant reductions after drought stress, with SS seedlings demonstrating a greater decrease than AS seedlings (Figure 1f). In contrast to the relative water content, the rate of water loss increased in both AS and SS seedlings under drought stress, with SS seedlings experiencing a more substantial increase than AS seedlings (Figure 1g). These findings suggest that SS seedlings are more susceptible to drought stress compared to AS seedlings.

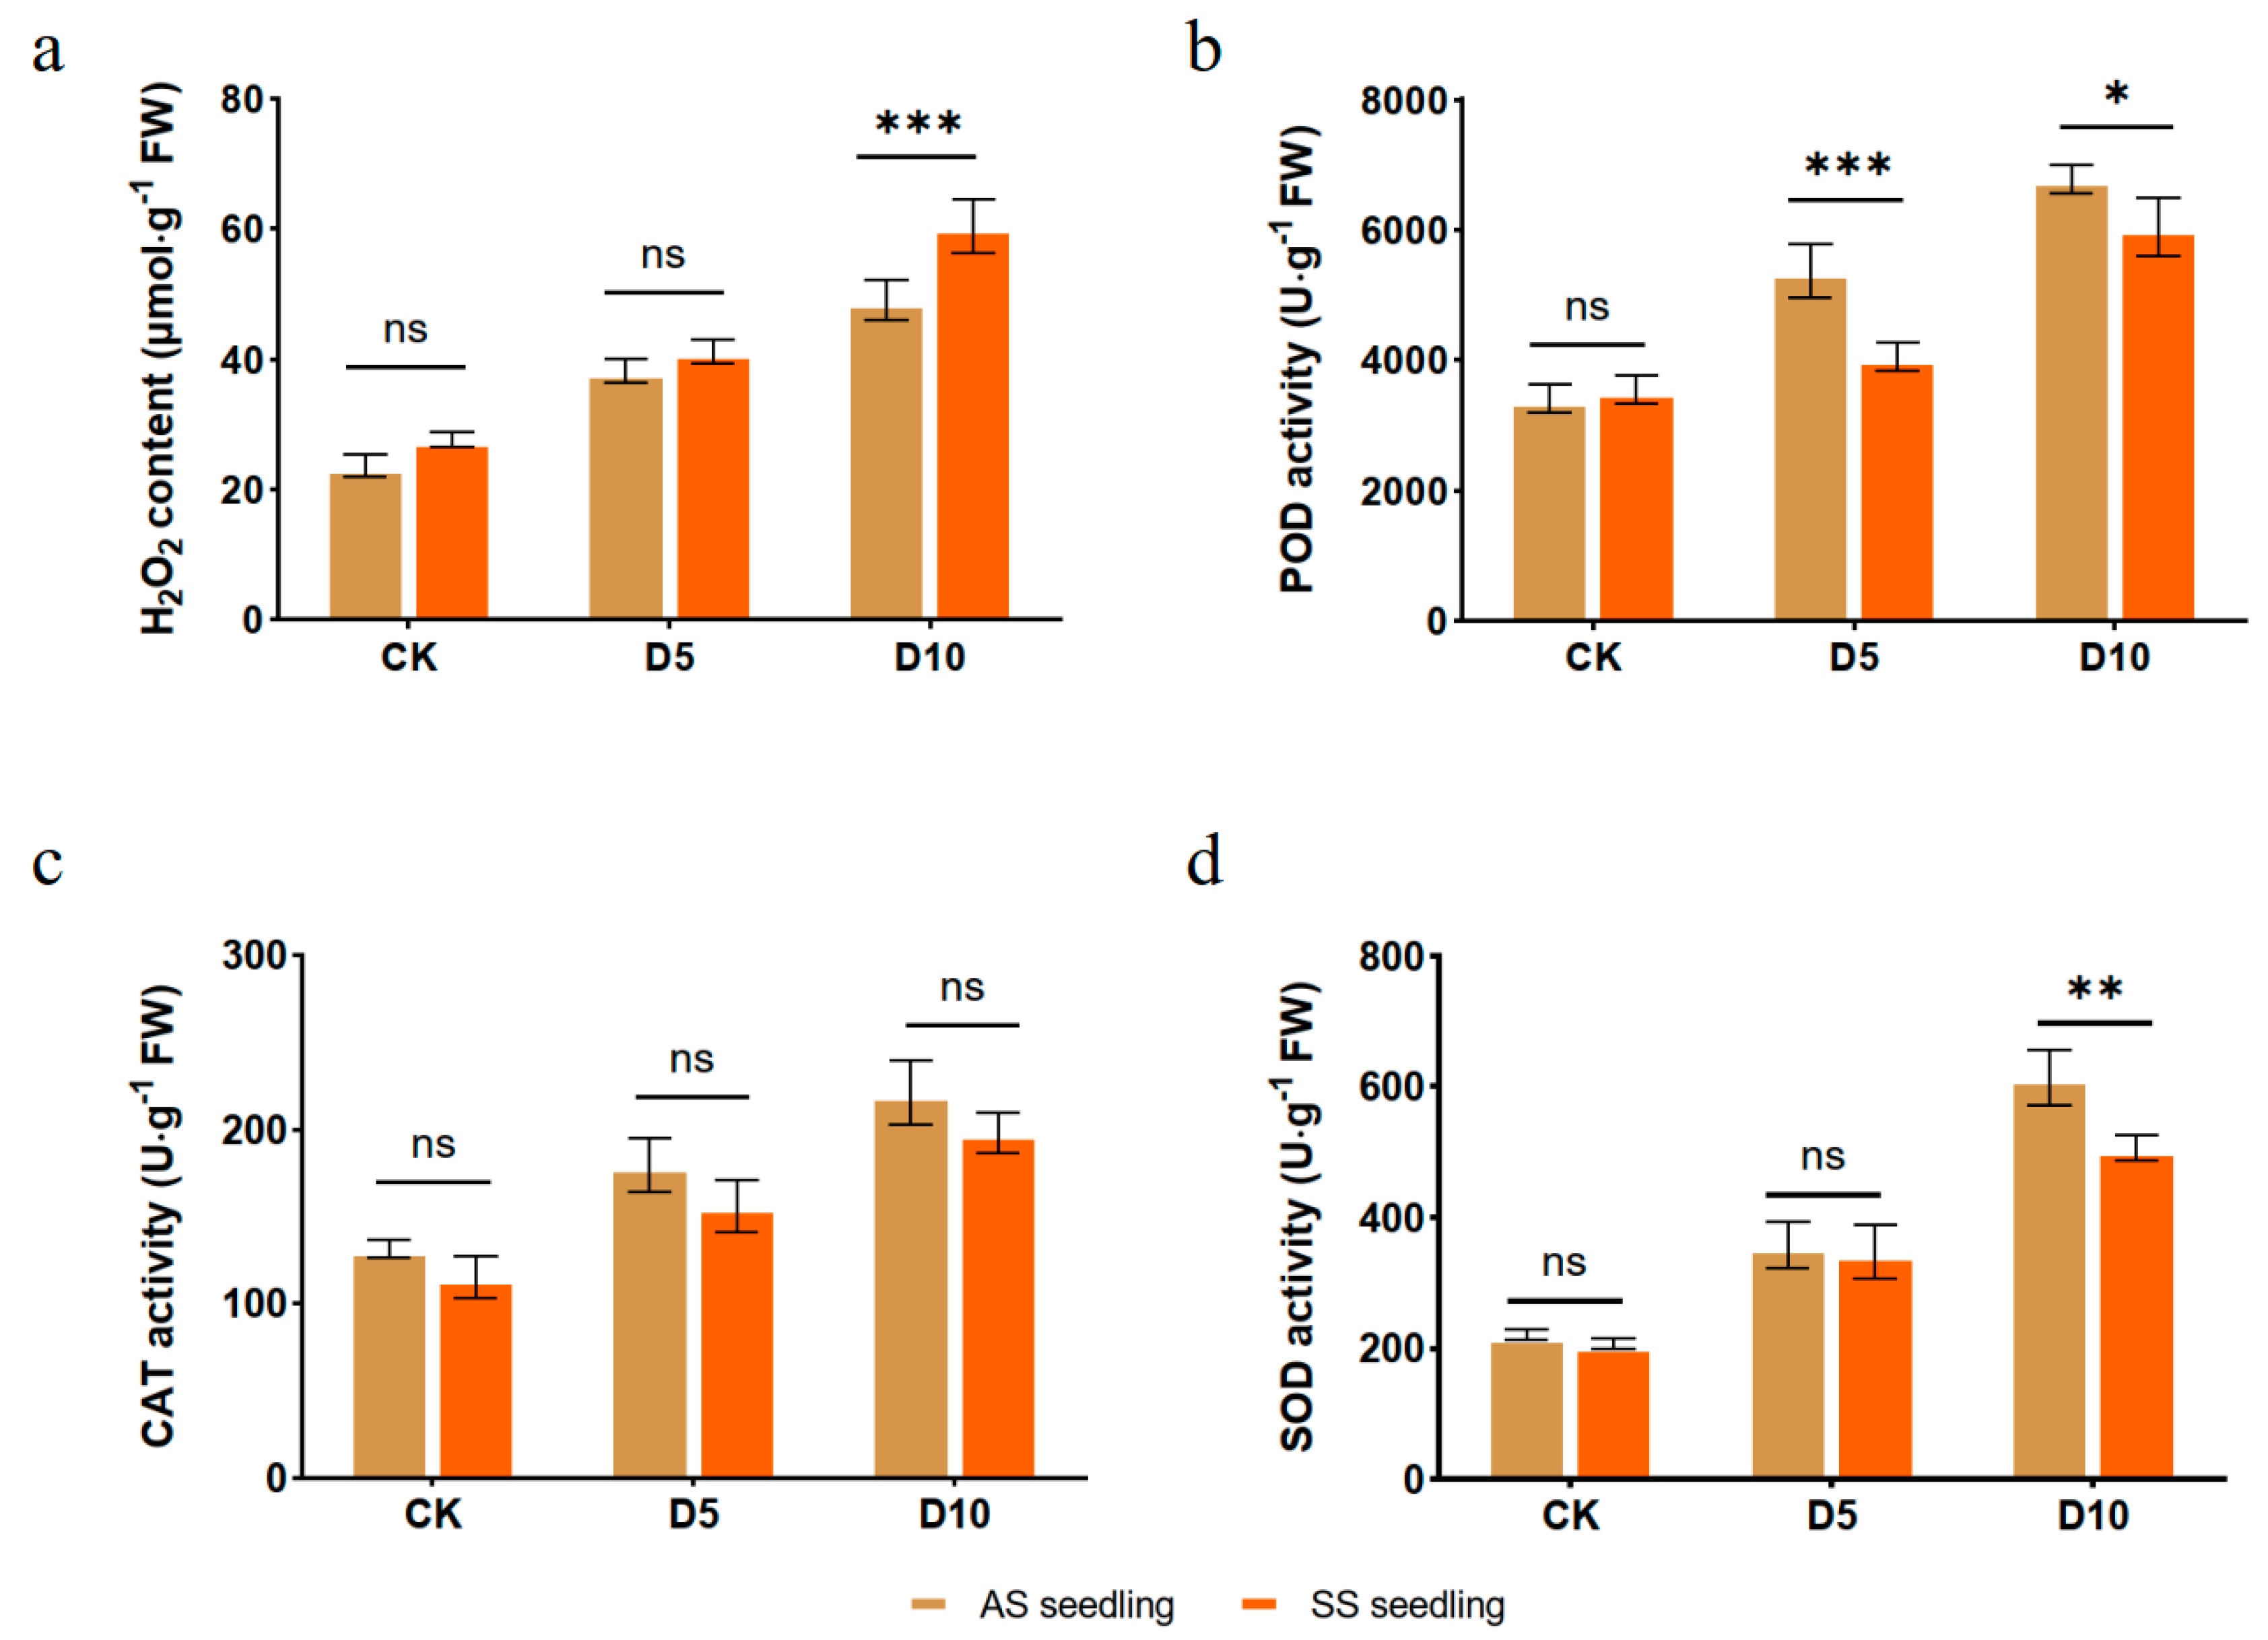
3.2. Effect of Drought Stress on ROSs and Antioxidant Activities in A. edgeworthii

In light of the potential for drought stress to induce the accumulation of reactive oxygen species (ROSs), we conducted an analysis of H2O2 levels and of the activities of three antioxidant enzymes—POD, CAT, and SOD—in both AS and SS seedlings subjected to drought treatments for five and ten days (D5 and D10). As shown in Figure 2a, the H2O2 levels in seedlings from both ASs and SSs significantly increased with prolonged drought exposure. Notably, there was no statistically significant difference in H2O2 levels between AS and SS seedlings under control conditions or after five days of drought treatment. However, after ten days of drought stress, the H2O2 levels in SS seedlings were markedly higher than those in AS seedlings, suggesting that SS seedlings may experience heightened oxidative stress due to H2O2. Conversely, the activities of the antioxidant enzymes (POD, CAT, and SOD) showed significant increases in both AS and SS seedlings following drought stress (Figure 2b–d). Importantly, after both five and ten days of drought treatment, the activity of POD, which serves as the primary H2O2 scavenger in plants under stress conditions, was significantly lower in SS seedlings compared to AS seedlings (Figure 2b). This finding further underscores the heightened sensitivity of SS seedlings to drought stress.

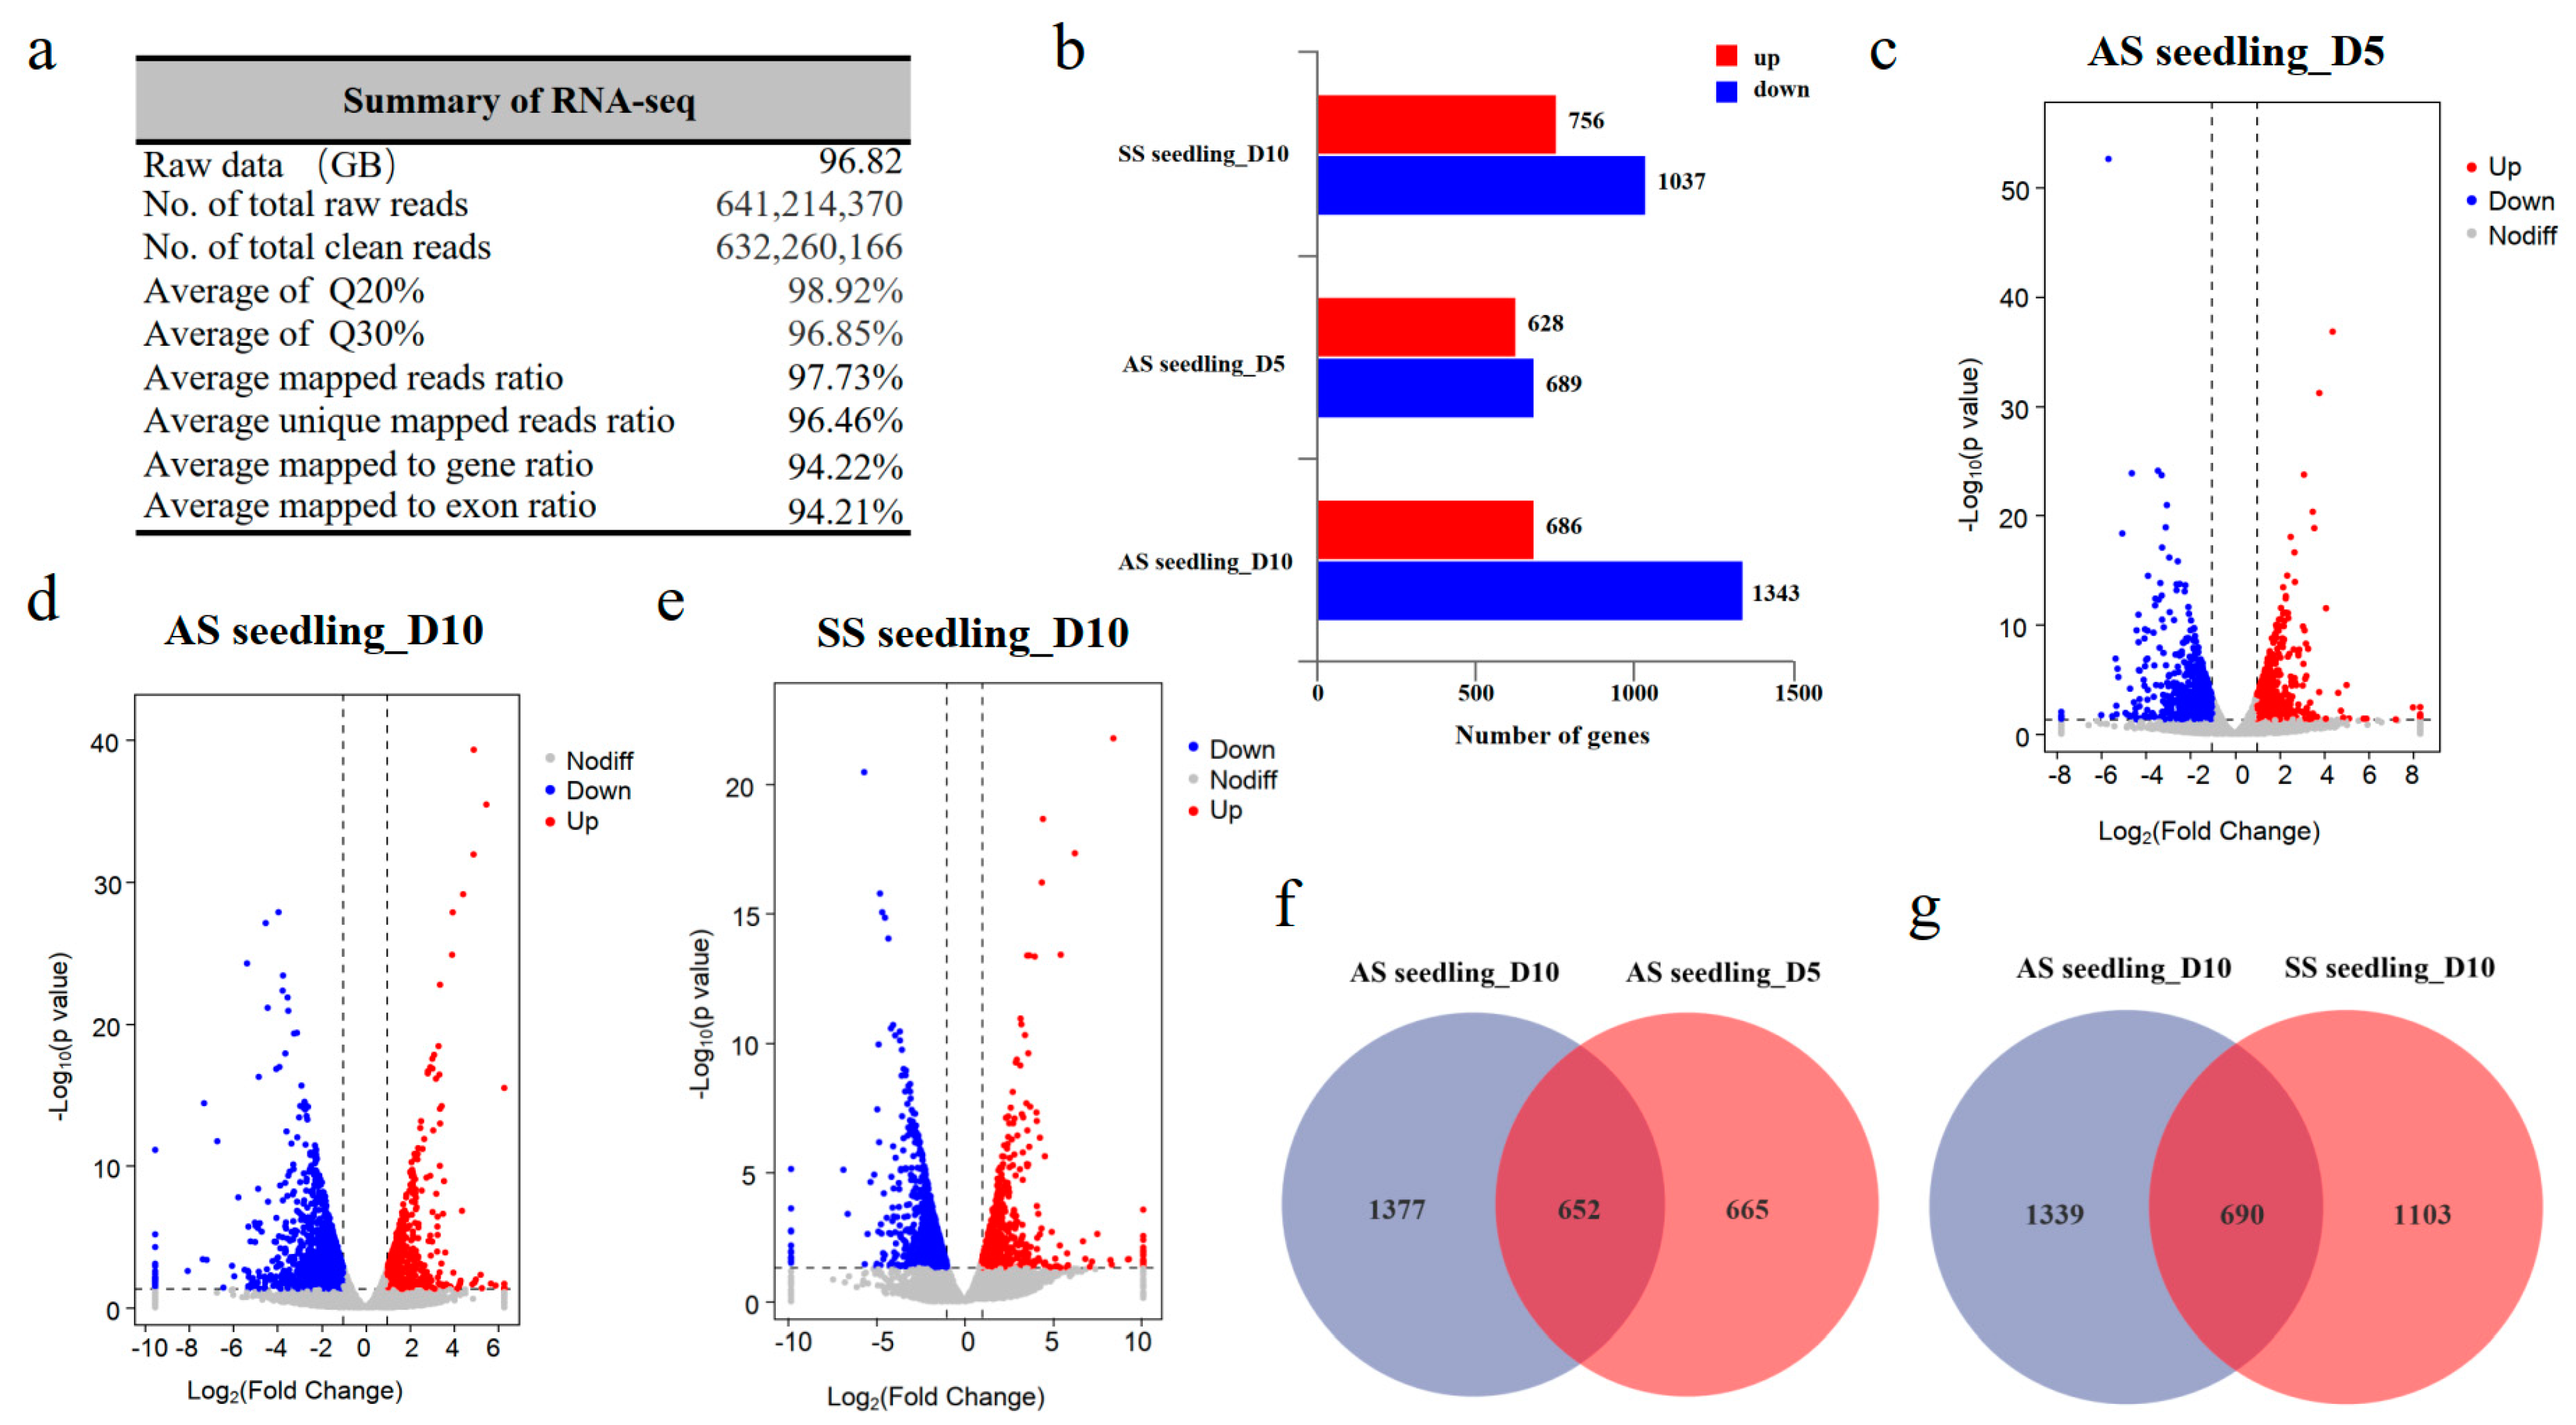
3.3. RNA-Seq Analysis and Screening of DEGs in AS and SS Seedlings Under Drought Stress

To elucidate the molecular changes in A. edgeworthii when exposed to drought stress, we conducted RNA-seq profiling for seedlings from both ASs and SSs following five or ten days of drought treatment. A total of 96.82 GB of raw data were obtained by RNA-seq, producing 641 million 150 bp paired-end valid raw reads. After data cleaning, a total of 632 million clean reads were obtained, with more than 96% of the clean reads having high quality at the Q30 level and over 97% of the clean reads were mapped to the genome of A. edgeworthii. Among them, more than 96% of the mapped reads were uniquely mapped, with more than 94% mapped to the gene region (Figure 3a). Subsequently, following assembly and quantification, a total of 24,195 expressed genes, with FPKM values greater than 0, were identified from all samples.
To investigate the differential responses to distinct periods of drought stress in AS and SS seedlings, DEGs were obtained by comparing gene expression levels between drought-stressed and control samples of the same source of seedlings. In response to drought stress, 2029 genes were differentially expressed in AS seedlings after ten days of drought treatment (AS seedling_D10): 686 upregulated and 1343 downregulated. Only 1317 genes were differentially expressed after five days of drought treatment (AS seedling_D5): 628 upregulated and 689 downregulated. Comparatively, 1793 genes were differentially expressed in SS seedlings after ten days of drought stress (SS seedling_D10): 756 upregulated and 1037 downregulated (Figure 3b–e).
For AS seedlings, 652 common DEGs were identified between the five- and ten-day post-drought treatments. Under drought stress, 665 DEGs were uniquely regulated five days after the drought treatment, whereas 1377 DEGs were uniquely regulated ten days after the drought treatment (Figure 3f). These results imply that plants may have distinct coping strategies under different durations of drought treatments. Similarly, 690 common DEGs were identified between AS and SS seedlings ten days after the drought treatment, while 1339 and 1103 DEGs from AS and SS seedlings, respectively, were uniquely regulated ten days after the drought treatment (Figure 3g). These findings suggest that similar mechanisms may underlie AS and SS seedlings’ response to drought stress.

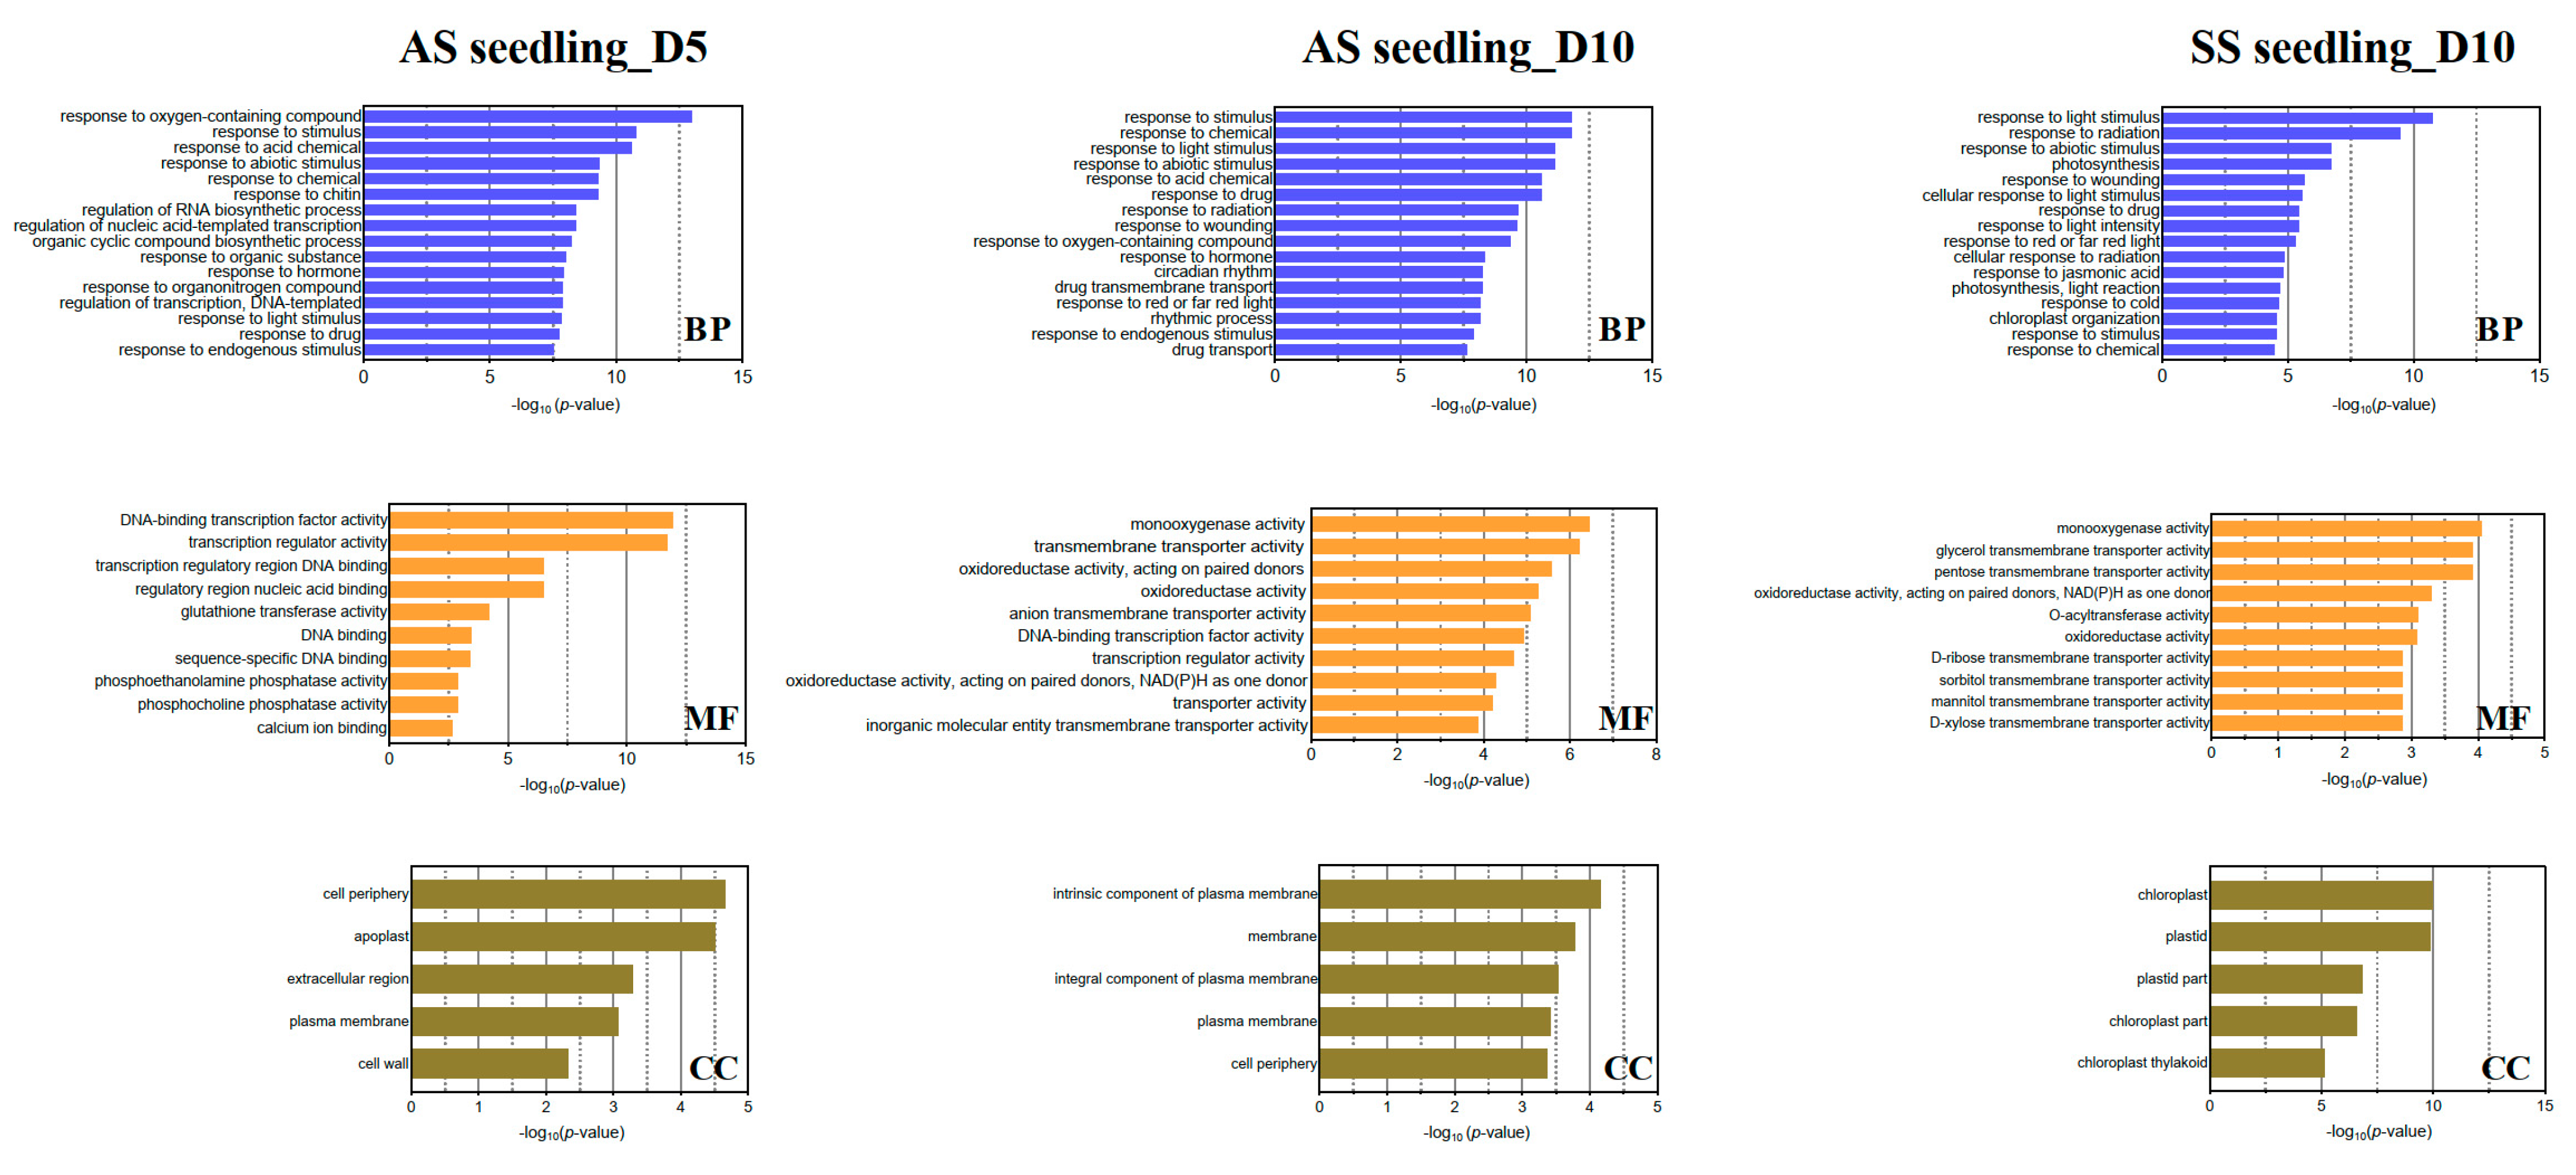
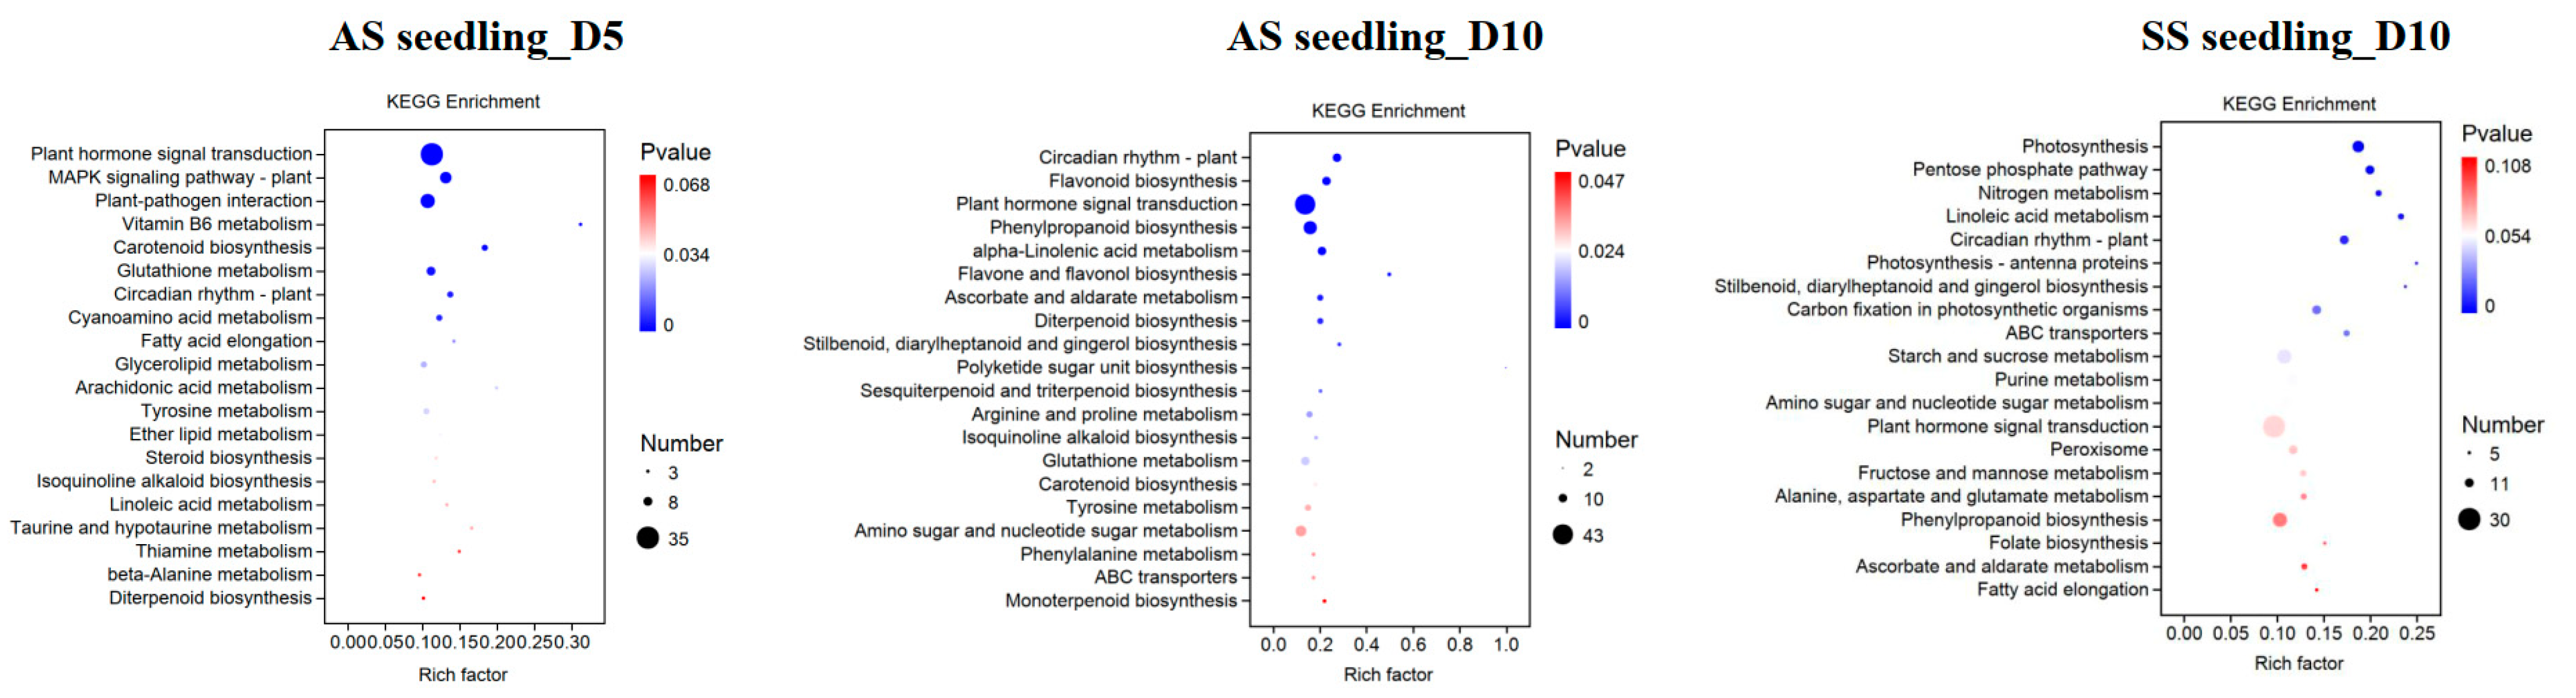
3.4. Functional Enrichment Analyses of Drought-Responsive DEGs

In order to acquire further insights into the biological functions of drought-responsive DEGs, the DEGs from AS seedlings five and ten days after the drought treatment (AS seedling_D5 and AS seedling_D10), as well as from SS seedlings ten days after the drought treatment (SS seedling_D10), were all subjected to functional enrichment analyses based on GO terms and KEGG pathways.
For the GO functional analyses, all identified DEGs were categorized into three functional groups: biological process (BP), cellular component (CC), and molecular function (MF). In the BP category, a plethora of response-related GO terms were significantly enriched, for example, the GO terms “response to stimulus”, “response to abiotic stimulus”, “response to chemical”, “response to light stimulus”, and “response to drug” were overrepresented in the DEGs from all three groups. In the MF category, the transcriptional regulation-associated GO terms were overrepresented, with “DNA-binding transcription factor activity” and “transcription regulator activity” being the top two significantly enriched GO terms in the DEGs from the early stage after drought treatment of AS seedlings (AS seedling_D5). In contrast, transmembrane-transporter- and oxidoreductase-activities-associated GO terms were overrepresented in DEGs from both AS and SS seedlings after ten days of drought treatment. In the CC category, “plasma membrane” and “cell periphery” were two common significantly enriched GO terms in DEGs from AS seedlings, whereas chloroplast-associated GO terms were overrepresented in DEGs from SS seedlings (Figure 4, Tables S2–S4).
For the KEGG functional analyses, the top 20 KEGG pathways enriched from drought-responsive DEGs in the three comparison groups are shown in Figure 5. Additionally, 17, 21, and 10 statistically significant (p < 0.05) KEGG pathways were enriched from the DEGs of the AS seedling_D5, AS seedling_D10, and SS seedling_D10 groups, respectively (Tables S5–S7). Among them, “Plant hormone signal transduction” was the most commonly significant KEGG pathway enriched by most DEGs in the two AS seedling groups, whereas, in the SS seedling group, “Starch and sucrose metabolism” and “Photosynthesis” were the top two significant KEGG pathways enriched by most DEGs (Figure 5). These findings imply that seedlings from ASs and SSs may response to drought stress through quite distinct signaling pathways.

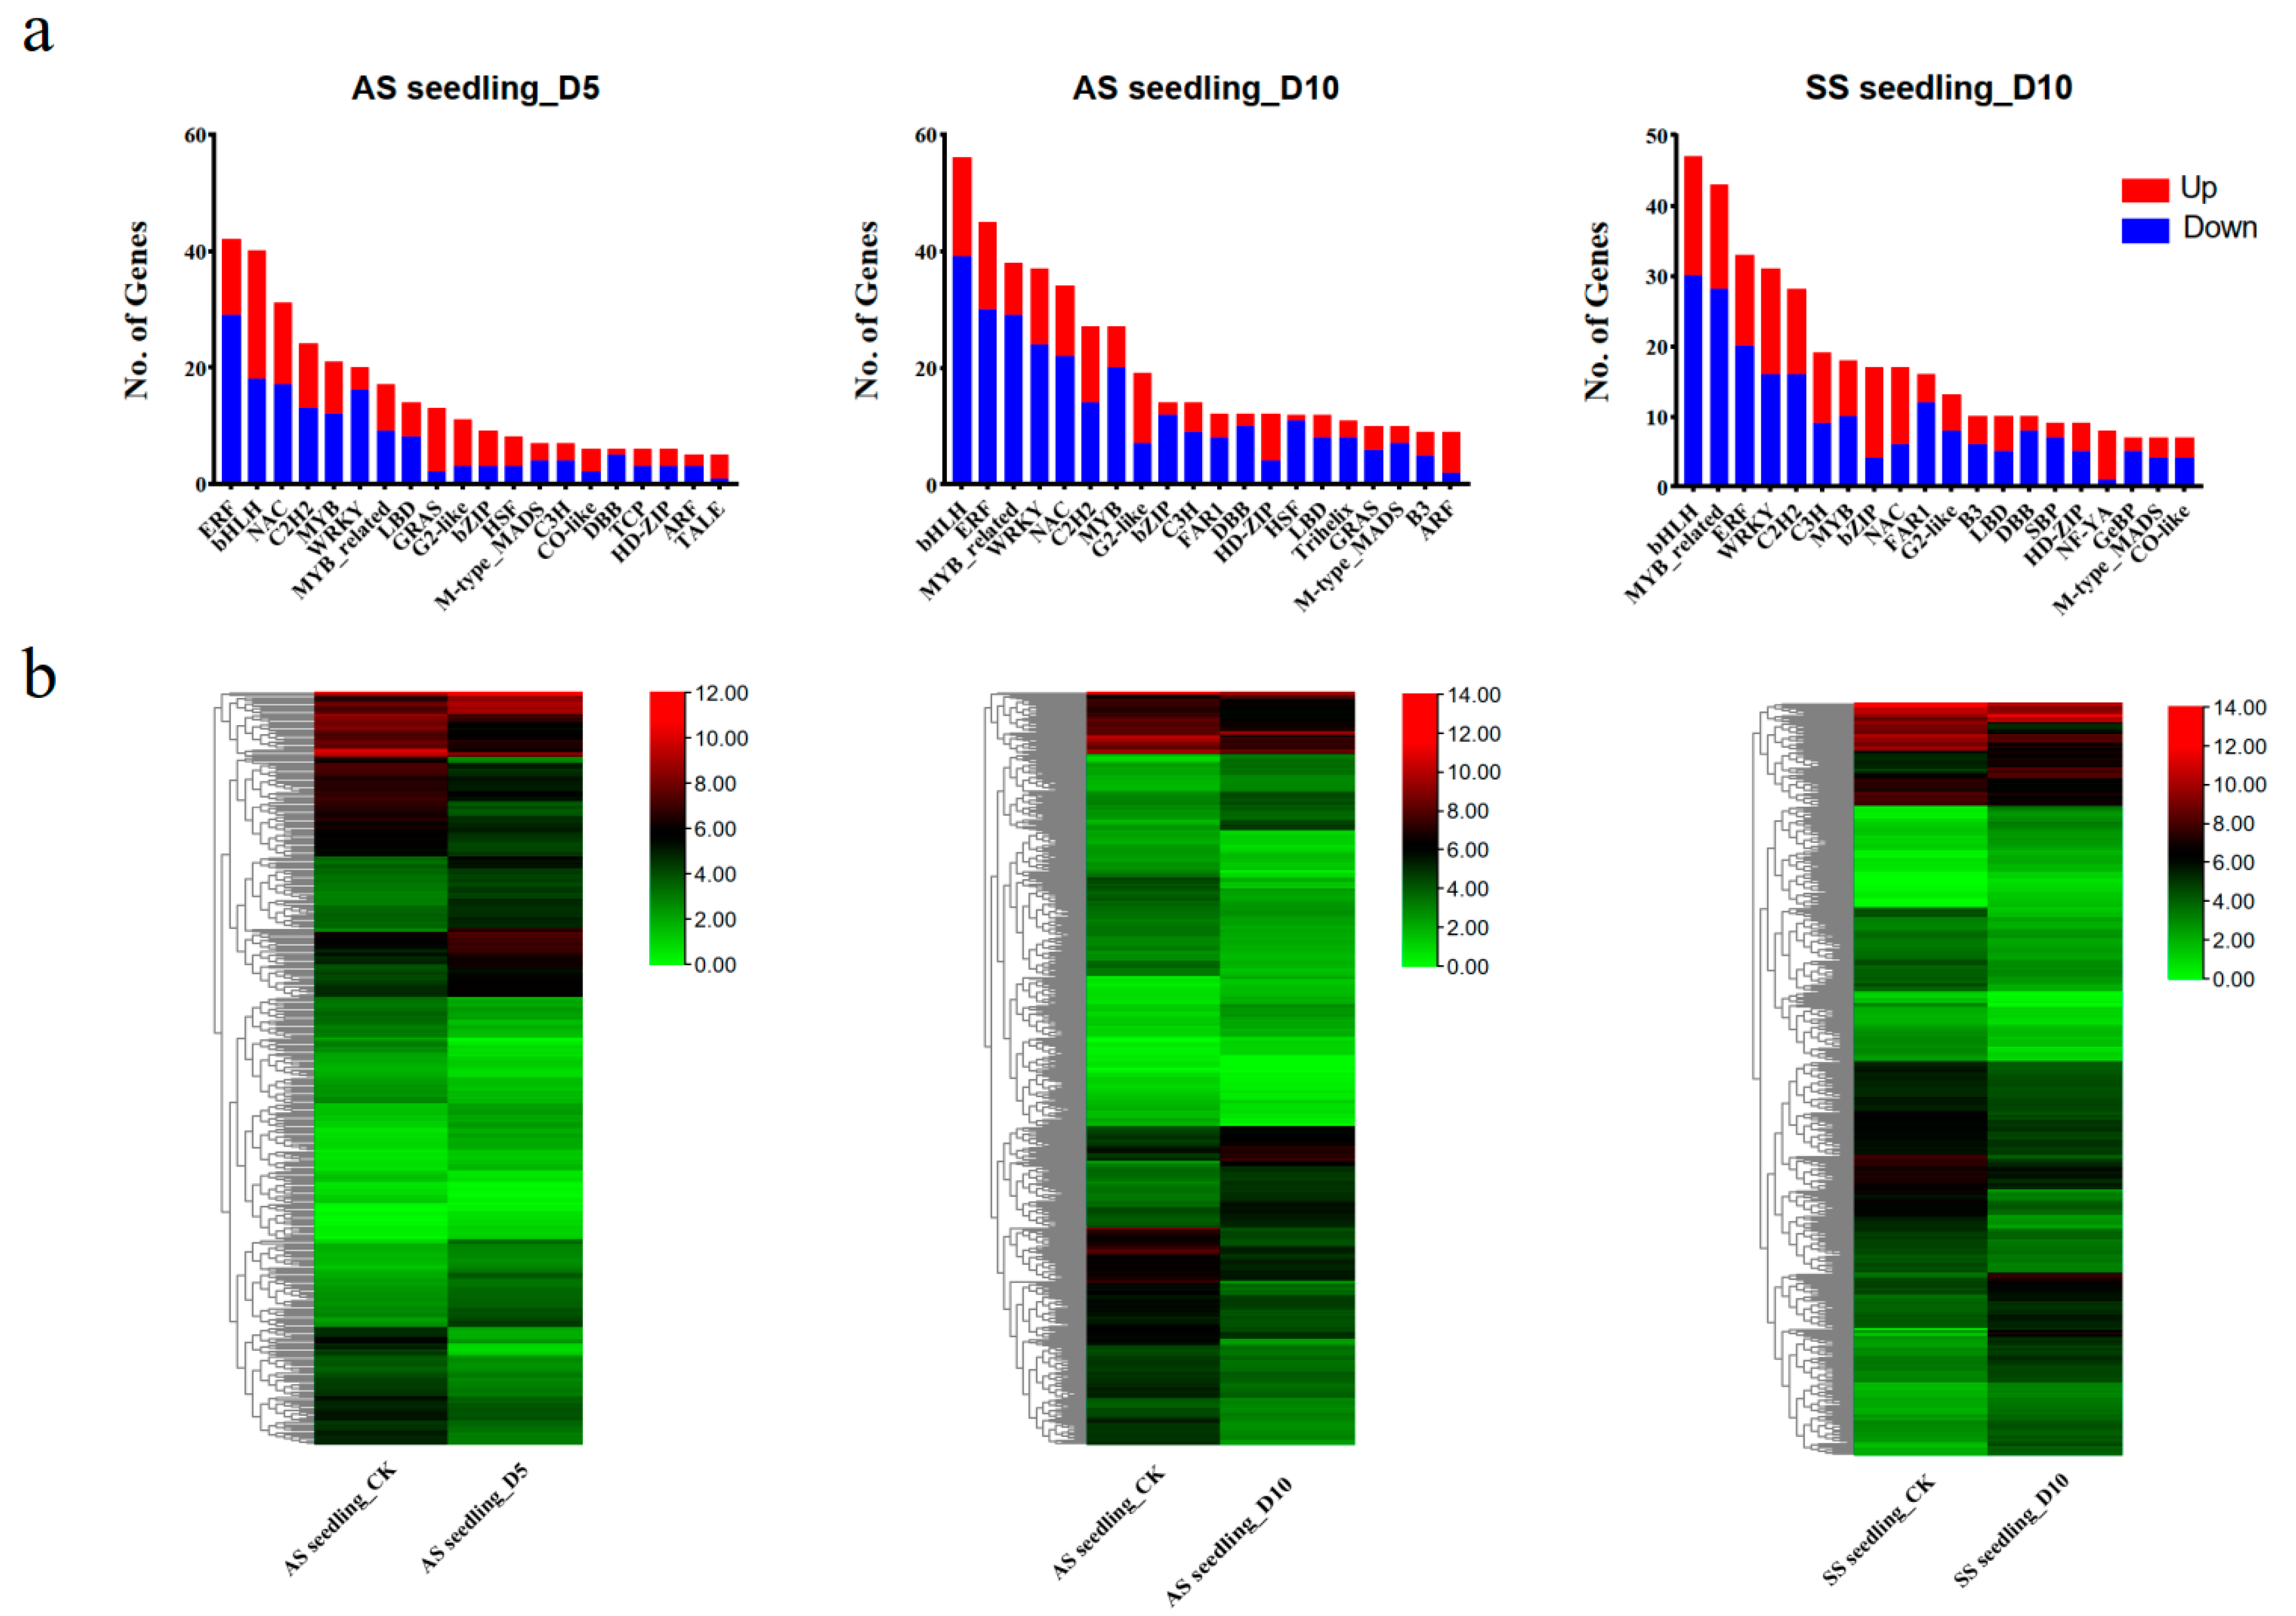
3.5. Distribution of Differentially Expressed Transcription Factors

In this study, the most significantly differentially expressed TF-encoding genes were identified within the AS seedling_D10 group (531 genes), followed by the SS seedling_D10 group (452 genes). Conversely, the AS seedling_D5 group exhibited the fewest differentially expressed TF-encoding genes, amounting to 369. Notably, the highest proportion of upregulated TF-encoding genes was observed in the AS seedling_D5 group, comprising 47% (173 out of 369), followed by the SS seedling_D10 group at 42% (192 out of 452) and the AS seedling_D10 group at 35% (188 out of 531) (Tables S8–S10). Analyzing TF categories, the predominant four categories in the AS seedling_D5 group were identified as ERF, bHLH, NAC, and C2H2. In contrast, the four leading TF categories in both the AS seedling_D10 and SS seedling_D10 groups were consistent, namely bHLH, ERF, MYB-related, and WRKY (Figure 6a). Additionally, heatmaps were generated to illustrate the expression patterns of the differentially expressed TF-encoding genes identified from the AS seedling_D5, AS seedling_D10, and SS seedling_D10 groups. The expression pattens exhibited notable similarities between the AS seedling_D10 and the SS seedling_D10 groups (Figure 6b).

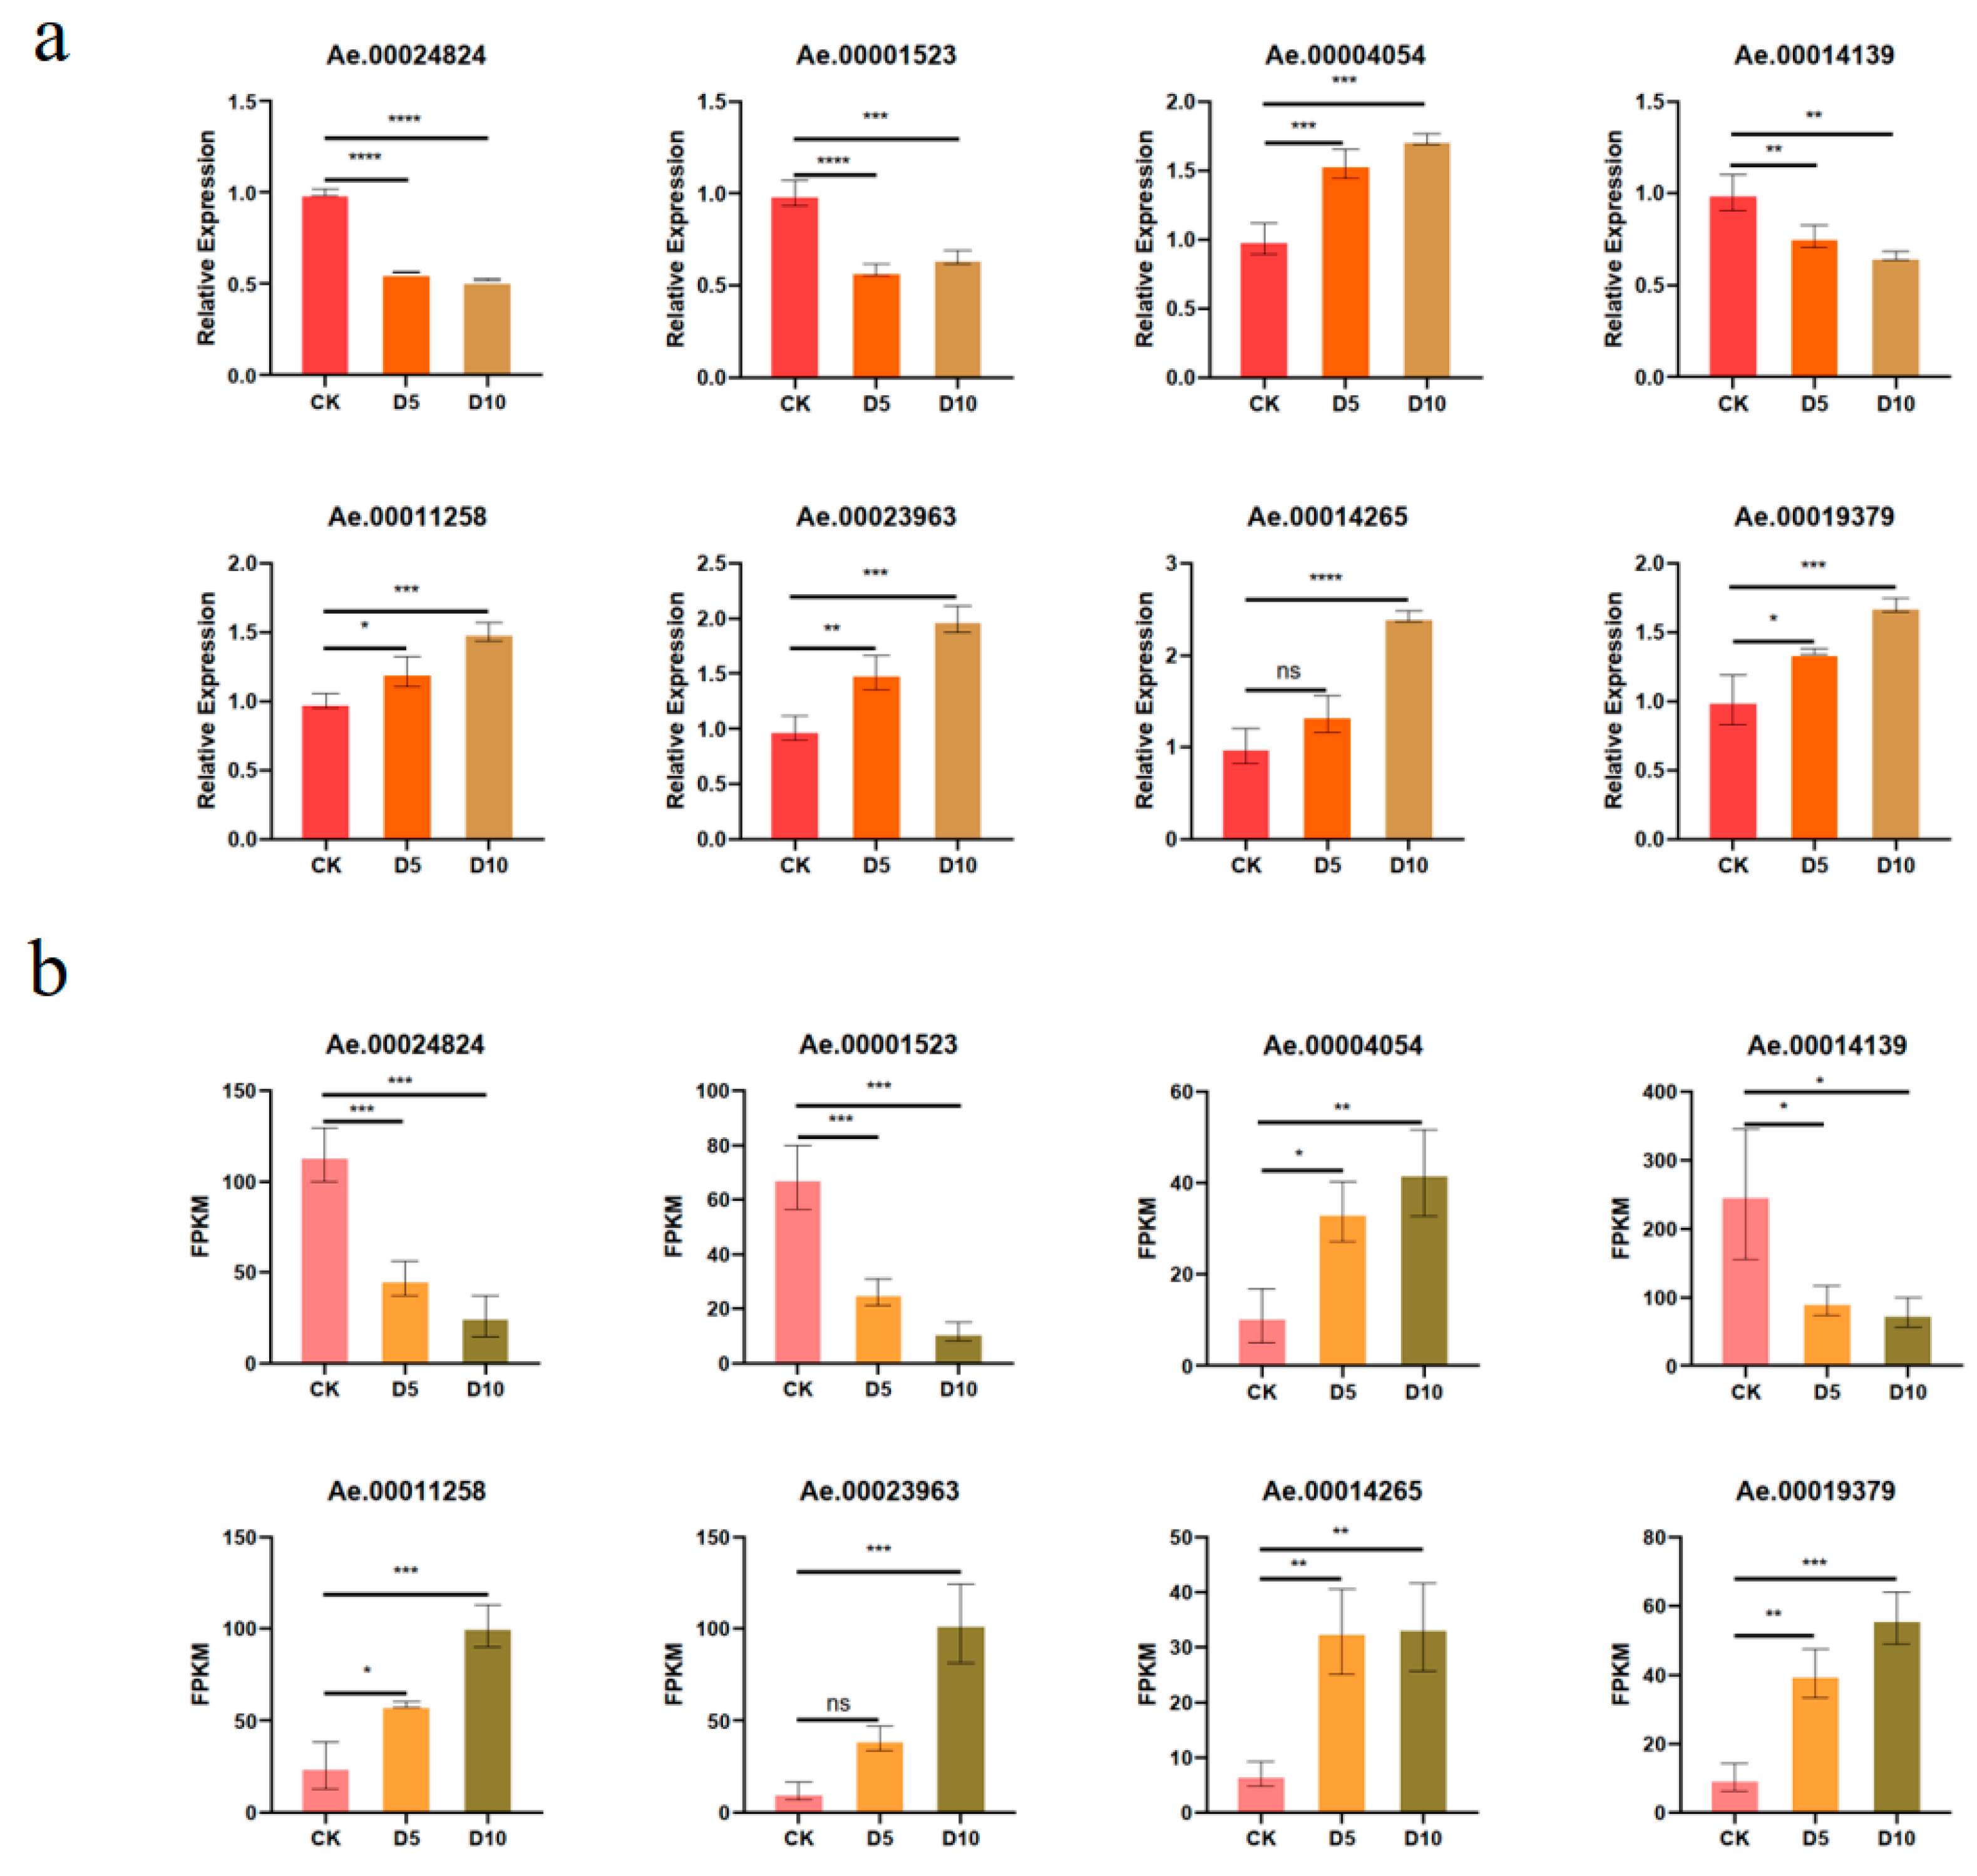
3.6. Validation of DEG Expression Patterns via RT-qPCR Analysis

To validate the reliability of the RNA-seq results, eight DEGs associated with drought stress response were randomly selected for RT-qPCR analysis. These DEGs included four TF genes [Ae.00024824 (AeTIFY6B), Ae.00014139 (AeTIFY3B), Ae.00014265 (AeGATA21), and Ae.00019379 (AeNAC2)], one protein kinase gene (Ae.00011258, AeSAPK10), one annexin gene (Ae.00001523, AeANN4), one glutathione S-transferase gene (Ae.00023963, AeGST11), and one two-component response regulator gene (Ae.00004054, AeARR6) (Table S1). The expression patterns of these DEGs in AS seedlings exhibited distinct trends under drought stress conditions (Figure 7a). Nevertheless, the RT-qPCR results displayed generally similar patterns to those of RNA-seq data (Figure 7b), confirming the reliability of the RNA-seq results.

4. Discussion

RNA-seq represents a high-throughput methodology employed to ascertain nucleotide sequences within biological samples. This technique has been effectively utilized to investigate the transcriptome of various plant species [24]. Certainly, RNA-seq has gained prominence in elucidating the molecular response mechanisms of plants subjected to drought stress [25,26]. A. edgeworthii, a member of the genus Amphibole within the Leguminosae family, exhibits notable drought resistance. Recent RNA-seq studies have provided valuable insights into the reproductive strategies of this genus [3]. However, the transcriptional alterations in A. edgeworthii in response to drought stress remain inadequately characterized. The present study aims to analyze the transcriptome of A. edgeworthii under drought conditions by using RNA-seq to reveal the differences between seedlings from ASs and SSs in response to drought stress. Meanwhile, we utilized RT-qPCR to verify the results of RNA-seq. The strong concordance between the expression patterns of selected genes in both RNA-seq and RT-qPCR reinforces the credibility of the RNA-seq data, while minor discrepancies may be attributed to inherent technical differences in sensitivity between RNA-seq and RT-qPCR. Furthermore, the inclusion of diverse functional categories (transcription factors, protein kinases, stress-related enzymes and regulators) among the validated genes further highlights the multifaceted molecular response to drought captured by the RNA-seq analysis.
Drought stress is a critical factor influencing plant growth and development. Research has demonstrated that drought stress induces modifications in physiological parameters [27]. The imposition of drought stress may cause a range of dehydration phenotypes, including reduced water content in plants, curling and wilting leaves, leaves exhibiting a yellowish hue, etc. Moreover, plants accumulate osmoregulatory compounds, including proline, soluble sugars, and inorganic ions, to maintain osmotic balance. Proline, in particular, serves as a significant physiological marker for assessing plant responses to drought stress [28], while MDA serves as an indicator of membrane injury associated with drought stress [29]. Additionally, drought stress is associated with ROS alterations in antioxidant enzyme activities, with increased activity contributing to enhanced drought resistance in plants [30,31]. For instance, in potatoes, drought stress has been shown to elevate both abscisic acid (ABA) levels and antioxidant enzyme activities [32]. The root-to-shoot ratio is also known to be enhanced in plants under drought stress. In Arabidopsis, the root-to-shoot ratio is increased by enhanced long-distance sucrose transport in an ABA-dependent manner under drought stress [33]. This study investigates the effects of drought stress on the morphological and physiological characteristics of both AS and SS seedling samples from A. edgeworthii. Our findings indicate that A. edgeworthii exhibits increased antioxidant enzyme activity, elevated proline and MDA content, and a higher root-to-shoot ratio under drought stress, suggesting that these physiological changes may constitute mechanisms through which the species responds to such stress. Our findings are consistent with a similar study in soybean which showed that the levels of H2O2, MDA, as well as the activities of SOD, POD, and CAT were significantly increased in the drought-sensitive (DS) genotype L21, while they were not affected significantly in the drought-resistant (DR) genotype L14 under drought stress [34]. We speculate that both AS and SS seedlings of A. edgeworthii may belong to the DS genotype.
In addition to physio-biochemical parameters, drought stress also significantly influences gene expression in plants. A transcriptome study of drought-resistant and drought-sensitive sorghum (Sorghum bicolor L.) genotypes in response to polyethylene glycol (PEG)-induced drought stress identified 180 DEGs expressed only in drought-resistant genotypes, including uncharacterized proteins, TFs, and signaling and stress-related proteins found in drought-tolerant plants from other crops [35]. Another transcriptomic analysis of two contrasting soybean genotypes identified thousands of DEGs, mostly enriched in photosynthesis, carbohydrate metabolism, lipid metabolism, cell wall organization, and signaling pathways [34]. A recent RNA-seq study of two Angelica sinensis cultivars found approximately ten thousand DEGs in both cultivars, mainly enriched in photosynthesis, antioxidant defense, and secondary metabolites. Further weighted gene co-expression network analysis (WGCNA) identified key TFs such as WRKY6, PAT1, and SCL13 [36]. In this study, we elucidate the gene expression changes in both AS and SS seedlings of A. edgeworthii under drought conditions through transcriptomic analysis. The RNA-seq data indicated that AS seedlings subjected to ten days of drought treatment (AS seedling_D10) exhibited a significantly higher total number of DEGs compared to AS seedlings subjected to five days of drought treatment (AS seedling_D5). Notably, the AS seedling_D10 samples displayed nearly double the number of downregulated DEGs (1343) compared to the AS seedling_D5 samples (689) (Figure 3b). The stress–dose dependency of downregulated DEGs in AS seedling samples is consistent with prior research, suggesting that severe drought stress typically leads to an increased number of downregulated genes relative to the early stages of stress [22]. Furthermore, after ten days of drought stress, SS seedlings demonstrated a greater number of upregulated DEGs but fewer downregulated DEGs than AS seedlings, indicating distinct mechanisms employed by the two types of seedlings to mitigate drought stress. The findings from the functional enrichment analysis of DEGs further substantiate this conclusion. The enrichment of plasma-membrane- and cell-periphery-associated GO terms in AS seedlings at both time points suggests a coordinated effort to modulate cellular transport, signaling, and osmotic adjustment—key processes for maintaining membrane integrity and stress perception under water deficit. This adaptive response may enhance AS seedlings’ ability to regulate water loss and sustain cellular homeostasis. The significant enrichment of the “Plant hormone signal transduction” pathway in AS seedlings further highlights their capacity to activate hormone-mediated stress adaptation mechanisms, which are critical for drought resilience. In contrast, the enrichment of chloroplast-related terms in SS seedlings implies that drought conditions disrupt the photosynthetic machinery, potentially leading to oxidative stress or signaling indicative of cellular damage. More seriously, the absence of the “Plant hormone signal transduction” pathway in SS seedlings underscores a potential deficiency in deploying systemic hormonal signals to mitigate stress, rendering them more vulnerable to drought stress. These findings suggest that AS seedlings employ an integrated strategy combining membrane-associated adjustments and hormone signaling to withstand drought, while SS seedlings exhibit fewer effective responses. The conclusion is consistent with our previous observations based on phenotypic and physio-biochemical alterations under drought stress that SS seedlings are more sensitive to drought stress. The divergence underscores the importance of regulation of drought-stress-related genes and pathways in determining drought tolerance outcomes. Further investigation into specific genes within these enriched pathways will elucidate precise molecular targets for improving drought resistance in plants.
The initiation of transcription in eukaryotes is a complex process that often necessitates the involvement of multiple protein factors. TFs are a class of proteins that can bind specifically to sequences upstream of the 5′ end of a gene, forming a transcription initiation complex with RNA polymerase II, thereby facilitating transcription initiation. Numerous TFs associated with plant responses to drought have been identified, including the bZIP, NAC, WRKY, MYB, and AP2/ERF families [37,38,39,40,41]. In this study, hundreds of drought-induced TFs were identified in the DEGs of AS and SS seedlings under drought conditions, indicating the significant involvement of TFs in mediating the drought response of A. edgeworthii. The higher number of differentially expressed TFs observed in both the AS and SS seedling_D10 groups compared to the AS seedling_D5 group may reflect an intensified transcriptional reprogramming in response to prolonged drought stress, potentially facilitating sustained adaptive responses. Notably, the AS seedling_D5 group, despite having the lowest number of differentially expressed TFs, exhibited the highest proportion of upregulated TFs (47%), implying an early activation of specific regulatory pathways aimed at initiating stress adaptation. On the other hand, the prevalence of ERF, bHLH, NAC, and C2H2 in the AS seedling_D5 group aligns with their recognized functions in abiotic stress signaling and early stress responses. In contrast, the shared dominance of bHLH, ERF, MYB-related, and WRKY in both the AS and SS seedling_D10 groups indicates a convergence of regulatory mechanisms responding to prolonged stress. Collectively, these findings underscore the specificity of TF-mediated regulation and provide valuable insights into potential master regulators involved in drought stress adaptation.

5. Conclusions

This study provides comprehensive insights into the response mechanisms of seedlings from ASs and SSs of the Chinese hog-peanut (A. edgeworthii) to drought stress. Our results demonstrate that both AS and SS seedlings exhibited significant morphological, physiological, and biochemical changes under drought conditions, including increased contents of PRO and MDA, higher root-to-shoot ratios, and accelerated water loss rates, while chlorophyll content and relative water content decreased. However, SS seedlings were found to be more susceptible to drought stress, as they accumulated more H2O2 and exhibited lower POD and SOD activity levels compared to AS seedlings. The RNA-seq analysis revealed thousands of drought-induced DEGs in both AS and SS seedlings which were commonly enriched in response-related GO terms. Additionally, hundreds of TF genes were identified among the DEGs, suggesting their potential and crucial roles in the drought response mechanisms of AS and SS seedlings. These findings highlight the distinct adaptive strategies of AS and SS seedlings to drought stress and provide valuable insights into the drought tolerance mechanisms in amphicarpic legumes. Future research should focus on the functional validation of these identified DEGs and TFs, as well as on further exploration of the regulatory networks underlying drought adaptability in A. edgeworthii.

Supplementary Materials

The following supporting information can be downloaded at: https://www.mdpi.com/article/10.3390/agronomy15030735/s1, Figure S1: Aerial seeds (ASs) and subterranean seeds (SSs). Table S1: Primers used in this study for RT-qPCR; Table S2: The results of GO enrichment analyses of DEGs from AS seedlings after five days of drought stress; Table S3: The results of GO enrichment analyses of DEGs from AS seedlings after ten days of drought stress; Table S4: The results of GO enrichment analyses of DEGs from SS seedlings after ten days of drought stress; Table S5: The results of KEGG pathway analyses of DEGs from AS seedlings after five days of drought stress; Table S6: The results of KEGG pathway analyses of DEGs from AS seedlings after ten days of drought stress; Table S7: The results of KEGG pathway analyses of DEGs from SS seedlings after ten days of drought stress; Table S8: The differentially expressed transcription factors from AS seedlings after five days of drought stress; Table S9: The differentially expressed transcription factors from AS seedlings after ten days of drought stress; Table S10: The differentially expressed transcription factors from SS seedlings after ten days of drought stress.

Author Contributions

Conceptualization, J.X. and Q.L.; writing—original draft, J.K. and Q.L.; data curation, Y.S., J.K. and T.L.; methodology, Y.S. and T.L.; investigation, S.H., J.T. and J.K.; formal analysis, J.T., S.H. and X.D.; software, M.L. and Y.S.; validation, M.L.; resources, S.Z.; writing—review and editing, X.D. and S.Z.; funding acquisition, J.X. and Q.L.; supervision, J.X. All authors have read and agreed to the published version of the manuscript.

Funding

This work was financially supported by the National Key R&D Program of China (2021YFD1201104-02), the National Natural Science Foundation of China (32272017), and the Natural Science Foundation of Heilongjiang Province (LH2022C019).

Data Availability Statement

The corresponding author will provide the data supporting the conclusions of the present study upon reasonable request.

Acknowledgments

We are grateful to Shanghai Personalbio Technology Co., Ltd. for assisting in the sequencing and bioinformatics analysis. We are grateful to Wordvice.AI (https://wordvice.ai/cn, accessed on 8 February 2025) and Deepseek (https://www.deepseek.com/, accessed on 10 March 2025) for assisting in polishing the language of this manuscript.

Conflicts of Interest

The authors declare no conflicts of interest. The funders had no role in the design of the study, in the collection, analyses, or interpretation of the data, in the writing of the manuscript, or in the decision to publish the results.

Abbreviations

The following abbreviations are used in this manuscript:
ASAerial seeds
SSSubterranean seeds
RNA-seqRNA sequencing
DEGDifferentially expressed gene
TFTranscription factor
ROSReactive oxygen species

References

  1. Zhang, Y.; Yang, J.; Rao, G.-Y. Genetic Diversity of an Amphicarpic Species, Amphicarpaea edgeworthii Benth. (Leguminosae) Based on RAPD Markers. Biochem. Syst. Ecol. 2005, 33, 1246–1257. [Google Scholar] [CrossRef]
  2. Zhang, K.; Baskin, J.M.; Baskin, C.C.; Yang, X.; Huang, Z. Lack of Divergence in Seed Ecology of Two Amphicarpaea (Fabaceae) Species Disjunct between Eastern Asia and Eastern North America. Am. J. Bot. 2015, 102, 860–869. [Google Scholar] [CrossRef] [PubMed]
  3. Liu, Y.; Zhang, X.; Han, K.; Li, R.; Xu, G.; Han, Y.; Cui, F.; Fan, S.; Seim, I.; Fan, G.; et al. Insights into Amphicarpy from the Compact Genome of the Legume Amphicarpaea edgeworthii. Plant Biotechnol. J. 2021, 19, 952–965. [Google Scholar] [CrossRef]
  4. Zhang, K.; Baskin, J.M.; Baskin, C.C.; Yang, X.; Huang, Z. Effect of Seed Morph and Light Level on Growth and Reproduction of the Amphicarpic Plant Amphicarpaea edgeworthii (Fabaceae). Sci. Rep. 2017, 7, 39886. [Google Scholar] [CrossRef]
  5. González, E.M. Drought Stress Tolerance in Plants. Int. J. Mol. Sci. 2023, 24, 6562. [Google Scholar] [CrossRef]
  6. Valliyodan, B.; Nguyen, H.T. Understanding Regulatory Networks and Engineering for Enhanced Drought Tolerance in Plants. Curr. Opin. Plant Biol. 2006, 9, 189–195. [Google Scholar] [CrossRef] [PubMed]
  7. Kakumanu, A.; Ambavaram, M.M.R.; Klumas, C.; Krishnan, A.; Batlang, U.; Myers, E.; Grene, R.; Pereira, A. Effects of Drought on Gene Expression in Maize Reproductive and Leaf Meristem Tissue Revealed by RNA-Seq. Plant Physiol. 2012, 160, 846–867. [Google Scholar] [CrossRef]
  8. Zhang, A.; Liu, M.; Gu, W.; Chen, Z.; Gu, Y.; Pei, L.; Tian, R. Effect of Drought on Photosynthesis, Total Antioxidant Capacity, Bioactive Component Accumulation, and the Transcriptome of Atractylodes lancea. BMC Plant Biol. 2021, 21, 293. [Google Scholar] [CrossRef]
  9. Yang, H.; Wu, F.; Cheng, J. Reduced Chilling Injury in Cucumber by Nitric Oxide and the Antioxidant Response. Food Chem. 2011, 127, 1237–1242. [Google Scholar] [CrossRef]
  10. Nadeem, M.; Li, J.; Yahya, M.; Sher, A.; Ma, C.; Wang, X.; Qiu, L. Research Progress and Perspective on Drought Stress in Legumes: A Review. Int. J. Mol. Sci. 2019, 20, 2541. [Google Scholar] [CrossRef]
  11. Bhatnagar-Mathur, P.; Vadez, V.; Jyostna Devi, M.; Lavanya, M.; Vani, G.; Sharma, K.K. Genetic Engineering of Chickpea (Cicer arietinum L.) with the P5CSF129A Gene for Osmoregulation with Implications on Drought Tolerance. Mol. Breed. 2009, 23, 591–606. [Google Scholar] [CrossRef]
  12. Chen, Y.; Chi, Y.; Meng, Q.; Wang, X.; Yu, D. GmSK1, an SKP1 Homologue in Soybean, Is Involved in the Tolerance to Salt and Drought. Plant Physiol. Biochem. 2018, 127, 25–31. [Google Scholar] [CrossRef]
  13. Privitera, G.F.; Treccarichi, S.; Nicotra, R.; Branca, F.; Pulvirenti, A.; Lo Piero, A.R.; Sicilia, A. Comparative Transcriptome Analysis of B. oleracea L. Var. Italica and B. macrocarpa Guss. Genotypes under Drought Stress: De Novo vs Reference Genome Assembly. Plant Stress 2024, 14, 100657. [Google Scholar] [CrossRef]
  14. Behera, S.; Voshall, A.; Moriyama, E.N. Plant Transcriptome Assembly: Review and Benchmarking. In Bioinformatics; Nakaya, H.I., Ed.; Exon Publications: Brisbane, Australia, 2021; pp. 109–130. ISBN 978-0-6450017-1-6. [Google Scholar]
  15. Ding, N.; Zhao, Y.; Wang, W.; Liu, X.; Shi, W.; Zhang, D.; Chen, J.; Ma, S.; Sun, Q.; Wang, T.; et al. Transcriptome Analysis in Contrasting Maize Inbred Lines and Functional Analysis of Five Maize NAC Genes under Drought Stress Treatment. Front. Plant Sci. 2023, 13, 1097719. [Google Scholar] [CrossRef] [PubMed]
  16. Liang, Q.; Dun, B.; Li, L.; Ma, X.; Zhang, H.; Su, Y.; Wu, D. Metabolomic and Transcriptomic Responses of Adiantum (Adiantum nelumboides) Leaves under Drought, Half-Waterlogging, and Rewater Conditions. Front. Genet. 2023, 14, 1113470. [Google Scholar] [CrossRef]
  17. Singh, V.; Gupta, K.; Singh, S.; Jain, M.; Garg, R. Unravelling the Molecular Mechanism Underlying Drought Stress Response in Chickpea via Integrated Multi-Omics Analysis. Front. Plant Sci. 2023, 14, 1156606. [Google Scholar] [CrossRef]
  18. Azzouz-Olden, F.; Hunt, A.G.; Dinkins, R. Transcriptome Analysis of Drought-Tolerant Sorghum Genotype SC56 in Response to Water Stress Reveals an Oxidative Stress Defense Strategy. Mol. Biol. Rep. 2020, 47, 3291–3303. [Google Scholar] [CrossRef]
  19. Li, M.; Li, H.; Sun, A.; Wang, L.; Ren, C.; Liu, J.; Gao, X. Transcriptome Analysis Reveals Key Drought-Stress-Responsive Genes in Soybean. Front. Genet. 2022, 13, 1060529. [Google Scholar] [CrossRef]
  20. Aleem, M.; Raza, M.M.; Haider, M.S.; Atif, R.M.; Ali, Z.; Bhat, J.A.; Zhao, T. Comprehensive RNA-seq Analysis Revealed Molecular Pathways and Genes Associated with Drought Tolerance in Wild Soybean (Glycine soja Sieb. and Zucc.). Physiol. Plant. 2021, 172, 707–732. [Google Scholar] [CrossRef]
  21. Abdeen, A.; Schnell, J.; Miki, B. Transcriptome Analysis Reveals Absence of Unintended Effects in Drought-Tolerant Transgenic Plants Overexpressing the Transcription Factor ABF3. BMC Genom. 2010, 11, 69. [Google Scholar] [CrossRef]
  22. Jia, X.; Sun, C.; Zuo, Y.; Li, G.; Li, G.; Ren, L.; Chen, G. Integrating Transcriptomics and Metabolomics to Characterise the Response of Astragalus membranaceus Bge. var. Mongolicus (Bge.) to Progressive Drought Stress. BMC Genom. 2016, 17, 188. [Google Scholar] [CrossRef]
  23. Livak, K.J.; Schmittgen, T.D. Analysis of Relative Gene Expression Data Using Real-Time Quantitative PCR and the 2−ΔΔCT Method. Methods 2001, 25, 402–408. [Google Scholar] [CrossRef] [PubMed]
  24. Alekseyev, Y.O.; Fazeli, R.; Yang, S.; Basran, R.; Maher, T.; Miller, N.S.; Remick, D. A Next-Generation Sequencing Primer—How Does It Work and What Can It Do? Acad. Pathol. 2018, 5, 2374289518766521. [Google Scholar] [CrossRef]
  25. Liu, E.; Xu, L.; Luo, Z.; Li, Z.; Zhou, G.; Gao, H.; Fang, F.; Tang, J.; Zhao, Y.; Zhou, Z.; et al. Transcriptomic Analysis Reveals Mechanisms for the Different Drought Tolerance of Sweet Potatoes. Front. Plant Sci. 2023, 14, 1136709. [Google Scholar] [CrossRef]
  26. Tamang, B.G.; Li, S.; Rajasundaram, D.; Lamichhane, S.; Fukao, T. Overlapping and Stress-specific Transcriptomic and Hormonal Responses to Flooding and Drought in Soybean. Plant J. 2021, 107, 100–117. [Google Scholar] [CrossRef]
  27. Chen, D.; Wang, S.; Cao, B.; Cao, D.; Leng, G.; Li, H.; Yin, L.; Shan, L.; Deng, X. Genotypic Variation in Growth and Physiological Response to Drought Stress and Re-Watering Reveals the Critical Role of Recovery in Drought Adaptation in Maize Seedlings. Front. Plant Sci. 2016, 6, 1241. [Google Scholar] [CrossRef] [PubMed]
  28. Luo, Q.; Ma, Y.; Xie, H.; Chang, F.; Guan, C.; Yang, B.; Ma, Y. Proline Metabolism in Response to Climate Extremes in Hairgrass. Plants 2024, 13, 1408. [Google Scholar] [CrossRef]
  29. Čakar, U.; Čolović, M.; Milenković, D.; Pagnacco, M.; Maksimović, J.; Krstić, D.; Đorđević, B. Strawberry and Drupe Fruit Wines Antioxidant Activity and Protective Effect Against Induced Oxidative Stress in Rat Synaptosomes. Antioxidants 2025, 14, 155. [Google Scholar] [CrossRef]
  30. Ahmad, M.; Waraich, E.A.; Zulfiqar, U.; Yong, J.W.H.; Ishfaq, M.; Din, K.U.; Ullah, A.; Abbas, A.; Awan, M.I.; Moussa, I.M.; et al. Thiourea Improves Yield and Quality Traits of Brassica napus L. by Upregulating the Antioxidant Defense System under High Temperature Stress. Sci. Rep. 2024, 14, 12195. [Google Scholar] [CrossRef]
  31. Das, D.; Chowdhury, N.; Sharma, M.; Suma, R.; Saikia, B.; Velmurugan, N.; Chikkaputtaiah, C. Screening for Brown-Spot Disease and Drought Stress Response and Identification of Dual-Stress Responsive Genes in Rice Cultivars of Northeast India. Physiol. Mol. Biol. Plants 2024, 30, 647–663. [Google Scholar] [CrossRef]
  32. Zhang, S.; Xu, X.; Sun, Y.; Zhang, J.; Li, C. Influence of Drought Hardening on the Resistance Physiology of Potato Seedlings under Drought Stress. J. Integr. Agric. 2018, 17, 336–347. [Google Scholar] [CrossRef]
  33. Chen, Q.; Hu, T.; Li, X.; Song, C.-P.; Zhu, J.-K.; Chen, L.; Zhao, Y. Phosphorylation of SWEET Sucrose Transporters Regulates Plant Root:Shoot Ratio under Drought. Nat. Plants 2022, 8, 68–77. [Google Scholar] [CrossRef] [PubMed]
  34. Li, S.; Yan, C.; Cao, Y.; Wang, C.; Sun, X.; Zhang, L.; Wang, W.; Song, S. Comparative Physiological and Transcriptomic Analysis of Two Contrasting Soybean Genotypes Reveals Complex Mechanisms Involved in Drought Avoidance. Crop Sci. 2024, 64, 788–802. [Google Scholar] [CrossRef]
  35. Abdel-Ghany, S.E.; Ullah, F.; Ben-Hur, A.; Reddy, A.S.N. Transcriptome Analysis of Drought-Resistant and Drought-Sensitive Sorghum (Sorghum bicolor) Genotypes in Response to PEG-Induced Drought Stress. Int. J. Mol. Sci. 2020, 21, 772. [Google Scholar] [CrossRef]
  36. Zhu, T.; Liu, T.; Kang, S.; Zhang, J.; Zhang, S.; Yang, B.; Ma, X.; Guo, L.; Li, M.; Jin, L. Integrated Physiological Characterisation and Transcriptomics Reveals Drought Tolerance Differences between Two Cultivars of A. Sinensis at Seedling Stage. Mol. Biol. Rep. 2025, 52, 283. [Google Scholar] [CrossRef]
  37. Zhang, J.; Zhang, Y.; Feng, C. Genome-Wide Analysis of MYB Genes in Primulina eburnea (Hance) and Identification of Members in Response to Drought Stress. Int. J. Mol. Sci. 2023, 25, 465. [Google Scholar] [CrossRef]
  38. Tao, R.; Liu, Y.; Chen, S.; Shityakov, S. Meta-Analysis of the Effects of Overexpressed bZIP Transcription Factors in Plants under Drought Stress. Plants 2024, 13, 337. [Google Scholar] [CrossRef] [PubMed]
  39. Wu, J.; Wang, L.; Wang, S. Comprehensive Analysis and Discovery of Drought-Related NAC Transcription Factors in Common Bean. BMC Plant Biol. 2016, 16, 193. [Google Scholar] [CrossRef]
  40. Wu, J.; Chen, J.; Wang, L.; Wang, S. Genome-Wide Investigation of WRKY Transcription Factors Involved in Terminal Drought Stress Response in Common Bean. Front. Plant Sci. 2017, 8, 380. [Google Scholar] [CrossRef]
  41. Li, H.; Wang, Y.; Wu, M.; Li, L.; Li, C.; Han, Z.; Yuan, J.; Chen, C.; Song, W.; Wang, C. Genome-Wide Identification of AP2/ERF Transcription Factors in Cauliflower and Expression Profiling of the ERF Family under Salt and Drought Stresses. Front. Plant Sci. 2017, 8, 946. [Google Scholar] [CrossRef]
Figure 1. Growth phenotype and physiological changes of A. edgeworthii after ten days of drought stress. (a) The growth performance of seedlings from both ASs and SSs subjected to drought stress for ten days (D10). Bar: 10.0 cm. (b) Chlorophyll content. (c) Proline content. (d) Malondialdehyde content. (e) Root-to-shoot ratio. (f) Relative water content. (g) Rate of water loss. Values represent the mean ± SE (n = 3). Significant differences (** p < 0.01, *** p < 0.001, **** p < 0.0001; unpaired two-tailed Student’s t tests).
Agronomy 15 00735 g001
Figure 2. Effect of drought stress on ROSs and antioxidant enzymes. (a) H2O2 content. (b) POD activity. (c) CAT activity. (d) SOD activity. Values represent the mean ± SE (n = 3). Significant differences (* p < 0.05, ** p < 0.01, *** p < 0.001; unpaired two-tailed Student’s t tests). ns, no significant.
Agronomy 15 00735 g002
Figure 3. Statistics of RNA-seq data and drought-responsive DEGs. (a) Summary of RNA-seq data. (b) Statistics of DEGs in AS and SS seedlings in response to drought stress. (c) Volcano plot of the expressed genes’ distribution in AS seedlings after five days of drought stress. (d) Volcano plot of the expressed genes’ distribution in AS seedlings after ten days of drought stress. (e) Volcano plot of the expressed genes’ distribution in SS seedlings after ten days of drought stress. (f) Overlap of DEGs from AS seedlings under drought stress for five and ten days. (g) Overlap of DEGs from AS and SS seedlings under drought stress for ten days.
Agronomy 15 00735 g003
Figure 4. GO enrichment analyses for DEGs from AS and SS seedlings of A. edgeworthii under drought treatments.
Agronomy 15 00735 g004
Figure 5. KEGG enrichment analyses for DEGs from AS and SS seedlings of A. edgeworthii under drought treatments.
Agronomy 15 00735 g005
Figure 6. Expression patterns of differentially expressed TFs in drought-responsive DEGs. (a) The up- and downregulated member distributions of differentially expressed TF categories from the AS seedlings_D5, AS seedlings_D10, and SS seedlings_D10 groups. The top 20 differentially expressed TF categories in each group are shown. (b) Heatmaps showing the expression patterns of differentially expressed TFs from the AS seedlings_D5, AS seedlings_D10, and SS seedlings_D10 groups. Gene expression data were normalized to Log2 (FPKM + 1). Red and green represent upregulated and downregulated TFs, respectively.
Agronomy 15 00735 g006
Figure 7. Validation of the expression patterns of eight selected DEGs by RT-qPCR assays. (a) RT-qPCR results of eight selected DEGs. (b) RNA-seq results of eight selected DEGs. Values represent the mean ± SE (n = 3). Significant differences (* p < 0.05, ** p < 0.01, *** p < 0.001, **** p < 0.0001; unpaired two-tailed Student’s t tests). ns, no significant.
Agronomy 15 00735 g007
Disclaimer/Publisher’s Note: The statements, opinions and data contained in all publications are solely those of the individual author(s) and contributor(s) and not of MDPI and/or the editor(s). MDPI and/or the editor(s) disclaim responsibility for any injury to people or property resulting from any ideas, methods, instructions or products referred to in the content.

