Article

The Effect of Pesticide Solutions on the Deposition of Bubble-Containing Droplets

1
School of Agricultural Engineering, Jiangsu University, Zhenjiang 212013, China
2
School of Energy and Power Engineering, Jiangsu University, Zhenjiang 212013, China
*
Author to whom correspondence should be addressed.
Agronomy 2025, 15(5), 1172; https://doi.org/10.3390/agronomy15051172
Submission received: 8 April 2025 / Revised: 6 May 2025 / Accepted: 9 May 2025 / Published: 12 May 2025
(This article belongs to the Special Issue Advances in Precision Pesticide Spraying Technology and Equipment)

Abstract

:
The deposition of spray droplets is a critical topic in plant protection. The air-induction nozzle is believed to mitigate spray drift by producing bubble-containing droplets. However, research on the deposition of bubble-containing droplets is limited. In this study, the deposition process of bubble-containing droplets was investigated using high-speed photomicrography. Three typical pesticide solutions, oil-based emulsions, suspensions, and aqueous solutions were used to produce bubble-containing droplets. Both hydrophilic and hydrophobic surfaces were used as deposition targets. The results indicate that the deposition of bubble-containing droplets can generate a central jet resembling the Worthington jet. All three solutions reduced liquid surface tension, thereby increasing the maximum spreading diameter of bubble-containing droplets. On hydrophilic surfaces, a functional curve describing the maximum spreading factor was fitted based on the dimensionless Weber number (We), expressed as f max = 0.04 We 0.508 + 3.21 . On hydrophobic leaves, the dynamic evolution and retention effects of bubble-containing droplets were analyzed. Suspensions and aqueous solutions exhibited droplet rebound, while oil-based emulsions transitioned from rebound (0–0.2% concentration) to adhesion (0.4–0.8% concentration), with 0.4% identified as the critical concentration for this rebound-to-adhesion transition. Morphological variations during deposition, including rebound, splashing, and fragmentation, were also observed across different solution concentrations.

1. Introduction

The utilization efficiency of pesticides is to some extent determined by the deposition characteristics of spray droplets [1,2,3]. In generally, spray droplets with small sizes are beneficial for deposition [4]. However, small droplets are easily carried away by the environmental airflow, drifting out of the target area and causing spray drift [5,6,7]. In recent years, air-induction spray technology, which features generating spray droplets with air bubbles inside, has been developed to reduce the spray drift [8,9,10]. On the one hand, the air bubbles inside the spray droplet increase its diameter, which effectively suppresses the spray drift [11,12]; on the other hand, during the deposition process, the bubbles inside the droplets may burst, forming smaller droplets, thereby enhancing the deposition [13,14]. Current research on the deposition of bubble-containing droplets is limited, especially when complex pesticide solutions are used.
For dense droplets (droplets without air bubbles inside), there have been extensive studies [15,16,17,18]. On hydrophilic targets, the deposition process of dense droplets can generally be divided into a spreading stage and a retraction stage [19,20,21]. During the spreading stage, the droplet transitions from a spherical shape to a disk-like shape, with a significant increase in surface area. During this stage, the initial kinetic energy of the droplet converts into viscous dissipation and surface energy [19]. In the retraction stage, the droplet changes from a disk shape to a hemispherical shape, resulting in a reduced surface area. Part of the surface energy is converted into kinetic energy and viscous dissipation [19]. On hydrophobic targets, the first two stages are similar to those on the hydrophilic targets. The difference lies in the fact that droplets on hydrophobic targets can fully retract and eventually bounce off the surface [22]. The surface of hydrophobic targets typically features numerous nanoscale protrusions [23,24] and droplets usually make point-like contact with these structures, meaning the contact area between the droplet and the target is relatively small [23,24]. As a result, the viscous dissipation due to friction is relatively low for droplets on hydrophobic surfaces [25].
Research on bubble-containing droplets is relatively limited. Hu et al. [26] collected the droplets of air-induction spray using silicone oil and observed the spray droplets with air bubbles inside. Post [27] captured images of bubble-containing droplets that detached from the liquid sheet of air-induction sprays. Gong et al. [28] documented the process of bubbles entering droplets of air-induction sprays. Regarding the deposition of bubble-containing droplets, only a few studies from industrial fields provide some reference. Existing research shows that the impact process of bubble-containing droplets on solid targets differs significantly from that of dense droplets [29,30,31]. For dense droplets, the liquid spreads radially outward during the spreading stage. For bubble-containing droplets, due to the presence of the air bubble, the liquid spreads outward while also converging inward toward the center [31]. As a result, the spreading diameter of bubble-containing droplets is smaller than that of dense droplets [30]. The inward-converging liquid gradually forms a jet inside the air cavity, known as a Worthington jet [29], which is considered a typical feature of bubble-containing droplet impact. The study of the deposition characteristics of bubble-containing droplets is still in the exploratory stage. The complex physicochemical properties of pesticide solutions will inevitably affect bubble stability [32,33], leading to more complex phenomena during the deposition of bubble-containing droplets, which warrants further in-depth research.
In this paper, the depositions of bubble-containing droplets under various pesticide solution conditions (oil-based emulsion, suspension, and aqueous solutions) were investigated. Bubble-containing droplets were generated using two syringe pumps and two micro-injectors. The deposition processes were captured and measured using a high-speed photography system. Three typical pesticide solutions, oil-based emulsion, suspension, and aqueous, were selected and used in the experiments. The effect of pesticide solutions on the deposition of bubble-containing droplets was discussed. Furthermore, deposition experiments were conducted on both hydrophilic and hydrophobic targets to examine the role of target properties in deposition.

2. Materials and Methods

To capture the deposition process of bubble-containing droplets on target surfaces, an experimental visualization system was developed. The schematic diagram of the experimental setup is illustrated in Figure 1. A high-speed camera (Olympus Co., Shinjuku-ku, Tokyo, Japan) coupled with a lens (Tokina Macro 100 F2.8 D, Olympus Co., Shinjuku-ku, Tokyo, Japan) was utilized to capture the deposition process of bubble-containing droplets. The exposure time and frame rate of the high-speed camera were set to 2.16 μs and 2000 f/s, respectively. A light source was positioned to enhance illumination in the field of view. A diffuser plate was placed between the light source and the target surface to ensure uniform light distribution. A handheld display monitor, synchronized with the high-speed camera, was employed to configure imaging parameters (e.g., exposure time, frame rate) and preview acquisition results.

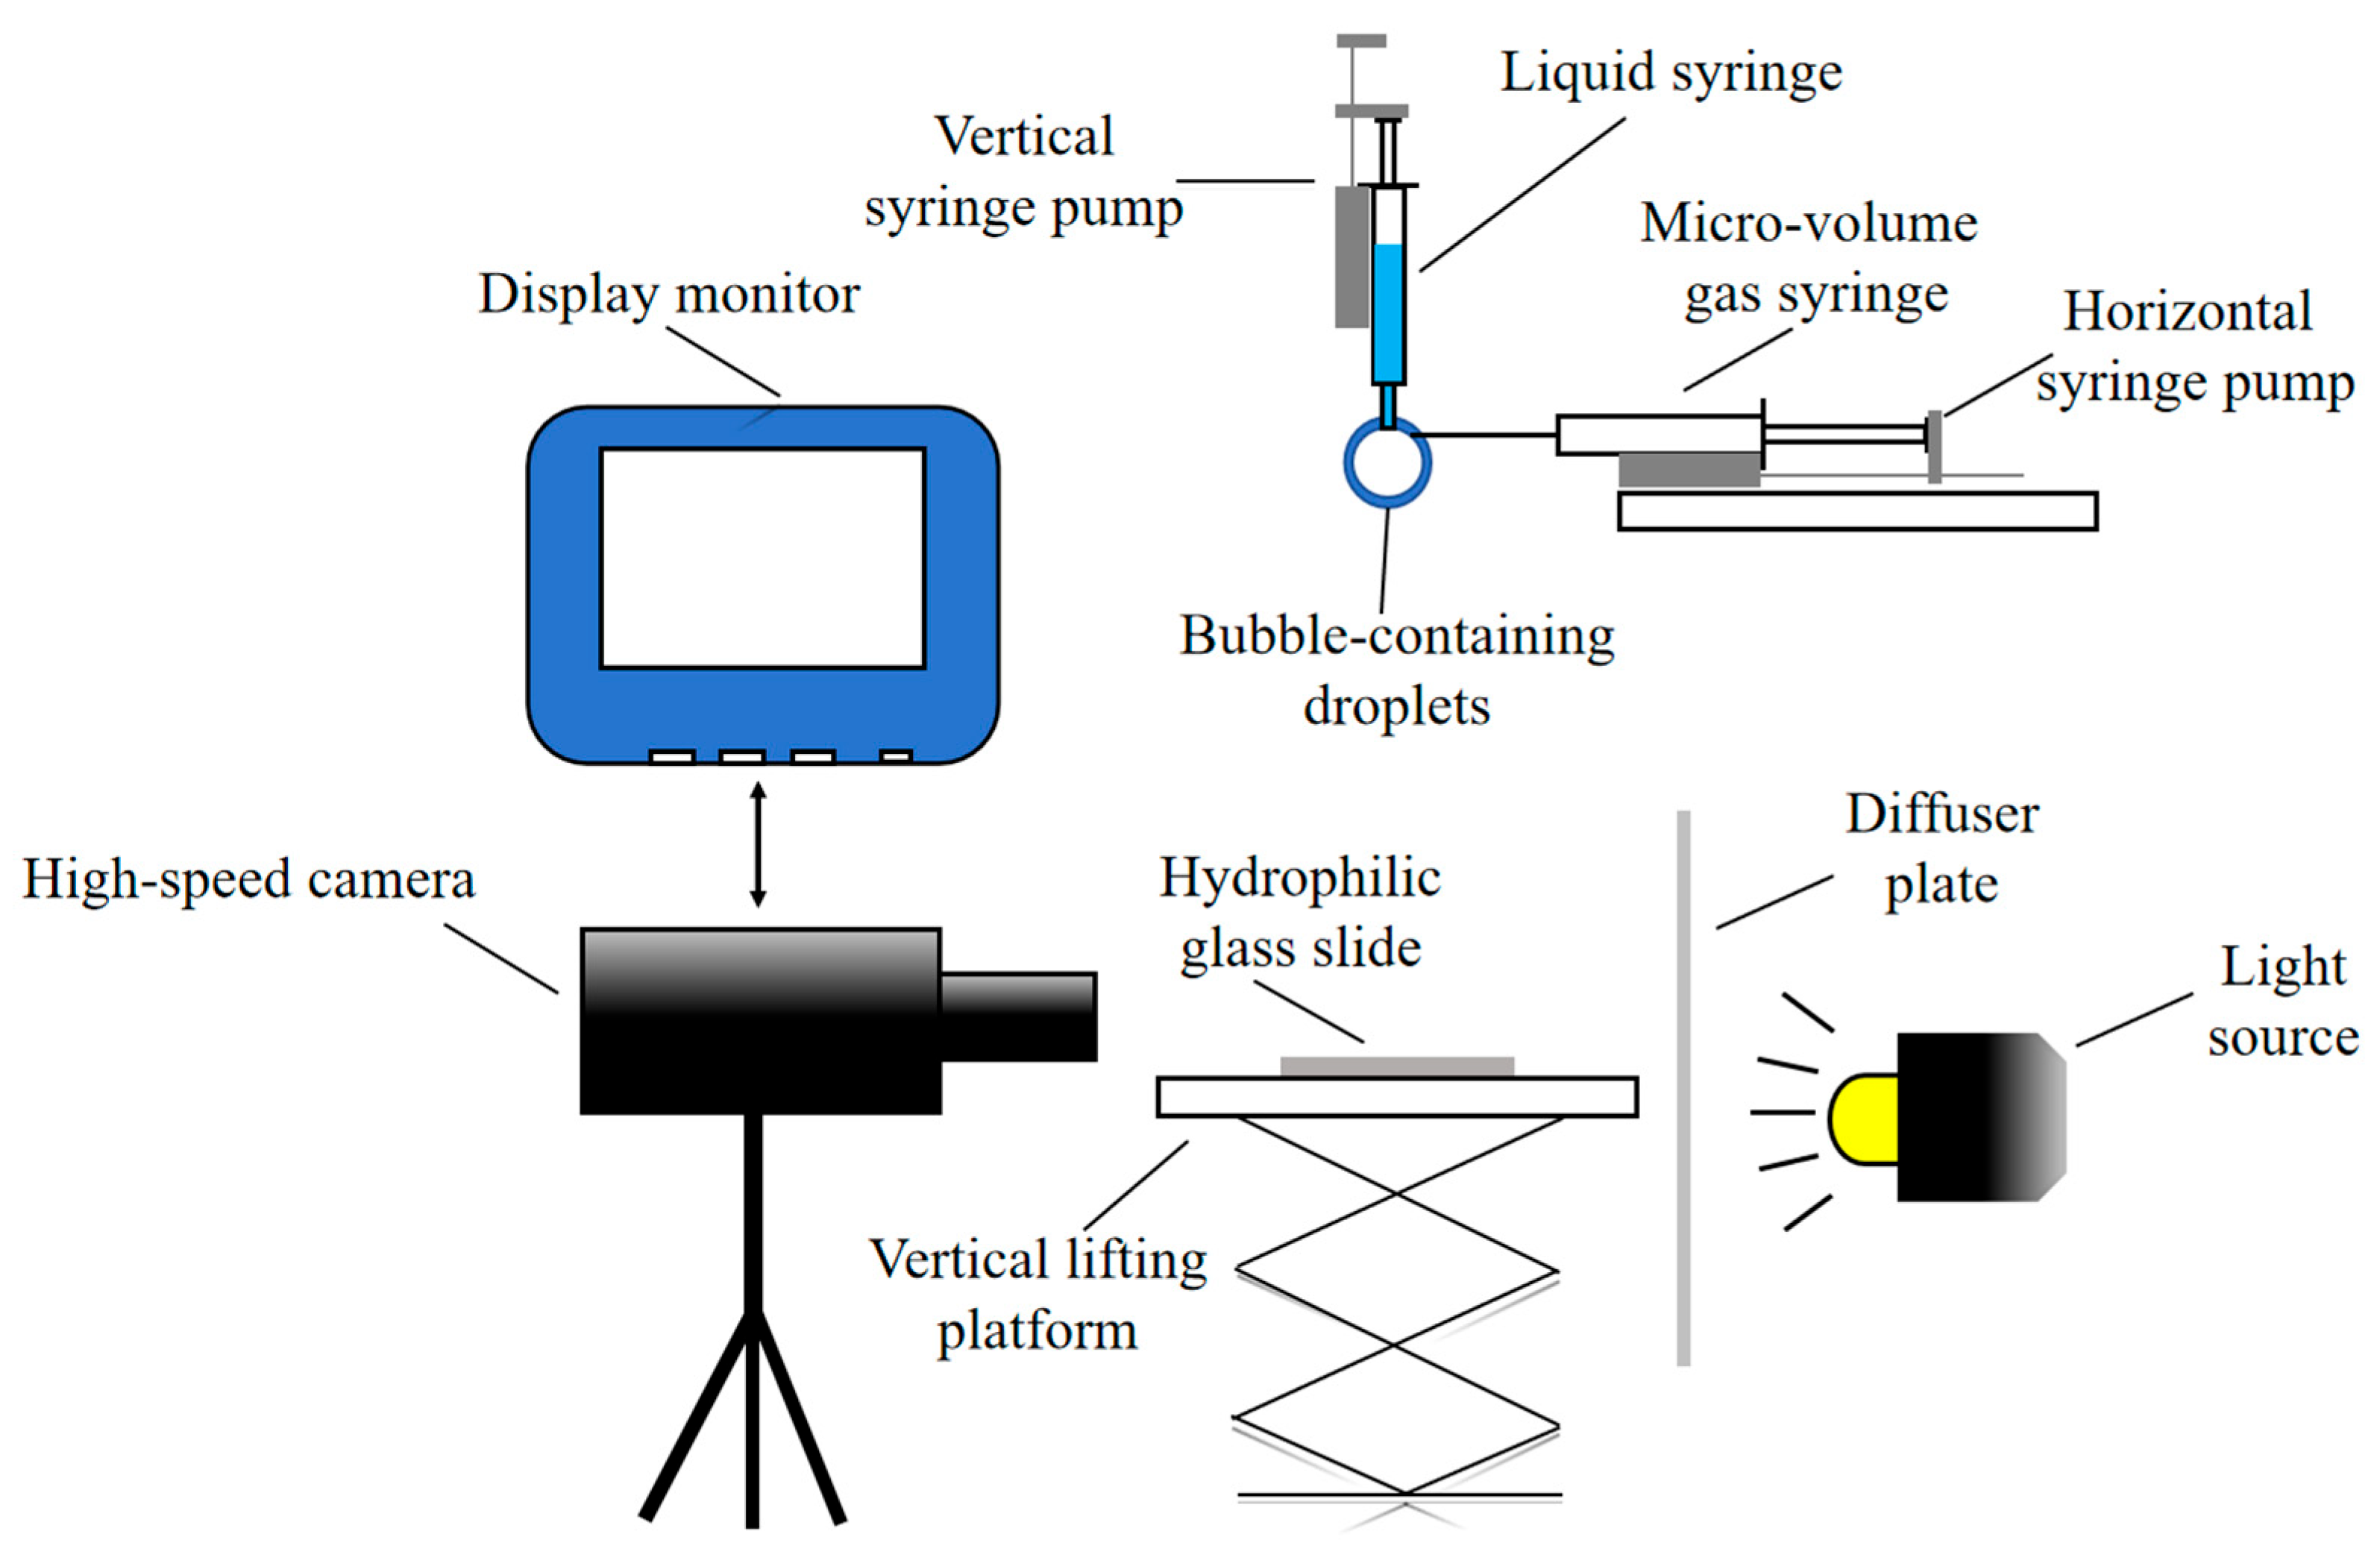
2.1. Generation Method of Bubble-Containing Droplets

The method for generating a bubble-containing droplet is as follows: First, fill a vertically arranged syringe with the pesticide solution. Use a vertically positioned syringe pump (Model: QHZS002T, Qinhe Intelligent Technology Co., Ltd., Shenzhen, China) to push the syringe, forming a droplet of the appropriate size at the tip of the vertical syringe. Next, load a certain amount of air into a horizontally placed micro-syringe (capacity: 100 μL, Shanghai Gaoge Industrial Co., Ltd., Shanghai, China) and adjust its position so that the needle tip is inserted into the center of the droplet. Activate the horizontal syringe pump to inject the air from the micro-syringe into the droplet. Finally, reactivate the vertical syringe pump to expel more pesticide solution. When the droplet reaches a certain volume, the bubble-containing droplet will detach and fall from the vertical syringe.
The volume of liquid and air in the bubble-containing droplets is calculated based on the scale difference in the vertical syringe and the horizontal micro-syringe before and after the experiment. In this paper, the volume percentage of air in the bubble-containing droplets is around 10%. The diameters of the droplets and the air bubble inside the droplet are calculated based on the volume of liquid and air. The impact velocity of the bubble-containing droplet on the target is determined by measuring its falling height. Due to operational errors in the actual process, each experiment is repeated multiple times to obtain suitable bubble-containing droplets.

2.2. Pesticide Solutions and Deposition Targets

Three typical pesticide solutions, oil-based emulsion, suspension, and aqueous solutions, were used in the experiments. The oil-based emulsion solution was prepared with water and Butachlor. Butachlor, a common emulsifiable herbicide used in weed control, was purchased from Jiangsu Lvlai Co., Ltd., Suzhou, China. The suspension solution was prepared with water and Atrazine. Atrazine, a common suspension herbicide used in weed control, was purchased from Qiaochang Modern Agriculture Co., Ltd., Binzhou, China. The aqueous solution was prepared with water and Glufosinate. Glufosinate, a common selective systemic herbicide used in weed control, was purchased from Hebei Zhongbao Lvnong Crop Technology Co., Ltd., Langfang, China. To align with the typical concentration range (≤1%) in agricultural spraying, pesticide solutions were prepared at concentrations of 0.1–0.8%. The surface tensions of the solutions were measured via the pendant drop method using an OCA optical contact angle goniometer (Model OCA25, Dataphysics GmbH, Stuttgart, Germany). For each liquid solution, multiple measurements were conducted, and the average value was used as the final surface tension.
Both hydrophilic and hydrophobic surfaces were used in the experiments. The hydrophilic surface was prepared with a glass slide. The hydrophobic surface was prepared with lotus leaf. During the experiment, the lotus leaves were cut into rectangular pieces and adhered to glass slides using double-sided tape to ensure they remained on a horizontal plane. Prior to testing, the contact angles of both the glass slides and lotus leaves were measured using a contact angle goniometer. To minimize errors, multiple measurements were taken, and the average value was used as the final result. The measured contact angles of the hydrophilic and hydrophobic surfaces are 67 ± 2° and 141.1 ± 1.5°. After multiple experiments and measurements, the initial diameter (D0) of the droplets ranged from 3.0 to 4.5 mm.
In the analysis of the droplet impact process, the Weber number (We), a dimensionless quantity representing the ratio of inertial forces to surface tension forces, is frequently used. It was calculated using the following formula:
W e = ρ v 2 L σ
where ρ is the fluid density (kg/m3), v is the fluid velocity (m/s), L is the characteristic length (m), and σ is the surface tension (N/m). In this paper, ρ refers to the density of the pesticide solution.

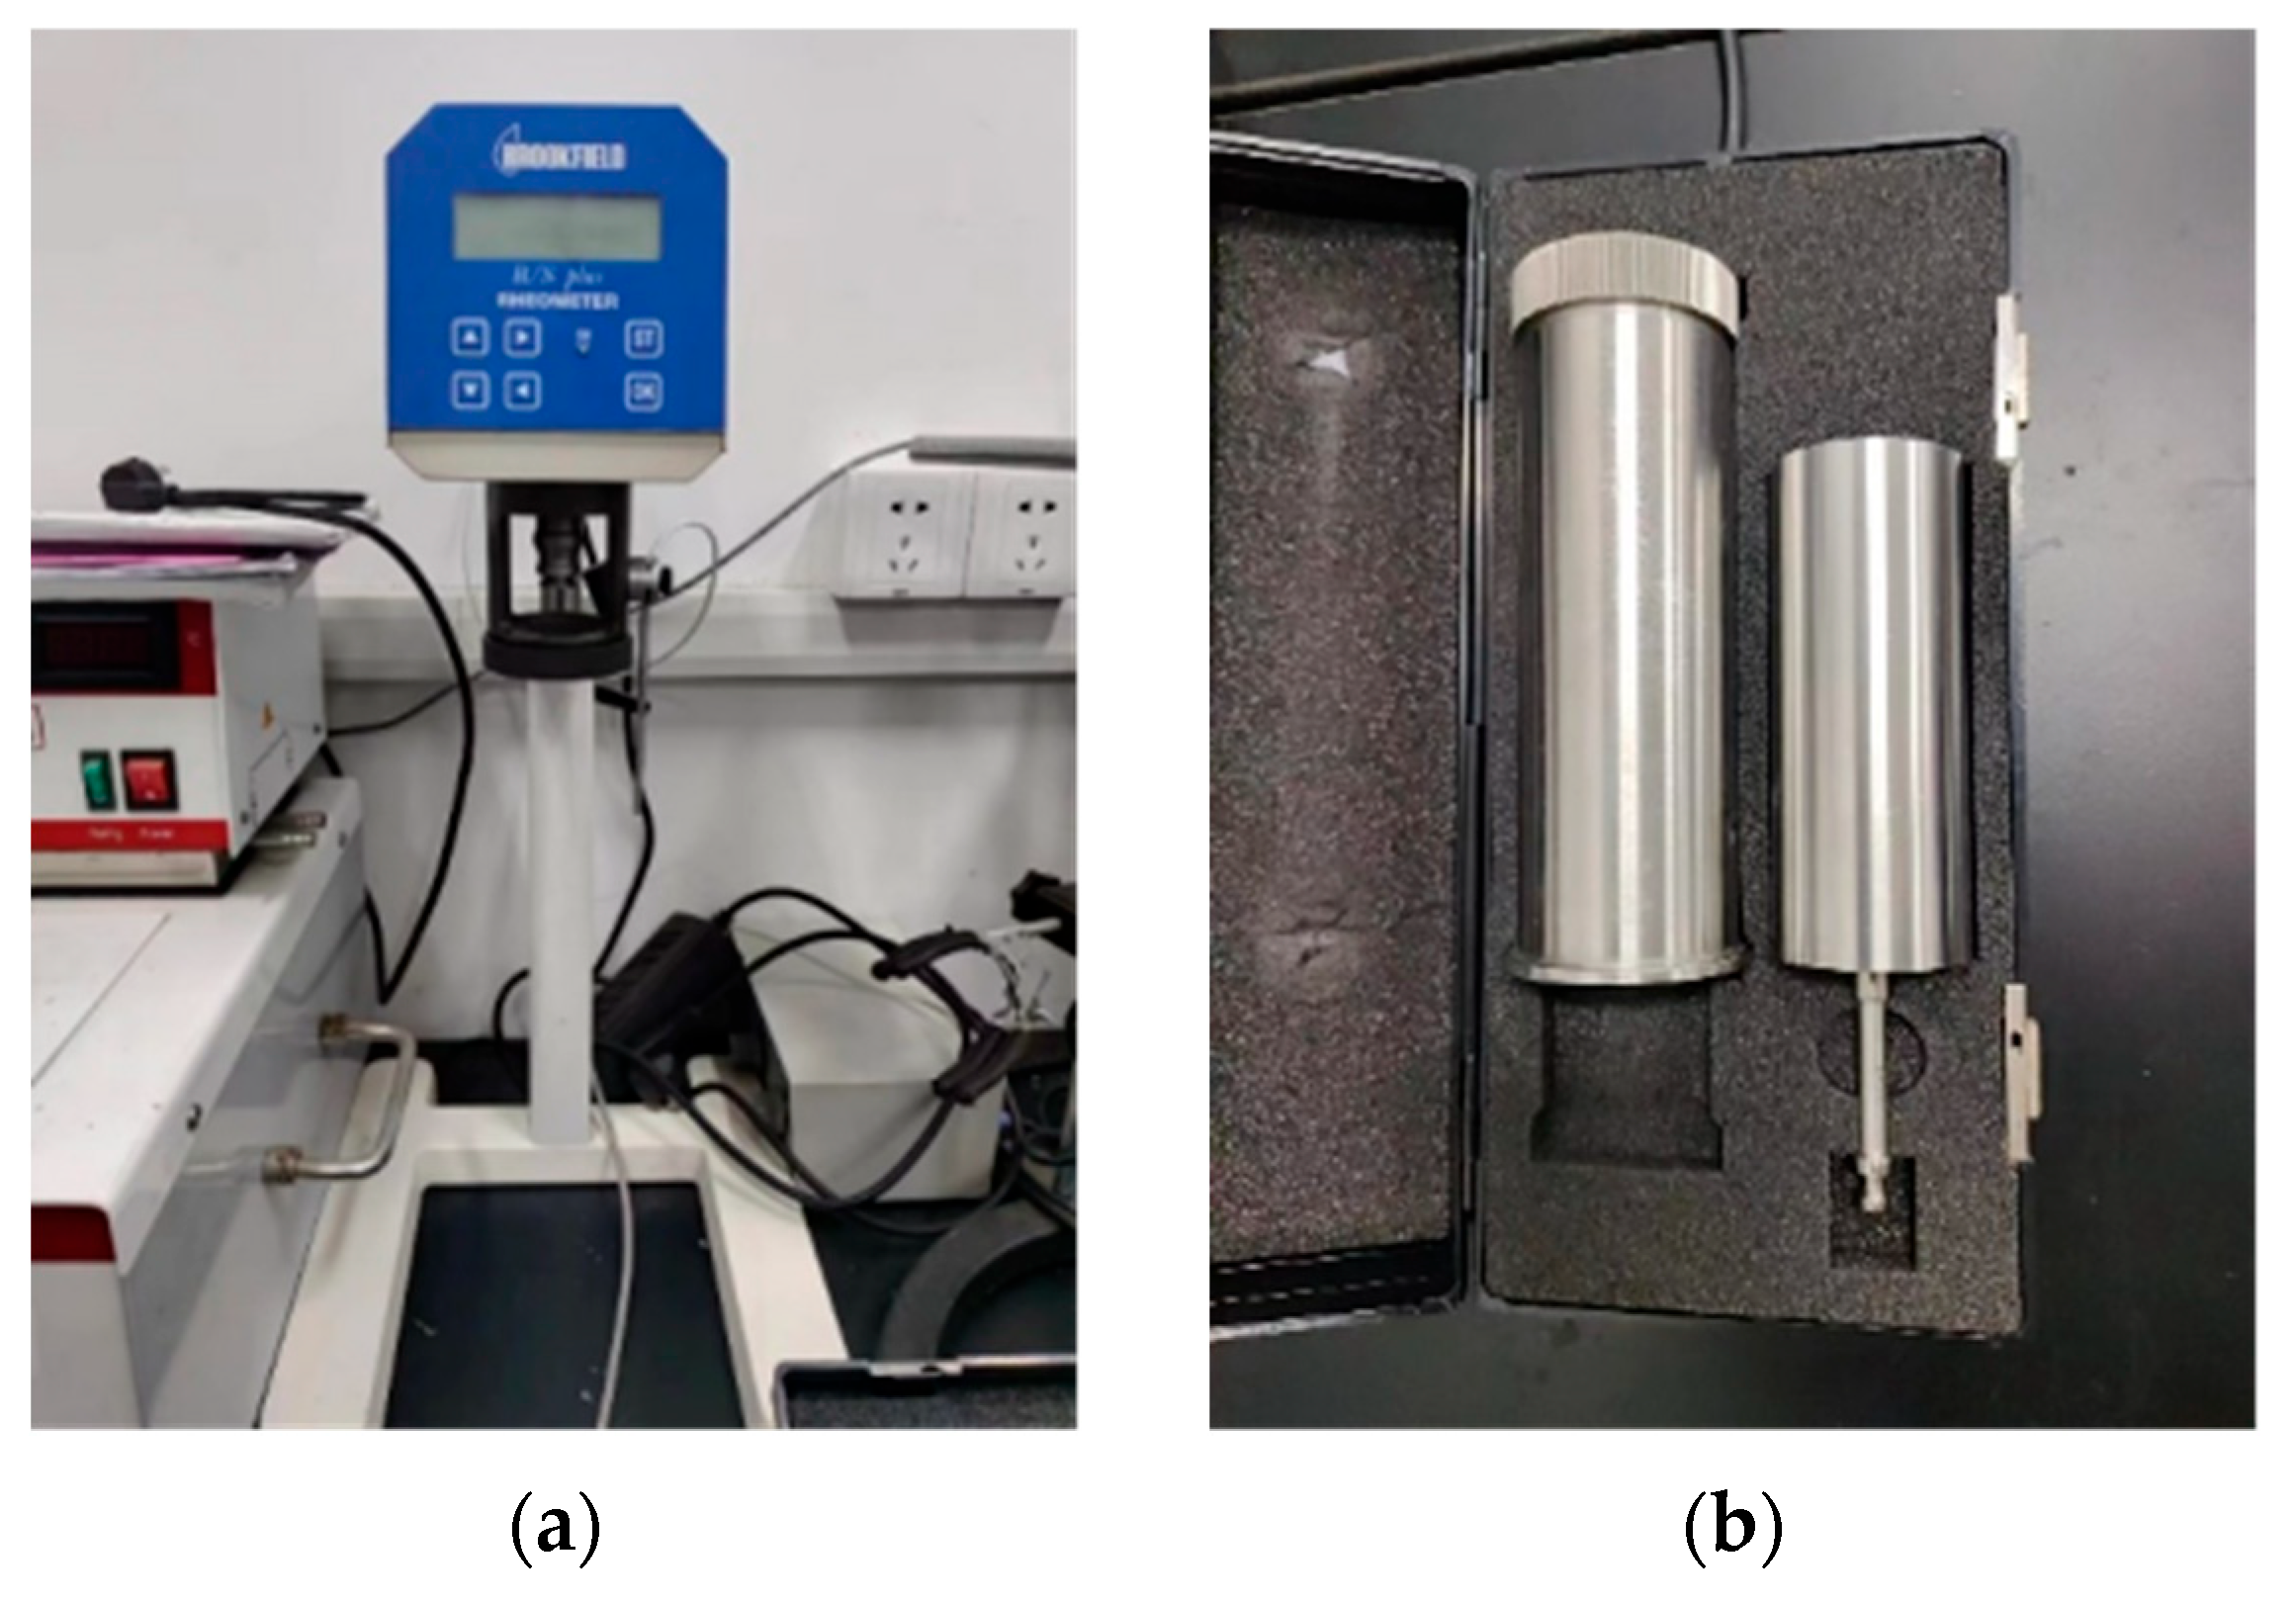
2.3. Dynamic Viscosity Measurement Method for the Liquid

Dynamic viscosity measurement of the liquid is conducted using the rotational viscometry method, which calculates viscosity from the shear and drag between a rotor and the fluid. We used an R/S rheometer (VTE-250, Brookfield, MA, USA) (Figure 2). In the instrument interface, set the Val shear rate to 290 S-1, with 10 measurements per group and 3 repeated measurements for each sample. Each group is measured for a total of 100 s. The sample testing environment temperature in this section is maintained within the range of 23 ± 2 °C. To perform the measurement, pour the sample reagent into the rotor (Figure 2). After each sample measurement, rinse the rotor thoroughly.

3. Results and Discussion

3.1. Deposition of Bubble-Containing Droplets on Hydrophilic Surfaces

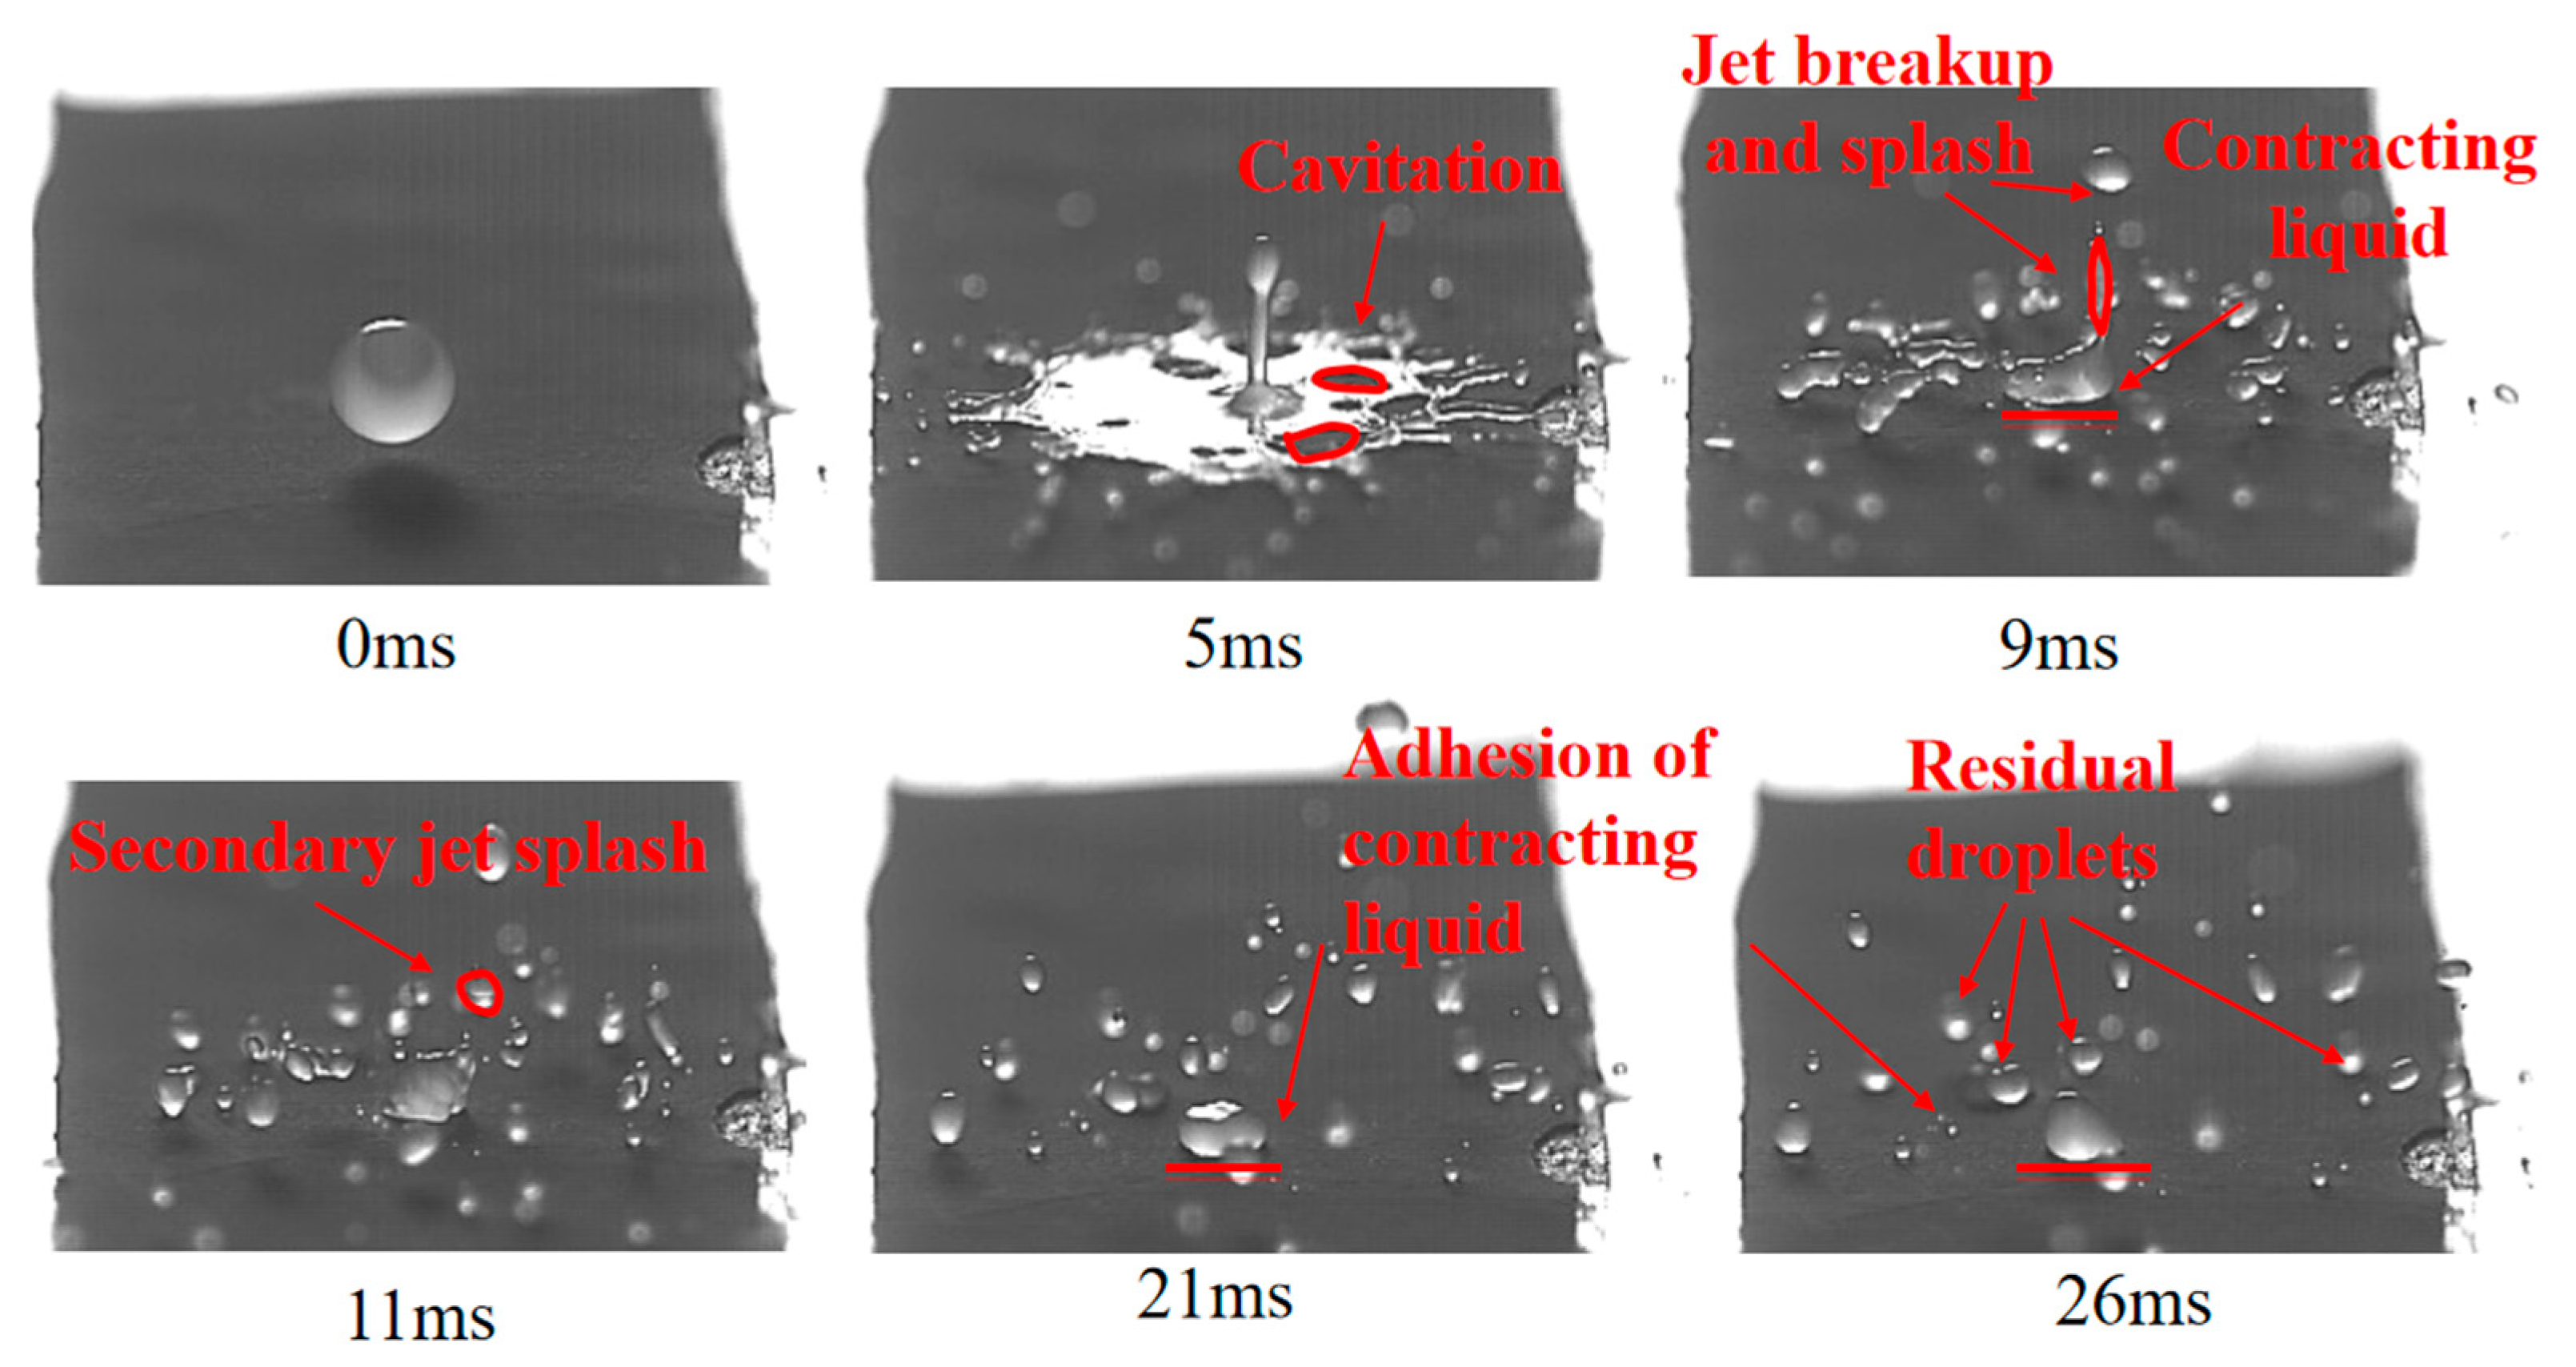
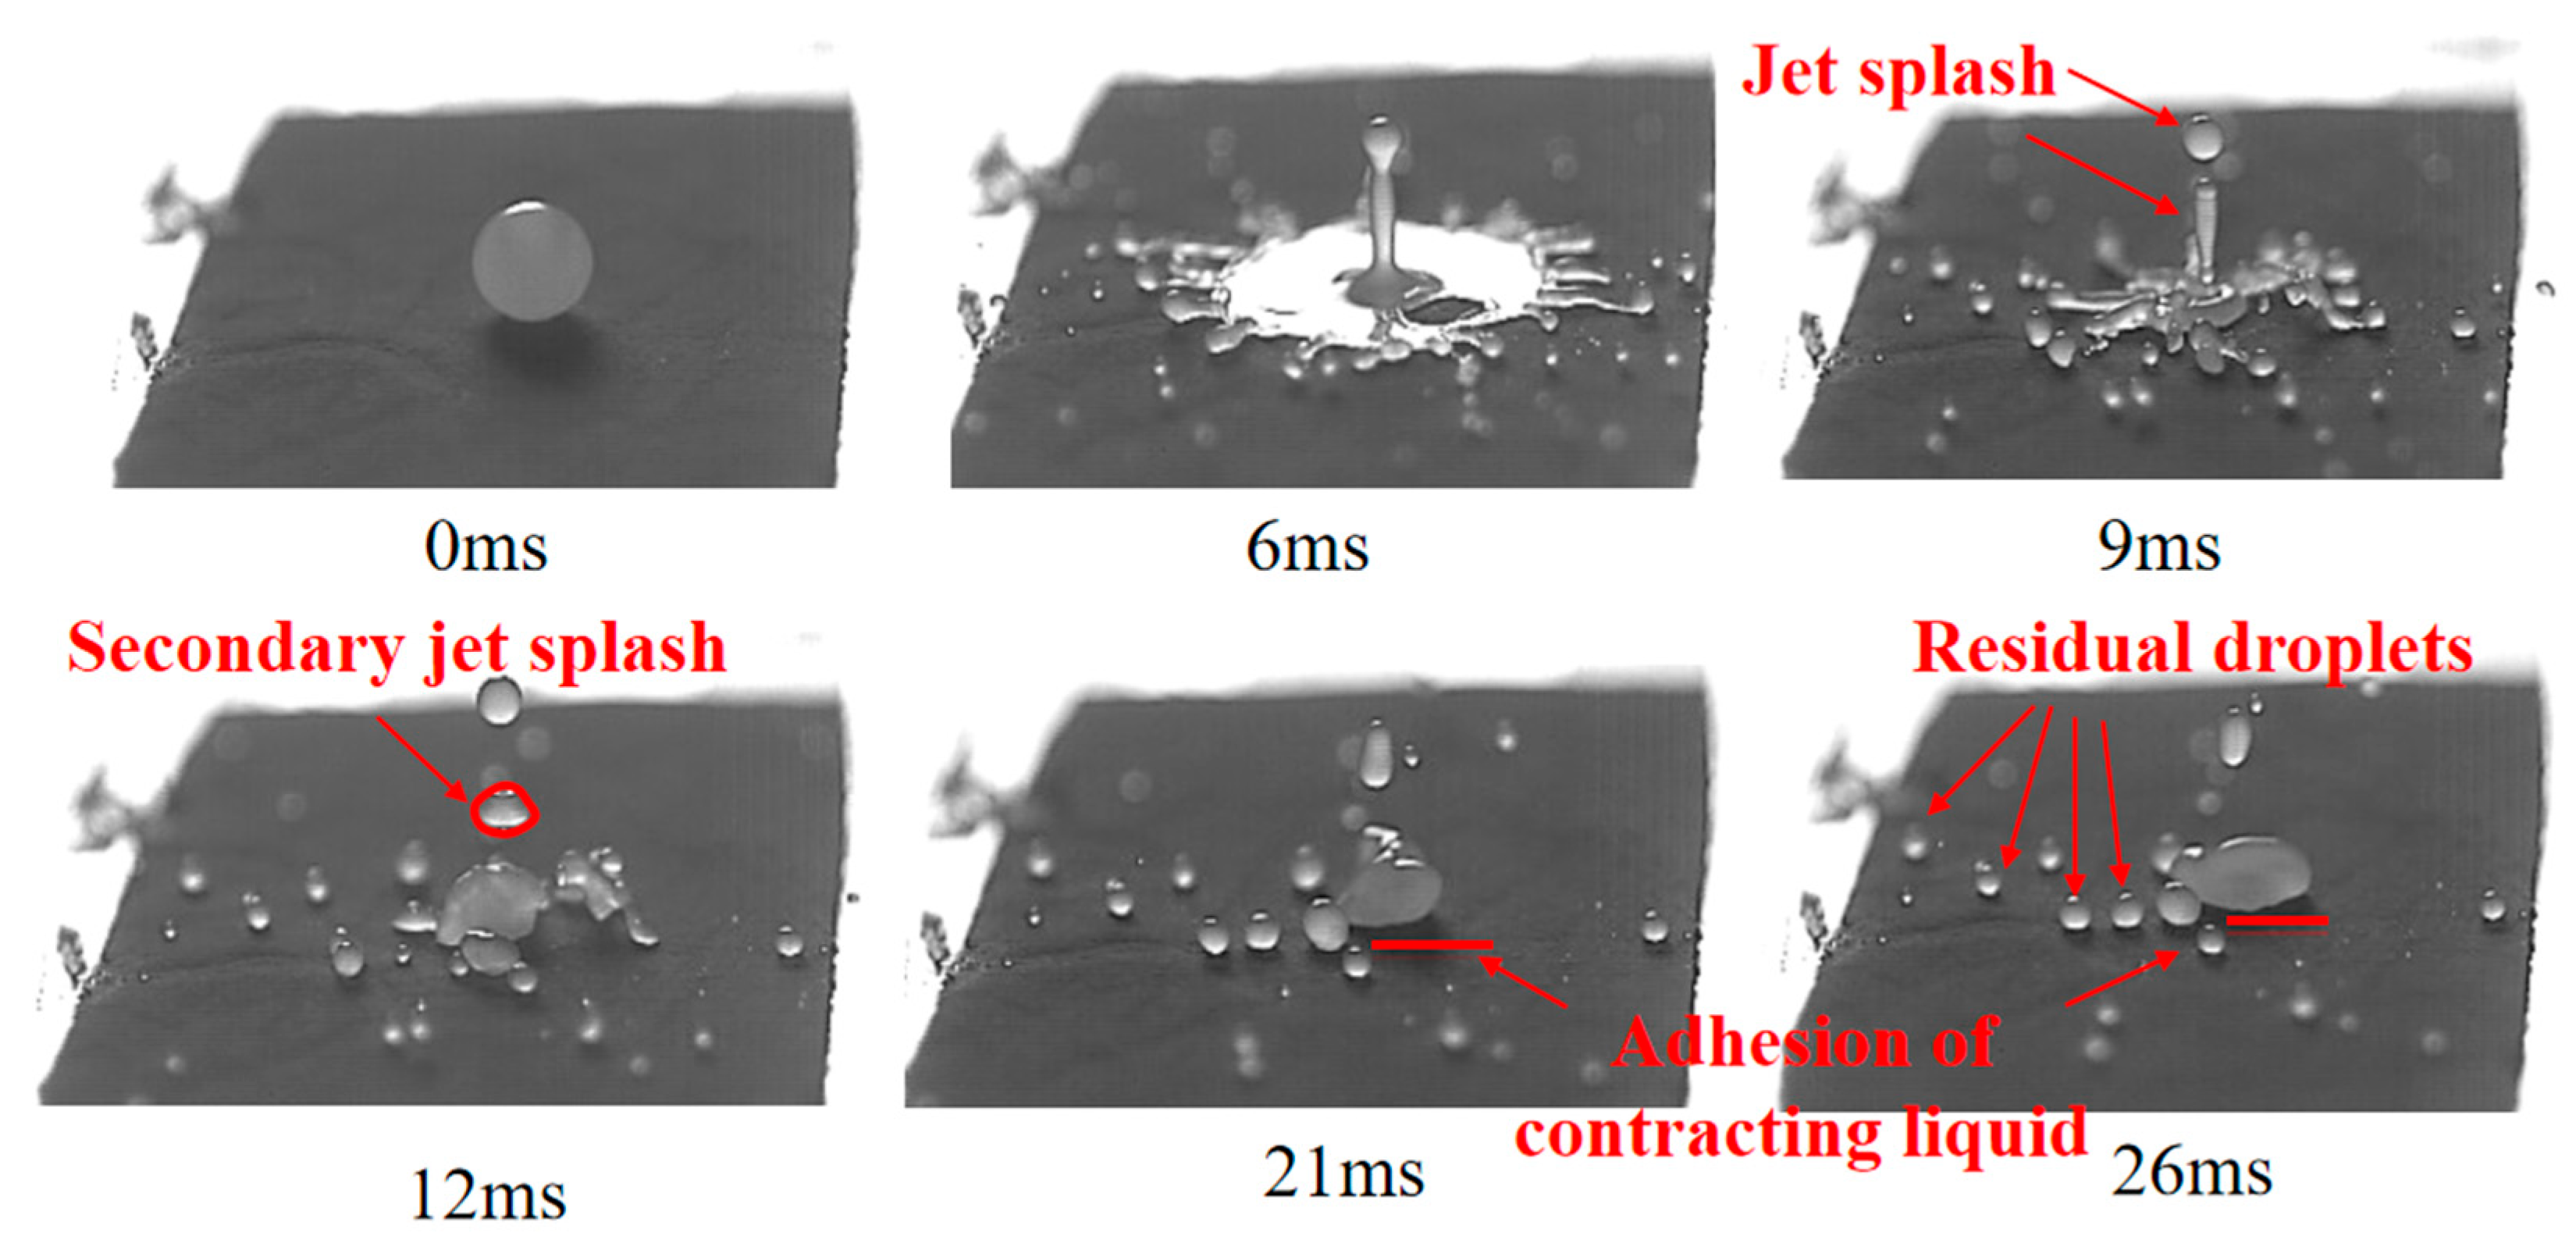
3.1.1. Deposition of the Oil-Based Emulsion Bubble-Containing Droplets on Hydrophilic Surfaces

Figure 3 illustrates the deposition process of oil-based emulsion bubble-containing droplets on the hydrophilic surface. For all tested emulsion concentrations (0.1–0.8%), the central jet consistently penetrated the entrapped air cavity. This phenomenon likely arises from the surfactant-induced reduction in surface tension, which destabilizes the thin liquid film encapsulating the bubble. The measurement results of surface tension for emulsions with different concentrations are shown in Table 1.
In emulsions with concentrations of 0.1–0.4%, varying degrees of splitting and cavity formation were observed during deposition. For the 0.1% emulsion, three perforations emerged on the basal diameter of the retracting droplet at 74.5 ms, coalescing into a stable central cavity (red arrow) by 122 ms (Figure 3a). The 0.2% emulsion formed a ring-shaped deposition pattern by 122 ms, characterized by peripheral liquid accumulation and a central cavity (red arrow) (Figure 3b). For the 0.4% emulsion, a perforation initiated at 47 ms evolved into a crescent-shaped cavity (red arrow) by 123 ms (Figure 3c). In contrast, the 0.8% emulsion exhibited no splitting or cavity formation, retracting into a continuous deposition area by 118 ms.
Capillary-driven flow dominated the retraction phase for 0.1–0.4% emulsions. Voids initially formed in regions of low liquid mass (e.g., 10 ms in Figure 3a–c) expanded due to suppressed liquid redistribution toward the center, resulting in progressively enlarging cavities.
As shown in Figure 4, the maximum spreading factor (the ratio of spreading diameter to initial diameter f m a x = D m a x / D 0 ) increased with emulsion concentration (C) due to reduced surface tension (σ). For water, f m a x measured approximately 4.02. At 0.1% and 0.2% concentrations, f m a x rose sharply to 4.14 and 4.39, respectively, corresponding to significant reductions in σ. Growth decelerated at higher concentrations (0.4–0.8%), with f m a x increasing marginally from 4.53 to 4.58, consistent with diminished surface activity under near-saturation surfactant conditions.

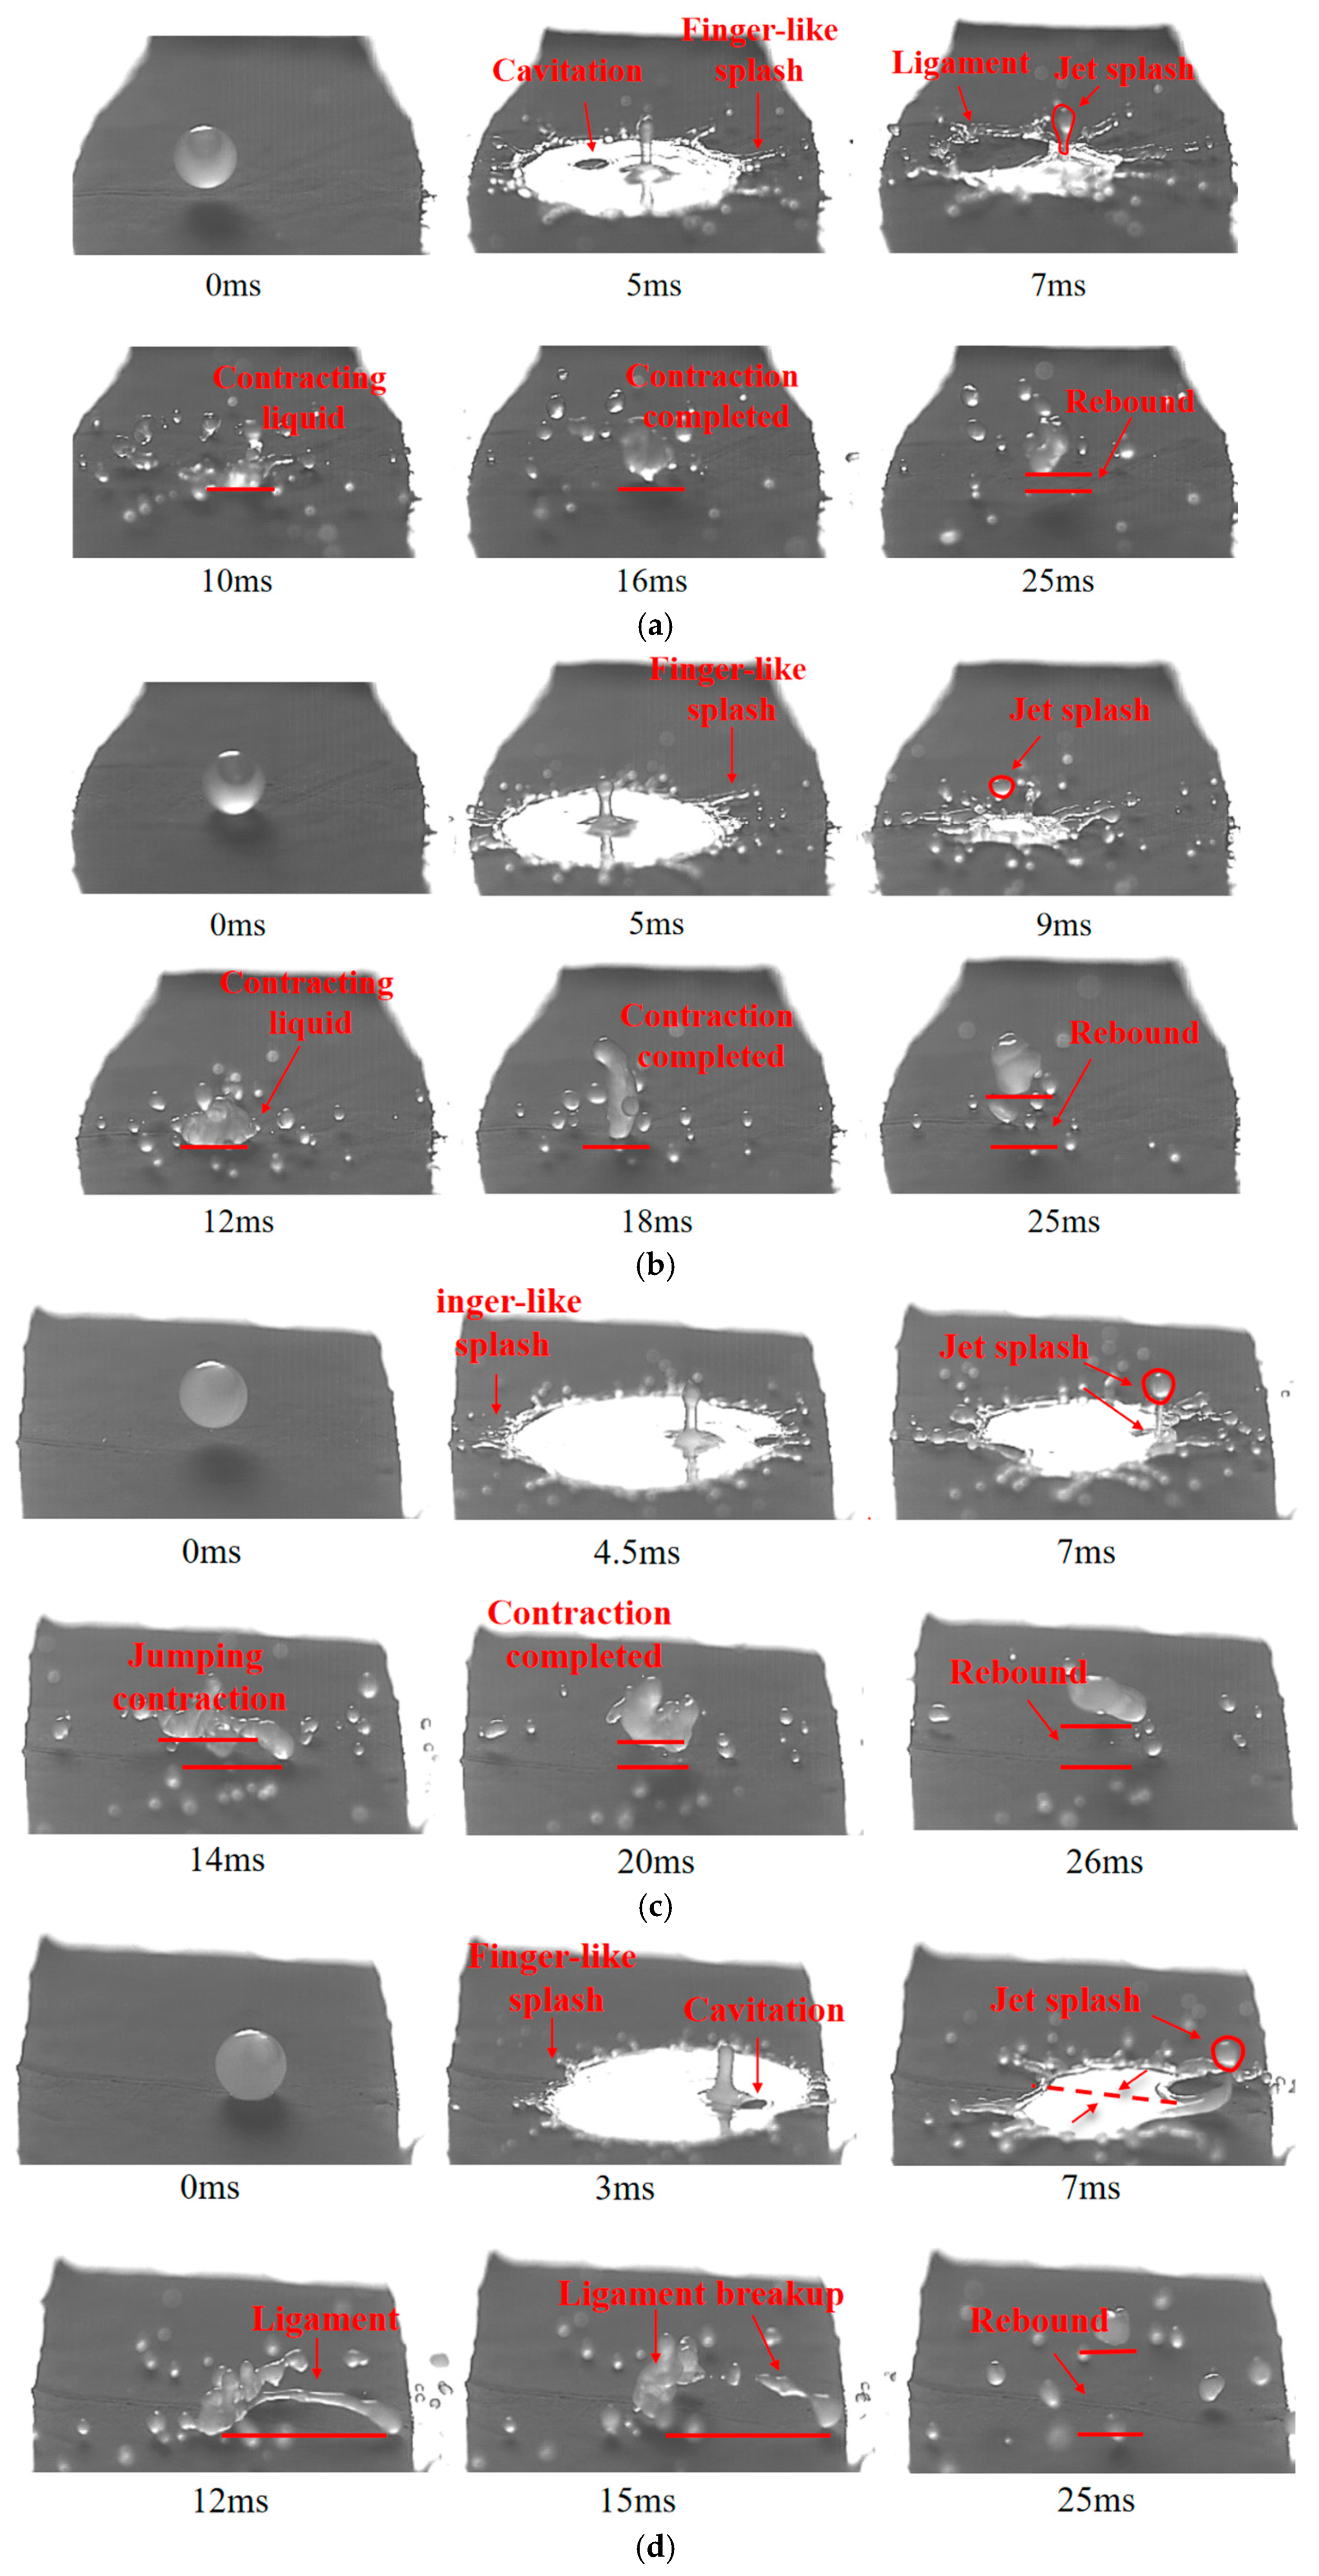
3.1.2. Deposition of Suspension Solution Bubble-Containing Droplets on Hydrophilic Surfaces

Figure 5 demonstrates the deposition dynamics of suspension-based bubble-containing droplets containing approximately 10% gas volume on hydrophilic surfaces across concentrations ranging from 0.1% to 0.8%. The dynamic deposition behavior exhibited minimal variation with increasing Suspension concentration, though droplet opacity significantly intensified at higher concentrations. At 5 ms post-impact, central jets penetrated the upper liquid shells uniformly across all concentrations, propagating toward the spreading edges before fragmentation and splashing.
For the 0.2% suspension system (Figure 5b), initial radial spreading (2–5 ms) was accompanied by vertical jet elongation and peripheral rim thickening, forming a chain-like morphology. Subsequent retraction (10–13.5 ms) involved jet fragmentation, splashing, and inward recession of the thickened periphery, with concentric contraction waves observable at the basal interface. By 27 ms, retraction stabilized into a final deposition pattern.
Surface tension reduction with suspension concentration (see Table 2) directly correlated with enhanced spreading capacity. As shown in Figure 6, the maximum spreading factor ( f m a x ) increased progressively: from 4.02 for pure water (0% suspension) to 4.08 (0.1% suspension), 4.13 (0.2% suspension), and further to 4.15–4.24 at 0.4–0.8% suspension. This uniform growth trend contrasts with emulsion systems, likely attributable to the absence of surfactant saturation effects in the suspension solution stabilized by solid particles.

3.1.3. Deposition of Aqueous Solution Bubble-Containing Droplets on Hydrophilic Surfaces

As illustrated in Table 3, the surface tension (σ) of the aqueous solutions exhibited a stepwise reduction with increasing solution concentration, with the aqueous solutions demonstrating significantly greater surface activity than emulsion solutions. At 0.02% concentration, the aqueous solutions achieved a surface tension of σ = 31.10 mN/m, comparable to the σ = 33.64 mN/m observed for a 0.8% emulsion solution.
Figure 7 demonstrates the deposition dynamics of aqueous solution bubble-containing droplets containing approximately 10% air volume on hydrophilic surfaces across concentrations ranging from 0.0025% to 0.02%. Despite similar bubble volume fractions, pre-impact bubble displacement significantly influenced jet orientation and subsequent deposition morphology. During the spreading phase (2–5 ms post-impact), droplets at all concentrations exhibited comparable spreading radii and central jet initiation. However, asymmetric bubble positioning prior to impact generated directional fluid instabilities.
For instance, in the 0.0025% system, lateral bubble displacement toward the right side induced a rightward-deflected central jet. By 8 ms, the jet propagated diagonally toward the rear-right quadrant, leaving an asymmetric deposition pattern. Conversely, the 0.005% solution displayed leftward bubble offset, resulting in a left-leaning jet that detached from the substrate by 8 ms and evolved into a fluid filament between 14–25 ms.
These observations align with prior studies attributing asymmetric jetting to pressure gradients between the spreading liquid film and the collapsing air cavity [34]. Specifically, the pressure differential drives fluid flow from regions of higher pressure (bubble-proximal zones) to lower pressure (bubble-distal zones), amplifying initial lateral displacements into macroscale directional biases. Such bubble-mediated flow steering underscores the critical role of gas-liquid interfacial topology in governing impact hydrodynamics.
As shown in Figure 8, the maximum spreading factor ( f m a x ) of aqueous solution bubble-containing droplets increased steadily with surfactant concentration (C) due to progressive surface tension (σ) reduction. For pure water (0% solution), f m a x measured approximately 4.02. Across the aqueous solution concentrations (0.0025–0.02%), f m a x exhibited a near-linear growth trend, rising from 4.07 to 4.26.
In summary, oil-based emulsions, suspension, and aqueous solutions all reduced the surface tension of the liquid, thereby enhancing the maximum spreading diameter of bubble-containing droplets. Among these, the aqueous solution exhibited the most significant effect on surface tension reduction. To achieve comparable surface tension levels, the aqueous solution was tested at the lowest concentration in this study.
During the deposition of bubble-containing droplets on hydrophilic surfaces, the central jetting phenomenon partially counteracted droplet spreading. This resulted in distinct spreading factor trends for bubble-containing droplets compared to solid droplets. Based on the Weber number (We) range in our experiments, a fitted empirical correlation (Figure 9) was established to predict the maximum spreading factor ( f m a x ) of bubble-containing droplets under similar conditions. The expression is
f m a x = 0.04 W e 0.508 + 3.21
Figure 9 illustrates the increasing trend of f m a x with rising We (i.e., decreasing surface tension). This relationship confirms that reduced surface tension promotes spreading.

3.2. Deposition of Bubble-Containing Droplets on Hydrophobic Plant Leaves

Previous sections have primarily focused on the deposition of bubble-containing droplets on hydrophilic surfaces. This section examines the deposition characteristics of pesticide bubble-containing droplets on hydrophobic plant leaves. For consistency with earlier studies, this section uses bubble-containing droplets with a bubble volume fraction of approximately 10%, impacting at 2.58 m/s.

3.2.1. Deposition of Oil-Based Emulsion Bubble-Containing Droplets on Hydrophobic Leaf Surfaces

When the oil-based emulsion concentration reaches 0.2%, the deposition process of bubble-containing droplets on hydrophobic leaf surfaces is characterized by distinct stages, as illustrated in Figure 10. At 4 ms, the bottom of the droplet spreads into a liquid film, forming a large hole that expands to the edge, leading to the rupture of the bottom diameter. A portion of the liquid splashes outward, while the remaining liquid retracts to the main body. By 8 ms, the retracting liquid divides into two parts: one part is the liquid that has retracted to the bottom, distributed horizontally; the other part is the central jet, which continues to move upward, distributed vertically. At 10 ms, driven by the rebound kinetic energy of the central jet and inertial forces, the retracting liquid rebounds upward and detaches from the surface. Between 21 and 26 ms, the retracting liquid is expelled outward, leaving almost no residual droplets on the leaf surface by 26 ms.
At an emulsion concentration of 0.4%, as depicted in Figure 11, the droplets adhere to the hydrophobic leaf surface. At 5 ms, the bottom of the emulsion droplet with bubbles starts to form pores, which subsequently enlarge and rupture, creating unstable ligament-like liquids on the surface. These unstable liquids either rebound, splash away, or remain on the leaf surface. By 9 ms, the splashed liquid has lost energy, reduced the rebound kinetic energy, and suppressed the retraction of the droplet. Between 9 ms and 26 ms, the retracted liquid is pulled upward by the inertia of the upward central jet (noted at 9 ms). This occurred at 0.2% concentration, but at 0.4% concentration, the retracted liquid adheres firmly to the leaf surface instead of leaving with the central jet. The central jet separates from the retracted liquid after failing to pull it away and undergoes secondary splashing (observed at 11 ms). At 26 ms, some small droplets remain on the leaf surface.
At an emulsion concentration of 0.6%, as shown in Figure 12, the mechanism of bottom film breakup and central jet splashing is similar to that at 0.2% and 0.4%. The central jet first causes top splashing, then separates from the retracted liquid, leading to secondary splashing. Between 9 ms and 14 ms, the retracted liquid is pulled upward by the jet and forms a water thread at 9 ms, yet it still adheres firmly to the leaf surface at 14 ms. At 26 ms, numerous small droplets remain on the leaf surface.
At an emulsion concentration of 0.8%, as depicted in Figure 13, the central jet separates from the retracting liquid at 9 ms, resulting in splashing. Between 21 ms and 26 ms, the retracting liquid adheres to the leaf surface rather than detaching. Small droplets remain on the leaf surface; the average diameter of seven such droplets measured is approximately 0.96 mm. Even as the emulsion concentration increases from 0.4% to 0.8%, the bubble-containing droplets continue to adhere to the hydrophobic leaf surface, highlighting the emulsion’s effective deposition characteristics.
Based on the above analysis, we can draw two conclusions. First, increasing the emulsion concentration promotes the deposition of bubble-containing droplets on the hydrophobic lotus leaf surface and enhances the adhesion of the droplet body. Second, in our experiment, the 0.4% emulsion concentration serves as a critical threshold for the transition of bubble-containing droplets from rebounding to adhering.

3.2.2. Deposition of Suspension Bubble-Containing Droplets on Hydrophobic Leaf Surfaces

The deposition of suspension bubble-containing droplets with concentrations ranging from 0.2% to 0.8% on lotus leaf surfaces is illustrated in Figure 14. Overall, all suspension bubble-containing droplets prepared from the suspension solution rebounded, unlike the emulsion bubble-containing droplets that transitioned from rebounding to adhering.
As shown in Figure 14a, for 0.2% suspension bubble-containing droplets, pores and edge finger-like splashing appeared at 5 ms. At 7 ms, the pore rupture caused the surrounding liquid to form ligaments, which broke and caused splashing, with edge droplets also being ejected from the tips of the finger-like structures. Between 10 ms and 25 ms, the droplet’s spread diameter retracted and rebounded.
In Figure 14b, for 0.4% suspension bubble-containing droplets, the retracted liquid moved upward at 18 ms and left the surface at 25 ms. For 0.6% suspension bubble-containing droplets in Figure 14c, the retracted liquid bounced upward at 14 ms, completed contraction in the air, and continued moving upward until it left the surface between 20 ms and 26 ms.
In Figure 14d, for 0.8% suspension bubble-containing droplets, pores appeared near the central jet at 3 ms, followed by the rupture of the bottom liquid film as the pores expanded. At 7 ms, the central jet’s top droplets splashed first, and then the bottom liquid film retracted along the arrow direction toward the red dashed line. Finally, an arc-shaped liquid ligament formed at 12 ms. At 15 ms, the ligament broke in the middle, with the right part splashing to the right at 25 ms and the left part rebounding above the leaf.
As shown in Figure 14, the deposition process of suspension bubble-containing droplets with concentrations from 0.2% to 0.6% indicates that, unlike emulsions, suspensions cannot make bubble-containing droplets adhere to the target surface. Each suspension droplet bounces high after collision.

3.2.3. Deposition of Aqueous Solutions Bubble-Containing Droplets on Hydrophobic Leaf Surfaces

The deposition of aqueous bubble-containing droplets with concentrations ranging from 0.0025% to 0.02% on lotus leaf surfaces is illustrated in Figure 15. Similar to the suspension droplets, all aqueous droplets rebounded, unlike the emulsion droplets that transitioned from rebounding to adhering.
As shown in Figure 15a, for 0.0025% aqueous bubble-containing droplets, the droplet contacted the surface as a sphere at 0 ms. At 5 ms, the droplet began to spread, with finger-like splashing at the edge and a relatively stable center. By 7 ms, the finger-like splashing intensified, with a central jet forming near the center and splashing at the edge. Between 10 ms and 15 ms, the droplet’s spread diameter gradually retracted, with surface liquid converging. At 15 ms, the retraction was nearly complete, resulting in a more compact droplet shape. At 21 ms, the droplet bounced off the surface.
For 0.005% aqueous bubble-containing droplets in Figure 15b, the droplet rapidly spread at 4 ms, with splashing at the edge and a central jet forming. By 7 ms, a distinct pore formed in the center, with the surrounding liquid converging to form unstable ligaments, causing some droplets to splash out. Between 10 ms and 16 ms, the droplet’s spread diameter continued to contract, with liquid gradually converging toward the center. At 21 ms, the droplet completed retraction and bounced off the surface.
In Figure 15c, for 0.01% aqueous bubble-containing droplets, the droplet finished spreading at 3 ms, with a jet forming in the center and the surrounding liquid expanding outward. At 6 ms, the pore expanded, with the surrounding liquid accelerating toward the edge, forming distinct finger-like splashes. Between 10 ms and 16 ms, the droplet’s spread diameter gradually contracted, with central liquid converging. At 21 ms, the droplet completed retraction and bounced off, exhibiting a pronounced rebound.
For 0.02% aqueous bubble-containing droplets in Figure 15d, the droplet spread at 4 ms, with splashing at the edge and a jet forming in the center. By 7 ms, unstable ligaments formed, with some droplets splashing out. Between 10 ms and 16 ms, the droplet’s spread diameter continued to contract, with liquid converging toward the center. At 21 ms, the droplet completed retraction and bounced off the surface.

4. Conclusions

In this paper, the deposition of bubble-containing droplets was studied using high-speed photomicrography. The effect of pesticide solutions on the deposition of bubble-containing droplets on hydrophilic and hydrophobic surfaces was investigated. It is found that pesticide solutions have a significant effect on the deposition process of the bubble-containing droplets. The main conclusions are as follows.
The deposition behavior of bubble-containing droplets is significantly different from that of dense droplets. Due to the presence of bubbles inside the droplet, a distinct rebounding jet forms during the deposition process. The position where the rebounding jet forms varies, primarily determined by the location of the bubble within the droplet. During the deposition of bubble-containing droplets, voids sometimes appear on the spreading surface.
On hydrophilic surfaces, the deposition processes of bubble-containing droplets with different pesticide solutions are similar. Droplet spreading is mainly influenced by surface tension. As the pesticide concentration increases, the surface tension continuously decreases, leading to an increase in the droplet-spreading diameter. A larger spreading diameter results in greater viscous dissipation, which reduces the height of the rebounding jet. Based on experimental data, a function curve of the maximum spread factor versus the dimensionless parameter We was fitted, with the expression f max = 0.04 W e 0.508 + 3.21 .
On hydrophobic lotus leaf surfaces, the deposition processes of bubble-containing droplets with different pesticide solutions show notable differences. For bubble-containing droplets of suspension and aqueous solution, the droplets ultimately rebound from the lotus leaf surface. For emulsion bubble-containing droplets, under low concentration conditions, the droplets also rebound from the surface. However, when the emulsion concentration increases to 0.4%, the droplets adhere to the lotus leaf surface. A possible explanation is that the oil phase in the emulsion can wet the hydrophobic surface.

Author Contributions

Methodology and project administration, C.G.; data acquisition, F.J.; writing—original draft preparation, M.Y.; writing—review and editing, C.K.; funding acquisition, C.K. All authors have read and agreed to the published version of the manuscript.

Funding

This research was funded by the National Natural Science Foundation of China (Nos. 51905220, 52311540154), Natural Science Foundation of Jiangsu Province, China (No. BK20231325) and a project funded by the Priority Academic Program Development of Jiangsu Higher Education Institutions (No. PAPD-2023-87).

Data Availability Statement

Data will be made available on request.

Acknowledgments

The authors thank the College of Agricultural Engineering of Jiangsu University for the experimental equipment.

Conflicts of Interest

The authors declare no conflicts of interest.

References

  1. Qin, W.-C.; Qiu, B.-J.; Xue, X.-Y.; Chen, C.; Xu, Z.-F.; Zhou, Q.-Q. Droplet deposition and control effect of insecticides sprayed with an unmanned aerial vehicle against plant hoppers. Crop Prot. 2016, 85, 79–88. [Google Scholar] [CrossRef]
  2. Wu, S.; Liu, J.Z.; Wang, J.S.; Hao, D.H.; Wang, R.K. The motion of strawberry leaves in an air-assisted spray field and its influence on droplet deposition. Trans. Asabe 2021, 64, 83–93. [Google Scholar] [CrossRef]
  3. Zhou, Q.; Xue, X.; Chen, C.; Cai, C.; Jiao, Y. Canopy deposition characteristics of different orchard pesticide dose models. Int. J. Agric. Biol. Eng. 2023, 16, 1–6. [Google Scholar] [CrossRef]
  4. Makhnenko, I.; Alonzi, E.R.; Fredericks, S.A.; Colby, C.M.; Dutcher, C.S. A review of liquid sheet breakup: Perspectives from agricultural sprays. J. Aerosol Sci. 2021, 157, 105805. [Google Scholar] [CrossRef]
  5. Li, J.; Nie, Z.; Chen, Y.; Ge, D.; Li, M. Development of boom posture adjustment and control system for wide spray boom. Agriculture 2023, 13, 2162. [Google Scholar] [CrossRef]
  6. Szarka, A.Z.; Kruger, G.R.; Golus, J.; Rodgers, C.; Perkins, D.; Brain, R.A. Spray drift deposition comparison of fluorimetry and analytical confirmation techniques. Pest Manag. Sci. 2021, 77, 4192–4199. [Google Scholar] [CrossRef] [PubMed]
  7. Zhang, C.; Zhai, C.; Zhang, M.; Zhang, C.; Zou, W.; Zhao, C. Staggered-Phase spray control: A method for eliminating the inhomogeneity of deposition in low-frequency pulse-width modulation (PWM) variable spray. Agriculture 2024, 14, 465. [Google Scholar] [CrossRef]
  8. Bueno, M.R.; da Cunha, J.P.A.R.; de Santana, D.G. Assessment of spray drift from pesticide applications in soybean crops. Biosyst. Eng. 2017, 154, 35–45. [Google Scholar] [CrossRef]
  9. Liao, J.; Hewitt, A.J.; Wang, P.; Luo, X.; Zang, Y.; Zhou, Z.; Lan, Y.; O’Donnell, C. Development of droplet characteristics prediction models for air induction nozzles based on wind tunnel tests. Int. J. Agric. Biol. Eng. 2019, 12, 1–6. [Google Scholar] [CrossRef]
  10. Liao, J.; Luo, X.; Wang, P.; Zhou, Z.; O’Donnell, C.C.; Zang, Y.; Hewitt, A.J. Analysis of the influence of different parameters on droplet characteristics and droplet size classification categories for air induction nozzle. Agronomy 2020, 10, 256. [Google Scholar] [CrossRef]
  11. Butts, T.R.; Luck, J.D.; Fritz, B.K.; Hoffmann, W.C.; Kruger, G.R. Evaluation of spray pattern uniformity using three unique analyses as impacted by nozzle, pressure, and pulse-width modulation duty cycle. Pest Manag. Sci. 2019, 75, 1875–1886. [Google Scholar] [CrossRef] [PubMed]
  12. Ferguson, J.C.; Chechetto, R.G.; O’Donnell, C.C.; Dorr, G.J.; Moore, J.H.; Baker, G.J.; Powis, K.J.; Hewitt, A.J. Determining the drift potential of Venturi nozzles compared with standard nozzles across three insecticide spray solutions in a wind tunnel. Pest Manag. Sci. 2016, 72, 1460–1466. [Google Scholar] [CrossRef]
  13. Dafsari, R.A.; Yu, S.; Choi, Y.; Lee, J. Effect of geometrical parameters of air-induction nozzles on droplet characteristics and behaviour. Biosyst. Eng. 2021, 209, 14–29. [Google Scholar] [CrossRef]
  14. McArtney, S.J.; Obermiller, J.D. Comparative performance of air-induction and conventional nozzles on an axial fan sprayer in medium density apple orchards. Horttechnology 2008, 18, 365–371. [Google Scholar] [CrossRef]
  15. De Cock, N.; Massinon, M.; Salah, S.O.T.; Lebeau, F. Investigation on optimal spray properties for ground based agricultural applications using deposition and retention models. Biosyst. Eng. 2017, 162, 99–111. [Google Scholar] [CrossRef]
  16. Shi, Q.; Mao, H.; Guan, X. Numerical simulation and experimental verification of the deposition concentration of an unmanned aerial vehicle. Appl. Eng. Agric. 2019, 35, 367–376. [Google Scholar] [CrossRef]
  17. Song, M.; Hu, D.; Zheng, X.; Wang, L.; Yu, Z.; An, W.; Na, R.; Li, C.; Li, N.; Lu, Z.; et al. Enhancing droplet deposition on wired and curved superhydrophobic leaves. ACS Nano 2019, 13, 7966–7974. [Google Scholar] [CrossRef]
  18. Xi, T.; Li, C.; Qiu, W.; Wang, H.; Lv, X.; Han, C.; Ahmad, F. Droplet deposition behavior on a pear leaf surface under wind-induced vibration. Appl. Eng. Agric. 2020, 36, 913–926. [Google Scholar] [CrossRef]
  19. Cheng, X.; Sun, T.-P.; Gordillo, L. Drop impact dynamics: Impact force and stress distributions. Annu. Rev. Fluid Mech. 2022, 54, 57–81. [Google Scholar] [CrossRef]
  20. Philippi, J.; Lagree, P.-Y.; Antkowiak, A. Drop impact on a solid surface: Short-time self-similarity. J. Fluid Mech. 2016, 795, 96–135. [Google Scholar] [CrossRef]
  21. Yarin, A.L. Drop impact dynamics: Splashing, spreading, receding, bouncing. Annu. Rev. Fluid Mech. 2006, 38, 159–192. [Google Scholar] [CrossRef]
  22. Jiang, X.; Zhou, Y.; Xu, E.; Meng, X.; Wu, G.; Li, H.Z. Dynamical behaviors of water drop impact on superhydrophobic surfaces with the macro-textured cavity. Colloids Surf. A-Physicochem. Eng. Asp. 2023, 657, 130583. [Google Scholar] [CrossRef]
  23. Zhao, R.; Yu, M.; Sun, Z.; Li, L.-J.; Guo, X.-Y.; Xu, Y.; Wu, X.-M. Regulating droplet impact and wetting behaviors on hydrophobic leaves using a nonionic surfactant. J. Colloid Interface Sci. 2023, 629, 926–937. [Google Scholar] [CrossRef] [PubMed]
  24. Zhao, R.; Yu, M.; Sun, Z.; Pan, S.-H.; Wang, Y.-M.; Ma, Y.-J.; Guo, X.-Y.; Xu, Y.; Wu, X.-M. Effect of hydrophilic chain length on the impact and wetting behavior of nonionic surfactants regulating droplets on hydrophobic surfaces. Surf. Interfaces 2023, 41, 103260. [Google Scholar] [CrossRef]
  25. Sanjay, V.; Chantelot, P.; Lohse, D. When does an impacting drop stop bouncing? J. Fluid Mech. 2023, 958, A26. [Google Scholar] [CrossRef]
  26. Hu, J.; Liu, C.; Wang, Z.; Li, Y.; Song, J.; Liu, Y.; Chu, X. Motion model for describing the quantity of air in droplets through changing the structure of air induction nozzle. Int. J. Agric. Biol. Eng. 2021, 14, 35–40. [Google Scholar] [CrossRef]
  27. Post, S.L. Drift of droplets from air-induction nozzles. Trans. Asabe 2019, 62, 1683–1687. [Google Scholar] [CrossRef]
  28. Gong, C.; Li, D.; Kang, C. Effect of oil-based emulsion on air bubbles in the spray sheet produced through the air-induction nozzle. Pest Manag. Sci. 2022, 78, 5347–5357. [Google Scholar] [CrossRef]
  29. Gulyaev, I.P.; Solonenko, O.P. Hollow droplets impacting onto a solid surface. Exp. Fluids 2013, 54, 1432. [Google Scholar] [CrossRef]
  30. Li, D.; Zhang, D.; Zheng, Z. Numerical analysis of hollow droplet impacts on a dry flat surface. Int. J. Heat Mass Transf. 2019, 129, 753–763. [Google Scholar] [CrossRef]
  31. Nasiri, M.; Amini, G.; Moreau, C.; Dolatabadi, A. Hollow droplet impact on a solid surface. Int. J. Multiph. Flow 2021, 143, 103740. [Google Scholar] [CrossRef]
  32. Yang, W.; Jia, W.; Ou, M.; Zhong, W.; Jiang, L.; Wang, X. Effect of Physical Properties of an Emulsion Pesticide on the Atomisation Process and the Spatial Distribution of Droplet Size. Agriculture 2022, 12, 949. [Google Scholar] [CrossRef]
  33. Yang, W.; Zhong, W.; Jia, W.; Ou, M.; Dong, X.; Zhang, T.; Ding, S.; Yu, P. The effect of oil-in-water emulsion pesticide on the evolution of liquid sheet rim disintegration and the spraying distribution. Crop Prot. 2024, 177, 106547. [Google Scholar] [CrossRef]
  34. Cao, C.; Liu, M.; Ma, X.; Chen, Y.; Huang, Q. Enhancing droplets deposition on superhydrophobic plant leaves by bio-based surfactant: Experimental characterization and molecular dynamics simulations. J. Mol. Liq. 2023, 387, 122696. [Google Scholar] [CrossRef]
Figure 1. Schematic diagram of the visualization test device.
Agronomy 15 01172 g001
Figure 2. Viscosity measuring device: (a) R/S rheometer; (b) rotor.
Agronomy 15 01172 g002
Figure 3. The deposition of bubble-containing droplets of different emulsion concentrations on a hydrophilic surface: (a) 0.1% emulsion; (b) 0.2% emulsion; (c) 0.4% emulsion; (d) 0.8% emulsion.
Agronomy 15 01172 g003
Figure 4. Change in the maximum spreading factor of emulsion bubble-containing droplets with concentration.
Agronomy 15 01172 g004
Figure 5. The deposition of bubble-containing droplets of different suspension agent concentrations on a hydrophilic surface: (a) 0.1% suspension; (b) 0.2% suspension; (c) 0.4% suspension; (d) 0.8% suspension.
Agronomy 15 01172 g005
Figure 6. Change in the maximum spreading factor of suspension agent bubble-containing droplets with concentration.
Agronomy 15 01172 g006
Figure 7. The deposition of bubble-containing droplets of different aqueous solution concentrations on a hydrophilic surface: (a) 0.0025% aqueous solution; (b) 0.005% aqueous solution; (c) 0.01% aqueous solution; (d) 0.02% aqueous solution.
Agronomy 15 01172 g007
Figure 8. Change in the maximum spreading factor of aqueous solution bubble-containing droplets with concentration.
Agronomy 15 01172 g008
Figure 9. The data on the maximum spreading factor of bubble-containing droplets.
Agronomy 15 01172 g009
Figure 10. The deposition of bubble-containing droplets with 0.2% emulsion concentration on the leaf surface, where the red horizontal line indicates the height of the leaf.
Agronomy 15 01172 g010
Figure 11. The deposition of bubble-containing droplets with 0.4% emulsion concentration on the leaf surface.
Agronomy 15 01172 g011
Figure 12. The deposition of bubble-containing droplets with 0.6% emulsion concentration on the leaf surface, where the red horizontal line indicates the height of the leaf.
Agronomy 15 01172 g012
Figure 13. The deposition of bubble-containing droplets with 0.8% emulsion concentration on the leaf surface.
Agronomy 15 01172 g013
Figure 14. The deposition of bubble-containing droplets with 0.2~0.8% concentration of suspension agent on the lotus surface, where the red horizontal line indicates the height of the leaf and droplets: (a) 0.2% suspension; (b) 0.4% suspension; (c) 0.6% suspension; (d) 0.8% suspension.
Agronomy 15 01172 g014
Figure 15. The deposition of bubble-containing droplets with concentrations of aqueous solution 0.0025~0.02% on the lotus surface, where the red horizontal line indicates the height of the leaf and droplets: (a) 0.0025% aqueous solution; (b) 0.005% aqueous solution; (c) 0.01% aqueous solution; (d) 0.02% aqueous solution.
Agronomy 15 01172 g015
Table 1. Measurement of surface tension and dynamic viscosity of the oil-based emulsion.
ConcentrationSurface Tension (m N/m)Dynamic Viscosity (mPa·s)
0%72.140.83
0.1%43.400.81
0.2%38.760.78
0.4%34.730.80
0.8%33.640.86
Table 2. Measurement of surface tension and dynamic viscosity of the suspension age.
ConcentrationSurface Tension (m N/m)Dynamic Viscosity (mPa·s)
0%72.140.83
0.1%64.421.04
0.2%53.601.13
0.4%45.931.20
0.8%37.331.21
Table 3. Measurement of surface tension and dynamic viscosity of aqueous solutions.
ConcentrationSurface Tension (m N/m)Dynamic Viscosity (mPa·s)
0%72.140.83
0.0025%70.290.87
0.0050%64.910.86
0.01%52.680.83
0.02%31.100.80
Disclaimer/Publisher’s Note: The statements, opinions and data contained in all publications are solely those of the individual author(s) and contributor(s) and not of MDPI and/or the editor(s). MDPI and/or the editor(s) disclaim responsibility for any injury to people or property resulting from any ideas, methods, instructions or products referred to in the content.

