1. Introduction
Citrus, a highly valuable fruit crop globally, is packed with essential nutrients such as vitamins, carotenoids, and dietary fiber. It also contains bioactive compounds like flavonoids and limonene, making it valuable for both consumption and medicinal purposes [
1]. A key factor in determining fruit quality is its ripening stage, which is typically classified manually by field experts. However, this is a labor-intensive and error-prone process, particularly under complex natural conditions which require a high level of expertise from the operator [
2]. In recent years, to address the growing gap between population growth and labor shortages, the application of agricultural robotics in fruit harvesting has been increasing significantly [
3]. Therefore, developing a lightweight, efficient, and accurate citrus ripeness detection model is crucial for enabling automated citrus harvesting.
Recently, computer vision has gained significant attention in fruit ripeness detection owing to its non-contact, high-accuracy, and fast detection advantages. Early studies mainly focused on color, texture, and morphology. For example, Malik et al. converted RGB images to the HSV color space and achieved 81.6% accuracy in tomato detection tasks [
4]. The method proposed by Ling et al. integrates AdaBoost with color analysis for tomato detection and has been successfully adopted by harvesting robots [
5]. However, traditional feature extraction methods struggle in complex environments due to noise and lighting variations. With deep learning advancements, models including LeNet [
6], AlexNet [
7], VGG [
8], GoogleNet [
9], and ResNet [
10] have further promoted the application of CNNs to complex tasks. Deep learning technology has shown significant advantages in agriculture, with researchers applying it to agricultural applications. For instance, Fan et al. combined dark channel enhancement and YOLOv5 for strawberry ripeness identification, achieving over 90% accuracy [
11]. Wang et al. optimized Faster R-CNN to detect the ripeness of tomatoes, demonstrating remarkable performance in difficult scenarios [
12].
Within the context of smart agriculture, deep learning has shown great potential, but research on citrus ripeness detection involving complex shapes and color variations remains limited. To achieve more accurate detection in complex orchard scenes, Xu et al. proposed HPL-YOLOv4, a modified version of the YOLOv4 architecture [
13]. To enhance green citrus detection in natural conditions, Zheng et al. developed YOLO BP by introducing Bi-PANet to better integrate features across layers [
14]. However, neither approach considered the ripeness information, limiting their effectiveness. A two-stage ripeness detection framework was developed by Chen et al., combining YOLOv5 for identifying fruit regions with saliency-based analysis for ripeness classification [
15]. While insightful, its high computational cost may hinder real-time harvesting in large orchards. Moreover, the green appearance of unripe citrus fruits is often similar to the color of surrounding foliage, leading to significant missed detections. Some unripe fruits also exhibit both orange and green hues, making them visually similar to ripe fruits and thus prone to misclassification [
16]. Therefore, it is necessary to develop a lightweight and accurate detection framework that can perform robustly in complex orchard environments and can support real-time applications.
To handle the aforementioned difficulties, recent advancements in model architectures and attention mechanisms offer new opportunities. Transformer-based detectors such as DETR [
17] and RT-DETR [
18] introduce global attention, which enables better modeling of contextual relationships and improves robustness to scale and occlusion issues. RT-DETR, in particular, combines the global information processing capability of transformers with the efficient feature extraction capability of convolutional neural networks (CNNs), aiming to achieve real-time object detection while maintaining high accuracy. In terms of design, RT-DETR removes the complex candidate box generation and non-maximum suppression (NMS) steps commonly used in traditional object detection, instead adopting a direct prediction method for object bounding boxes and class labels from feature maps. This end-to-end design not only simplifies the model structure but also reduces computational resource consumption, enabling RT-DETR to operate on edge devices and meet real-time application requirements.
Meanwhile, visual saliency detection, inspired by human attention mechanisms, has shown promise in guiding neural networks toward informative regions. Despite its potential for enhancing feature extraction, the integration of saliency priors directly into object detection pipelines remains limited, particularly in agricultural scenarios such as citrus ripeness detection. Existing approaches like Chen et al.’s [
15] perform detection first and then crop individual fruit regions for separate saliency-guided classification, rather than embedding saliency cues within the detection process itself. This two-stage strategy increases computational complexity and limits real-time applicability in large-scale orchard environments. Traditional saliency algorithms such as the Itti model [
19] and FT [
20] are efficient but inadequate in complex natural scenes. Deep learning-based saliency models offer better accuracy but require large, labeled datasets and high computational costs. In comparison, traditional color-based saliency detection methods offer greater robustness and interpretability under low-resource and small-sample conditions. In light of this, this study leverages techniques from traditional saliency detection methods, such as color space transformation and grayscale mapping, to enhance the model’s overall detection effectiveness. By combining lightweight saliency priors with modern detection frameworks like RT-DETR, we can improve feature focus and model efficiency, offering a promising solution that distinguishes itself from traditional approaches.
Building upon the advancements in detection frameworks and saliency-guided feature enhancement, this paper presents an innovative citrus ripeness detection method that integrates visual saliency priors with the improved RT-DETR model, named LightSal-RTDETR. LightSal-RTDETR integrates visual saliency priors to enhance feature extraction, incorporates an improved backbone with the iRMB-cascaded block combining the cascaded group attention (CGA) mechanism and the inverted residual mobile block (iRMB), and introduces an efficient module that combines cross-stage partial networks with gated and partial convolution mechanisms (E-CSPPC) to reduce computational cost. In addition, the loss function is optimized by combining Inner-IoU and SIoU for more precise bounding box regression. Considering the absence of publicly available citrus ripeness detection datasets, we also constructed a comprehensive dataset covering a wide range of backgrounds, distances, and lighting conditions to support robust model training and evaluation.
The principal innovations and contributions of this work are described as follows:
Establishment of a citrus ripeness dataset. A citrus ripeness dataset was developed under various backgrounds, distances, and lighting conditions, resulting in greater adaptability and precision under a wide range of environments. This provides a robust foundation for training models capable of handling complex orchard scenarios.
iRMB-cascaded block. A new iRMB-cascaded block was designed by integrating the CGA mechanism with the iRMB, enhancing the backbone’s residual structure. This integration improves feature extraction efficiency while reducing computational load without compromising performance.
E-CSPPC module. A novel E-CSPPC module was introduced to minimize unnecessary computations and memory usage, enhancing the efficiency of the lightweight network and further optimizing the model’s performance under resource-constrained conditions.
Optimized loss function. The loss function was refined by combining Inner-IoU and SIoU, resulting in more accurate bounding box regression, thereby improving overall detection precision.
Visual saliency maps-based initialization. A new weight transfer strategy was applied, where model weights trained on a combination of visual saliency maps and RGB images were used to initialize the new model. This strategy facilitates more efficient extraction of key image features by the model.
2. Materials and Methods
2.1. Data Acquisition and Dataset Construction
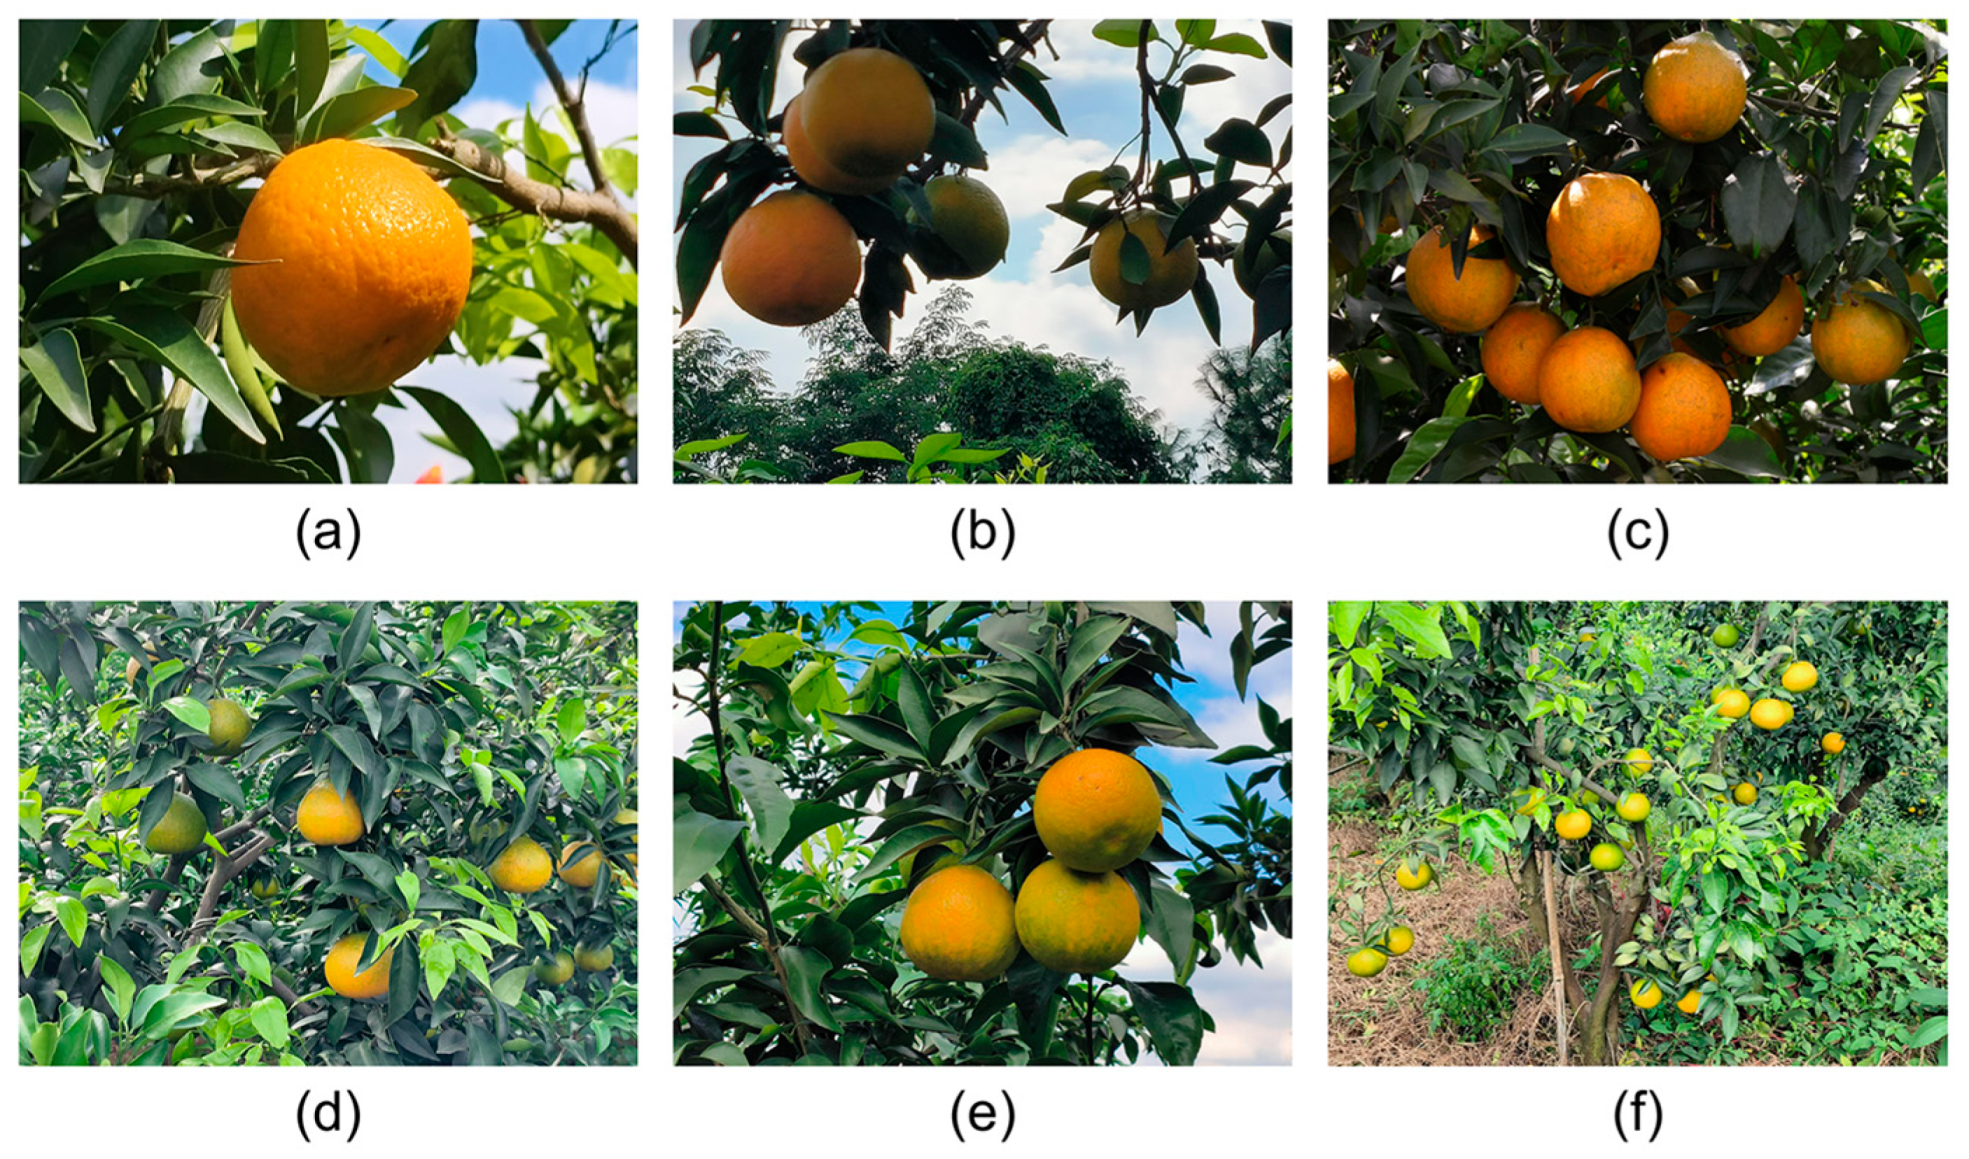
The citrus image dataset used in this study was collected through on-site photography by research team members from orchards in Meishan City, Sichuan Province, China. The images were captured using a Canon R-10 (Canon Inc., Tokyo, Japan) and an OPPO Reno8 Pro+ mobile phone (Guangdong OPPO Mobile Telecommunications Corp., Ltd., Dongguan, China), covering citrus fruits at different growth stages. The dataset consists of 1912 images captured under various lighting conditions, capture distances, and levels of occlusion, with a resolution of 4096 × 3072 pixels. It includes 9144 citrus targets, of which 4287 were ripe and 4857 were unripe. All images are stored in JPEG format, which can effectively control the file volume while ensuring high image quality.
Figure 1 illustrates citrus fruits at various stages of ripeness within complex environmental settings.
The classification criteria of mature and immature fruits combined the shooting time and biological characteristics: images of immature fruits were mainly collected in October 2024, while mature fruits were concentrated in December 2024. At the same time, the shape characteristics of citrus fruits were combined for comprehensive judgment. Unripe citrus fruits are usually green or yellow-green, indicating that they have yet to reach the optimal harvesting period. Ripe citrus fruits, on the other hand, are considered to be at the ideal harvesting stage, characterized by an orange color, which indicates their full ripeness. At this stage, picking will not negatively affect the final product quality. Based on specified characteristics, citrus images were annotated using LabelImg [
21], and the bounding box labels were saved in a YOLO-compatible text format. Unripe citrus fruits were annotated as ‘unripe_mandarin’, typically exhibiting a green to yellowish-green peel, while ripe citrus fruits were labeled as ‘mandarin’, characterized by an orange peel. During the annotation process, each citrus fruit was enclosed with a tightly fitted rectangular bounding box following its contour. In cases where fruits were overlapped or partially occluded by branches and leaves, the bounding boxes were determined by estimating the complete contours of the fruits based on their visible regions. A total of 1339, 188, and 385 images were allocated to the training, validation, and test sets, respectively, using a 7:1:2 split. This split ensures a sufficiently large training set while maintaining a larger test set, which contributes to a more robust model evaluation. These images, collected from real citrus orchards, present challenges for ripeness detection, such as overlapping, occlusion, visual similarity to the orchard background, and dense target distribution.
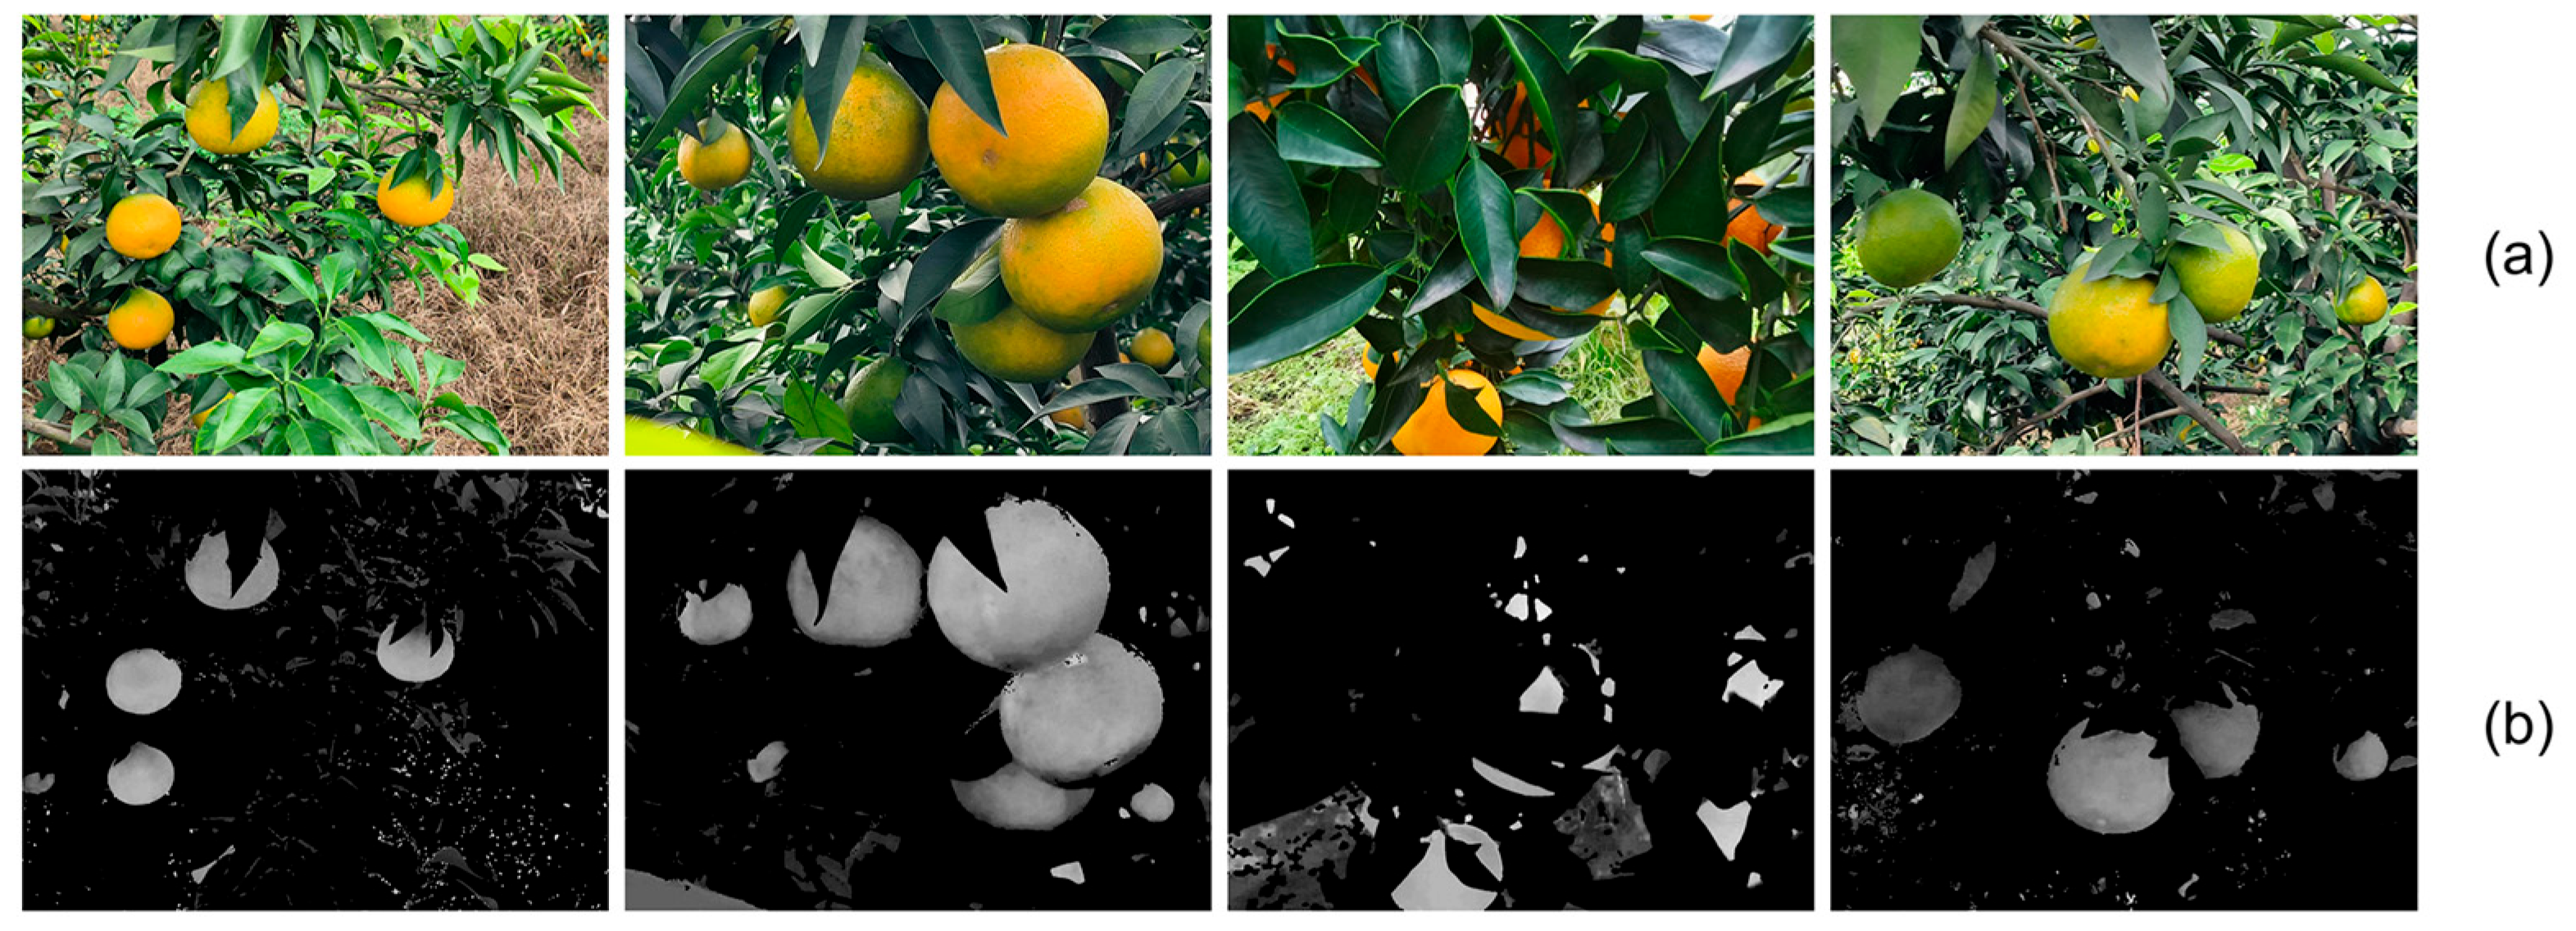
2.2. Generation of Visual Saliency Maps
To highlight citrus targets and enhance ripeness differences, this study introduces a simple visual saliency map generation strategy that integrates traditional image processing techniques with task-specific adaptations. First, images are converted into the HSV domain, in which the hue, saturation, and value channels are employed to filter the citrus color range (from orange to green). A binary mask is generated by applying appropriate color thresholds to separate ripe and unripe fruit regions. To enhance regional continuity and eliminate noise, morphological operations (closing and opening) are applied to refine the mask. Next, adaptive grayscale mapping is applied to citrus regions based on their hue distribution, such that ripe orange areas appear with high brightness, unripe green areas with medium brightness, and the background with the lowest brightness. Specifically, the maximum grayscale value for ripe regions is defined as
, and the minimum grayscale value for unripe regions as
. Linear mapping is performed using the following equation:
where
and
represent the lower and upper hue limits for orange and green, respectively. The resulting saliency maps effectively highlight the ripeness-related features of citrus fruits in complex environments, facilitating downstream object detection tasks. Examples of the generated visual saliency maps are shown in
Figure 2. Notably, during the initial training stage, the generated visual saliency maps are fed into the model alongside the original RGB images to jointly guide feature extraction. The obtained model weights, enriched with prior saliency knowledge, are later used for initializing the final model, as detailed in
Section 2.7.
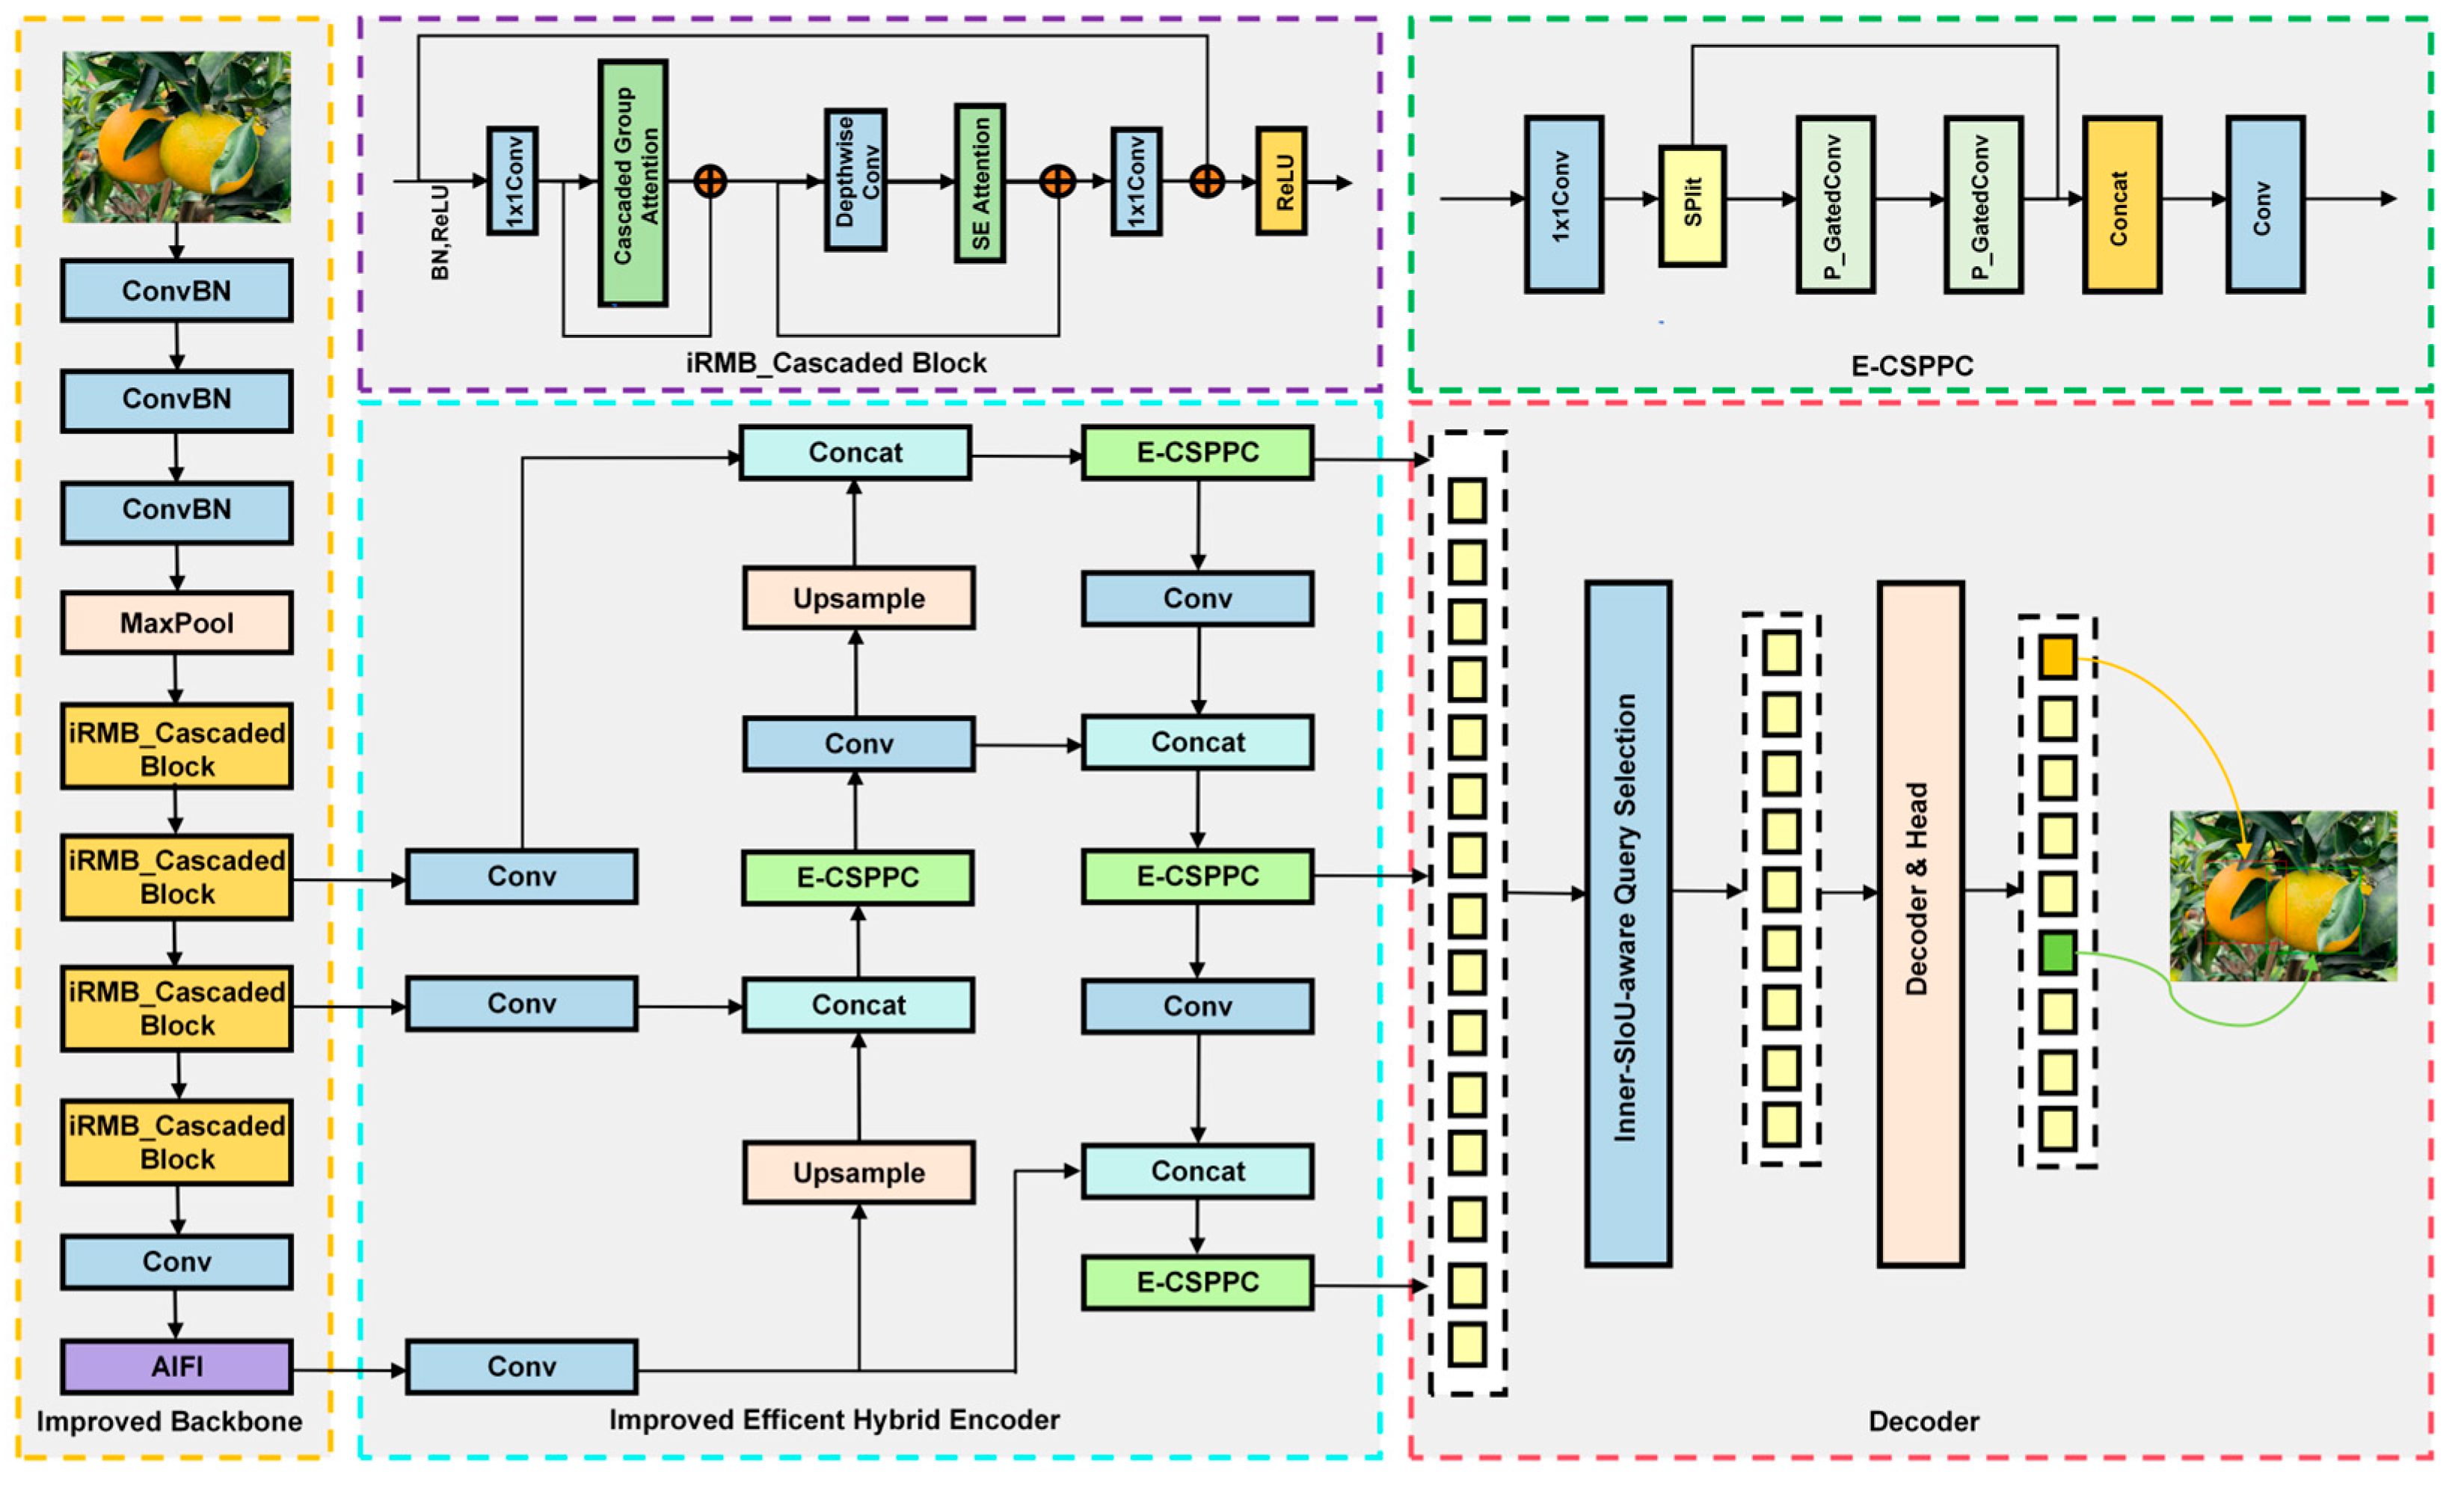
2.3. The LightSal-RTDETR Model Architecture
LightSal-RTDETR is a lightweight model designed to efficiently detect citrus ripeness in natural environments. RT-DETR simplifies the detection pipeline by removing components such as anchor generation and NMS, achieving an effective balance between accuracy and model complexity. However, in practical applications, limited hardware resources remain a challenge, highlighting the need to reduce computational load. This study proposes the LightSal-RTDETR model, which addresses these issues through a lightweight architectural design.
In LightSal-RTDETR, the CGA mechanism [
22] is integrated with the iRMB [
23] to form the iRMB-cascaded block module, which strengthens the residual structure of the backbone network. This integration improves feature extraction efficiency while reducing computational complexity. Additionally, to further minimize redundant computation, the model employs partial convolution (PConv) [
24] to refine the RepC3 module, resulting in the proposed E-CSPPC module. For the loss function, the model combines Inner-IoU [
25] with SIoU [
26], forming a new Inner-SIoU to enhance the accuracy of bounding box regression. Moreover, A weight transfer strategy is adopted, where weights jointly trained on visual saliency maps and RGB images are used for model initialization. This improves feature localization and object detection performance.
Figure 3 presents the overall architecture of LightSal-RTDETR.
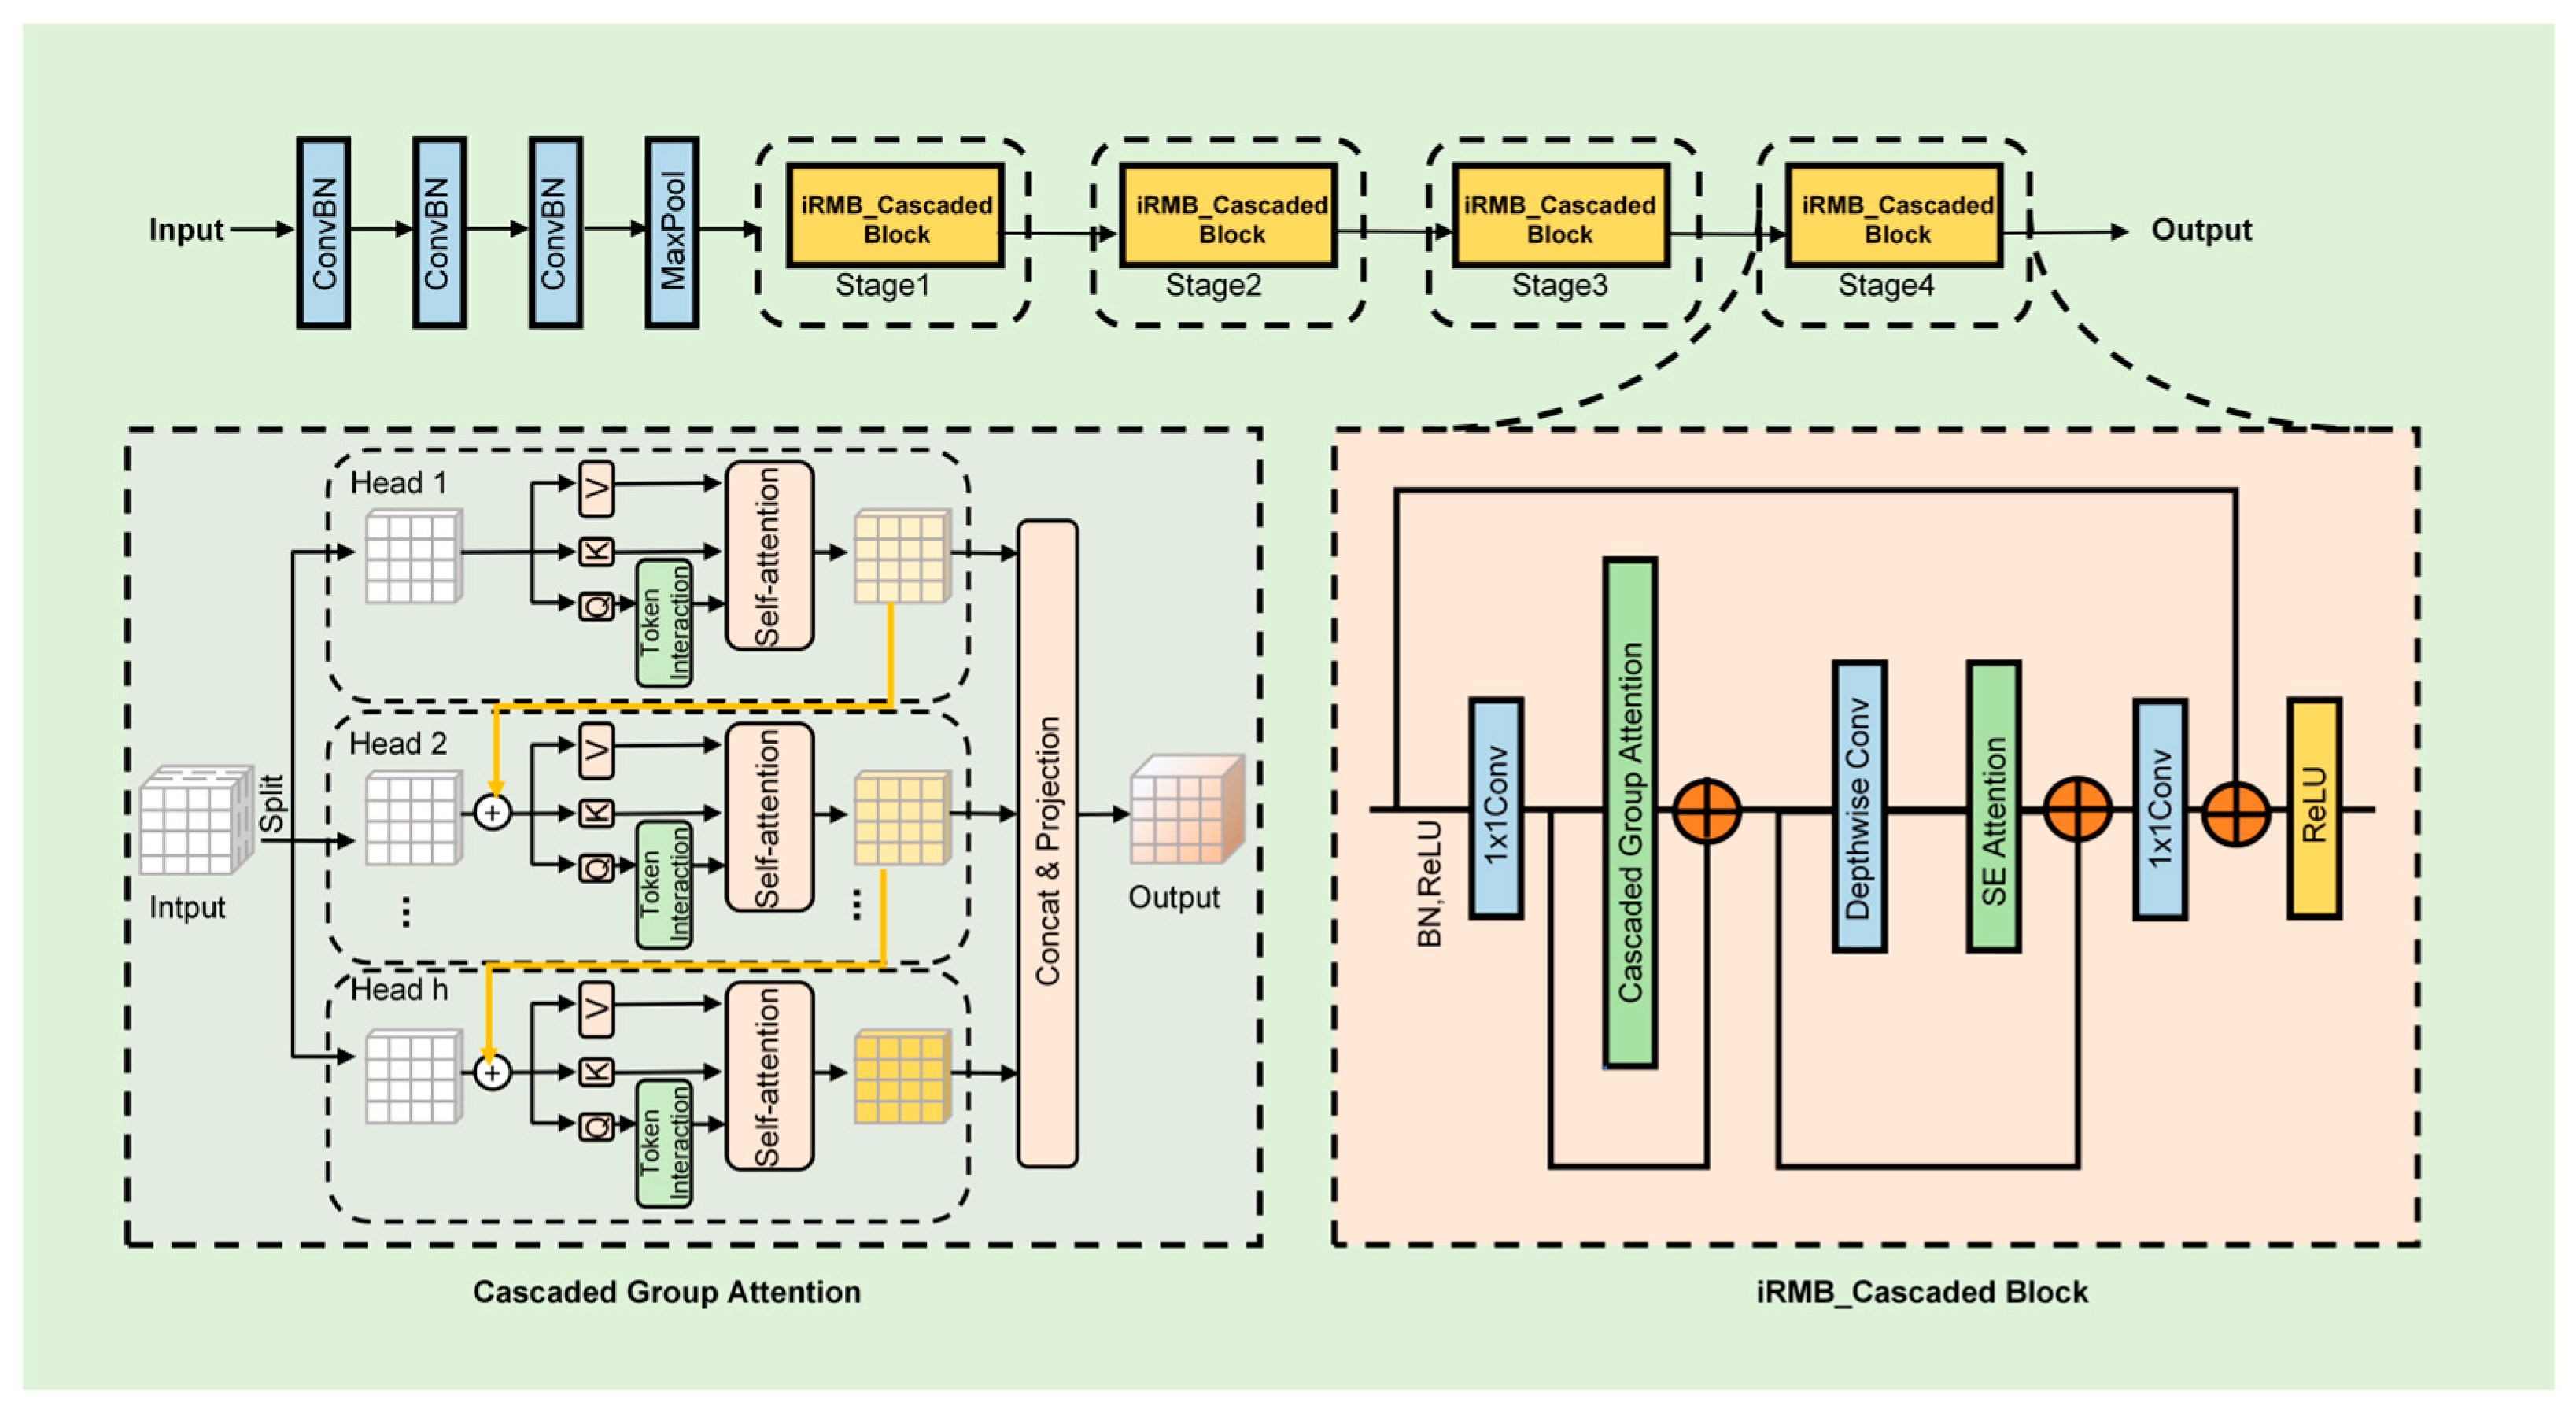
2.4. Improved Backbone
The ResNet18 backbone consists of a series of basic block modules, which use skip connections to introduce identity mappings, thus enhancing gradient flow and mitigating the vanishing gradient issue [
10]. To enhance feature extraction capabilities, this study integrates the CGA mechanism and the iRMB into the basic block structure. The improved backbone architecture is illustrated in
Figure 4.
CGA enhances the feature extraction process, enabling the model to better capture intricate patterns by employing a cascaded attention mechanism across multiple feature groups. Each attention head is assigned a distinct subset of feature channels, structurally partitioning the attention computations across heads to improve representation diversity and efficiency [
22]. The attention mechanism is mathematically formulated as follows:
The input feature
is divided into h segments, denoted as
, where h is the total number of attention heads. The j-th attention head performs self-attention on its corresponding segment
. Each head uses the projection matrices
,
, and
to transform its segment into query, key, and value subspaces, respectively. After computing attention outputs for all heads, a linear projection
is applied to the concatenated result to restore the original dimensionality. To increase representational capacity, CGA projects the Q, K, and V embeddings onto enhanced feature subspaces that encode more diverse and discriminative information. Attention maps are computed in a cascaded sequence, where the output of each head serves as input to the next, enabling progressive refinement of the feature representations.
As shown in Equation (4),
is the sum of the j-th input split
and the output
from the (j − 1)-th head (calculated by Equations (2) and (3)), which replaces
as the new input for the j-th head in the self-attention computation. After the Q projection, a token interaction layer is incorporated to help the self-attention mechanism [
27] capture local and global contextual information, further enhancing the expressiveness of features. This cascaded design, similar to group convolutions [
28], reduces floating-point operations (FLOPs) and parameters by providing each attention head with different feature splits, which increases the diversity of the attention maps. Moreover, this design increases network depth, further improving model capacity without adding extra parameters.
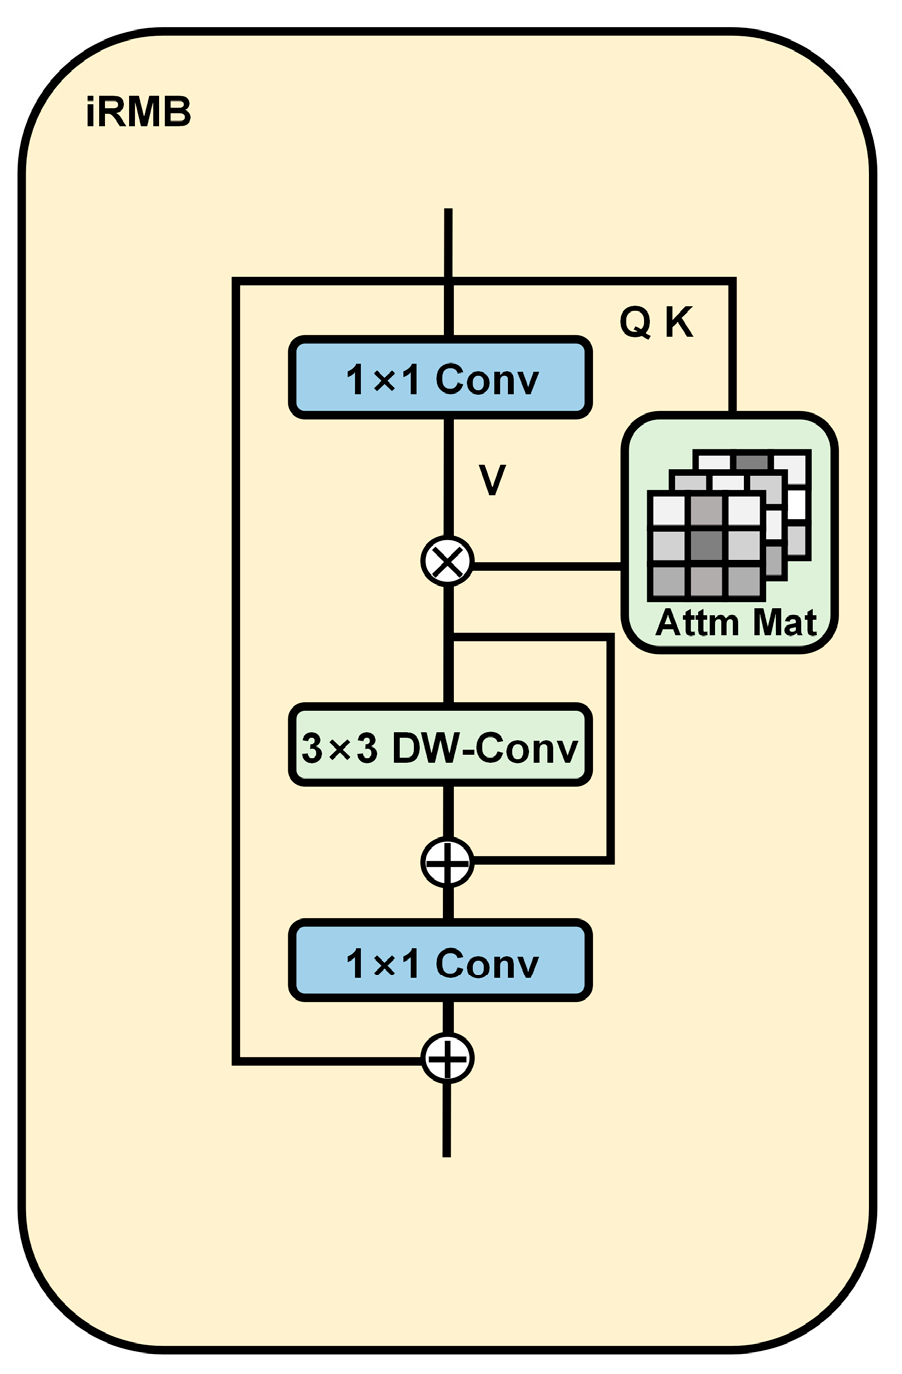
To extract rich ripeness information from complex orchard environments while maintaining a lightweight model, we also employed the iRMB [
23], integrating it into the backbone network for feature extraction. iRMB is a hybrid network module that integrates depthwise separable convolution [
29] (3 × 3 DW-Conv) with a self-attention mechanism. A 1 × 1 convolution is employed to reduce and expand the channel dimensions, enhancing computational efficiency. The depthwise separable convolution effectively captures spatial patterns, while the attention mechanism models global feature dependencies. The architectural design of iRMB is depicted in
Figure 5. Additionally, the SE module [
30] was introduced to reweight channels based on global information and is positioned after the depthwise convolution, as depicted in
Figure 4.
The iRMB-cascaded block integrates the strengths of both CGA and iRMB mechanisms, creating a powerful feature extraction module that enhances the ability to capture complex feature relationships while maintaining computational efficiency, as detailed in
Figure 4. CGA strengthens the ability to capture complex feature relationships by applying cascaded attention across different groups, thereby improving cross-group correlation modeling. Meanwhile, the iRMB mechanism optimizes internal information flow, enhancing the robustness and accuracy of feature representations while maintaining computational efficiency. Incorporating the iRMB-cascaded block into ResNet18 not only enhances feature extraction capability but also improves overall performance without increasing computational complexity.
2.5. Improved Efficient Hybrid Encoder
RT-DETR is composed of a backbone, an encoder, and a decoder. Its notable detection performance mainly benefits from the efficient hybrid encoder, which effectively handles multi-scale feature representation by decoupling intra-scale interactions and cross-scale fusion [
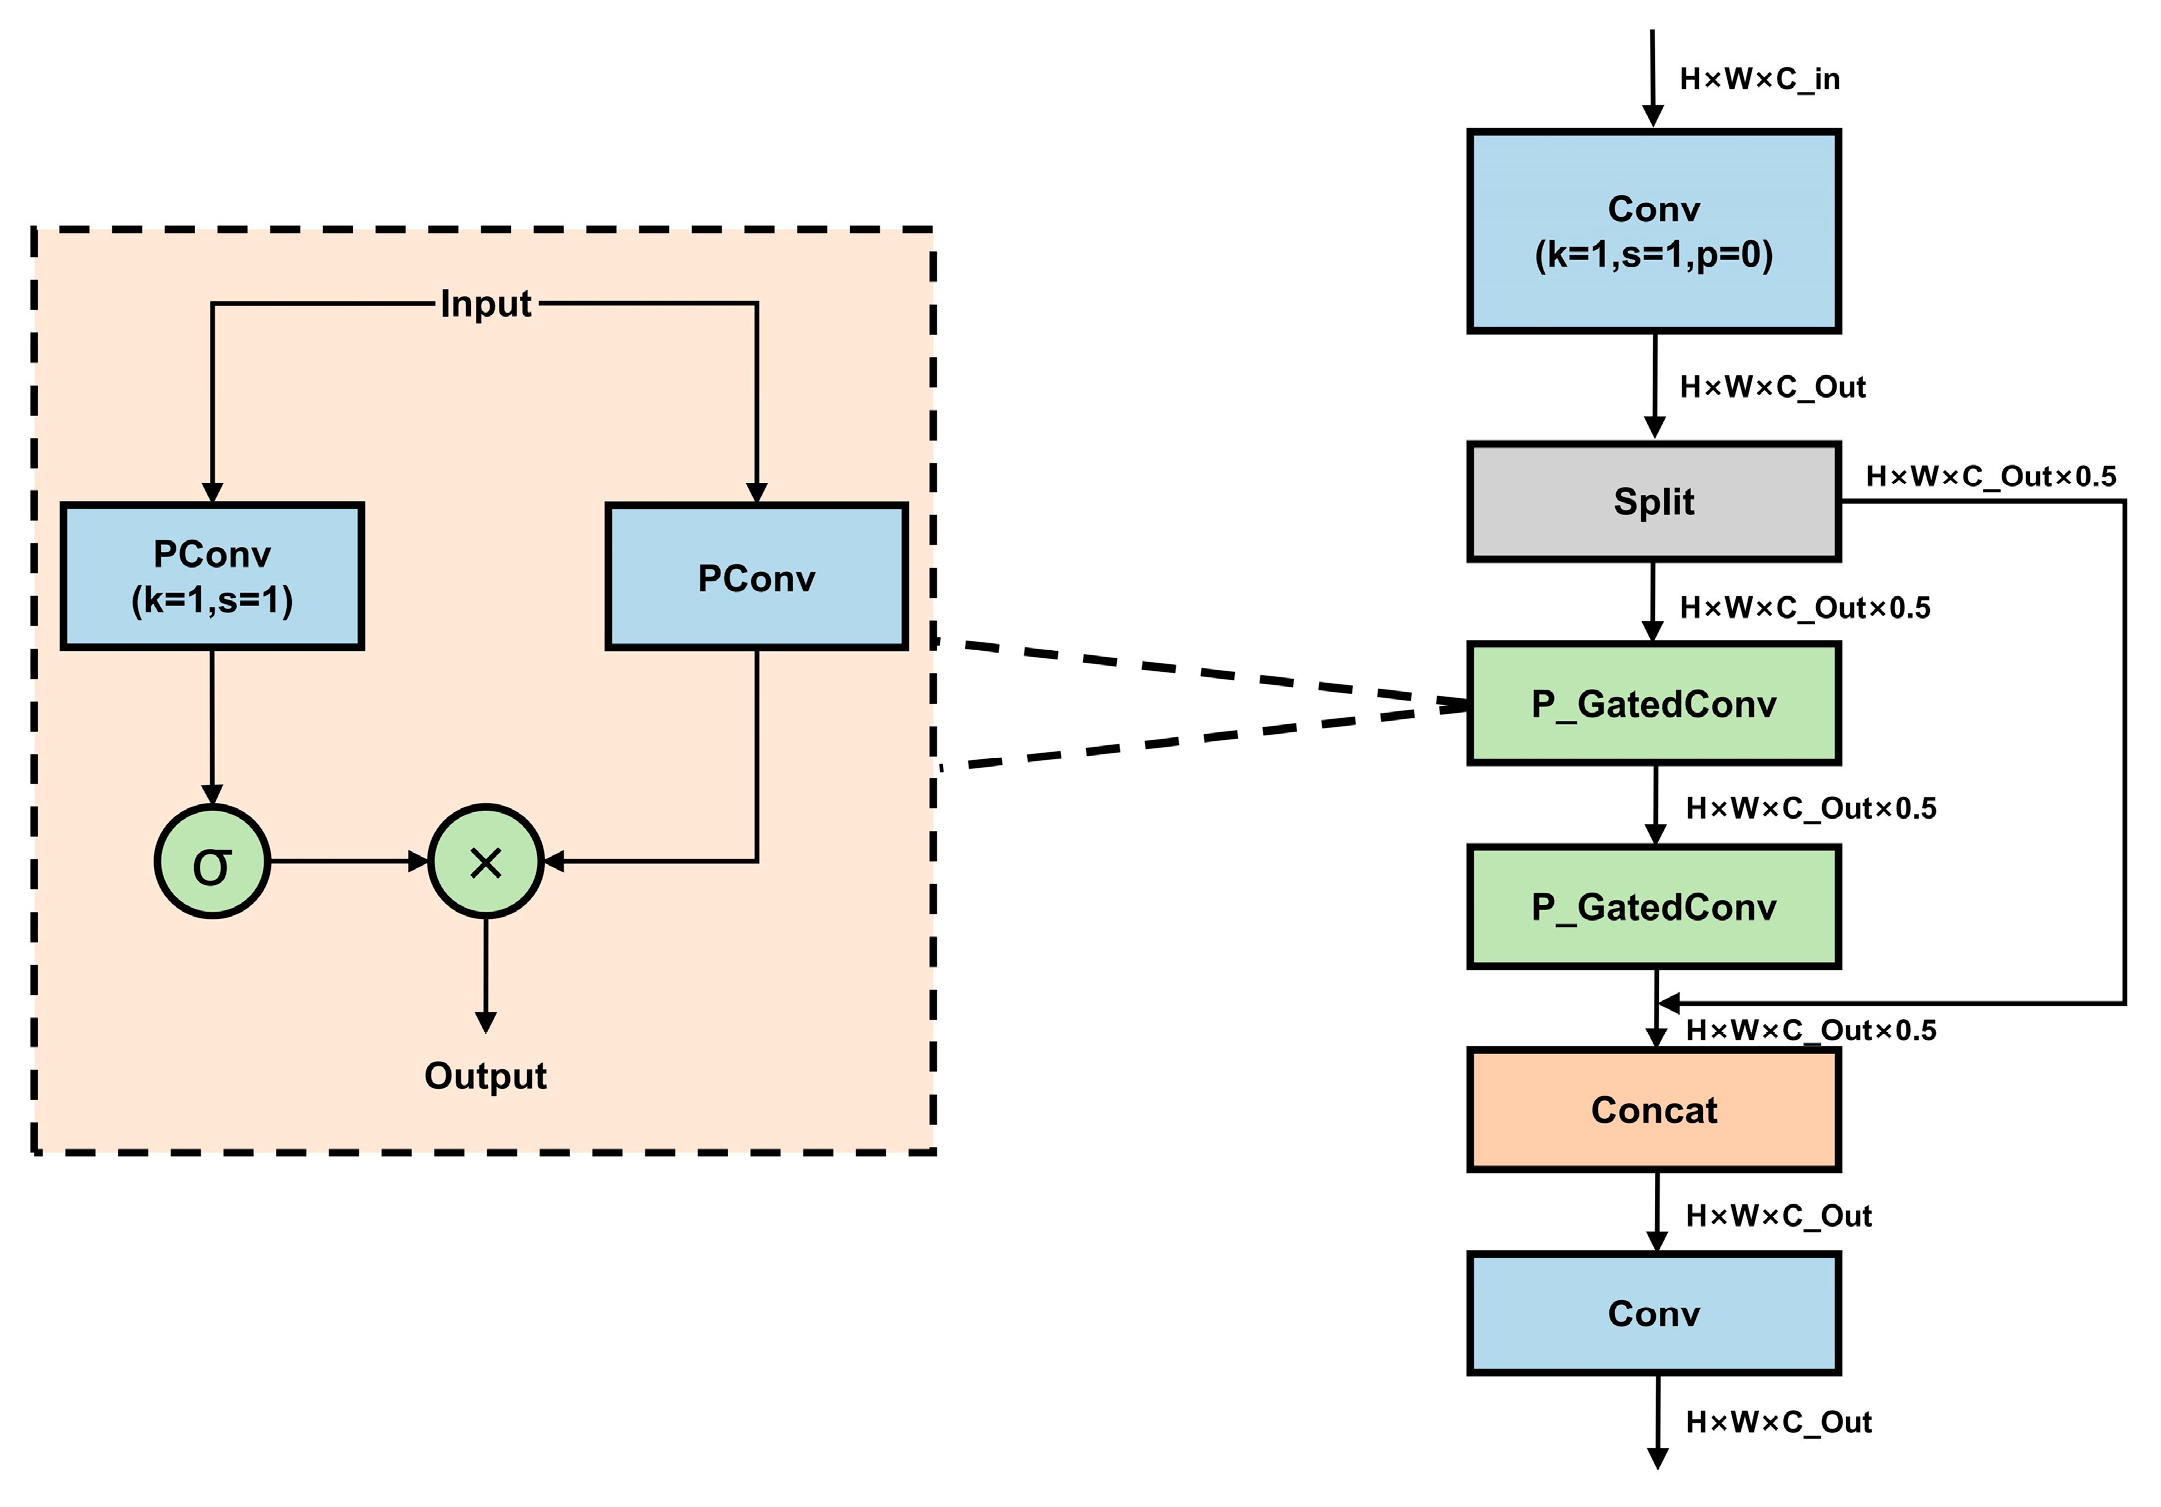
18]. Within the encoder, the re-parameterized convolution module, RepC3, is deployed to enhance feature extraction. However, despite improving feature representation, RepC3 may introduce redundant convolution operations during inference, leading to increased computational complexity. To tackle this issue, we developed the E-CSPPC module based on PConv to reduce model complexity and computation. The structure of E-CSPPC is depicted in
Figure 6.
PConv performs convolution only on a portion of the input channels, extracting spatial features while preserving the other channels unchanged [
24].
Figure 7a,b show the structures of partial and regular convolution. Compared to traditional convolution, PConv improves local feature capture and enhances recognition capability. For regular memory access, we opt for the first or last
channels to represent the full feature map, assuming the number of channels in both the input and output feature maps is identical. Therefore, when the input shape is
and the kernel size is
, the FLOPs of PConv are as follows:
With a partial ratio of , the FLOPs of PConv are reduced to that of regular convolution. Additionally, PConv requires only the memory access of regular convolution.
Gated convolution (GatedConv) dynamically adjusts convolution outputs through a gating mechanism [
31]. Specifically, the input feature map is processed by a standard convolution to extract local features. A 1 × 1 convolutional layer subsequently produces a weight map that matches the dimensions of the input feature map. The weight map, following sigmoid activation, is multiplied by the corresponding elements in the feature map to modify its feature intensity. This mechanism allows the network to selectively retain or suppress specific regional features, enhancing feature extraction and robustness.
The P_GatedConv module, combining GatedConv with PConv, is integrated into the E-CSPPC module. This reduces computational and memory redundancy and lowers the number of parameters. It also reduces model size and development costs for hierarchical devices.
2.6. The Improved Loss Function
To enhance the evaluation accuracy, Inner-SIoU is used to replace the IoU loss function in this model. During training, a smaller auxiliary boundary is used for loss computation, and a scaling factor is applied to adjust the auxiliary boundary ratio. Based on Equations (5)–(8), Inner-IoU [
25] is applied to the SIoU loss function [
26] calculation as follows:
Define as the ground truth box and b as the anchor box, with their widths and heights represented by , and w, h, respectively. The ratio serves as a parameter that determines the scale of the auxiliary boundary. The SIoU loss function is composed of four components: angle, distance, shape, and IoU losses. Inner-SIoU improves the regression accuracy for high IoU samples by optimizing the internal area of the box and introducing small-scale auxiliary boundaries for loss computation, effectively reducing the influence of low IoU samples during training.
2.7. Weight Transfer
This study adopts a weight initialization strategy, using model weights obtained from joint training on RGB images and visual saliency maps as the initialization parameters for the new model. Guided by saliency maps, the model can acquire richer key information during the early training stage, improving its representation of salient features. In addition, this initialization method provides better optimization guidance during model optimization, reducing focus on non-salient regions, thereby improving detection accuracy under cluttered backgrounds and occlusions. The model obtained from joint training on visual saliency maps and RGB images is shown in
Figure 8. To ensure the compatibility of the weights, the structure of this model is basically consistent with LightSal-RTDETR.
3. Results
3.1. Training Environment and Settings
To train and test the proposed model, the experiments were conducted in an Ubuntu 22.04 environment, equipped with an AMD EPYC 9754 128-core CPU and an NVIDIA GeForce RTX 4090 D GPU with 24 GB of RAM. The programming language used was Python 3.8.10, with PyTorch version 2.0.0 and CUDA version 11.8 as the deep learning framework.
For consistency, input images were uniformly scaled to 640 × 640 pixels throughout the training phase. The training was conducted over 150 epochs using a batch size of 16, with the AdamW optimizer configured for a learning rate of 0.0005 and a weight decay of 0.0001. To ensure objectivity, all experimental evaluations of the proposed method were carried out using identical hyperparameter settings. These hyperparameters were tuned based on validation performance to ensure good convergence and generalization. The training process was monitored using the validation mean average precision (mAP). As shown in
Figure 9a, the validation mAP increased steadily and plateaued in the later epochs, reaching a best value of 80.8% at mAP@50. The final test set mAP was 81%, which is consistent with the validation performance, suggesting that the model effectively generalizes without overfitting.
3.2. Evaluation Metrics
A comparative analysis of detection performance before and after enhancement is conducted under the same experimental setup to validate the algorithm’s improvements. The performance assessment in this work is based on precision, recall, F1 score, mean average precision (mAP), total parameters, and GFLOPs. All reported precision, recall, and F1 scores are calculated using macro-averaging. For NMS, the following thresholds are used: YOLO series (confidence = 0.25, IoU = 0.7), SSD (confidence = 0.5, IoU = 0.45), and Faster R-CNN (confidence = 0.5, IoU = 0.3). These threshold values are chosen based on the default settings used in the respective models’ original implementations, ensuring consistency with standard practices in object detection tasks. In contrast, DETR-based models do not require NMS thresholds during evaluation due to their transformer-based architecture. During the prediction phase, a confidence threshold of 0.25 is applied to filter out low-confidence predictions, while all predictions are included in the evaluation phase to compute the precision-recall curve and mAP.
Precision represents the model’s effectiveness in correctly predicting positive outcomes. The formula is defined in Equation (10):
TP denotes the correct positive predictions, whereas FP refers to incorrect ones.
Recall reflects how well the model detects positive samples. The formula is defined in Equation (11):
FN refers to positive instances that were incorrectly classified as negative.
The F1 score offers a comprehensive evaluation of model performance. The F1 score is defined in Equation (12):
The mean average precision (mAP) is a comprehensive performance metric for object detection tasks that accounts for both the precision and recall of the model at different thresholds. Prior to computing AP, the area under the precision–recall curve (AUC) is estimated via interpolation. In this paper, we use the 101-point interpolation method, where interpolated precision is sampled at 101 equally spaced recall thresholds between 0 and 1. Notably,
Section 3.4 follows the COCO-style evaluation protocol to ensure fair comparison with lightweight DETR benchmarks, while all other experiments adopt the default mAP computation used in the YOLO framework, which is also based on 101-point interpolation. The formula for mAP is shown as Equation (13):
represents the average precision of the i-th class, and N represents the number of classes.
The parameter count indicates the cumulative number of parameters that can be learned by the model. It is typically used to evaluate model complexity.
GFLOPs serves as a measure of its computational efficiency. During inference, GFLOPs provides a useful estimate of the computational load a model imposes, making it suitable for cross-model efficiency comparisons on the same device. Fewer GFLOPs indicate higher computational efficiency.
3.3. Ablation Study
To evaluate the effectiveness of the modules introduced, an ablation study was conducted using the dataset constructed in this study. In the experiment, i_C Block represents the iRMB-cascaded block module, E-C represents the E-CSPPC module, and Inner-SIoU refers to the use of the Inner-SIoU loss. The weight_load refers to the initialization of model weights obtained from joint training with visual saliency maps and RGB images.
Table 1 presents the findings from the ablation study. The ablation study includes five groups of experiments, with each experiment adding different modules. The models are evaluated against the original RT-DETR model based on precision, recall, mAP, parameter count, and GFLOPs.
As shown in
Table 1, integrating the E-CSPPC module into the network leads to increases of 0.2% in mAP@50 and 2.1% in mAP@50:95, while simultaneously lowering the number of parameters and computational overhead. By combining the iRMB-cascaded block and E-CSPPC, the detection performance is further boosted, with mAP@50 increasing by 0.4% and mAP@50:95 by 1.8%. Compared to the baseline RT-DETR, this approach cuts the parameter count to 14.28 M and the computational cost to 41.8 GFLOPs, representing reductions of 28.1% and 26.5%, respectively. Furthermore, integrating the Inner-SIoU loss function leads to a 1.0% improvement in mAP@50. A comparison between Experiment 4 and Experiment 5 indicates that initializing with weights trained on both visual saliency maps and RGB images in Experiment 5 leads to improvements of 0.5% in mAP@50 and 0.9% in mAP@50:95, relative to random initialization. Finally, with all enhancements applied, LightSal-RTDETR demonstrates performance gains of 1.9% for mAP@50 and 3.4% for mAP@50:95. It also reduces the parameter count and GFLOPs by 28.1% and 26.5% compared to the baseline. Beyond improving detection accuracy, LightSal-RTDETR significantly reduces model complexity and computational cost, enhancing its suitability for real-world deployment. This demonstrates the practical value of the proposed improvements.
3.4. Comparison Experiments
The effectiveness of the proposed LightSal-RTDETR was evaluated by comparing it with a range of mainstream detectors, including SSD [
32], Faster R-CNN [
33], YOLOv5, YOLOv8, YOLOv10 [
34], YOLO11, YOLOv12 [
35], and RT-DETR networks.
Figure 9a presents the performance curves of all nine models evaluated on the proposed dataset. Faster R-CNN has significantly more parameters and higher computational complexity than the other models, while its average precision remains relatively low. Due to its limited practical value,
Figure 9b excludes Faster R-CNN and illustrates the relationship between parameter count, computational complexity, and mAP@50:95 for the remaining models. As shown, LightSal-RTDETR demonstrates a clear advantage in terms of accuracy–efficiency trade-offs.
Figure 9.
Results of comparison experiments. (a) Accuracy variation of nine object detectors, and (b) bubble chart of parameters, GFLOPs, and mAP@50:95.
Figure 9.
Results of comparison experiments. (a) Accuracy variation of nine object detectors, and (b) bubble chart of parameters, GFLOPs, and mAP@50:95.
Table 2 presents a comparison of different models in terms of accuracy, recall, mAP, model parameters, and GFLOPs. Compared with SSD, Faster R-CNN, YOLOv5, YOLOv10, YOLO11, and YOLOv12, LightSal-RTDETR achieves higher average precision by 1.6%, 5.9%, 0.6%, 4.1%, 0.4%, and 0.5%, respectively, at an IoU of 0.5. Although YOLOv8 achieves a high accuracy of 82.2%, it comes at the cost of considerably higher parameter size and computational burden compared to LightSal-RTDETR. LightSal-RTDETR surpasses the baseline RT-DETR by 1.9% in mAP@50 and 3.4% in mAP@50:95, while also delivering 1.6% higher accuracy and a 2.7% boost in recall. Overall, LightSal-RTDETR offers a favorable trade-off between accuracy and resource consumption, maintaining high detection precision with reduced parameter size and computational demands, thus supporting efficient lightweight deployment.
In addition, to further validate the effectiveness of the proposed model, we compared LightSal-RTDETR with several state-of-the-art lightweight DETR-based models, namely D-FINE [
36], LW-DETR [
37], and DEIM-D-FINE [
38]. The comparison results are shown in
Table 3. The mAP evaluation metrics used in this experiment follow the official COCO evaluation protocol. As shown in the table, LightSal-RTDETR achieves a good balance between accuracy and model complexity. Specifically, it achieves 80.5% on mAP@50 and 60.0% on mAP@50:95, both outperforming the other compared models and demonstrating superior object detection capability. Meanwhile, it maintains a low model size of only 14.28 M parameters and 41.8 GFLOPs, which are lower than those of D-FINE, LW-DETR, and DEIM-D-FINE, highlighting its lightweight advantage. These results indicate that LightSal-RTDETR not only offers better detection performance but also demonstrates improved adaptability to edge devices with limited resources.
3.5. Visualization Analysis
In natural environments, citrus ripeness detection is influenced by various factors, including uneven lighting, occlusion by leaves or branches, and overlapping fruits.
Figure 10 presents a comparison of citrus ripeness prediction generated by LightSal-RTDETR and the original RT-DETR. Various example scenarios are used to demonstrate detection effectiveness, such as under direct sunlight, in shaded conditions, with overlapping or occluded objects, and in high-density environments. The results indicate that LightSal-RTDETR demonstrates strong robustness in adapting to lighting variations and detecting overlapping fruits.
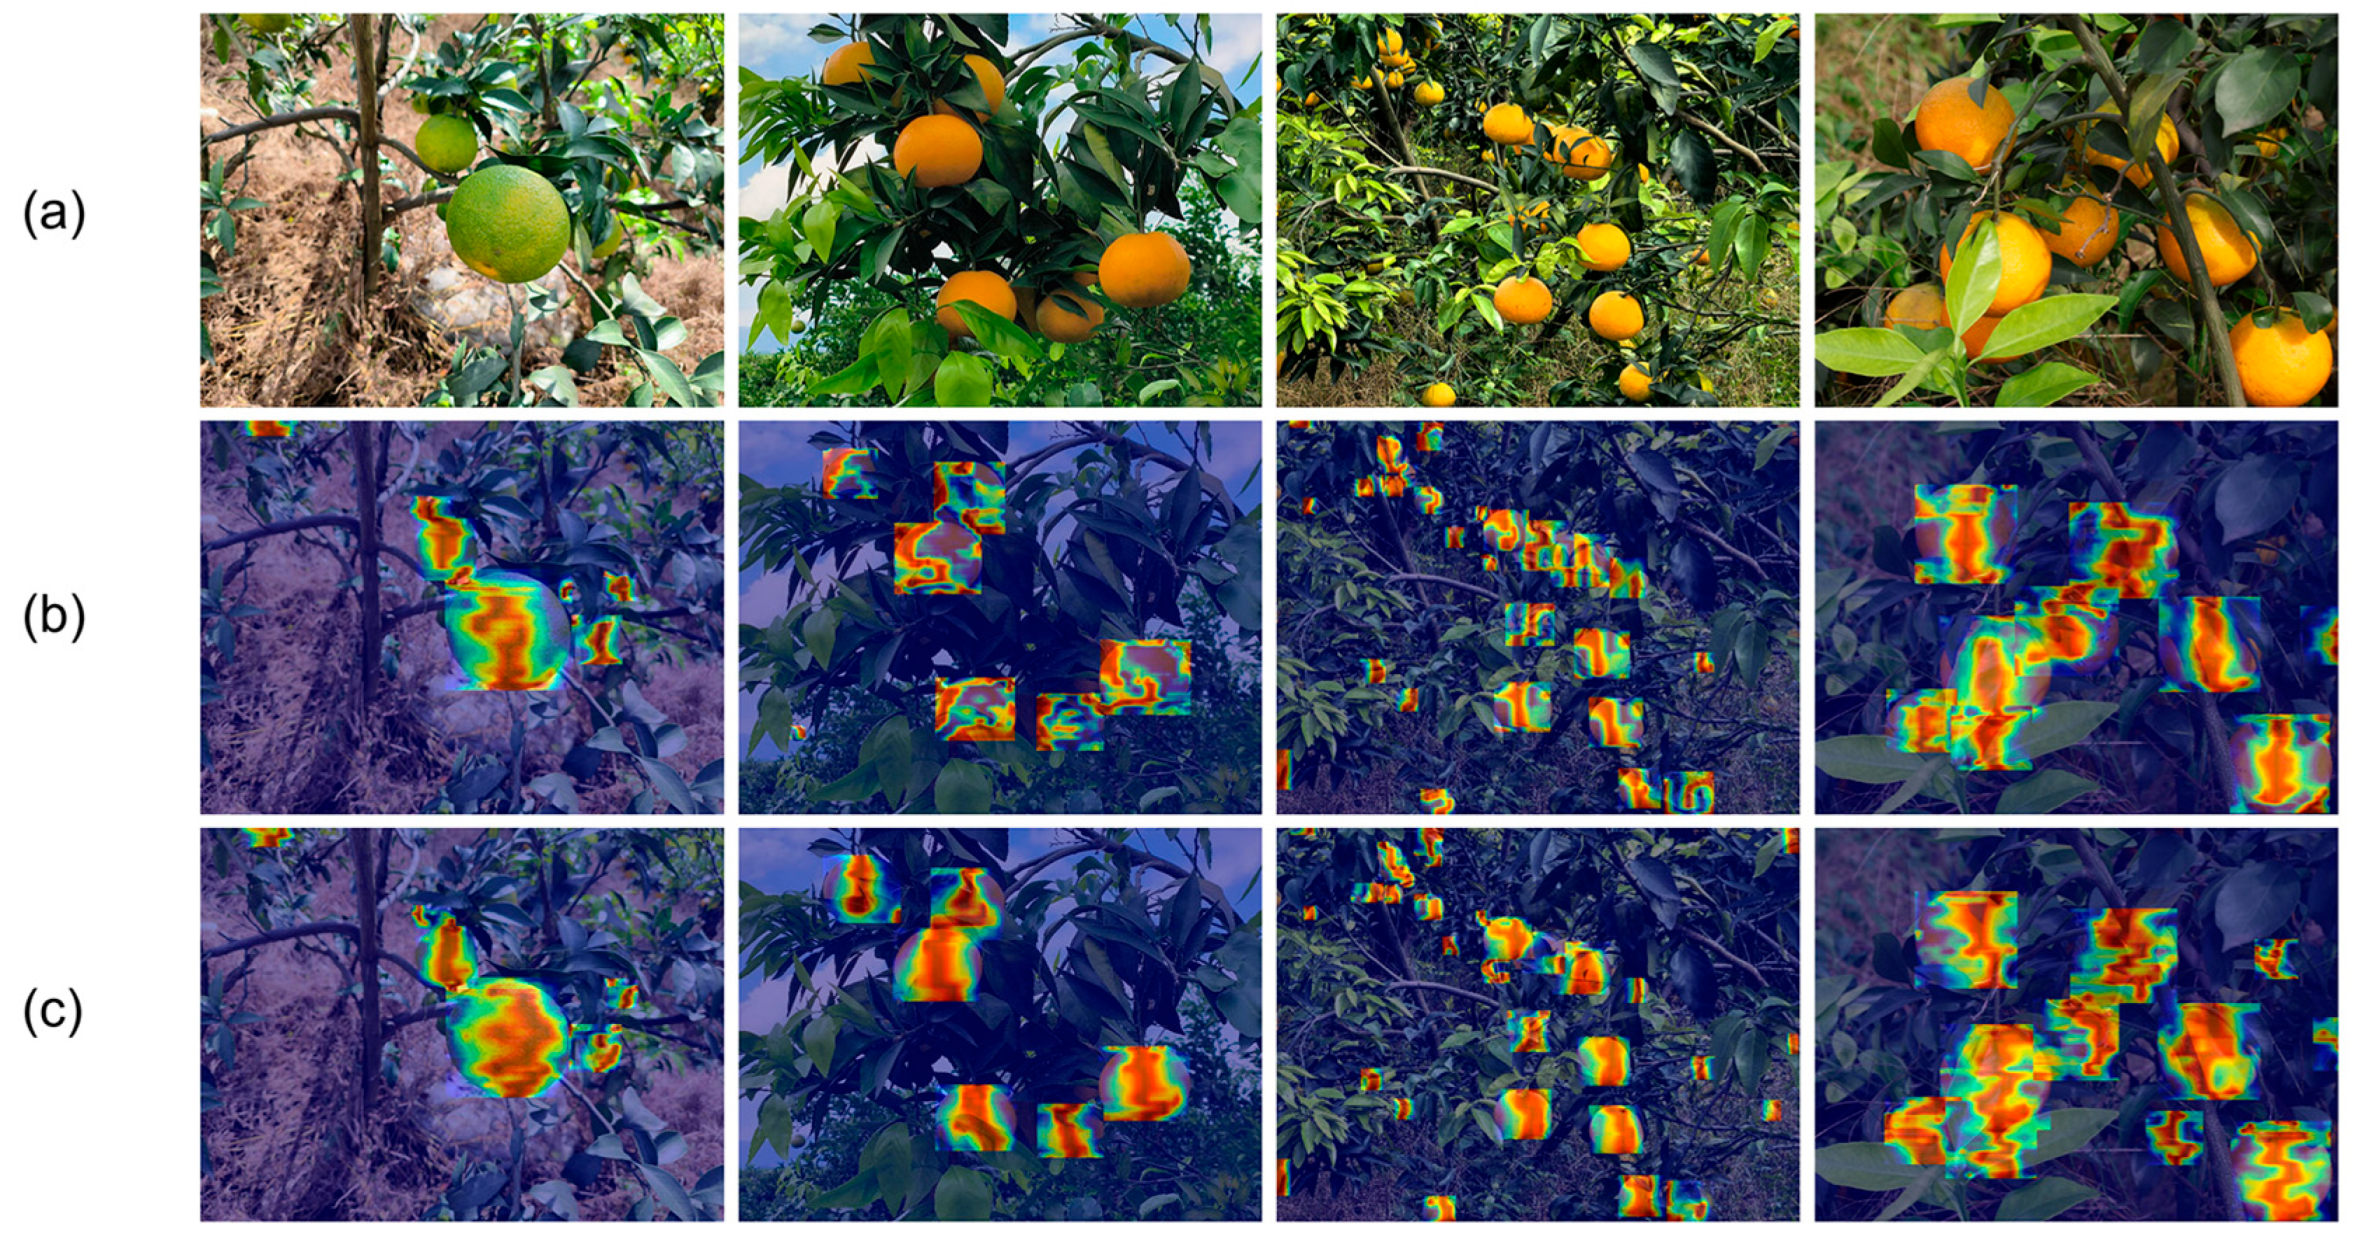
To gain deeper insights into the effectiveness of the proposed algorithm under complex orchard backgrounds in citrus ripeness detection, this study employs GradCAM++ [
39] for heatmap analysis. In the resulting heatmaps, red regions represent the model’s focus areas, with darker shades indicating higher levels of attention.
Figure 11 provides a comparative visualization of the heatmaps generated by the original and improved models. The results demonstrate that the optimized model exhibits a stronger focus on target regions while effectively reducing computational overhead in non-target areas, thereby confirming the effectiveness of the improvements.
3.6. Comparative Experiments on Backbone Network
The RT-DETR model in this study adopts ResNet-18 as the backbone network. To evaluate the effectiveness of enhancing the basic block in ResNet18 through the integration of iRMB and CGA, we conducted comparative experiments with several representative convolutional structures, as shown in
Table 4.
As shown in
Table 4, compared with the baseline model, the introduction of the iRMB-cascaded block not only significantly reduces the number of parameters and computational cost but also improves the detection accuracy. Notably, an increase of 1.1% in mAP@50 is achieved. In comparison to using iRMB alone, the iRMB-cascaded block yields a 0.6% improvement in mAP while reducing the parameter count by 1.13 M and lowering the computational complexity by 2.3 GFLOPs. Furthermore, this study also integrates PConv and DualConv [
40] into the original basic block module for comparison purposes. Although both PConv and DualConv reduce model size and computation, they lead to performance degradation, with PConv causing a 0.5% drop in mAP@50, and DualConv resulting in a 1.3% decrease in mAP@50:95, which fails to meet the accuracy requirements for citrus ripeness detection. Through a comprehensive comparison, the proposed iRMB-cascaded block demonstrates superior overall performance.
3.7. Generalization Assessment of E-CSPPC Module
To further evaluate the generalization capability of the E-CSPPC module, we conducted validation experiments using the YOLO11 model based on the YOLO architecture. In this experiment, the original C3K2 module in the neck of YOLO11 was replaced with the proposed E-CSPPC module to assess its effectiveness in feature extraction following feature fusion. The experimental results are presented in
Table 5.
As shown in the results, the performance of the E-CSPPC module varies across different model architectures. In the RT-DETR model, integrating the E-CSPPC module improved mAP@50 from 79.1% to 79.3% and mAP@50:95 from 57.1% to 59.2% while reducing the number of parameters by 1 M and computational cost by 4.9 GFLOPs. In contrast, when applied to YOLO11, the introduction of E-CSPPC slightly reduced mAP@50 from 80.6% to 80.2% and mAP@50:95 from 57.5% to 57.0%, though it still reduced parameters by 2.07 M and GFLOPs by 6.6 G.
These outcomes indicate that the performance impact of E-CSPPC is closely related to the target architecture. In our study focused on optimizing RT-DETR, integrating E-CSPPC resulted in improved accuracy and reduced computational cost. In contrast, a slight drop in detection accuracy was observed when applying E-CSPPC to YOLO11, though it still achieved notable reductions in model parameters and GFLOPs. This suggests that the practical benefits of E-CSPPC, particularly in terms of model lightweighting, depend on how well it aligns with the architectural characteristics of the base model. We acknowledge that E-CSPPC may not be universally applicable to all detection frameworks, and further evaluation on broader model families is left as future work.
3.8. Validity of Weight Transfer
To further evaluate the effectiveness of weight transfer from models jointly trained on visual saliency maps and RGB images, we conducted an experiment comparing various weight initialization strategies for citrus ripeness detection. The results are presented in
Table 6. In this experiment, both models, RT-DETR and improved RT-DETR, used random initialization, while RT-DETR (pretrained) and improved RT-DETR (pretrained) employed pretrained weights from the COCO [
41] and Objects365 [
42] datasets. It is also worth noting that improved RT-DETR and LightSal-RTDETR share an identical network architecture.
The experimental results indicate that RT-DETR (pretrained) achieves a 1.6% improvement in F1 score compared to its randomly initialized counterpart. However, mAP@50 is 0.3% lower than the random initialization model. The improved RT-DETR (pretrained) shows a 0.6% lower mAP@50 than the random initialization version of the improved RT-DETR, indicating that pretrained weights from COCO and Objects365 may not be suitable for the citrus dataset. In contrast, LightSal-RTDETR (the model with weights trained jointly using visual saliency maps and RGB images) shows significant improvements in both F1 score and mAP@50, suggesting that this transfer learning approach is more suitable for citrus ripeness detection.
3.9. Applicability
To explore the model’s generalization ability to other fruit types, we utilized the Melon Puspalebo Dataset [
43] from Roboflow. This public dataset contains melons at various ripeness stages in orchard environments, categorized into two classes: ripe and unripe. A 7:2:1 proportion was used to allocate the dataset to the training, validation, and testing phases. The dataset, which includes augmented images as part of the original collection, was expanded to a total of 1038 images.
Table 7 displays the performance evaluation outcomes of LightSal-RTDETR on the dataset.
Table 7 indicates that the proposed LightSal-RTDETR model exhibits high effectiveness on this dataset. Specifically, the mAP@50 for ripe and unripe categories achieves 99.5% and 91.5%, respectively. Furthermore, the results from additional evaluation metrics reflect strong performance. These results highlight the applicability and adaptability of LightSal-RTDETR in assessing fruit ripeness across different categories.
3.10. Deployment Plan
To enable the practical application of the proposed algorithm in orchard environments, it is planned to be deployed on an intelligent fruit-picking robot. The system will be built on an embedded computing platform powered by the NVIDIA Jetson Orin Nano, which offers high computational efficiency and low power consumption, making it suitable for edge computing scenarios. The robot will be equipped with a high-resolution industrial camera (e.g., IDS uEye FA series) for image acquisition via a USB 3.0 interface and will support remote data transmission through Wi-Fi or 4G networks. To enhance system stability and robustness in complex orchard conditions such as high humidity and vibration, the camera module will adopt a shock-absorbing structural design. By integrating the proposed algorithm, the robot will be capable of autonomous orchard inspection and intelligent fruit ripeness detection, providing effective support for orchard management and harvesting operations.
4. Discussion
The experimental results indicate that the proposed model improves the accuracy of citrus ripeness detection in complex orchard environments while simultaneously reducing model parameters and computational cost. The ablation study further verifies the effectiveness of the proposed architectural enhancements. The E-CSPPC module, iRMB-cascaded block, and Inner-SIoU loss function were introduced, and the weights obtained through the hybrid training of RGB images and visual saliency maps were used for weight initialization. Compared to the baseline model, LightSal-RTDETR achieved improvements of 1.6%, 2.7%, 1.9%, and 3.4% in precision, recall, mAP@50, and mAP@50:95, respectively. Meanwhile, the model’s parameters and computational cost were reduced by 28.1% and 26.5%, respectively. These results demonstrate that the improved model effectively detects citrus maturity under complex orchard backgrounds and extracts features representing the citrus ripening stages. In the comparative experiments, we compared the improved model with mainstream object detection models and, using the COCO mAP calculation standard, also compared it with leading lightweight DETR-based models, D-FINE, LW-DETR, and DEIM-D-FINE. LightSal-RTDETR exhibited significantly lower parameter count and computational cost while maintaining high detection accuracy, indicating an optimal balance between computational load and detection performance. In the visual analysis, we visualized detection results in complex orchard environments, including various lighting conditions, overlaps, occlusions, and multiple fruits. The results demonstrated the model’s robustness in challenging orchard scenarios. The proposed method holds promise for enhancing citrus harvest quality in future automated harvesting platforms.
Despite the promising detection performance of the model, limitations in data collection still remain. Although this study includes citrus samples at various ripeness stages collected from complex orchard environments, certain data gaps are evident. For instance, the dataset lacks instances of decayed citrus fruits and images captured under extreme weather conditions. These limitations suggest potential areas for improvement. Future research should focus on gathering a more varied range of datasets to improve the model’s robustness and generalization ability.
From an architectural design perspective, LightSal-RTDETR introduces CGA to enhance feature extraction capability and improve modeling of occluded areas while incorporating PConv to reduce the model size and computational cost. However, these modules may face performance degradation under certain conditions. For instance, when the input image contains significant object occlusion or blurred edges, the local attention mechanism, due to its limited receptive field, may struggle to model global dependencies across regions, leading to decreased detection accuracy. Furthermore, in cases of high occlusion or extreme lighting conditions, partial convolutions may erroneously suppress features in the target area, negatively impacting the model’s performance. In addition, the E-CSPPC module, proposed as a lightweight enhancement block, demonstrated varying levels of effectiveness across different architectures. While it improved both accuracy and efficiency in the RT-DETR framework, it led to a slight accuracy drop in YOLO11, despite significantly reducing model complexity. This further reinforces the importance of aligning module design with architectural characteristics. Future work may explore how such modules can be better adapted to different model types.
Additionally, the proposed LightSal-RTDETR achieves an mAP of 81%, which meets the fundamental requirements for industrial deployment. However, there remains room for further enhancement in detection accuracy. Current maturity detection methods are still at the algorithmic stage, and there remains a certain gap in their deployment in real-world scenarios. The application and deployment of LightSal-RTDETR in citrus orchards still require further research and exploration. In the future, our research will continue to transform this algorithm into a deployable system to ensure its effectiveness and reliability in real orchard environments.
5. Conclusions
To overcome the difficulties posed by complex orchard environments in citrus ripeness detection, we proposed a lightweight algorithm, LightSal-RTDETR, based on the RT-DETR architecture. Experimental evaluation confirms that the algorithm achieves 81% in mAP@50 and 60.5% in mAP@50:95. The proposed approach maintains a favorable balance between detection model complexity and precision when compared with popular object detection algorithms. LightSal-RTDETR outperforms the original RT-DETR by increasing mAP@50 by 1.9% and mAP@50:95 by 3.4%, simultaneously achieving a 28.1% reduction in parameter count and a 26.5% reduction in computational cost. These results demonstrate the feasibility of this method for citrus ripeness detection, enabling more accurate identification of ripe and unripe fruits in natural environments and offering robust technical support for the development of smart orchards. It should be noted that variations in environmental conditions and citrus cultivars may influence the model’s detection performance. Subsequent studies will aim to refine the model architecture, enrich the dataset, and enhance detection accuracy and robustness under diverse and challenging conditions, thereby contributing to the advancement of modern agricultural automation. Based on cutting-edge practices in agricultural robotics, we propose a feasible prospective deployment plan. Potential applications include automated orchard harvesting systems. These implementations are expected to significantly enhance the automation level of the citrus industry, optimize harvest timing decisions, reduce post-harvest losses, and provide data-driven support for precision agriculture, ultimately accelerating the intelligent transformation and upgrading of the citrus industry.


