Article

Numerical Simulation of Dry and Wet Rice Seeds in an Air-Suction Seed Metering Device

1
College of Engineering, South China Agricultural University, Guangzhou 510642, China
2
China Key Laboratory of Key Technology on Agricultural Machine and Equipment, Ministry of Education, South China Agricultural University, Guangzhou 510642, China
3
State Key Laboratory of Agricultural Equipment Technology, Beijing 100083, China
4
School of Information Technology & Engineering, Guangzhou College of Commerce, Guangzhou 511363, China
5
Guangdong Provincial Key Laboratory of Agricultural Artificial Intelligence (GDKL-AAI), Guangzhou 510642, China
*
Authors to whom correspondence should be addressed.
Agronomy 2025, 15(5), 1145; https://doi.org/10.3390/agronomy15051145
Submission received: 22 March 2025 / Revised: 24 April 2025 / Accepted: 6 May 2025 / Published: 7 May 2025

Abstract

:
Rice direct seeding for bunch planting is a sustainable agricultural production method that reduces production costs, improves rice lodging resistance, and conserves irrigation water in the field. However, there are notable differences in seed treatment between direct seeding on dry land and in paddy fields, which can impact the seeding process’s accuracy. This study employs the numerical simulation methods of computational fluid dynamics (CFDs) and discrete element method (DEM) to examine the motion characteristics of dry and wet rice seeds in a fluid–solid coupled domain and their impact on seeding accuracy. The aim is to guide the optimization of the rice air-suction seed metering device. Rice seeds were divided into dry and wet groups, and their physical properties were measured. Discrete element models of rice seeds were constructed and calibrated using a polyhedral method. The results show that the static friction coefficient between the seed meter and the seed ranged from 0.902 to 0.950, and the thousand-grain weights ranged from 25.89 to 32.42 g, which were higher than those of the dry rice seed, which ranged from 0.774 to 0.839, and from 25.89 to 32.42 g. After calibration, the errors between the simulated dynamic stacking angles of HHZD, HYD, YLYD, HHZW, HYW, and YLYW and the physical–dynamic stacking angles were 0.12%, 0.13%, 0.75%, 0.62%, 0.08%, 0.75%, 0.59%, and 1.24%, respectively, which indicated that the discrete element model for rice was reliable. Additionally, a seeding accuracy test revealed that wet seeds of the same variety had higher missing and single indices, while dry seeds had higher triple and multiple indices. Furthermore, CFD-DEM simulations demonstrated that wet seeds’ normal and tangential forces were more significant than those on dry seeds during the seed-filling process. At 40 rpm, the normal and tangential forces during the seed-filling process of HYW are 37.69 × 10⁻³ N and 12.47 × 10⁻³ N, respectively, which are higher than those of HYD (25.18 × 10⁻³ N and 9.19 × 10⁻³ N). The action force of suctioned rice seeds was directly proportional to the missing and single indices. The primary factors contributing to the discrepancy in seeding accuracy between dry and wet rice are the thousand-grain weight, the static friction coefficient between the seed meter and the seed, and the action force exerted between the rice seeds. In addition, using a shaped hole structure and optimizing the seed chamber structure can reduce normal and tangential forces and improve seeding accuracy. This study provides a reference for the simulation of rice seed flow-solid coupling and optimization of air-suction seed metering devices.

1. Introduction

Rice is one of the world’s most important food crops, with planting methods primarily consisting of transplanting and direct seeding [1]. Transplanted rice allows more precise control of the distance between plants and optimizes the efficiency of light, water, and nutrient use. However, it should be noted that the planting cost of transplanting is much higher than direct seeding. Compared to transplanting, direct seeding can lower production costs by eliminating the need for seedling cultivation [2]. Mechanized precision direct seeding through bunch planting has been shown to improve rice root growth, enhance field ventilation and light transmission, and reduce water usage [3,4,5]. Bunch planting refers to the seeding method of concentrating multiple seeds into seed holes at a fixed row spacing and depth within the seeding rows. Air-suction seeding technology is employed in direct seeding to increase the precision of the seeding process, reduce seed consumption, and minimize damage rates [6]. Wet seeds are used for paddy field seeding, while dry seeds are used for dry land. Pre-germination of rice seeds has been observed to improve emergence rates and shorten emergence times [7]. Seed pre-germination is necessary for direct seeding in paddy fields. However, different treatments for rice seeds can affect the seeding accuracy of the air-suction seed metering device. The seeding accuracy of wet rice seed is lower than that of dry rice seed. Therefore, it is necessary to analyze the forces on dry and wet rice seeds in the fluid–solid coupling field to obtain the optimization guidelines for the air-suction seed metering device.
The seed metering device is a crucial component of the planter apparatus, directly influencing crop yield [8,9,10]. To improve seeding accuracy for various crops, researchers have optimized the key components of seed metering devices, such as the seed disc [11,12], seed tube [13], and band-type seeding device [14]. At the same time, various metering devices have been invented for different agronomic needs and operating environments, including field breeding [15], mulch planting [16], and no-tillage seeding [17]. With the development of machine learning, artificial neural networks have been used to predict the optimal operating parameters of seed metering devices [18,19]. However, the aforementioned studies on metering devices have focused on high-sphericity seeds such as corn, soybeans, cotton, and peanuts, not barred seeds such as rice.
In addition, previous studies have been dominated by dry seeds [20,21]. There is a big difference between the movement and force of dry and wet seeds in the seed metering device. The study of dry and wet seed movement and forces in seed metering devices will be an important guide for the optimization of air-suction seed metering devices for rice. Physical tests have limitations that make it challenging to analyze the forces and movements of seeds directly. Numerical simulation methods can be used to study the interaction mechanism between seeds and rows in detail and clarify seed movement rules [22,23]. The CFD-DEM coupling method is necessary to simulate the operation of the air-suction seed metering device [24,25]. CFD-DEM simulations are widely used in fields such as fluidized beds [26], pneumatic conveying [27], and fluid machinery [28].
Particle modeling methods primarily include the multi-sphere, ellipsoidal, and polyhedral models [29]. In other studies, maize seeds [30] and soybean seeds [31] were modeled using the multi-sphere modeling method and wheat seeds [32] were modeled using the ellipsoid modeling method. However, the multi-sphere and ellipsoid modeling methods have limitations for irregular particles, and the shape between the simulation model and the actual particles is large. The polyhedral modeling method uses multiple triangular facets to form a complex shape, reducing simulation errors for particles with intricate geometries [33,34]. Rice seeds have complex shapes, so the polyhedral modeling method is suitable for Rice seeds.
This study used the CFD-DEM numerical simulation method to examine the motion characteristics of dry and wet rice seeds in a fluid–solid coupled domain and their impact on seeding accuracy. First, the physical property parameters of rice seeds were measured, and the polyhedral method constructed discrete element models of six rice seeds. Seeding accuracy tests were conducted to analyze the effects of different rice seeds on the seeding accuracy. Finally, the CFD-DEM numerical simulation method was used to analyze the differences in forces in the fluid–solid coupling field of different rice seeds. The optimization guidelines for the air-suction rice seed metering device will be obtained based on the study results.

2. Materials and Methods

2.1. Measurement of Seed Physical Characteristics
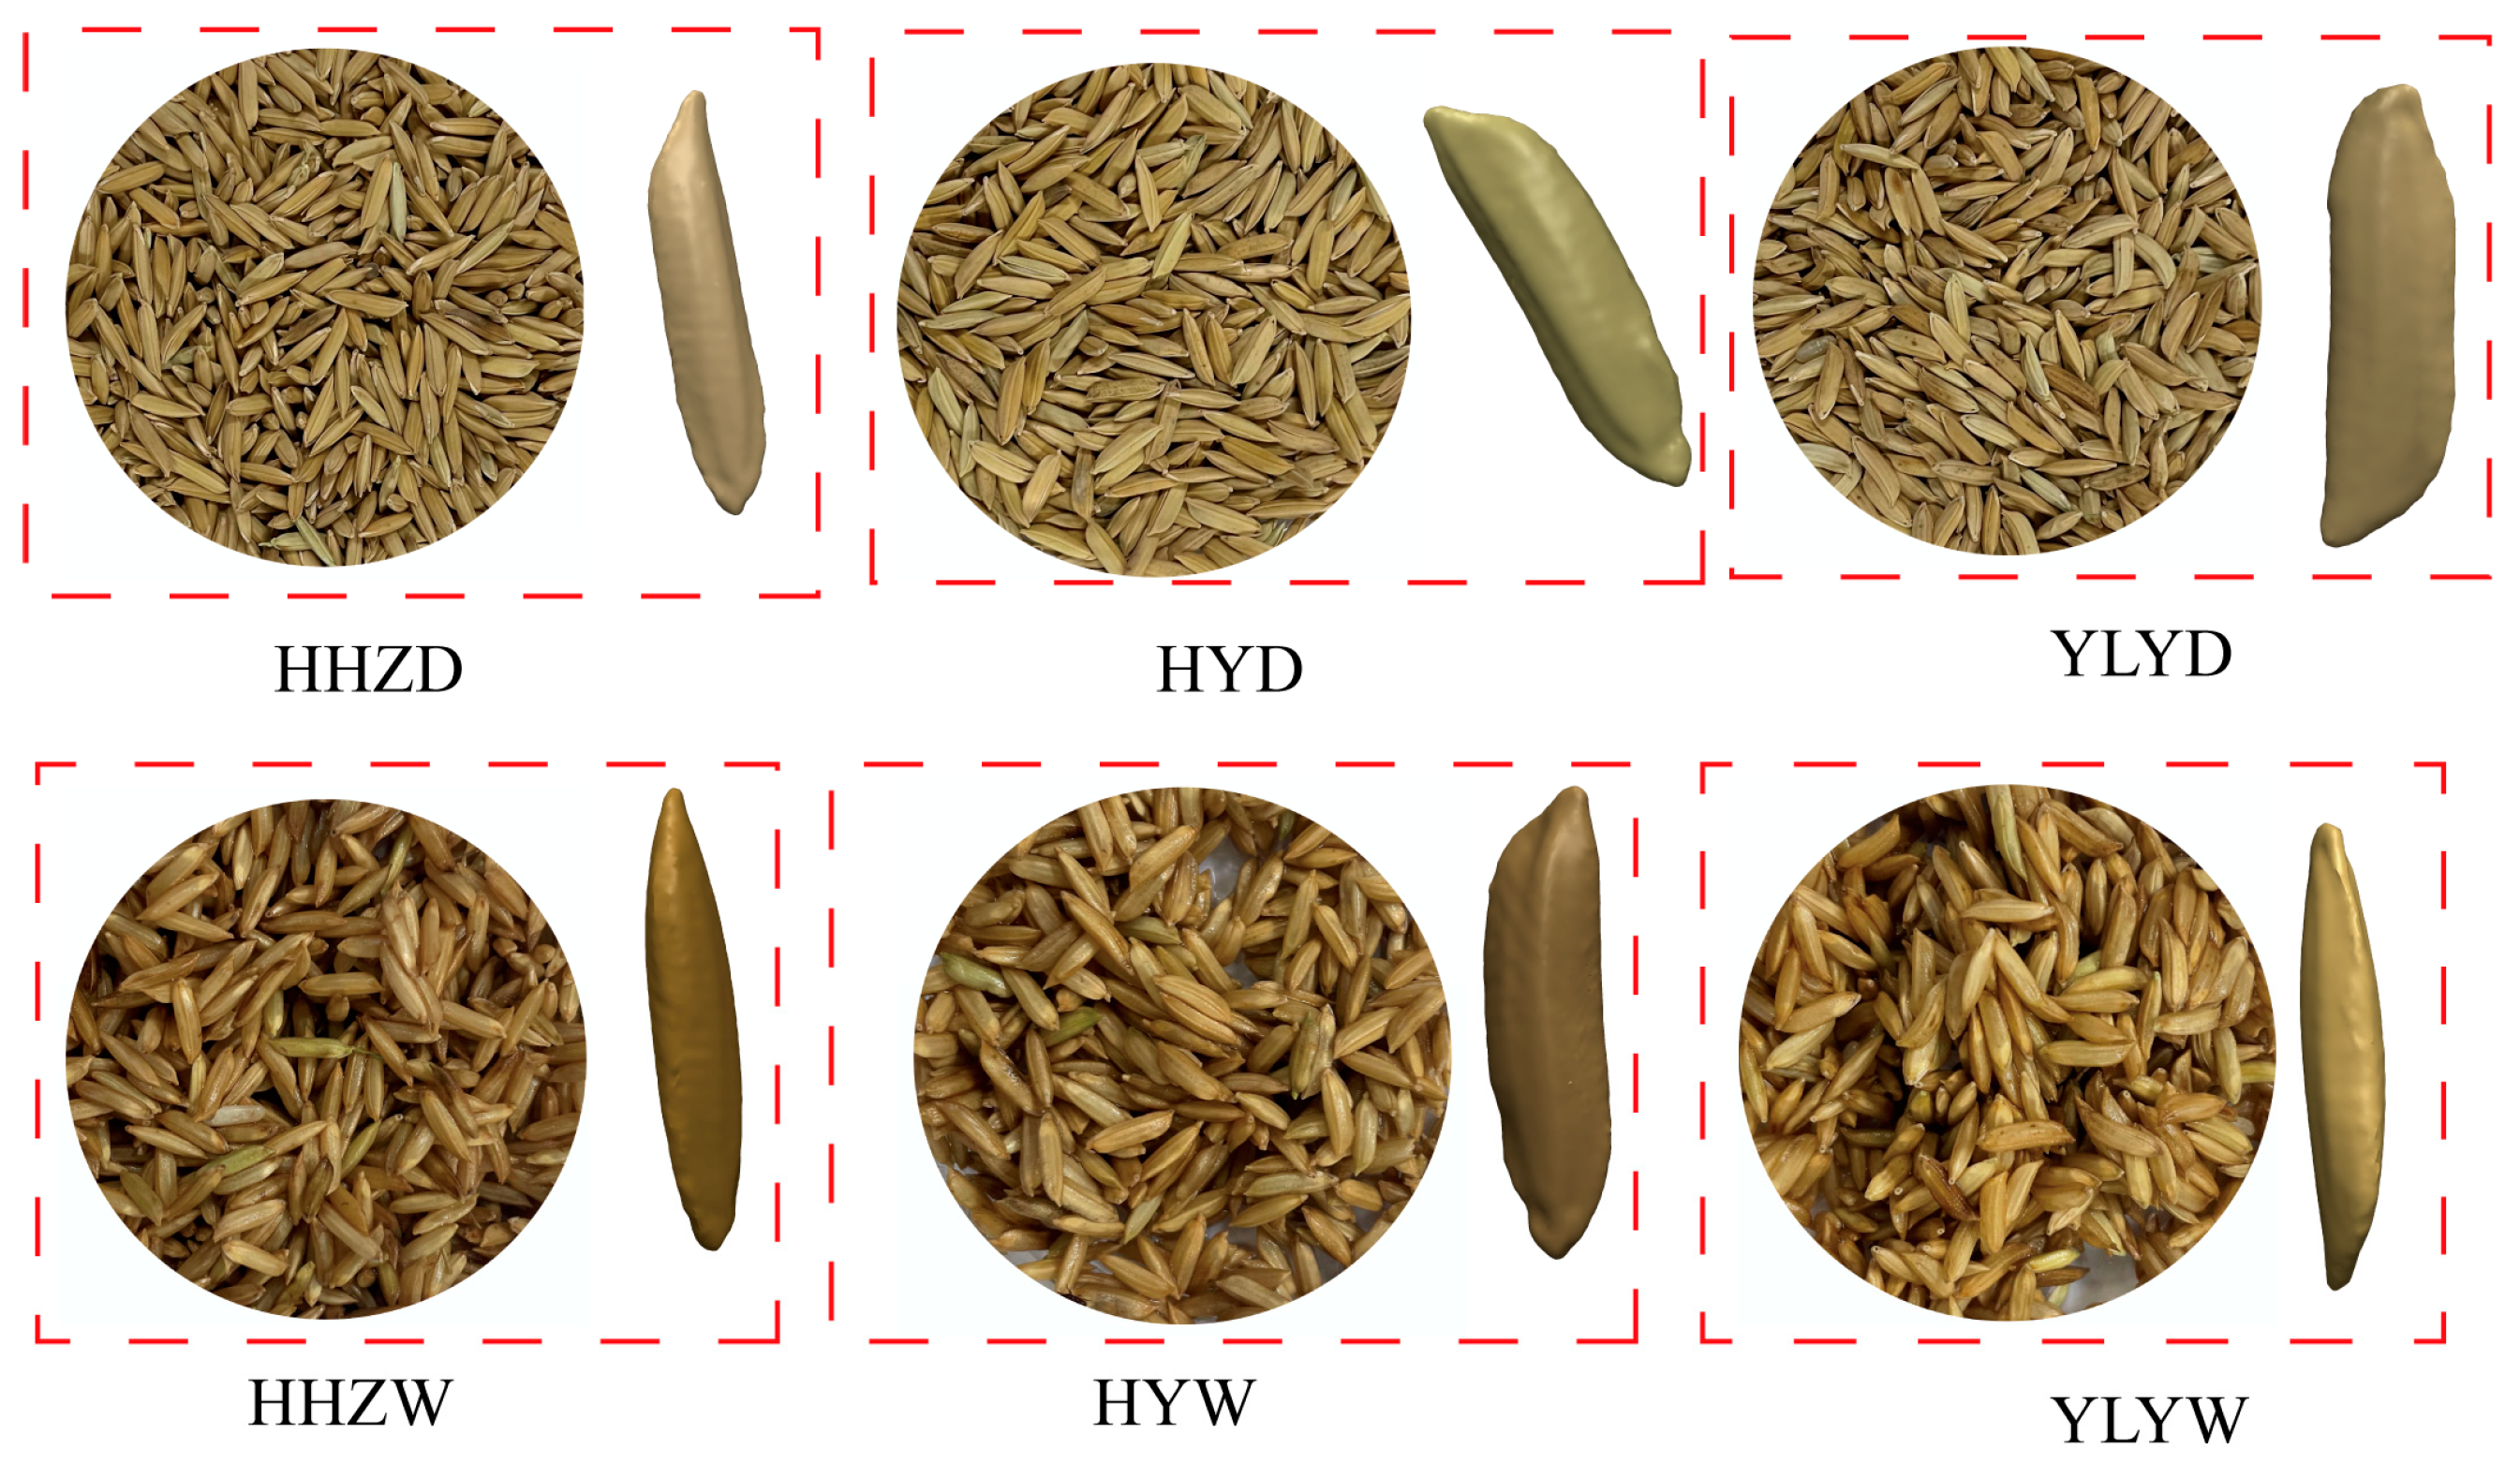
2.1.1. Rice Seeds

The three types of rice, Huanghuazhan, Hanyou 73, and Yliangyou 900, are characterized by high yield, high quality, wide adaptability, and strong resistance. They are commonly used for direct seeding and have large differences in external dimensions. Hence, Huanghuazhan, Hanyou 73, and Yliangyou 900 were selected to measure the physical characteristics of the rice varieties to provide a basis for the numerical simulation of the air-suction seed metering device. Rice samples were divided into two groups, one with pre-germination treatment (wet seeds) and one without pre-germination treatment (dry seeds). The rice seeds were pre-germinated by thoroughly soaking the seeds in water, removing any impurities or empty husks floating on the surface of the water, and soaking the seeds for 24 h. The soaked seeds were drained and spread flat in a ventilated area for about 6 h to avoid the formation of agglomerates in wet rice seeds.

2.1.2. Size, Thousand-Grain Weight, and Density

The dimensions of the rice seeds were measured using a vernier caliper with an accuracy of 0.01 mm, and the sample size was 100. The thousand-grain weight was determined by counting the seeds on a seed counting board and weighing them on an electronic scale with a precision of 0.01 g. The average value was calculated from three measurements. The density of the rice was calculated using the formula in Equation (1), and the volume of the rice seed model was obtained using SolidWorks 2021
ρ = m t 1000 V t
where ρ is density of rice, g/cm3; mt is the thousand-grain weight of rice, g; and Vt is the volume of rice, cm3.

2.1.3. Contact Parameters

The contact parameters include the friction coefficient and collision recovery coefficient, in which the friction coefficient is divided into static and dynamic friction coefficients. Determining the contact parameters is important for studying the interaction between the seeds and the seed metering device. The inclinometer method can measure the static friction coefficient, and simulation tests will calibrate the dynamic friction coefficient. The static friction coefficient includes the static friction coefficient between the seed and the static friction coefficient between the seed and the seed metering device. Suppose the inclinometer method measures the static friction coefficient between the seed and the seed, a large error will occur in that case, so only the static friction coefficient between the seed and the seed metering device is measured. The test device of the static friction coefficient includes the inclined plane device and the electronic protractor. First, six rice seeds were glued to the same plastic plane to increase the number of seeds in each trial to minimize the measurement error. Then, a resin plate (the material used to make the seed metering device) was fixed on the inclinometer, and the rice seeds came into contact with the resin plate. Rotating the handle increased the inclination angle of the inclinometer until the seeds slid, and the inclinometer on the inclinometer could measure the inclination angle (as shown in Figure 1). While rotating the handle to tilt the inclinometer until the seed slides, the seed sliding process is played back in slow motion after the test is completed to determine the critical tilt angle for seed sliding. According to Equation (2) [35], the coefficient of static friction between the seed and the seed metering device (SPG) can be obtained.
S P G = tan θ
where SPG is the coefficient of static friction between the seed and the metering device; θ is the angle as the seed slides, °.
The restitution coefficient is defined as the ratio of the relative velocity of the two objects after the collision to the absolute value of the relative velocity of the two objects before the collision. The collision between the seed and the seed metering device is inelastic, and the drop method is usually used to determine the restitution coefficient. Assuming that the air resistance is ignored, the seed starts free-fall movement from the initial height h0 from the resin plate, the seed rebounds after collision with the resin plate, and the maximum height of the seed after rebound is measured h1. The restitution coefficient of the collision between the seed and the seed metering device (RPG) can be calculated according to Equation (3) [36]. The restitution coefficient measurement process is shown in Figure 2. Firstly, the resin flat plate is aligned with the scale of the coordinate paper by lifting the platform so that the seed is suctioned on the vacuum suction head. Then, the fan power is turned off, and due to the loss of suction force, the seed falls from the vacuum suction head and starts a free-fall motion, and the collision process is recorded at 960 frames per second.
R P G = h 1 h 0

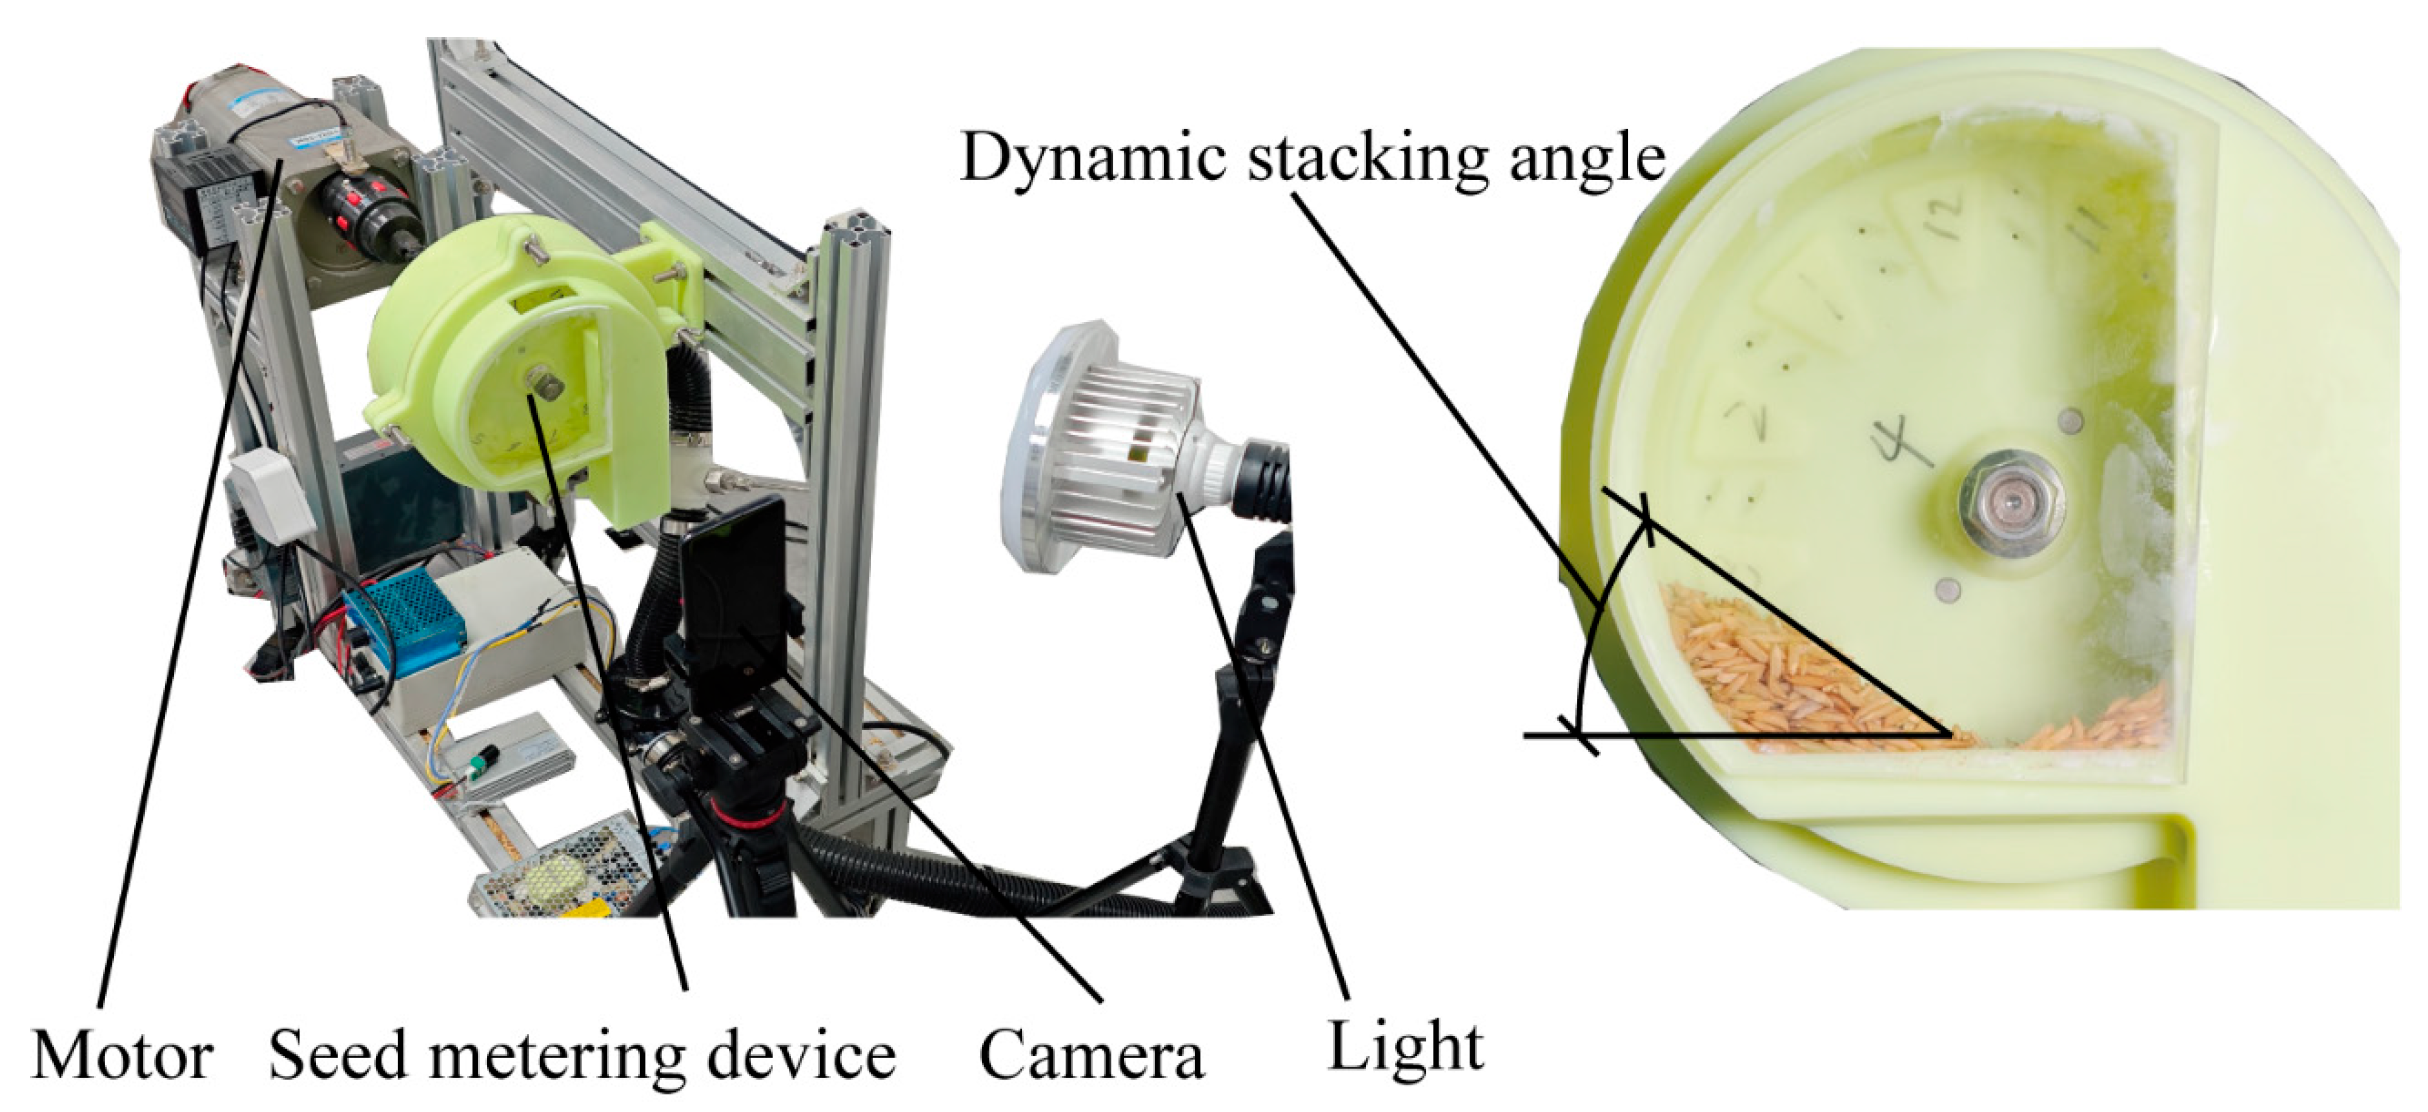
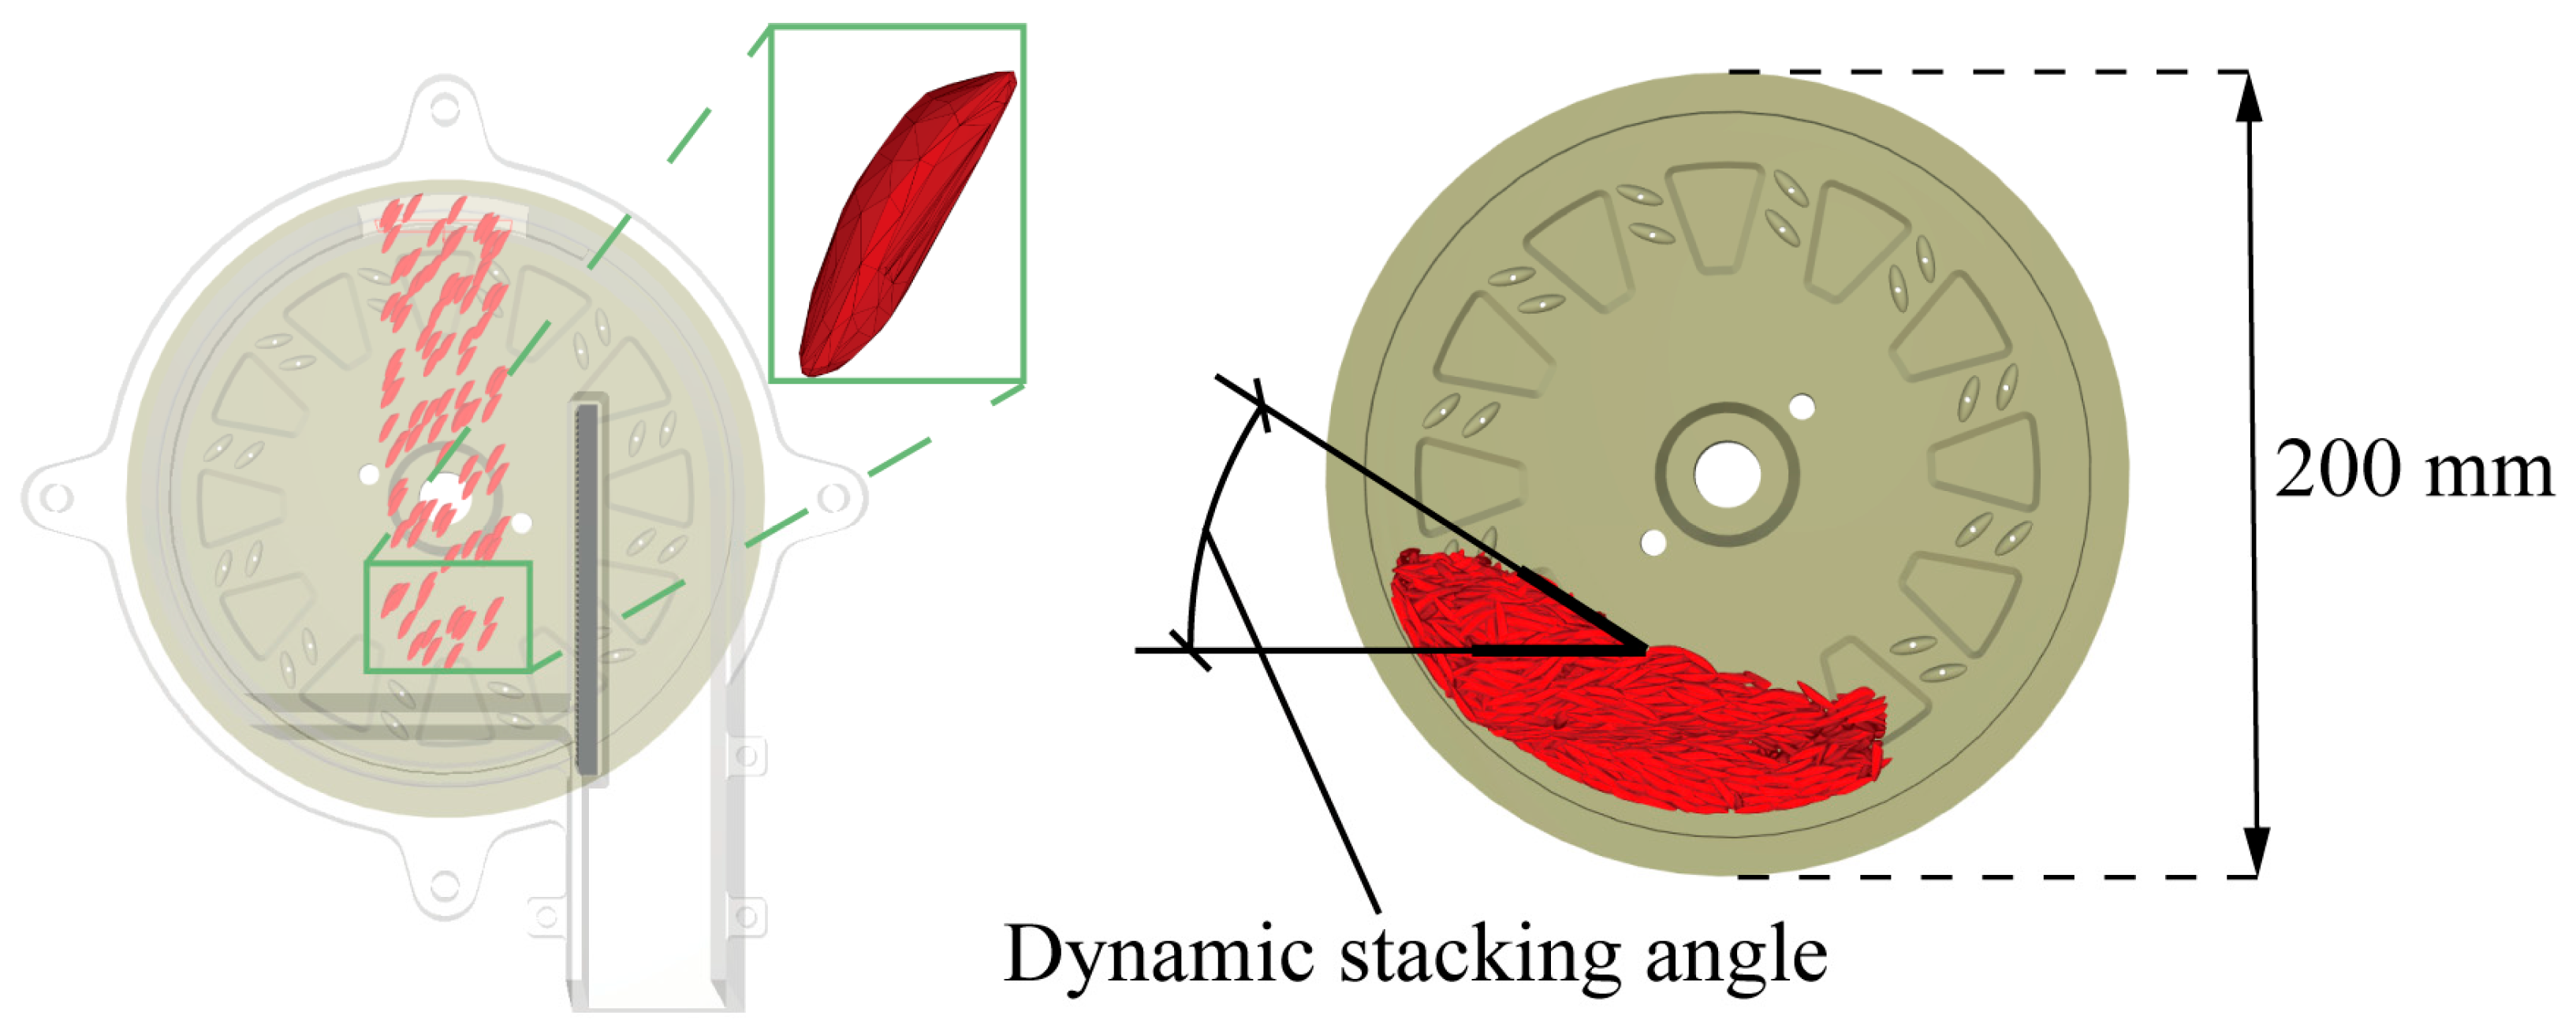
2.1.4. Dynamic Stacking Angle

The dynamic stacking angle of rice seeds in the seed metering device must be determined to calibrate the parameters of different rice seed discrete element models. The experiment was conducted without vacuum pressure in the air-suction seed metering device, with only the disk rotating at 40 rpm (Figure 3). For each experiment, the volume of rice seeds used was 100 mL. The movement of the seeds in the metering device was recorded at 240 frames per second, and the dynamic stacking angles of the rice seeds were measured.

2.2. Parameter Calibration of the Discrete Elemental Model of Rice Seed

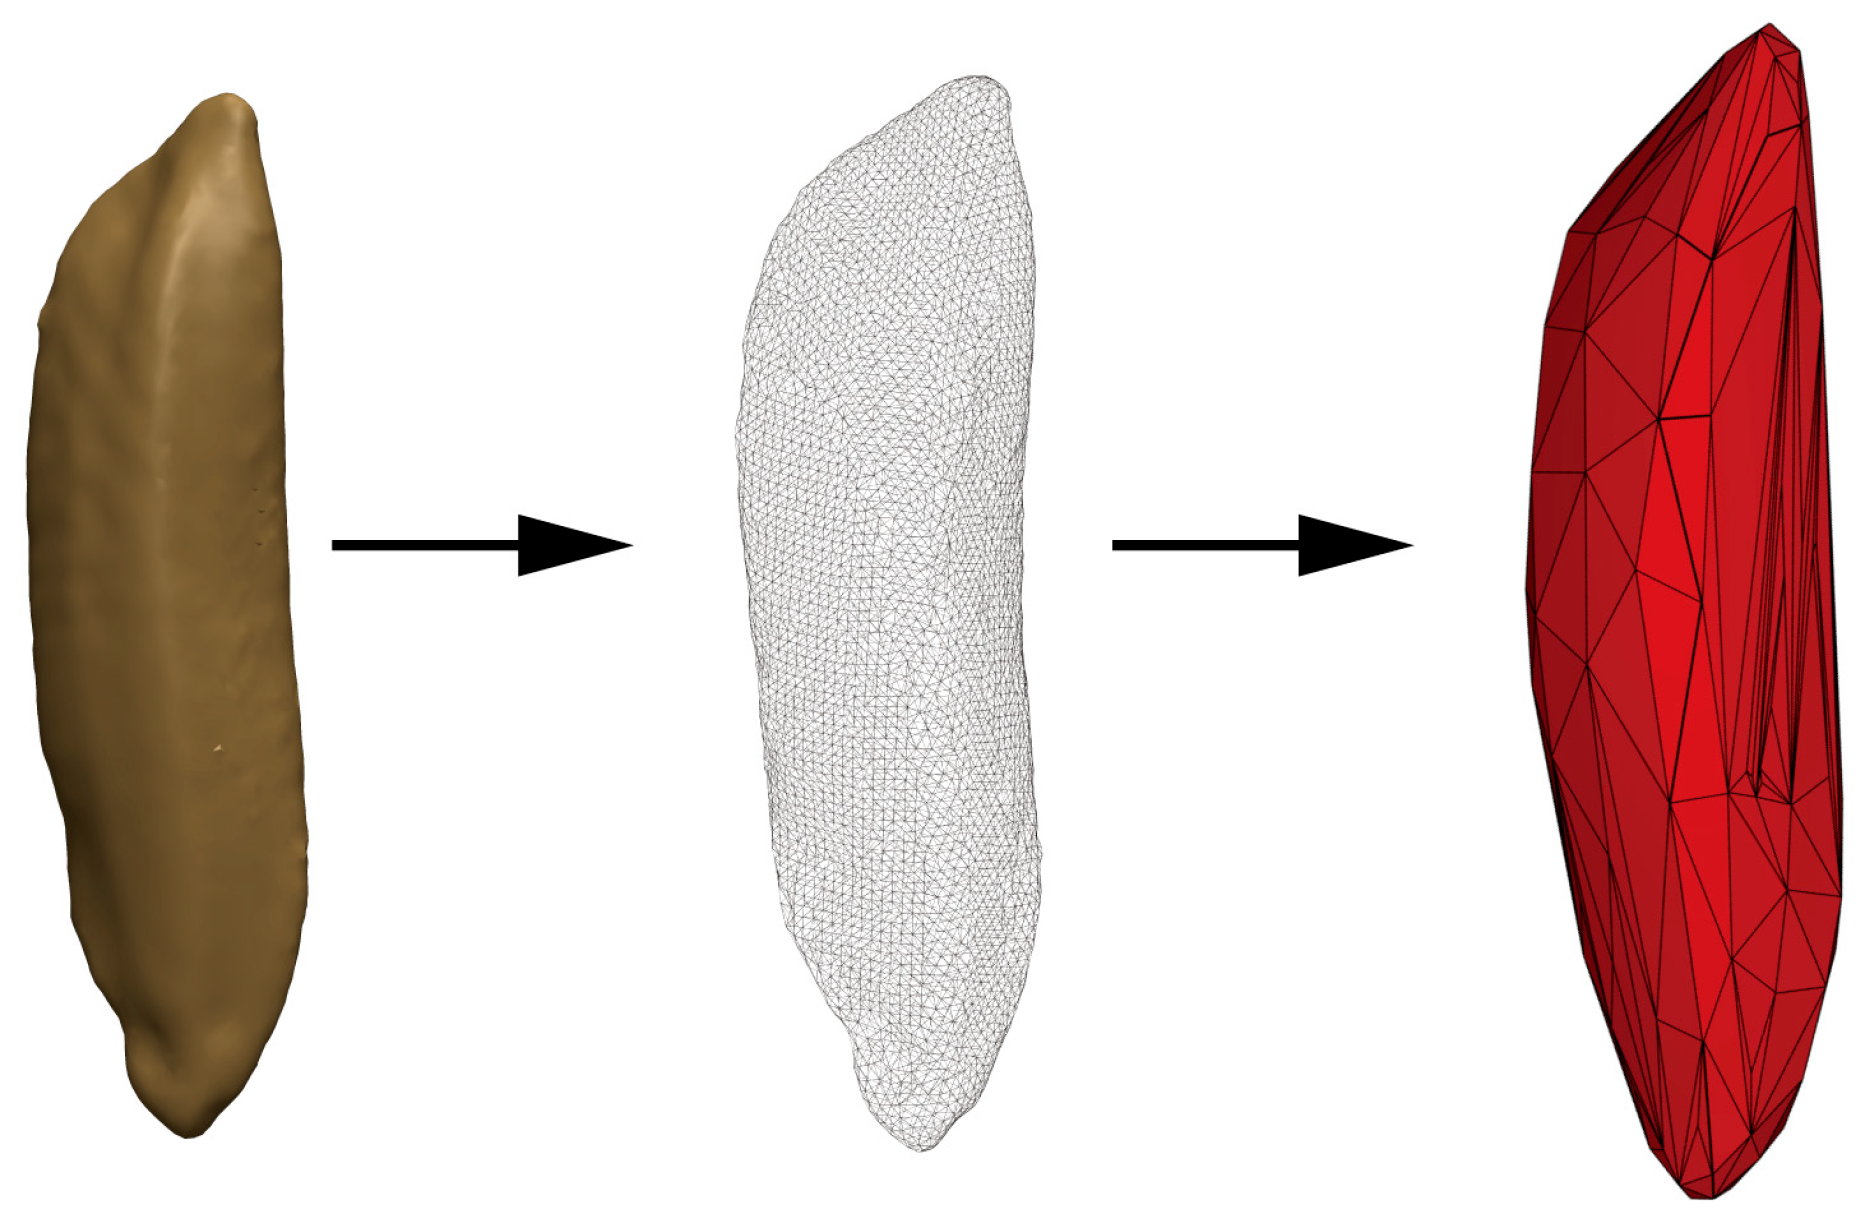
2.2.1. Modeling Methods

Rocky discrete element software was used to model the rice seeds. The modeling process of rice seed is shown in Figure 4, where the geometric model of rice seed is obtained by the inverse modeling technique, the geometric model is imported into the Rocky 2024 software, the triangular faceted data of the geometric model are extracted, and the discrete elemental model of rice seed is finally established. The normal force contact model for rice seeds is the Hysteretic linear spring model, while the tangential force contact model is the linear spring Coulomb limit model. The contact parameters for the discrete element models of the different wet and dry rice seeds vary, requiring calibration through dynamic stacking angle simulation experiments. The rotational speed of the simulation test should be consistent with the physical dynamic stacking angle test, which was set at 40 rpm. The time of the simulation test was 10 s to ensure that the stacking angle of the rice seeds was stabilized. The dynamic stacking angle stabilized when the simulation test was 7 s. Therefore, the dynamic stacking angles of 8 s, 9 s, and 10 s were chosen to be recorded as the results of each test (Figure 5). According to related studies [37,38,39], the intrinsic and contact parameters of the material are shown in Table 1 and Table 2.

2.2.2. Experimental Design

Experimental factors include seed type and contact parameters (DPG, DPP, RPP, and SPP). All different rice seeds adopt the same modeling method and contact model. The differences among different rice seeds mainly lie in their intrinsic parameters, contact parameters, and seed shapes. Thus, the influence and significance of the contact parameters of different rice seeds on the dynamic stacking angle are consistent, and a preliminary test has also verified this result. We can reduce the number of tests by selecting only one type of rice seed to conduct a single-factor test to determine the contact parameters that significantly impact the dynamic stacking angle.
Firstly, a discrete element model was developed for HYW, and a single-factor experiment was conducted to identify the factors affecting the dynamic stacking angle. The fixed values of DPG, DPP, RPP, and SPP were set to 0.6, 0.6, 0.35, and 0.7, respectively. Fixed values are the level values of the remaining test factors for conducting a single-factor experiment of a particular factor. Then, based on the results of the one-factor experiment, two-factor experiment, and the optimization test, investigations were conducted to determine the optimal parameter combinations for the factors with significant effects.

2.3. Seeding Accuracy Test

The main structure of the air-suction seed metering device for rice is shown in Figure 6, which is mainly composed of the seed chamber, brush, seed protection ring, disc, seal ring, clearing hole device, and air chamber. Unlike other air-suction seed metering devices, this seed metering device contains double suction holes per set of holes. The seeding bench is shown in Figure 7 and includes the air-suction seed metering device for the rice, motor, DC fan, hall sensor, air pressure sensor, motor governor, fan governor, camera, and light.
The motor governor adjusts the rotational speed of the seed metering device with an accuracy of ±1 r/min, and the fan governor adjusts the vacuum pressure of the seed metering device with an accuracy of ±0.05 kPa. The Hall sensor and the air pressure sensor mainly measure the rotational speed and vacuum pressure of the seed metering device, which facilitates the precise adjustment of the rotational speed and the vacuum pressure. The working process of the seed metering device was filmed and recorded at a filming frame rate of 240 frames/second by the camera. Subsequently, the number of seeds suctioned by each set of suction holes of the seed metering device was counted manually based on the filmed video.
The motor and fan governor controlled the experiment’s vacuum pressure and rotational speed. In each experiment, the rice seed filling of 360 sets of suction holes was counted and repeated three times. The test indices included the missing index, single index, double index, triple index, and multiple index. The test indicators were calculated according to Equation (4).
Q 0 = N 0 360 × 100 % Q 1 = N 1 360 × 100 % Q 2 = N 2 360 × 100 % Q 3 = N 3 360 × 100 % Q 4 = N 4 360 × 100 %
where Q0, Q1, Q2, Q3, and Q≥4 are the missing index, single index, double index, triple index, and multiple index, respectively; N0, N1, N2, N3, and N≥4 refer to the number of seeds that were 0, 1, 2, 3, and ≥4 on each set of suction holes at the time of testing, respectively.

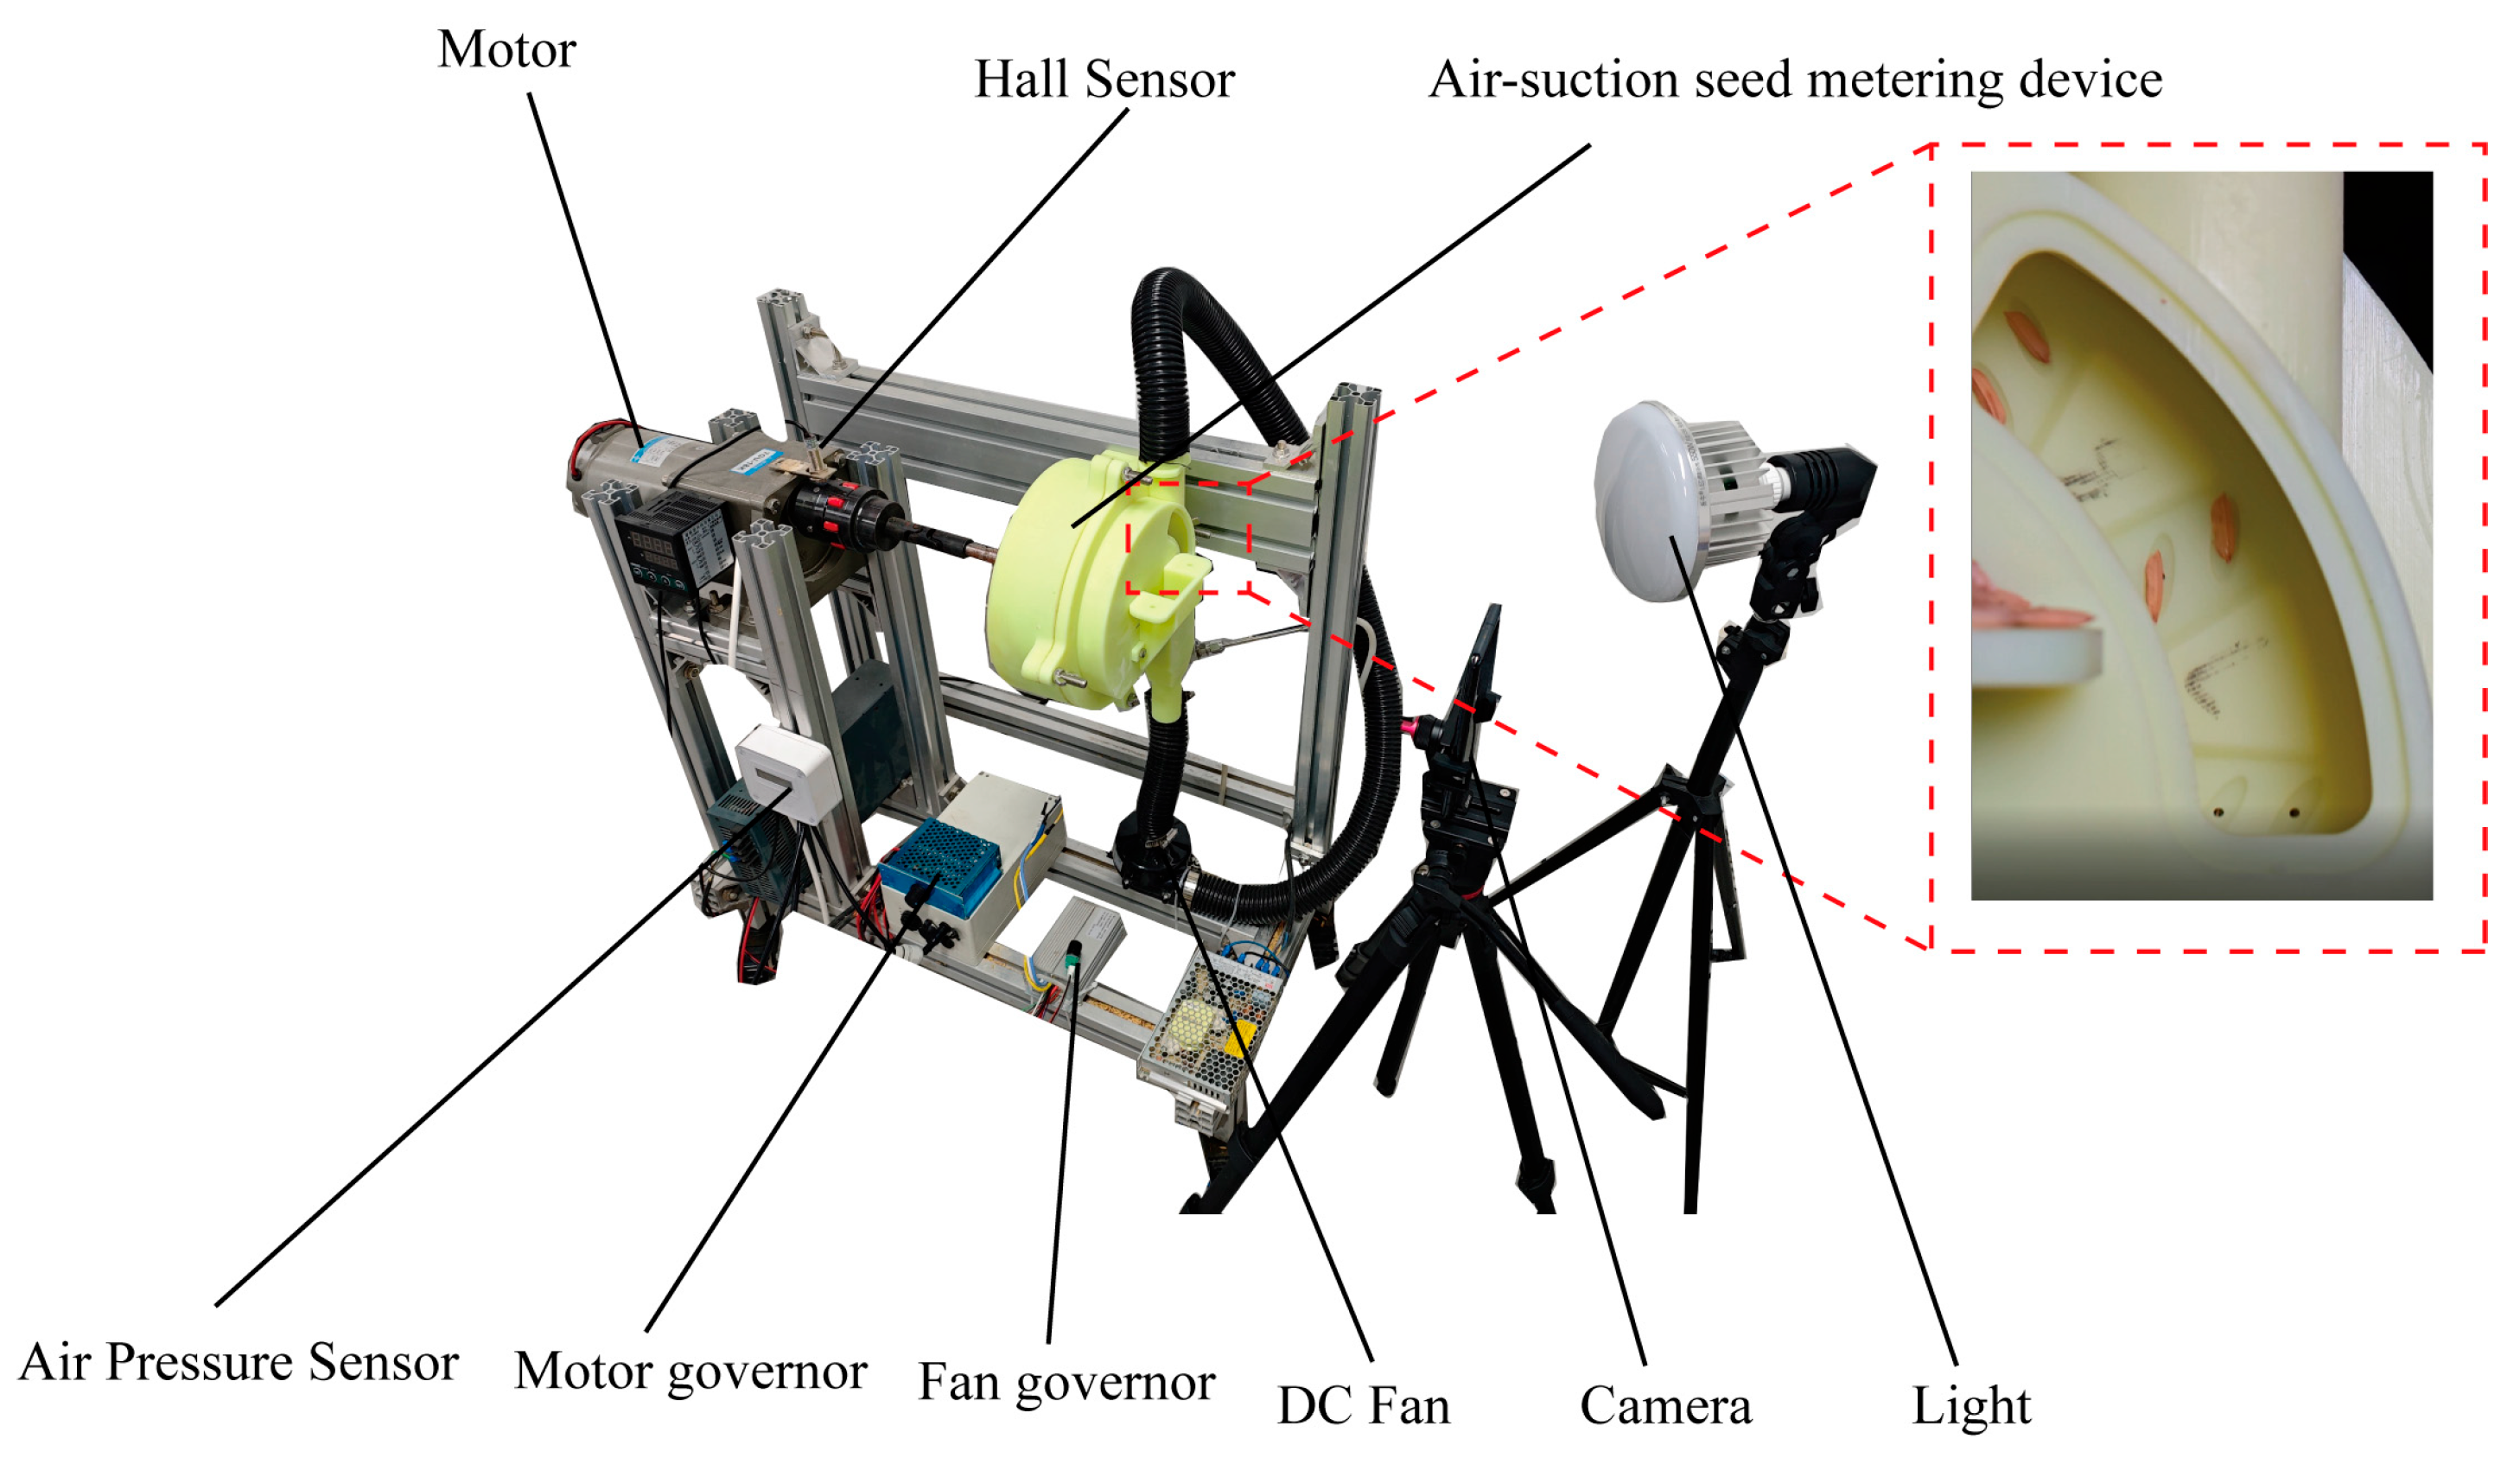
2.4. CFD-DEM Two-Way Coupled Numerical Simulation

2.4.1. Theoretical Equations of CFD-DEM

Energy exchange is not considered in the numerical simulation of the air-suction seed metering device. The mass and momentum Equations of the fluid flow are solved using the finite volume method in Ansys Fluent 2024. The coupling between the particles and the fluid is achieved through the momentum exchange source term, which arises from the interaction between the particle phase and the fluid phase.
In the discrete cell method, the motion of the particles is tracked using the Lagrange approach, which is implemented by explicitly solving Euler’s first (Equation (5)) and second (Equation (6)) laws.
m p d v p d t = F c + F f p + m p g
I p d ω p d t = M c + M f p
where mp is the mass of the particle, kg; vp is the velocity of the particle, m/s; Fc is the contact force interacting between the particle and the particle and between the particle and the wall, N; g is the gravitational acceleration vector, m/s2; Ffp is the external force of the fluid acting on the particle, N; Ip is the moment of inertia of the particle, N·m; ωp is the angular velocity vector, rad/s; Mc is the combined torque caused by the tangential force to make the particle rotate, N·m; and Mfp is the external torque caused by the gradient of the velocity of the fluid phase, N·m.
According to Equation (7), the external forces Ffp acting on the particles by the fluid mainly include the drag force FD, the pressure gradient force Fp, the lift force FL, the virtual mass force FVM, and other forces due to the motion of the fluid Fothers. According to the physical properties of the fluid, most of these forces can be neglected. Only the drag force and the pressure gradient force need to be considered, especially in the case of particles where the density of the particles is much higher than the density of the fluid.
F f p = F D + F p + F L + F V M + F o t h e r s
The drag force FD and the pressure gradient force Fp can be calculated according to Equations (8) and (9), respectively.
F D = 1 2 C D ρ f A u v p 2
where CD is the drag force coefficient, ρf is the density of the fluid, g/cm3; A the projected area of the particle in the direction of the fluid, m2; and u is the velocity vector of the fluid, m/s.
F p = V p p
where Vp is the volume of the particle, m3; ∇p is the local pressure gradient, Pa/m.
The fluid motion is described according to the Navier–Stokes equations, the mass conservation equation is Equation (10), and the momentum conservation Equation is Equation (11).
t α f ρ f + α f ρ f u = 0
t α f ρ f u + α f ρ f u u = α f p + α f τ + α f ρ f g + S f p
where αf is the volume fraction of the fluid, τ is the stress tensor of the fluid phase, Pa; and Sfp is the interphase momentum exchange source term, N∙s.

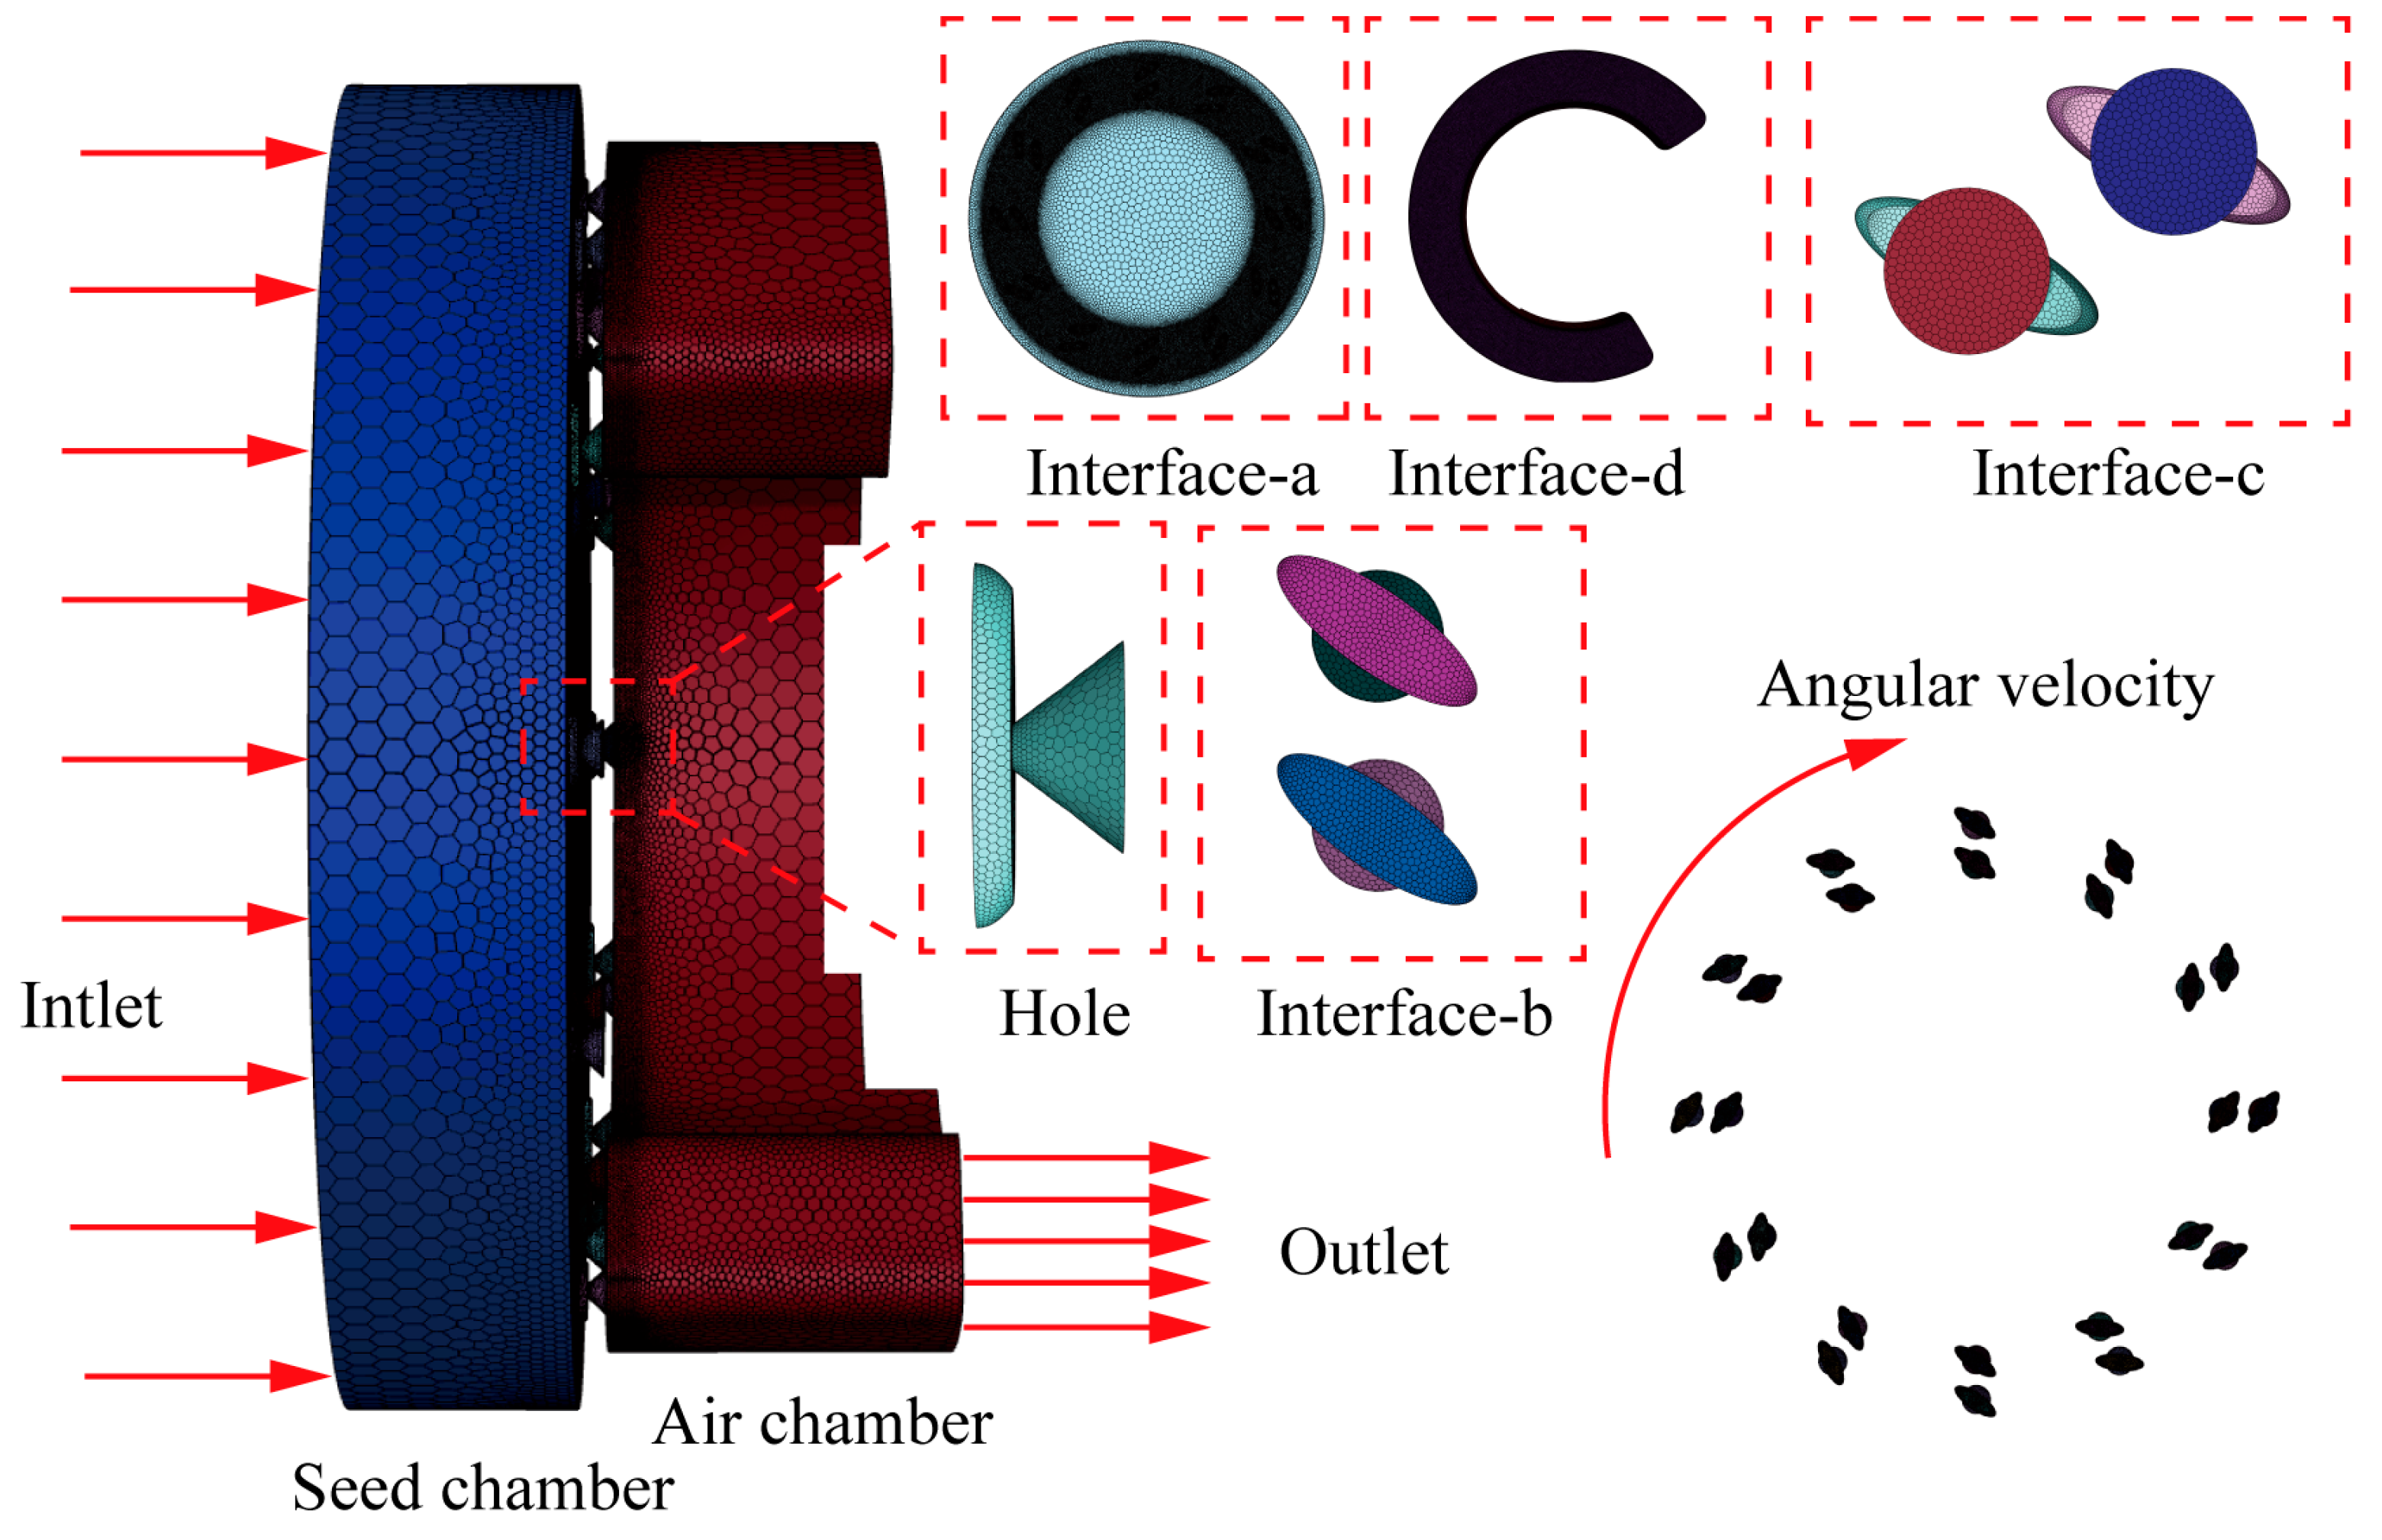
2.4.2. Fluid Domain Meshing

The fluid domain of the air-suction seed metering device primarily consists of a seed chamber, suction holes, and an air chamber. First, Ansys Space Claim defines the fluid domain boundary conditions, such as inlet, outlet, wall, and interface. When performing mesh generation for the fluid domain using Fluent Meshing, local refinement is applied to the seed chamber and the intersection surfaces of the gas suction and suction holes to improve the convergence of the calculations. A polyhedral mesh is used for body meshing, which reduces the number of meshes by over 30% compared to a tetrahedral mesh. In order to minimize the effect of the number of meshes on the accuracy of the simulation, six sets of meshes were meshed for the fluid domain to verify the mesh independence. The test results are shown in Figure 8, and the mesh IV was determined based on the test results. The fluid domain mesh IV is shown in Figure 9. The cells, faces, and nodes of mesh are 844,353, 5,823,820 and 4,477,278. Maximum skewness values of the suction hole, gas chamber, and seed chamber are 0.23, 0.25, and 0.21, respectively. To verify the simulation accuracy, we measured the vacuum pressure values inside the simulated and experimental chambers and the results are shown in Figure 10. The simulation results are in good agreement with the experimental data as a whole, verifying the reliability of the model. The drag law is set to Haider and Levenspiel law.
Ansys Fluent is used to solve the fluid domain. For the computational fluid dynamics (CFD) analysis of the air-suction seed metering device, transient analysis is selected. The SST k-ω model is more suitable for fluid domains with rotating motions [40], and the fluid domain of this study belongs to the rotating fluid domain, so the turbulence model is set to the SST k-ω. During the operation of the seed meter, the suction hole rotates, causing the fluid domain of the suction hole to undergo a circular motion. This motion is simulated using the Mesh Motion method, with the angular velocity of the circumferential motion set accordingly. For boundary conditions, the vacuum pressure at the outlet is set to 2.6 kPa. It is because there is a large difference between wet and dry rice seeds at a vacuum pressure of 2.6 kPa. Two interface pairs are created for data exchange: one between the suction hole and the seed chamber and another between the suction hole and the gas chamber. The time step for the numerical simulation in the fluid domain is set to 0.0005 s. After 35 ~ 42 iteration steps, the residual values satisfy the convergence criteria, so the maximum number of iteration steps is 50.

2.4.3. Data Processing

The physical property parameters (density, Poisson’s ratio, and Young’s modulus) and contact parameters (static friction coefficient, dynamic friction coefficient, and restitution coefficient) of different rice seeds were set according to the calibrated experimental results. During the simulation, the disk’s rotational speed was kept consistent with that of the suction hole fluid domain. After completing the simulation, cubes were added to each suction hole. Their dimensions were adjusted to ensure that the seeds adsorbed on the suction holes could be selected Figure 11. The normal, tangential, drag, and pressure gradient forces acting on the seeds adsorbed on the suction holes were extracted. The data were divided into the seed-filling process and the seed-carrying process.

3. Results

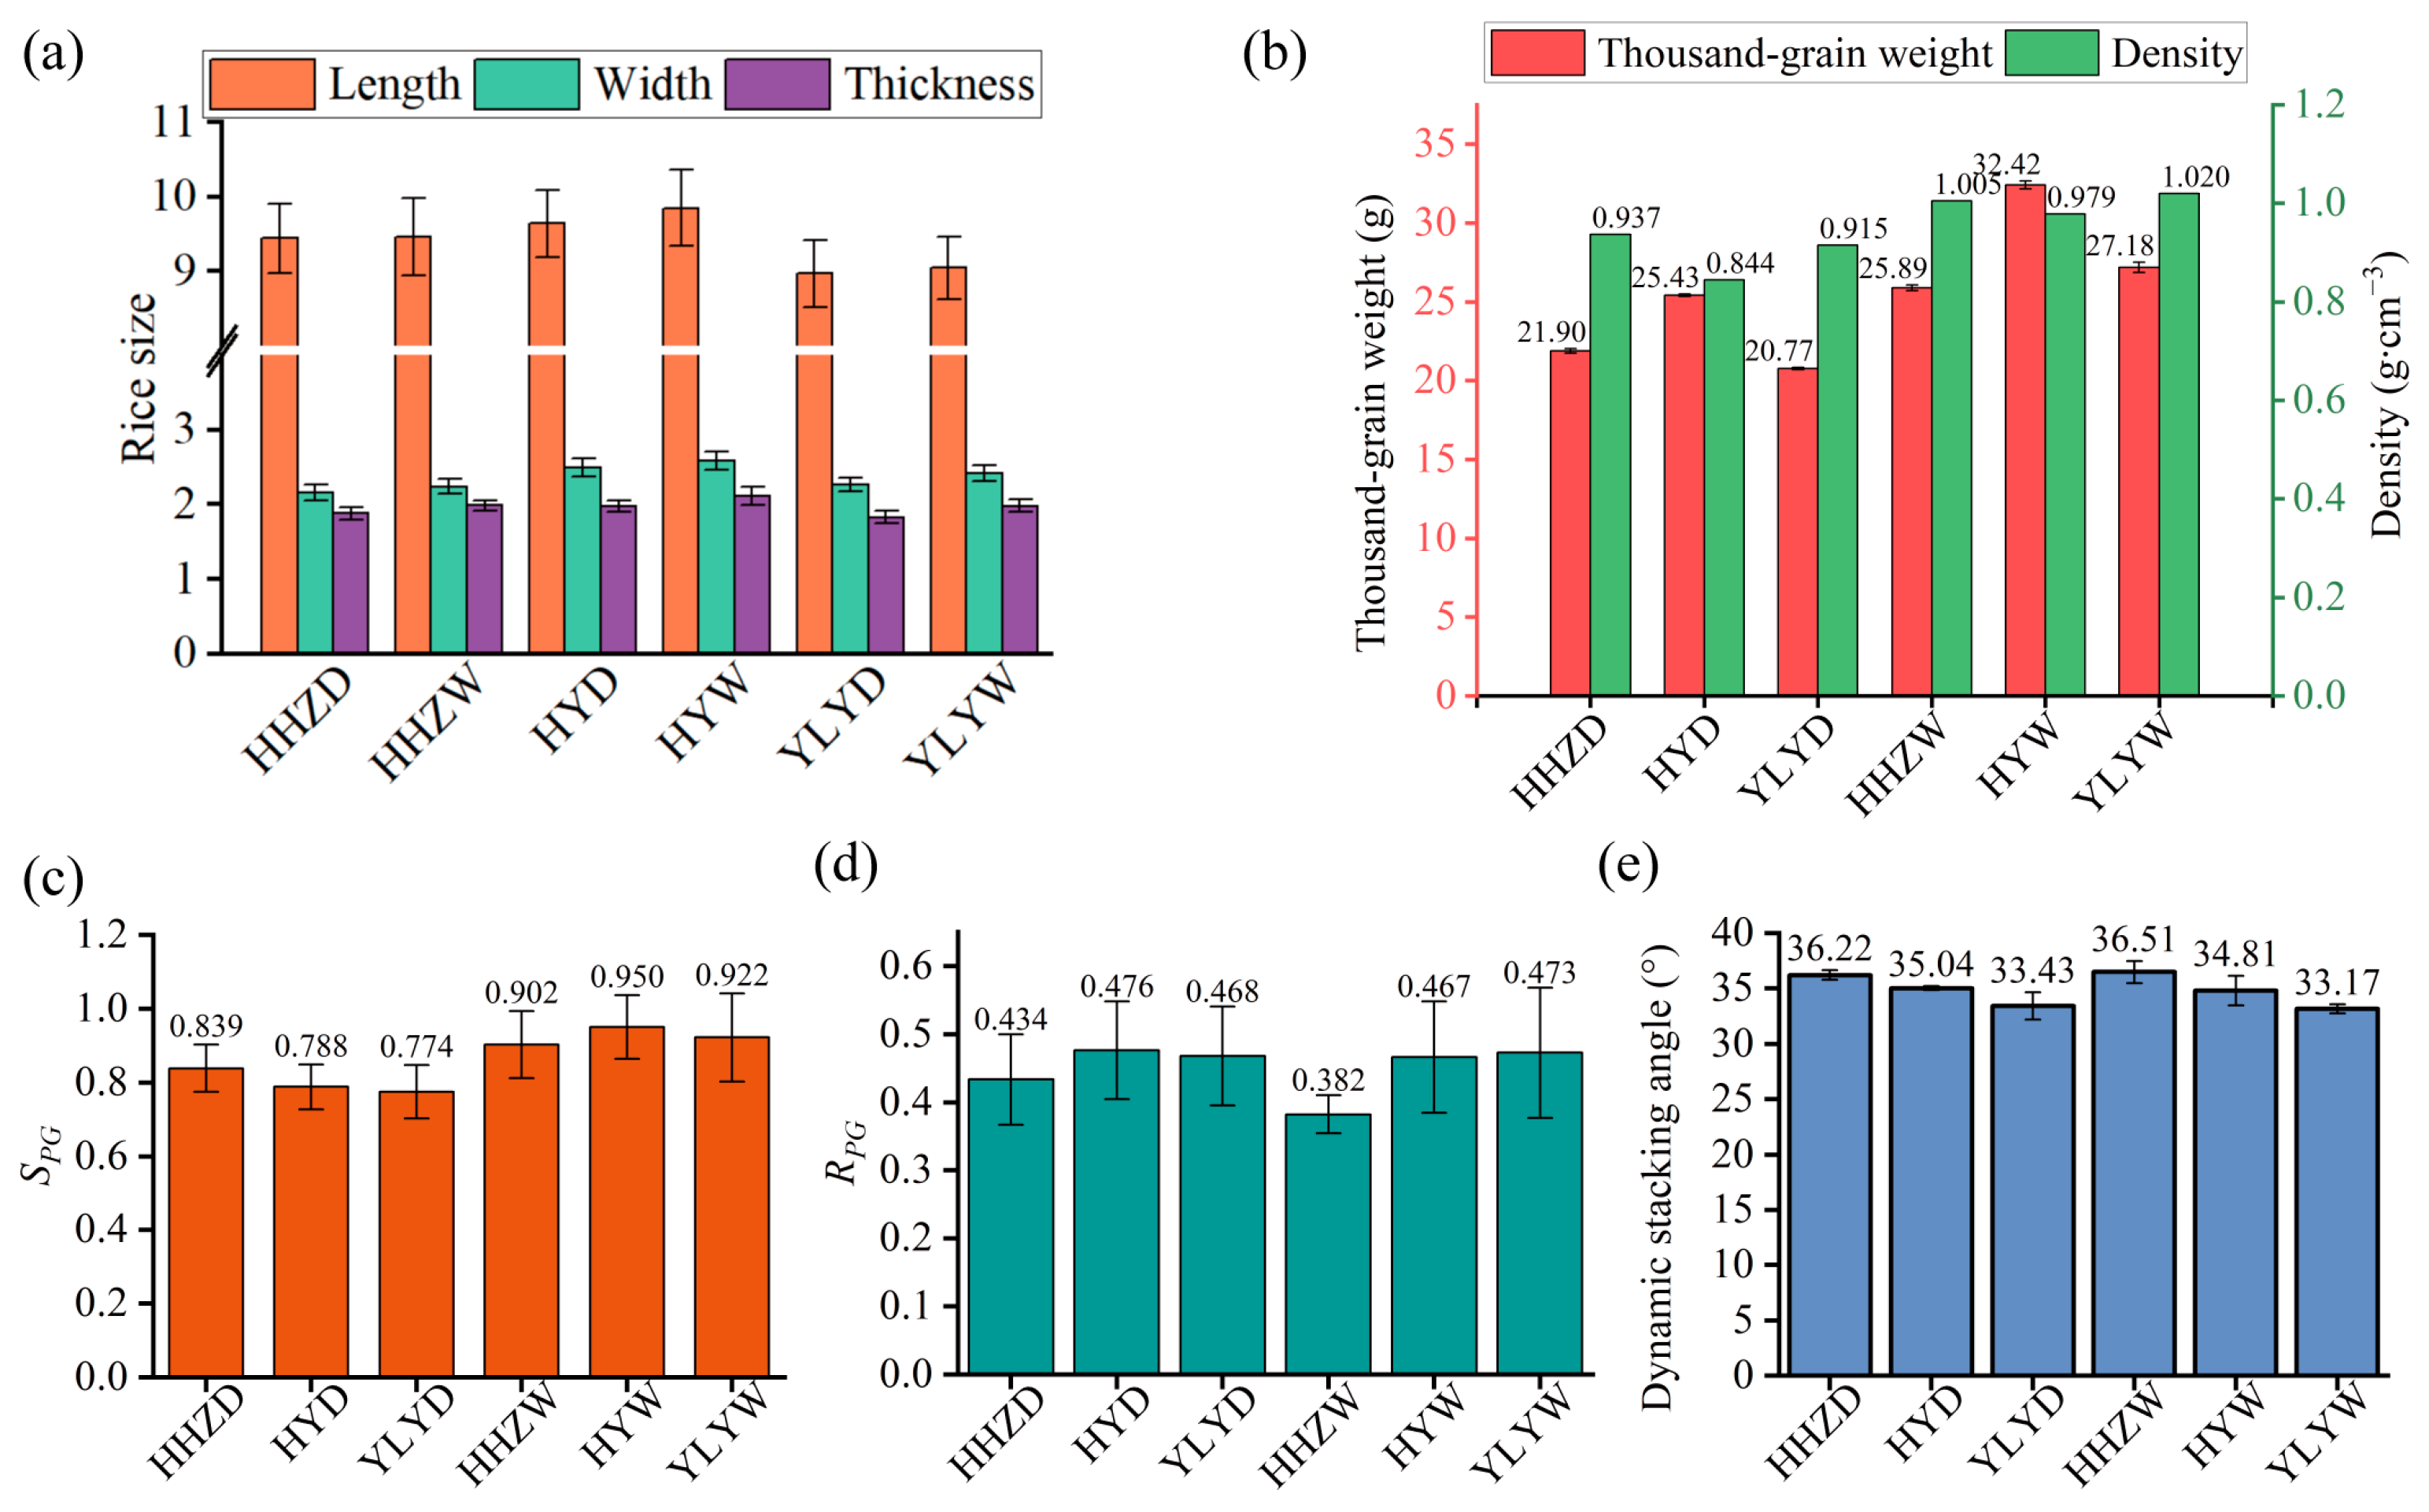
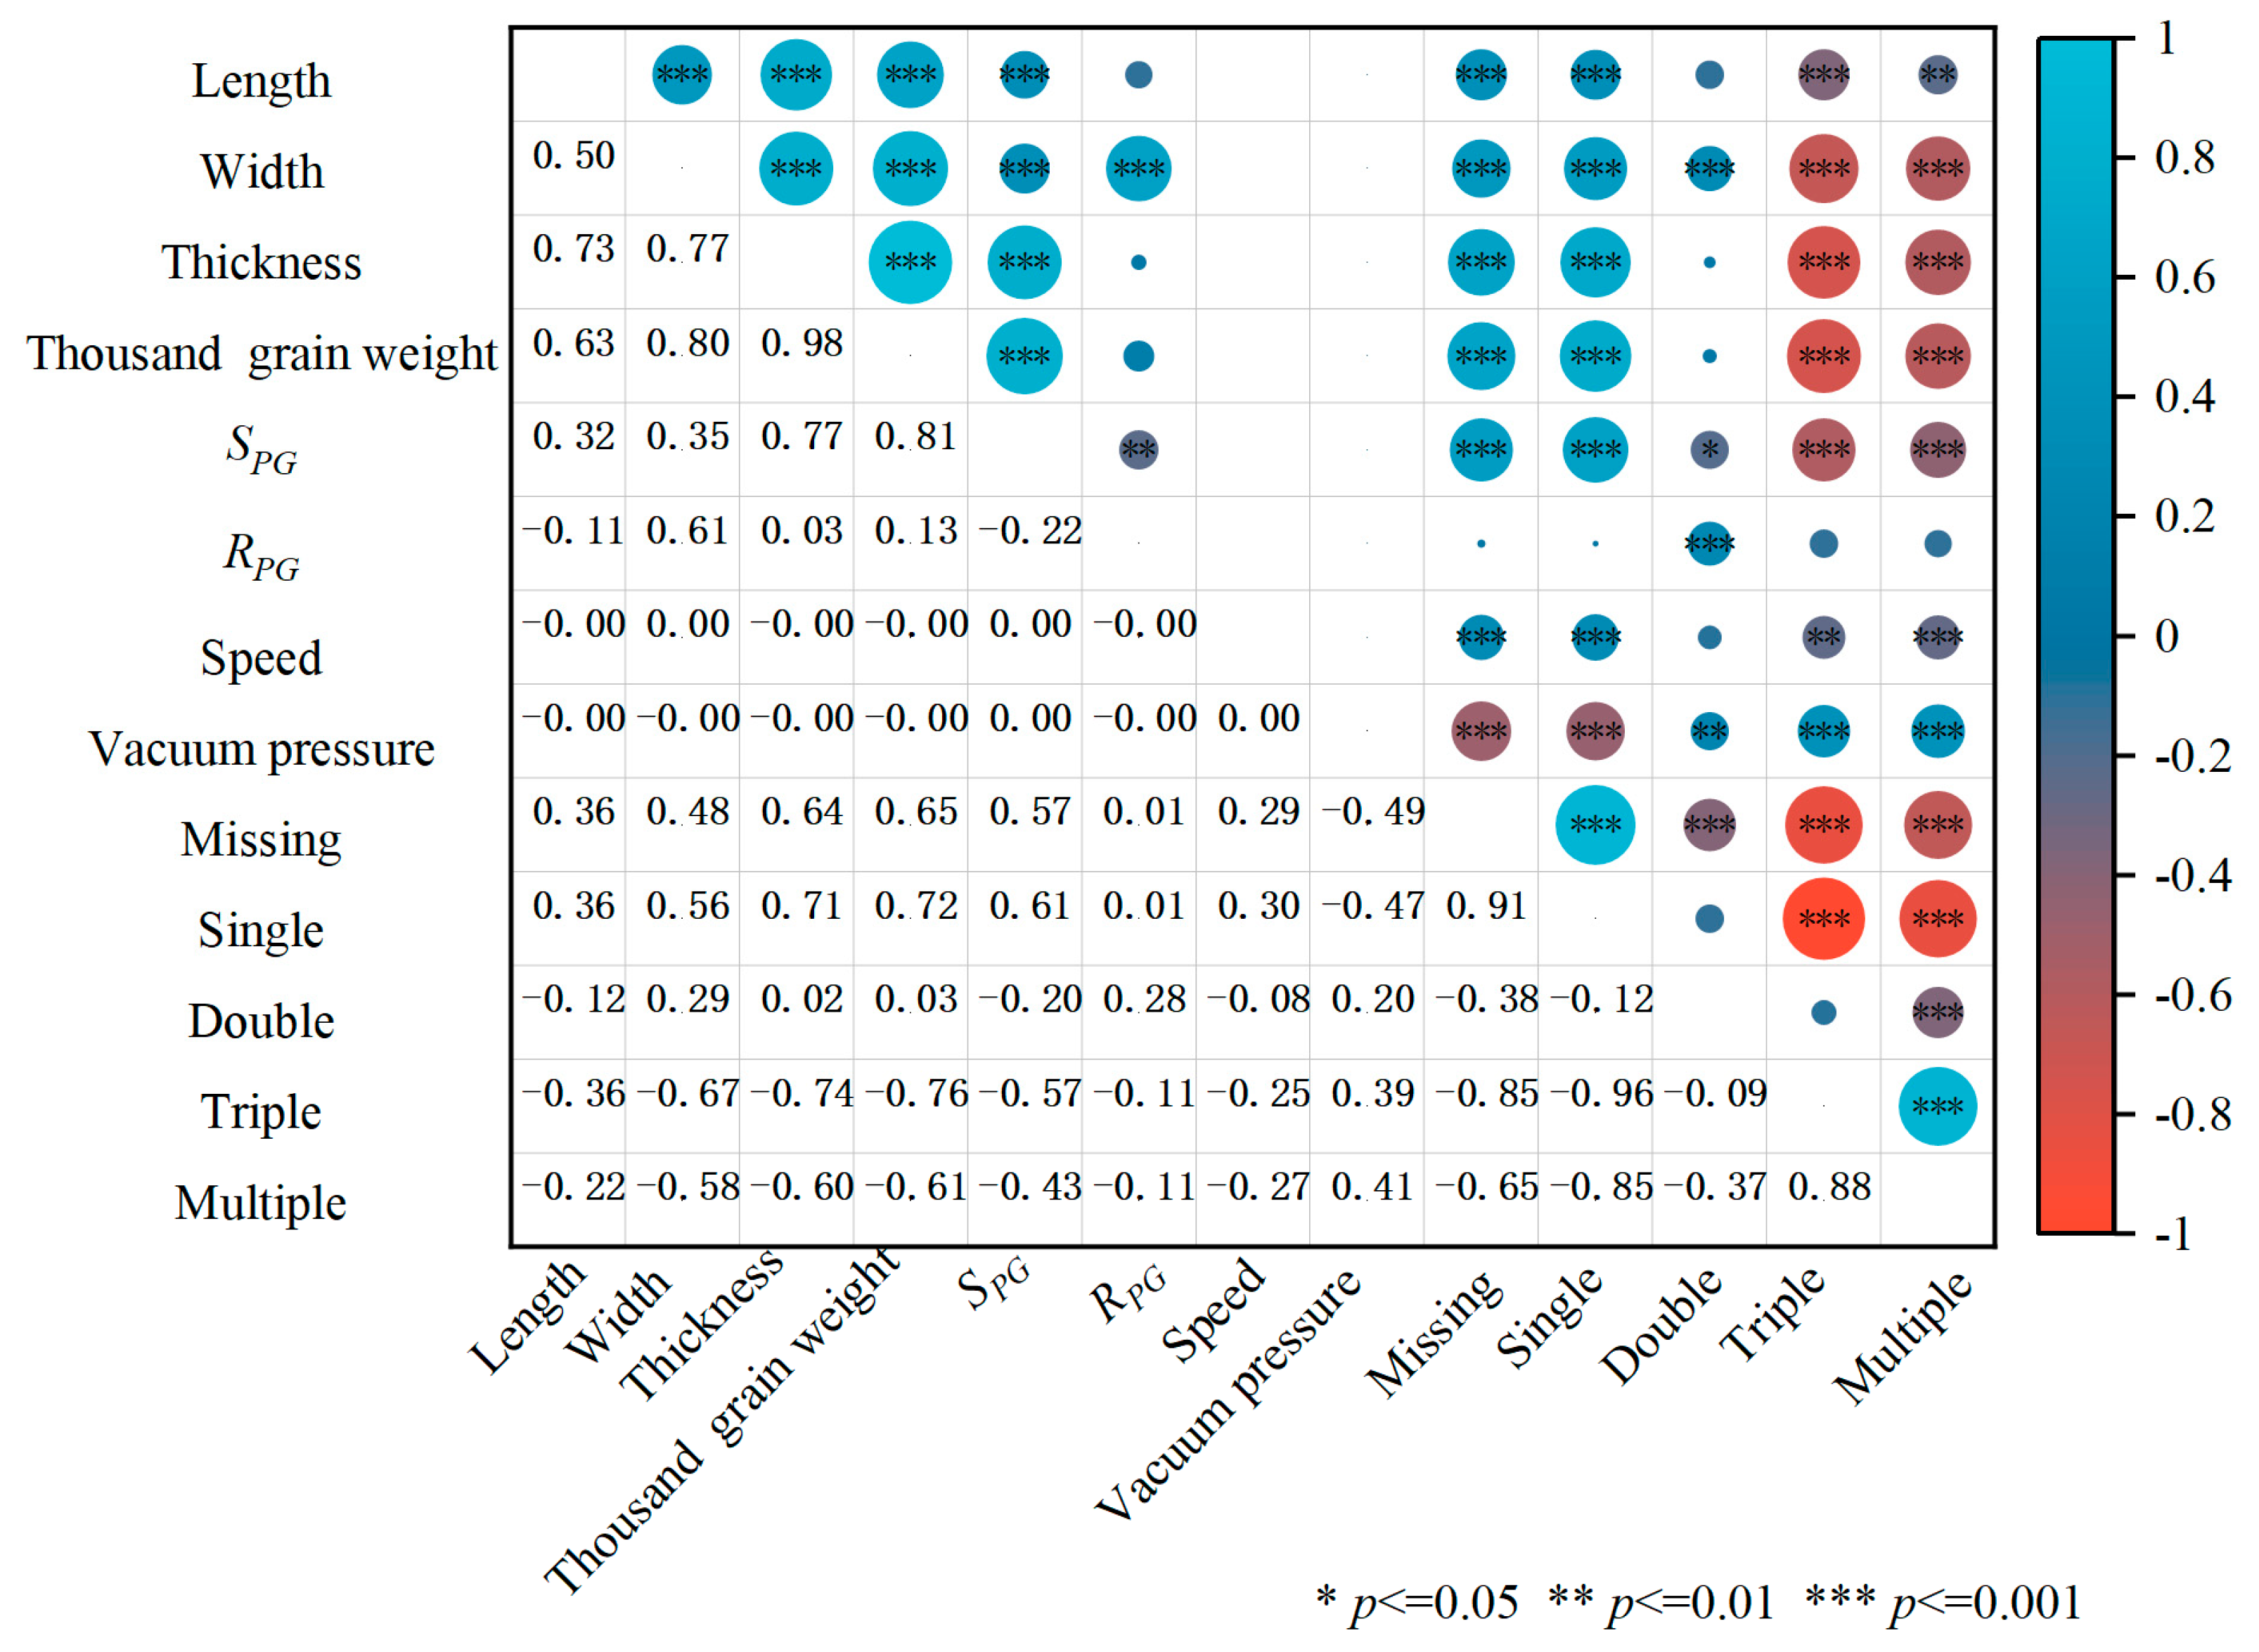
3.1. Seed Physical Characteristics

The experimental samples are shown in Figure 12, which includes the following: dry seeds of Huanghuazhan (HHZD), dry seeds of Hanyou 73 (HYD), dry seeds of Yliangyou 900 (YLYD), wet seeds of Huanghuazhan (HHZW), wet seeds of Hanyou 73 (HYW), and wet seeds of Yliangyou 900 (YLYW). Three-dimensional models of the rice seeds were created using inverse modeling technology, which was then used to develop a discrete element model of the seeds.
The results of the rice size measurements are presented in Figure 13a. The rice’s length, width, and thickness follow an approximately normal distribution, and there are significant differences in the three-dimensional dimensions of the different rice varieties. The rice seeds are ranked from highest to lowest in width in the order of HYW, HYD, YLYW, YLYD, HHZW, and HHZD. The length, width, and thickness of wet rice seeds of the same variety are greater than those of dry rice seeds due to the swelling that occurs when the seeds absorb water.
The measurements of thousand-grain weight and density are shown in Figure 13b. The thousand-grain weight of wet rice seed was 20.77~25.43 g, higher than that of dry rice seed, 25.89~32.42 g. The seeds are ranked from highest to lowest by thousand-grain weight in the order of HYW, YLYW, HHZW, HYD, HHZD, and YLYD. The SPG of 0.902~0.950 for wet rice was higher than that of 0.774~0.839 for dry rice (shown in Figure 13c). It is because the moisture on the surface of the rice seed increases the coefficient of static friction. There was no significant difference between dry rice seeds and rice seeds for RPG (shown in Figure 13d). The dynamic stacking angle is used as an optimization objective for the discrete element model. There was also no significant difference between the dynamic stacking angles of dry and wet seeds (shown in Figure 13e).

3.2. Discrete Elemental Model of Rice Seed

The results are shown in Figure 14. As the values of RPP and SPP increased, there was no significant change in the dynamic stacking angle (DSA) of HYW. The effects of RPP and SPP on the DSA were insignificant (p > 0.05). In subsequent experiments, the RPP and SPP for the discrete element models of all the rice seeds were set to 0.35 and 0.7, respectively. As the values of DPG and DPP increased, the DSA of HYW tended to rise, and the differences between the various levels of DSA were significant (p < 0.05). In the subsequent experiments, the levels of DPG and DPP were set to range from 0.2 to 0.6, respectively.
The results of the two-factor experiment are shown in Figure 15. For different rice seeds, there is a positive correlation between the DSA and DPG. The DSA for a DPP of 0.2 is significantly smaller than for the other values, and there is no clear trend of an increase in the DSA with increasing DPP when the value of DPG is fixed. All DSA, except for the DPP of 0.2, intersect with the reference line of the target optimization value. It is necessary to determine the DPP value before determining the optimization interval for DPG. When determining the fixed DPP value, preference should be given to DSA curves near to or those that intersect the experimental levels and exhibit smoother changes.
Table 3 shows the results of the DSA optimization experiments, which determined that the DPP and DPG for HHZD are 0.4 and 0.32, for HHZW are 0.6 and 0.40, for HYD are 0.4 and 0.44, for HYW are 0.5 and 0.28, for YLYD are 0.5 and 0.38, and for YLYW are 0.4 and 0.36. The DSA of calibrated rice seed is shown in Figure 16. After calibration, the errors between the simulated dynamic stacking angles of HHZD, HYD, YLYD, HHZW, HYW, and YLYW and the physical–dynamic stacking angles were 0.12%, 0.13%, 0.75%, 0.62%, 0.08%, 0.75%, 0.59%, and 1.24%, respectively, which indicated that the discrete metamodels for rice were accurate.

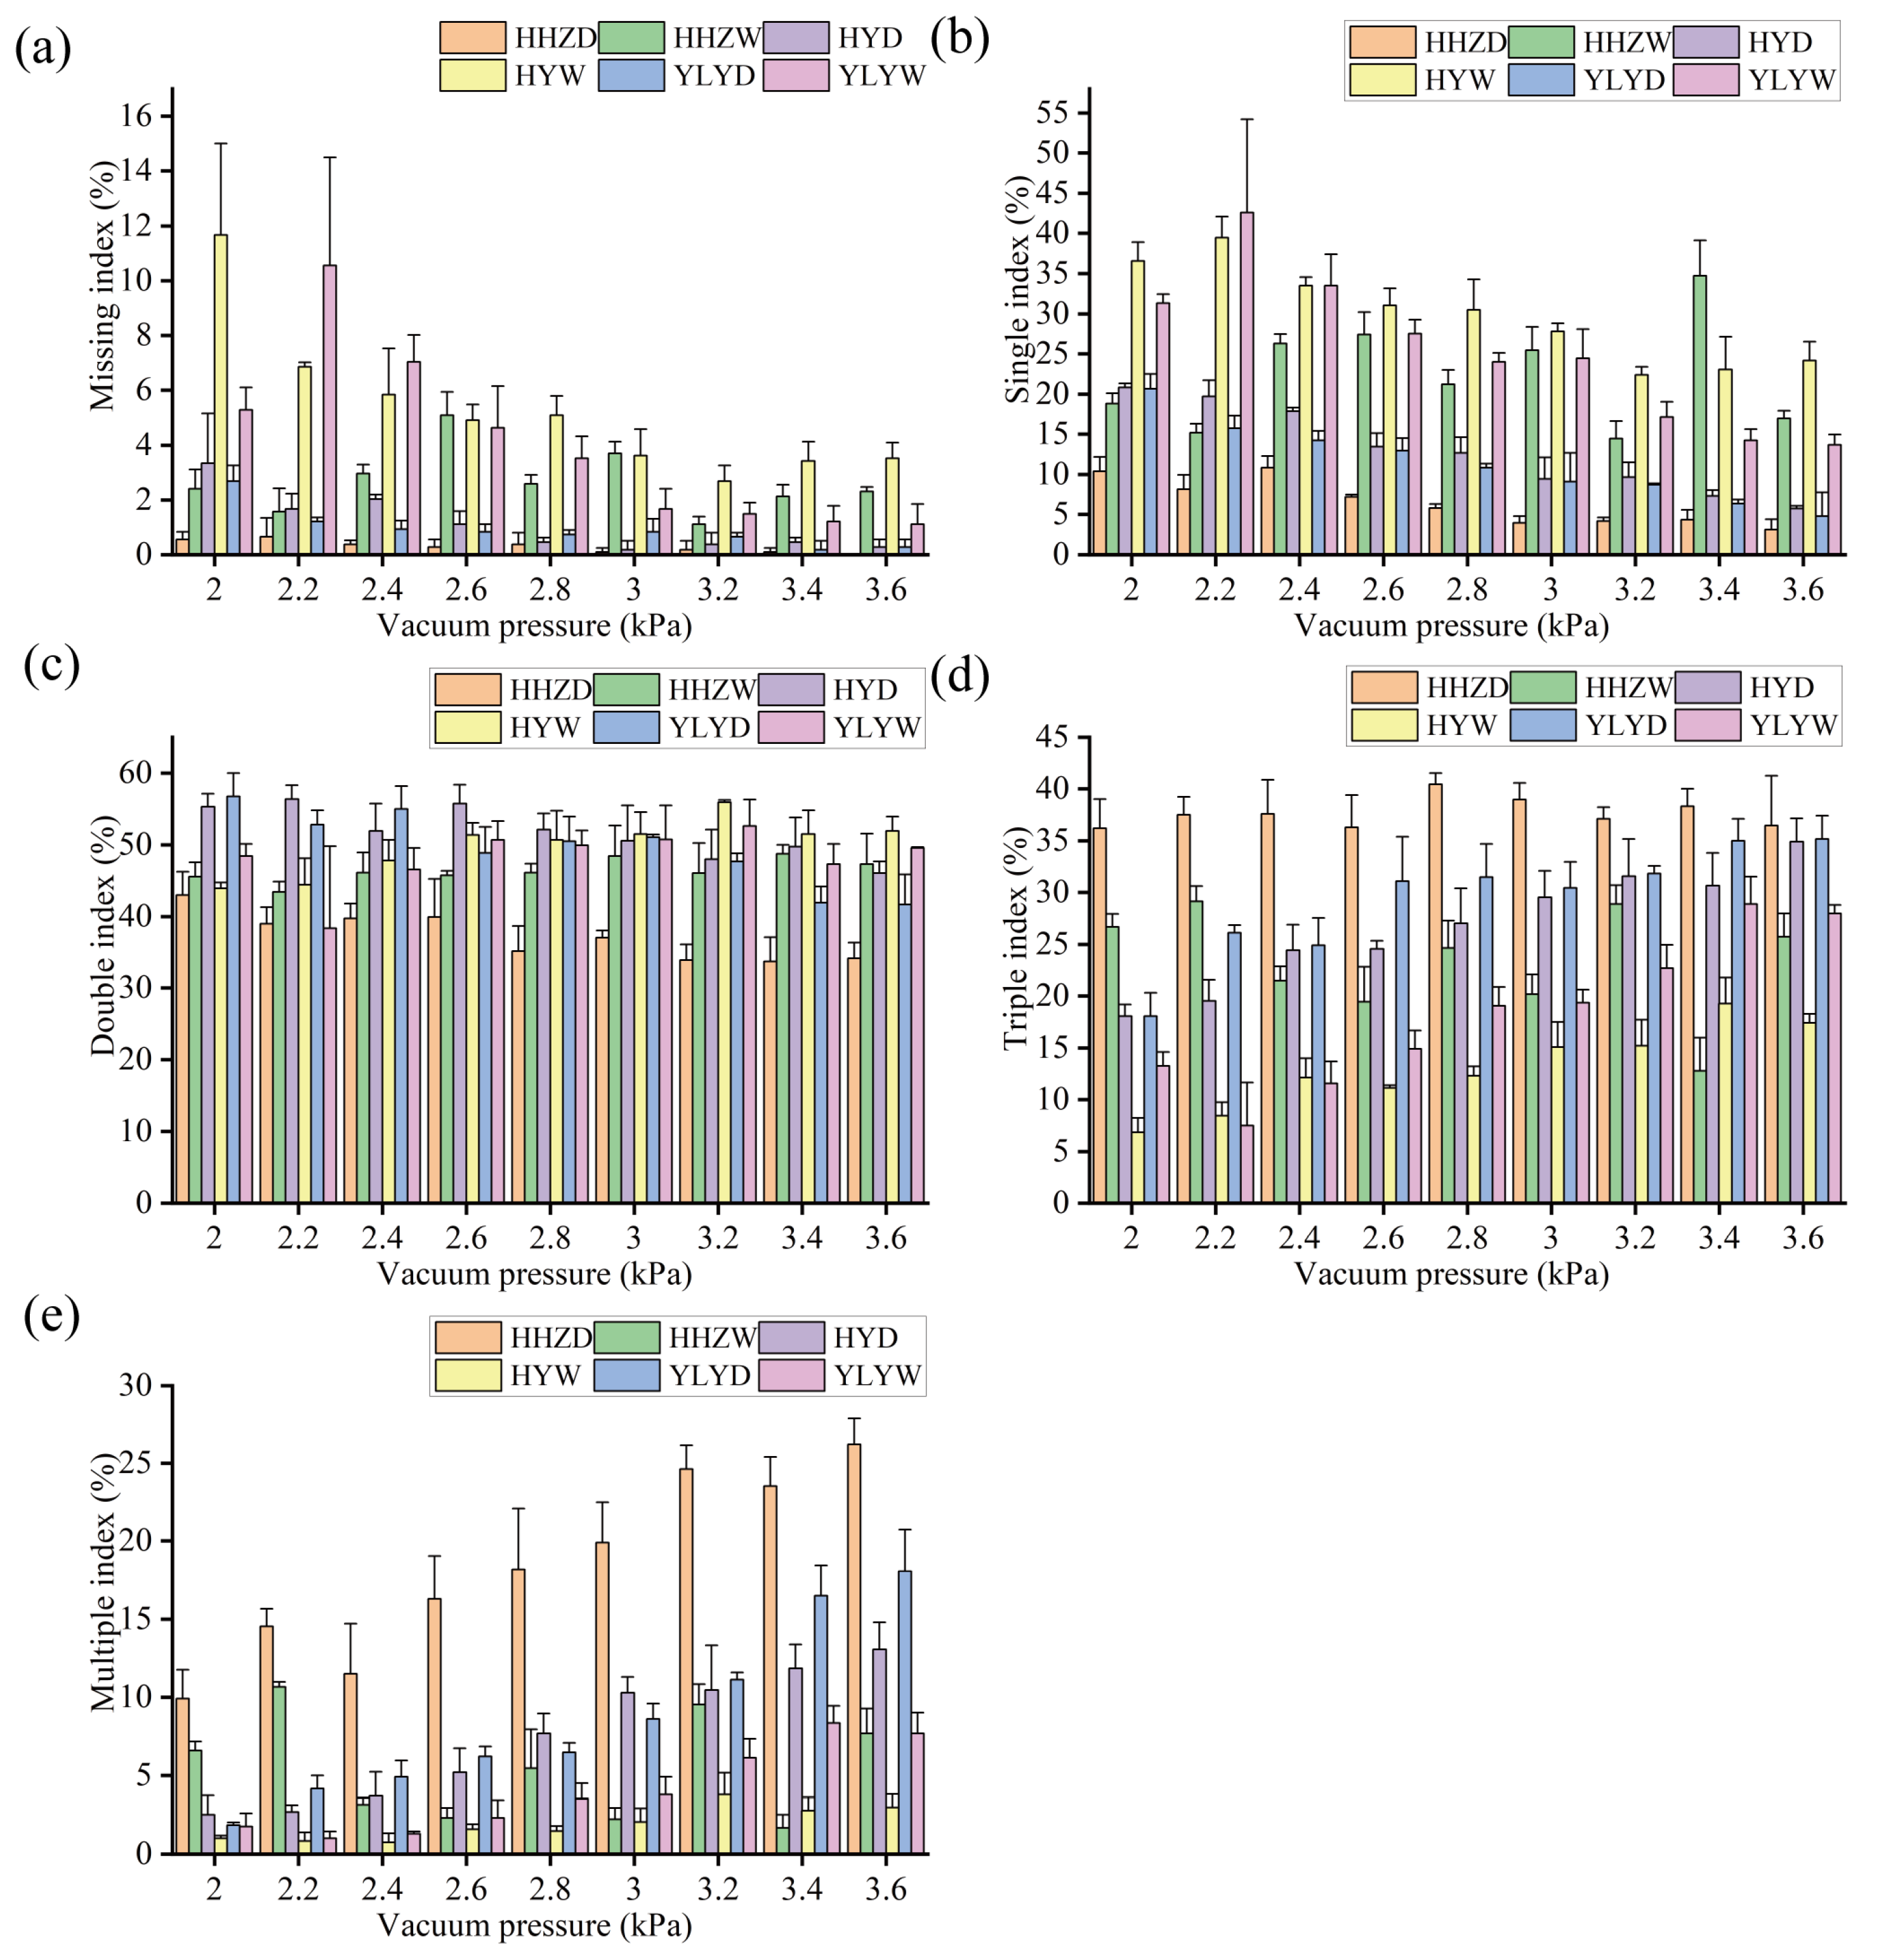
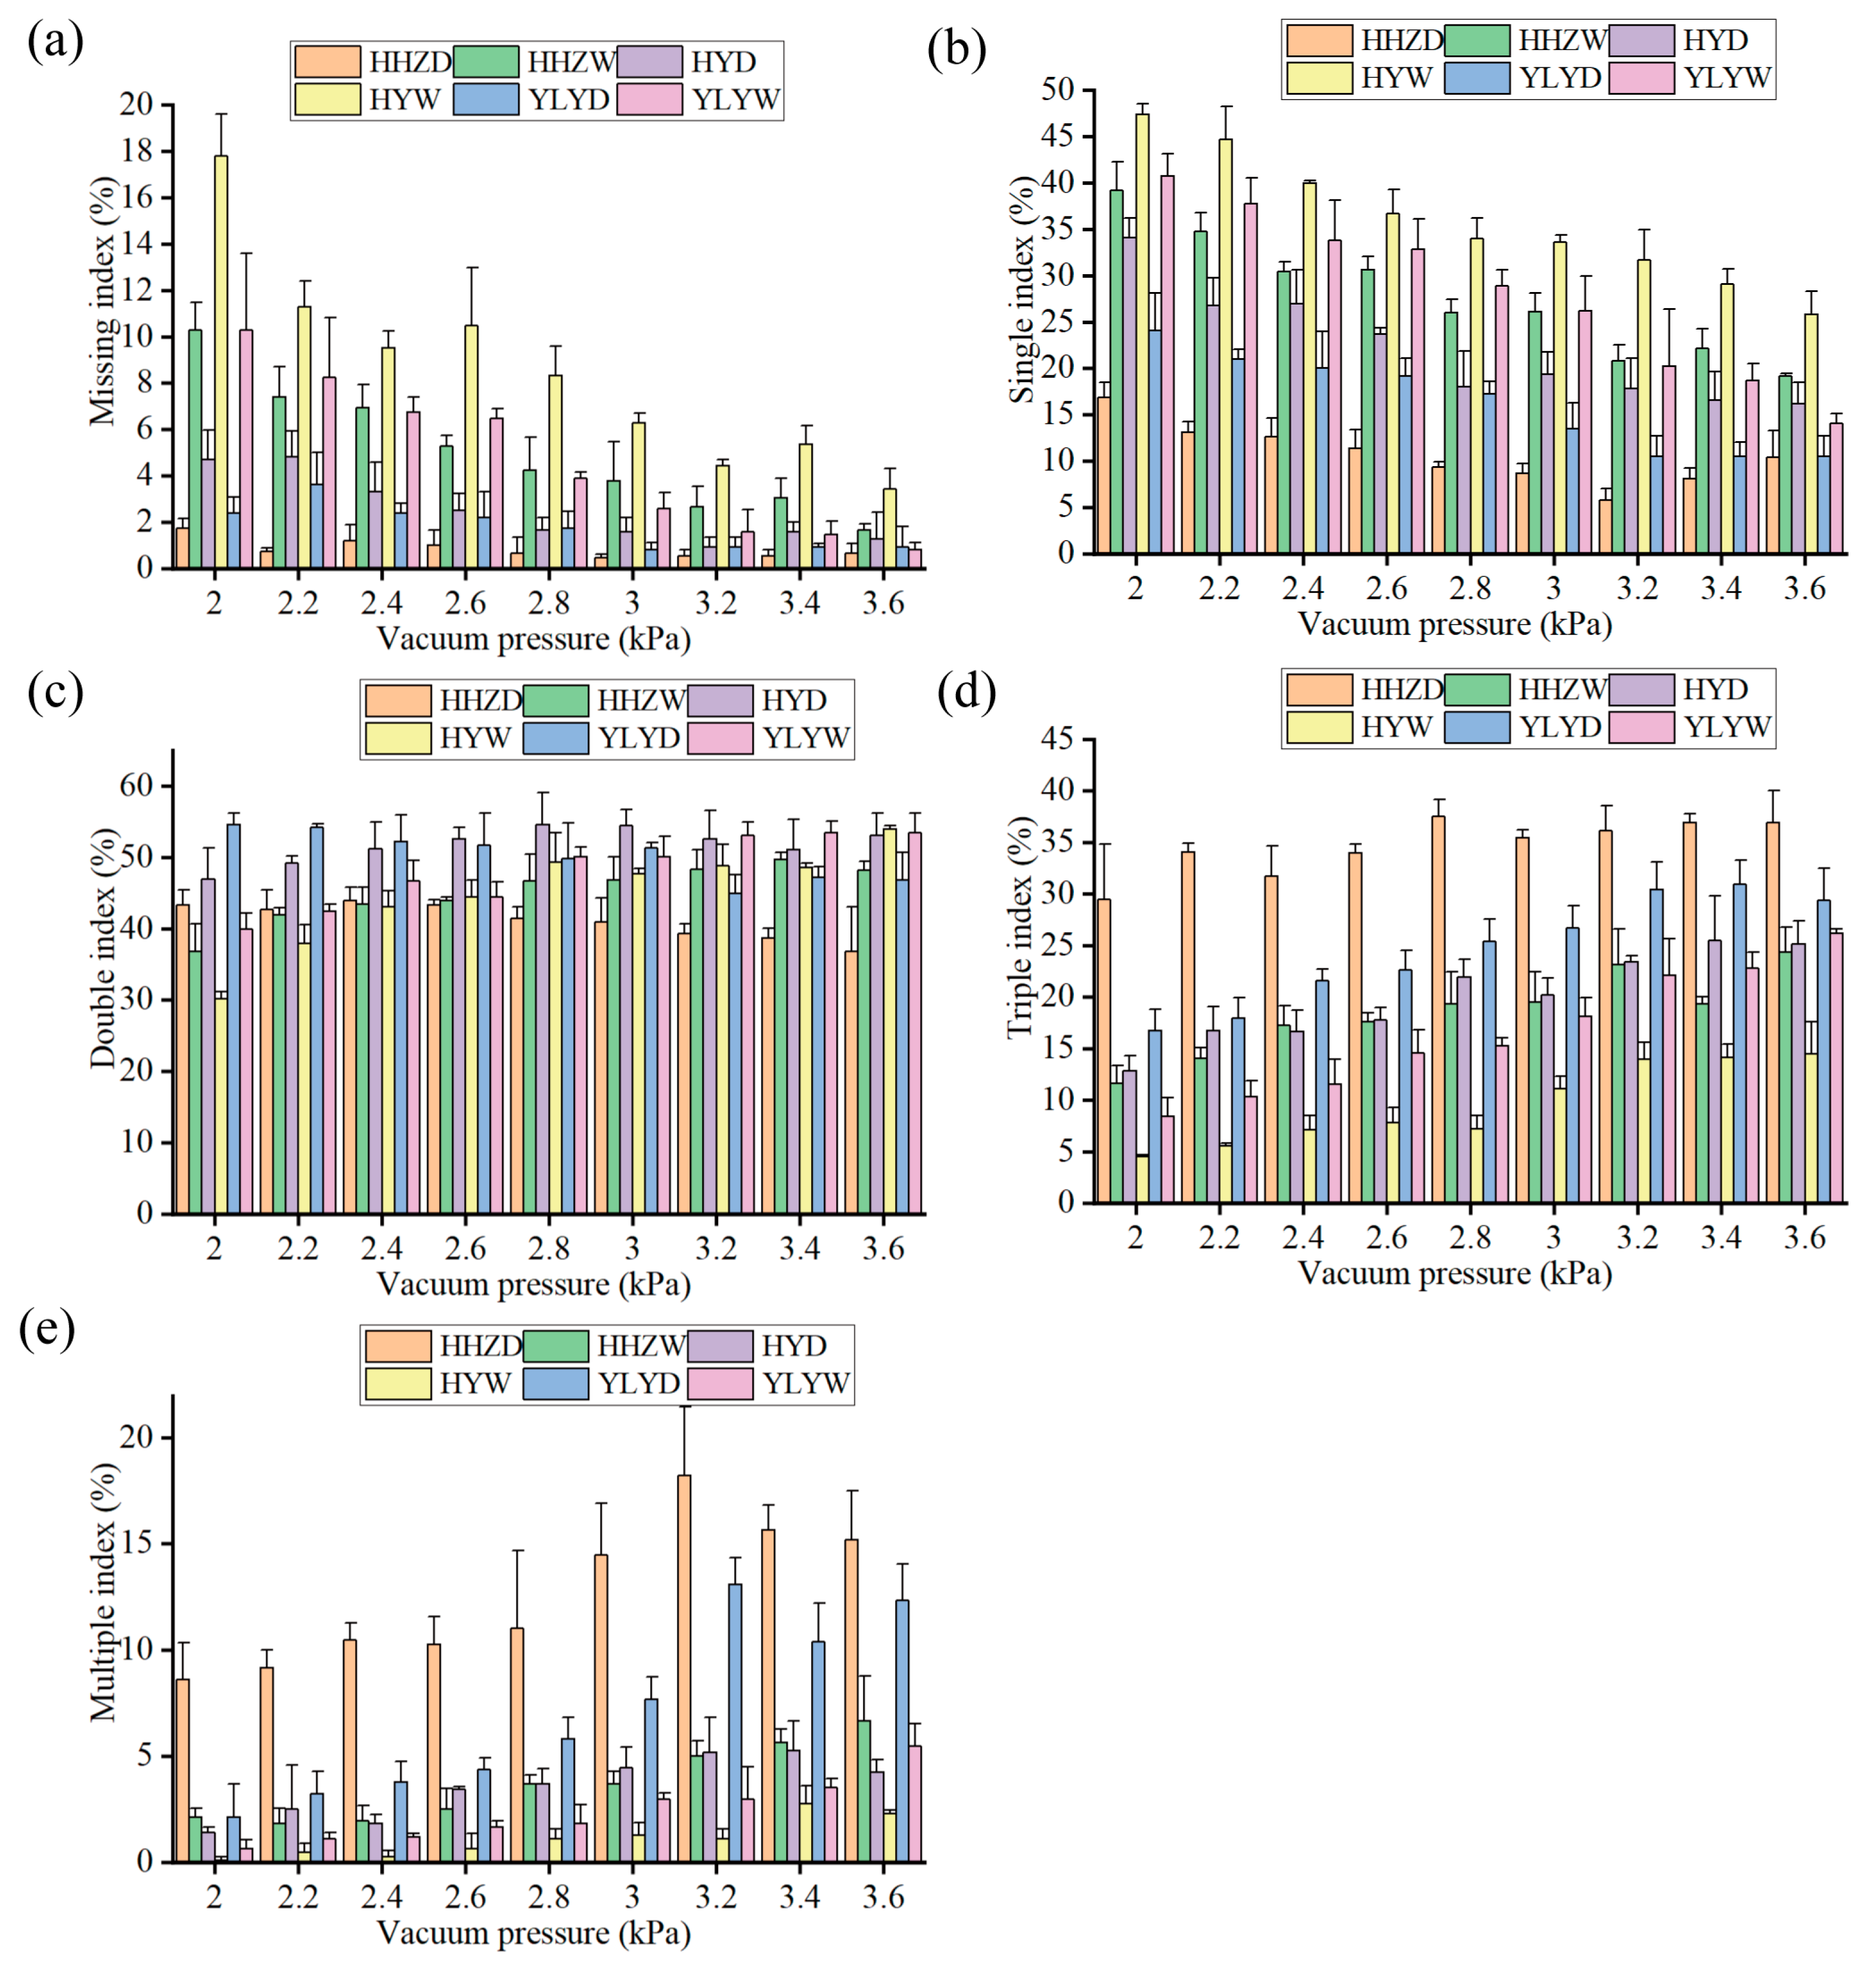
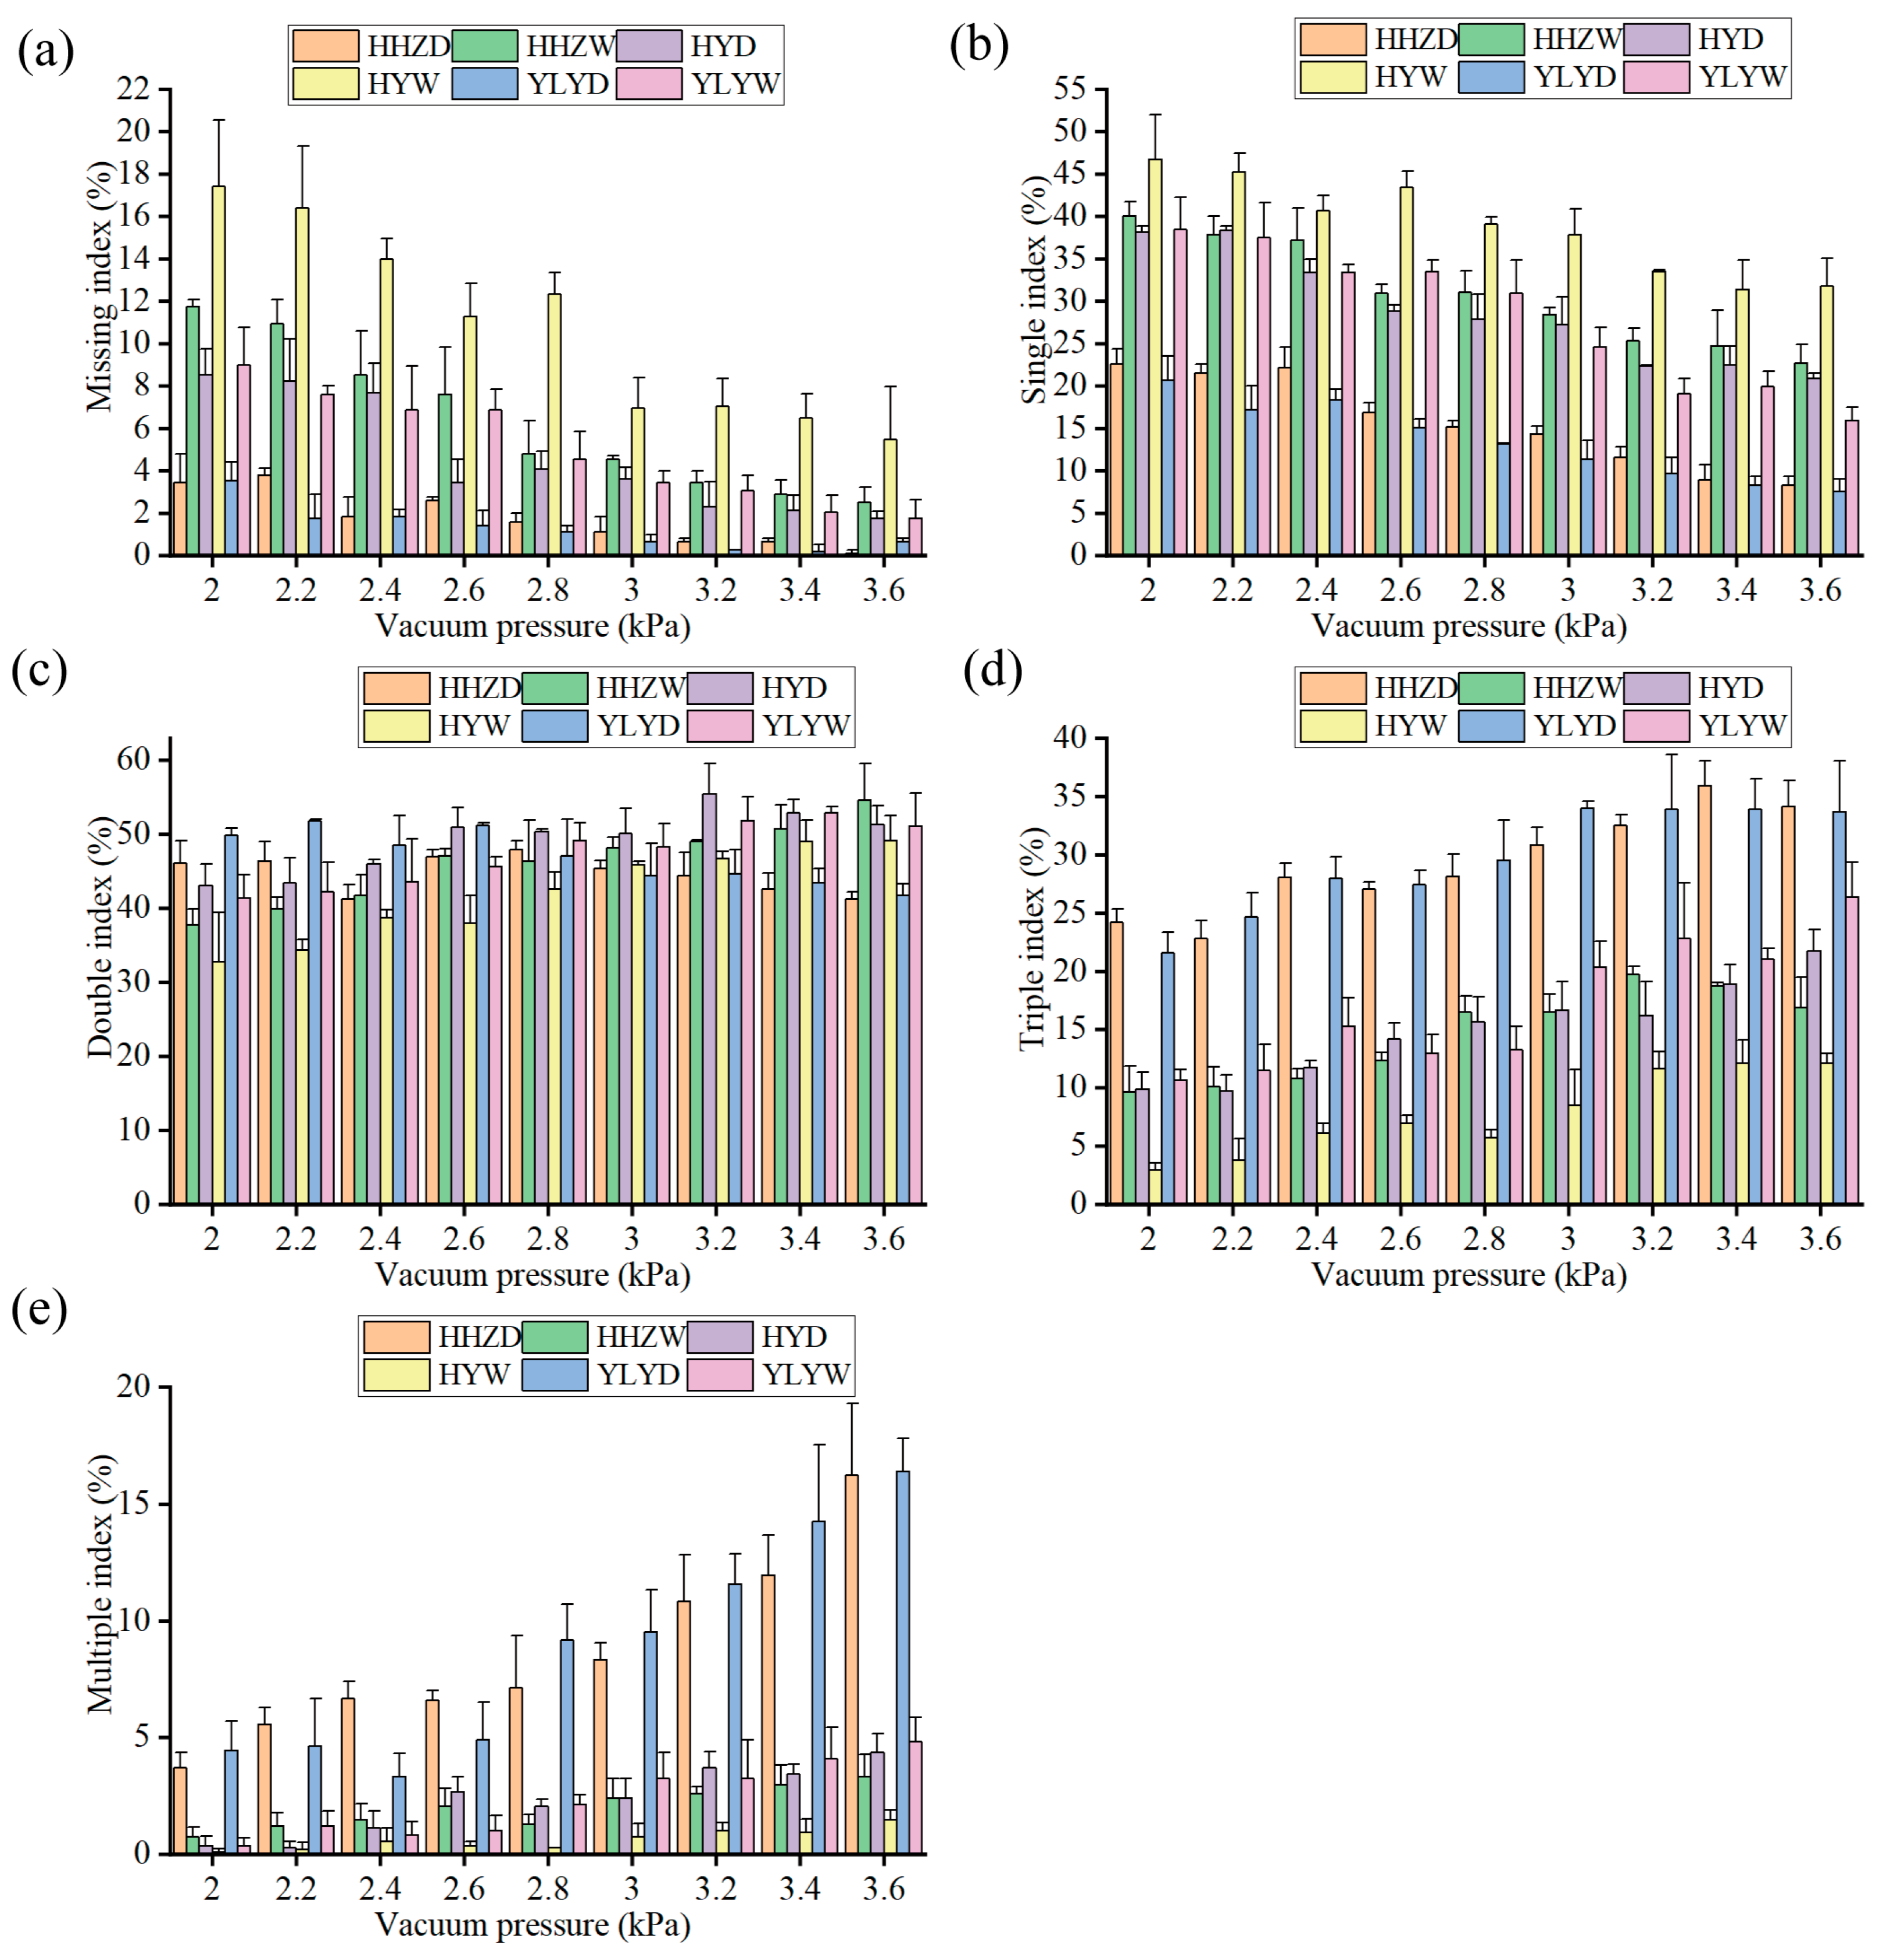
3.3. Seeding Accuracy

Figure 17 illustrates the accuracy of the air-suction seed metering device at a speed of 20 rpm. At vacuum pressures ranging from 2.4 kPa to 3.6 kPa, the missing index of wet rice seeds was higher than that of dry rice seeds. It may be attributed to the fact that the surface of wet rice seed contains moisture, which reduces seed mobility, requiring greater suction force to detach the seed. The single index of wet rice seeds was higher than that of dry rice seeds and tended to decrease as vacuum pressure increased. When the vacuum pressure varied, no significant difference was observed in the double index between dry and wet rice seeds.
The double index for HHZD was also considerably smaller than for the other rice seeds. When the vacuum pressure exceeded 2.2 kPa, the triple index for dry rice seeds was higher than that of wet rice seeds. Dry rice seeds exhibited a higher multiple index than wet rice seeds, and the multiple index of HHZD was higher than those of YLYD and HYD. The missing and single indices of dry seeds followed this ascending order: HHZD, YLYD, and HYD. The thousand-grain weight of HYD was greater than that of HHZD and YLYD, which explains why the missing index for HYD was lower than for HHZD and YLYD. Although the thousand-grain weight of HHZD was higher than YLYDs, the SPG of HHZD was greater than YLYDs, which may provide more friction in the seed-filling process.
At a rotational speed of 40 rpm, the missing index of wet rice seeds was significantly higher than that of dry rice seeds, with HYW exhibiting the highest missing index (Figure 16). When the vacuum pressure ranged from 2.0 kPa to 3.4 kPa, the single index of wet rice seeds was also higher than that of dry rice seeds. HYW exhibited the highest single index, while HHZD demonstrated the lowest. No significant difference was observed between the double index of dry and wet rice seeds. HHZD and YLYD exhibited the highest triple and multiple indexes, while HYW exhibited the lowest. These findings are illustrated in Figure 18. Similarly, the missing index of dry seeds and the single index of HHZD, YLYD, and HYD were in ascending order. When the vacuum pressure ranged from 2.0 kPa to 2.6 kPa, the missing index of YLYW was more extensive than HHZW’s. However, when the vacuum pressure ranged from 2.8 kPa to 3.6 kPa, the missing index of HHZW was more significant than that of YLYW.
Regarding the physical characteristics of the rice, the difference in the static friction coefficient between YLYW and HHZW was less pronounced, and the thousand-grain weight of YLYW (27.18 g) was higher than that of HHZW (25.89 g), resulting in a greater missing index for YLYW compared to HHZW. It may be because when the vacuum pressure is between 2.0 kPa and 2.6 kPa, the thousand-grain weight is the primary factor affecting seed-filling performance, so the missing index of YLYW is greater than that of HHZW. However, when the vacuum pressure is between 2.8 kPa and 3.6 kPa, the action force between the rice seeds of HHZW may be greater than that between the rice seeds of YLYW, or the drag force or pressure gradient force on YLYW may be greater than that on HHZW. Therefore, the missing index of HHZW is greater than that of YLYW.
At a rotational speed of 60 rpm, HYW exhibited the highest missing index and single index. In contrast, HHZD and YLYD demonstrated lower missing and single index values than the other rice seeds (Figure 19). As with the results at 20 and 40 rpm, no significant difference was observed in the double index between the dry and wet rice seeds. The triple and multiple indexes were higher for HHZD and YLYD than for the other rice seeds. Conversely, the triple and multiple indices were lower for HYW than for the other rice seeds. Unlike the observations at 20 and 40 rpm, dry seeds’ missing index and single index increased in the order of YLYD, HHZD, and HYD. This phenomenon may be attributed to the inter-seed force being higher for HHZD than for YLYD at 60 rpm. The higher missing index observed in HHZW than YLYW may be due to two potential factors: either the interaction force between rice seeds in HHZW is greater than that in YLYW or the drag or pressure gradient force of YLYW is higher than HHZW. At a rotational speed of 60 rpm, the discrepancy between the missing indices of HYD and YLYW was minimal, with even the missing index of HYD exceeding that of YLYW. It can be attributed to the fact that the higher rotational velocity enhances the mobility of the seeds, thereby reducing the influence of thousand-grain weight on the missing index of HYD and YLYW. Consequently, the discrepancy between the two missing indices at 60 rpm was not pronounced.
To further analyze the relationships between length, width, thickness, thousand-grain weight, SPG, RPG, rotational speed, negative pressure, and the missing index, single index, double index, triple index, and multiple index Pearson correlation analysis was performed. The results are shown in Figure 20. The missing index was positively correlated with length, width, thickness, thousand-grain weight, SPG, and rotational speed, while it was negatively correlated with negative vacuum pressure. The single index showed significant positive correlations with length, width, thickness, thousand-grain weight, SPG, and rotational speed and a significant negative correlation with negative vacuum pressure. The double index was significantly and positively correlated with width and RPG. The triple index was significantly negatively correlated with length, width, thickness, thousand-grain weight, SPG, and rotational speed but positively correlated with negative vacuum pressure. The multiple index was significantly negatively correlated with length, width, thickness, thousand-grain weight, SPG, and rotational speed, while it was positively correlated with negative vacuum pressure. The correlation analysis revealed that width, thickness, thousand-grain weight, and SPG had the highest correlation coefficients.

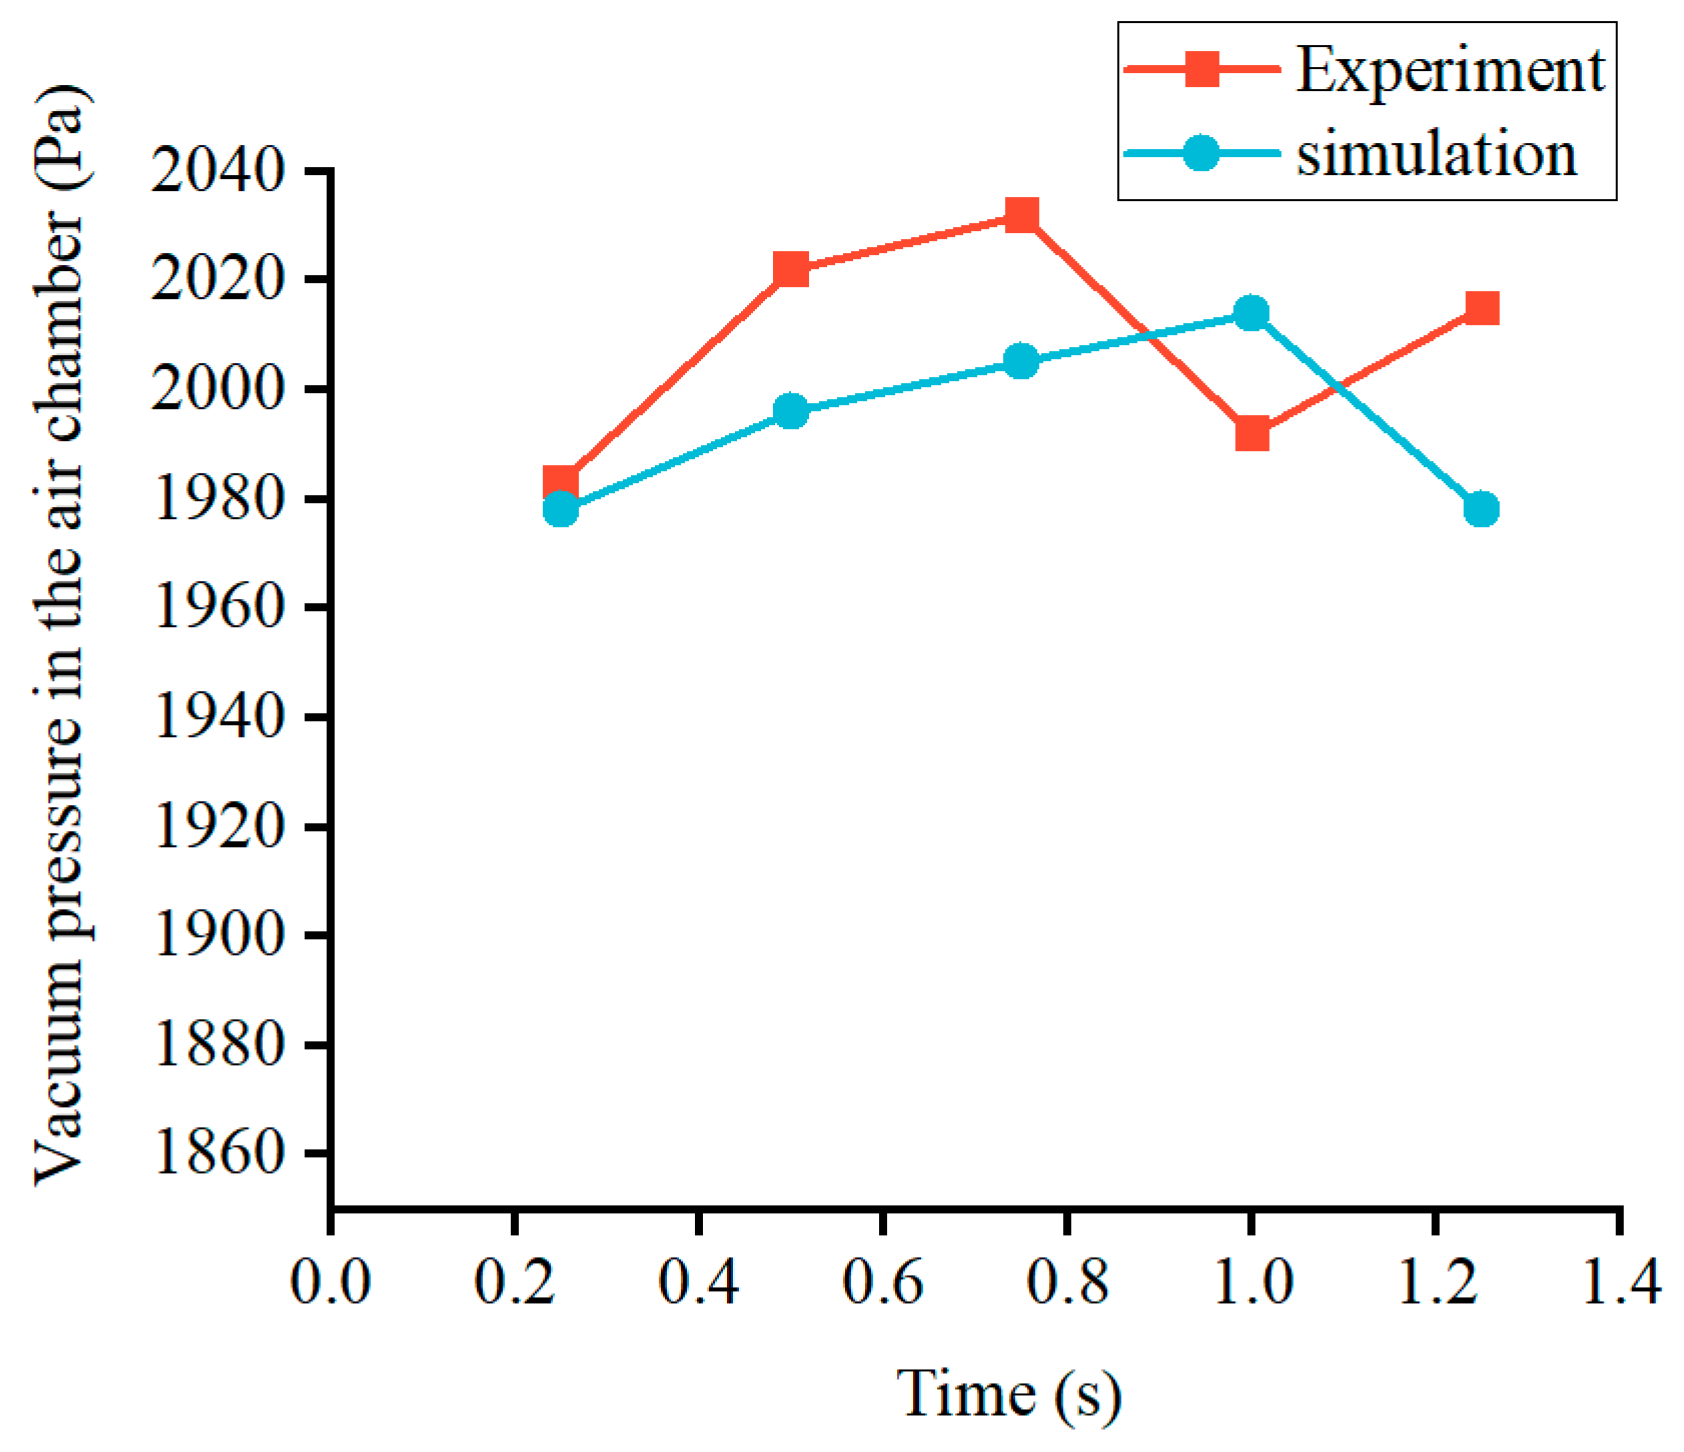
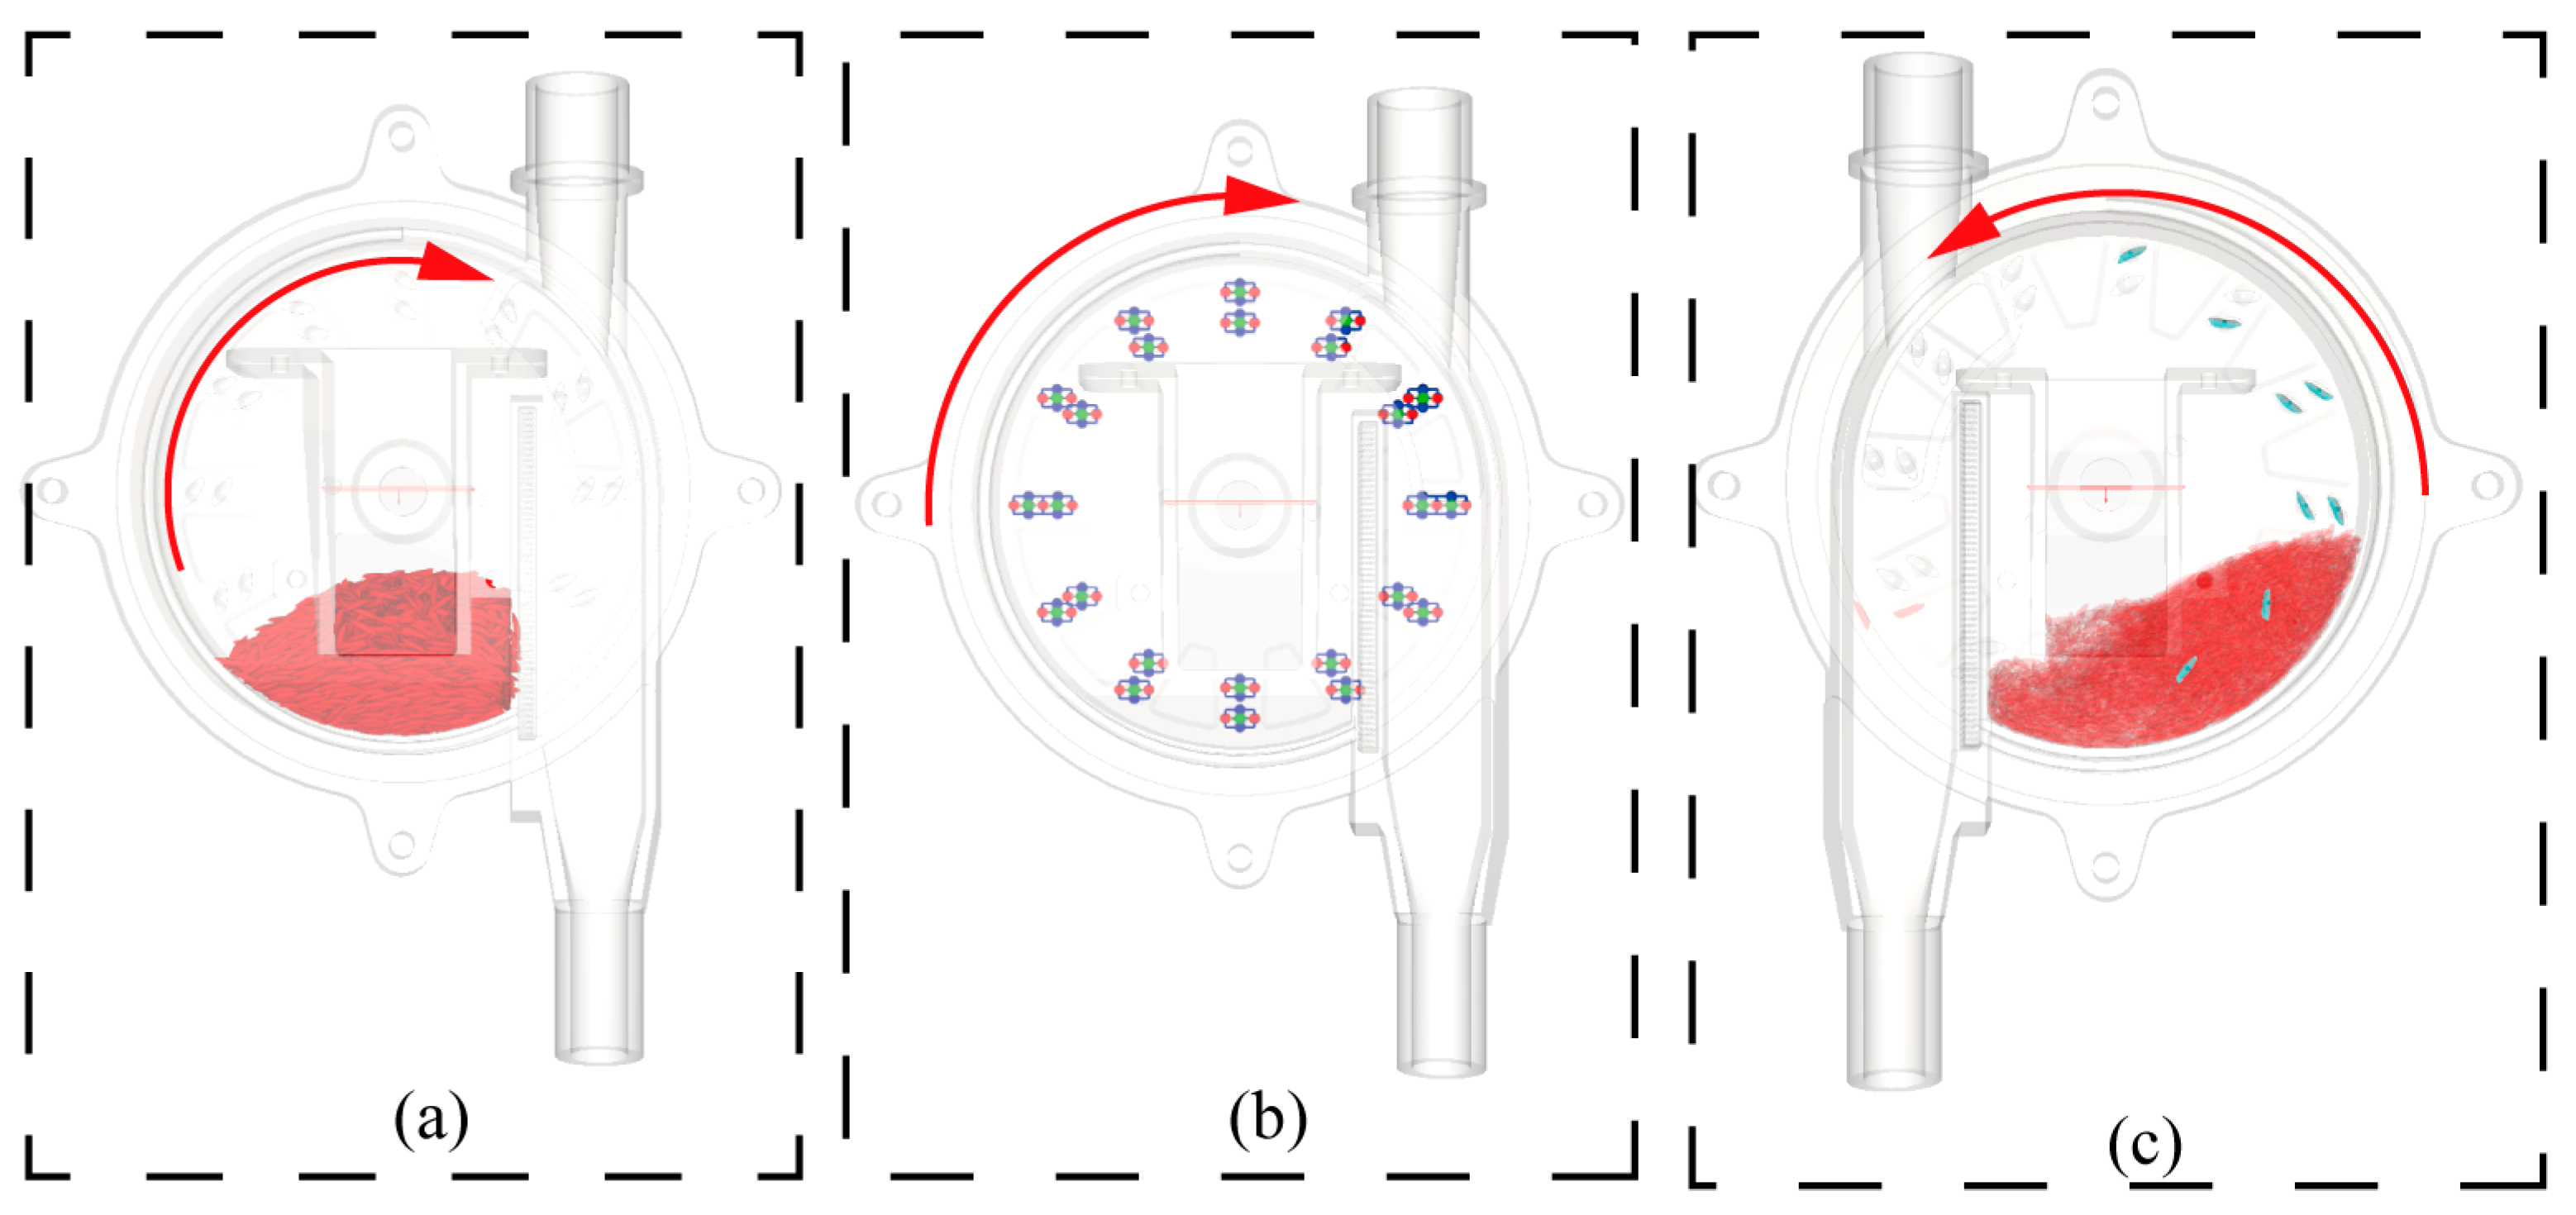
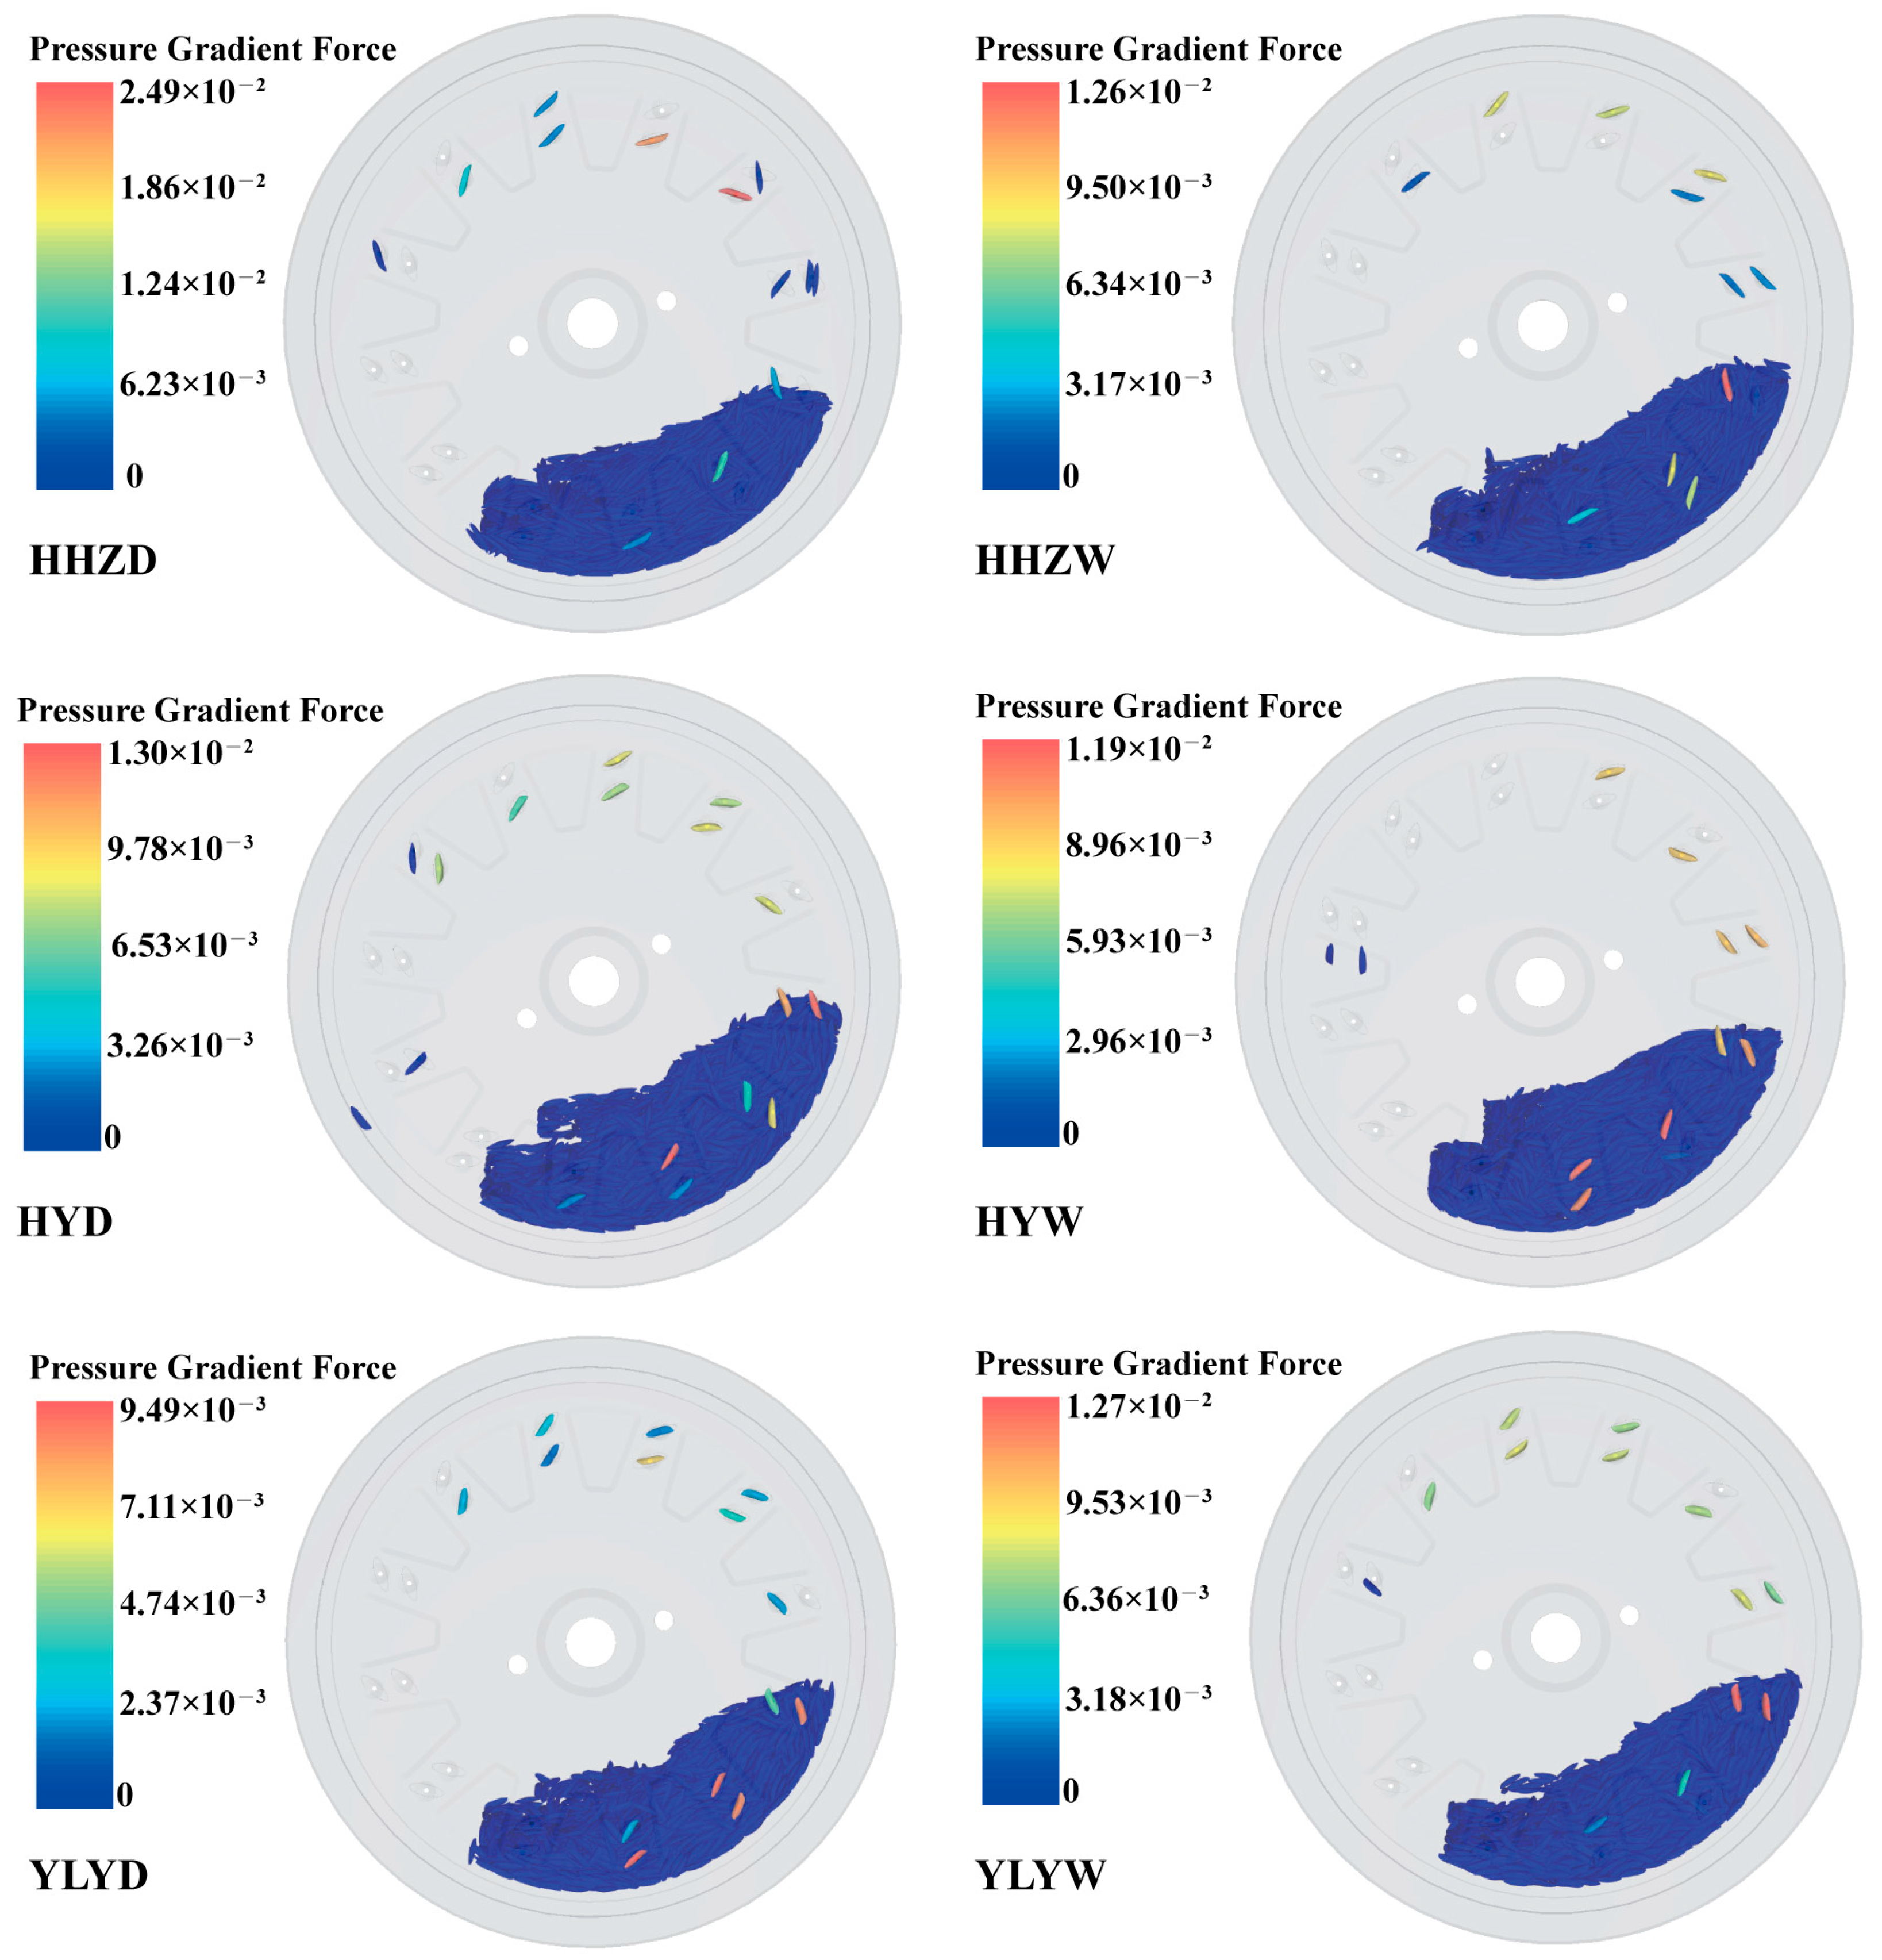
3.4. CFD-DEM Simulation

The pressure gradient force of different rice seeds in the air-suction seed meter at a speed of 40 rpm is shown in Figure 21. The forces exerted on the seed in the flow field primarily comprise the drag force and the pressure gradient force, as illustrated in Table 4. The analysis of variance for drag force and pressure gradient force is shown in Table 5. The analysis reveals that the drag force acting on rice seeds is less in magnitude than the pressure gradient force; this trend is consistent with the findings of He et al. [41]. The discrepancy is observed between the drag force and the pressure gradient force on rice seeds during the filling and carrying processes. Specifically, the drag force and pressure gradient force during filling are found to be greater than those during carrying. This disparity can be attributed to the displacement of the seeds from the vacuum pressure port during the carrying process, resulting in a decline in drag force and pressure gradient force with an increase in carrying time. In the filling process, the difference in drag force and pressure gradient force between the inside and outside suction holes is mainly related to the seed layer height. When the seed layer height is greater, the energy loss of the airflow reaching this seed layer height is greater. During the seed-carrying process, for the same variety of rice, the difference in drag force and pressure gradient force between the inside and outside suction holes is minimal.
The drag force and pressure gradient force vary for different rice seeds, which is due to differences in the windward projected area, volume, drag coefficient, flow field velocity, and pressure gradient of rice. For dry and wet rice seeds, the drag force of dry rice seeds is, in most cases, smaller than that of wet rice seeds. This is mainly because the porosity of wet rice seeds is lower, which results in greater loss of airflow velocity. There is no significant difference in the pressure gradient force of dry and wet rice seeds. However, the difference between the sum of the drag force and the pressure gradient force of different rice seeds is small. This shows that the drag force and pressure gradient force are not the main factors contributing to the difference in filling performance.
If two rice seeds come into contact with each other, the force perpendicular to the contact surface is the normal force. The force in the direction of the tangent of the contact surface is called the tangential force, which mainly affects the relative sliding and rotation of the rice seeds. Excessive normal and tangential forces can cause suctioned seeds to detach from the suction hole, resulting in an elevated missing index. Smaller normal and tangential forces contribute to the reduction in the missing index. The normal and tangential forces acting on the seeds during filling and carrying are shown in Table 6; analysis of variance is shown in Table 7. There are significant differences in the normal and tangential forces acting on dry and wet rice seeds. During the filling process, wet rice seeds of the same variety experience higher normal and tangential forces than dry rice seeds. For example, at 40 rpm, the normal and tangential forces of HYW are 37.69 × 10⁻³ N and 12.47 × 10⁻³ N, respectively, which are higher than those of HYD (25.18 × 10⁻³ N and 9.19 × 10⁻³ N). During the filling process, the rice seeds in the outside suction hole experience higher normal and tangential forces than those in the inside pores. This is because the seed layer height of the outside suction hole is higher during filling, which results in the suctioned seeds being subjected to the action of more rice seeds.
The normal force and tangential force experienced by the seed during carrying are generated by the contact between the suction hole and the seed. In order to more intuitively analyze the normal and tangential forces acting on the seeds in the seed chamber, the action force between the rice seeds is used as an evaluation index. The action force between rice seeds is the difference between the force applied to the suctioned seeds during the seed-filling process and the force experienced during the seed-carrying process. The forces of different rice varieties on suctioned seeds are shown in Table 8; analysis of variance is shown in Table 9. As shown in Table 8, the normal action force between rice seeds is greater than the tangential action force.
When the rotation speed is 20 rpm, the tangential action forces of dry rice seeds are in descending order: HYD, YLYD, and HHZD. The normal forces of dry rice seeds at 20 rpm are in descending order: HYD, HHZD, and YLYD, and the difference in normal force between HHZD and YLYD is small. At a rotational speed of 40 rpm, the normal and tangential action forces between dry rice seeds followed the order HYD, YLYD, and HHZD, in descending order, which aligns with the descending order of the missing index and single index of dry seeds. Similarly, at a rotational speed of 60 rpm, the normal action forces between dry rice seeds followed the same order: HYD, HHZD, and YLYD, consistent with the missing index and single index rankings of dry seeds. Although the order of magnitude of the tangential action forces at 60 rpm did not fully align with the missing index and single index rankings, the discrepancy of tangential action forces between YLYD and HHZD was minimal.
When the rotational speed is 20 rpm, the normal force between the rice seeds of wet rice seeds is in descending order: HYW, YLYW, and HHZW. At 40 rpm, the normal action forces followed the order HYW, YLYW, and HHZW in descending order, consistent with the missing index and single index rankings of wet rice seeds. At a rotational speed of 60 rpm, the normal and tangential action forces on wet rice seeds followed the order HYW, HHZW, and YLYW, consistent with the missing index and single index rankings.

4. Discussion

Using the discrete element method to simulate agricultural material particles helps researchers study the movement of particles in agricultural machinery and thus improves agricultural machinery [42]. Therefore, it is crucial that the discrete element model accurately represents the morphological characteristics of the particles. In this study, we used the polyhedral method to establish a discrete element model of rice seeds, and the experimental results also proved the superiority of the method. The polyhedral method can be used to model more non-spherical particles to reduce the simulation error. Compared with the discrete elemental model of rice seed using the multi-sphere method [43], the rice seed modeled with the polyhedral method better reflects the morphological characteristics of the actual rice seed, which helps to reduce the error of simulation.
The seeding accuracy test results showed that the air-suction seed metering device for rice could maintain a low missing index under suitable vacuum pressure. However, there were significant differences in the missing index, single index, triple index, and multiple index between dry and wet rice seeds of the same variety. Wet rice seeds exhibited higher missing and single indices, while dry rice seeds had higher triple and multiple indices. This results in higher vacuum pressures for the air-suction seed metering device when sowing wet rice seeds, which consumes more energy. No significant difference was observed in the double index between dry and wet rice seeds. The primary factors contributing to these differences were the physical characteristics, such as thousand-grain weight and SPG. For the differences in the missing index, single index, triple index, and multiple index among different varieties of seeds under the same treatment, the key factors were not only thousand-grain weight and SPG but also potential variations in the drag force, pressure gradient force, and action force on the seeds during seed filling.
The CFD-DEM simulation results showed that rice seeds are suctioned mainly by suction forces (drag force and pressure gradient force) and friction force. When the normal and tangential action forces on rice seeds exceed a critical level, the rice seeds will detach from the suction holes, resulting in an increase in the missing index and single index. To minimize this effect, the friction force can be increased by increasing the contact area between the suction hole and the rice through the shaped hole structure, and the normal and tangential action forces can be reduced by decreasing the contact area between the rice seed on the suction hole and the rest of seeds in the seed chamber. Of course, it is also possible to reduce the number of rice seeds by optimizing the structure of the seed chamber, thereby reducing the normal and tangential forces. The above improvements will improve the seeding accuracy of the air-suction seed metering device for wet and dry rice seeds. This will reduce the vacuum pressure for sowing wet rice seeds and reduce energy consumption.
Although the contact parameters for rice seeds were calibrated, they may not fully represent the actual physical properties of the seeds. Future studies will focus on determining additional contact parameters through non-simulation experiments. Meanwhile, in future research, we should improve the parameters of the simulation model by experimentally measuring the suction force of the rice seed to reduce the error in the simulation.

5. Conclusions

This study employed experimental analysis and CFD-DEM numerical simulation methods to investigate the primary factors contributing to the differences in seeding accuracy between dry and wet rice seeds. Three rice seeds were categorized into dry and wet (subjected to pre-germination treatment). The physical property parameters of the seeds were measured, and the contact parameters of the seed discrete element model were calibrated. Differences in seeding accuracy among the rice seeds were analyzed, followed by CFD-DEM numerical simulations. The following conclusions were drawn from the study:
(1)
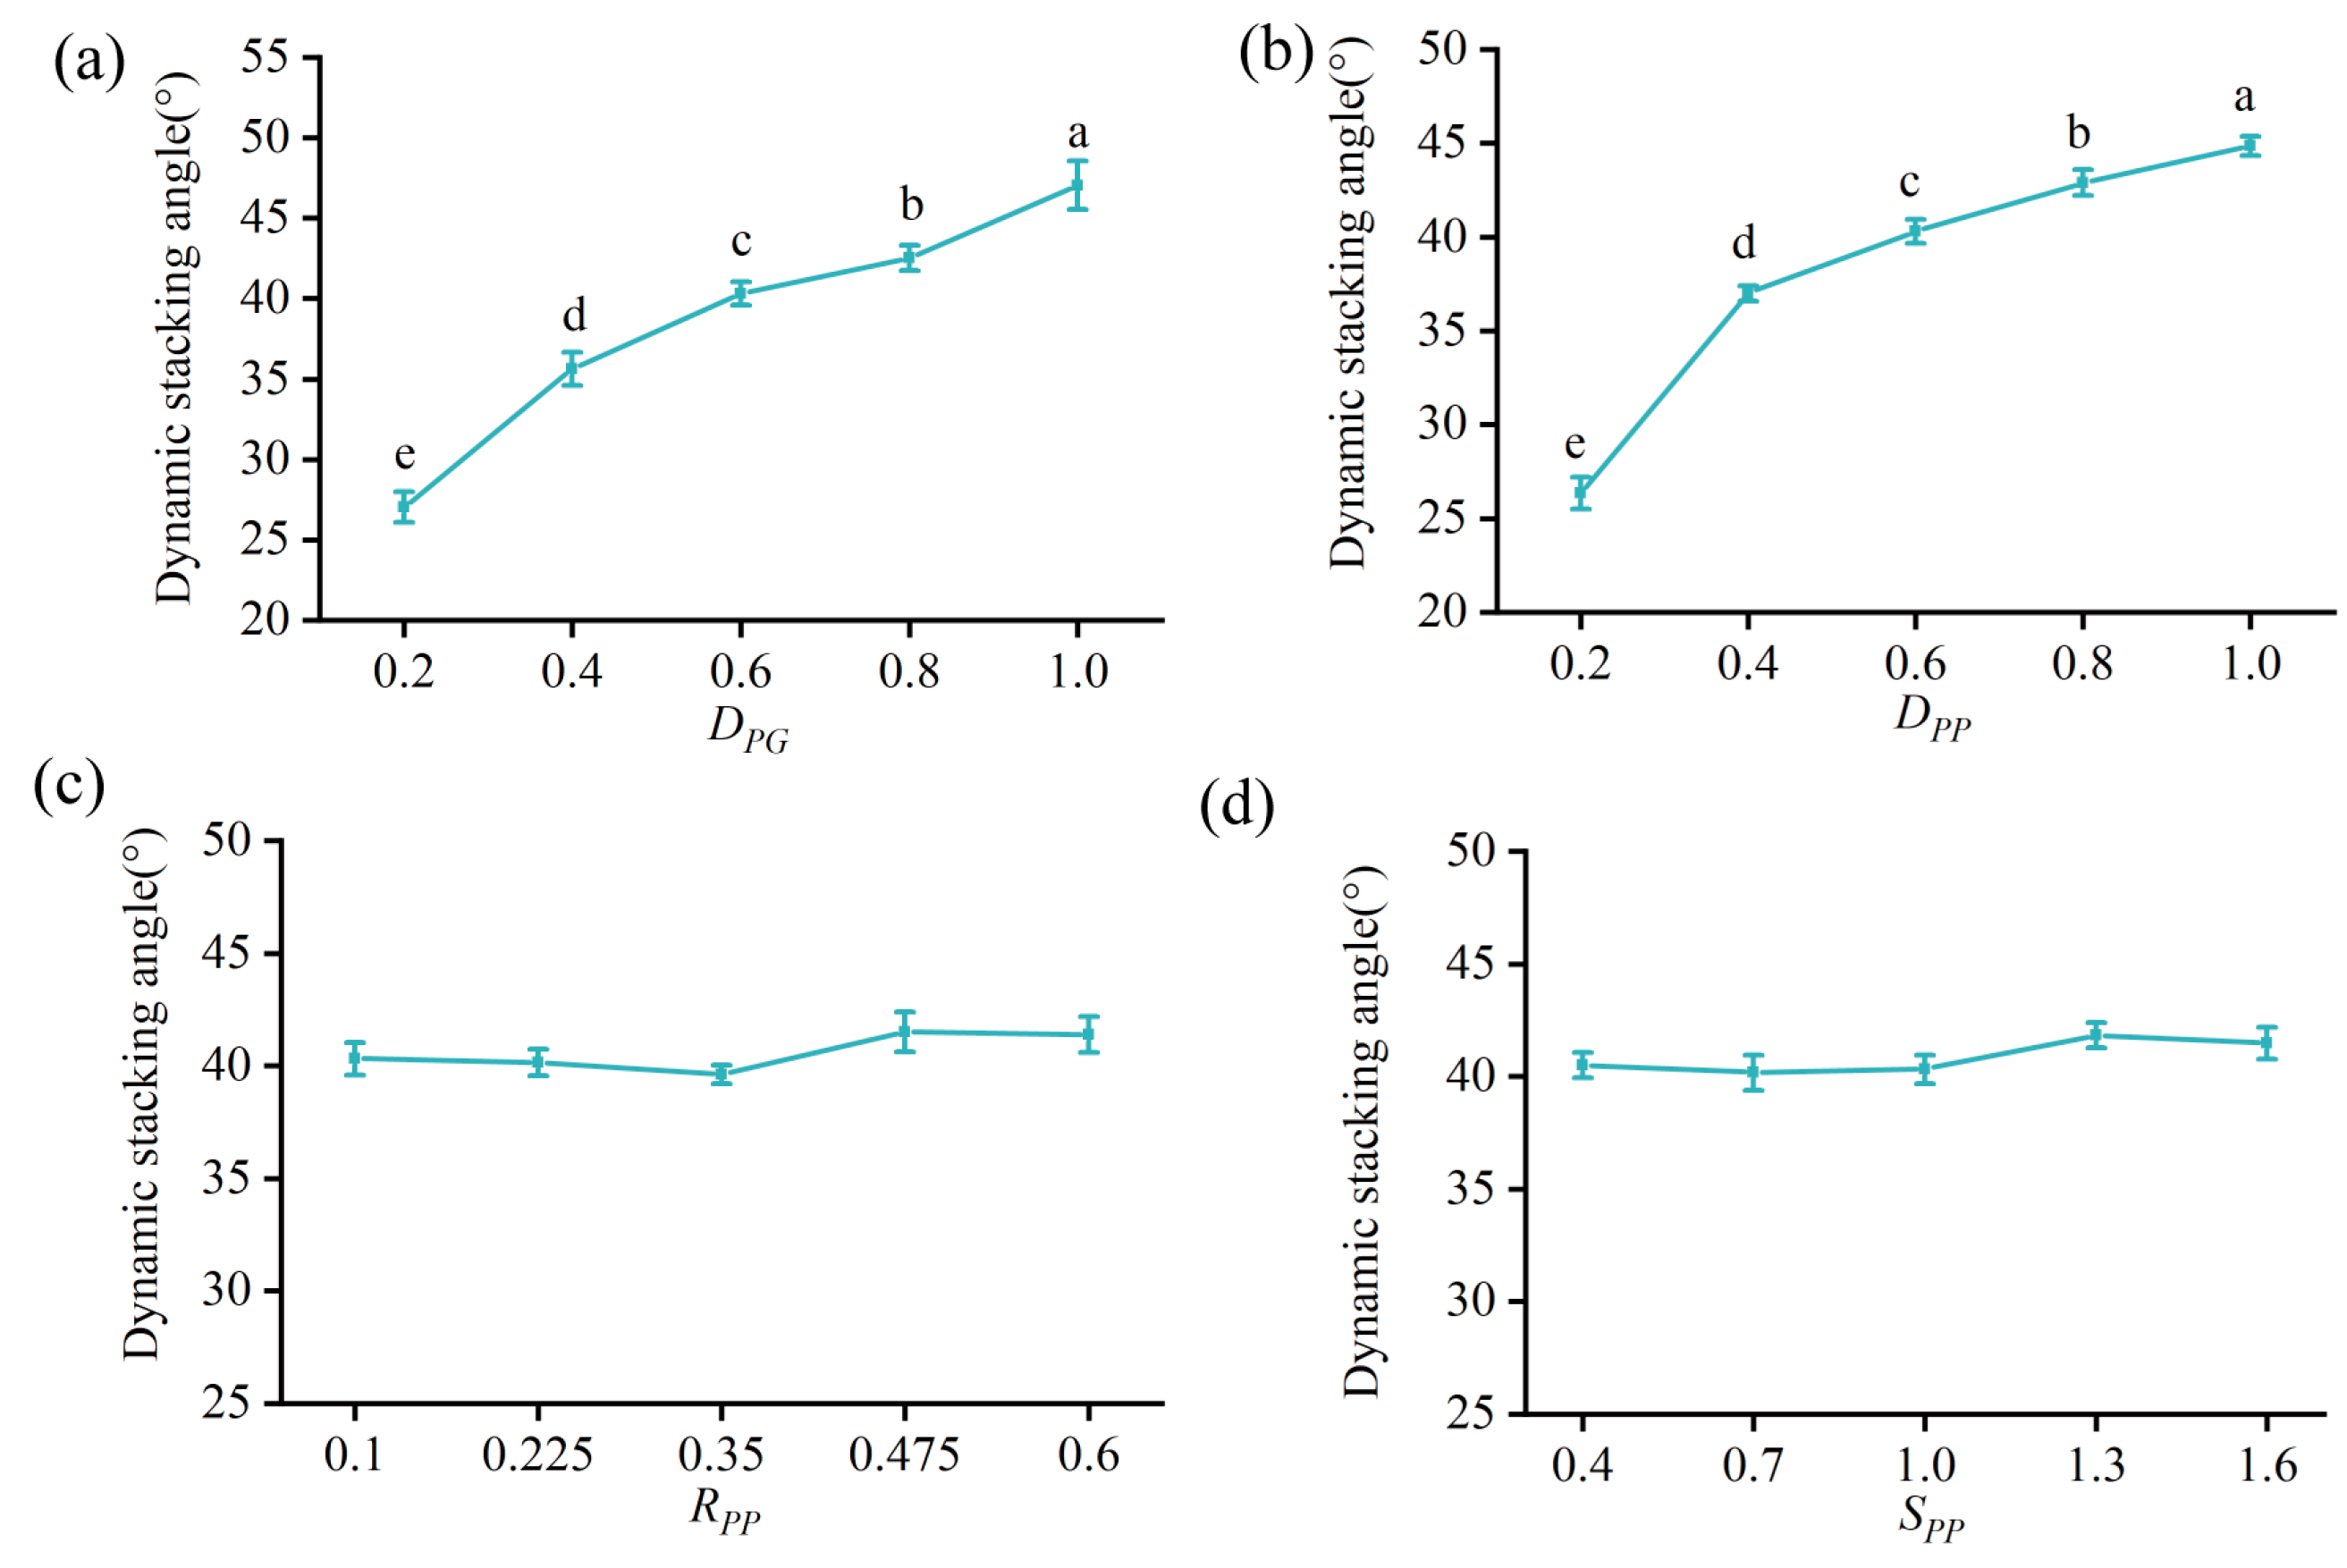
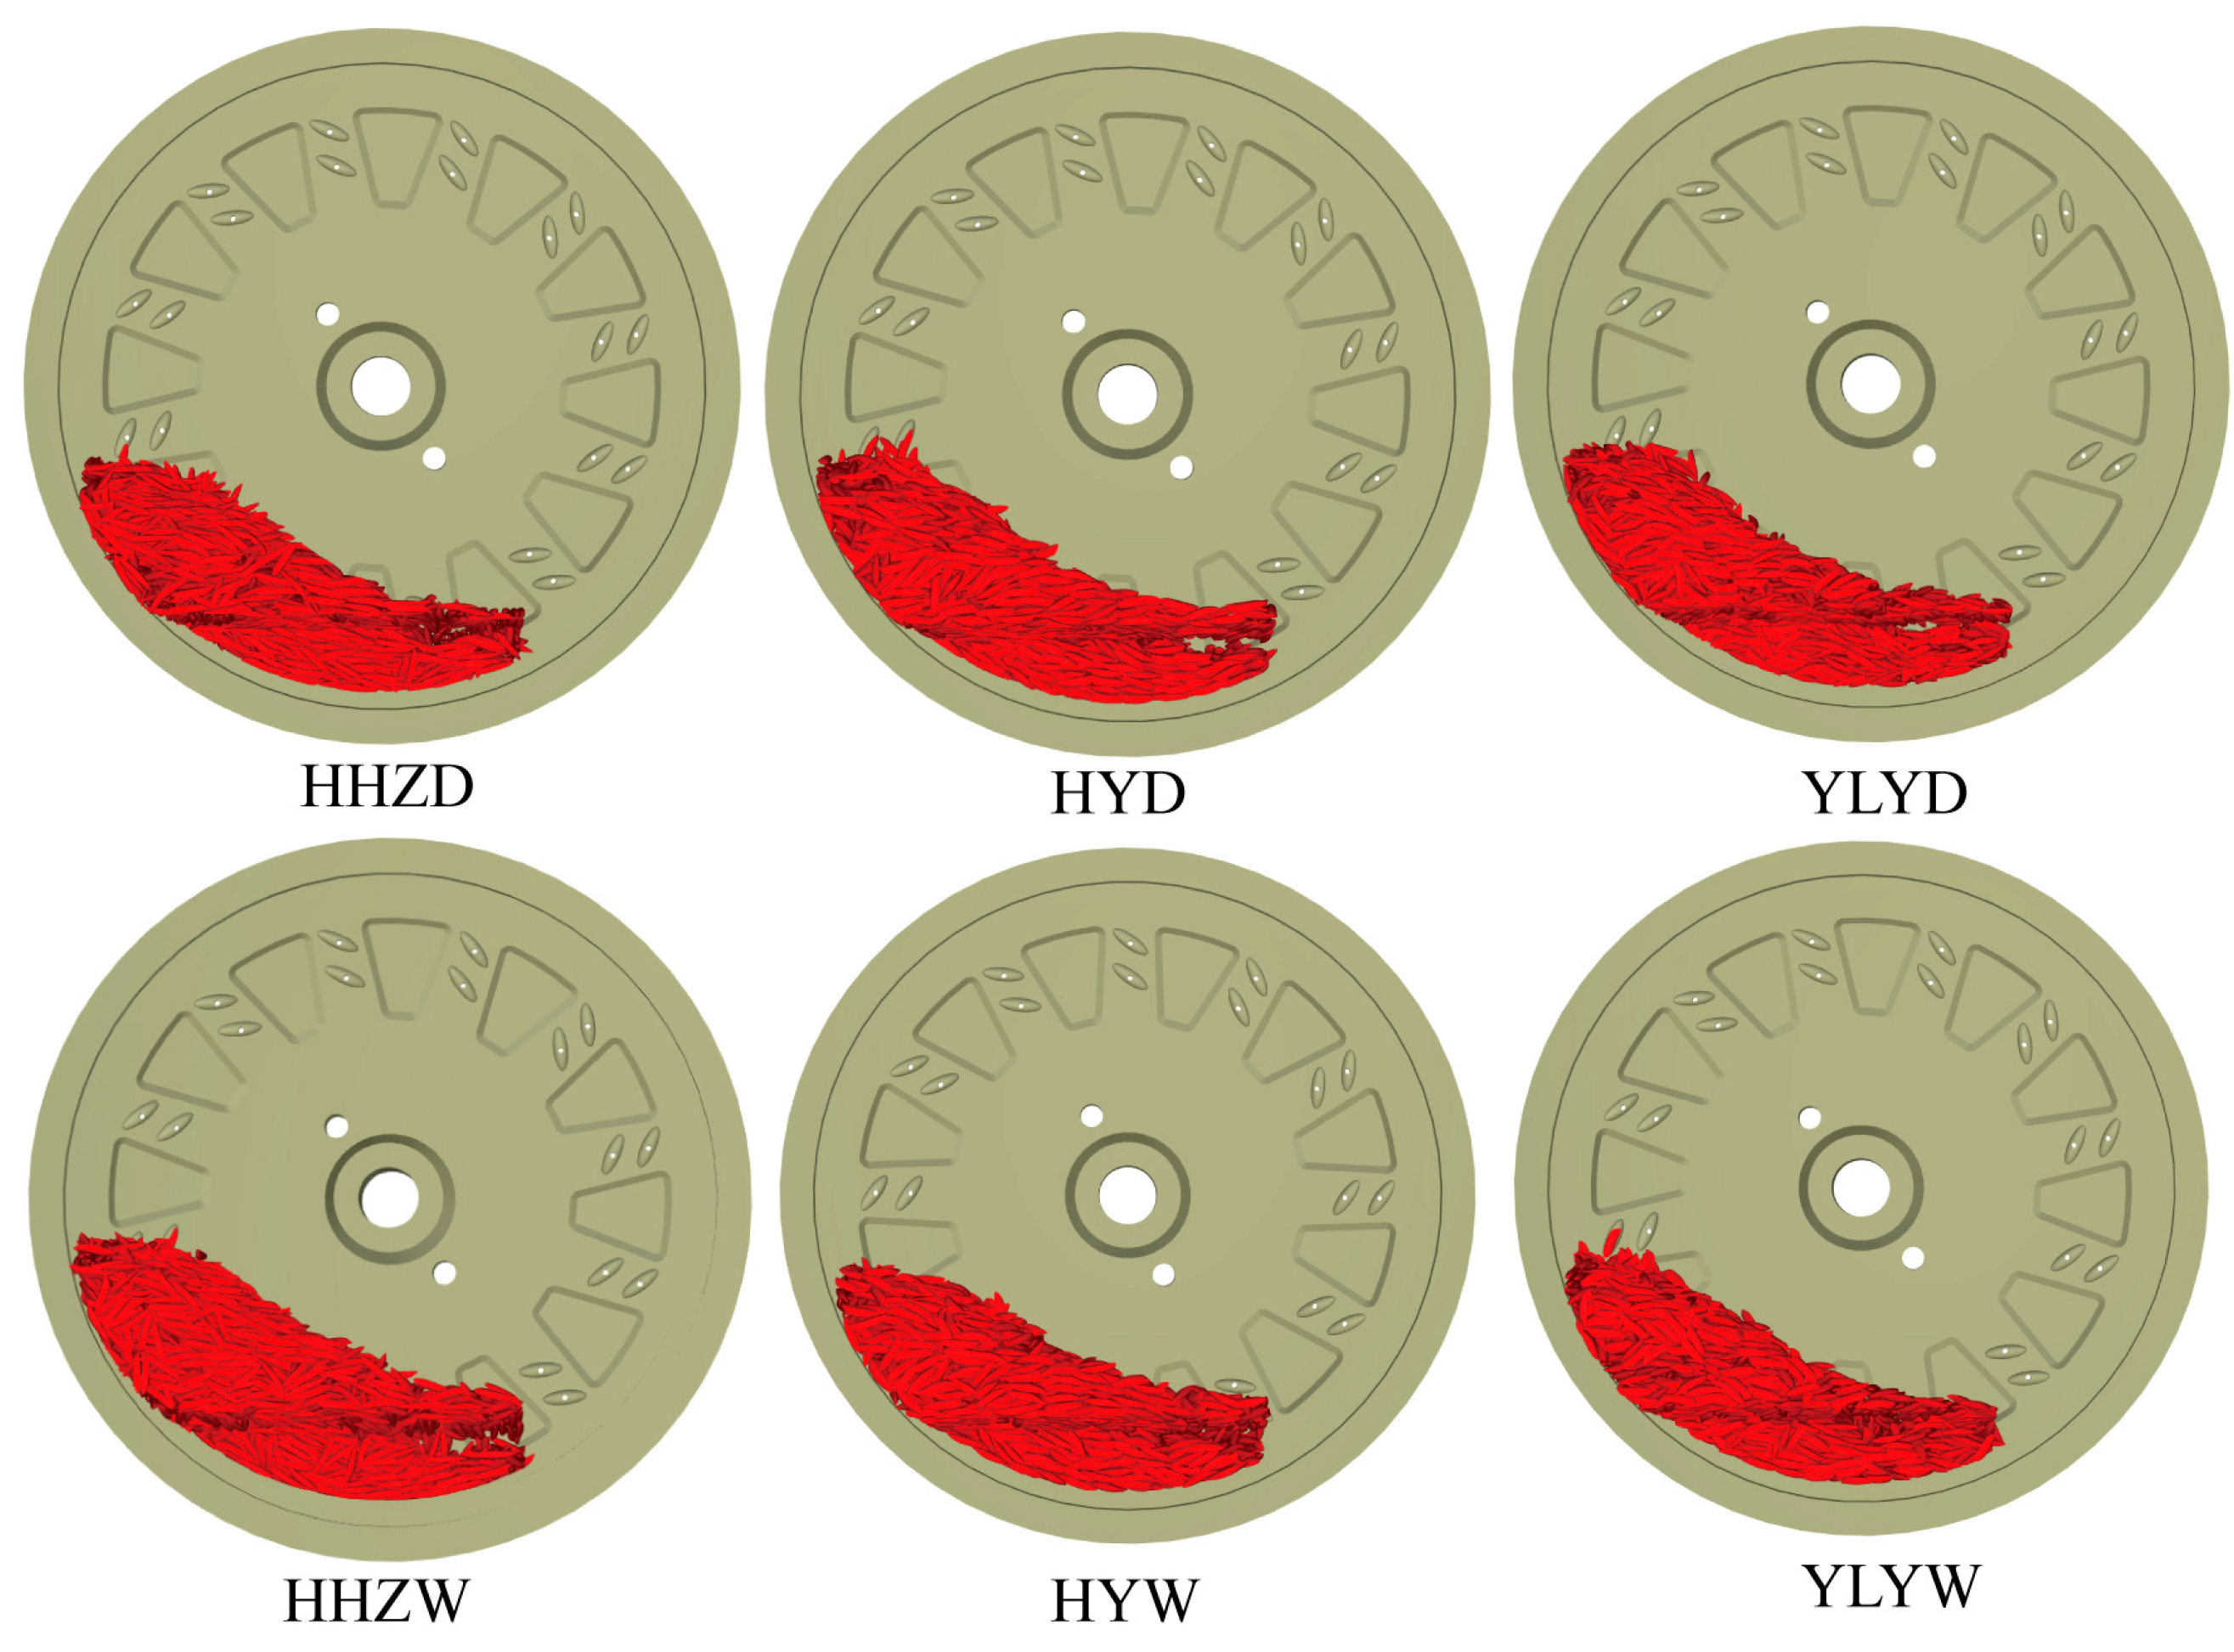
Rice seeds subjected to pre-germination treatment exhibited greater triaxial dimensions, thousand-grain weight, density, and coefficient of static friction between the seeds and the seed discharger than dry rice seeds. The effects of RPP and SPP on the dynamic stacking angle were found to be insignificant (p > 0.05), whereas the effects of DPG and DPP on the dynamic stacking angle were significant (p < 0.05). The difference between the calibrated seeds’ simulated and physical dynamic stacking angles was minimal, indicating that the polyhedral method is reliable for constructing the discrete elements of rice seeds;
(2)
For the same variety of seeds, the missing index and single index of wet rice seeds were higher than those of dry rice seeds, while the triple index and multiple index of dry rice seeds were higher than those of wet rice seeds. No significant difference was observed in the double index between dry and wet rice seeds. Additionally, there were differences in the missing index, single index, triple index, and multiple index for the same treatment across different rice seed varieties;
(3)
For the same variety of rice seeds, the normal and tangential forces on wet rice seeds during seed filling were higher than those on dry rice seeds. Additionally, for the same treatment, the greater the action force between the seeds, the higher the missing index and single index. The differences in seeding accuracy between dry and wet rice seeds of the same variety were primarily attributed to the thousand-grain weight, the coefficient of static friction between the air-suction seed metering device and the seed, and the action force between the seeds.
These findings are instructive for improving the optimization of the air-suction seed metering device for rice. In our future research, we will optimize the shaped hole structures and the seed chamber to improve the seeding accuracy and reduce the energy consumption of the seed metering device. From the theoretical point of view, applying the CFD-DEM simulation method not only verifies the validity of the study of non-spherical particles in the fluid–solid coupled field but also enriches the existing research methods in agricultural engineering.
However, this study also has some limitations. The study mainly focused on a limited number of rice seed varieties with relatively controlled environmental conditions during the experiment. In actual agricultural production, a wide range of rice seed varieties are used, the seeding environment is more complex, and factors such as soil type, temperature, and humidity may also affect the seeding accuracy. Future research could expand the range of seed varieties and conduct more in-depth field tests under different environmental conditions to further validate and refine the findings. In addition, exploring the interactions between seeds and different types of soil during sowing will also provide a more comprehensive understanding of the mechanisms of seeding accuracy.
The results of this study provide insights into the optimization of the rice air-suction seed metering device, which can be achieved by refining the device structure to reduce the action force between the seeds and the suction system, thereby improving seeding accuracy. The CFD-DEM simulation method used in this study offers valuable guidance for simulating non-spherical particles in fluid–solid coupled fields.

Author Contributions

Conceptualization, C.Q., W.Q. and Y.Z.; Data curation, Z.F., D.Y., Y.J. and Z.H.; Funding acquisition, W.Q., H.X., Z.W. and Y.Z.; Investigation, Z.F., D.Y., Y.J. and Z.H.; Methodology, C.Q.; Project administration, W.Q., H.X., Z.W. and Y.Z.; Resources, W.Q., H.X., Z.W. and Y.Z.; Software, C.Q. and Y.J.; Validation, Z.F., D.Y. and Z.H.; Writing—original draft, C.Q.; Writing—review and editing, W.Q. and Y.Z. All authors have read and agreed to the published version of the manuscript.

Funding

This research was funded by the National Natural Science Foundation of China, grant numbers 52175228; China Agriculture Research System for rice, grant numbers CARS-01.

Data Availability Statement

Data will be made available on request.

Conflicts of Interest

The authors declare no conflicts of interest.

Abbreviations

The following abbreviations are used in this manuscript:
CFDComputational fluid dynamics
DEMDiscrete element method
SPGStatic friction coefficient between the seed meter and the seed
RPGRestitution coefficient of the collision between the seed and the seed metering device
DPGDynamic friction coefficient between the seed and the metering device
DPPDynamic friction coefficient between seeds and seeds
RPPRestitution coefficient between seeds and seeds
SPPStatic friction coefficient between seeds and seeds
DSADynamic stacking angle

References

  1. Lv, Y.S.; Shao, G.N.; Jiao, G.A.; Sheng, Z.H.; Xie, L.H.; Hu, S.K.; Tang, S.Q.; Wei, X.J.; Hu, P.S. Targeted mutagenesis of that negatively regulates mesocotyl elongation enables the generation of direct-seeding rice with improved grain yield. Mol. Plant 2021, 14, 344–351. [Google Scholar] [CrossRef] [PubMed]
  2. Ma, P.; Zhou, L.; Liao, X.H.; Zhang, K.Y.; Aer, L.; Yang, E.L.; Deng, J.; Zhang, R.P. Effects of Low Light after Heading on the Yield of Direct Seeding Rice and Its Physiological Response Mechanism. Plants 2023, 12, 4077. [Google Scholar] [CrossRef] [PubMed]
  3. Zhang, M.H.; Mo, Z.W.; Liao, J.; Pan, S.G.; Chen, X.F.; Zheng, L.; Luo, X.W.; Wang, Z.M. Lodging Resistance Related to Root Traits for Mechanized Wet-Seeding of Two Super Rice Cultivars. Rice Sci. 2021, 28, 200–208. [Google Scholar] [CrossRef]
  4. Kargbo, M.B.; Pan, S.G.; Mo, Z.W.; Wang, Z.M.; Luo, X.W.; Tian, H.; Hossain, M.F.; Ashraf, U.; Tang, X.R. Physiological Basis of Improved Performance of Super Rice to Deep Placed Fertilizer with Precision Hill-drilling Machine. Int. J. Agric. Biol. 2016, 18, 797–804. [Google Scholar] [CrossRef]
  5. Zhang, M.H.; Wang, Z.M.; Luo, X.W.; Zang, Y.; Yang, W.W.; Xing, H.; Wang, B.L.; Dai, Y.Z. Review of precision rice hill-drop drilling technology and machine for paddy. Int. J. Agric. Biol. Eng. 2018, 11, 1–11. [Google Scholar] [CrossRef]
  6. Qian, C.; He, S.Y.; Qin, W.; Jiang, Y.C.; Huang, Z.S.; Zhang, M.L.; Zhang, M.H.; Yang, W.W.; Zang, Y. Influence of Shaped Hole and Seed Disturbance on the Precision of Bunch Planting with the Double-Hole Rice Vacuum Seed Meter. Agronomy 2024, 14, 768. [Google Scholar] [CrossRef]
  7. Farooq, M.; Barsa, S.M.A.; Wahid, A. Priming of field-sown rice seed enhances germination, seedling establishment, allometry and yield. Plant Growth Regul. 2006, 49, 285–294. [Google Scholar] [CrossRef]
  8. Tang, H.; Guan, T.; Xu, F.; Xu, C.; Wang, J. Test on adsorption posture and seeding performance of the high-speed precision dual-chamber maize metering device based on the seed characteristics. Comput. Electron. Agric. 2024, 216, 108471. [Google Scholar] [CrossRef]
  9. Van Loon, J.; Krupnik, T.J.; López-Gómez, J.A.; Timsina, J.; Govaerts, B. A Standard Methodology for Evaluation of Mechanical Maize Seed Meters for Smallholder Farmers Comparing Devices from Latin America, Sub-Saharan Africa, and Asia. Agronomy 2020, 10, 1091. [Google Scholar] [CrossRef]
  10. Zhong, W.D.; Zhao, X.; Liu, F.; Bai, H.B.; Dong, W.X.; Hu, H.T.; Kong, X. Design and Experiment of Precision Seed Metering Device for Flow Adsorption of Quinoa Seeds. Agriculture 2024, 14, 434. [Google Scholar] [CrossRef]
  11. Cai, Y.Q.; Luo, X.; Hu, B.; Mao, Z.B.; Li, J.W.; Guo, M.Y.; Wang, J. Theoretical and experimental analyses of high-speed seed filling in limited gear-shaped side space of cotton precision dibbler. Comput. Electron. Agric. 2022, 200, 107202. [Google Scholar] [CrossRef]
  12. St Jack, D.; Hesterman, D.C.; Guzzomi, A.L. Precision metering of Santalum spicatum (Australian Sandalwood) seeds. Biosyst. Eng. 2013, 115, 171–183. [Google Scholar] [CrossRef]
  13. Jia, X.; Zhu, J.Y.; Guo, G.; Huang, Y.X.; Gao, X.J.; Zhang, C.Q. Design and test of a novel converging groove-guided seed tube for precision seeding of maize. Biosyst. Eng. 2024, 245, 36–55. [Google Scholar] [CrossRef]
  14. Li, Y.F.; Zhou, W.Q.; Ma, C.C.; Feng, Z.H.; Wang, J.W.; Yi, S.J.; Wang, S. Design and optimization of the seed conveying system for belt-type high-speed corn seed guiding device. Int. J. Agric. Biol. Eng. 2024, 17, 123–131. [Google Scholar] [CrossRef]
  15. Deng, S.D.; Feng, Y.M.; Cheng, X.P.; Wang, X.L.; Zhang, X.C.; Wei, Z.C. Disturbance analysis and seeding performance evaluation of a pneumatic-seed spoon interactive precision maize seed-metering device for plot planting. Biosyst. Eng. 2024, 247, 221–240. [Google Scholar] [CrossRef]
  16. Sun, Y.H.; Guo, J.H.; Shi, L.R. Design and parameter optimization of air-suction wheel type of seed-metering device with elastic pad for maize. Int. J. Agric. Biol. Eng. 2024, 17, 116–127. [Google Scholar] [CrossRef]
  17. Wang, Y.B.; Li, H.W.; Hu, H.N.; He, J.; Wang, Q.J.; Lu, C.Y.; Liu, P.; Yang, Q.L.; He, D.; Jiang, S.; et al. A noncontact self-suction wheat shooting device for sustainable agriculture: A preliminary research. Comput. Electron. Agric. 2022, 197, 106927. [Google Scholar] [CrossRef]
  18. Anantachar, M.; Kumar, P.G.V.; Guruswamy, T. Neural network prediction of performance parameters of an inclined plate seed metering device and its reverse mapping for the determination of optimum design and operational parameters. Comput. Electron. Agric. 2010, 72, 87–98. [Google Scholar] [CrossRef]
  19. Karayel, D.; Güngör, O.; Sarauskis, E. Estimation of optimum vacuum pressure of air-suction seed-metering device of precision seeders using artificial neural network models. Agronomy 2022, 12, 1600. [Google Scholar] [CrossRef]
  20. Weng, W.; Wang, C.; Zhu, G.; Gu, Z.; Tang, H.; Wang, J.; Wang, J. Optimization of and experiment on simulation parameters for rotary hole filling corn precision metering device. Agriculture 2023, 13, 1093. [Google Scholar] [CrossRef]
  21. Zhao, X.; Liu, R.; Liu, F.; Bai, H.; Dong, W. Research on the Cluster Hole Effect and Performance Testing of Air-Suction Quinoa Seed Metering Device. Agriculture 2024, 14, 1391. [Google Scholar] [CrossRef]
  22. Ding, L.; Yuan, Y.C.; Dou, Y.F.; Li, C.X.; He, Z.; Guo, G.M.; Zhang, Y.; Chen, B.J.; Li, H. Design and Experiment of Air-Suction Maize Seed-Metering Device with Auxiliary Guide. Agriculture 2024, 14, 169. [Google Scholar] [CrossRef]
  23. Zhao, P.; Gao, X.; Su, Y.; Xu, Y.; Huang, Y. Investigation of seeding performance of a novel high-speed precision seed metering device based on numerical simulation and high-speed camera. Comput. Electron. Agric. 2024, 217, 108563. [Google Scholar] [CrossRef]
  24. Xu, J.; Sun, S.L.; He, Z.K.; Wang, X.M.; Zeng, Z.H.; Li, J.; Wu, W.B. Design and optimisation of seed-metering plate of air-suction vegetable seed-metering device based on DEM-CFD. Biosyst. Eng. 2023, 230, 277–300. [Google Scholar] [CrossRef]
  25. Du, X.; Liu, C.L. Design and testing of the filling-plate of inner- filling positive pressure high-speed seed-metering device for maize. Biosyst. Eng. 2023, 228, 1–17. [Google Scholar] [CrossRef]
  26. Zhao, Z.; Zhou, L.; Bai, L.; Wang, B.; Agarwal, R. Recent Advances and Perspectives of CFD–DEM Simulation in Fluidized Bed. Arch. Comput. 2023, 31, 871–918. [Google Scholar] [CrossRef]
  27. Lavrinec, A.; Orozovic, O.; Rajabnia, H.; Williams, K.; Jones, M.G.; Klinzing, G. Velocity and porosity relationships within dense phase pneumatic conveying as studied using coupled CFD-DEM. Powder Technol. 2020, 375, 89–100. [Google Scholar] [CrossRef]
  28. El-Emam, M.A.; Zhou, L.; Shi, W.D.; Han, C. True shape modeling of bio-particulate matter flow in an aero-cyclone separator using CFD-DEM simulation. Comput. Part. Mech. 2021, 8, 955–971. [Google Scholar] [CrossRef]
  29. Ma, H.Q.; Zhou, L.Y.; Liu, Z.H.; Chen, M.Y.; Xia, X.H.; Zhao, Y.Z. A review of recent development for the CFD-DEM investigations of non-spherical particles. Powder Technol. 2022, 412, 117972. [Google Scholar] [CrossRef]
  30. Chen, Z.R.; Yu, J.Q.; Xue, D.M.; Wang, Y.; Zhang, Q.; Ren, L.Q. An approach to and validation of maize-seed-assembly modelling based on the discrete element method. Powder Technol. 2018, 328, 167–183. [Google Scholar] [CrossRef]
  31. Yan, D.X.; Yu, J.Q.; Wang, Y.; Zhou, L.; Yu, Y.J. A general modelling method for soybean seeds based on the discrete element method. Powder Technol. 2020, 372, 212–226. [Google Scholar] [CrossRef]
  32. Sun, K.; Yu, J.Q.; Liang, L.S.; Wang, Y.; Yan, D.X.; Zhou, L.; Yu, Y.J. A DEM-based general modelling method and experimental verification for wheat seeds. Powder Technol. 2022, 401, 117353. [Google Scholar] [CrossRef]
  33. Chiaravalle, A.G.; Cotabarren, I.M.; Pina, J. DEM breakage calibration for single particle fracture of maize kernels under a particle replacement approach. Chem. Eng. Res. Des. 2023, 195, 151–165. [Google Scholar] [CrossRef]
  34. Chiaravalle, A.G.; Pina, J.; Cotabarren, I.M. DEM simulation of maize milling in a hammer mill. Powder Technol. 2025, 457, 120892. [Google Scholar] [CrossRef]
  35. Wang, X.; Zhai, Q.; Zhang, S.; Li, Q.; Zhou, H. Efficient and accurate calibration of discrete element method parameters for black beans. Agronomy 2024, 14, 2803. [Google Scholar] [CrossRef]
  36. Hu, M.; Xia, J.; Zhou, Y.; Luo, C.; Zhou, M.; Liu, Z. Measurement and calibration of the discrete element parameters of coated delinted cotton seeds. Agriculture 2022, 12, 286. [Google Scholar] [CrossRef]
  37. Li, A.; Jia, F.; Shen, S.; Han, Y.; Chen, P.; Wang, Y.; Zhang, J.; Feng, W.; Fei, J.; Hao, X. Numerical simulation approach for predicting rice milling performance under different convex rib helix angle based on discrete element method. Innov. Food Sci. Emerg. Technol. 2023, 83, 103257. [Google Scholar] [CrossRef]
  38. Hao, X.Z.; Han, Y.L.; Shen, S.H.; Li, A.Q.; Chen, P.Y.; Zhang, J.C.; Wang, Y.L.; Feng, W.Y.; Fei, J.M.; Jia, F.G. Study on radial segregation of whole and broken rice in an indented cylinder separator. Powder Technol. 2023, 422, 118499. [Google Scholar] [CrossRef]
  39. Zhang, S.; Tekeste, M.Z.; Li, Y.; Gaul, A.; Zhu, D.Q.; Liao, J. Scaled-up rice grain modelling for DEM calibration and the validation of hopper flow. Biosyst. Eng. 2020, 194, 196–212. [Google Scholar] [CrossRef]
  40. Tang, H.; Xu, C.; Guo, F.; Yao, Z.; Jiang, Y.; Guan, R.; Sun, X.; Wang, J. Analysis and Experiment on the Seed Metering Mechanism of Multi-Grain Cluster Air Suction Type Rice (Oryza sativa L.) Hill Direct Seed Metering Device. Agriculture 2022, 12, 1094. [Google Scholar] [CrossRef]
  41. He, S.; Qian, C.; Jiang, Y.; Qin, W.; Huang, Z.; Huang, D.; Wang, Z.; Zang, Y. Design and optimization of the seed feeding device with DEM-CFD coupling approach for rice and wheat. Comput. Electron. Agric. 2024, 219, 108814. [Google Scholar] [CrossRef]
  42. Yue, Y.; Zhang, Q.; Dong, B.; Li, J. Application of Discrete Element Method to Potato Harvesting Machinery: A Review. Agriculture 2025, 15, 315. [Google Scholar] [CrossRef]
  43. Xing, H.; Cao, X.M.; Zhong, P.; Wan, Y.K.; Lin, J.J.; Zang, Y.; Zhang, G.Z. DEM-CFD coupling simulation and optimisation of rice seed particles seeding a hill in double cavity pneumatic seed metering device. Comput. Electron. Agric. 2024, 224, 109075. [Google Scholar] [CrossRef]
Figure 1. Test device of the static friction coefficient between the seeds and the seed meter.
Agronomy 15 01145 g001
Figure 2. Restitution coefficient test device.
Agronomy 15 01145 g002
Figure 3. Measurement device of the dynamic stacking angle.
Agronomy 15 01145 g003
Figure 4. Modeling process for rice seeds.
Agronomy 15 01145 g004
Figure 5. Discrete element experiment of dynamic stacking angle.
Agronomy 15 01145 g005
Figure 6. Air-suction seed metering device for rice.
Agronomy 15 01145 g006
Figure 7. Bench of seeding accuracy tests.
Agronomy 15 01145 g007
Figure 8. Relationships between the number of meshes and the drag force, pressure gradient forces.
Agronomy 15 01145 g008
Figure 9. Fluid domain mesh IV of the air-suction seed metering device.
Agronomy 15 01145 g009
Figure 10. Experimental and simulated results for air chamber vacuum pressure.
Agronomy 15 01145 g010
Figure 11. Extraction of CFD-DEM data: (a) Simulation models; (b) Adding cubes to suction holes; (c) Selected suctioned rice seeds.
Agronomy 15 01145 g011
Figure 12. Rice seeds and their three-dimensional models.
Agronomy 15 01145 g012
Figure 13. Test result of rice seed physical characteristics: (a) Rice size; (b) Thousand-grain weight and density; (c) SPG; (d) RPG; (e) Dynamic stacking angle.
Agronomy 15 01145 g013
Figure 14. Single-factor experiment results of the dynamic stacking angle: (a) DPG; (b) DPP; (c) RPP; (d) SPP. Lowercase letters are usually used to mark significant differences between groups of data (p < 0.05).
Agronomy 15 01145 g014
Figure 15. Two-factor experiment results of the dynamic stacking angle: (a) HHZD; (b) HHZW; (c) HYD; (d) HYW; (e) YLYD; (f) YLYW. The reference line in the figure shows the optimization objective for the dynamic stacking angle. Lowercase letters are usually used to mark significant differences between groups of data (p < 0.05).
Agronomy 15 01145 g015
Figure 16. Dynamic stacking angle of calibrated rice seed.
Agronomy 15 01145 g016
Figure 17. Seeding accuracy at 20 rpm: (a) Missing; (b) Single; (c) Double; (d) Triple; (e) Multiple.
Agronomy 15 01145 g017
Figure 18. Seeding accuracy at 40 rpm: (a) Missing; (b) Single; (c) Double; (d) Triple; (e) Multiple.
Agronomy 15 01145 g018
Figure 19. Seeding accuracy at 60 rpm: (a) Missing; (b) Single; (c) Double; (d) Triple; (e) Multiple.
Agronomy 15 01145 g019
Figure 20. Pearson correlation analysis.
Agronomy 15 01145 g020
Figure 21. Pressure gradient force of rice seed at 40 rpm.
Agronomy 15 01145 g021
Table 1. Intrinsic parameters of the material.
MaterialsPoisson’s RatioYoung’s Modulus
(MPa)
Density
(g/cm3)
Rice0.2570Test results
Metering device0.425001.15
Table 2. Contact parameters of the material.
ParametersValue
Dynamic friction coefficient between the seed and the metering device (DPG)0.2~1.0
Dynamic friction coefficient between seeds and seeds (DPP)0.2~1.0
Restitution coefficient between seeds and seeds (RPP) 0.2~0.6
Static friction coefficient between seeds and seeds (SPP) 0.4~1.6
Coefficient of static friction between the seed and the seed metering device (SPG)Test results
Restitution coefficient of the collision between the seed and the seed metering device (RPG)Test results
Table 3. Dynamic stacking angle optimization experiment results.
IndicatorRice Seed
HHZDHHZWHYDHYWYLYDYLYW
DPP0.400.600.400.500.500.40
DPG0.320.380.420.260.360.32
DSA (°)36.17 ± 0.3435.38 ± 0.6834.56 ± 0.4032.33 ± 0.3232.83 ± 0.1931.41 ± 0.59
DPG0.340.400.440.280.380.34
DSA (°)36.31 ± 0.5336.23 ± 0.5135.30 ± 0.3734.61 ± 0.7433.64 ± 0.1732.64 ± 0.81
DPG0.360.420.460.300.400.36
DSA (°)36.83 ± 0.1937.3 ± 0.5335.97±35.13 ± 0.8533.72 ± 0.9633.58 ± 0.76
DPG0.380.440.480.320.420.38
DSA (°)37.31 ± 0.1839.41 ± 0.2836.41±35.77 ± 0.5134.91 ± 0.6334.18 ± 0.97
Table 4. Drag force and pressure gradient force on rice seeds in filling and carrying.
ProcessLocationSeedDrag Force
(×10−3N)
Pressure Gradient Force (×10−3N)Sum
(×10−3N)
Rotational Speed (rpm)
204060204060204060
FillingInsideHHZD4.193.803.838.759.198.7612.9412.9912.59
HHZW3.533.002.828.978.438.1312.511.4310.95
HYD2.482.252.429.618.679.6412.0910.9212.06
HYW2.522.412.3710.039.709.3712.5512.1111.74
YLYD3.372.922.977.576.746.7010.949.669.67
YLYW2.642.422.3710.729.759.8613.3612.1712.23
OutsideHHZD3.783.703.808.747.897.8312.5211.5911.63
HHZW3.402.882.727.968.626.7211.3611.59.44
HYD2.472.392.259.639.578.9812.111.9611.23
HYW2.512.232.1710.168.728.7712.6710.9510.94
YLYD3.262.822.787.256.596.8110.519.419.59
YLYW2.572.212.2410.488.939.3313.0511.1411.57
CarryingInsideHHZD2.963.243.023.446.224.896.49.467.91
HHZW2.542.322.465.856.096.278.398.418.73
HYD1.911.871.778.147.927.4510.059.799.22
HYW1.961.981.808.468.607.7510.4210.589.55
YLYD2.512.422.244.033.784.726.546.26.96
YLYW1.881.861.797.947.837.559.829.699.34
OutsideHHZD2.983.402.973.736.834.226.7110.237.19
HHZW2.542.232.455.446.505.287.988.737.73
HYD1.881.901.777.958.117.619.8310.019.38
HYW1.961.961.868.498.488.1010.4510.449.96
YLYD2.462.382.213.644.034.586.16.416.79
YLYW1.821.821.817.637.647.649.459.469.45
Table 5. Analysis of variance for drag force and pressure gradient force.
ProcessLocationIndicatorsFactorsdfFp
FillingInsideDrag forceSeed572.16<0.01
Rotational speed213.76<0.01
Pressure gradient forceSeed529.16<0.01
Rotational speed24.540.04
SumSeed517.43<0.01
Rotational speed28.87<0.01
OutsideDrag forceSeed558.94<0.01
Rotational speed212.23<0.01
Pressure gradient forceSeed513.29<0.01
Rotational speed25.580.02
SumSeed57.13<0.01
Rotational speed29.35<0.01
CarryingInsideDrag forceSeed575.01<0.01
Rotational speed22.490.13
Pressure gradient forceSeed519.41<0.01
Rotational speed20.640.55
SumSeed510.09<0.01
Rotational speed20.620.56
OutsideDrag forceSeed541.05<0.01
Rotational speed21.090.37
Pressure gradient forceSeed519.04<0.01
Rotational speed22.260.16
SumSeed510.19<0.01
Rotational speed22.140.17
Table 6. Normal and tangential forces on rice seeds in filling and carrying.
ProcessLocationSeedNormal Force
(×10−3N)
Tangential Force
(×10−3N)
Rotational Speed (rpm)
204060204060
FillingInsideHHZD22.1821.7420.516.606.416.32
HHZW24.3124.1723.338.609.249.28
HYD28.6725.1827.869.939.1910.15
HYW36.0237.6930.3611.9112.4710.03
YLYD22.1218.4017.277.766.676.45
YLYW30.2926.9622.569.679.147.77
OutsideHHZD29.1924.4422.108.627.576.78
HHZW32.2727.2327.4311.9310.4511.64
HYD37.6835.1131.3713.2912.5011.59
HYW46.9651.2441.4315.7317.7913.70
YLYD26.0223.9120.409.1911.457.68
YLYW39.0441.5525.8012.6514.228.89
CarryingInsideHHZD5.819.006.431.522.011.54
HHZW7.597.648.222.102.102.35
HYD9.869.538.822.892.692.65
HYW10.2110.319.062.662.482.49
YLYD5.825.165.901.581.491.67
YLYW9.669.368.962.212.312.34
OutsideHHZD7.069.155.771.831.891.51
HHZW7.248.086.312.102.101.91
HYD9.769.7012.252.712.943.92
HYW10.2610.149.402.562.652.43
YLYD5.215.055.551.401.971.58
YLYW9.289.089.032.212.462.24
Table 7. Analysis of variance for normal and tangential force.
ProcessLocationIndicatorsFactorsdfFp
FillingInsideNormal forceSeed521.03<0.01
Rotational speed24.730.04
Tangential forceSeed519.43<0.01
Rotational speed21.670.24
OutsideNormal forceSeed529.16<0.01
Rotational speed221.88<0.01
Tangential forceSeed513.23<0.01
Rotational speed25.130.03
CarryingInsideNormal forceSeed511.60<0.01
Rotational speed20.780.48
Tangential forceSeed523.29<0.01
Rotational speed20.020.98
OutsideNormal forceSeed510.40<0.01
Rotational speed20.350.71
Tangential forceSeed59.43<0.01
Rotational speed20.590.57
Table 8. Normal and tangential action force on rice seeds.
ProcessSeedNormal Action Force
(×10−3N)
Tangential Action Force
(×10−3N)
Rotational Speed (rpm)
204060204060
InsideHHZD16.3712.7414.085.084.534.78
HHZW16.7216.5315.116.497.146.93
HYD18.8115.6519.057.046.57.51
HYW25.8127.3821.309.259.997.54
YLYD16.3013.2411.386.185.184.77
YLYW20.6317.613.617.456.835.43
OutsideHHZD22.1315.2916.326.795.685.27
HHZW25.0319.1521.139.838.359.73
HYD27.9225.4119.1310.579.567.67
HYW36.7141.132.0313.1715.1411.26
YLYD20.8118.8614.857.799.486.10
YLYW29.7632.4716.7710.4411.766.66
Table 9. Analysis of variance for normal and tangential action force.
LocationIndicatorsFactorsdfFp
InsideDrag forceSeed512.46<0.01
Rotational speed24.390.04
Tangential forceSeed511.50<0.01
Rotational speed21.670.24
OutsideDrag forceSeed511.52<0.01
Rotational speed26.440.02
Tangential forceSeed510.56<0.01
Rotational speed25.410.03
Disclaimer/Publisher’s Note: The statements, opinions and data contained in all publications are solely those of the individual author(s) and contributor(s) and not of MDPI and/or the editor(s). MDPI and/or the editor(s) disclaim responsibility for any injury to people or property resulting from any ideas, methods, instructions or products referred to in the content.

