Abstract
The main objective of energy balance analysis is to guide farmers in making informed decisions that promote the efficient management of natural resources, optimise the use of agricultural inputs, and improve the overall economic performance of their farms. In addition, it supports the adoption of sustainable agricultural practices, such as crop diversification, the use of renewable energy sources, and the recycling of agricultural by-products and residues into natural energy sources or fertilisers. This paper analyses the variation in energy efficiency between 2019 and 2022 of the main crops in Angola: maize, soybean, and rice, and the forest production of eucalyptus biomass in agroforestry farms. The research was based on the responses to interviews conducted with the managers of the farms regarding the machinery used, fuels and lubricants, labour, seeds, phytopharmaceuticals, and fertilisers. The quantities are gathered by converting data into Megajoules (MJ). The results show variations in efficiency and energy balance. In corn, efficiency fluctuated between 1.32 MJ in 2019 and 1.41 MJ in 2020, falling to 0.94 MJ in 2021 due to the COVID-19 pandemic before rising to 1.31 MJ in 2022. For soybeans, the energy balance went from a deficit of −8223.48 MJ in 2019 to a positive 11,974.62 MJ in 2022, indicating better use of resources. Rice stood out for its high efficiency, reaching 81,541.33 MJ in 2021, while wood production showed negative balances, evidencing the need for more effective strategies. This research concludes that understanding the energy balance of agricultural operations in Angola is essential not only to achieve greater sustainability and profitability but also to strengthen the resilience of agricultural systems against external factors such as climate change, fluctuations in input prices, and economic crises. A comprehensive understanding of the energy balance allows farmers to assess the true cost-effectiveness of their operations, identify energy inefficiencies, and implement more effective strategies to maximise productivity while minimising environmental impacts.
1. Introduction
The sustainability of agroforestry farms is a central issue in the global context, where energy consumption and efficiency are emerging as critical indicators of sustainable practices [1,2,3,4,5,6,7]. Recent studies emphasise the importance of integrating renewable and conventional energy sources as a way of improving efficiency and reducing environmental impacts [8,9]. Despite this, many agroforestry farms still do not adequately assess the energy balance of their activities, limiting opportunities to optimise productivity and address environmental and climate challenges [10,11].
Analysing the life cycle of products, from harvesting to transport and processing, is essential to ensure the efficient use of energy and reduce environmental impacts [7,12]. In this context, Angola, with its vast territory and unique environmental and cultural characteristics, presents an ideal setting for studies on sustainable agroforestry practices [13]. Forest management in the country is marked by diverse soil and climatic conditions, suitable for agricultural activities, animal husbandry, and forestry production systems. These conditions make Angola not only locally relevant but also representative for regions with similar challenges [14].
The farms studied in this study are located in strategic provinces of Angola: Benguela, Bié, Cuanza-Sul, Huambo, and Cuando Cubango. The selection was based on territorial suitability, available infrastructure (road, rail, maritime, and river networks), proximity to industrial centres and energy distribution networks, and favourable climatic conditions for growing energy crops such as rice, maize, soya, and eucalyptus. These characteristics make it possible to evaluate practices in real and varied contexts, providing applicable insights in Angola and other tropical and subtropical regions [13,14].
This study aims to analyse the energy balance and efficiency of agroforestry activities in Angola using data collected between 2019 and 2022, providing insight into the energy reality of agroforestry practices in Angola [15].
The energy balance is the result of the difference between the energy produced and the energy consumed. This calculation must be made for several years and several crops, resulting in positive values when companies produce well or negative values when production is low and inconsistent. The importance of these calculations is highlighted by [1], who highlight energy efficiency as a crucial indicator of sustainability. Energy efficiency is the ratio between the energy produced and the energy consumed, making it possible to identify situations in which the costs related to production factors are higher than the value of production [2].
In the reviewed literature, energy efficiency and energy balance in rice, corn, soybean, and eucalyptus wood crops are topics of great interest, due to their classification as important bioenergy crops to produce biomass for bioenergy [16,17]. This interest is justified by the potential of these crops to provide energy for both domestic and industrial applications. The analysis of energy efficiency and energy balance is essential to improve agricultural practices and the sustainability of production systems [2]. This approach allows the assessment of the viability of the adopted production systems and is crucial for the analysis of efficiency in agroforestry production systems [16,17].
The research aims to identify gaps in energy efficiency and propose strategies that optimise productivity and minimise environmental impacts. The results will contribute to advancing knowledge about sustainable agroforestry practices, providing a model applicable to other regions with similar conditions and promoting the adoption of approaches in line with the Sustainable Development Goals.
2. Materials and Methods
2.1. Data Collection
The data for this study were collected from agroforestry farms in Angola between 2019 and 2022. The farms varied in size, and the data were obtained through interviews with those responsible for them, as depicted in Figure 1. At the request of the farm managers and for data protection reasons, we were not allowed to reveal the farm’s name.
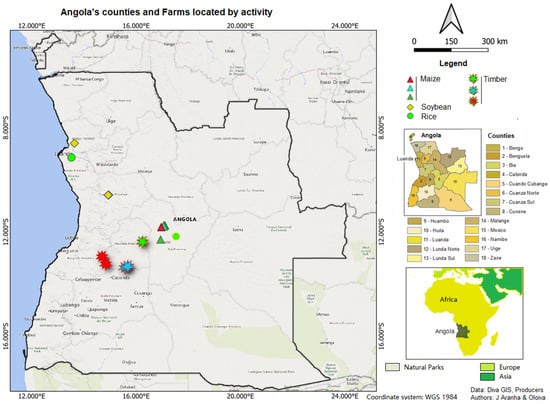
Figure 1.
Study area location.
The agroforestry farms selected for this study were chosen based on specific criteria that considered land suitability and the soil and climatic conditions of the regions where they are located. The selection prioritised areas with favourable morphological, soil, and climatic characteristics for cultivating energy crops such as rice, maize, soybean, and eucalyptus, for analysing territorial suitability.
Farms were selected for their proximity to key transport networks (road, rail, sea, and river), industrial centres, and energy distribution networks. These features facilitate logistic operations and support the implementation of circular economy projects. The study included farms across different provinces to reflect Angola’s environmental and cultural diversity, ensuring broad geographical and socio-economic representativeness.
2.1.1. Location of the Farms
The research team sent the request for information and the interview guide to 58 farm managers. We received positive answers from 18 farms’ managers. The farms are distributed across six Angolan provinces, covering a wide range of geographical and climatic conditions (Figure 1). However, only seven managers sent us completed information suitable to be used in further calculation: Benguela: Farm A; Bié: Farm B1, Farm B2, Farm C; Cuanza-Sul: Farm D, Farm E; Huambo: Farm F; and Cuando Cubango: Farm F.
2.1.2. Management Methods
The farms in the analysis have two main management modes, reflecting different scales and operational approaches:
Local Agriculture Farms: Farm A: Maize crop; Farm B1: Maize crop; Farm C: Maize crop; Farm B2: Soya crop.
National Agriculture Farms: Farm D: Rice crop; Farm E: Rice crop; Farm F: Timber production
2.1.3. Data Collection Procedures
Data were collected between 2019 and 2022 using a combination of direct observations, structured interviews, and records of production activities, based on answers and values presented for the following:
- Products (e.g., maize, soybeans, rice, timber)
- Total farm size (ha)
- Area in production (ha)
- Description (e.g., grain, oil, logs, branches)
- Total production by cultures for the years: 2019, 2020, 2021, 2022
The interviews followed a detailed questionnaire that was provided to farmers and farm managers. The questionnaire included questions related to the following levels of analysis: (1) Operational Practices: Methods of soil preparation and crop management; Use of agricultural inputs such as fertilisers and pesticides. (2) Energy Consumption: Sources of energy used at each stage of the production process; Energy consumption per activity, including soil preparation, irrigation, transport and processing. (3) Infrastructure: Availability and use of transport and storage infrastructure; Proximity to industrial centres and access to the energy distribution network. (4) Sustainability and Energy Efficiency: Farmers’ perceptions of energy efficiency and sustainable practices; Challenges faced in implementing circular economy strategies.
2.1.4. Data Analysis
The data collected was organised and analysed to identify patterns in energy consumption and efficiency. The analysis considered the identification of opportunities to optimise production practices and promote greater sustainability.
2.2. Structure and Calculation of Energy Consumption
A matrix was created to calculate energy consumption in rice, maize, soya, and timber production operations. The activities analysed included all stages, from tilling the soil to harvesting. Only primary products were considered, excluding by-products and waste.

Table 1.
Variables and values to be used in the energy calculation.
Characteristics of the Energy Matrix [10,12,18,19,20].
- Direct Inputs: These include energy from fossil fuels, electricity, and the use of agricultural machinery during the production cycle.
- Indirect Inputs: These include the energy embedded in the manufacturing and transport of inputs such as fertilisers, pesticides, and seeds.
- Energy Outputs: Calculated as the sum of the energy contained in the main agricultural products and by-products, based on energy coefficients available in the literature.
Formulas for Calculating Energy Balance and Energy Efficiency.
- Energy Balance
The energy balance (EB—Equation (1)) was calculated as the difference between the total energy produced (Eprod) and the total energy consumed (Econs) on each farm and crop. This approach reflects whether the analysed system has a positive or negative energy balance:
where
EB = Eprod − Econs
- Eprod: Total energy produced, including crops and by-products (MJ/ha)
- Econs: Total energy consumed, considering direct and indirect inputs (MJ/ha)
- Energy Efficiency
Energy efficiency (EE—Equation (2)) was calculated as the ratio of energy produced (Eprod) to energy consumed (Econs). This index measures the efficiency of agricultural systems in converting energy inputs into productive outputs:
where
- Eprod: Total energy produced, including crops and by-products (MJ/ha)
- Econs: Total energy consumed, considering direct and indirect inputs (MJ/ha)
2.3. Analysing the Production System
The analysis of the production system focused on primary products and considered all the direct and indirect energy used up to the farm gate, excluding energy for drying, packaging, storage, and transport after the farm gate. Also excluded were solar energy, energy for fertiliser production, and the manufacture of agricultural machinery.
The definition of the system boundary plays a central role in the study, as it avoids ambiguities and ensures methodological consistency. In this case, the system is delimited up to the ‘farm gate’, restricting itself to the agricultural production cycle itself. This choice reflects the need for a clear and specific analysis, centred on the inputs and outputs directly associated with primary production.
By adopting the ‘farm gate’ as the system boundary, the energy used up to harvesting and initial crop preparation is considered exclusively. This approach includes both direct energy, such as fuel consumption for agricultural machinery, and indirect energy, such as that associated with the manufacture and transport of inputs (e.g., fertilisers and seeds). This approach ensures that the analysis remains focused on agricultural activity, avoiding the inclusion of elements outside the production cycle.
Expanding the scope of the study beyond the defined limit would imply considering subsequent processes such as transport, packaging, or storage. These activities are often associated with other sectors, such as logistics or the processing industry, and would require additional parameters that would significantly expand the scope of the study. This kind of overlap could compromise clarity and analytical focus, leading interpretation of the results to be less precise.
The choice to delimit the system up to the ‘farm gate’ has direct implications for the balance sheet and energy efficiency. This approach allows for a detailed analysis of the primary production cycle, highlighting the energy contribution of on-farm production factors. Furthermore, by excluding subsequent stages, the study remains focused on the energy sustainability of agricultural production itself, providing relevant information for the efficient management of resources within the agricultural sphere.
2.4. How the Spreadsheet Works
Collecting and entering data: the data collected from each farm is manually entered into the spreadsheet and categorised into different types of energy consumed and produced. This process is fundamental to ensuring accuracy in analysing the energy balance [10].
Calculating the energy balance: the difference between the energy produced and consumed is calculated for each year and each crop, resulting in a positive or negative energy balance. The importance of these calculations is emphasised by Zahedi et al. [1], who highlight energy efficiency as a crucial indicator of sustainability.
Energy efficiency: Energy efficiency is calculated as the ratio between the energy produced and the energy consumed, making it possible to identify the efficiency of each crop over the period analysed. This method is in line with the bibliometric analysis carried out by Benedek et al. [14].
Comparative analysis: The results are compared between different years and crops, identifying variations and trends in energy efficiency and energy balance. Bharda and Dixit [8] discuss the importance of using conventional and non-conventional energy sources, reinforcing the need for a detailed comparative analysis.
2.5. Energy Indicators
Energy efficiency indicators were measured in Megajoules per hectare (MJ/ha) and included energy consumption during the production cycle. Both direct energy (electricity, fuels) and indirect energy (fertilisers, pesticides, seeds) were taken into account.
2.6. Energy Inputs and Outputs
Transport was not considered in the energy balance analysis when it was related to post-production activities, i.e., the transport of products that had already been harvested and were ready to be sent to the market or other off-farm destinations. However, internal transport, which is directly linked to the production cycle, was included. This internal transport refers to the handling and movement of inputs and products within the farm, necessary to transport the product to the farm gate. In this way, the study remains focused exclusively on the primary production cycle, guaranteeing consistency and clarity of the analytical scope.
2.7. Efficiency and Energy Balance of Rice, Maize, Soya, and Eucalyptus Wood Crops
The energy balance has varied over the years, indicating the energy viability of agricultural and forestry production. A positive balance indicates viability, while a negative balance suggests the need to review agricultural practices to increase energy efficiency [7,12,17].
2.8. Cluster Analysis
After data analysis and farms’ characterisation, a cluster analysis [21] was applied to check how the different farms could be associated according to the results.
3. Results
3.1. Farms’ Main Characteristics
The results from data processing, presented in Table 2, enable the characterisation of the farms into three classes: those dedicated to subsistence agriculture and local trade, large commercial producers, and purely forestry. This statement is corroborated by the dendrogram obtained after applying a cluster analysis to the data matrix (Table 2), as shown in Figure 2.
Table 2.
Summary characteristics of the farms in the analysis.
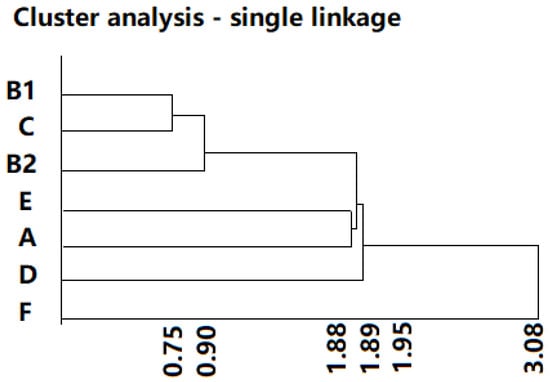
Figure 2.
Dendrogram from cluster analysis using the single linkage method.
3.2. Energy Balance and Efficiency
The energy balance has varied over the years, indicating the energy viability of agricultural and forestry production. A positive balance indicates viability, while a negative balance points to the need to review agricultural practices to increase energy efficiency [10,12,18,19,20]. The results show that there was, in general, an improvement in energy efficiency between 2019 and 2022, with rice cultivation proving to be the most efficient and forestry enterprises as the least efficient, as presented in Table 3 and shown in Figure 3.
Table 3.
Energy inputs, outputs, and efficiency for the seven farms in the analysis.
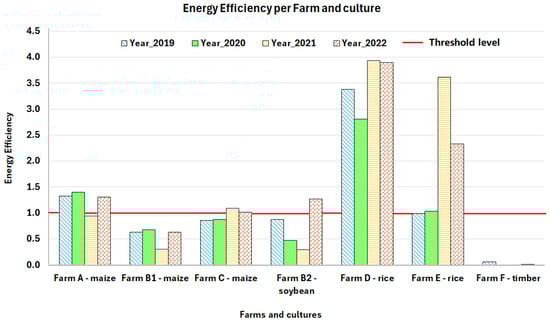
Figure 3.
Energy efficiency by farm and culture.
Table 3 presents the energy efficiency results for maize crops at Farm A between 2019 and 2022, revealing an interesting trajectory as, in 2019, the energy efficiency of 1.32 MJ indicates a solid performance, in which the energy produced was 32% higher than that consumed.
The annual variations in total energy and energy efficiency require a detailed analysis to see if the decrease in energy efficiency in 2022 indicates the need for process improvements or more sustainable practices. In 2011, there was an increase in the use of direct and indirect energy, which led to a decrease in energy efficiency to 0.94 MJ.
As shown in Table 3, understanding the energy efficiency and energy balance of maize production is crucial for its sustainability and profitability, as increasing energy efficiency translates to an increase in production per unit of energy consumed. Table 3 shows a detailed analysis of the efficiency trajectory and energy balance of the maize crop on Farm B1 between 2019 and 2022. In 2019, energy efficiency was 0.64 MJ, increasing slightly to 0.68 MJ in 2020. This growth may be related to operational adjustments and the impact of the COVID-19 pandemic, which led to the reorganisation of activities. However, in 2021, energy efficiency fell sharply to 0.30 MJ, reflecting the period of generalised disruption to activities due to pandemic restrictions. In 2022, energy efficiency grew again, reaching 0.63 MJ.
The results presented in Table 3 emphasise the need to combine traditional techniques with technological innovations, promoting a resilient and efficient agricultural model that can meet future challenges. It also offers a practical example of how scientific results can be applied to benefit individual agricultural businesses, improving their long-term sustainability and profitability
Table 3 provides an analysis of the energy efficiency trajectory and energy balance of maize cultivation on Farm C between 2019 and 2022, offering valuable insights into the management of energy resources in the agricultural sector. In 2019, the energy balance was negative (−5989.44 MJ), with an energy efficiency of 0.86, indicating less efficient energy production. In 2020, despite the COVID-19 pandemic, the energy balance improved to −2003.88 MJ, and energy efficiency slightly increased to 0.88.
In 2021, a significant advancement was observed: The energy balance turned positive (2923.21 MJ) and energy efficiency rose to 1.09, signifying that energy production exceeded energy consumption. In 2022, although the energy balance declined to 842.26 MJ and energy efficiency dropped to 1.02, both indicators remained positive, demonstrating a consistent improvement in energy efficiency over the analysed period.
Table 3 presents the energy efficiency trajectory and energy balance for soybean cultivation on Farm B2 between 2019 and 2022. In 2019, the energy balance was negative (−8223.48 MJ) with an energy efficiency of 0.87, indicating that the crop consumed more energy than it produced. These results underscore the importance of energy resource optimisation for sustainable agricultural practices. The transition from a negative energy balance in 2019 and 2020 to a positive balance in 2022 demonstrates the farm’s ability to adapt to challenges, such as the pandemic, and refine its practices over time.
Table 3 provides an overview of the energy efficiency and balance of rice cultivation on Farm D from 2019 to 2022, offering practical insights into agricultural energy management. These results demonstrate that adopting efficient practices can significantly reduce energy input without compromising productivity. These insights contribute to broader sustainability goals by promoting energy-conscious agricultural practices that align with environmental preservation. Table 3 presents a detailed analysis of the energy efficiency and balance of rice cultivation on Farm E from 2019 to 2022. In 2019, the energy balance was negative (−1103.47 MJ), indicating that energy consumption exceeded production, with an energy efficiency of 0.99. In 2020, the energy balance turned positive (918.04 MJ), and energy efficiency increased slightly to 1.03. This improvement can be attributed to reduced energy consumption, particularly during the early stages of the COVID-19 pandemic.
In 2021, there was a significant rise in the energy balance, reaching 52,735.21 MJ, and energy efficiency increased to 3.62, indicating optimised resource use during this period. By 2022, the energy balance decreased to 41,648.39 MJ, with energy efficiency dropping to 2.33. Despite this reduction, the energy produced remained considerably higher than the energy used, reflecting a sustained positive balance. The achieved results demonstrate that efficient energy use and resource optimisation can lead to improvements even amidst external challenges such as the pandemic.
Table 3 provides a detailed analysis of the energy efficiency and energy balance in timber production on Farm F between 2019 and 2022. In 2019, the energy balance was −120,519.70 MJ, with an energy efficiency of 0.06. During 2020 and 2021, a significant decline was observed, with the energy balance falling to −97,552.08 MJ and −2590.71 MJ, respectively, accompanied by zero energy efficiency. This downturn may be attributed to the COVID-19 pandemic, which likely disrupted production activities and negatively impacted energy efficiency.
4. Discussion
Continuous monitoring and analysis of energy use can help identify opportunities for long-term optimisation and improvement [22,23,24,25,26]. The impact of the COVID-19 pandemic manifested itself in 2020 and 2021 with drops in energy efficiency due to pandemic restrictions. In 2022, energy efficiency grew again, demonstrating recovery and adaptation to the adverse conditions faced in the previous years [27,28]. These findings highlight the importance of energy efficiency in sustainable resource management in agriculture and emphasise the relevance of adaptive strategies even in the face of challenges such as the COVID-19 pandemic [29,30,31].
Cluster analysis [21] shows that Farms B1 and C are the most similar, which is justified by their similar farm areas and production (quantity). Farm B2 integrates this first group, although not so closely. These companies have subsistence farming activities and sell to local businesses.
As expected, Farm F is the most different of all because it has a large area of forestry and low production. Analysing the history provided by the company’s manager, the justification for the two years without production is that they were installing new eucalyptus plantations.
The intermediate group of farms is made up of A, E, and D, which are the companies that produce the most and sell to a wider market.
While in terms of size and production, companies can be grouped into local and national groups, in terms of energy efficiency, the scenario changes completely. Only two of the farms can operate with positive energy efficiency. Correlation analysis demonstrated a negative relationship between total input energy and the other variables, as presented in Table 4
Table 4.
Correlation matrix for energy analysis.
Achieved results for the maize crop at Farm A (Table 3) suggest that agricultural practices and the use of resources were balanced, allowing the farm to operate efficiently. The increase to 1.41 MJ in 2020 reflects further optimisation, which can be attributed to improvements in resource management or the implementation of techniques that increased productivity without proportionally raising energy costs.
In 2021, however, the drop to 0.94 MJ signals challenges that have negatively affected efficiency. The COVID-19 pandemic, mentioned as a possible factor, may have influenced access to inputs, availability of labour, or logistical operations. This situation highlights the vulnerability of farms to external events and the importance of resilient strategies.
The recovery in 2022, with energy efficiency returning to 1.31 MJ, shows that the farm has adopted effective measures to overcome the problems of 2021. The higher proportion of indirect energy (fertilisers, seeds) in this period, used to improve productivity, reflects the focus on strategies aimed at increasing production even without expanding the cultivated area or significantly increasing labour [31].
The energy balance figures (12,234.29 MJ in 2019; 14,415.59 MJ in 2020; −2080.10 MJ in 2021; and 11,887.04 MJ in 2022) highlight fluctuations arising from both internal and external factors. The sharp drop in 2021 suggests a period of significant operational challenges, while the recovery in 2022 reflects more effective management. Analysing this balance is key to understanding how agricultural practices can be optimised in terms of energy consumption [27,28,29,30,31,32,33].
The results obtained on Farm A can be applied directly to other farms with similar characteristics. Some practical considerations include the following:
Optimising the Use of Inputs: The proportion of indirect energy (fertilisers, seeds) in 2022 suggests that efficient management of these resources can significantly improve productivity. Companies should carefully evaluate the dosage and choice of inputs to maximise efficiency without waste.
Continuous Monitoring: Detailed analysis of efficiency and energy balance over time makes it possible to identify variations and opportunities for improvement. Monitoring tools, such as customised spreadsheets, can help to detect drops in performance.
Planning for Resilience: The challenges of 2021 show the importance of strategies that increase resilience in the face of external factors. Investments in technologies that optimise the use of energy and resources can help farms adapt to adverse conditions.
Regional Application: Maize, being a central crop in several agricultural regions, allows for the replication of these analyses to understand how local characteristics, such as soil type and climate, affect energy performance.
Continuous monitoring and adaptation of farming practices based on these results can contribute to a more efficient and resilient agricultural sector, aligned with the practical needs of producers and global demands for sustainability.
The proportion of indirect energy, such as seeds and fertilisers, as well as nitrogen, phosphorus, and potassium, increased in 2022, possibly due to their greater use to ensure or increase productivity [27,28,29,30,31,32,33]. The use of agricultural equipment remained constant, and there was no increase in the area cultivated, so production and operating hours were maintained. Labour has not changed significantly, which indicates that management practices have remained stable.
The results regarding maize crops on Farm B1 between 2019 and 2022 underline the importance of efficient resource management. During the period analysed, direct energy, represented by petrol, oil, diesel and lubricants, maintained relatively stable consumption. This consistency suggests careful and efficient management of direct raw materials. In addition, the stability in the use of lubricants reflects the reliable operationalisation of activities in the field.
The analysis presented in Table 3 for Farm B1 shows that, despite the adversities faced in 2021, the B1 operation was able to implement effective strategies to recover its energy efficiency in 2022. The negative energy balance recorded over the years (2019: −16,714.08 MJ; 2020: −6996.53 MJ; 2021: −33,898.23 MJ; 2022: −17,099.48 MJ) reflects the challenges faced by farm B1. The higher negative value in 2021 (−33,898.23 MJ) highlights the impact of external factors, such as the pandemic, on agricultural production. On the other hand, the improvement in 2022 shows that, with appropriate measures, it is possible to mitigate the effects of these challenges.
Indirect energy, which comes from inputs such as seeds, fertilisers and pesticides, showed an increase in 2022. This growth can be attributed to the strengthening of agricultural practices, such as intensive fertilisation and crop protection against pests, to compensate for unfavourable climatic conditions. This type of investment reflects a strategic approach that can be applied to other farms with similar characteristics.
In addition, the constant use of labour hours and the regular performance of agricultural equipment indicate efficient management of available resources. Individual companies can benefit from practices such as regular machine maintenance and optimised labour allocation to increase operational efficiency. Some practical solutions for improving the energy balance include the following:
- Precision Farming: Technologies that optimise the use of inputs, reducing waste and maximising productivity.
- Improved Seed Varieties: Seeds that are more resistant to adverse conditions and have higher yields.
- Soil Conservation: Practices that increase water and nutrient retention in the soil, improving fertiliser efficiency.
The results presented for Farm B1 (Table 3) are highly relevant to agricultural sustainability in the region. They show that energy efficiency is a crucial indicator for measuring productive performance and the sustainable use of resources. Despite the negative energy balance recorded during the period, the results highlight the ability of B1 farms to adapt and recover from adverse conditions. The return to higher levels of energy efficiency in 2022 reflects a proactive approach that prioritises the effective management of resources and the implementation of sustainable practices. For individual companies, these data reinforce the importance of continuously monitoring efficiency and energy balance as tools for identifying opportunities for improvement.
The analysis of the energy balance described for maize cultivation on Farm C between 2019 and 2022 (Table 3) underscores significant changes in energy management on Farm C, providing practical insights into monitoring and improving energy use in agriculture. Practically speaking, the evolution of the energy balance reflects progressive adaptation to adverse conditions and points to the potential of more sustainable and efficient agricultural practices. These data are particularly valuable in regions where climatic variability and global crises may impact agricultural production [29,30].
These results offer practical insights for individual agricultural companies. The positive evolution in energy balance and efficiency can be replicated through the adoption of sustainable farming practices, such as efficient input usage and diversification of energy sources. The analysis enables companies to identify critical areas for intervention, minimising costs and maximising energy output [29,30]. These findings for agricultural sustainability demonstrate how energy efficiency can be improved even under adverse circumstances. The continuous improvement in the energy balance on Farm C shows that sustainable resource management is both feasible and essential for agricultural resilience. This analysis provides a foundation for strategies that promote more efficient agriculture with reduced dependence on external energy sources, aligning with global sustainability objectives [29,30].
As previously presented for Farm B2 (Table 3) the energy efficiency trajectory and energy balance for soybean cultivation between 2019 and 2022 suffered particular variations. During 2020, the energy balance dropped significantly to −16,421.68 MJ, and energy efficiency decreased to 0.47. This downturn could be attributed to the impact of the COVID-19 pandemic, which disrupted crop management capacity and agricultural practices more broadly. Restrictions on movement, coupled with reduced availability of labour and raw materials, likely hindered normal farm operations.
However, by 2022, the energy balance had improved to a positive value of 11,974.62 MJ, with energy efficiency increasing to 1.27. This substantial improvement indicates that the energy produced exceeded the energy consumed, reflecting enhanced energy resource optimisation and recovery from pandemic-related disruptions. The dynamics observed in Table 3 underscore the adaptability and resilience of the farm’s management practices [1,8]. These results demonstrate a progression from a negative balance in 2019 and 2020 to a positive outcome by 2022. These changes reflect modifications in agricultural practices, particularly in energy use. In 2022, fuel consumption for direct energy sources, such as petrol and diesel, was notably low, which positively influenced the energy balance.
The use of indirect energy sources, such as seeds, remained consistent over the years. However, the use of nitrogen peaked in 2021 before returning to its initial value in 2022. Similar patterns were observed for phosphorus and potassium, suggesting a strategic adjustment to fertilisation practices. Despite these variations, the use of herbicides and pesticides remained stable, indicating consistent pest and weed control practices.
Additionally, operational stability in the use of agricultural machinery was evident, as the hours of usage for tractors, seed drills, sprayers, and fertiliser spreaders remained unchanged. This stability, combined with an improved energy balance, likely points to enhanced efficiency in machinery use over the period [1,8]. The reduction in energy consumption through the efficient use of direct energy sources and targeted adjustments to fertiliser inputs highlights actionable strategies for improving energy efficiency.
For example, maintaining stable use of herbicides and pesticides, coupled with operational consistency in machinery, can ensure long-term sustainability while optimising resources. Such measures are especially relevant for farms seeking to recover from disruptions, as evidenced by the improvements observed in 2022. These strategies can be tailored to specific regional conditions to enhance energy efficiency and resource management on individual farms [1,8]. A positive energy balance and energy efficiency above 1 in 2022 reflect effective post-pandemic management and a commitment to sustainability. These results are particularly relevant for regions where disruptions to agricultural operations can have significant energy-related implications. By adopting similar practices, farms can enhance their resilience, promote sustainable energy use, and contribute to broader sustainability goals [1,8].
The energy balance trends described for Farm D (Table 3) highlight the dynamic fluctuations in energy productivity over four years of rice cultivation on this farm. In 2019, the energy balance was positive at 77,039.94 MJ, with an energy efficiency of 3.38, indicating that the energy produced significantly exceeded the energy used. By 2020, the energy balance declined to 23,487.02 MJ, and efficiency dropped slightly to 2.81, although both metrics remained positive.
In 2021, the energy balance improved substantially, reaching 81,541.33 MJ, and efficiency rose to 3.93, suggesting a marked recovery in energy productivity. In 2022, a minor decrease in the energy balance was observed, though the metrics continued to reflect positive outcomes, with an energy efficiency close to 3.90, indicating that the energy produced was nearly four times the energy consumed. Table 3 underscores the importance of maintaining sustainable practices to enhance energy efficiency and achieve a favourable balance [12]. Despite variations, the consistently positive balance demonstrates the potential for optimising resource use while minimising environmental impact. These findings are particularly relevant for agricultural regions seeking to improve energy management under varying conditions [12].
For rice cultivation in Farm E, the energy balance trends shown in Table 3 highlight the progressive improvements achieved over the analysed period. Although the balance fluctuated, the results consistently show that optimising energy use leads to substantial gains. This is particularly evident in 2021, where increased efficiency reflects an alignment between sustainable practices and energy productivity. These findings underline the importance of understanding and monitoring energy inputs to ensure sustainable agricultural production [31].
The insights presented for this farm (Table 3) have practical implications for agricultural enterprises. Direct energy inputs (e.g., petrol, diesel, lubricants, and grease) and indirect inputs (e.g., seeds, fertilisers, and agrochemicals) constituted most of the energy consumption during the study period. These findings highlight areas where resource use can be optimised, potentially reducing costs and increasing energy efficiency. Moreover, adopting strategies such as precision agriculture and optimised input application can help other farms replicate the positive energy balance observed on Farm E [31]. These results underscore the critical role of energy management in sustainable agricultural practices. Despite challenges posed by the COVID-19 pandemic, rice cultivation on Farm E demonstrated a positive trend towards more efficient energy use. The analysis reveals that adopting energy-conscious practices can not only enhance production efficiency but also contribute to long-term sustainability in agriculture. It also provides valuable insights for policymakers and practitioners seeking to implement sustainable farming strategies [31].
Regarding forestry management and timber production, the previously presented results for Farm F (Table 3) highlight the need for better management strategies to address the ongoing challenges and enhance energy efficiency in timber production [12,18].
In 2022, there were signs of recovery, as the energy balance improved slightly to −129,355.24 MJ, and energy efficiency increased to 0.02. These findings suggest a partial recuperation in timber production; however, energy efficiency remains below the level observed in 2019.
The energy balance trends described for Farm F (Table 3) indicate the considerable impact of the COVID-19 pandemic on timber production operations. The sharp decline in direct energy usage, particularly diesel consumption, during 2020 and 2021 underscores how external disruptions can affect energy-intensive agricultural activities. Although some recovery occurred in 2022, the results suggest that further improvements in energy management are needed to achieve sustainable production [9,32,33,34].
The data presented in Table 3 regarding Farm F highlights practical applications for timber production enterprises. Direct energy inputs, such as diesel, demonstrated significant variability during the study period, emphasising the importance of efficient energy use. While indirect energy inputs, including fertilisers and agrochemicals, showed minimal changes, the consistent contribution of labour and agricultural equipment suggests areas where optimisation could yield better energy efficiency. Companies should consider adopting innovative strategies, such as renewable energy integration and improved operational planning, to enhance overall efficiency [9,32,33,34].
5. Conclusions
This study stands out as an important milestone in the understanding of energy sustainability within the Angolan agroforestry context, as it offers an in-depth view of the energy balance and energy efficiency of the country’s predominant crops.
The main result obtained shows that the farms have very different production rates (ton/ha) between themselves and between production years. The calculation of the energy balance and energy efficiency is intrinsically dependent on the energy invested in the production factors and the energy that represents production. The weight of production factors (fertilisers, machinery, labour) is relatively higher for low production than for medium to high production. Thus, the increase in production and the improvement in yield (ton/ha) lead to increases in energy efficiency. If companies do not produce large quantities, they are always working at the limit of positive performance.
Only Farm D, a large-scale rice producer, can operate above energy efficiency levels suitable for a profitable activity. Despite these good results and the good performance of Farm E in 2021 and 2022, in general terms, these farms are performing above expectations for the level of production they present.
Rice, maize, soya, and timber production have different energy balances and energy efficiencies. The results presented in this study have the potential to contribute to the formulation of new management policies and strategies, orienting them towards sustainability. By providing avenues for future optimisation, this research not only contributes to enriching the body of academic knowledge but also serves as a valuable resource for stakeholders in defining more sustainable and efficient practices in Angola’s agroforestry farms.
The results show that knowledge of energy efficiency and energy balance is not only an analytical tool but also a basis for strategic decisions. Increased energy efficiency directly equates to greater production per unit of energy consumed, which in turn boosts the profitability and sustainability of farms. Individual companies can apply these lessons to optimise practices, minimise costs, and improve long-term sustainability.
The achieved results underline the challenges of maintaining energy efficiency in timber production, particularly during periods of external disruption like the COVID-19 pandemic. Despite signs of recovery in 2022, the results point to the necessity of implementing sustainable energy management strategies to mitigate the impact of such events. Future research could explore the inclusion of by-products and waste into energy efficiency models, as well as expand analyses to different crops and regions. Developing predictive models based on diverse management and climatic scenarios would also provide valuable insights for achieving long-term sustainability in timber production [9,32].
By focusing on optimising direct energy sources (e.g., diesel, lubricants) and indirect inputs (e.g., fertilisers, pesticides), companies can achieve similar positive energy balances. These results underline the necessity of resource-efficient strategies and the integration of advanced technologies to maximise productivity while reducing costs [12].
Author Contributions
Conceptualisation, O.S., M.R.L. and J.A.; Methodology, O.S., F.S., M.R.L. and J.A.; Formal analysis, L.S.; Investigation, O.S., F.S., M.R.L. and J.A.; Writing—original draft, L.S. and M.R.L.; Supervision, F.S. and J.A.; Project administration, J.A.; Funding acquisition, J.A. All authors have read and agreed to the published version of the manuscript.
Funding
This work is supported by National Funds by FCT—Portuguese Foundation for Science and Technology, under the projects UID/04033: Centro de Investigação e de Tecnologias Agro-Ambientais e Biológicas and LA/P/0126/2020, (https://doi.org/10.54499/LA/P/0126/2020), and under the scope of the projects UIDB/04011/2020 (https://doi.org/10.54499/UIDB/04011/2020), UIDB/05183/2020 (https://doi.org/10.54499/UIDB/05183/2020; https://doi.org/10.54499/LA/P/0121/2020). Additional acknowledgements to FCT—Portuguese Foundation for Science and Technology, under research contract PRT/BD/152094/2021 to Oloiva Maria Tavira da Silva e Sousa.
Data Availability Statement
According to the General Regulation on Data Protection (GRDP), regulated by Law 59/2019, all the farms’ data treated within the scope of this paper are confidential. General data about Africa and Angola could be accessed at: https://diva-gis.org; https://openlayers.org.
Acknowledgments
The authors would like to acknowledge the Angola farm owners and managers who made available private information that allowed us to conduct this research.
Conflicts of Interest
The authors declare no conflicts of interest.
References
- Zahedi, M.; Mondani, F.; Eshghizadeh, H.R. Analysing the energy balances of double-cropped cereals in an arid region. Energy Rep. 2015, 1, 43–49. [Google Scholar] [CrossRef]
- Campos, A.T.; Campos, A.T. Agricultural energy balances: An important tool to indicate the sustainability of agroecosystems. Ciênc. Rural 2004, 3, 1977–1985. [Google Scholar] [CrossRef]
- Castro, A.P.; Fraxe, T.J.; Santiago, J.L.; Matos, R.B.; Pinto, I.C. The agroforestry systems as an alternative of sustainable land use in várzea (floodplain) ecosystems in Amazon State. Acta Amaz. 2009, 39, 279–288. [Google Scholar] [CrossRef]
- Salla, D.A.; Furlaneto, F.P.; Cabello, C.; Kanthack, R.A. Energy study of biofuel production from maize. Ciênc. Rural 2010, 40, 1977–1985. [Google Scholar] [CrossRef]
- Azevedo, J.C. Forests Environment and Sustainability: An Approach Centred on Ecosystem Services in the Forests of the Bragança District; Academy of Sciences: Lisbon, Portugal, 2012. [Google Scholar]
- Feil, A.A.; Schreiber, D. Sustainability and sustainable development: Unravelling the overlaps and scope of their meanings. Cad. EBAPE 2017, 14, 667–681. [Google Scholar] [CrossRef]
- Ulbanere, R.C.; Ferreira, W.A. Analysis of the energy balance for maize production in the State of São Paulo. Eng. Agríc. 1989, 4, 35–42. [Google Scholar]
- Bharda, D.A.; Dixit, R. Utilisation of conventional and non-conventional energy sources. Int. J. Res. Appl. Sci. Eng. Technol. 2023, 11, 205–208. [Google Scholar] [CrossRef]
- Kulyk, M.; Kalynychenko, O.; Pryshliak, N.; Pryshliak, V. Efficiency of using biomass from energy crops for sustainable bioenergy development. J. Environ. Manag. Tour. 2020, 11, 1133–1147. [Google Scholar] [CrossRef]
- Demircan, V.; Ekinci, K.; Keener, H.M.; Akbolat, D.; Ekinci, C. Energy and economic analysis of sweet cherry production in Turkey: A case study. Energy Conv. Manag. 2006, 47, 1761–1769. [Google Scholar] [CrossRef]
- Lasaksi, N.; Putri, V.K.; Alaydrus, A.Z. Analisis bibliometrik pemanfaatan energi terbarukan dalam proses produksi pangan. J. Multidisiplin West Sci. 2023, 2, 819–832. [Google Scholar] [CrossRef]
- Oliveira, E.D.; Seixas, F., Jr. Energy analysis of two mechanised eucalyptus harvesting systems. Sci. For. 2006, 70, 49–57. [Google Scholar]
- Winardi, B.; Ajulian, A. Quantifying the impact of renewable energy research on environmental sustainability. West Sci. Interdiscip. Stud. 2023, 1, 551–563. [Google Scholar] [CrossRef]
- Benedek, A.; Rokicki, T.; Szeberényi, A. Bibliometric evaluation of energy efficiency in agriculture. Energies 2023, 16, 5942. [Google Scholar] [CrossRef]
- Alves, J.L.; Chagas, M.J.; Faria, E.O.; Caldeira-Pires, A.A. Circular economy and renewable energies: A bibliometric analysis of international literature. Interactions 2022, 23, 267–283. [Google Scholar] [CrossRef]
- Dipti, P. Bioenergy crops and alternate energy. Int. J. Environ. Eng. Manag. 2013, 4, 265–272. [Google Scholar]
- Yadav, P.; Priyanka, P.; Kumar, D.; Yadav, A.; Yadav, K. Bioenergy Crops: Recent Advances and Future Outlook. In Prospects Of Renewable Bioprocessing in Future Energy Systems; Rastegari, A., Yadav, A., Gupta, A., Eds.; Springer: Cham, Switzerland, 2019; Chapter 12; pp. 315–335. [Google Scholar]
- Ziero, H.D.; Berni, M.D.; Buller, L.S.; Vasconcelos, L.G.; Dorileo, I.L.; Mudhoo, A.; Forster-Carneiro, T. Foresight for corn-to-ethanol mills in the Southern Brazilian Amazon: Energy economic and environmental analysis. J. Environ. Chem. Eng. 2021, 9, 106740. [Google Scholar] [CrossRef]
- Sevgi, E.; Figen, A.Z. Determination of Renewable Energy Growth Using Cluster Analysis and Multi-Criteria Decision-Making Methods. Appl. Sci. 2025, 15, 1575. [Google Scholar] [CrossRef]
- Akyol, M. The effect of energy consumption on agricultural added value: Panel data analysis for transition economies and EU member. Anemon J. Soc. Sci. Mus Alparslan Univ. 2020, 8, 59–64. [Google Scholar]
- Horvath, T.; Nyéki, A.; Neményi, M. The energy balance of maize production: Alternative approaches. Acta Agrar. Debreceniensis 2018, 74, 59–63. [Google Scholar] [CrossRef]
- Geletukha, G.; Haidai, O. Energy and ecological analysis of the life cycle of energy use of maize crop residues. Thermophys. Therm. Power Eng. 2021, 43, 51–58. [Google Scholar] [CrossRef]
- Guareschi, R.F.; Silva, E.P.; Urquiaga, S.; Alves, B.; Boddey, R.; Sarkis, L.; Jantalia, C. Energy efficiency in maize crops in different regions of Brazil. Semin. Ciênc. Agrár. 2021, 42, 2271–2283. [Google Scholar] [CrossRef]
- Sami, M.; Shiekhdavoodi, M.J.; Almassi, M. Analysis of energy and greenhouse gas balance as indexes for environmental assessment of wheat and maize farming: A case study. Acta Agric. Slov. 2014, 103, 191–201. [Google Scholar] [CrossRef]
- Missing, D. OECD-FAO Agricultural Outlook 2020–2029; OECD Publishing: Paris, France, 2020. [Google Scholar] [CrossRef]
- Baharudin, S.A. Understanding energy efficiency using a socioeconomic framework: The case of paddy farming in Malaysia. Geography Malays. J. Soc. Space 2021, 17, 53–67. [Google Scholar] [CrossRef]
- Stephens, E.C.; Martin, G.; van Wijk, M.V.; Timsina, J.; Snow, V. Editorial: Impacts of COVID-19 on agricultural and food systems worldwide and on progress to the sustainable development goals. Agric. Syst. 2020, 183, 102873. [Google Scholar] [CrossRef]
- Zhang, W.; Qian, C.; Carlson, K.M.; Ge, X.; Wang, X.; Chen, X. Increasing farm size to improve energy use efficiency and sustainability in maize production. Food Energy Secur. 2021, 10, e271. [Google Scholar] [CrossRef]
- Farine, D.; O’Connell, D.; Grant, T.; Poole, M.L. Opportunities for energy efficiency and biofuel production in Australian wheat farming systems. Biofuels 2010, 1, 747–760. [Google Scholar] [CrossRef]
- Meyer-Aurich, A.; Balafoutis, A.; Daalgard, T.; Visser, C.D.; Gołaszewski, J.; Mikkola, H.; Silva, L. Energy efficiency in agriculture—Opportunities, constraints and research needs. In Proceedings of the First International Symposium on Agricultural Engineering—ISAE, Zemun, Serbia, 4–6 October 2013; Volume 7, pp. 19–25. Available online: https://www.researchgate.net/publication/303766825_Energy_Efficiency_in_Agriculture_-_Opportunities_Constrains_and_Research_Needs (accessed on 1 May 2025).
- Zhu, J.; Zhao, Y.; Xie, Q.; Zhang, Y. Study on agricultural energy efficiency measurement and rebound effect based on DEA model. In Proceedings of the International Conference on Electronic Information Engineering Big Data and Computer Technology, Sanya, China, 20–22 January 2022. [Google Scholar] [CrossRef]
- Dekkers, W.; Lange, J.M.; Wit, C. Energy production and use in Dutch agriculture. Neth. J. Agri. Sci. 1974, 22, 100–112. [Google Scholar] [CrossRef]
- Ziaabadi, M.; Mehrjerdi, M.Z. Factors affecting energy consumption in the agricultural sector of Iran: The application of ARDL-FUZZY. Int. J. Agric. Manag. Dev. 2019, 9, 293–305. [Google Scholar]
- Semerci, A.; Baran, M.F.; Cobanoglu, F.; Celik, A.D. Determination of energy use efficiency of cotton production in Turkey: A case study from Hatay Province. Fresenius Environ. Bull. 2019, 28, 1829–1835. [Google Scholar]
Disclaimer/Publisher’s Note: The statements, opinions and data contained in all publications are solely those of the individual author(s) and contributor(s) and not of MDPI and/or the editor(s). MDPI and/or the editor(s) disclaim responsibility for any injury to people or property resulting from any ideas, methods, instructions or products referred to in the content. |
© 2025 by the authors. Licensee MDPI, Basel, Switzerland. This article is an open access article distributed under the terms and conditions of the Creative Commons Attribution (CC BY) license (https://creativecommons.org/licenses/by/4.0/).