Article

OsVPS16 Deficiency Enhances Salinity Tolerance in Rice by Regulating Ion Homeostasis, Antioxidant Activity, and Stress-Responsive Gene Expression

1
Xinyang Key Laboratory of Rice Genetic Improvement, Ecology and Physiology, Xinyang High Quality Rice Research and Development Center, Xinyang Agriculture and Forestry University, Xinyang 464000, China
2
Xinyang Academy of Agricultural Sciences, Xinyang 464000, China
*
Author to whom correspondence should be addressed.
Agronomy 2025, 15(5), 1146; https://doi.org/10.3390/agronomy15051146
Submission received: 27 March 2025 / Revised: 27 April 2025 / Accepted: 6 May 2025 / Published: 7 May 2025
(This article belongs to the Section Plant-Crop Biology and Biochemistry)

Abstract

:
Soil salinization has emerged as a significant global threat to agricultural productivity. Rice is susceptible to salinity stress at the seedling stage. However, the mechanisms underlying rice responses to salinity stress remain incompletely characterized. In this study, we have characterized a transfer DNA (T-DNA) insertion mutant line of rice, designated OsVPS16 (Os12g0594200), to elucidate its functional role in salt stress tolerance. A real-time quantitative PCR (RT-qPCR) analysis revealed that salt stress inhibited the expression of OsVPS16, with the vps16 mutant showing negligible expression levels. A phenotypic analysis showed that the loss of OsVPS16 enhanced primary root elongation, and increased the survival rate to improve salt stress tolerance. Compared to the wild type (DJ), the vps16 mutant accumulated less Na+ and more K+ in the shoots under salt stress. Furthermore, the vps16 mutant displayed decreased malondialdehyde (MDA) accumulation and enhanced the activities of superoxide dismutase (SOD) and peroxidase (POD) under salt stress. Transcriptomic profiling identified 1236 differentially expressed genes (DEGs) between vps16 and DJ roots under salt stress. A functional enrichment analysis revealed that DEGs were enriched in protein serine/threonine kinase activity, Ca2+ signal pathways, and the MAPK signaling pathway. Notably, the up-regulation of critical protein kinases (PKs) and transcription factors (TFs), including OsSRK1, OsCDPK21, and OsNAC45, probably adds to the effect of OsVPS16 mutation to account for salt stress tolerance. Collectively, comprehensive physiological and molecular analyses demonstrated that the loss of OsVPS16 improves rice salt tolerance through multiple mechanisms, including the regulation of K+/Na+ homeostasis, the modulation of antioxidant enzyme activities, and the transcriptional reprogramming of stress-responsive genes. This study not only elucidates the function of a novel salt stress response gene in rice, but also provides valuable genetic resources for developing salt-tolerant rice cultivars through molecular breeding approaches.

1. Introduction

Soil salinity is now a major problem for agricultural production all over the world, stunting crop development and reducing crop productivity [1,2]. Currently, more than 20% of the world’s agricultural land is affected by soil salinization, and this proportion is expected to rise in the future due to global climate change and groundwater irrigation [3,4,5]. Consequently, the development of salt-tolerant crop cultivars has become a critical strategy for the sustainable utilization of saline–alkaline lands, with the potential to enhance crop production and ensure global food security [6,7].
Rice (Oryza sativa L.), as one of the most important staple food crop, feeds more than 50% of the global population. And Asian countries account for more than 90% of the worldwide rice production according to the FAO data [8]. Rice is susceptible to salinity stress during the growth period, especially at the seedling and reproductive stage [9]. Salt stress adversely affects the growth and development of rice, reduces the capacity of roots to absorb water and nutrients, disrupts ion homeostasis, and induces oxidative stress in rice plants [10,11,12]. To improve salt tolerance and the productivity of crops exposed to salt stress, rice has evolved various adaptive mechanisms, which are regulated by multiple genes and signaling pathways [13,14,15]. Therefore, it is an urgent and great challenge to explore salt-tolerant genes and further reveal the regulatory mechanisms of salt tolerance in rice.
To date, numerous quantitative trait locus (QTLs) and candidate genes associated with salt tolerance have been identified and functionally characterized [16,17,18]. RST1, HST1, and SKC1 (HKT1;5) have been cloned using map-based strategies [19,20,21]. SKC1 encodes a high-affinity K+ transporter, and mediates Na+ influx in the parenchyma cells of roots to regulate K+/Na+ under salt stress [19,22]. OsHKT1;4 has been shown to enhance Na+ exclusion from leaves and stems, while increasing Na+ toxicity in roots under saline conditions [23]. OsSOS1, a plasma membrane Na+/H+ exchanger gene, facilitates Na+ extrusion through roots and confers salinity tolerance [24]. Additionally, the Shaker-type K+ channel OsAKT2 regulates K+ recirculation from shoots to roots to maintain Na+/K+ homeostasis under salt stress [25]. OsLPR5, encoding a ferroxidase, positively regulates salt stress tolerance in rice by decreasing the Na+ level and Na+/K+ ratio [26]. Calcium-dependent protein kinases OsCPK5 and OsCPK13, enhance salt tolerance by phosphorylating and activating mitogen-activated protein kinases (MAPKs/MPKs) OsMPK3/6 [27]. Transcription factors OsNAC3 and OsNAC45, have also been reported to positively regulate salt tolerance [28,29]. Conversely, OsCRN, acts as a negative regulator, with T-DNA insertion mutations in its ortholog AtCRN improving salt tolerance [30]. OsTSD2, a pectin methyltransferase, can be induced by salt, and the T-DNA insertion rice mutant (sstm1) exhibits increased Na+ accumulation and reduced K+ levels in shoots, leading to decreased salt tolerance [31]. Collectively, rice functional genomics, including reverse and forward genetics methods, have become an important research approach to identify novel genes for salt stress response and tolerance. These genes can become new targets for genetic engineering to improve salt stress tolerance in rice.
The endosomal sorting complex required for transport (ESCRT) machinery consists of four sequentially acting multiprotein complexes, namely ESCRT-I, -II, -III, and VPS4/SKD1 (vacuolar protein sorting 4/suppressor of K+ transport growth defect1), which play essential roles in plant development and stress response [32]. Emerging evidence highlights ESCRT’s involvement in vacuolar trafficking and stress-responsive membrane remodeling: Arabidopsis VPS41 regulates vacuolar transport and vegetative growth [33], AtVPS25 modulates auxin-mediated primary root development [34], and VPS36-dependent plasma membrane protein turnover governs root gravitropism [35]. Critically, salt stress activates ESCRT assembly to promote endocytosis and degradation of plasma membrane transporters [36], with ESCRT-I subunit VPS23A enhancing salt tolerance via reinforcement of the Salt Overly Sensitive (SOS) pathway [37]. Despite these advances, ESCRT subunit VPS-mediated salt adaptation mechanisms in crops remain poorly understood.
In this study, we have characterized a unique T-DNA insertion mutant line of rice, designated OsVPS16, which encodes a predicted vacuolar protein sorting-associated protein based on a RiceFREND analysis (http://ricefrend.dna.affrc.go.jp/ (accessed on 13 September 2023)) [38]. However, the mechanisms underlying OsVPS16-mediated salt stress response remain elusive. To address this, we conducted comprehensive phenotypic, physiological, and transcriptomic analyses of the vps16 mutant under the control and salt stress conditions.

2. Materials and Methods

2.1. Plant Materials and Growth Conditions

The OsVPS16 (Os12g0594200) T-DNA knockout rice mutant vps16 (PFG_4A-00132.R) in the Dongjin (DJ, Japonica) background was obtained from the Rice Functional Genomics Express Database (RiceGE, http://signal.salk.edu/cgi-bin/RiceGE (accessed on 10 May 2021)). The vps16 mutant was identified using Tri-Primer-PCR using the T-DNA primers and gene-specific primers (Supplementary Table S1).
Rice seeds were surface-sterilized by 10% H2O2 and soaked in distilled water at 28 °C for 48 h to promote germination. Germinated seeds were transferred to bottomless 96-well plates and floated on distilled water for 5 days. Seedlings were then acclimated to Yoshida nutrient solution, gradually increasing from one-quarter to full strength over 6 days, followed by continuous cultivation in full-strength nutrient solution. Unless otherwise specified, plants were grown in a controlled growth chamber maintained at 28 °C/25 °C (day/night) with a 14 h light/10 h dark photoperiod and 70% relative humidity.

2.2. Analysis of Root Morphology

The longest root length was measured using a ruler. Grayscale images (4800 DPI) of the entire root system were captured using an Epson Perfection V850 Pro scanner (Epson, Suwa, Japan). Root morphological parameters, including total root length, total root surface area, average root diameter, and total root volume, were quantified using WinRHIZO root analysis software (v2020a, Regent Instruments Inc., Quebec City, QC, Canada).

2.3. Determination of Tissue Ion Content

Five-leaf seedlings of the DJ and vps16 mutant were exposed to 150 mmol·L−1 NaCl for 10 days. After the treatment, the seedling survival rate was analyzed. For an ion content analysis, three-leaf-stage seedlings were treated with 150 mmol·L−1 NaCl for 5 days. Roots and shoots were harvested, dried at 70 °C, and ground into a fine powder. The powdered samples were digested with 98% H2SO4–30% H2O2. The digested solution was diluted with deionized water. The Na+ and K+ contents were determined by a flame photometer (FP6410, Shanghai Precision Scientific Instrument Co. Ltd., Shanghai, China), as previously described [39].

2.4. Measurement of the Antioxidant Enzyme Activity and Malondialdehyde Content

Three-leaf-stage seedlings of the DJ and vps16 mutant were exposed to 150 mmol·L−1 NaCl for 5 days. Fresh root samples were collected, flash-frozen in liquid nitrogen, and stored at −80 °C for subsequent analysis. Malondialdehyde (MDA) content, superoxide dismutase (SOD) activity, and peroxidase (POD) enzyme activity were measured as described elsewhere [40]. Approximately 0.1 g of frozen roots was homogenized with ice-cold extraction buffer (50 mmol·L−1 potassium phosphate buffer, pH 7.8). The homogenate was transferred and centrifuged at 10,000× g for 10 min at 4 °C. The supernatant was used for the following enzyme assays. The MDA content was determined using the thiobarbituric acid method. The SOD and POD activities were estimated using the guaiacol method and the nitro blue tetrazolium method, respectively.

2.5. RNA Sequencing Analysis

Three-leaf-stage seedlings were transferred to the nutrient solution containing 0 or 150 mmol·L−1 NaCl for 48 h. Root tissues of the DJ and vps16 mutant were harvested, immediately frozen in liquid nitrogen, and stored at −80 °C for RNA extraction. Roots from three seedlings were pooled to form one biological replicate, with three biological replicates prepared for an RNA sequencing (RNA-seq) analysis. Total RNA was extracted using TRIzol reagent (Sangon Biotech, Shanghai, China). RNA-seq libraries were constructed and sequenced on an Illumina Novaseq 6000 platform (Biomarker Technologies, Beijing, China). Clean reads were mapped to the rice genome (Rap-DB) using HISAT2 (v2.0.4) [41]. A differential expression analysis was performed using DESeq2 (v1.30.1) [42], with differentially expressed genes (DEGs) identified based on |log2(fold change)| ≥ 1, and a false discovery rate (FDR) ≤ 0.05. A gene ontology (GO) enrichment analysis of DEGs was conducted using topGO (v2.48.0) [43], with significance determined by the corrected p-value (q-value). A Kyoto Encyclopedia of Genes and Genomes (KEGG) pathway enrichment analysis was performed to identify biological functions and metabolic pathways associated with DEGs [44].

2.6. Real-Time Quantitative Polymerase Chain Reaction (RT-qPCR) Analysis

Total RNA was extracted using TRIzol reagent (Sangon Biotech, China) and reverse-transcribed into the first-strand cDNA with a MightyScript Plus First Strand cDNA Synthesis Master Mix (Sangon Biotech, China). A RT-qPCR analysis was performed with SGExcel FastSYBR Mixture (with ROX) (Sangon Biotech, China) on an ABI 7500 Real-Time PCR System (Thermo Fisher, Singapore). The reaction program involved pre-incubation at 95 °C for 5 min, followed by 40 cycles of denaturation at 95 °C for 15 s, annealing at 60 °C for 15 s, and extension at 72 °C for 32 s. Primer sequences for the internal control gene (β-actin) and target genes are listed in Supplementary Tables S1 and S2. Relative gene expression levels were calculated using the 2−ΔΔCT method [45].

2.7. Statistical Analysis

All data were analyzed by an analysis of variance (ANOVA) using SPSS 21.0 software (SPSS, Inc., Chicago, IL, USA), followed by Tukey’s HSD test to evaluate significant differences (p < 0.05 and p < 0.01) in measured parameters between the wild-type and mutant lines. At least three independent biological replicates were used for each measurement. All values were reported as the mean ± SE (standard error). Graphs were generated using Sigma plot software (12.5, Systat Software Inc., San Jose, CA, USA).

3. Results

In our previous investigation, we systematically screened a collection of mutant per-formed stress tolerance screening on these mutants. Through a comprehensive phenotypic characterization, we demonstrated that OsVPS16 is a potential regulator of salt stress responses. Building upon these findings, the current study conducts a comprehensive functional characterization of OsVPS16 to elucidate its underlying mechanisms in salt stress tolerance in rice.

3.1. Bioinformatics Analysis of OsVPS16

A bioinformatic analysis of the OsVPS16 gene was carried out using a publicly available biological database. The OsVPS16 gene is located on chromosome 12 of the rice genome. It features an open reading frame (ORF) of 3189 bp, encoding a protein of 1062 amino acid residues. The predicted protein has a molecular weight of 11.97 kDa and an isoelectric point (pI) of approximately 6.14. To infer its potential functions, the relationship between the OsVPS16 protein and its homologous proteins in Arabidopsis was analyzed. The protein sequence of OsVPS16 was obtained from the rice database RAP-DB (https://rapdb.dna.affrc.go.jp/ (accessed on 11 January 2024)) and subjected to a BLAST (v2.9.0) analysis against the Arabidopsis database TAIR (https://www.arabidopsis.org/ (accessed on 1 February 2024)). The analysis revealed that OsVPS16 has only one homologous protein, AT3G0380 in Arabidopsis (Supplementary Figure S1A,B). Among its transcript variants, AT3G0380.2 exhibited the highest homology to OsVPS16, with an E-value of 9e-26 (Supplementary Figure S1C). In the TAIR database, AT3G0380 is annotated as a vacuolar protein sorting-associated protein (Supplementary Figure S1D), but its molecular function remains uncharacterized.
To investigate the regulatory elements within the promoter region, the 2000 bp nucleotide sequence upstream of the OsVPS16 ORF initiation site was analyzed using the PlantCare online promoter analysis tool [46]. The analysis identified multiple cis-acting elements, including 27 CAAT-boxes (common cis-acting elements in promoter and enhancer regions), 19 TATA-boxes, 4 ABREs (ABA-responsive elements), 3 EREs (ethylene-responsive elements), 5 STREs (stress response elements), 6 MYC elements, 2 MYB elements, and 2 TGACG motifs (Supplementary Figure S2).

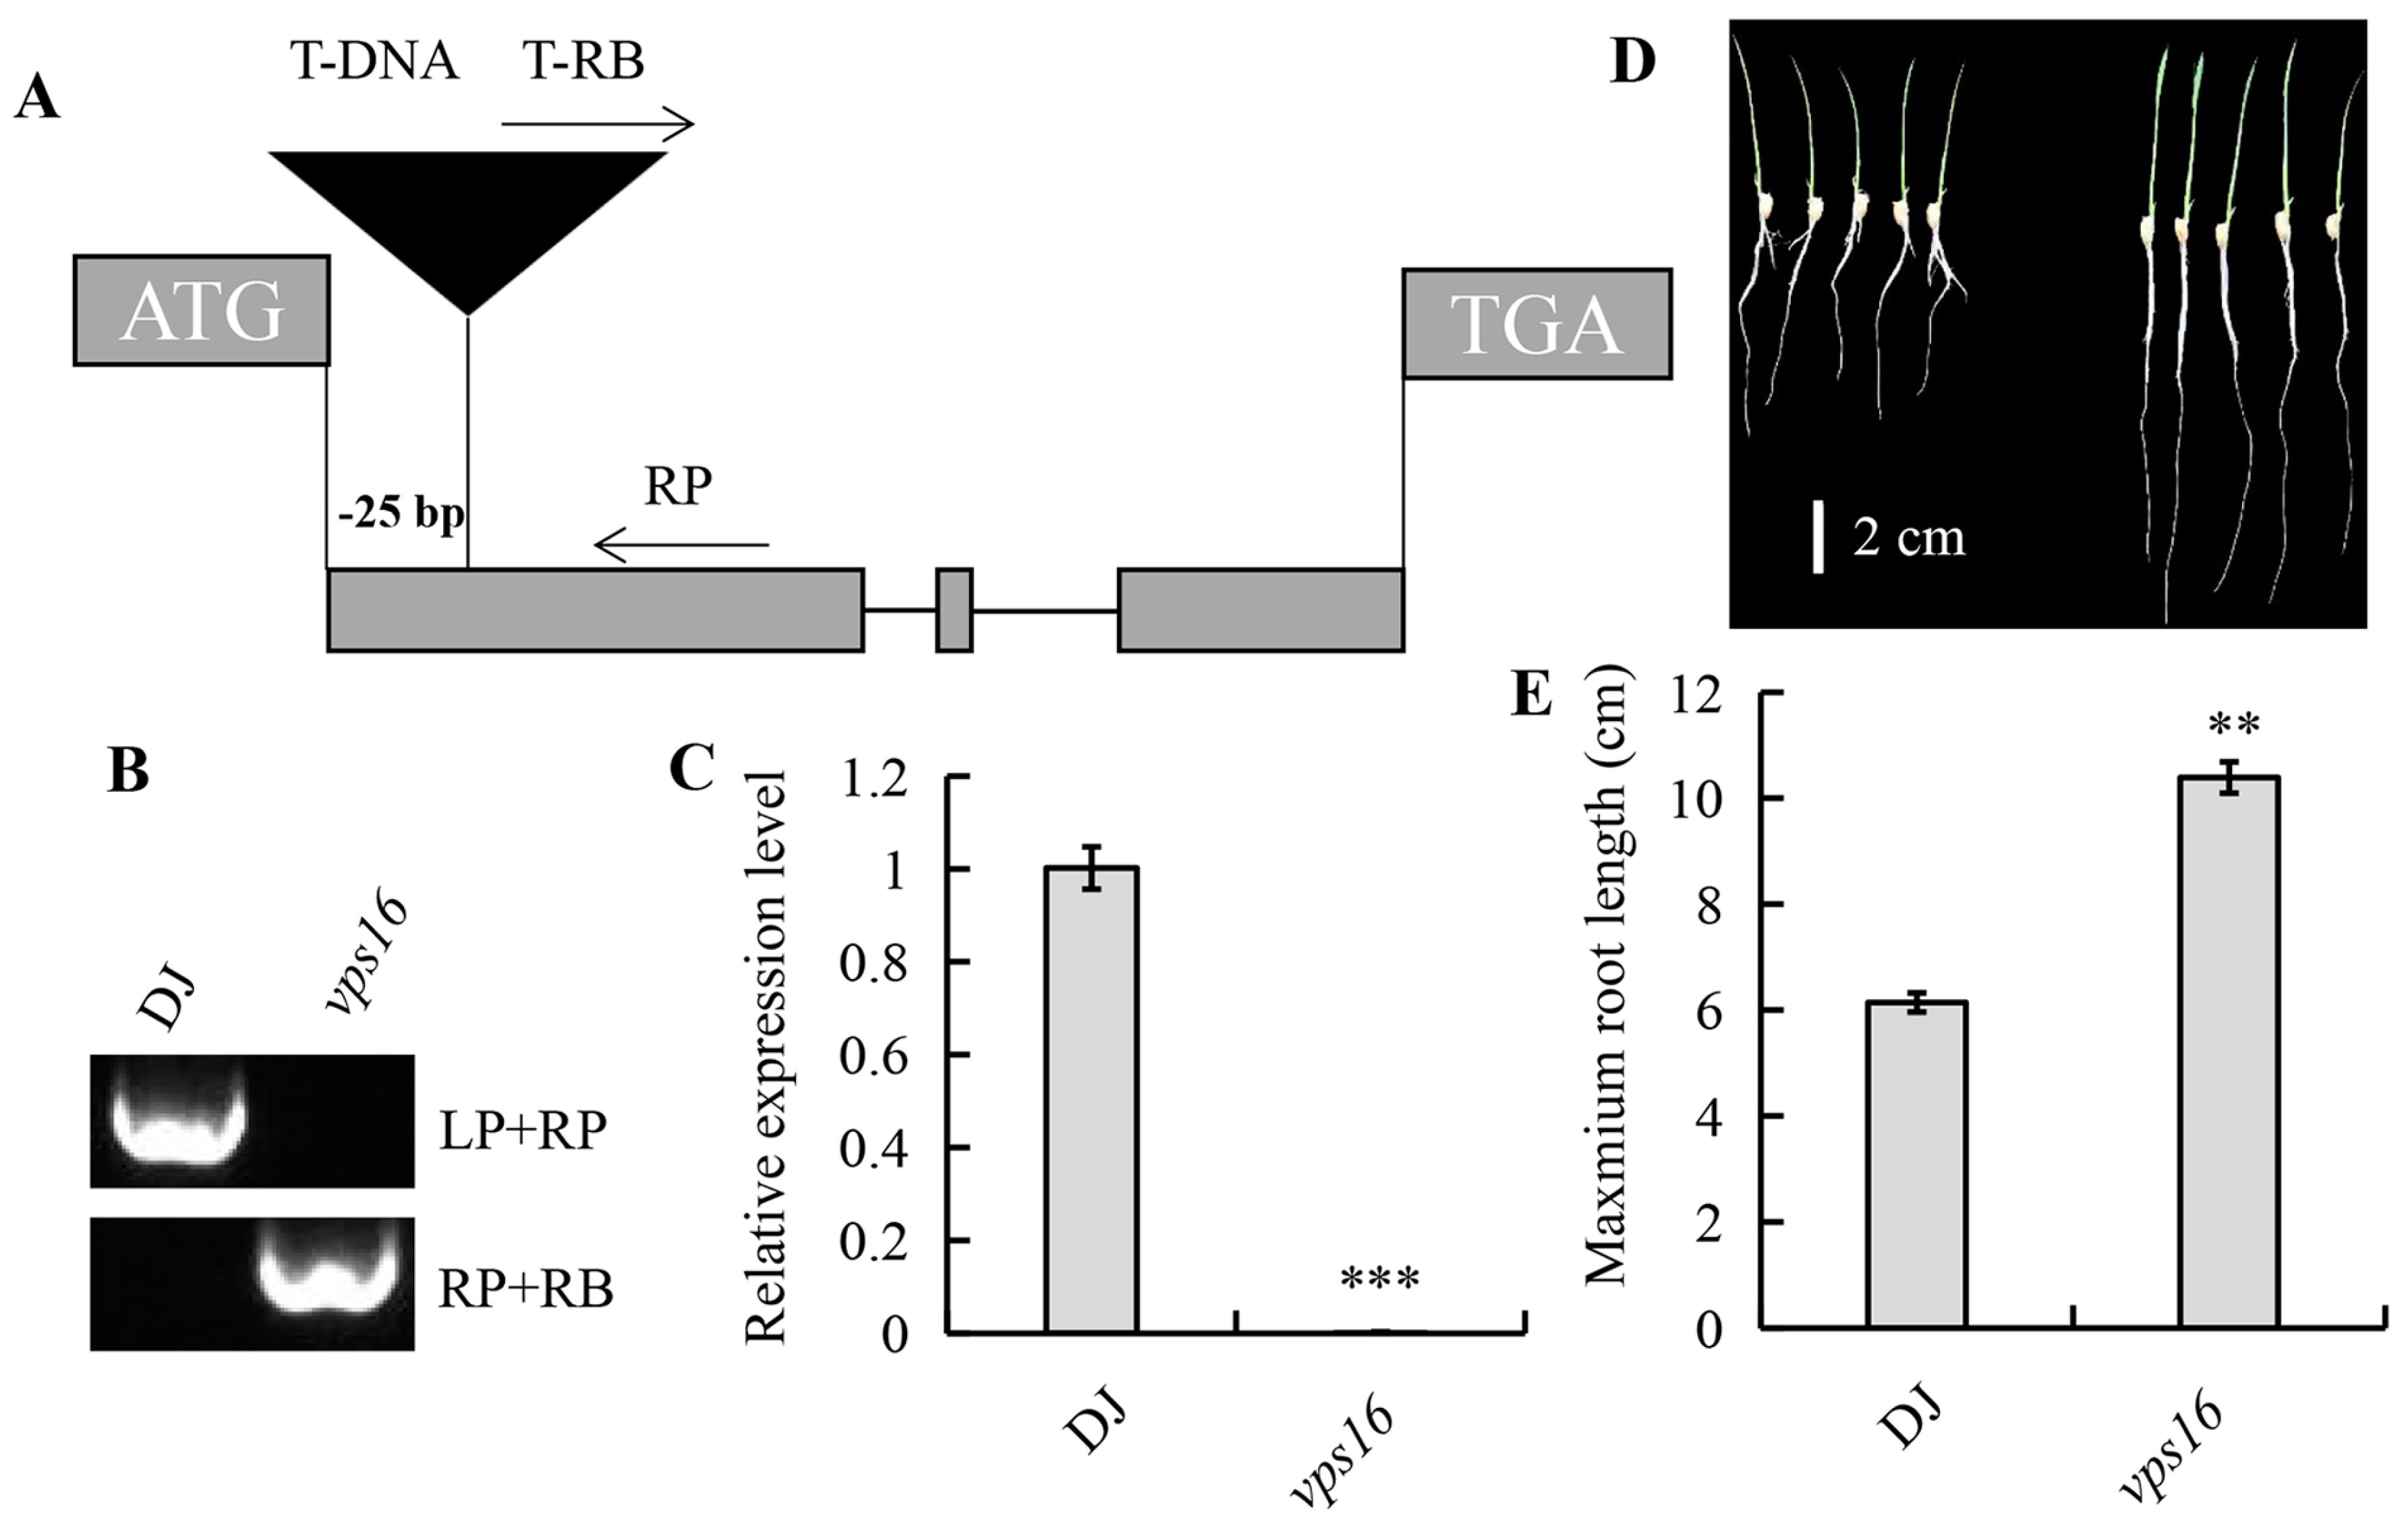
3.2. Expression and Transcriptional Activation Analysis of OsVPS16

The expression of OsVPS16 was examined in various tissues, including root, stem, leaf, leaf sheath, glume, flower, and grain, using RT-qPCR. The results revealed that OsVPS16 expression was highest in leaves and lowest in roots during the seedling and tillering stages (Figure 1A). At the filling stage, OsVPS16 expression remained highest in the leaves and lowest in flowers. To explore the role of OsVPS16 in salt stress response, its expression was analyzed in rice roots following salt (NaCl) treatment over a time gradient. The expression of OsVPS16 decreased under salt stress, reaching its lowest level at 8 h post-treatment (Figure 1B). And after 8 h of salt treatment, the expression of OsVPS16 was down-regulated to 2.26-fold compared to the untreated control.

3.3. Loss of OsVPS16 Increases Primary Root Length

To elucidate the function of OsVPS16, we characterized the vps16 mutant, which harbors a T-DNA insertion in the first exon region of OsVPS16, at 25 bp downstream of ATG (Figure 2A). Since the T-DNA was inserted near the RB end, without a promoter, it did not induce transcriptional activation near the insertion site. The homozygous loss-of-function mutant was confirmed at both the DNA and RNA levels (Figure 2B,C). OsVPS16 expression in the vps16 mutant was nearly undetectable compared to the wild-type DJ (Figure 2C). A phenotypic analysis revealed that the vps16 mutant exhibited significantly longer primary roots than DJ plants, with the primary root length 1.69 times greater in the vps16 mutant (Figure 2D,E).

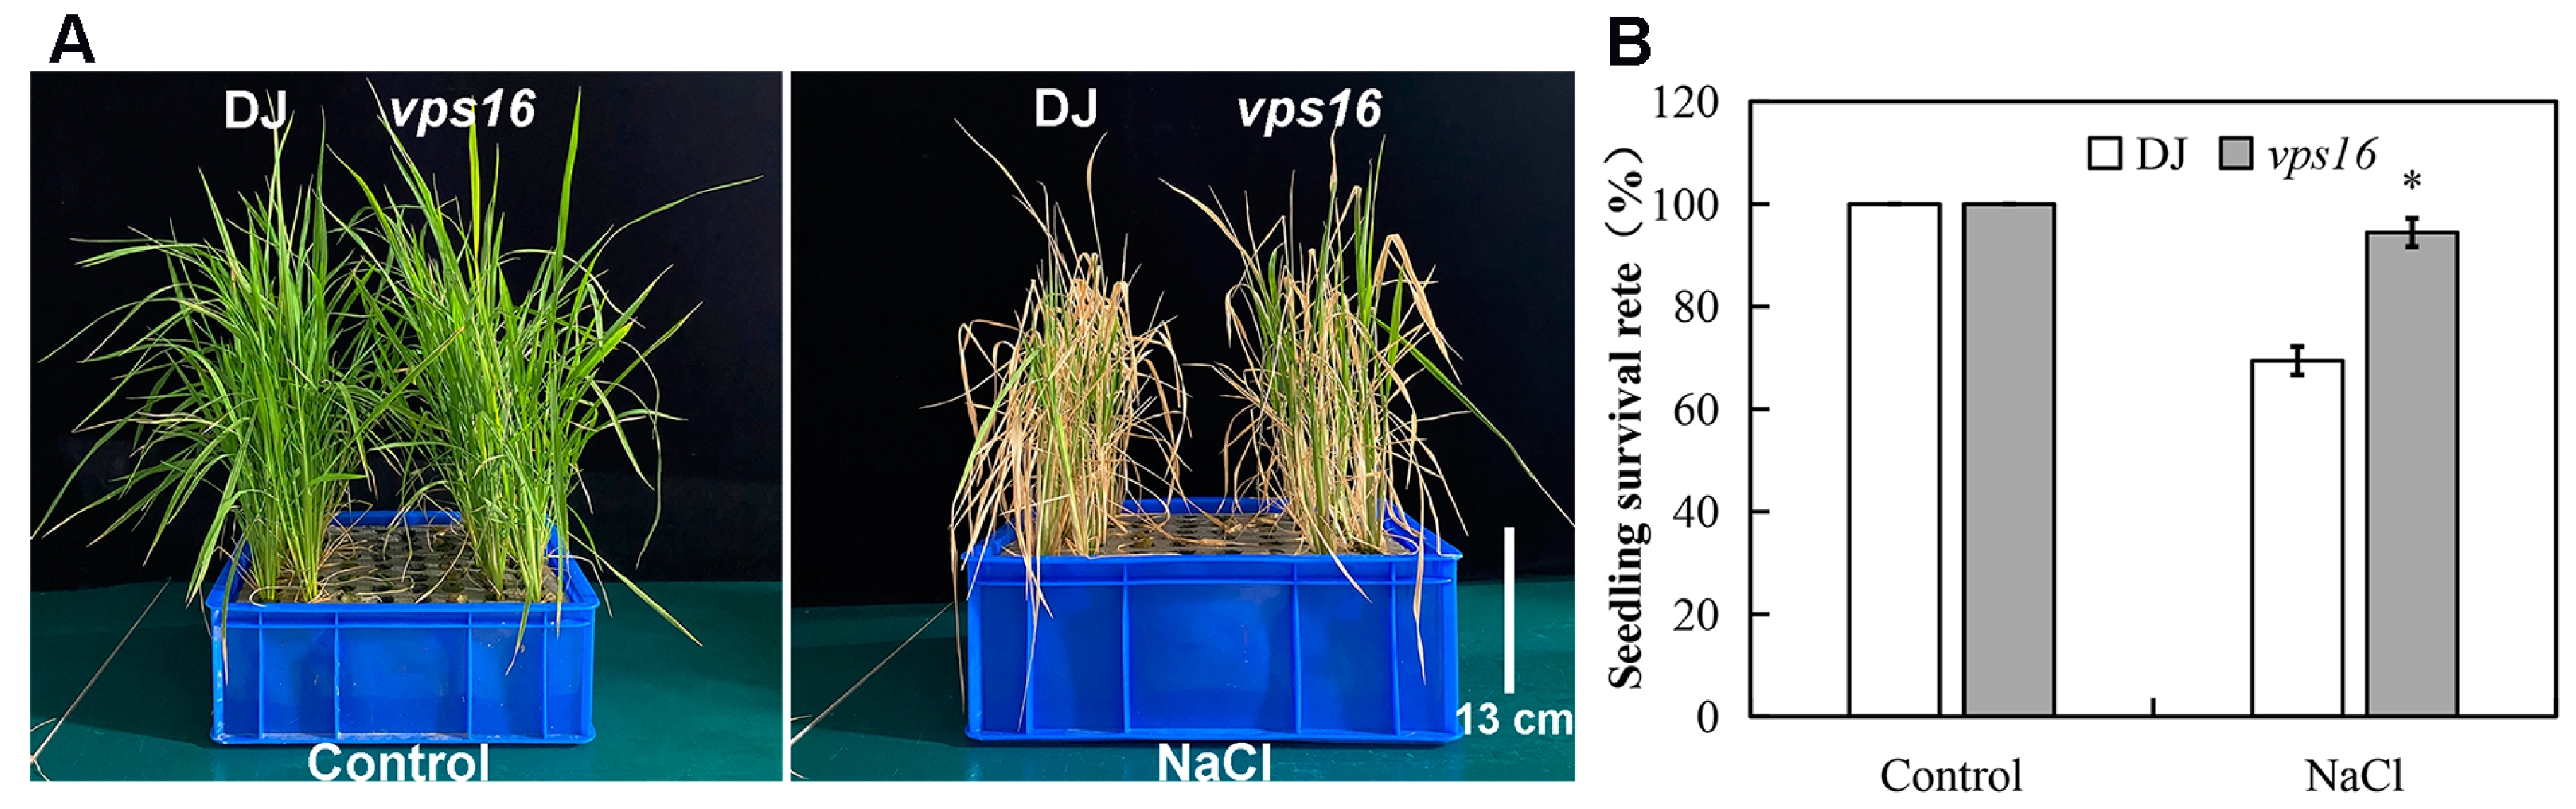
3.4. Loss of OsVPS16 Improves Salt Tolerance in Rice

To investigate the role of OsVPS16 in rice salt tolerance, the seedlings of DJ and vps16 plants were treated with 150 mM NaCl for 10 d. After salt treatment, the vps16 plants displayed better growth compared to DJ (Figure 3A). Salt stress reduced plant biomass, total root length, total root surface area, average root diameter, and total root volume in both genotypes (Table 1). However, vps16 mutants exhibited significantly higher plant biomass, total root length, and total root surface area under salt stress compared to DJ. Additionally, the seedling survival rate of vps16 plants reached 94.44%, significantly higher than that of DJ (Figure 3B).

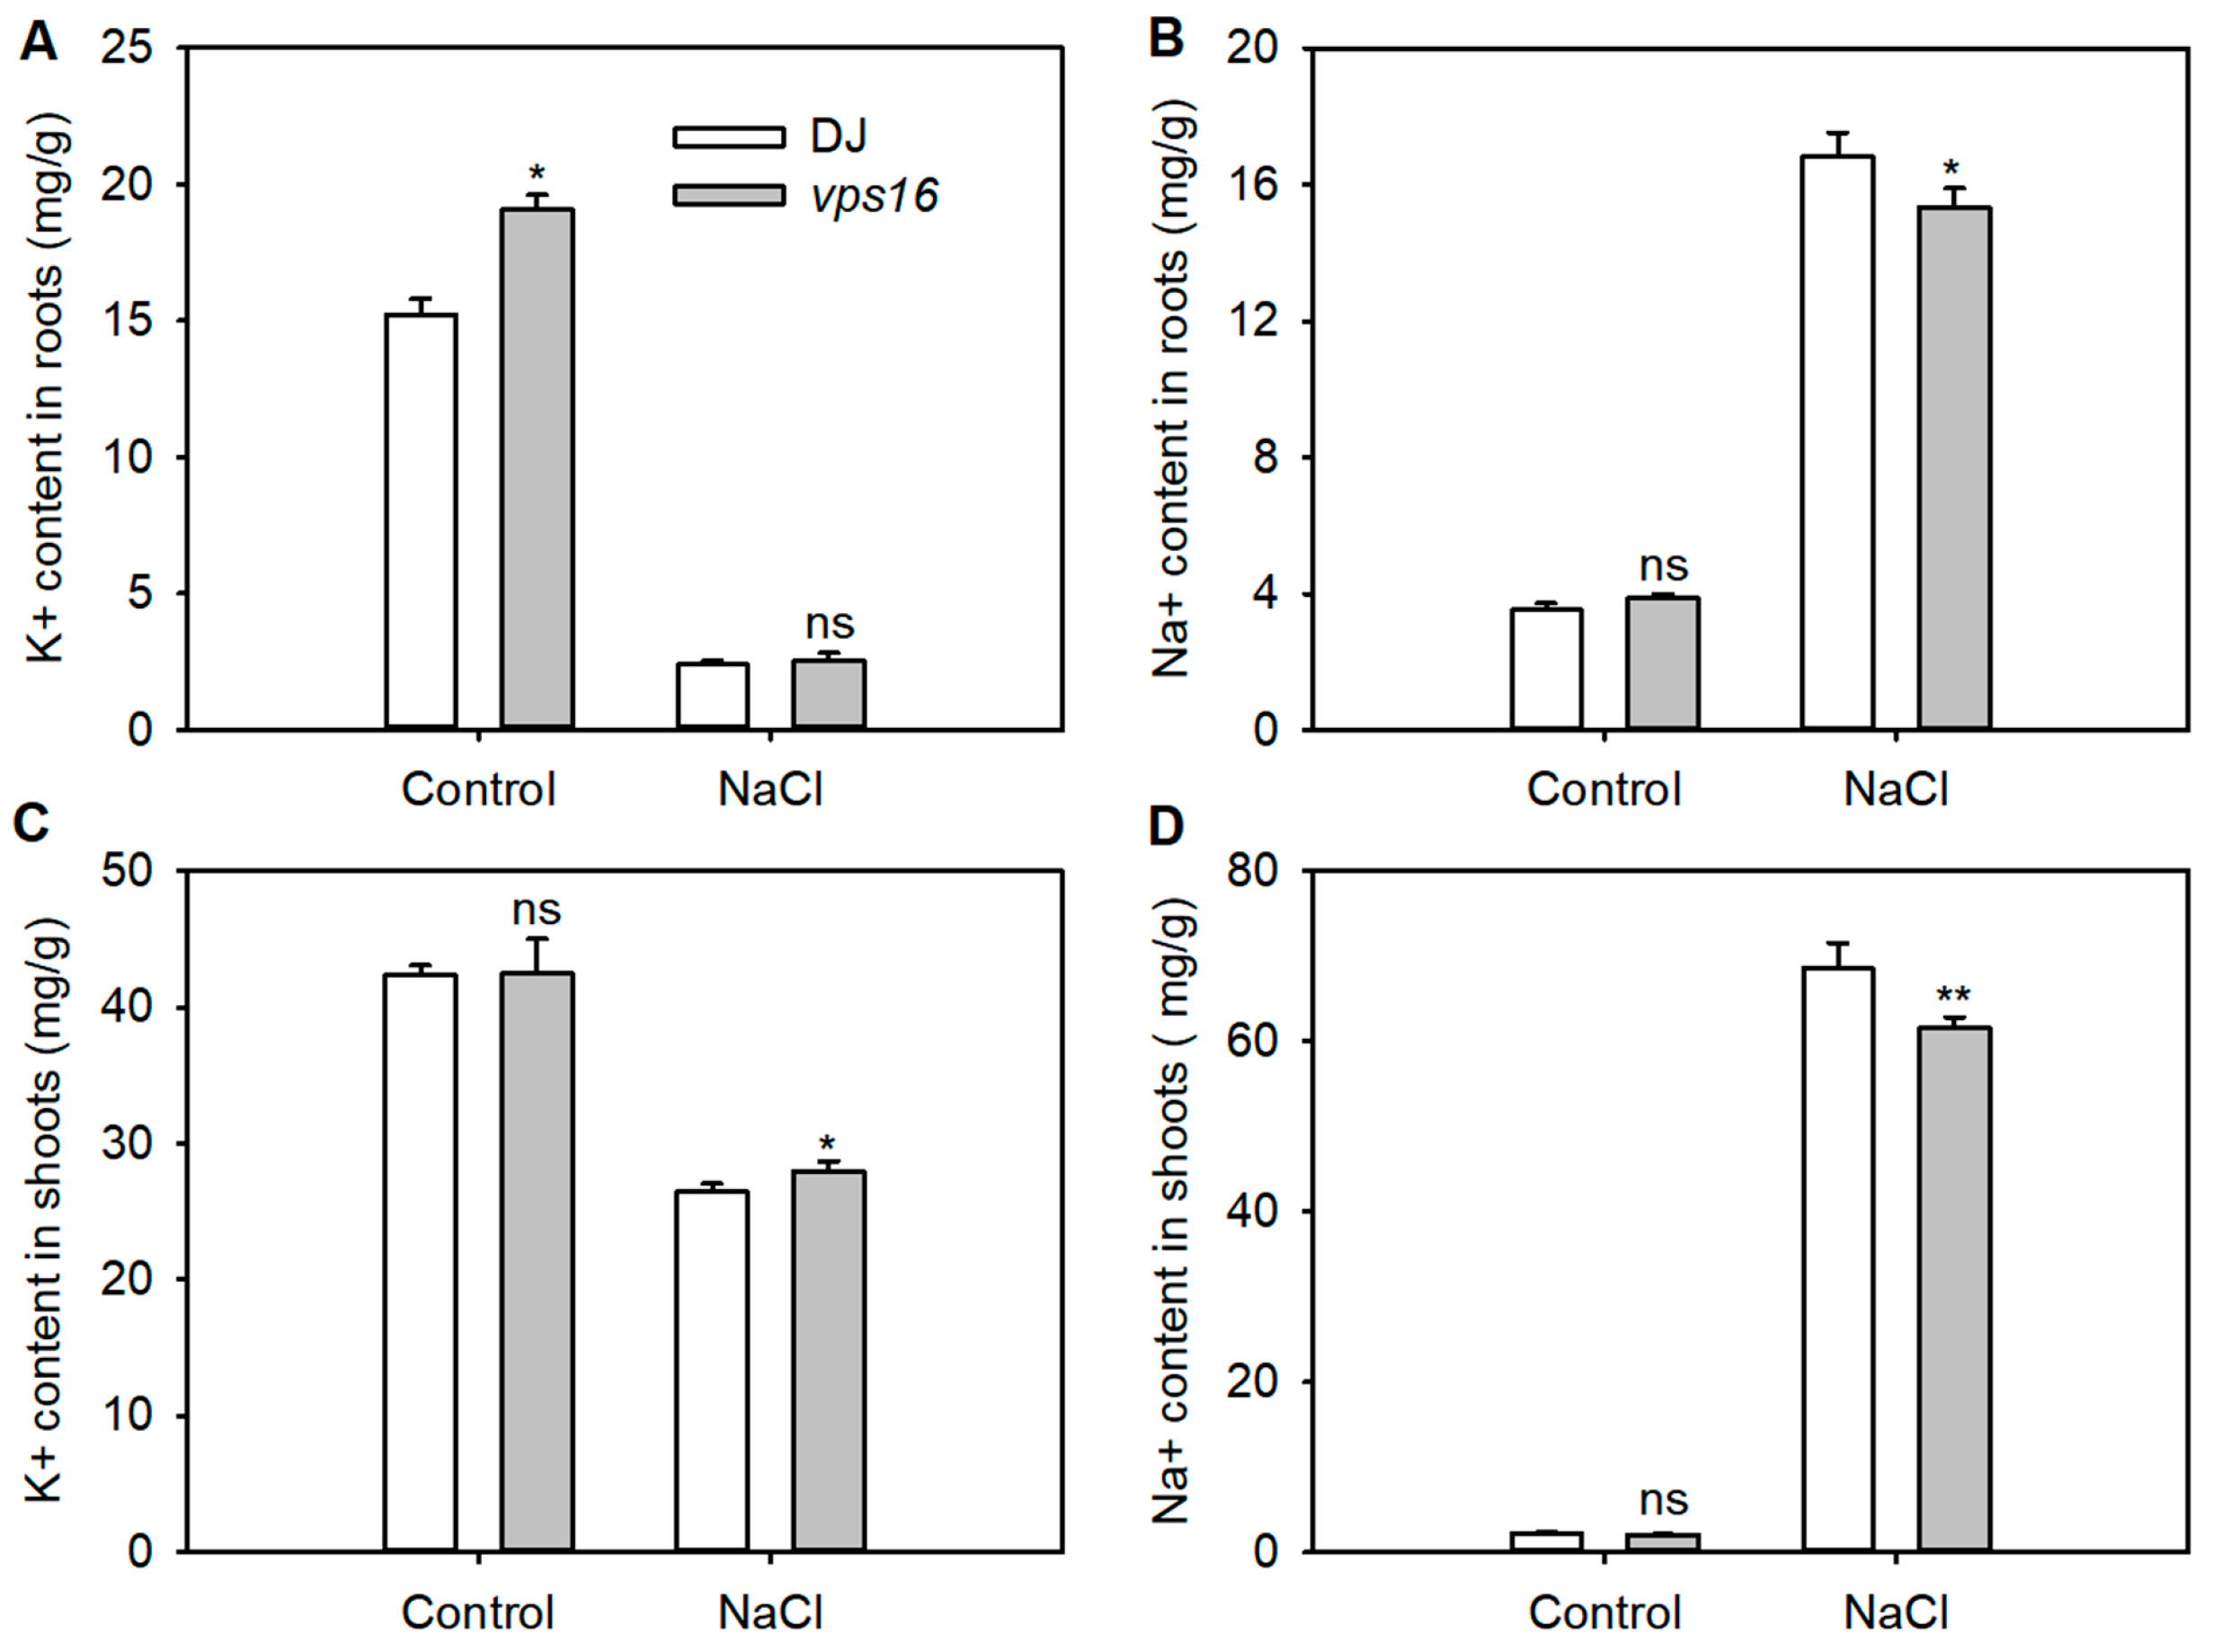
3.5. Loss of OsVPS16 Enhances Ion Homeostasis Under Salt Stress

To evaluate the effect of OsVPS16 on ion homeostasis, Na+ and K+ contents were measured in shoots and roots after 5 d of treatment with 0 and 150 mM NaCl. Salt stress significantly reduced K+ content, and increased Na+ content in both shoots and roots of DJ and vps16 plants, compared to the non-salt control (Figure 4). Under salt stress, Na+ contents in the roots and shoots of vps16 plants were significantly lower than in DJ (Figure 4B,D). Additionally, the K+ content in shoots of the vps16 plant was significantly higher than that of DJ, while no significant difference was observed in the roots (Figure 4A,C).

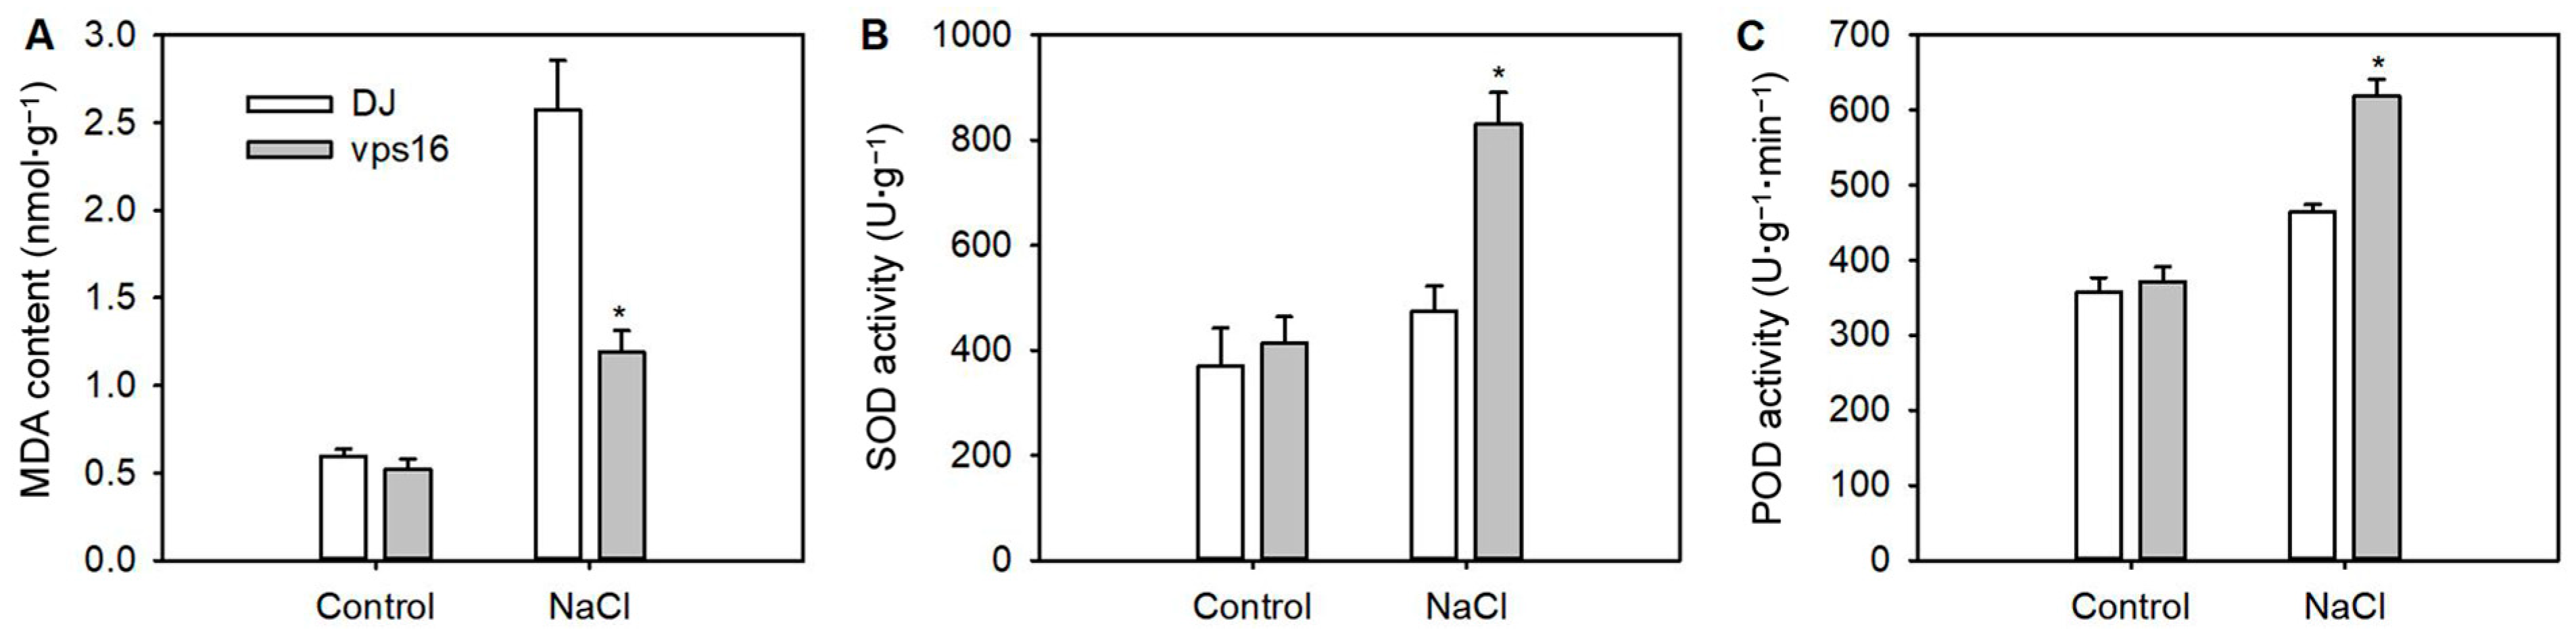
3.6. Loss of OsVPS16 Decreased the Accumulation of MDA and Improved Antioxidant Enzyme Activity Under Salt Stress

To investigate how OsVPS16 affect the antioxidant system in response to salt stress, the contents of MDA and the activities of SOD and POD were measured after 5 d of salt stress. The MDA content in the vps16 plants was significantly lower than in DJ (Figure 5A). Additionally, the activities of SOD and POD were significantly higher in the vps16 plant compared to DJ under salt stress (Figure 5B,C).

3.7. Transcriptomic Analysis of the vps16 Mutant in Response to Salt Stress

To further explore the role of OsVPS16 under the control and salt conditions, an RNA-seq analysis was performed on roots of vps16 and DJ plants treated with 150 mM NaCl for 0 and 48 h (Supplementary Table S3). Under the control conditions, a total of 731 down-regulated and 293 up-regulated DEGs were identified in the vps16 nutant compared to DJ (Figure 6A). Under salt conditions, a total of 823 down-regulated and 313 up-regulated DEGs were identified in the vps16 nutant compared to DJ (Figure 6A). In addition, 534 DEGs were common to both conditions (Figure 6B). To validate the RNA-seq data, 19 randomly selected genes were analyzed using RT-qPCR (Supplementary Table S4). A high correlation (R2 = 0.85) was observed between the RT-qPCR and RNA-seq results, confirming the reliability of the transcriptomic data.
A GO enrichment analysis revealed that the top enriched GO terms under the control conditions included defense response (GO:0006952), integral component of membrane (GO:0016021), ADP binding (GO:0043531), and protein serine/threonine kinase activity (GO:0004674) (Supplementary Table S5, Figure 6C). Under salt stress, the most enriched GO terms included defense response (GO:0006952), carbohydrate metabolic process (GO:0005975), integral component of membrane (GO:0016021), ADP binding (GO:0043531), protein serine/threonine kinase activity (GO:0004674), and calcium ion binding (GO:0005509) (Figure 6D).
To further identify the functions of DEGs in the vps16 mutant compared with DJ under the control and salt conditions, a pathway enrichment analysis was performed using the KEGG database (Supplementary Table S6, Figure 7). Under the control conditions, plant–pathogen interactions (ko04626), the MAPK signaling pathway–plant (ko04016) pathway, and plant hormone signal transduction (ko04075) were predominantly enriched in the vps16 mutant compared to DJ (Figure 7A). Under salt stress, plant–pathogen interactions (ko04626), MAPK signaling pathway–plant (ko04016), phenylpropanoid biosynthesis (ko00940), and starch and sucrose metabolism (ko00500) were predominantly enriched in the vps16 mutant compared to DJ (Figure 7B).

3.8. OsVPS16 Regulated Several Key Genes in Response to Salt Stress

Among the 602 uniquely regulated DEGs (URDEGs) identified under salt stress, 20 protein kinases (PKs) and 21 transcription factors (TFs) were differentially expressed in vps16 plants compared to DJ under the control and salt conditions (Figure 8). The PKs are mainly involved in the processes of protein serine/threonine kinase activity, ATP binding, and calcium ion binding (Supplementary Table S7). Notably, Os10g0180800, Os11g0694100, OsSRK1 (Os06g0241100), and OsCDPK21 (Os08g0540400) were significantly up-regulated in the vps16 mutant compared to DJ under the salt conditions, whereas there was no significant difference under the control conditions (Figure 8A). Among the TFs, members of the NAC domain family, as well as other families such as bHLH, bZIP, GNAT, GRAS, HB-HD-ZIP, MADS, MYB, and Trihelix, were differentially expressed in the vps16 mutant (Supplementary Table S7). Os03g0127500 (bZIP) and OsNAC45 (Os11g0127600) were significantly up-regulated in the vps16 mutant compared with DJ under the salt conditions, but exhibited no significant difference under the control conditions (Figure 8B).

4. Discussion

In the context of continuous changes to the global climate and the continuous reduction in cultivated land area, soil salinity is proving to be a major abiotic stress that restricts rice growth production [47]. The identification and characterization of salt-tolerant genes are crucial for enhancing the growth and production of rice under saline conditions and cultivating new salt-tolerant varieties.
In this study, we characterized a T-DNA insertion mutant of rice, vps16, which resulted in the loss function of OsVPS6 due to the absence of a promoter in the T-DNA region (Figure 2A). A promoter cis-element prediction analysis identified stress-responsive regulatory motifs in the OsVPS16 promoter, such as ABREs, EREs, STREs, and MYB elements (Supplementary Figure S2). Notably, previous studies have established functional links between these motifs and salt tolerance mechanisms. An ABRE-binding TF (OsbZIP23) has been reported to be essential for ABA-mediated salt tolerance in rice [48]. Similarly, the OsMYB2 of the ABA signaling pathway positively regulates salt tolerance in rice [49]. OsRAV1, encoding an ERF-type TF, positively regulates seed initial germination rate and seedling establishment under saline conditions [50]. These results suggested that OsVPS16 may be regulated by a variety of hormonal and stress-related signaling pathways, highlighting its potential role in stress responses. The RT-qPCR analysis demonstrated that salt stress suppressed the expression of OsVPS16 (Figure 1B). These results indicated that OsVPS16 may mediate the response to salt stress in rice.
Rice is particularly vulnerable to salt stress during the seedling stage [9]. Previous studies have shown that salt stress inhibits rice growth, delays the rice growth process, and accelerates plant senescence [10,51]. In this study, salt stress inhibited the growth of both wild-type (DJ) and vps16 seedlings, but the growth inhibition was less severe in the vps16 mutant compared to DJ (Table 1, Figure 3A). In addition, the vps16 mutant showed a higher survival rate under salt stress than DJ (Figure 3B). These results show that the vps16 mutant has better salt tolerance.
Salt stress disrupts ion homeostasis by promoting excessive Na+ accumulation and inhibiting K+ uptake, thereby impairing normal metabolic functions [52,53]. In this study, salt stress significantly increased the Na+ content and decreased the K+ content in both DJ and vps16 plants (Figure 4). However, the vps16 mutant maintained significantly lower Na+ levels in roots and shoots and higher K+ levels in shoots compared to DJ (Figure 4B–D). These results suggest that the vps16 mutant mitigates salt stress by reducing Na+ uptake and minimizing K+ loss.
Usually, salt stress causes damage to plant membrane integrity, resulting in lipid peroxidation [54]. MDA, a product of membrane lipid peroxidation, serves as an indicator of oxidative damage to cells [55]. Plants counteract oxidative stress through an antioxidant enzyme system, which enhances salt tolerance by protecting cellular structures [56]. In this study, salt stress increased the MDA content in the vps16 mutant and DJ, but the vps16 mutant accumulated significantly less MDA than DJ (Figure 5A). Antioxidant enzymes, such as SOD and POD, play critical roles in scavenging reactive oxygen species (ROS) [57]. Previous studies have shown that salt-tolerant rice varieties exhibit higher or more rapidly induced SOD and POD activities compared to sensitive varieties [58]. Consistently with this, the vps16 mutant displayed significantly higher SOD and POD activities under salt stress than DJ (Figure 5B,C), indicating enhanced antioxidant capacity and reduced oxidative damage under salt stress.
To elucidate the molecular mechanism underlying the improved ion homeostasis and antioxidant activity in the vps16 mutant, a transcriptomic analysis was conducted using RNA-seq. Extensive studies have demonstrated the utility of RNA-seq in uncovering transcriptional changes in response to salt stress [59,60,61]. In this study, a total of 1136 DEGs were identified between vps16 and WT under salt stress (Figure 6A,B), and a GO enrichment analysis revealed that these DEGs were primarily associated with defense response, the carbohydrate metabolic process, the integral component of membrane, ADP binding, protein serine/threonine kinase activity, and calcium ion binding (Figure 6D). These pathways are known to play critical roles in salt stress responses [58,62,63,64]. A KEGG pathway analysis further highlighted the enrichment of DEGs in the MAPK signaling pathway and starch and sucrose metabolism (Figure 7B). The MAPK cascade is well documented for its role in regulating salt stress responses in rice [65,66]. These results together suggest that loss of OsVPS16 enhances salt tolerance in rice by regulating genes related to protein serine/threonine kinase activity, Ca2+ signal pathways, and MAPK signaling pathway, and they can form a close-knit signaling network to mediate K+/Na+ homeostasis and increase antioxidant activity.
A further analysis identified key DEGs involved in these pathways. Receptor-like cytoplasmic kinases (RLCKs), such as Os10g0180800 and Os11g0694100, were significantly up-regulated in the vps16 mutant under salt stress (Figure 8A). RLCKs, including STK and STRK1, have been reported to enhance salt tolerance by improving ROS detoxification and reducing Na+ accumulation [67,68]. Additionally, the expression of OsSRK1 and OsCDPK21 was strongly induced in the vps16 mutant under salt stress. OsSRK1, an S-receptor-like kinase with ATP binding and protein serine/threonine kinase activity, positively regulates salt tolerance [69], while OsCDPK21, a calcium-dependent protein kinase, is involved in salt stress signaling [70,71]. Transcription factors (TFs), such as OsbZIP25 and OsNAC45, were also significantly up-regulated in the vps16 mutant (Figure 8B). OsNAC45, in particular, enhances salt tolerance through ROS scavenging pathways [29]. These findings suggest that OsVPS16 influences salt tolerance by regulating the expression of key genes, including OsSRK1, OsCDPK21, and OsNAC45. However, the precise molecular mechanisms and genetic pathways underlying OsVPS16-mediated salt tolerance require further investigation.

5. Conclusions

In this study, we identified the vps16 mutant, which exhibits enhanced salt tolerance compared to the wild-type DJ. The vps16 mutant accumulates less Na+, retains more K+, and exhibits elevated antioxidant enzyme activities under salt stress. A transcriptome analysis revealed that the loss of OsVPS16 enhances salt tolerance by modulating genes involved in protein serine/threonine kinase activity, Ca2+ signaling pathways, and the MAPK signaling pathway. Key protein kinases and transcription factors, such as OsSRK1, OsCDPK21, and OsNAC45, likely contribute to the observed salt tolerance in the vps16 mutant. In summary, this study demonstrates that OsVPS16 deficiency improves rice salt tolerance by regulating K+/Na+ homeostasis, enhancing antioxidant activity, and modulating the expression of multiple stress-related genes. These insights provide valuable genetic resources for developing salt-tolerant rice varieties through molecular breeding approaches.

Supplementary Materials

The following supporting information can be downloaded at https://www.mdpi.com/article/10.3390/agronomy15051146/s1. Figure S1: Homologous protein analysis of OsVPS16 in Arabidopsis; Figure S2: Sequence of OsVPS16 cis-element in the putative promoter region; Table S1: The sequences of T-DNA primers and gene-specific primers for Tri-Primer-PCR to identify the homozygous mutant; Table S2: Primer sequences of the internal control gene (β-actin) and target genes for RT-qPCR analysis; Table S3: Differentially expressed genes detected in rice roots of DJ and vps16 plants under the control and salt conditions; Table S4: Quantitative RT-PCR (RT-qPCR) verification of DEGs from RNA-Seq data; Table S5: GO enrichment analysis of differentially expressed genes (DEGs) in the vps16 mutant compared with DJ under the control and salt conditions, respectively; Table S6: KEGG pathway enrichment analysis of the DEGs in the vps16 mutant compared with DJ under the control and salt conditions, respectively; Table S7: Selected salt-responsive DEGs associated with protein kinase (PKs) and transcription factors (TFs) in the vps16 mutant compared with DJ under the control and salt conditions.

Author Contributions

X.J. and J.L. designed the experiments; M.T., Y.L. (Yun Lu), H.Y. and Y.L. (Yang Liu) performed the experiments; Y.C., X.S. and Q.L. analyzed the data; J.L. wrote—original draft preparation, X.J. revised and edited this manuscript. All authors have read and agreed to the published version of the manuscript.

Funding

This work was funded by the National Natural Science Foundation of China (Grant No. 32201701, 32101678), Henan Science and Technology Research and Development Project (Grant No. 232102110191, 242102111105, 242102110250), Henan Universities Young Backbone Teacher Training Program Project (Grant No. 2024GGJS153), 2023 Henan Research Funding Program for Returnees, The Special Program for Key Research and Development of Henan Province (Grant No. 231111110500), and Xinyang Agriculture and Forestry University Youth Fund Project (Grant No. QN2023011).

Data Availability Statement

All data supporting the conclusions of this article are provided within the article and in its additional files and are available upon reasonable request to the corresponding author.

Acknowledgments

The authors thank the MDPI Author Services team for providing language editing services relating to this manuscript.

Conflicts of Interest

The authors declare no conflicts of interest.

References

  1. Van Zelm, E.; Zhang, Y.; Testerink, C. Salt tolerance mechanisms of plants. Annu. Rev. Plant Biol. 2020, 71, 403–433. [Google Scholar]
  2. Alkharabsheh, H.M.; Seleiman, M.F.; Hewedy, O.A.; Battaglia, M.L.; Jalal, R.S.; Alhammad, B.A.; Schillaci, C.; Ali, N.; Al-Doss, A. Field crop responses and management strategies to mitigate soil salinity in modern agriculture: A review. Agronomy 2021, 11, 2299. [Google Scholar] [CrossRef]
  3. Haque, M.A.; Rafii, M.Y.; Yusoff, M.M.; Ali, N.S.; Yusuff, O.; Datta, D.R.; Anisuzzaman, M.; Ikbal, M.F. Advanced breeding strategies and future perspectives of salinity tolerance in rice. Agronomy 2021, 11, 1631. [Google Scholar] [CrossRef]
  4. FAO. Agriculture organization of the United Nations the future of food and agriculture. In Trends and Challenges; FAO: Rome, Italy, 2017. [Google Scholar]
  5. Ahmad, I.; Zhu, G.; Zhou, G.; Younas, M.U.; Suliman, M.S.E.; Liu, J.; Zhu, Y.M.; Salih, E.G.I. Integrated approaches for increasing plant yield under salt stress. Front. Plant Sci. 2023, 14, 1215343. [Google Scholar] [CrossRef]
  6. Liu, J.; Shen, L.; Guo, L.; Zhang, G.; Gao, Z.; Zhu, L.; Hu, J.; Dong, G.; Ren, D.; Zhang, Q.; et al. OsSTS, a novel allele of mitogen-activated protein kinase kinase 4 (OsMKK4), controls grain size and salt tolerance in rice. Rice 2023, 16, 47. [Google Scholar] [CrossRef]
  7. Yamaguchi, T.; Blumwald, E. Developing salt-tolerant crop plants: Challenges and opportunities. Trends Plant Sci. 2005, 10, 615–620. [Google Scholar] [CrossRef]
  8. FAO. World Food and Agriculture–Statistical Yearbook 2023; Food and Agriculture Organization of the United Nations: Rome, Italy, 2023. [Google Scholar] [CrossRef]
  9. Hoang, T.M.L.; Tran, T.N.; Nguyen, T.K.T.; Williams, B.; Wurm, P.; Bellairs, S.; Mundree, S. Improvement of salinity stress tolerance in rice: Challenges and opportunities. Agronomy 2016, 6, 54. [Google Scholar] [CrossRef]
  10. Hussain, S.; Zhang, J.H.; Zhong, C.; Zhu, L.F.; Cao, X.C.; Yu, S.M.; Bohr, J.A.; Jin, Q.Y. Effects of salt stress on rice growth, development characteristics, and the regulating ways: A review. J. Integr. Agric. 2017, 16, 2357–2374. [Google Scholar]
  11. Wang, H.; Zhang, M.; Guo, R.; Shi, D.; Liu, B.; Lin, X.; Yang, C. Effects of salt stress on ion balance and nitrogen metabolism of old and young leaves in rice (Oryza sativa L.). BMC Plant Biol. 2012, 12, 194. [Google Scholar] [CrossRef]
  12. Moradi, F.; Ismail, A.M. Responses of photosynthesis, chlorophyll fuorescence and ROS-scavenging systems to salt stress during seedling and reproductive stages in rice. Ann. Botany 2007, 99, 1161–1173. [Google Scholar] [CrossRef]
  13. Munns, R.; Tester, M. Mechanisms of salinity tolerance. Annu. Rev. Plant Biol. 2008, 59, 651–681. [Google Scholar] [CrossRef]
  14. Ganie, S.A.; Molla, K.A.; Henry, R.J.; Bhat, K.V.; Mondal, T.K. Advances in understanding salt tolerance in rice. Theor. Appl. Genet. 2019, 132, 851–870. [Google Scholar]
  15. Deinlein, U.; Stephan, A.B.; Horie, T.; Luo, W.; Xu, G.; Schroeder, J.I. Plant salt-tolerance mechanisms. Trends Plant Sci. 2014, 19, 371–379. [Google Scholar]
  16. Liu, C.T.; Mao, B.G.; Yuan, D.Y.; Chu, C.C.; Duan, M.J. Salt tolerance in rice: Physiological responses and molecular mechanisms. Crop J. 2022, 10, 13–25. [Google Scholar]
  17. Singh, R.K.; Kota, S.; Flowers, T.J. Salt tolerance in rice: Seedling and reproductive stage QTL mapping come of age. Theor. Appl. Genet. 2021, 134, 3495–3533. [Google Scholar] [PubMed]
  18. Nayyeripasand, L.; Garoosi, G.A.; Ahmadikhah, A. Genome-wide association study (GWAS) to identify salt-tolerance QTLs carrying novel candidate genes in rice during early vegetative stage. Rice 2021, 14, 9. [Google Scholar] [CrossRef]
  19. Ren, Z.H.; Gao, J.P.; Li, L.G.; Cai, X.L.; Huang, W.; Chao, D.Y.; Zhu, M.Z.; Wang, Z.Y.; Luan, S.; Lin, H.X. A rice quantitative trait locus for salt tolerance encodes a sodium transprter. Nat. Genet. 2005, 37, 1141. [Google Scholar] [CrossRef]
  20. Takagi, H.; Tamiru, M.; Abe, A.; Yoshida, K.; Uemura, A.; Yaegashi, H.; Obara, T.; Oikawa, K.; Utsushi, H.; Kanzaki, E.; et al. MutMap accelerates breeding of a salt-tolerant rice cultivar. Nat. Biotechnol. 2015, 33, 445–449. [Google Scholar] [CrossRef]
  21. Deng, P.; Jing, W.; Cao, C.; Sun, M.; Chi, W.; Zhao, S.; Dai, J.; Shi, X.; Wu, Q.; Zhang, B.; et al. Transcriptional repressor RST1 controls salt tolerance and grain yield in rice by regulating gene expression of asparagine synthetase. Proc. Natl. Acad. Sci. USA 2022, 119, e2210338119. [Google Scholar] [CrossRef]
  22. Kobayashi, N.I.; Yamaji, N.; Yamamoto, H.; Okubo, K.; Ueno, H.; Costa, A.; Tanoi, K.; Matsumura, H.; Fujii-Kashino, M.; Horiuchi, T.; et al. OsHKT1;5 mediates Na+ exclusion in the vasculature to protect leaf blades and reproductive tissues from salt toxicity in rice. Plant J. 2017, 91, 657–670. [Google Scholar] [CrossRef]
  23. Oda, Y.; Kobayashi, N.I.; Tanoi, K.; Ma, J.F.; Itou, Y.; Katsuhara, M.; Itou, T.; Horie, T. T-DNA Tagging-based gain-of-function of OsHKT1;4 reinforces Na exclusion from leaves and stems but triggers Na toxicity in roots of rice under salt stress. Int. J. Mol. Sci. 2018, 19, 235. [Google Scholar] [CrossRef] [PubMed]
  24. Martínez-Atienza, J.; Jiang, X.; Garciadeblas, B.; Mendoza, I.; Zhu, J.K.; Pardo, J.M.; Quintero, F.J. Conservation of the salt overly sensitive pathway in rice. Plant Physiol. 2007, 143, 1001–1012. [Google Scholar] [CrossRef]
  25. Tian, Q.; Shen, L.; Luan, J.; Zhou, Z.; Guo, D.; Shen, Y.; Jing, W.; Zhang, B.; Zhang, Q.; Zhang, W. Rice shaker potassium channel OsAKT2 positively regulates salt tolerance and grain yield by mediating K+ redistribution. Plant Cell Environ. 2021, 44, 2951–2965. [Google Scholar] [CrossRef]
  26. Zhao, J.; Meng, X.; Zhang, Z.; Wang, M.; Nie, F.; Liu, Q. OsLPR5 encoding ferroxidase positively regulates the tolerance to salt stress in rice. Int. J. Mol. Sci. 2023, 24, 8115. [Google Scholar] [CrossRef] [PubMed]
  27. Su, S.; Jiang, Y.; Zhu, X.; Yu, S.; Wang, F.; Xue, L.; Cui, H. Calcium-dependent protein kinases 5 and 13 enhance salt tolerance in rice by directly activating OsMPK3/6 kinases. Plant Physiol. 2024, 196, 3033–3047. [Google Scholar] [CrossRef]
  28. Zhang, X.; Long, Y.; Chen, X.; Zhang, B.; Xin, Y.; Li, L.; Cao, S.; Liu, F.; Wang, Z.; Huang, H.; et al. A NAC transcription factor OsNAC3 positively regulates ABA response and salt tolerance in rice. BMC Plant Biol. 2021, 21, 546. [Google Scholar] [CrossRef]
  29. Zhang, X.; Long, Y.; Huang, J.; Xia, J. OsNAC45 is involved in ABA response and salt tolerance in rice. Rice 2020, 13, 79. [Google Scholar] [CrossRef]
  30. Kojonna, T.; Suttiyut, T.; Khunpolwattana, N.; Pongpanich, M.; Suriya-Arunroj, D.; Comai, L.; Buaboocha, T.; Chadchawan, S. Identification of a negative regulator for salt tolerance at seedling stage via a genome-wide association study of thai rice populations. Int. J. Mol. Sci. 2022, 23, 1842. [Google Scholar] [CrossRef] [PubMed]
  31. Fang, C.; Li, K.; Wu, Y.; Wang, D.; Zhou, J.; Liu, X.; Li, Y.; Jin, C.; Liu, X.; Mur, L.A.J.; et al. OsTSD2-mediated cell wall modification affects ion homeostasis and salt tolerance. Plant Cell Environ. 2019, 42, 1503–1512. [Google Scholar] [CrossRef]
  32. Hu, S.; Li, B.; Wu, F.; Zhu, D.; Zouhar, J.; Gao, C.; Shimada, T.; Rojo, E.; Hara-Nishimura, I.; Jiang, L.; et al. Plant ESCRT protein ALIX coordinates with retromer complex in regulating receptor-mediated sorting of soluble vacuolar proteins. Proc. Natl. Acad. Sci. USA 2022, 119, e2200492119. [Google Scholar] [CrossRef]
  33. Jiang, D.; He, Y.; Zhou, X.; Cao, Z.; Pang, L.; Zhong, S.; Jiang, L.; Li, R. Arabidopsis HOPS subunit VPS41 carries out plant-specific roles in vacuolar transport and vegetative growth. Plant Physiol. 2022, 189, 1416–1434. [Google Scholar] [CrossRef] [PubMed]
  34. Guo, M.; Chen, M.; Liu, R.; Ma, Y.; Li, L.; Xu, Z.; Zhang, X. Vacuolar Protein Sorting AtVPS25 Regulates Auxin Responses in Arabidopsis thaliana. Sci. Agric. Sin. 2014, 47, 3501–3512. (In Chinese) [Google Scholar]
  35. Hsu, Y.W.; Jauh, G.Y. VPS36-Mediated plasma membrane protein turnover is critical for Arabidopsis root gravitropism. Plant Signal. Behav. 2017, 12, e1307495. [Google Scholar] [CrossRef]
  36. Li, J.; Cao, Y.; Shi, L.; Chen, B.; Tan, Y.; Gao, Y.; Cao, W. Research advances on the plant ESCRT machinery regulation of stress responses. J. Zhejiang A F Univ. 2024, 41, 1094–1104. (In Chinese) [Google Scholar]
  37. Wang, X.; Xu, M.; Gao, C.; Zeng, Y.; Cui, Y.; Shen, W.; Jiang, L. The roles of endomembrane trafficking in plant abiotic stress responses. J. Integr. Plant Biol. 2020, 62, 55–69. [Google Scholar] [CrossRef]
  38. Sato, Y.; Namiki, N.; Takehisa, H.; Kamatsuki, K.; Minami, H.; Ikawa, H.; Ohyanagi, H.; Sugimoto, K.; Itoh, J.; Antonio, B.A.; et al. RiceFREND: A platform for retrieving coexpressed gene networks in rice. Nucleic Acids Res. 2013, 41, D1214–D1221. [Google Scholar] [CrossRef] [PubMed]
  39. Liu, J.; Shabala, S.; Shabala, L.; Zhou, M.; Meinke, H.; Venkataraman, G.; Chen, Z.; Zeng, F.; Zhao, Q. Tissue-specific regulation of Na+ and K+ transporters explains genotypic differences in salinity stress tolerance in rice. Front. Plant Sci. 2019, 10, 1361. [Google Scholar] [CrossRef]
  40. Zhou, J.; Qiao, J.; Wang, J.; Quan, R.; Huang, R.; Qin, H. OsQHB improves salt tolerance by scavenging reactive oxygen species in rice. Front. Plant Sci. 2022, 13, 848891. [Google Scholar] [CrossRef]
  41. Kim, D.; Langmead, B.; Salzberg, S.L. HISAT: A fast spliced aligner with low memory requirements. Nat. Methods 2015, 12, 357–360. [Google Scholar] [CrossRef]
  42. Wang, L.; Feng, Z.; Wang, X.; Wang, X.; Zhang, X. DEGseq: An R package for identifying differentially expressed genes from RNA-seq data. Bioinformatics 2010, 26, 136–138. [Google Scholar] [CrossRef]
  43. Alexa, A.; Rahnenführer, J. Gene set enrichment analysis with topGO. Bioconductor Improv. 2009, 27, 1–26. [Google Scholar]
  44. Kanehisa, M.; Araki, M.; Goto, S.; Hattori, M.; Hirakawa, M.; Itoh, M.; Katayama, T.; Kawashima, S.; Okuda, S.; Tokimatsu, T.; et al. KEGG for linking genomes to life and the environment. Nucleic Acids Res. 2007, 36, D480–D484. [Google Scholar] [CrossRef]
  45. Livak, K.J.; Schmittgen, T.D. Analysis of relative gene expression data using real-time quantitative PCR and the 2(-delta delta C(T)) method. Methods 2001, 25, 402–408. [Google Scholar] [CrossRef] [PubMed]
  46. Lescot, M.; Déhais, P.; Thijs, G.; Marchal, K.; Moreau, Y.; Van de Peer, Y.; Rouzé, P.; Rombauts, S. PlantCARE, a database of plant cis-acting regulatory elements and a portal to tools for in silico analysis of promoter sequences. Nucleic Acids Res. 2002, 30, 325–327. [Google Scholar] [CrossRef] [PubMed]
  47. Yang, Y.; Guo, Y. Elucidating the molecular mechanisms mediating plant salt-stress responses. New Phytol. 2018, 217, 523–539. [Google Scholar] [CrossRef]
  48. Xiang, Y.; Tang, N.; Du, H.; Ye, H.; Xiong, L. Characterization of OsbZIP23 as a key player of the basic leucine zipper transcription factor family for conferring abscisic acid sensitivity and salinity and drought tolerance in rice. Plant Physiol. 2008, 148, 1938–1952. [Google Scholar] [CrossRef]
  49. Nie, S.; Huang, W.; He, C.; Wu, B.; Duan, H.; Ruan, J.; Zhao, Q.; Fang, Z. Transcription factor OsMYB2 triggers amino acid transporter OsANT1 expression to regulate rice growth and salt tolerance. Plant Physiol. 2025, 197, kiae559. [Google Scholar] [CrossRef]
  50. Gao, Y.; Zhao, X.; Liu, X.; Liu, C.; Zhang, K.; Zhang, X.; Zhou, J.; Dong, G.; Wang, Y.; Huang, J.; et al. OsRAV1 regulates seed vigor and salt tolerance during germination in rice. Rice 2024, 17, 56. [Google Scholar] [CrossRef]
  51. Gupta, B.; Huang, B. Mechanism of salinity tolerance in plants: Physiological, biochemical, and molecular characterization. Int. J. Genom. 2014, 2014, 701596. [Google Scholar] [CrossRef]
  52. Wu, H. Plant salt tolerance and Na+ sensing and transport. Crop J. 2018, 6, 215–225. [Google Scholar] [CrossRef]
  53. Jiang, Z.; Song, G.; Shan, X.; Wei, Z.; Liu, Y.; Jiang, C.; Jiang, Y.; Jin, F.; Li, Y. Association analysis and identification of ZmHKT1;5 variation with salt-stress tolerance. Front. Plant Sci. 2018, 9, 1485. [Google Scholar] [CrossRef]
  54. Miller, G.; Suzuki, N.; Ciftci-Yilmaz, S.; Mittler, R. Reactive oxygen species homeostasis and signalling during drought and salinity stresses. Plant Cell Environ. 2010, 33, 453–467. [Google Scholar] [CrossRef] [PubMed]
  55. He, J.; Chen, S.; Chen, R.; Li, X.; Wu, J.; Zheng, Y.; Li, F.; Zhan, Y. Okra WRKY transcription factor AeWRKY32 and AeWRKY70 are involved in salt stress response. Int. J. Mol. Sci. 2024, 25, 12820. [Google Scholar] [CrossRef]
  56. Wang, Y.; Wang, J.; Zhao, X.; Yang, S.; Huang, L.; Du, F.; Li, Z.; Zhao, X.; Fu, B.; Wang, W. Overexpression of the transcription factor gene OsSTAP1 increases salt tolerance in rice. Rice 2020, 13, 50. [Google Scholar] [CrossRef] [PubMed]
  57. Foyer, C.H.; Noctor, G. Redox homeostasis and antioxidant signaling: A metabolic interface between stress perception and physiological responses. Plant Cell. 2005, 17, 1866–1875. [Google Scholar] [CrossRef]
  58. Fang, X.; Mo, J.; Zhou, H.; Shen, X.; Xie, Y.; Xu, J.; Yang, S. Comparative transcriptome analysis of gene responses of salt-tolerant and salt-sensitive rice cultivars to salt stress. Sci. Rep. 2023, 13, 19065. [Google Scholar] [CrossRef] [PubMed]
  59. Bundó, M.; Martín-Cardoso, H.; Pesenti, M.; Gómez-Ariza, J.; Castillo, L.; Frouin, J.; Serrat, X.; Nogués, S.; Courtois, B.; Grenier, C.; et al. Integrative approach for precise genotyping and transcriptomics of salt tolerant introgression rice lines. Front. Plant Sci. 2022, 12, 797141. [Google Scholar] [CrossRef]
  60. Wang, Y.; Huang, L.; Du, F.; Wang, J.; Zhao, X.; Li, Z.; Wang, W.; Xu, J.; Fu, B. Comparative transcriptome and metabolome profiling reveal molecular mechanisms underlying OsDRAP1-mediated salt tolerance in rice. Sci. Rep. 2021, 11, 5166. [Google Scholar] [CrossRef]
  61. Duan, F.; Wu, F.; Li, Z.; Zhang, K.; Ma, Q. Response of young rice panicles to salt stress: Insights based on phenotype and transcriptome analysis. Front. Plant Sci. 2024, 15, 1451469. [Google Scholar] [CrossRef]
  62. Nivedita; Rawoof, A.; Ramchiary, N.; Abdin, M.Z. A high-throughput RNA-Seq approach to elucidate the transcriptional response of Piriformospora indica to high salt stress. Sci. Rep. 2021, 11, 4129. [Google Scholar]
  63. Zhu, J.K. Salt and drought stress signal transduction in plants. Annu. Rev. Plant Biol. 2002, 53, 247–273. [Google Scholar] [CrossRef] [PubMed]
  64. Kong, W.; Zhong, H.; Gong, Z.; Fang, X.; Sun, T.; Deng, X.; Li, Y. Meta-analysis of salt stress transcriptome responses in different rice genotypes at the seedling stage. Plants 2019, 8, 64. [Google Scholar] [CrossRef]
  65. Wang, F.; Jing, W.; Zhang, W. The mitogen-activated protein kinase cascade MKK1–MPK4 mediates salt signaling in rice. Plant Sci. 2014, 227, 181–189. [Google Scholar] [CrossRef]
  66. Kumar, K.; Sinha, A.K. Overexpression of constitutively active mitogen activated protein kinase kinase 6 enhances tolerance to salt stress in rice. Rice 2013, 6, 25. [Google Scholar] [CrossRef] [PubMed]
  67. Zhou, Y.; Zhang, Z.; Zhao, X.; Liu, L.; Tang, Q.; Fu, J.; Tang, X.; Yang, R.; Lin, J.; Liu, X.; et al. Receptor-like cytoplasmic kinase STK confers salt tolerance in rice. Rice 2023, 16, 21. [Google Scholar] [CrossRef] [PubMed]
  68. Zhou, Y.B.; Liu, C.; Tang, D.Y.; Yan, L.; Wang, D.; Yang, Y.Z.; Gui, J.S.; Zhao, X.Y.; Li, L.G.; Tang, X.D.; et al. The receptor-like cytoplasmic kinase STRK1 phosphorylates and activates CatC, thereby regulating H2O2 homeostasis and improving salt tolerance in rice. Plant Cell. 2018, 30, 1100–1118. [Google Scholar] [CrossRef]
  69. Zhou, J.J.; Ju, P.N.; Zhang, F.; Zheng, C.K.; Bai, B.; Li, Y.P.; Wang, H.F.; Chen, F.; Xie, X.Z. OsSRK1, an atypical S-receptor-like kinase positively regulates leaf width and salt tolerance in rice. Rice Sci. 2020, 27, 133–142. [Google Scholar]
  70. Chen, Y.; Zhou, X.; Chang, S.; Chu, Z.; Wang, H.; Han, S.; Wang, Y. Calcium-dependent protein kinase 21 phosphorylates 14-3-3 proteins in response to ABA signaling and salt stress in rice. Biochem. Biophys. Res. Commun. 2017, 493, 1450–1456. [Google Scholar] [CrossRef]
  71. Asano, T.; Hakata, M.; Nakamura, H.; Aoki, N.; Komatsu, S.; Ichikawa, H.; Hirochika, H.; Ohsugi, R. Functional characterisation of OsCPK21, a calcium-dependent protein kinase that confers salt tolerance in rice. Plant Mol. Biol. 2011, 75, 179–191. [Google Scholar] [CrossRef]
Figure 1. Expression profile of OsVPS16. (A) The spatial and developmental expression patterns of OsVPS16. (B) Time-course expression pattern of OsVPS16 in rice roots. Seedlings were exposed to 150 mM NaCl for 1, 2, 4, 8, 12, and 24 h.
Agronomy 15 01146 g001
Figure 2. The T-DNA mutant vps16 displays a long root phenotype. (A) Schematic representation of the T-DNA insertion site in OsVPS16. (B) PCR analysis of the T-DNA insertion site in vps16. Upper bands: OsVPS16 gene fragments; lower bands: T-DNA insertion fragments. (C) qRT-PCR analysis of OsVPS16 expression in DJ and vps16 plants. (D) Root phenotypes of 4 d old DJ and vps16 plants. Bar, 2 cm. (E) The maximum root length of the plants is shown in (D). Asterisks indicate a significant difference, where ** and *** indicate p < 0.01 and p < 0.001 level, respectively.
Agronomy 15 01146 g002
Figure 3. Loss of OsVPS16 increases salt tolerance in rice. (A) Phenotype of DJ and vps16 plants with 150 mM NaCl for 10 d. (B) The seedling survival rate of DJ and vps16 plants after salt stress. Values are the mean ± SE. Asterisks indicate a significant difference, * indicates p < 0.05 level.
Agronomy 15 01146 g003
Figure 4. OsVPS16 mutation effect on K+ and Na+ homeostasis. (A,C) K+ content (left), and (B,D) Na+ content (right) in the roots (upper) and shoots (lower) of the WT and mutant plants. * and ** indicates p < 0.05 and p < 0.01 level, respectively. ns indicates no significant difference.
Agronomy 15 01146 g004
Figure 5. Physiological analyses of the T-DNA insertion mutant and WT plants under salt stress. (A) MDA contents, (B) SOD activity, and (C) POD activity of roots from WT and vps16 mutants following 150 mM NaCl treatment. * indicates p < 0.05 level.
Agronomy 15 01146 g005
Figure 6. Transcriptome analysis of OsVPS16-regulated genes. (A) The number of differentially expressed genes (DEGs) regulated by OsVPS16 in the mutant and WT under control and NaCl conditions. (B) Venn diagram showing the OsVPS16 regulated DEGs in the mutant and WT under control and NaCl conditions. (C) GO analysis of DEGs in the vps16 mutant compared with DJ under the control conditions. (D) GO analysis of DEGS in the mutant compared with DJ under the NaCl condition.
Agronomy 15 01146 g006
Figure 7. (A) KEGG enrichment analysis of DEGs in vps16 compared with WT under the control conditions. (B) KEGG enrichment analysis of DEGs in vps16 compared with WT under the salt conditions.
Agronomy 15 01146 g007
Figure 8. A heatmap of the DEGs associated with protein kinases (PKs, (A)) and transcription factors (TFs, (B)) in the vps16 line relative to DJ (WT) under control and salt conditions.
Agronomy 15 01146 g008
Table 1. The changes in plant biomass and root morphological parameters in vps16 and DJ under the control and 150 mM NaCl. * and ** indicates p < 0.05 and p < 0.01 level, respectively. ns indicates no significant difference.
TreatmentGenotypesFresh Weight per Plant (g)Dry Weight per Plant (g)Total Root Length (cm)Total Root Surface Area (cm2)Root Average Diameter (mm)Total Root Volume (cm3)
ControlDJ0.91 ± 0.020.12 ± 0.00114.06 ± 6.259.82 ± 0.450.28 ± 0.000.07 ± 0.00
vps161.06 ± 0.02 **0.13 ± 0.00 **157.98 ± 8.52 **10.74 ± 0.56 ns0.22 ± 0.01 **0.06 ± 0.00 ns
NaClDJ0.17 ± 0.010.04 ± 0.00103.52 ± 5.598.13 ± 0.330.25 ± 0.010.05 ± 0.01
vps160.19 ± 0.00 **0.05 ± 0.00 **135.20 ± 6.58 **9.49 ± 0.40 *0.22 ± 0.01 **0.05 ± 0.00 ns
Disclaimer/Publisher’s Note: The statements, opinions and data contained in all publications are solely those of the individual author(s) and contributor(s) and not of MDPI and/or the editor(s). MDPI and/or the editor(s) disclaim responsibility for any injury to people or property resulting from any ideas, methods, instructions or products referred to in the content.

